Article

Agribusiness Corporations and Family Farms in Ukraine: Impacts on Regional Agricultural and Rural Sustainability and Supply Chain Implications

by
Yuliia Zolotnytska
1,
Vitaliy Krupin
2,* and
Julian Krzyżanowski
1
1
Institute of Agricultural and Food Economics, National Research Institute, 00-002 Warsaw, Poland
2
Institute of Rural and Agricultural Development, Polish Academy of Sciences, 00-330 Warsaw, Poland
*
Author to whom correspondence should be addressed.
Sustainability 2026, 18(7), 3629; https://doi.org/10.3390/su18073629
Submission received: 14 March 2026 / Revised: 3 April 2026 / Accepted: 6 April 2026 / Published: 7 April 2026

Abstract

This study examines the impact of agribusiness corporations (large-scale agricultural enterprises) and family farms on the sustainable development of agriculture and rural areas in Ukraine, and considers implications for SDG-aligned agri-food value chains that rely on stable access to sustainably produced raw materials. The research applies a multi-criteria decision analysis framework integrating economic, environmental and social indicators at the regional level. Using min–max normalisation, scoring and ranking methods, composite indices of economic sustainability, environmental sustainability, and sustainable rural development were constructed for 20 selected Ukrainian regions, and an integral sustainability index was calculated. Spearman’s rank correlation was applied to identify relationships between sustainability indicators and the structural characteristics of agricultural production. The results reveal pronounced interregional differentiation and an overall predominance of economic over environmental sustainability. Regions with a higher share of family farming demonstrate stronger environmental sustainability and more balanced development patterns, whereas dominance of large-scale enterprises is associated with adverse environmental effects. At the same time, relationships between farm structure and sustainable rural development are weak and not statistically significant, suggesting that social sustainability outcomes depend on more complex and context-dependent mechanisms beyond production scale alone. The findings highlight structural trade-offs between economic efficiency and environmental sustainability and underline the importance of regionally differentiated policy instruments. Strengthening support for family farms is identified as a promising mechanism for improving environmental performance and enhancing upstream conditions for sustainability-oriented sourcing and agri-food value chains.

1. Introduction

Sustainable development constitutes a central paradigm in contemporary debates on the relationship between environment and development, integrating economic efficiency, social equity and ecological balance in the context of global challenges and structural transformations [1,2]. Within the agricultural sector, this concept acquires particular significance, as agriculture directly affects food security, the condition of natural resources, rural development and the welfare of rural populations. For Ukraine, which possesses considerable agricultural potential and holds an important position in global agricultural markets, the sustainable development of agriculture and rural areas is therefore of paramount relevance. Importantly, the sustainability of primary production also shapes the wider context for sustainability-oriented practices along agri-food value chains, including downstream activities that depend on stable, quality-assured, and sustainably produced raw materials.
Ukraine’s contemporary agricultural system is characterised by a dual organisational and economic structure in which large-scale agricultural enterprises (hereafter, agribusiness corporations) coexist with family farms [3]. On the one hand, agribusiness corporations provide production scale, investment capacity, the implementation of innovative technologies and integration into global value chains [4]. On the other hand, the concentration of land resources, intensive use of agrochemicals and orientation towards short-term economic gains generate environmental risks, exacerbate social polarisation and contribute to the decline of rural communities [5]. At the same time, family farms play an important role in maintaining the social stability of rural territories, preserving traditional ways of life, diversifying production and promoting more sustainable use of natural resources [6]. However, their contribution to sustainable development is constrained by limited financial resources, restricted access to markets and modern technologies, and insufficient state support, which reduces the competitiveness of small producers relative to large agricultural entities.
Accordingly, the key challenges of sustainable development in Ukraine’s agricultural sector lie in reconciling economic efficiency with environmental responsibility, ensuring social balance and establishing an institutional environment capable of harmonising the interests of agribusiness corporations and family farms. Moreover, the intensity and manifestation of these sustainability challenges vary considerably across regions due to disparities in land concentration and the structural characteristics of agricultural production, with potential implications for the environmental footprint and resilience of agricultural supply within agri-food value chains.
Regional differentiation in land concentration in Ukraine is shaped by a complex interplay of factors, including soil quality, climatic conditions, agro-industrial specialisation, historical patterns of land use, infrastructure development, institutional frameworks, and regional differences in the implementation of land and agricultural policies. Consequently, the effects of agribusiness corporations and family farms on sustainability exhibit a combined and regionally differentiated character, extending beyond local outcomes to shape the conditions under which agricultural production takes place.
From a broader agri-food system perspective, these regional characteristics can be interpreted as upstream sustainability conditions that influence the environmental, economic and socio-territorial context of agricultural raw-material supply. In this sense, production structures and land concentration patterns affect not only regional sustainability performance, but also the sustainability attributes embedded in primary production, which are subsequently transmitted along agri-food value chains.
Based on these considerations, we hypothesise that regions in which family farms account for a higher share of agricultural production are characterised by more favourable upstream sustainability conditions, particularly in environmental terms, and more balanced development patterns. Conversely, regions where agribusiness corporations dominate the structure of agricultural production are expected to exhibit less favourable environmental conditions and more pronounced trade-offs between economic and environmental sustainability, which may result in less balanced sustainability profiles in primary agricultural production.
In the context of sustainable agricultural development in Ukraine’s regions, instruments for integrated diagnostics of sustainability at the farm and enterprise level have been proposed as part of methodological frameworks for sustainability assessment and reporting [7]. At the same time, the impact of agribusiness corporations and family farms on regional sustainability remains insufficiently explored, particularly with regard to how regionally differentiated sustainability conditions shape upstream contexts for sustainability-oriented coordination along agri-food value chains.
Existing studies have developed important approaches to sustainability assessment, including farm-level evaluation frameworks [8], regional indicator-based analyses for EU countries [9], and comparative regional assessments of agriculture and rural areas [10]. However, these contributions do not explicitly address the role of farm structure and land concentration in shaping sustainability outcomes.
The present study extends this strand of research by focusing on the Ukrainian context and examining how the coexistence of family farms and large-scale agricultural enterprises influences regional sustainability patterns and their implications for agri-food value chains. Therefore, the objective of this study is to assess the level of sustainable development across Ukrainian regions, with a particular focus on how farm structure and land concentration influence upstream sustainability conditions relevant to agri-food value chains, including the environmental, economic and rural-development characteristics of agricultural production systems.

2. Sustainable Development—Literature Review

The concept of sustainable development emerged in response to growing concerns about the environmental and social consequences of post-war industrialisation and rapid economic growth in the mid-twentieth century. A pivotal milestone in the formalisation of the concept was the 1987 report of the World Commission on Environment and Development, commonly known as the Brundtland Report, which defined sustainable development as “development that meets the needs of the present without compromising the ability of future generations to meet their own needs” [11]. This definition integrated three interdependent dimensions—economic efficiency, social equity and environmental protection—into a unified normative framework. Subsequent global initiatives, including the 1992 Rio Earth Summit and the adoption of Agenda 21, further institutionalised sustainable development as a guiding principle of international policy [12].
In the agricultural context, the concept evolved in parallel with increasing recognition of agriculture’s dual role as both a provider of food security and a significant driver of environmental change. The idea of sustainable agriculture gained prominence in the 1980s in response to the negative externalities of industrialised farming systems, such as soil degradation, biodiversity loss, water pollution and greenhouse gas emissions [13,14,15,16]. Sustainable agricultural development, therefore, came to encompass not only productivity and economic viability, but also ecological resilience, prudent resource use and the maintenance of rural livelihoods. It emphasises long-term soil fertility, biodiversity conservation, climate adaptation and the socio-economic vitality of rural communities. Today, sustainable agriculture is embedded within broader frameworks such as the Sustainable Development Goals (SDGs), where it is closely linked to zero hunger, climate action, responsible consumption and production, and the protection of terrestrial ecosystems [17,18].
In parallel, recent food systems scholarship emphasises that SDG progress increasingly depends on how value is created and impacts are managed across agri-food value chains, in which food processing plays a central role in food safety, quality and shelf-life, while also contributing to resource use (e.g., energy and water) and waste generation [19,20].
Accordingly, sustainability goals pursued at the farm level are increasingly evaluated in relation to downstream requirements for consistent, quality-assured raw materials and for improved sustainability performance across the wider supply chain [19].
Sustainable agricultural development is achieved when economic, environmental, and social progress is pursued in an integrated, coordinated, and consistent manner, provided that at least a medium level of development is attained across all considered dimensions [10]. Research on sustainable development, including in agriculture and rural areas, is grounded in the quantitative assessment of characteristics associated with its three core dimensions. It is well established that studies in this field face several recurring challenges, including: (i) selecting measures and indicators that comprehensively and adequately capture individual dimensions of sustainability [21]; (ii) recognising that certain indicators relate simultaneously to multiple dimensions, which complicates their unambiguous attribution to a specific sustainability domain [22]; and (iii) the lack of sufficient input and output data to ensure a reliable characterisation of particular dimensions or levels of sustainability [23,24].
Related work increasingly argues for complementing farm- or firm-level sustainability measurement with value-chain perspectives, because sustainability outcomes and trade-offs emerge across interconnected stages (production, processing, distribution and consumption). One example is the proposal of holistic sustainability assessment frameworks at the agri-food value-chain level that integrate multiple pillars and explicitly account for system configuration and governance [25].
Similarly, systematic reviews of social sustainability assessment in food supply chains underline that social indicators and tools differ across stages, including the processing stage, and that consistent treatment of social aspects across the chain is needed to avoid fragmented sustainability performance [26].
In the case of agriculture, an additional obstacle arises from inherent trade-offs, particularly between economic and environmental drivers [10]. Capital-intensive intensification of agricultural production, manifested through mechanisation and increased use of chemical inputs, contributes to higher productivity and improved economic efficiency, as well as to the development of rural social infrastructure. However, such intensification is simultaneously associated with a greater environmental burden, including soil, water and air pollution, biodiversity loss, and increased greenhouse gas emissions resulting from the intensive use of fertilisers and fossil fuels. Consequently, these processes lead, to varying degrees, to environmental degradation and long-term ecological imbalances [27,28].
Comparable trade-offs are also discussed in the food-processing domain, where achieving safety, shelf-life extension and nutritional objectives can entail energy and resource burdens, strengthening calls for optimisation approaches that consider multiple objectives and constraints simultaneously [20,29].
Research has demonstrated that an environmentally oriented model of agricultural development, characterised by limiting production intensity and implementing conservation practices, contributes to the preservation of natural capital and the enhancement of ecosystem resilience. However, in the absence of adequate economic incentives, such an approach may constrain growth in production performance and farmers’ incomes [30]. This necessitates the search for balanced mechanisms that reconcile economic efficiency with environmental sustainability in the agricultural sector.
At the interface between regional production structures and food-processing/supply chain organisation, the spatial configuration of value chains (e.g., distance to raw materials, degree of decentralisation, and local processing capacity) can influence environmental performance. For example, a life-cycle assessment case study on tomato juice compared centralised processing with a decentralised mobile processing unit and highlighted the role of proximity to raw materials and processing configuration in reducing environmental impacts [31].
In addition, transparency and traceability are increasingly framed as enabling conditions for sustainability governance across food supply chains. For instance, research published in Sustainability has proposed blockchain-based traceability frameworks intended to strengthen sustainability communication across the production–distribution–consumption cycle [32].
The recent literature increasingly suggests that sustainability-related outcomes in agri-food systems should not be understood as the additive result of separate economic, environmental and social dimensions, but rather as the outcome of structurally interdependent processes. From this perspective, sustainability dimensions are linked through conditional dependencies, feedback effects, synergies and trade-offs, which may generate both balanced and unbalanced development configurations. Thus, improvements in one dimension do not automatically translate into improvements in others, and aggregate sustainability scores should be interpreted with caution [33]. This systemic understanding is consistent with network-oriented approaches that conceptualise agri-food performance through relationally embedded drivers rather than isolated pillars.
In this regard, Istudor et al. [33] propose a network perspective in which the performance of the EU cereal value chain is examined through structurally linked dimensions, including factor endowments, self-sufficiency, trade strategy, resource productivity and environmental impact. Using a sparse Gaussian graphical model, the authors identify conditional dependencies, synergies, decouplings and structural misalignments among these dimensions, demonstrating that system-level outcomes are shaped by the pattern of interrelations among drivers rather than by the isolated strength of individual indicators. Although their focus is competitiveness rather than regional agricultural sustainability per se, their conceptual contribution is relevant to sustainability assessment, especially in contexts where economic, environmental and rural-development dimensions interact in non-linear and potentially conflicting ways.
Building on this line of reasoning, the present study treats regional sustainability not as a simple aggregation of independent pillars, but as a multidimensional configuration in which farm structure, production intensity, environmental pressure and rural-development outcomes may reinforce or weaken one another.

3. Materials and Methods

To assess the impact of agribusiness corporations and family farms on the sustainable development of Ukraine’s regions, the study employs a scoring method and a ranking method, both of which belong to the toolkit of multi-criteria decision analysis (MCDA). Multi-criteria analysis methods enable the integration of heterogeneous and multidimensional indicators into a unified evaluation framework, thereby supporting the comparative assessment of multiple objects across a set of selected criteria [34]. Such integrative approaches are particularly useful for capturing the interconnected economic, environmental and rural-development dimensions that shape regional sustainability and, indirectly, the stability of upstream conditions within agri-food value chains.
It should be noted that the present study applies a simplified form of multi-criteria decision analysis (MCDA), based on indicator normalisation, scoring and aggregation. While MCDA encompasses a broad range of more advanced methods (e.g., AHP, TOPSIS, and PROMETHEE), the approach adopted here is intentionally non-preference-based and focuses on providing a transparent and consistent comparative assessment of regional sustainability.
Conceptually, the study adopts a systemic perspective in which economic sustainability, environmental sustainability and sustainable rural development are treated as interdependent dimensions of regional agri-food sustainability rather than as analytically isolated pillars. Accordingly, the MCDA procedure is used as an operational tool for structuring and synthesising multidimensional evidence, while the substantive interpretation of results is grounded in the assumption that the analysed dimensions may interact through trade-offs, synergies and asymmetries. In this sense, the composite indicators (EcS, EnS and SR) are retained separately to reveal balanced versus unbalanced development configurations, whereas the integral index serves as a synthetic diagnostic measure rather than as a substitute for analysing interdependencies among dimensions. This interpretation is aligned with recent network-oriented approaches emphasising structural linkages among system drivers [33].
The scoring method is based on transforming the values of individual indicators into a point scale according to predefined intervals or normalised values [35]. Applying this approach allows for a quantitative assessment of differences between the analysed objects and reduces the influence of extreme values on the final results [36]. The ranking method represents a classical MCDA technique, involving the ordering of alternatives according to various criteria, followed by aggregation and the determination of an integral index [34]. The use of ranking enabled the identification of the relative positions of Ukrainian regions in terms of sustainable development, which is particularly important given the substantial territorial differentiation in their socio-economic performance.
The study applies equal weighting within each sustainability block to avoid introducing additional subjective assumptions regarding the relative importance of individual indicators. However, this should not be interpreted as implying equal causal importance of all variables. Rather, equal weighting is used as a pragmatic simplification for comparative regional assessment, while the analytical emphasis is placed on identifying structural tensions, trade-offs and complementarities across sustainability dimensions.

3.1. Indicator Selection Protocol

At the first stage of the research, a statistical database was compiled covering indicators of: (1) economic sustainability of agriculture ( E c S 1 E c S 9 ), (2) environmental sustainability ( E n S 1 E n S 10 ), and (3) sustainable development of rural areas ( S R 1 S R 9 ) across Ukrainian regions, based on official data from the State Statistics Service of Ukraine for 2022 (Table 1). Due to limited data availability for regions affected by occupation or active hostilities, the analysis was conducted for 20 regions for which consistent statistical data were available.
The variables E n S 1 , E n S 2 , E n S 3 , E n S 6 , E n S 10 and S R 4 were treated as destimulants (i.e., lower values correspond to higher sustainability). For selected variables, threshold values were defined: E n S 1 —66.0% and E n S 2 —2.0 LSU/ha of utilised agricultural land. For the remaining variables, the range of their observed values was adopted as the basis for assessment. The adopted threshold values are based on commonly used agronomic and environmental reference levels reported in the literature, where excessive crop concentration and high livestock density are associated with increased environmental pressure. Importantly, in the analysed dataset, these thresholds were not exceeded, and therefore the threshold-based adjustment did not affect the final results.
The selection of indicators for economic sustainability (EcS), environmental sustainability (EnS) and sustainable rural development (SR) was based on a structured indicator selection protocol designed to ensure theoretical consistency, empirical relevance and data reliability.
First, the selection was guided by the conceptual framework of sustainable development, which distinguishes three interrelated dimensions: economic, environmental and social/rural. Indicators were therefore chosen to reflect key processes within each dimension, while acknowledging potential interdependencies, as emphasised in systemic and network-oriented approaches to sustainability assessment.
Second, indicators were selected based on their empirical relevance to the structural characteristics of agricultural production in Ukraine. In particular, priority was given to variables capturing mechanisms through which farm structure (i.e., the relative importance of family farms versus large-scale agricultural enterprises) may influence sustainability outcomes. These include indicators related to production intensity, land-use structure, input use (e.g., fertilisers and pesticides), environmental pressure, economic performance, and rural socio-economic conditions.
Third, the selection was constrained by the availability, consistency and comparability of regional-level data. Only indicators derived from official statistics (State Statistics Service of Ukraine) and available for all analysed regions were included, ensuring methodological consistency and comparability across observations.
In addition, the selection sought to balance comprehensiveness and parsimony. Indicators were included where they captured distinct and policy-relevant aspects of sustainability, while avoiding redundancy where multiple variables reflected similar underlying phenomena.
It should be noted that some indicators may relate to more than one sustainability dimension (e.g., input intensity may affect both economic performance and environmental pressure). In such cases, indicators were assigned to the dimension for which their primary analytical relevance was considered most direct, while cross-dimensional effects are addressed in the interpretation of results.
Overall, the final set of indicators represents a theoretically informed and data-constrained operationalisation of regional agricultural and rural sustainability, rather than an exhaustive representation of all possible sustainability dimensions. Importantly, the indicators are not interpreted as independent variables, but as components of an interdependent system in which relationships between dimensions (e.g., trade-offs between economic performance and environmental pressure) play a central role.

3.2. Indicator Normalisation and Scoring Procedure

Indicator normalisation was carried out through a scoring procedure on a 0–5 scale using min–max normalisation (where 0 represents the lowest level of sustainability and 5 the highest). Each analysed object was assigned a specific number of points for each indicator depending on the extent to which the target criterion was achieved. For stimulant indicators, Formula (1) was applied:
B i = 5 · X i X m i n X m a x X m i n ,
For destimulant indicators, Formula (2) was used:
B i = 5 · X m a x X i X m a x X m i n ,
where
B i —The score assigned to the i-th region for the respective indicator (within the range of 0–5).
X i —The actual value of the indicator.
X m a x ,     X m i n —The maximum and minimum values of the indicator observed across the analysed regions, respectively [37] (pp. 55–60). In constructing the composite indicators, equal weighting was applied to all indicators within each sustainability dimension. This choice reflects a deliberate methodological decision rather than an assumption of equal causal importance of all variables. In the absence of a universally accepted framework for assigning differential weights to economic, environmental and rural-development indicators at the regional level, equal weighting provides a transparent and neutral baseline that avoids introducing additional subjective bias. Moreover, this approach is consistent with a substantial body of literature on composite sustainability indicators and MCDA applications, where equal weighting is frequently used in exploratory and comparative analyses.
For variables with predefined threshold values ( E n S 1 —66.0% and E n S 2 —2.0 LSU/ha of utilised agricultural land), a threshold-based approach was applied: values exceeding environmentally acceptable limits were assigned lower scores in proportion to the degree of deviation. For the remaining indicators, ranking was conducted within the observed range (minimum-maximum), divided into intervals corresponding to scores from 0 to 5. In the case of destimulants, the scoring scale was applied in reverse order.
The resulting scores were subsequently used for aggregation and the construction of integral assessments, enabling the identification of regional disparities and the relative positions of regions within the analysed sample. The composite indicator of economic sustainability was calculated as the sum of scores for E c S 1 E c S 9 ; in the same manner, composite indicators of environmental sustainability ( E n S 1 E n S 10 ) and sustainable development of rural areas ( S R 1 S R 9 ) were computed. Furthermore, the integral index of regional sustainable development ( I S R ) was determined as the arithmetic mean of the E c S ,   E n S and S R indicators. This index is used as a synthetic summary measure for comparative purposes; however, because the three dimensions are conceptually interdependent and may evolve asymmetrically, the integral score does not replace separate interpretation of the economic, environmental and rural-development components.
Following min–max normalisation and scoring, a ranking method was applied to enable a comparative evaluation of regions with respect to the level of development of the respective sustainability components. Ranking was performed according to the principle of monotonic increasing dependence, whereby regions with higher normalised indicator values received higher ranking positions. For each indicator, regions were ordered in either ascending or descending sequence depending on the direction of its effect on sustainability.
At the third stage, direct indicators reflecting the influence of family farming and large-scale agricultural enterprises (agribusiness corporations) at the regional level were incorporated into the ranking results. These included: the share of regional agricultural land cultivated by family farms and large-scale agricultural enterprises; and the share of agricultural output produced by family farms and large-scale agricultural enterprises in the total regional production volume.
To identify the nature and direction of the relationships between indicators of sustainable agriculture and sustainable rural development, and the operational parameters of agricultural producers, the study applied Spearman’s rank correlation coefficient [38]. This method enables the analysis of monotonic relationships between variables measured on a scoring or ordinal scale and does not require the assumption of a normal data distribution.
Spearman’s rank correlation coefficient was calculated using the classical Formula (3):
ρ = 1   6 d i 2 n ( n 2 1 ) ,
where
ρ —Spearman’s rank correlation coefficient.
d i —The difference between the two ranks of the i-th region for the two variables under consideration.
n—The number of observations (regions).
For each pair of variables, the difference between the corresponding ranks ( d i ) was calculated, along with its squared value ( d i 2 ). Subsequently, the sum of squared rank differences d i 2 was determined. At the final stage, the statistical significance of the obtained coefficients was evaluated using the p-value at a significance level of α = 0.05, according to Formula (4):
t =   ρ n 2 1   ρ 2
The obtained values of Spearman’s rank correlation coefficient were interpreted in accordance with the commonly accepted scale: weak (|ρ| < 0.3), moderate (0.3 ≤ |ρ| < 0.6) and strong (|ρ| ≥ 0.6) relationship.
It should be emphasised that Spearman’s rank correlation is used here as an exploratory tool to identify monotonic associations between variables and does not allow for causal inference. The results are therefore interpreted as indicative of structural relationships rather than as evidence of causal effects.

4. Results

4.1. Assessment of Sustainable Development of Ukrainian Regions

The selection of indicators for economic, environmental, and rural sustainability was guided by their ability to capture, in a comprehensive manner, the performance of the agricultural sector, the degree of utilisation of natural resources, and the socio-economic conditions of rural populations. The chosen indicators reflect key aspects of production efficiency, the intensity of anthropogenic pressure on the environment, and the quality of life in rural areas, thereby ensuring both representativeness and a systemic basis for the assessment. This approach enables objective interregional comparison and facilitates the identification of disparities and the underlying drivers of sustainable development.
In line with the adopted value-chain perspective, the analysed indicators can also be interpreted as reflecting upstream sustainability conditions relevant to agri-food systems. In this context, economic sustainability ( E c S ) captures the stability and reliability of agricultural raw-material supply, environmental sustainability ( E n S ) reflects the ecological footprint embedded in primary production, and sustainable rural development ( S R ) represents the socio-territorial conditions in sourcing regions. In addition, the structure of agricultural production (family farms versus large-scale enterprises) is treated as a proxy for the composition of the supplier base, which may influence production practices and sustainability performance along the value chain.
Against this background, the statistical values of the selected indicators reveal substantial differentiation in the economic sustainability of agricultural development across Ukraine’s regions across all examined parameters (Table 2).
On average, the share of individual regions in total national agricultural output amounts to 4.3%; however, Vinnytsia, Dnipropetrovsk, Cherkasy and Poltava regions demonstrate the highest contributions, underscoring their significant role in shaping agricultural production at the national level. The lowest values are observed in Zakarpattia and Chernivtsi regions, which can be attributed to natural resource constraints and structural limitations. Agriculture constitutes a dominant sector of the regional economy (indicator E c S 3 exceeding the national average) in Vinnytsia, Volyn, Zhytomyr, Zakarpattia, Ivano-Frankivsk, Ternopil, Khmelnytskyi, Cherkasy, Chernivtsi and Chernihiv regions.
Land-use efficiency ( E c S 2 ) is highest in Lviv, Ivano-Frankivsk and Cherkasy regions, whereas Odesa and Mykolaiv regions lag significantly behind the national average (USD 53.7 thousand per 100 ha of agricultural land), indicating a more extensive pattern of land use. The indicators of cereal yield ( E c S 4 ) and average milk productivity ( E c S 5 ) point to relatively higher agricultural production efficiency in the western and northern regions, particularly in Sumy, Khmelnytskyi, Chernihiv and Poltava regions. Labour productivity ( E c S 6 ) exceeds the national average in Sumy, Lviv, Ternopil and Cherkasy regions, reflecting a higher level of production organisation and more effective utilisation of labour potential. Investment activity ( E c S 7 ) is most pronounced in Sumy, Chernihiv and Kirovohrad regions, while in several regions (Zakarpattia and Odesa) it remains critically low, limiting opportunities for modernisation of the material and technical base.
Crop production ( E c S 8 ) is profitable in most regions (with the exception of the Odesa region), whereas livestock production ( E c S 9 ) is unprofitable in the majority of regions (with the exception of the Rivne region), indicating systemic challenges within the sector. Overall, the findings suggest that the economic sustainability of agriculture across Ukraine’s regions is developing unevenly, characterised by the dominance of specific leading regions and the persistence of structural disparities. These differences may have implications for the stability and sustainability of upstream supply within agri-food value chains.
From a value-chain perspective, regional variation in economic sustainability may be reflected in differences in the stability and reliability of agricultural raw-material supply. The statistical values of the selected environmental sustainability indicators reveal substantial regional differences in land-use structure, the degree of agricultural intensification and the scale of environmental protection activities across Ukraine (Table 3).
On average, the share of cereals in the structure of arable land ( E n S 1 ) amounts to 45.7%. The highest values are observed in Kirovohrad, Mykolaiv and Odesa regions, indicating a high degree of cereal specialisation and potential risks of soil degradation in these areas. In contrast, western regions are characterised by a lower dominance of monocultures and a more diversified land-use structure. This indicator is comparable to the share of cereals in the arable land structure of EU countries, which reached 52.5% in 2022 [40].
Given the negative profitability of the livestock sector, which reflects substantial structural and production challenges, livestock density ( E n S 2 ) remains relatively low in most Ukrainian regions (0.2 LSU/ha of utilised agricultural land). From an environmental perspective, this may reduce pressure on ecosystems through lower greenhouse gas emissions and reduced risks of land and water pollution. By comparison, the average livestock density in the EU in 2020 was 0.7 livestock units per hectare of agricultural land, ranging from 0.2 in Bulgaria, Latvia, and Lithuania to 3.4 in the Netherlands [41].
The average application rate of mineral fertilisers ( E n S 3 ) in Ukraine was 151 kg/ha, although Ternopil and Vinnytsia regions exhibit higher levels of chemical intensification (236 kg/ha and 214 kg/ha, respectively), while Odesa and Poltava regions show significantly lower values (94 kg/ha and 101 kg/ha, respectively). For comparison, global fertiliser use in 2023 averaged 112 kg per hectare of agricultural land, including 132.8 kg/ha in Canada, 127.8 kg/ha in the United States, and 124.2 kg/ha in the EU [42]. However, substantial differences exist among EU Member States: Poland averaged 155.6 kg/ha, France 131.3 kg/ha, Germany 128.6 kg/ha, Spain 115.1 kg/ha, Belgium 191.7 kg/ha, and the Netherlands 238.0 kg/ha [43]. Thus, fertiliser application rates in Ukraine generally exceed the world average, but are broadly in line with fertiliser application levels in EU countries.
Forest cover ( E n S 4 ) reveals a distinct regional contrast: the highest levels are recorded in Zakarpattia (51.2%), Ivano-Frankivsk (45.3%), and Rivne (36.4%) regions, contributing to greater ecological stability, while southern steppe regions are characterised by low forest cover (4–9%). By comparison, the average forest cover in the EU is 39%, with the highest levels in Finland (66%), Sweden (63%), and Slovenia (61%), and the lowest in Denmark (15%), Ireland (11%), and the Netherlands (10%) [44]. The share of protected areas ( E n S 7 ) in Ukraine averages 4.9%, which is 21.5 percentage points lower than the EU average (26.4% of EU territory designated as protected). The EU Biodiversity Strategy for 2030 sets a target of protecting at least 30% of land, while ensuring effective management of all protected areas [45].
Pesticide use ( E n S 6 ) in Ukrainian regions generally fluctuates around a moderate level (1.6 kg/ha), although higher application rates (2.1–2.2 kg/ha) are observed in several regions, including Rivne and Khmelnytskyi. Studies indicate that pesticide use intensity in EU countries ranges from approximately 0.6 kg/ha to over 5 kg/ha, with the EU average reaching 2.2 kg/ha in 2021 [46]. Therefore, pesticide use in Ukrainian regions is generally lower than or comparable to the EU average, suggesting moderate chemical intensity; however, localised exceedances require strengthened environmental monitoring and the implementation of more balanced agroecological practices.
Environmental protection expenditures ( E n S 8 E n S 9 ) indicate an asymmetry in ecological investment, with Dnipropetrovsk and Kharkiv regions significantly exceeding the national average. In particular, Dnipropetrovsk region stands out: in 2022, capital investments in environmental protection were 11.1 times higher, and current expenditures were 8.2 times higher per hectare than the national averages. At the same time, the region is characterised by a high concentration of industrial pollution sources [47], as reflected in elevated emissions of pollutants ( E n S 10 ).
These results suggest that the region’s relatively high environmental sustainability score is largely driven by intensive environmental protection expenditures and selected agricultural indicators, whereas the overall environmental condition is strongly influenced by industrial pressures that are not fully captured by the applied indicator system.
Overall, the findings suggest that the environmental sustainability of Ukraine’s regions is shaped by a combination of agricultural specialisation, natural resource endowment, and the level of industrial and technological development. At the same time, the average values of most indicators point to considerable potential for enhancing environmental sustainability, particularly through crop diversification and the expansion of conservation and organic practices, with implications for the resilience of regional agri-food value chains.
Environmental sustainability indicators reflect the ecological footprint embedded in agricultural production, which may influence the sustainability performance of downstream agri-food value chains.
The analysis of the social dimension of sustainable rural development across Ukraine’s regions, based on indicators S R 1 S R 9 , reveals substantial interregional disparities in socio-economic living conditions and the reproduction capacity of the rural population (Table 4).
On average, the ratio of wages in agriculture to those in other sectors amounts to 75.6%. The most favourable situation is observed in Ternopil, Chernihiv and Lviv regions, whereas Kharkiv, Mykolaiv and Odesa regions exhibit a substantial wage gap, reducing the attractiveness of agricultural employment in these areas. The share of the rural population ( S R 2 ) and the level of employment in the agricultural sector ( S R 3 ) remain high in the western regions of Ukraine, indicating the agrarian orientation of their economies (40–60%). In contrast, industrially developed regions demonstrate significantly lower values (5–20%).
The rural unemployment rate ( S R 4 ) exceeds 10% in most regions, reflecting structural imbalances in rural labour markets. The migration balance ( S R 5 ) is predominantly negative, confirming ongoing depopulation trends in rural areas; positive values are recorded only in a few regions, notably Kyiv and Kharkiv. The availability of medical personnel ( S R 6 ) and housing conditions ( S R 7 ) appear relatively stable overall; however, persistent regional disparities continue to affect the quality of life of the rural population.
The share of household income derived from agricultural activities and subsistence production ( S R 8 S R 9 ) remains relatively low on average, indicating limited financial resilience of rural households and their dependence on external income sources. Combined with relatively high rural unemployment, this situation creates preconditions for increased socio-economic vulnerability, intensified migration processes and a decline in the capacity for human capital reproduction in the agricultural sector.
Overall, the findings confirm that the social sustainability of Ukraine’s rural regions is developing unevenly and requires targeted policy measures aimed at increasing income levels, expanding employment opportunities and improving the quality of social services in rural areas.
The social dimension of rural development may also influence the long-term resilience of agricultural supply systems, including labour availability in sourcing regions, which is relevant to the stability of agri-food value chains.
To ensure comparability and to construct an integral assessment of regional sustainability levels, the indicators of economic sustainability, environmental sustainability and sustainable rural development ( E c S ,   E n S , and S R ) were normalised using a scoring scale from 0 to 5 (where 0 corresponds to the lowest level of sustainability and 5 to a very high level of sustainability), applying min–max normalisation according to Formulas (1) and (2).
For variables with predefined threshold values ( E n S 1 —66.0% and E n S 2 —2.0 LSU/ha of utilised agricultural land), a threshold approach was applied: values exceeding environmentally acceptable limits were assigned lower scores in proportion to the degree of deviation. For the remaining indicators, ranking was conducted within the observed range of values (minimum–maximum), divided into intervals corresponding to scores from 0 to 5. For destimulant variables, the scoring scale was applied in reverse order.
Following normalisation, synthetic (aggregated) indicators were calculated for each block of variables by summing the respective scores (Table 5).
The composite indicator of economic sustainability was formed as the sum of scores for E c S 1 E c S 9 ; similarly, aggregated indicators of environmental sustainability ( E n S 1 E n S 10 ) and sustainable rural development ( S R 1 S R 9 ) were computed. In addition, an integral regional sustainable development index ( I S R ) was calculated as the arithmetic mean of the E c S ,   E n S and S R indicators, thereby providing a comprehensive representation of agricultural and rural sustainability within a unified synthetic framework.
The analysis of the integral sustainable development indices of Ukraine’s regions reveals pronounced interregional differentiation in the level of sustainability of the agricultural sector and rural areas. On average, the level of economic sustainability ( E c S ) exceeds that of environmental sustainability ( E n S ), indicating that agricultural production remains predominantly oriented towards economic performance, while the degree of environmental integration remains insufficient.
The highest levels of environmental sustainability in agriculture were identified in Zakarpattia ( E n S = 28.13), Dnipropetrovsk ( E n S = 25.97), Ivano-Frankivsk ( E n S = 25.49), and Chernivtsi ( E n S = 24.21) regions, whereas the lowest levels were recorded in Ternopil ( E n S = 9.86), Cherkasy ( E n S = 14.85), and Vinnytsia ( E n S = 16.05) regions. In general, these differences are associated with a relatively smaller share of land cultivated by large-scale agricultural enterprises within the overall land-use structure, as well as with a substantial proportion of forests and grasslands, which contributes to higher ecological stability.
With regard to the high level of E n S in the Dnipropetrovsk region, the obtained results do not contradict the well-documented fact of substantial overall environmental pollution in the region. Rather, they reflect the specific nature of the interaction between the agricultural sector and the environment, indicating a degree of structural separation between agricultural and industrial sources of environmental pressure. The low ranking of the Ternopil region is attributable to elevated levels of mineral fertiliser application per hectare of utilised agricultural land (39% above the national average), as well as intensive pesticide use (21.1% above the national average). Overall, a clear pattern emerges whereby environmental sustainability in agriculture decreases with increasing intensity of agricultural production and chemicalisation of land use, whereas regions with a higher share of natural land and a lower concentration of industrialised agricultural production demonstrate more favourable environmental indicators.
Significant regional variation is also observed in the levels of economic sustainability of agriculture. The highest levels of economic sustainability were recorded in Ternopil ( E c S = 29.31), Sumy ( E c S = 28.96) and Vinnytsia ( E c S = 28.48) regions, primarily due to the substantial contribution of agriculture to regional economies, higher wage levels in the sector, greater production efficiency per 100 ha of land, and stronger investment activity. In contrast, Odesa ( E c S = 5.05), Dnipropetrovsk ( E c S = 13.47) and Mykolaiv ( E c S = 15.01) regions occupy the lowest positions. The overall average level of economic sustainability across the studied regions amounts to 21.91 points. Thus, the economic sustainability of agriculture in Ukraine is characterised by pronounced unevenness, with a clear distinction between leading regions—where agriculture acts as a key economic driver—and lagging regions, where development is constrained by low productivity and limited investment.
Regional disparities are likewise evident in the levels of sustainable rural development. The highest scores were observed in Ternopil ( S R = 28.57), Vinnytsia ( S R = 26.69) and Chernivtsi ( S R = 23.80) regions, largely as a result of the influence of local urban agglomerations on surrounding rural areas. Conversely, Dnipropetrovsk, Kharkiv, and Mykolaiv regions recorded values of 8.69, 10.67, and 13.82 points, respectively, indicating stagnation of rural development. The national average level of sustainable rural development amounts to 18.45 points.
The mean value of the integral sustainable development index for Ukraine’s regions is 20.41, reflecting an overall moderate level of sustainability nationwide. The highest integral index values were recorded in Vinnytsia (23.74), Chernivtsi (23.01) and Volyn (22.81) regions, attributable to the combined effect of relatively strong environmental and economic sustainability. The lowest values were observed in Odesa (14.40), Kharkiv (15.24) and Mykolaiv (15.29) regions, highlighting significant disparities in regional sustainability, particularly in the environmental dimension.
This pattern should be interpreted as a structural configuration rather than a simple difference in levels. In particular, the fact that economic sustainability frequently exceeds environmental sustainability suggests that regional development is shaped by partially conflicting logics, whereby production efficiency and intensification may improve economic outcomes while simultaneously weakening ecological balance.

4.2. Ranking of Regions of Ukraine by Level of Sustainable Development

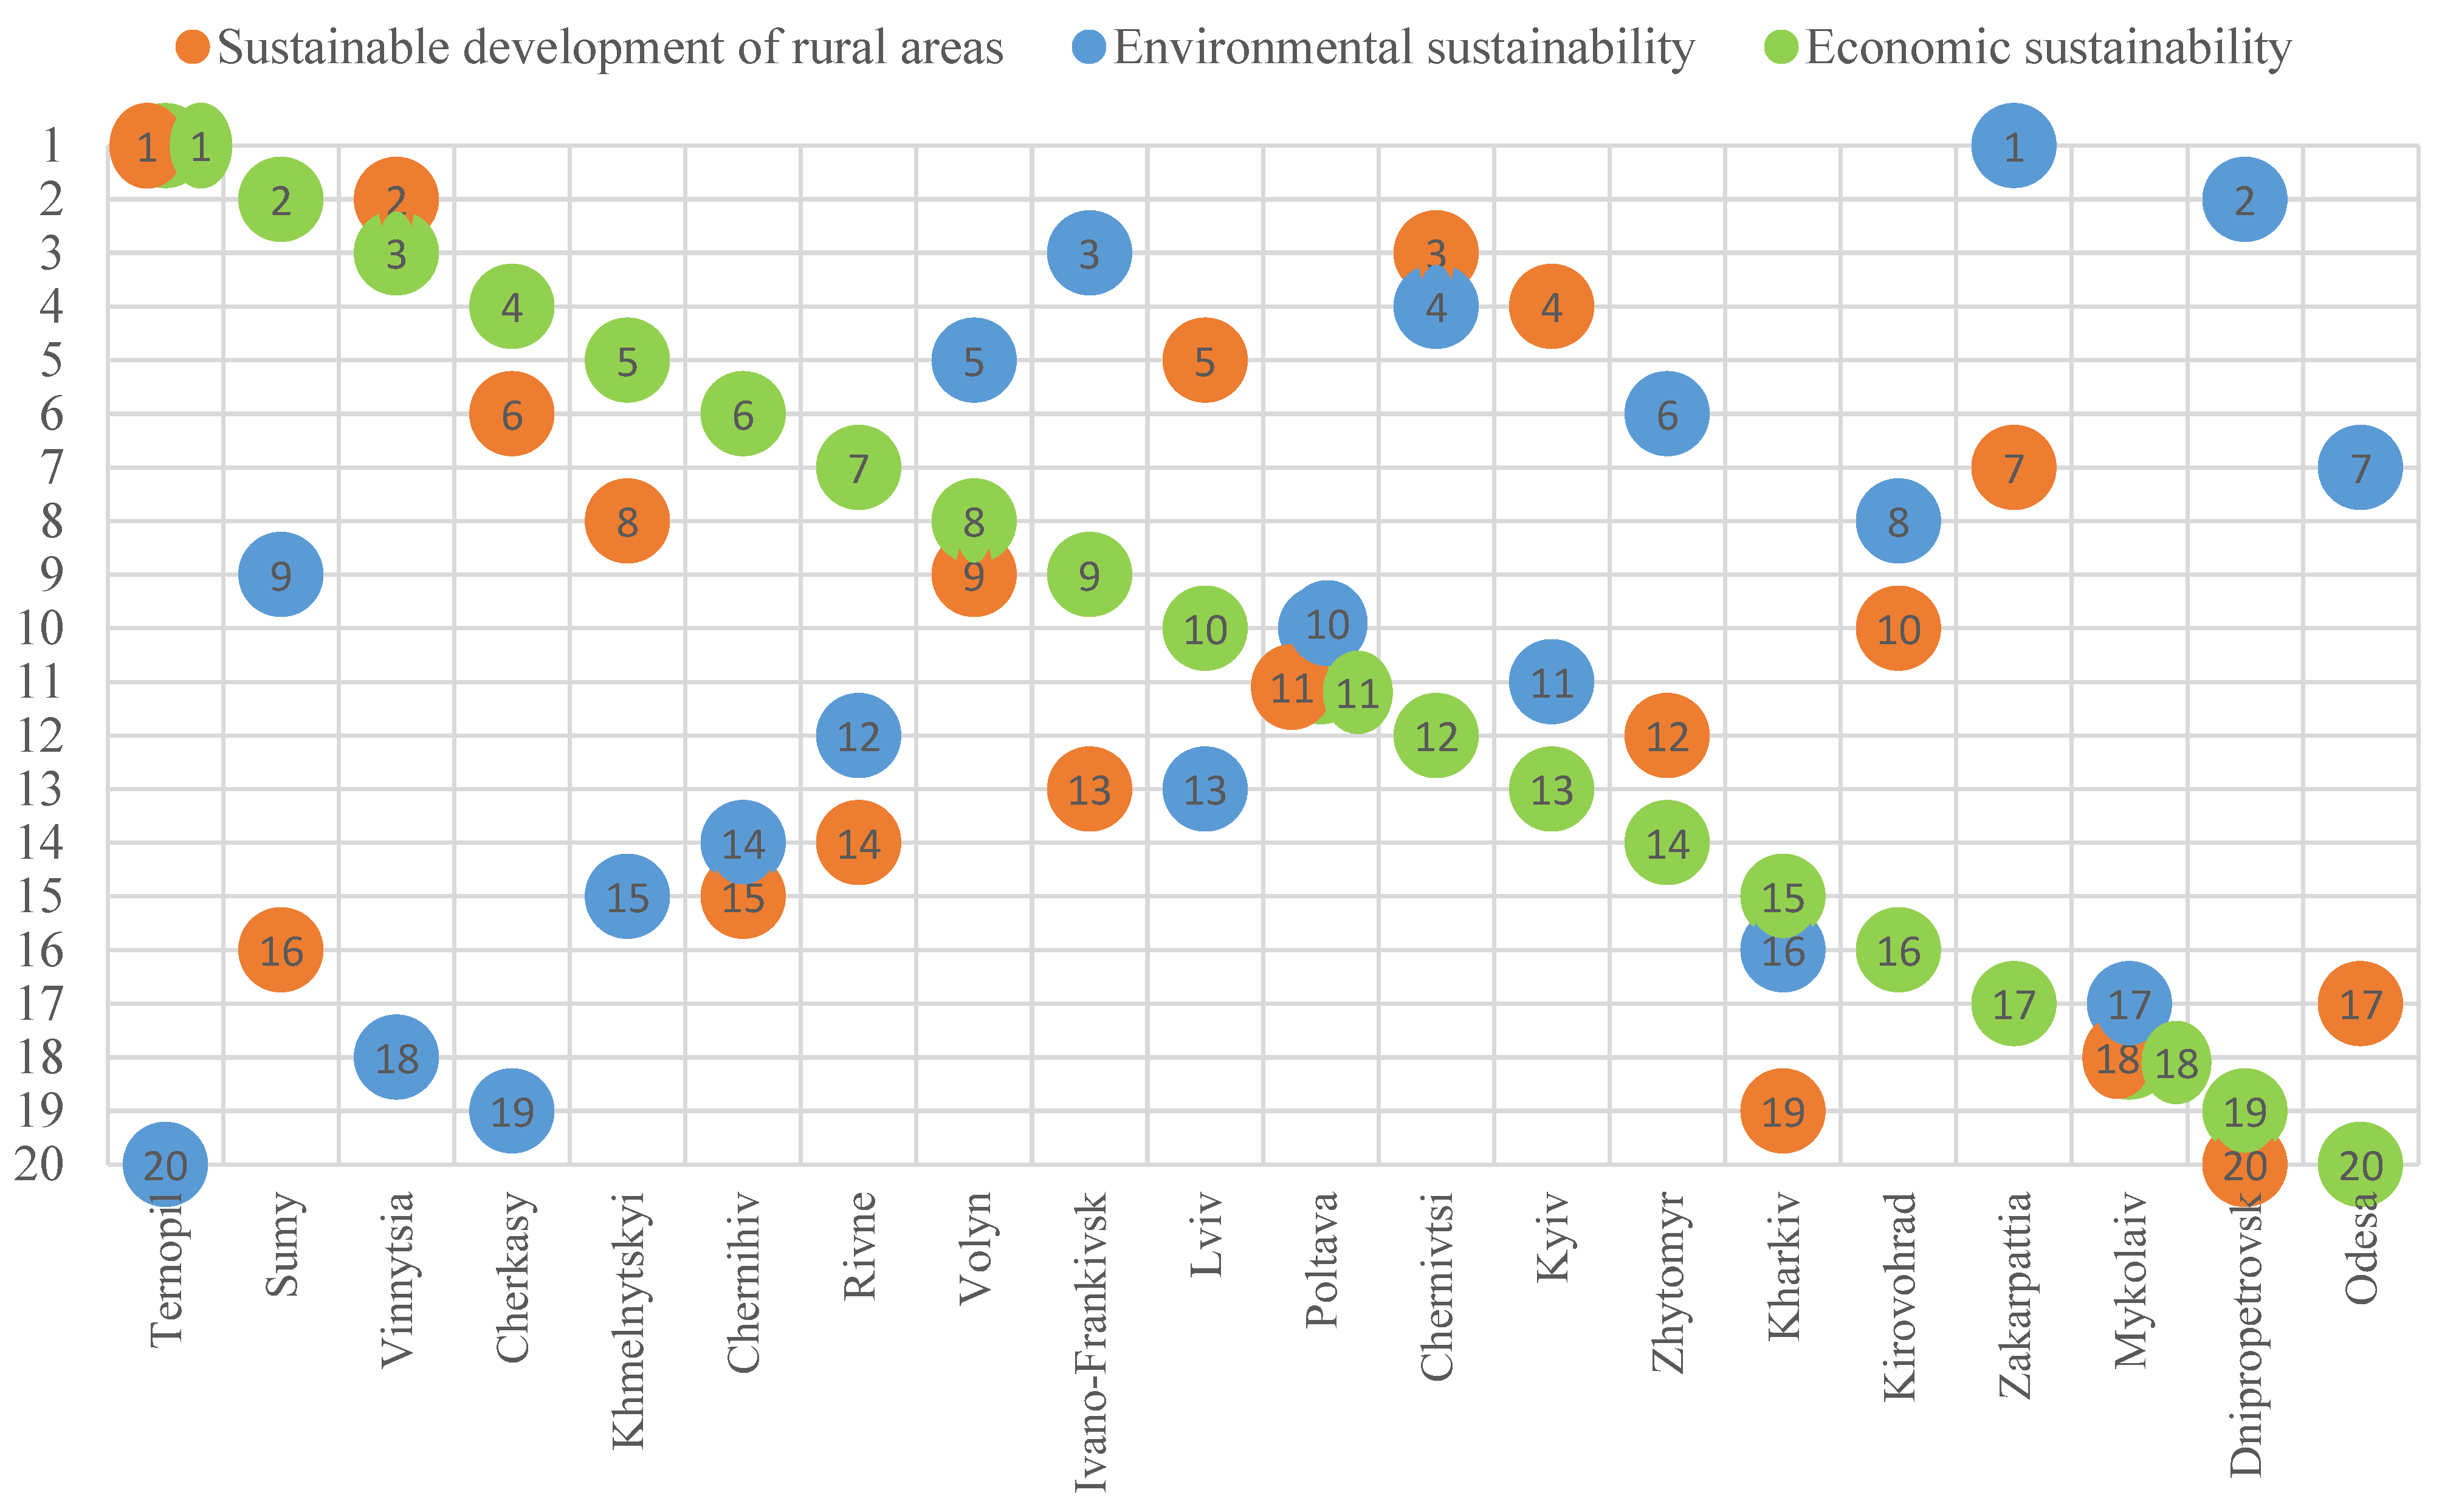
Sustainable rural development implies a balanced and proportionate advancement of the economic, environmental and social dimensions, whereby none of these components exhibits critical underperformance or excessive negative dominance. The results of the ranking procedure made it possible to assess the studied regions of Ukraine from the perspective of balanced sustainable development (Figure 1).
The ranking graph of Ukraine’s regions, constructed on the basis of the economic dimension of sustainability, provides a visual representation of the dissonance between economic performance and the socio-environmental parameters of rural territorial development across regions. Among the regions under study, three distinct groups can be identified in terms of balanced sustainable development.
The first group comprises the most balanced regions, characterised by high (or moderately high) and relatively similar rankings across all three dimensions—environmental, economic and rural development—without pronounced disparities. This group includes Volyn, Ivano-Frankivsk, Lviv, Poltava, Chernivtsi, Kyiv and Zhytomyr regions. These regions demonstrate harmonised positions across all components, indicating a balanced combination of environmental potential, sufficient economic activity and relatively stable social conditions in rural areas. It can be argued that these regions exhibit greater adaptability of the agricultural sector to internal and external challenges, as well as a stronger capacity for the long-term reproduction of productive, natural and human capital. From a strategic perspective, they may be considered a reference model of balanced sustainable rural development, suitable for disseminating best practices to other regions of Ukraine, including approaches that may support more sustainable and resilient raw-material supply within agri-food value chains.
The second group consists of regions with a high level of economic development in the agricultural sector, accompanied by low or relatively low environmental and social indicators. This group reflects a production-oriented development model, where strong economic performance in agriculture is achieved at the cost of heightened anthropogenic pressure on the environment and insufficient social and infrastructural development of rural areas. This group includes Ternopil, Sumy, Vinnytsia, Cherkasy, Khmelnytskyi, Chernihiv and Rivne regions. In these regions, high agricultural productivity, combined with environmental constraints and socio-demographic challenges, limits the realisation of balanced sustainable development potential, which may also increase sustainability-related risks for downstream users of agricultural raw materials.
The third group comprises regions with relatively high environmental sustainability and rural-development levels but a low economic component. This group includes Kirovohrad, Zakarpattia, Dnipropetrovsk and Odesa regions. Zakarpattia stands out among them, possessing significant natural resource potential and a relatively high level of rural sustainability that does not translate into corresponding economic performance. The low level of agricultural economic development in Zakarpattia can be explained by the challenging mountainous terrain and limited land resources. In Kirovohrad, Dnipropetrovsk and Odesa regions, the relatively moderate or high environmental indicators are partly related to their industrial specialisation, which simultaneously contributes to rural outmigration and constraints in social infrastructure development. This underscores the need to formulate development models that integrate environmental preservation with the promotion of environmentally oriented agricultural and non-agricultural activities, including through more effective coordination and value creation along regional agri-food value chains.
The clear outliers in terms of environmental and economic sustainability, as well as rural development, are Kharkiv and Mykolaiv regions. These regions face demographic challenges in rural areas, the low attractiveness of rural lifestyles, and structural imbalances between the environmental and economic components of agricultural development, all of which complicate the achievement of balanced sustainability.
Overall, the study confirms that, in agriculture, an additional obstacle to achieving balanced sustainable development lies in the inherent trade-off between economic and environmental drivers. Capital-intensive intensification of agricultural production—through mechanisation, chemicalisation and crop concentration—enhances economic efficiency, increases farmers’ incomes and indirectly supports rural social development. However, this model is associated with growing anthropogenic pressure, soil degradation, biodiversity loss and rising environmental risks, which in the long term undermine sustainability and can weaken the resilience of agricultural supply.
Conversely, reducing the intensity of agricultural production alleviates environmental pressure and strengthens the ecological component, yet may weaken economic performance and reduce agricultural incomes, thereby constraining rural-development potential.
Nevertheless, the regions of the first group demonstrate that reconciling economic performance with environmental constraints and socio-demographic viability is feasible. This finding supports the implementation of integrated, regionally differentiated development policies for the agricultural sector and rural areas, aimed at achieving a balanced combination of economic, environmental and social dimensions, and thereby strengthening the upstream conditions that underpin sustainability efforts across agri-food value chains.
From a systemic perspective, the identified regional groups may be interpreted as distinct sustainability configurations reflecting different patterns of coupling among economic, environmental and rural-development dimensions. Thus, the results do not merely indicate regional differences in performance, but also reveal whether the analysed dimensions are mutually reinforcing, weakly connected, or structurally imbalanced in specific regional contexts.

4.3. Determining the Impact of Agricultural Corporations and Family Farms on the Sustainable Development of Ukraine’s Regions

At the third stage, the ranking results were supplemented with direct indicators reflecting the development of family farming at the regional level. These included, in particular, the share of agricultural land cultivated by family farms and the share of agricultural output produced by family farms and large-scale agricultural enterprises (agribusiness corporations) in the total regional production volume. The ranking of these indicators was performed according to the principle of monotonic increasing dependence, whereby higher values corresponded to higher ranks (Table 6). This approach enables a clearer comparison of how the structural characteristics of agricultural production relate to regional sustainability outcomes across the analysed sample and helps to interpret potential upstream implications for agri-food value chains that rely on regionally differentiated raw-material supply.
To determine the direction and strength of the relationship between indicators of sustainable agricultural and rural development and the characteristics of family (small-scale) farming development, Spearman’s rank correlation coefficient was applied and calculated using Formula (3). The statistical significance of the obtained coefficients was assessed using the p-value at a significance level of α = 0.05, in accordance with Formula (4).
For the calculation of the rank correlation coefficient, the previously constructed integral and composite scores for the three blocks of sustainable agricultural and rural-development indicators were used: economic sustainability ( E c S ), environmental sustainability ( E n S ), and sustainable rural development ( S R ). In addition, indicators reflecting the development of family farms and agricultural enterprises were incorporated, including the share of agricultural land operated by family farms and the share of agricultural output produced by family farms and agricultural enterprises across the regions of Ukraine (based on data from Table 2, Table 3, Table 4 and Table 6) (Table 7).
The results of Spearman’s rank correlation analysis revealed a statistically significant positive relationship between environmental sustainability and the share of agricultural production generated by family farms (ρ = 0.571; p < 0.01), as well as a moderate positive association between environmental sustainability and the share of agricultural land operated by family farms (ρ = 0.435). These findings indicate a tendency towards higher environmental sustainability in regions characterised by a greater prevalence of small-scale land use. This supports the argument that the environmentally oriented nature of small-scale farming is generally based on less intensive exploitation of natural resources and a more rational land-use structure, which may also reduce upstream environmental pressures embedded in agricultural raw materials supplied to downstream users.
At the same time, a statistically significant negative relationship was identified between environmental sustainability and the share of production generated by large-scale agricultural enterprises (ρ = −0.571; p < 0.01). This suggests an adverse environmental effect associated with the concentration of agricultural production, driven by intensified land use and increased anthropogenic pressure, which may have implications in terms of higher sustainability risks in the upstream segment of agri-food value chains.
The calculation of Spearman’s coefficient further demonstrated a moderate negative relationship between economic sustainability and the share of production generated by family farms (ρ = −0.414; p ≈ 0.07), alongside a moderate positive relationship between economic sustainability and the share of production generated by large-scale agricultural enterprises (ρ = 0.414; p ≈ 0.07). These results indicate a tendency for the role of the small-scale sector to decline in regions with higher levels of economic sustainability in agricultural production. This outcome is consistent with previous research showing that the economic sustainability of the agricultural sector is largely shaped by production concentration, operational scale and the predominance of large-scale agricultural enterprises [48].
However, the rank correlation analysis did not reveal a statistically significant relationship between the level of sustainable rural development and the share of agricultural land operated by family farms (ρ = 0.25; p > 0.05) or the scale of activity of large agricultural enterprises (ρ = −0.098; p > 0.05). The weak and statistically unstable nature of these relationships suggests an indirect impact of small-scale land use on the socio-territorial parameters of rural development. The indirect (albeit negative) effect of large agro-industrial enterprises may be explained by their ability to operate in both relatively developed and economically depressed rural areas without necessarily generating stable socio-territorial spillover effects.
The correlation results further support a relational interpretation of sustainability, as they indicate partial coupling between farm structure and environmental outcomes, but much weaker and more context-dependent transmission mechanisms in the social/rural dimension. Overall, the correlation analysis provides grounds to argue that small family farming plays a substantial role in promoting sustainable rural development, particularly through the environmental dimension and associated socio-economic mechanisms. Unlike large-scale agribusiness, family farms are directly embedded in local communities, contribute to maintaining employment, and may help mitigate depopulation processes in rural areas. Their spatial embeddedness and diversified activities create preconditions for rational land use and environmentally balanced agricultural production, strengthening the sustainability of upstream agri-food supply systems that underpin downstream food value chains.


5. Discussion

The findings suggest that small family farms may play a substantial role in promoting the sustainable development of rural areas, primarily through their local embeddedness and potential contributions to employment, household incomes, and the preservation of the social fabric of rural communities. Consistent with the correlation results, regions with a higher share of family farming (in land use and/or output) tend to demonstrate stronger environmental sustainability indicators and, in several cases, more balanced development patterns, particularly in regions with limited opportunities for industrial growth.
From a value-chain perspective, the identified regional differences in sustainability can be interpreted as variations in upstream conditions that shape the performance of agri-food systems. Regions characterised by higher environmental sustainability and a stronger presence of family farming may provide raw materials with a lower embedded environmental footprint and greater alignment with sustainability-oriented sourcing requirements. Conversely, regions dominated by large-scale, input-intensive production may generate higher environmental pressures that can propagate along the value chain, potentially constraining the sustainability performance of downstream actors. In this regard, supporting small-scale farming structures may also improve the sustainability of agricultural raw-material supply, which is increasingly relevant for broader agri-food system transformation and SDG-aligned development across agri-food value chains.
From the perspective of supply chain organisation, these patterns suggest that agri-food value chains are structurally conditioned by regional production systems rather than being neutral transmission mechanisms. In particular, the observed divergence between economic and environmental sustainability implies that downstream actors may face trade-offs between cost efficiency and sustainability requirements when sourcing from different regions. Moreover, the weak and statistically non-significant relationship between farm structure and the social dimension ( S R ) indicates that social sustainability may not be directly transmitted along supply chains, but instead depends on broader territorial and institutional contexts. This highlights the importance of regionally differentiated sourcing strategies and closer coordination between upstream and downstream stages of agri-food value chains. An illustrative example of the interrelationship between economic performance and the adoption of environmentally oriented approaches in agriculture is the increase in farm incomes accompanied by the implementation of sustainable production methods. In particular, practices such as agroecological farming, alternative tillage systems (min-till, no-till, and strip-till), and the use of digital technologies for integrated pest management and the reduction in plant protection inputs have been associated with significant improvements in farm-level economic efficiency [49]. In developing countries, farmers who integrate agroecological principles into their production systems demonstrate more stable socio-economic outcomes and greater adaptability to market and environmental requirements [50]. This evidence is also consistent with EU analytical assessments of support programmes for sustainable agriculture, where the introduction of eco-schemes and financial incentives for environmentally friendly farming practices has led to measurable improvements in both economic and environmental performance at the farm level [51].
From a value-chain perspective, these findings align with arguments that sustainability outcomes and trade-offs increasingly need to be understood across interconnected stages of agri-food systems, including processing, distribution and consumption [19,25]. From a broader agri-food system perspective, these trade-offs may translate into tensions between cost efficiency and sustainability requirements for downstream actors. In practice, food processors and other downstream actors are increasingly exposed to upstream variability in environmental performance (e.g., input intensity and land-use structure), which can influence the feasibility of sustainability-oriented sourcing strategies and compliance with sustainability requirements communicated through supply chains [19]. Although the empirical focus of this study is upstream and regional, the identified interregional differentiation suggests that conditions relevant to sustainability-oriented sourcing and coordination within agri-food value chains are not uniform across Ukraine’s regions.
In addition, the literature highlights that food processing plays a dual role: it is essential for food safety, quality, and shelf-life, but it also contributes to resource use (notably, energy and water) and may generate waste streams, reinforcing the need for multi-objective approaches to sustainability [20,29]. In this context, improvements in upstream environmental sustainability—such as reduced chemical pressure and more diversified land-use structures—may complement downstream sustainability efforts by lowering the environmental burden embedded in raw materials and reducing sustainability risks that can propagate along the value chain.
A further implication concerns the spatial organisation of agri-food chains. Evidence from life-cycle assessment research indicates that value-chain configuration (including proximity to raw materials and the degree of decentralisation of processing capacity) can materially affect environmental performance [31]. Although the present study focuses on regional sustainability rather than processing configuration, the observed regional heterogeneity suggests that regionally tailored strategies—linking sustainable production areas with appropriate local or regional processing/logistics solutions—may offer an additional pathway to improve overall sustainability performance without undermining rural livelihoods.
Finally, sustainability governance increasingly depends on transparency and credible communication along supply chains. Traceability tools and frameworks, including blockchain-based approaches, have been proposed to support sustainability communication across food supply chains [32]. In the Ukrainian context, strengthening traceability readiness may be particularly relevant where policy aims to translate improvements in environmental sustainability (more strongly associated here with family farming) into market access, price premiums, and more stable buyer–supplier relationships. At the same time, systematic reviews emphasise that social sustainability assessment remains methodologically challenging across supply chain stages [26], which is consistent with the present finding of weak and statistically non-significant relationships between farm structure and the SR component.
Although the present study does not apply formal network modelling, its findings can be interpreted within a systemic framework in which sustainability dimensions are understood as structurally interdependent. In this respect, the divergence observed between economic and environmental sustainability, the positive environmental association of family farming, and the weak direct linkage between farm structure and the SR component point to a configuration of partial couplings, trade-offs and asymmetries rather than simple one-directional effects. This interpretation is close to the network perspective proposed by Istudor et al. [33], where system-level outcomes depend on the structure of interrelations among key drivers and where policy relevance arises from identifying synergies, decouplings and structural misalignments rather than relying solely on aggregate scores. For the purposes of the present study, this perspective helps to clarify that farm structure should be viewed not as a single determinant of sustainability outcomes, but as a factor embedded in a broader regional system linking production intensity, land-use structure, environmental pressure and rural-development dynamics. However, a large-scale transition of farmers to environmentally friendly and sustainable production methods remains difficult to anticipate, even within the EU.
The trade-offs between environmental measures and short-term economic outcomes remain substantial, often resulting in reduced incomes for farms that adopt less capital-intensive and more environmentally responsible production methods. Therefore, dedicated institutional support from the state (similar to instruments of the Common Agricultural Policy) is necessary to compensate for potential economic losses arising from the implementation of environmentally and socially beneficial transformations. In Ukraine, such support could be strengthened by regionally differentiated instruments that (i) prioritise measures with the strongest environmental co-benefits in regions where chemical pressure is high; (ii) support family farms’ access to markets, advisory services and technologies; and (iii) encourage forms of coordination that improve value-chain transparency and reward sustainability improvements, thereby linking regional sustainability performance with supply chain incentives [19,32]. Future research could extend this approach by linking regional sustainability profiles to processing-stage resource efficiency, traceability practices, and circular-economy interventions, thereby strengthening the evidence base for SDG-aligned agri-food value-chain strategies.

6. Conclusions

The study confirms substantial regional disparities in the level of agricultural and rural sustainability in Ukraine. Economic sustainability generally exceeds environmental sustainability, indicating an asymmetric development pattern. Family farming is positively associated with environmental sustainability and more balanced regional development, whereas the predominance of large-scale agricultural enterprises is linked to adverse environmental effects despite higher economic performance.
No statistically significant relationship was identified between farm structure and the social dimension (SR), suggesting that social sustainability outcomes depend on more complex and context-specific mechanisms beyond production scale alone. The results highlight inherent trade-offs between economic intensification and ecological stability, although balanced development remains achievable in some regions.
From the perspective of SDG-aligned agri-food value chains, regional differences in sustainability represent both constraints and opportunities for sourcing strategies. Regions characterised by stronger environmental performance and a higher prevalence of family farming may offer more favourable conditions for sustainability-oriented procurement, whereas input-intensive production systems may generate risks that propagate along the value chain.
These findings support the need for regionally differentiated policy instruments and stronger coordination between farm structures and value-chain requirements. More broadly, the results underscore a systemic interpretation of sustainability, in which economic, environmental and social dimensions are interdependent and characterised by structural trade-offs. Accordingly, the integral sustainability index should be treated as a synthetic reference point, while the main analytical value lies in identifying asymmetries between dimensions.
Future research could extend this approach by incorporating multi-year data and establishing more direct links to value-chain dynamics.

Author Contributions

Conceptualization, Y.Z. and V.K.; methodology, Y.Z.; software, Y.Z.; validation, Y.Z., V.K. and J.K.; formal analysis, Y.Z., V.K. and J.K.; investigation, Y.Z., V.K. and J.K.; data curation, Y.Z.; writing—original draft preparation, Y.Z., V.K. and J.K.; writing—review and editing, Y.Z., V.K. and J.K.; visualisation, Y.Z.; supervision, Y.Z.; project administration, Y.Z.; funding acquisition, V.K. All authors have read and agreed to the published version of the manuscript.

Funding

This research received no external funding.

Institutional Review Board Statement

Not applicable.

Informed Consent Statement

Not applicable.

Data Availability Statement

The original data presented in the study are openly available in the State Statistics Service of Ukraine (SSSU). All calculations were performed by the authors based on the cited sources.

Conflicts of Interest

The authors declare no conflicts of interest.

References

  1. Elliott, J. An Introduction to Sustainable Development, 4th ed.; Routledge: London, UK, 2012. [Google Scholar] [CrossRef]
  2. Pezzey, J. Sustainable Development Concepts: An Economic Analysis; World Bank Environment Paper No. 2; World Bank: Washington, DC, USA, 1992; Available online: https://documents.worldbank.org/en/publication/documents-reports/documentdetail/237241468766168949 (accessed on 30 January 2026).
  3. Zolotnytska, Y. Transformation of the Ukrainian Agrarian Model in the Context of Accession to the EU. Int. J. Manag. Econ. 2025, 61, 161–173. [Google Scholar] [CrossRef]
  4. Heyets, V.M.; Borodina, O.M.; Prokopa, I.V. The Ukrainian Model of Agrarian Development and Its Socioeconomic Reorientation; National Academy of Sciences of Ukraine, State Institution “Institute for Economics and Forecasting of the National Academy of Sciences of Ukraine”: Kyiv, Ukraine, 2012; 56p. (In Ukrainian) [Google Scholar]
  5. Nivievskyi, O.; Iavorskyi, P.; Donchenko, O. Assessing the Role of Small Farmers and Households in Agriculture and the Rural Economy and Measures to Support Their Sustainable Development; Kyiv School of Economics: Kyiv, Ukraine, 2021; Available online: https://kse.ua/wp-content/uploads/2021/02/KSE-Smallholders.pdf (accessed on 13 March 2026).
  6. Lupenko, Y.O.; Malik, M.Y.; Shpykulyak, O.G.; Mamchur, V.A.; Avramenko, Y.O.; Pivtorak, V.S.; Mamchur, L.V.; Malik, L.M.; Demchenko, O.V.; Tarasyuk, A.V. Orhanizatsiyno-Ekonomichne Zabezpechennya Rozvytku Simeynykh Fermers’kykh Hospodarstv: Monohrafiya [Organizational and Economic Support for the Development of Family Farms: Monograph]; National Research Center “Institute of Agrarian Economics”: Kyiv, Ukraine, 2019. [Google Scholar]
  7. Sokil, O.; Zhuk, V.; Vasa, L. Integral Assessment of the Sustainable Development of Agriculture in Ukraine. Econ. Ann.-XXI 2018, 170, 15–21. [Google Scholar] [CrossRef]
  8. Harasim, A. Metoda oceny zrównoważonego rozwoju rolnictwa na poziomie gospodarstwa rolnego. Stud. I Rap. IUNG-PIB 2013, 32, 25–75. Available online: https://bc.iung.pl/server/api/core/bitstreams/eb8f8fd9-ddb7-404a-b350-90b4e6688f6c/content (accessed on 2 April 2026).
  9. Matuszczak, A. Wskaźniki zrównoważonego rozwoju rolnictwa: Przesłanki teoretyczne i propozycja pomiaru w regionach UE. Wieś Rol. 2013, 1, 101–119. [Google Scholar] [CrossRef]
  10. Kowalczyk, S.; Zolotnytska, Y. Sustainability of Agriculture and Rural Areas in Regional Terms. Econ. Environ. 2024, 89, 773. [Google Scholar] [CrossRef]
  11. UN. Our Common Future; World Commission on Environment and Development; United Nations: New York, NY, USA; Oxford University Press: Oxford, UK, 1987; Available online: https://www.brundtland.co.za/wp-content/uploads/2022/08/Brundtland-Report-1987-Our-Common-Future.pdf (accessed on 13 March 2026).
  12. UN. Report of the United Nations Conference on Environment and Development, A/CONF.151/26 (Vol. I), Rio de Janeiro, 3–14 June 1992; United Nations: New York, NY, USA, 1992; Available online: https://digitallibrary.un.org/record/160453 (accessed on 13 March 2026).
  13. Douglass, G. The Meanings of Agricultural Sustainability. In Agricultural Sustainability in a Changing World Order; Douglass, G., Ed.; Westview Press: Boulder, CO, USA, 1984; 282p. [Google Scholar]
  14. Smit, B.; Smithers, J. Sustainable Agriculture: Interpretations, Analyses and Prospects. Can. J. Reg. Sci. 1993, 16, 499–524. Available online: https://www.researchgate.net/publication/266337678_Sustainable_Agriculture_Interpretations_Analyses_and_Prospects (accessed on 27 January 2026).
  15. Hansen, J.W. Is Agricultural Sustainability a Useful Concept? Agric. Syst. 1996, 50, 117–143. [Google Scholar] [CrossRef]
  16. Edwards, C.A. Sustainable Agricultural Systems; CRC Press: Boca Raton, FL, USA, 1990; 712p. [Google Scholar] [CrossRef]
  17. Robertson, G.P.; Harwood, R.R. Sustainable Agriculture. In Encyclopedia of Biodiversity, 2nd ed.; Levin, S.A., Ed.; Academic Press: Waltham, MA, USA, 2013; Volume 1, pp. 111–118. [Google Scholar] [CrossRef]
  18. UN. Sustainable Development Goals; United Nations: New York, NY, USA, 2015; Available online: https://sdgs.un.org/goals (accessed on 13 March 2026).
  19. Michel, M.; Eldridge, A.L.; Hartmann, C.; Klassen, P.; Ingram, J.; Meijer, G.W. Benefits and Challenges of Food Processing in the Context of Food Systems, Value Chains and Sustainable Development Goals. Trends Food Sci. Technol. 2024, 153, 104703. [Google Scholar] [CrossRef]
  20. Knorr, D. Food Processing: Legacy, Significance and Challenges. Trends Food Sci. Technol. 2024, 143, 104270. [Google Scholar] [CrossRef]
  21. Tomaš Simin, M.; Glavaš-Trbić, D.; Miljatović, A.; Despotović, J.; Novaković, T. Farm Sustainability Indicators—Exploring FADN Database. Land 2025, 14, 1950. [Google Scholar] [CrossRef]
  22. Bockstaller, C.; Guichard, L.; Makowski, D.; Aveline, A.; Girardin, P.; Plantureux, S. Agri-environmental indicators to assess cropping and farming systems. A review. Agron. Sustain. Dev. 2008, 28, 139–149. [Google Scholar] [CrossRef]
  23. Gaviglio, A.; Bertocchi, M.; Demartini, E. A Tool for the Sustainability Assessment of Farms: Selection, Adaptation and Use of Indicators for an Italian Case Study. Resources 2017, 6, 60. [Google Scholar] [CrossRef]
  24. Robling, H.; Hatab, A.A.; Säll, S.; Hansson, H. Measuring sustainability at farm level—A critical view on data and indicators. Environ. Sustain. Indic. 2023, 18, 100258. [Google Scholar] [CrossRef]
  25. Allali, T.; Colabianchi, M.; Moretti, M.; Brunori, G. Towards a New Framework to Assess Agri-Food Value Chains’ Sustainability—The Case of Chestnut Value Chain. Heliyon 2024, 10, e27836. [Google Scholar] [CrossRef]
  26. Desiderio, E.; García-Herrero, L.; Hall, D.; Segrè, A.; Vittuari, M. Social Sustainability Tools and Indicators for the Food Supply Chain: A Systematic Literature Review. Sustain. Prod. Consum. 2022, 30, 527–540. [Google Scholar] [CrossRef]
  27. Brunelle, T.; Chakir, R.; Carpentier, A.; Dorin, B.; Goll, D.; Guilpart, N.; Maggi, F.; Makowski, D.; Nesme, T.; Roosen, J. Reducing Chemical Inputs in Agriculture Requires a System Change. Commun. Earth Environ. 2024, 5, 369. [Google Scholar] [CrossRef]
  28. Garcia, A. The Environmental Impacts of Agricultural Intensification; SPIA Technical Note No. 9; CGIAR: Montpellier, France, 2020; Available online: https://iaes.cgiar.org/spia/publications/environmental-impacts-agricultural-intensification (accessed on 13 March 2026).
  29. Madoumier, M.; Trystram, G.; Sébastien, P.; Collignan, A. Towards a Holistic Approach for Multi-Objective Optimization of Food Processes: A Critical Review. Trends Food Sci. Technol. 2019, 86, 1–15. [Google Scholar] [CrossRef]
  30. Ait Sidhoum, A.; Canessa, C.; Sauer, J. Effects of Agri-Environment Schemes on Farm-Level Eco-Efficiency Measures: Empirical Evidence from EU Countries. J. Agric. Econ. 2023, 74, 551–569. [Google Scholar] [CrossRef]
  31. Silva, B.Q.; Kancirova, E.; Zdravkovic, M.; Batta, U.; Petrusán, J.-I.; Pasch, K.; Aganovic, K.; Vasconcelos, M.W.; Smetana, S. Sustainable Food Chains Designed for Optimised Resource Use: Optimising Downscaled Food Chains for Sustainable Resource Use: A Comprehensive Case Study on Tomato Juice. J. Clean. Prod. 2024, 450, 141879. [Google Scholar] [CrossRef]
  32. Cao, S.; Xu, H.; Bryceson, K.P. Blockchain Traceability for Sustainability Communication in Food Supply Chains: An Architectural Framework, Design Pathway and Considerations. Sustainability 2023, 15, 13486. [Google Scholar] [CrossRef]
  33. Istudor, N.; Constantin, M.; Privitera, D.; Ignat, R.; Petrescu, I.-E.; Teodor, C. Systemic competitiveness in the EU cereal value chain: A network perspective for policy alignment. Land 2025, 14, 731. [Google Scholar] [CrossRef]
  34. Rezaei, J. Best-Worst Multi-Criteria Decision-Making Method. Omega 2015, 53, 49–57. [Google Scholar] [CrossRef]
  35. Talukder, B.; Hipel, K.W.; Van Loon, G.W. Developing Composite Indicators for Agricultural Sustainability Assessment: Effect of Normalization and Aggregation Techniques. Resources 2017, 6, 66. [Google Scholar] [CrossRef]
  36. Ferla, G.; Mura, B.; Falasco, S.; Caputo, P.; Matarazzo, A. Multi-Criteria Decision Analysis (MCDA) for Sustainability Assessment in the Food Sector: A Systematic Literature Review on Methods, Indicators and Tools. Sci. Total Environ. 2024, 946, 174235. [Google Scholar] [CrossRef] [PubMed]
  37. Tzeng, G.-H.; Huang, J.-J. Multiple Attribute Decision Making: Methods and Applications; CRC Press: Boca Raton, FL, USA, 2011; 336p. [Google Scholar] [CrossRef]
  38. Hauke, J.; Kossowski, T. Comparison of Values of Pearson’s and Spearman’s correlation coefficients on the same sets of data. Quaest. Geogr. 2011, 30, 87–93. [Google Scholar] [CrossRef]
  39. SSSU. Economic Statistics/Economic Activities/Agriculture, Forestry and Fishing. State Statistics Service of Ukraine. 2024. Available online: https://www.ukrstat.gov.ua (accessed on 30 January 2026).
  40. Trading Economics. European Union—Land under Cereal Production (Hectares). 2026. Available online: https://tradingeconomics.com/european-union/land-under-cereal-production-hectares-wb-data.html (accessed on 30 January 2026).
  41. Eurostat. Agri-Environmental Indicator—Livestock Patterns. 2023. Available online: https://ec.europa.eu/eurostat/statistics-explained/index.php?title=Agri-environmental_indicator_-_livestock_patterns (accessed on 30 January 2026).
  42. Our World in Data. Fertilizer Use per Hectare of Arable Land. 2023. Available online: https://ourworldindata.org/grapher/fertilizer-use-in-kg-per-hectare-of-arable-land (accessed on 30 January 2026).
  43. Eurostat. Agri-Environmental Indicator—Mineral Fertiliser Consumption. 2025. Available online: https://ec.europa.eu/eurostat/statistics-explained/index.php?title=Agri-environmental_indicator_-_mineral_fertiliser_consumption (accessed on 30 January 2026).
  44. Eurostat. 39% of the EU Is Covered with Forests (Eurostat News, 21 March 2021). 2021. Available online: https://ec.europa.eu/eurostat/web/products-eurostat-news/-/edn-20210321-1 (accessed on 30 January 2026).
  45. European Environment Agency. Designated Terrestrial Protected Areas in Europe: Indicator Assessment. 2025. Available online: https://www.eea.europa.eu/en/analysis/indicators/terrestrial-protected-areas-in-europe (accessed on 30 January 2026).
  46. McGinley, J.; Healy, M.; Ryan, P.; Harmon O’Driscoll, J.; Mellander, P.-E.; Morrison, L.; Siggins, A. Impact of Historical Legacy Pesticides on Achieving Legislative Goals in Europe. Sci. Total Environ. 2023, 873, 162312. [Google Scholar] [CrossRef]
  47. Ligutko, A.V.; Avanesyan, A.S. Ekologichni Problemy Dnipropetrovshchyny ta Shlyakhy Yikh Vyrishennya [Environmental Problems of the Dnipropetrovsk Region and Ways of Their Solution]. In Proceedings of the Scientific Materials of the VII All-Ukrainian Young Scientists Conference, Section 10—Environmental Problems of the Regions, Dnipro, Ukraine, 27 November–3 December 2019; Available online: https://ir.nmu.org.ua/handle/123456789/154880?show=full (accessed on 30 January 2026).
  48. Duffy, M. Economies of Size in Production Agriculture. J. Hunger Environ. Nutr. 2009, 4, 375–392. [Google Scholar] [CrossRef]
  49. Bocean, C.G. A Cross-Sectional Analysis of the Relationship between Digital Technology Use and Agricultural Productivity in EU Countries. Agriculture 2024, 14, 519. [Google Scholar] [CrossRef]
  50. Setsoafia, E.; Ma, W.; Renwick, A. Effects of Sustainable Agricultural Practices on Farm Income and Food Security in Northern Ghana. Agric. Food Econ. 2022, 10, 16. [Google Scholar] [CrossRef]
  51. Zieliński, M.; Józwiak, W.; Żak, A.; Rokicki, T. Development of Eco-Schemes as an Important Environmental Measure in Areas Facing Natural or Other Specific Constraints under the Common Agricultural Policy 2023–2027: Evidence from Poland. Sustainability 2025, 17, 2781. [Google Scholar] [CrossRef]
Figure 1. Results of ranking Ukraine’s regions by the analysed dimensions of sustainable development. Source: Own research.
Sustainability 18 03629 g001
Table 1. Indicators of economic sustainability of agriculture, environmental sustainability and sustainable development of rural areas across Ukrainian regions.
Economic SustainabilityEnvironmental SustainabilitySustainable Development of Rural Areas
E c S 1 —Region’s share of total national agricultural output, % E n S 1 —Share of cereal crops in the sown area of arable land, % S R 1 —Ratio of the average wage in agriculture to the average wage in other sectors of the national economy, %
E c S 2 —Agricultural production per 100 hectares of agricultural land in the region (thousand USD) E n S 2 —Livestock density on utilised agricultural land in large animal units (LSU/ha) S R 2 —Share of the rural population in the region, %
E c S 3 —Share of agricultural output in total regional production, % E n S 3 —Mineral fertiliser application rate, kg per hectare of fertilised area S R 3 —Share of the employed population engaged in agriculture, %
E c S 4 —Average yield of cereals and legumes, decitonne per hectare (dt/ha) E n S 4 —Share of forest area in the total area of the region, % S R 4 —Unemployment rate in rural areas, %
E c S 5 —Average annual milk yield per cow, kg E n S 5 —Share of organically farmed land in the total agricultural area of the region, % S R 5 —Net migration balance in rural areas, thousand persons
E c S 6 —Labour productivity in enterprises engaged in agricultural activity, thousand USD per employee E n S 6 —Pesticide use intensity, kg per hectare of arable land S R 6 —Number of physicians per 10,000 rural inhabitants
E c S 7 —Share of capital investments in agriculture in the total regional investment volume, % E n S 7 —Share of protected natural areas in the total area of the region, % S R 7 —Rural housing stock, m2 per inhabitant
E c S 8 —Profitability rate of production of main crop products by enterprises in the region, % E n S 8 —Capital investments in environmental protection, USD per 100 ha of regional area S R 8 —Share of household income derived from the sale of agricultural products in total household income, %
E c S 9 —Profitability rate of production of main livestock products by enterprises in the region, % E n S 9 —Current expenditures on environmental protection, USD per 100 ha of regional area; S R 9 —Value of consumed products obtained from personal subsidiary farming and self-provisioning in total household income, %
E n S 10 —Emissions of air pollutants from stationary sources, thousand tonnes
Source: Own study.
Table 2. Selected indicators of economic sustainability of agriculture in the regions of Ukraine, 2022.
RegionsIndicators of Economic Sustainability
E c S 1 E c S 2 E c S 3 E c S 4 E c S 5 E c S 6 E c S 7 E c S 8 E c S 9
Vinnytsia8.371.534.344.4589227.122.415.7−20.3
Volyn2.467.243.244.7546026.315.336.3−12.8
Dnipropetrovsk6.244.97.632.1377020.83.825.1−31.3
Zhytomyr4.139.225.743.3497625.616.312.3−19.5
Zakarpattia1.136.245.638.6513511.41.731.2−6.7
Ivano-Frankivsk2.079.155.658.3532024.85.45.0−11.3
Kyiv5.756.514.048.7697017.012.811.9−25.6
Kirovohrad5.242.123.645.2317014.433.116.2−32.0
Lviv3.679.88.758.5502230.55.612.0−7.0
Mykolaiv4.127.819.230.3453014.927.415.1−13.1
Odesa4.725.412.226.033129.97.1−10.5−21.9
Poltava5.955.615.957.5630619.113.319.8−31.7
Rivne2.557.419.849.9423829.520.238.624.4
Sumy4.047.126.864.4521733.637.038.1−31.5
Ternopil3.971.733.759.7536930.426.323.3−12.9
Kharkiv5.231.816.342.3473025.612.331.1−35.2
Khmelnytskyi5.664.633.263.4527628.127.120.6−31.2
Cherkasy6.075.232.656.5661518.930.817.8−29.7
Chernivtsi1.657.054.754.0551018.45.310.1−14.8
Chernihiv4.843.529.962.8553426.336.823.2−19.0
Average value4.353.727.649.0511822.618.019.6−19.2
Source: Calculated by the authors based on data from [39].
Table 3. Selected indicators of environmental sustainability of agriculture in the regions of Ukraine, 2022.
RegionsIndicators of Environmental Sustainability
E n S 1 E n S 2 E n S 3 E n S 4 E n S 5 E n S 6 E n S 7 E n S 8 E n S 9 E n S 10
Vinnytsia45.80.2521413.19.81.80.8171.9206.469.6
Volyn37.80.2315735.75.11.31.540.5366.74.8
Dnipropetrovsk47.30.121255.64.51.30.13997.17159.5328.9
Zhytomyr39.80.2015433.64.91.41.710.0171.39.7
Zakarpattia35.30.3015951.22.51.212.148.6508.13.4
Ivano-Frankivsk38.90.2916145.33.21.110.5480.41053.2152.3
Kyiv45.90.2714322.23.01.68.7253.7998.248.0
Kirovohrad56.80.141394.513.81.52.449.3209.48.4
Lviv41.80.3016328.59.61.73.7189.1694.376.2
Mykolaiv57.30.161284.15.11.80.7337.0657.25.3
Odesa55.50.12946.14.20.83.393.7599.127.2
Poltava48.20.191018.67.01.60.8316.9953.527.7
Rivne42.60.2814336.45.92.25.163.8646.55.6
Sumy43.10.1216817.84.21.61.790.1658.810.7
Ternopil51.20.3623613.32.71.92.065.565.88.3
Kharkiv49.30.2312712.12.11.80.8562.41062.323.2
Khmelnytskyi41.20.3414712.93.62.113.173.9387.016.5
Cherkasy50.30.2717415.13.21.61.351.3312.147.0
Chernivtsi42.70.2114231.93.21.45.6246.7502.41.4
Chernihiv42.80.1413820.90.81.61.338.8306.615
Average value45.70.2015120.94.91.63.9359.0876.044.5
Source: Calculated by the authors based on data from [39].
Table 4. Selected indicators of sustainable development of rural areas in the regions of Ukraine, 2022.
RegionsIndicators of Sustainable Development of Rural Areas
S R 1 S R 2 S R 3 S R 4 S R 5 S R 6 S R 7 S R 8 S R 9
Vinnytsia80.948.03211.4−0.374538.45.84.9
Volyn83.147.717.510.5−0.383228.03.47.4
Dnipropetrovsk65.115.97.69.1−0.403530.61.01.6
Zhytomyr82.440.513.811.6−0.303336.03.86.5
Zakarpattia85.462.825.712.3−0.193025.41.79.0
Ivano-Frankivsk79.355.528.511.9−0.223029.71.65.9
Kyiv71.238.015.57.32.234529.50.93.4
Kirovohrad57.636.47.810.5−0.153849.05.03.2
Lviv92.138.917.07.9−0.064831.11.02.6
Mykolaiv52.831.316.58.50.023928.72.21.5
Odesa54.532.815.27.50.013925.82.42.4
Poltava73.137.422.012.8−0.054329.33.75.6
Rivne55.352.517.110.5−0.043632.22.34.7
Sumy86.130.422.710.5−0.533525.63.52.7
Ternopil102.254.132.012.3−0.204834.54.26.6
Kharkiv48.618.75.79.40.064729.40.71.9
Khmelnytskyi76.342.326.310.8−0.233829.43.33.8
Cherkasy86.042.826.310.4−0.253236.16.70.9
Chernivtsi85.156.727.411.5−0.113937.33.35.3
Chernihiv95.134.223.712.9−0.213427.81.65.6
Average value75.640.820.0210.48−0.0738.331.72.914.3
Source: Calculated by the authors based on data from [39].
Table 5. Levels of sustainability of agriculture and rural areas in the regions of Ukraine.
RegionsAgricultureSustainable Development of Rural Areas,
S R
Integral Regional Sustainable Development Index,
I S R
Environmental Sustainability,
E n S
Economic Sustainability,
E c S
Vinnytsia16.0528.4826.6923.74
Volyn23.8725.9418.6222.81
Dnipropetrovsk25.9713.478.6916.04
Zhytomyr23.3318.9018.0120.08
Zakarpattia28.1316.1419.2221.16
Ivano-Frankivsk25.4924.8517.6022.65
Kyiv21.2120.8523.0721.71
Kirovohrad21.5716.9418.4819.00
Lviv21.0023.0921.4721.85
Mykolaiv17.0515.0113.8215.29
Odesa23.255.0514.9014.40
Poltava21.2422.1718.4620.62
Rivne21.0126.4416.5121.32
Sumy21.5228.9615.2921.92
Ternopil9.8629.3128.5722.58
Kharkiv17.4817.5810.6715.24
Khmelnytskyi19.6627.9818.7422.13
Cherkasy14.8528.4320.8421.37
Chernivtsi24.2121.0123.8023.01
Chernihiv20.7127.6715.5521.31
Average value20.8721.9118.4520.41
Source: Own calculations.
Table 6. Ranking of indicators reflecting the contribution of family farms and large-scale agricultural enterprises to regional agricultural land use and output in Ukraine, 2022.
RegionsFamily Farms: Share of Agricultural Land CultivatedFamily Farms: Share of Agricultural Output in Total Regional OutputLarge-Scale Enterprises: Share of Agricultural Output in Total Regional Output
%Rank%Rank%Rank
Vinnytsia19.71226.71773.34
Volyn48.6345.9554.116
Dnipropetrovsk21.9930.01370.08
Zhytomyr19.21344.2755.814
Zakarpattia48.5491.019.020
Ivano-Frankivsk55.3256.1343.918
Kyiv17.51629.71470.37
Kirovohrad20.31135.3964.712
Lviv41.3645.2654.815
Mykolaiv22.3834.31065.711
Odesa21.91036.8863.213
Poltava18.31528.91671.15
Rivne43.5551.6448.417
Sumy10.72020.11979.92
Ternopil27.8732.11167.910
Kharkiv17.11830.91269.19
Khmelnytskyi17.21729.21570.86
Cherkasy19.11422.41877.63
Chernivtsi63.4173.6226.419
Chernihiv11.21919.32080.71
Average value28.2-39.8-60.2-
Source: Own research based on data from [39].
Table 7. Results of Spearman’s rank correlation analysis across the analysed regions of Ukraine (n = 20).
Pairwise Correlation CoefficientsΣd2Spearman’s Coefficient ρp-ValueDirection of the Relationship
Environmental sustainability E n S /share of agricultural land in the region cultivated by family farms, %7520.4350.056Moderate positive correlation; marginally statistically significant
Environmental sustainability E n S /share of agricultural output produced by family farms in total regional output, %5700.5710.008Moderate strong positive correlation; statistically significant
Economic sustainability E c S /share of agricultural output produced by family farms in total regional output, %1880−0.4140.070Moderate negative correlation; marginally statistically significant
Sustainable development of rural areas S R / share of agricultural land in the region cultivated by family farms, %9980.2500.290Weak positive correlation; not statistically significant
Economic sustainability E c S /share of agricultural output produced by large-scale agricultural enterprises in total regional output, %7800.4140.070Moderate positive correlation; marginally statistically significant
Environmental sustainability E n S /share of agricultural output produced by large-scale agricultural enterprises in total regional output, %2090−0.5710.009Moderate negative correlation; statistically significant
Sustainable development of rural areas S R / share of agricultural output produced by large-scale agricultural enterprises in total regional output, %1460−0.0980.680Very weak negative correlation; not statistically significant
Source: Own research.
Disclaimer/Publisher’s Note: The statements, opinions and data contained in all publications are solely those of the individual author(s) and contributor(s) and not of MDPI and/or the editor(s). MDPI and/or the editor(s) disclaim responsibility for any injury to people or property resulting from any ideas, methods, instructions or products referred to in the content.