1. Introduction
The Architecture, Engineering, and Construction (AEC) sector represents a key contributor to global CO
2 emissions and resource consumption. The international context is marked by the effects of climate change, which lead to increased attention to performance evaluation and material selection, within a sustainable development perspective [
1].
In this scenario, the performance of the building envelope, particularly the external walls, plays a critical role [
2]. The magnitude of heat transfer by conduction depends on the thermal insulation performance of the walls, which directly affects the evaluation of the building’s energy performance [
3]. In parallel, variations in thermal insulation thickness and the use of high-performance insulating materials represent a direct method not only for improving thermal performance but also for assessing the environmental sustainability of the external wall, in relation to the impacts associated with materials throughout their life cycle [
4].
Several European and national policies, such as the Energy Performance of Buildings Directive (EPBD IV) [
5], Energy Efficiency Directive (EED III) [
6], and the Italian Ministerial Decree of 28 October 2025 (D.M. 28/10/2025) [
7], assign a priority role to the building envelope’s performance by introducing requirements for thermal transmittance and energy efficiency. The EPBD IV further strengthens these objectives by introducing the concept of zero-emission buildings and by promoting large-scale renovation strategies to decarbonize the European building stock by 2050. In parallel, the EED III sets binding targets for reducing overall energy consumption at the EU level and reinforces the role of energy efficiency measures across multiple sectors, including buildings [
8]. Within this framework, the D.M. 28/10/2025 transposes the international requirements into the Italian regulatory context by defining calculation methodologies for energy performance, establishing minimum design and renovation requirements, and specifying compliance verification criteria, particularly for the building envelope [
9]. The decree also introduces procedures for comparing reference and design buildings and sets limits for periodic thermal transmittance and surface mass, recognized as key parameters for controlling summer thermal loads and the dynamic behavior of buildings [
10].
In parallel, other regulatory instruments, such as the European Construction Products Regulation (CPR) [
11] and the Minimum Environmental Criteria (CAM) [
12], introduce requirements related to material sustainability and environmental impacts throughout the life cycle. CPR is aligned with major European initiatives such as the Circular Economy Action Plan [
13], the European Green Deal [
14], and the Renovation Wave [
15], which promote life cycle thinking, resource efficiency, and waste reduction within the built environment [
16]. Through the CPR, sustainability-related requirements for construction products are progressively strengthened, supporting the integration of circular principles and the development of complementary national instruments such as Green Public Procurement [
17] and the Italian CAM, regulated by the Ministerial Decree of 24 November 2025 (D.M. 24/11/2025). Within this framework, the CAM for buildings introduces additional sustainability evaluation criteria. They are structured into thematic sections addressing different phases and components of the construction process and integrating environmental requirements into public procurement procedures [
18]. Attention is given to materials, where criteria aim to reduce life-cycle environmental impacts by requiring minimum thresholds for recycled and recovered content for different material categories (e.g., concrete, wood products, and insulation materials) [
19].
These regulatory frameworks require a rethinking of design criteria, material selection, and performance evaluation methods. Within this perspective, Green Building Rating Systems (GBRS), including Leadership in Energy and Environmental Design (LEED) [
20], are defined as international certification systems that evaluate the environmental performance of buildings throughout their entire life cycle. LEED is structured into thematic categories that address performance criteria related to thermal performance and material quality and impacts, thereby integrating energy and environmental aspects into an overall assessment of the building envelope [
21]. Within the Materials and Resources (MR) category, specific credits are dedicated to LCA-based evaluations, in which comparisons of alternative design solutions are required to demonstrate reductions in life-cycle environmental impacts [
22].
Within this framework, Building Information Modeling (BIM) is structured as a transformative methodology capable of supporting digital representation and life-cycle management of buildings [
23]. BIM is a data-driven process in which geometric information is integrated with numeric and semantic data describing materials, construction systems, performance characteristics, costs, and environmental indicators. Through BIM, performance and material-based information are generated, stored, and updated throughout the building life cycle, enabling more informed and consistent decision-making [
24]. To enhance design flexibility and performance-driven workflows, BIM is often integrated with parametric design software [
25], such as Visual Programming Languages (VPL). VPLs are rule-based scripting environments in which algorithms are created through graphical nodes. Tools such as Dynamo (VPL for Autodesk Revit) define relationships among design parameters, enabling the rapid generation and modification of design alternatives and the structured management of information, as data dependencies and parameters are automatically updated within the design workflow [
26]. Furthermore, BIM is increasingly connected with performance simulation tools, including energy or environmental calculators, and with LCA software, such as Tally and SimaPro. However, limited interoperability among software tools persists, resulting in time-consuming, manual processes prone to error [
27,
28].
The partial absence of interoperable, coordinated tools makes it difficult to compare design alternatives, as they require evaluating different combinations of thermal performance and material sustainability. In this context, the adoption of MCDM techniques is considered effective in managing the complexity of design alternative evaluation by structuring and integrating multiple performance criteria [
29]. MCDM methods are structured approaches that simultaneously consider multiple aggregate criteria to support rational and transparent decision-making. In building design and sustainability assessment, MCDM techniques are applied to integrate heterogeneous performance indicators into a coherent evaluation framework, including energy efficiency, life-cycle–based environmental impacts, economic performance, indoor environmental quality (e.g., thermal and acoustic comfort), and compliance with regulatory and sustainability requirements [
30]. Commonly used MCDM methods include the Analytic Hierarchy Process (AHP), Technique for Order Preference by Similarity to Ideal Solution (TOPSIS), and ELECTRE, which differ in weighting strategies, aggregation procedures, and decision making [
31].
From the literature analysis, technological and methodological gaps emerge despite the potential of BIM-MCDM integration (see
Section 2). The first gap concerns the limited multidimensionality of sustainability indicators. Current approaches are focused on a single performance criterion, often limited to energy or economic considerations, while other relevant dimensions, such as thermal and acoustic comfort, regulatory compliance, and life-cycle–based environmental sustainability, are overlooked. An additional limitation concerns the availability, reliability, and consistency of input data used in BIM-based decision-support workflows. The use of heterogeneous sources such as external databases, regulatory documents, or manually compiled spreadsheets may introduce inconsistencies and potential errors, and is closely related to the second and third research gaps. In fact, the second gap is associated with the dependence on information flows external to BIM. In several workflows, performance values are derived from external simulation software or databases that are not fully integrated into BIM environments. This condition results in data continuity and consistency throughout the workflow, thereby increasing operational complexity and the risk of errors. The third gap concerns the lack of fully integrated BIM multi-criteria analysis workflows. Although multi-criteria methods are widely adopted to support decision-making, such analyses are often decoupled from BIM, relying on external tools or manual comparisons of design alternatives, thereby reducing the effectiveness of the decision-support process.
To address these gaps, this study develops an integrated digital workflow within the BIM environment to support the evaluation of alternative building-envelope configurations in the early design stages. The proposed workflow enables management of the entire evaluation process, from initial parametric design choices to decision support, while avoiding post-processing analyses on static models. Rather than introducing new individual assessment methods, this research’s contribution lies in the structured integration of existing regulatory checks, environmental indicators, and multi-criteria decision-making within a single interoperable and automated BIM-based environment. The framework integrates thermal performance simulations, conducted through compliance verification with D.M. 28/10/2025, and environmental sustainability assessment of the building envelope, conducted through CAM verification, LEED certification criteria, and LCA. The framework is based on the digital integration of Autodesk Revit with VPL tools, such as Dynamo, and dedicated plug-ins, such as Tally. The extracted criteria are divided into three thematic clusters: (a) environmental, including indicators derived from LCA, LEED, and CAM, (b) thermophysical performance, and (c) cost. The optimal alternative is evaluated using the AHP, fully implemented in Dynamo, within the proposed workflow.
The proposed methodology is tested through a case study involving a platform-frame vertical enclosure, in which three insulation materials, rock wool, EPS, and aerogel, are alternatively adopted. The results are discussed to highlight the benefits, trade-offs, and design implications associated with the different material combinations.
The present study is structured as follows.
Section 2 provides an analysis of previous studies on BIM-MCDM workflows for evaluating alternatives in building envelope components.
Section 3 describes the methodological procedure and the operational phases of the study. In detail, automated parametric methods used for the development of the BIM model and the selection of indicators are presented, the structuring of Dynamo scripts for the calculation and verification of indicators is illustrated, and the parametric implementation of the AHP method is described.
Section 4 reports the results obtained from applying the methodology, and the best-performing solution is identified. In
Section 5, the study is positioned within the broader scientific research landscape, and limitations and future research directions are outlined. Finally,
Section 6 presents the conclusions, highlighting the main outcomes of the research.
2. Previous Studies
Despite the increasing adoption of BIM-based workflows and multi-criteria techniques, several limitations remain across the analyzed studies
The first research gap emerges in the selection of sustainability indicators. In fact, some frameworks are developed with analyses limited to a single criterion, neglecting other relevant dimensions such as comfort, regulatory requirements, and environmental sustainability. For example, Balo et al. [
32] used BIM and energy simulation tools to evaluate, according to energy-related criteria, material alternatives and construction solutions in a nursing home, integrating a hybrid MCDM model. Specifically, four wall typologies are modeled, each using four natural stone construction materials and three insulation materials: straw, cellulose fiber, and hemp fiber. Annual heating and cooling loads and yearly energy consumption are evaluated through Green Building Studio (GBS). Finally, a hybrid MCDM method is proposed, developed entirely manually. Similarly, Zhang et al. [
33] proposed a BIM-based framework integrated with Multi-Criteria Group Decision-Making (MCGDM) techniques to optimize the selection of external wall retrofit strategies. This selection is based on technical indicators for thermal insulation, technical feasibility, durability, and economic efficiency, with environmental performance indicators not included in the workflow. Different thermal insulation alternatives, XPS, EPS, PU, and rock wool, are initially modeled in BIM, and the thermal transmittance coefficient is calculated for each solution through model parameters. In the final phase, the fuzzy VIKOR method is applied to rank retrofit alternatives and select the optimal solution. Zigmund et al. [
34] implemented an integrated BIM-MCDM approach to compare suspended masonry façade alternatives. Specifically, in an initial phase, evaluation criteria for the production stage are defined in terms of cost savings. Subsequently, a BIM construction model is developed from which three alternatives of suspended masonry elements are generated. These alternatives are compared and ranked through a manual multi-criteria evaluation using the WASPAS method.
The previous studies could also be presented in descending order by the level of automation of the decision-making process, highlighting the progressive limitations in indicator selection, information integration, and workflow interoperability. From this perspective, an additional limitation arises regarding the availability, reliability, and consistency of the input data used in BIM-based decision-support workflows. As these approaches are inherently data-driven, the quality and completeness of input information directly affect the robustness of the evaluation results. This issue is closely related to the second and third research gaps.
In several frameworks, performance data are not fully embedded within the BIM environment and are often derived from heterogeneous sources, such as external databases, regulatory documents, or manually compiled spreadsheets, which may introduce inconsistencies and potential sources of error in the evaluation process. In this context, the second gap concerns reliance on external information flows for calculating the indicator values under consideration. In some workflows, performance values are derived from external simulation software that is not fully integrated into BIM authoring environments, leading to information continuity loss and increased operational complexity. For example, Cascone et al. [
35] developed a BIM-based workflow integrated with MCDM to compare and optimize external wall stratigraphies. The authors present a framework that incorporates the external software ECHO (Software version: v8.3) to estimate acoustic performance and information manually derived from EPDs to estimate GWP and embodied energy. Finally, MCDM techniques are implemented in Excel (Software version: Office 365), specifically the Weighted Sum Model (WSM), to support the decision-making process. Similarly, Marzouk et al. [
36] proposed a BIM-based framework integrated with energy simulations and MCDM, specifically AHP and TOPSIS techniques, to evaluate and optimize energy retrofit strategies in religious buildings. In the first phase, the building’s BIM model is developed. The gbXML file is imported into Integrated Environmental Solutions–Virtual Environment (IESVE) (Software version: v2020) to evaluate the overall building performance. Based on the simulation results, MCDM techniques (AHP and TOPSIS) are applied. Jalilzadehazhari et al. [
37] developed an integrated decision-support approach that combines BIM, Design of Experiments (DoE) as an optimization algorithm, and AHP as an MCDM technique. Initially, a BIM model is generated, subsequently saved and exported to gbXML, and then converted into an IDF file using the DesignBuilder simulation software. The IDF file is then completed in EnergyPlus (Software version: v. 8.5.0). The final step concerns executing the optimization process. To this end, a DOS batch file is used to automatically run EnergyPlus (Software version: v. 8.5.0) simulations within modeFRONTIER. Once the optimization process is complete, the AHP is applied to identify a compromise solution among the 375 alternatives analyzed. Han et al. [
38] proposed a BIM-based system integrated with MCDA to support sustainable decision-making in demolition waste management (DWM). Specifically, the framework, implemented at a prototypical stage using the Revit API and C#, enables the parametric extraction of data from manually populated BIM models, the definition of alternative DWM schemes, and their comparative evaluation using sustainability indicators. The results are interpreted using MCDA functions integrated into the decision-support module, which calculate the sustainability scores of DWM schemes directly on the BIM-based platform using the TOPSIS method. However, the framework does not include integrated LCA databases, and environmental profiles are not calculated but are derived from the literature.
Integration with external databases falls within the second gap, as it is not native and bidirectional, requiring manual mapping between BIM objects and external data. For example, Fazeli et al. [
39] developed a decision-support tool that integrates BIM with MCDM techniques to optimize the selection of sustainable building components in the early design stages. An external database of sustainable materials and evaluation parameters is defined. Design alternatives are modeled in Autodesk Revit, quantities extracted to Excel, and criteria manually selected. Model data are then transferred to MATLAB to execute the Fuzzy TOPSIS algorithm, with results returned to Revit to support cost-effective LEED-EB refurbishment. Similarly, Jalaei et al. [
40] developed a decision-support methodology that integrates BIM and MCDM to optimize the selection of sustainable building components based on three macro sustainability criteria: environmental and economic factors, and social well-being. A green materials database is developed, including material data, suppliers, and potential LEED credits. Energy consumption is calculated using GBS through gbXML export from Revit, while LCC analysis uses RS Means databases. A Decision Support System integrated as a Revit plug-in executes the TOPSIS procedure within the BIM environment.
However, a third gap concerns the absence of fully integrated BIM multi-criteria analysis workflows, as existing approaches lack interoperable processes that link the BIM environment to multi-criteria analyses, thereby reducing overall process effectiveness. For example, Tan et al. [
41] proposed a BIM-based framework integrated with an MCDM technique to evaluate the weights of all parameters contributing to the definition of Design for Manufacture and Assembly (DfMA). Specifically, parameter weighting is performed in BIM using Revit schedules and quantity takeoff functions. Although the MCDM approach is used to define and weight the parameters, it is not extended to the comparative evaluation and ranking phase of the design alternatives, which remains dependent on manual comparison of results. Similarly, Saud et al. [
42] developed a BIM-based method to evaluate and compare eight external wall assemblies using nine criteria, with the weights of which were estimated and validated through a questionnaire. The nine considered criteria are weighted using a combination of the Functional Analysis System Technique (FAST) and the AHP methods to reflect the project objectives and the application context. BIM primarily serves as an information repository and a visualization environment. At the same time, Dynamo automates data extraction and calculations; however, the MCDM logic remains external to the BIM environment, resulting in a workflow that is only partially integrated. Finally, Mohanta et al. [
43] address the performance gap in green buildings by developing a multicriteria decision support system based on the Best–Worst Method (BWM). The framework integrates ECBC regulatory requirements, BIM-based energy simulations, and the prediction of maintainability performance already in the early design stages of the building envelope. However, the BWM method is implemented manually within MS Excel. This results in a loss of automation, increased error risk, and a time-consuming process.
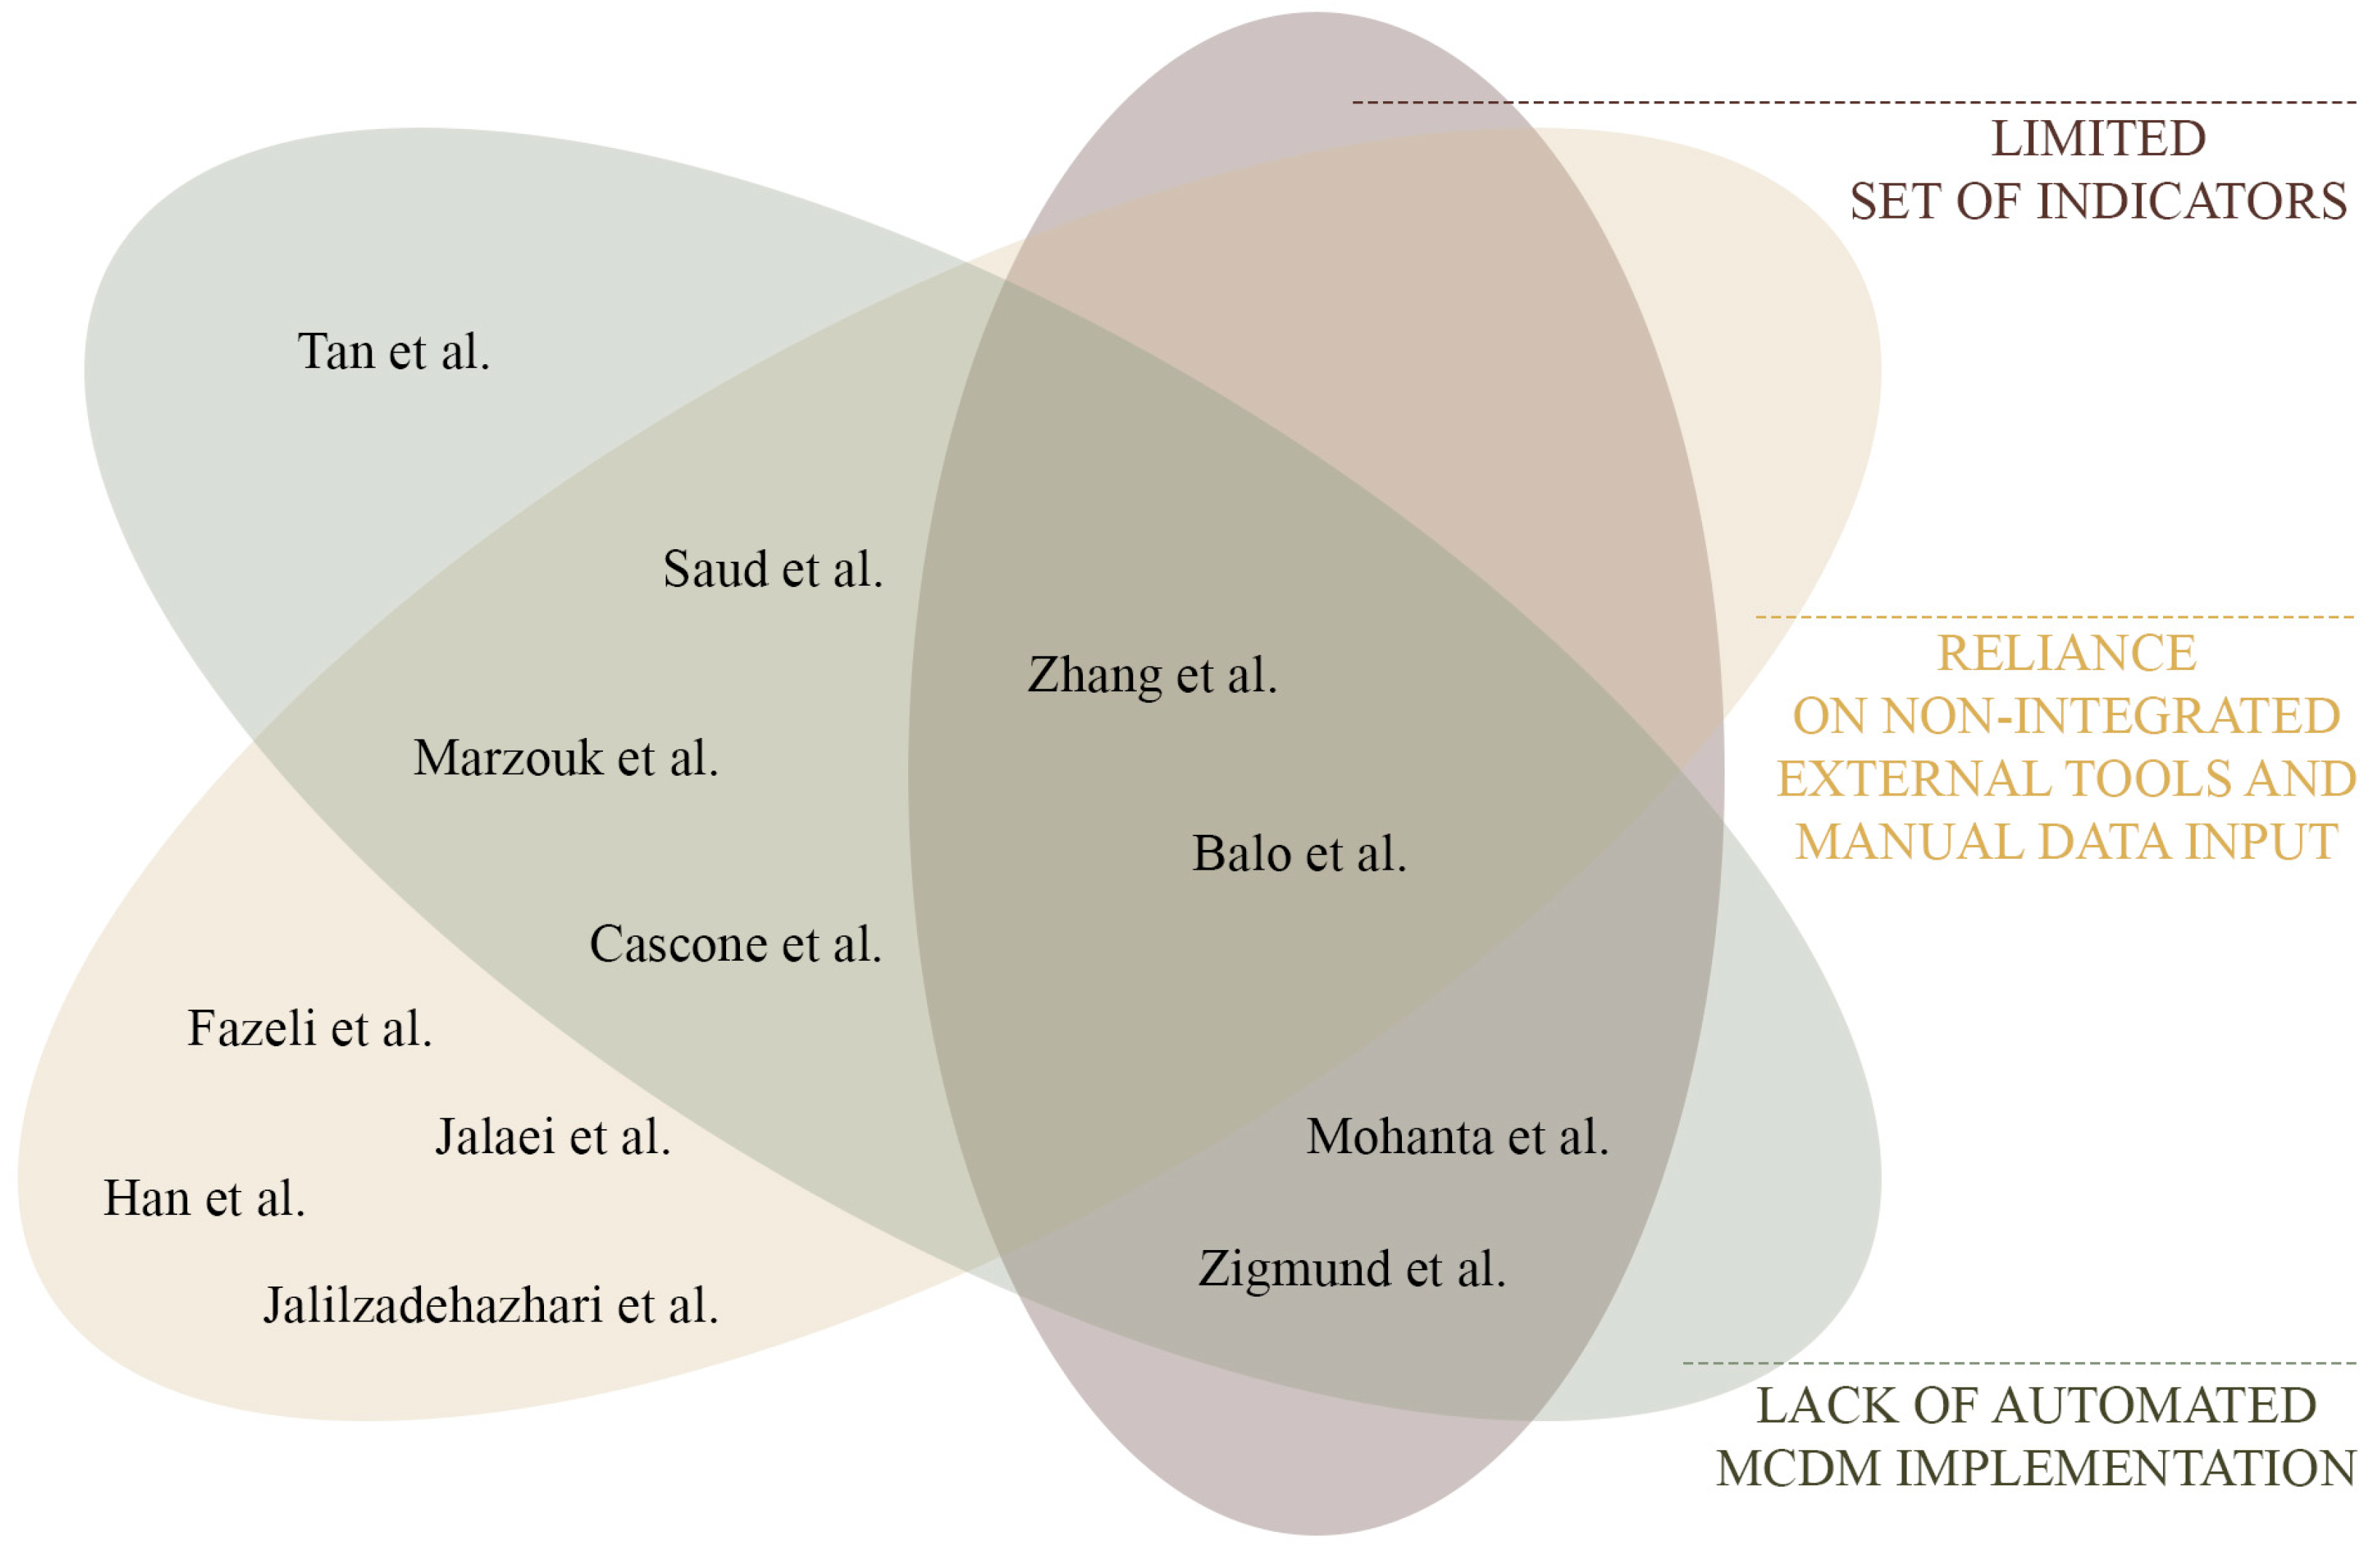
Overall, as highlighted in
Figure 1, the reviewed literature is affected by limitations that constrain the maturity of BIM-based decision-support workflows for building envelope design. The selection of evaluation criteria is characterized by limited multidimensionality. MCDM is often operationalized through a restricted subset of indicators, i.e., energy-based and cost-oriented, while other decision-relevant dimensions, such as thermal and acoustic comfort, compliance with regulatory thresholds, and life cycle–based environmental impacts, are not systematically included. Consequently, the trade-offs are only partially represented, and the ranking of alternatives is driven by an unbalanced indicator set rather than by a comprehensive performance profile. Moreover, a strong dependence on information flows external to the BIM environment is observed. Performance values are commonly generated by separate simulation tools or standalone databases and subsequently transferred to the BIM model via export–import procedures or manual mapping. In this configuration, data traceability and reproducibility are lost, as boundary conditions and data provenance are not consistently preserved within a unified information structure. Also, BIM is used primarily as a data repository, whereas MCDM is executed externally or manually. Consequently, automation is limited, and real-time feedback during iterative design exploration is not enabled. As a result, multi-criteria analysis is often applied as a post-processing step to static design alternatives rather than as an embedded decision-support mechanism to guide parametric refinement.
Taken together, these gaps indicate that previous BIM-MCDM integrations are still characterized by fragmented indicator frameworks, discontinuous data flows, and externally implemented decision-support mechanisms. Therefore, this study proposes end-to-end BIM-integrated workflows that manage multidimensional criteria through consistent data flows and in-model multi-criteria logic.
3. Materials and Methods
In this section, the BIM-MCDM integration workflow developed for the comparative analysis of thermal insulation alternatives in a platform-frame wall is examined.
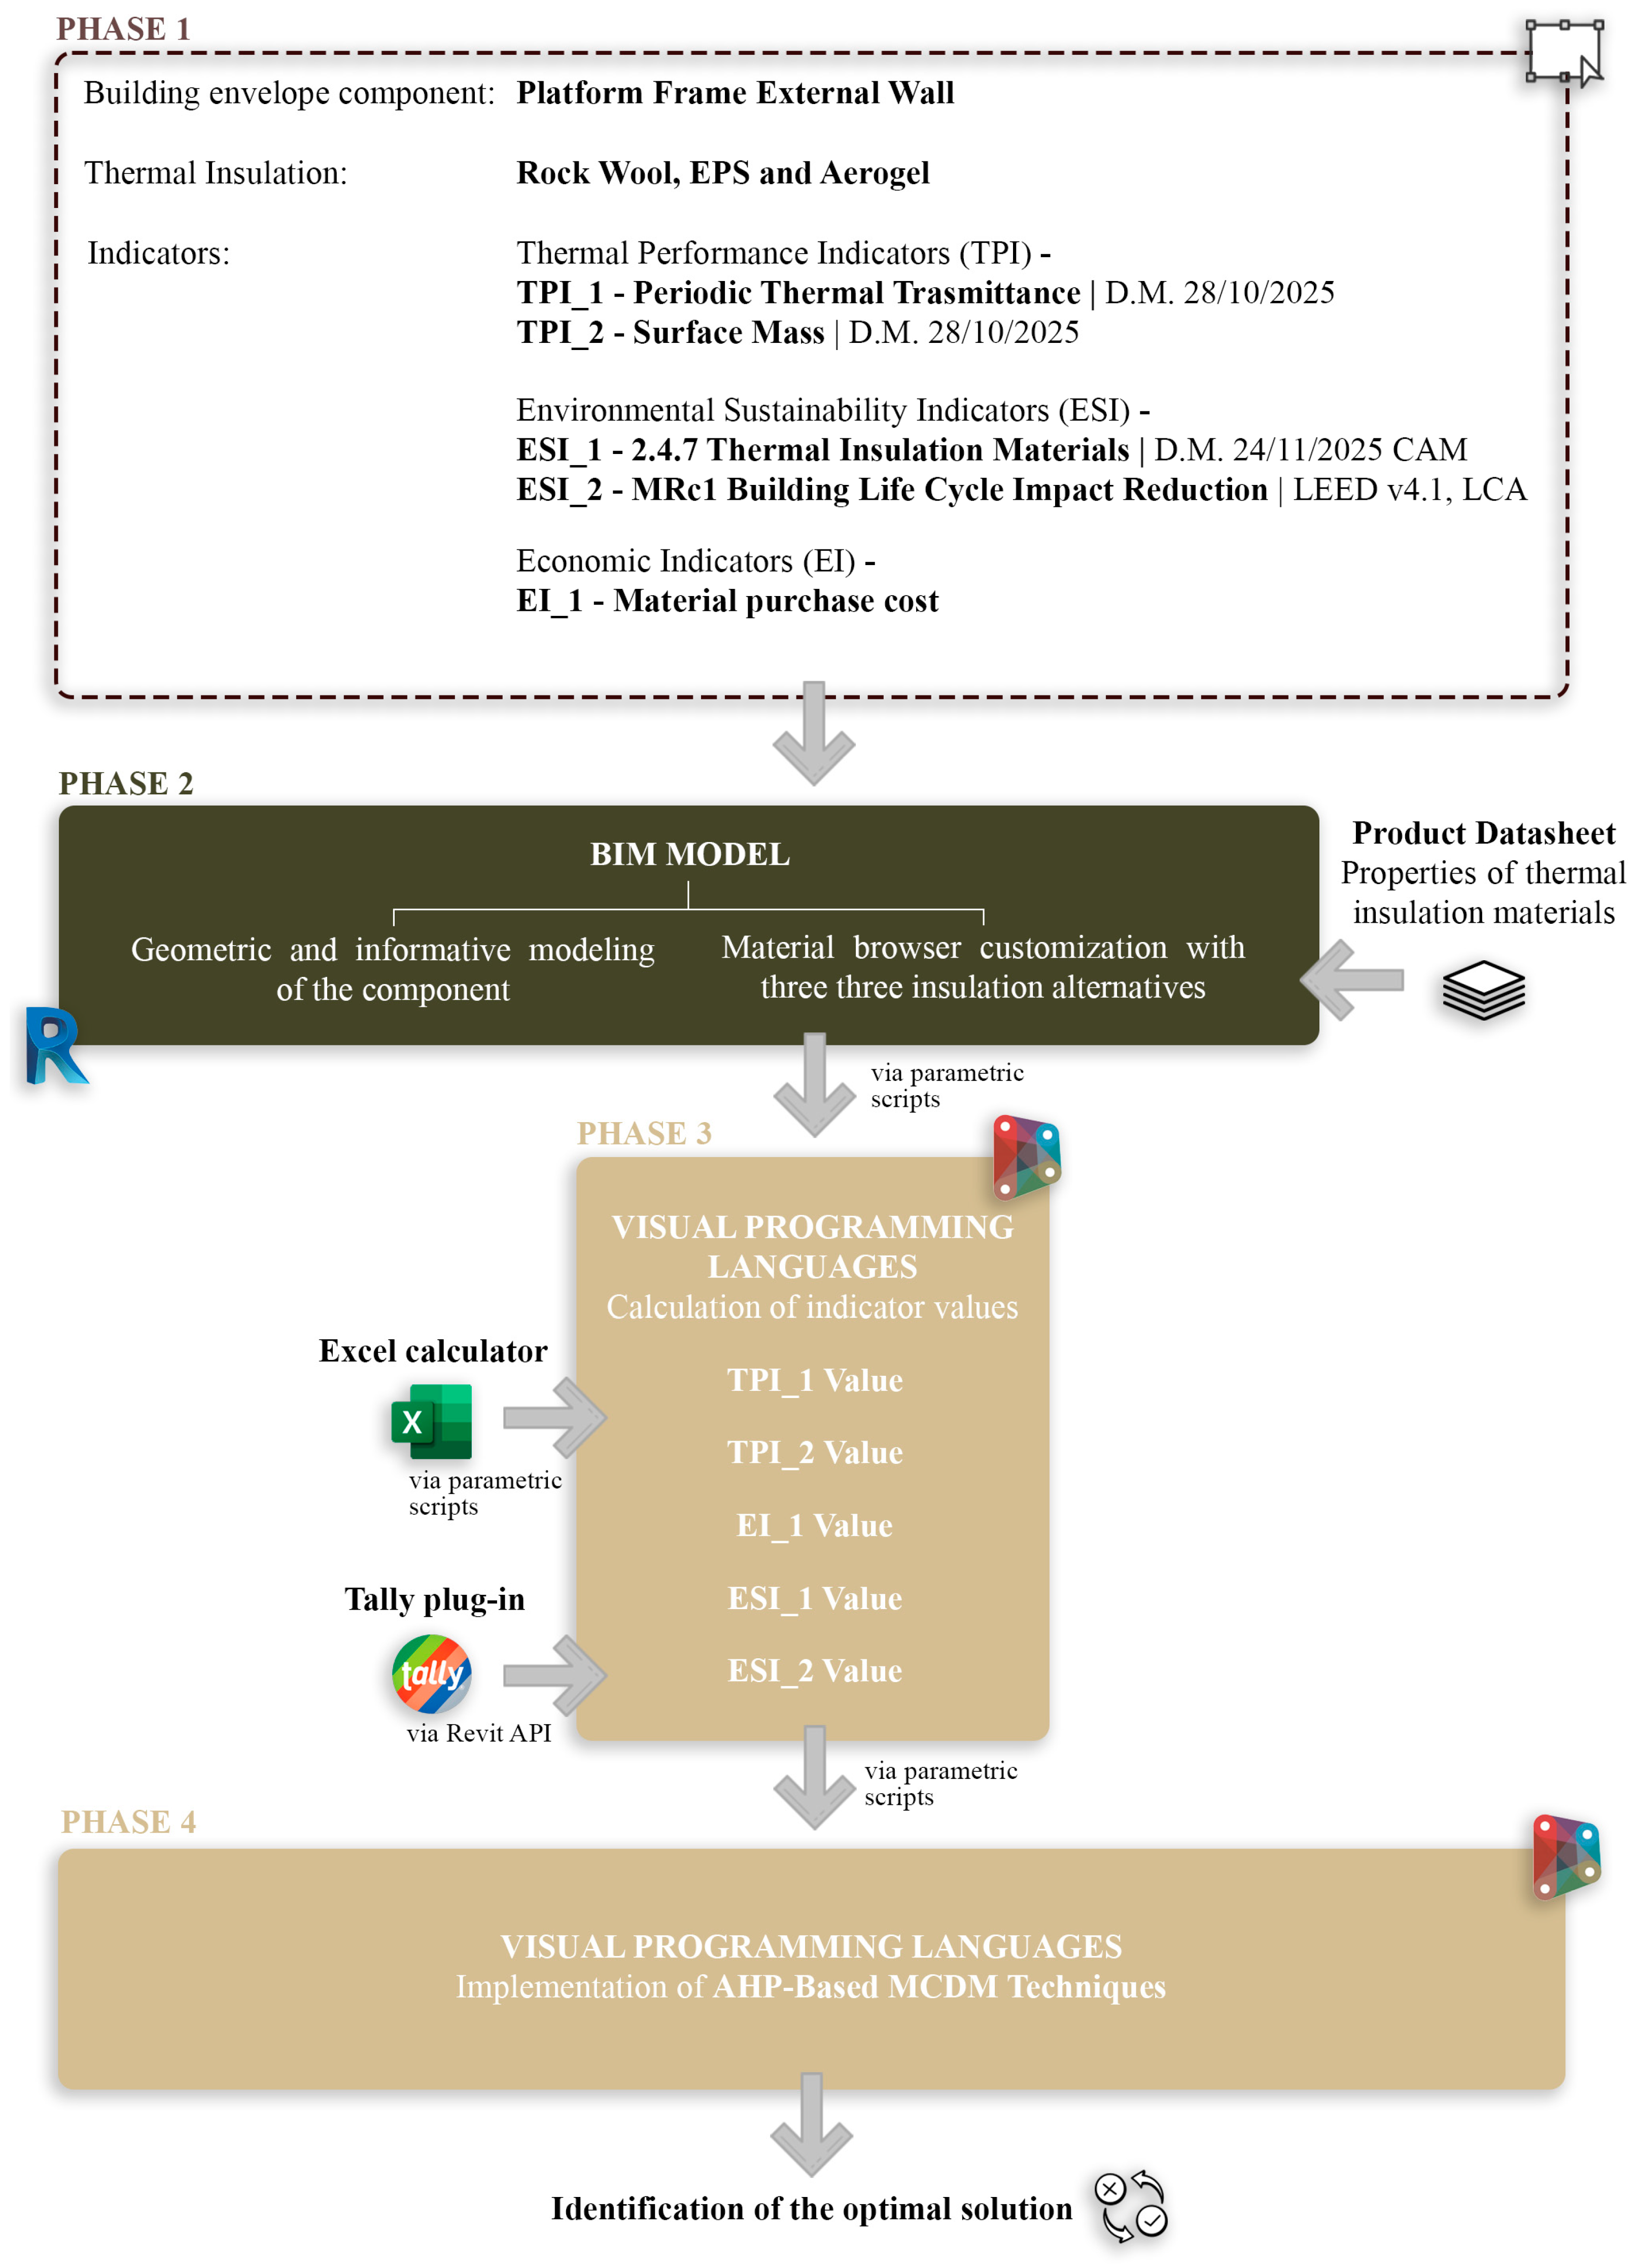
Figure 2 highlights the phases of the BIM-based workflow for selecting the optimal solution.
In Phase 1, the external wall stratigraphy, the thermal insulation alternatives, and the performance indicators are defined (see
Section 3.1). This definition enables, in Phase 2, the geometric and information modeling of the external wall within BIM, using Autodesk Revit (Software version: v.2025.3), as well as the customization of the material database by including the previously defined thermal insulation alternatives, whose parameters are derived from product technical datasheets (see
Section 3.2). This approach enables parametric variation in thermal insulation alternatives within the external wall stratigraphy, yielding three distinct stratigraphic configurations. In Phase 3, for each configuration, the performance indicator values are calculated by integrating BIM and VPL. Using Dynamo (Software version: v2.19.4), parametric scripts automate data extraction from the BIM model, indicator calculation, compliance verification against regulatory requirements, and the transfer of results back to the BIM (see
Section 3.3). In addition, for indicator calculation, the BIM-VPL workflow is directly integrated with third-party software, such as Microsoft Excel (Software version: Office 365) and Tally v2025.2, and with an Autodesk Revit plug-in, as described in
Section 3.3.1,
Section 3.3.2 and
Section 3.3.3. In Phase 4, the indicator values obtained for each stratigraphic configuration are weighted, and an MCDM analysis is performed using the AHP method fully implemented in Dynamo (see
Section 3.4).
In this study, the parametric core of the proposed approach enables scalable, adaptable workflows, thereby facilitating the integration of additional performance indicators and the assessment of other components of the building envelope.
3.1. Phase 1—Identification of Building Envelope Components and Indicator Selection
Light timber-framed construction, including platform-frame systems, is increasingly gaining attention in the building sector due to its sustainability potential [
44], ease of construction, and the possibility of using locally available materials, supporting more resource-efficient and environmentally sustainable construction practices [
45]. Such flexibility within the developed framework yields a range of applicable insulation solutions with respect to thermal performance and environmental and economic impacts.
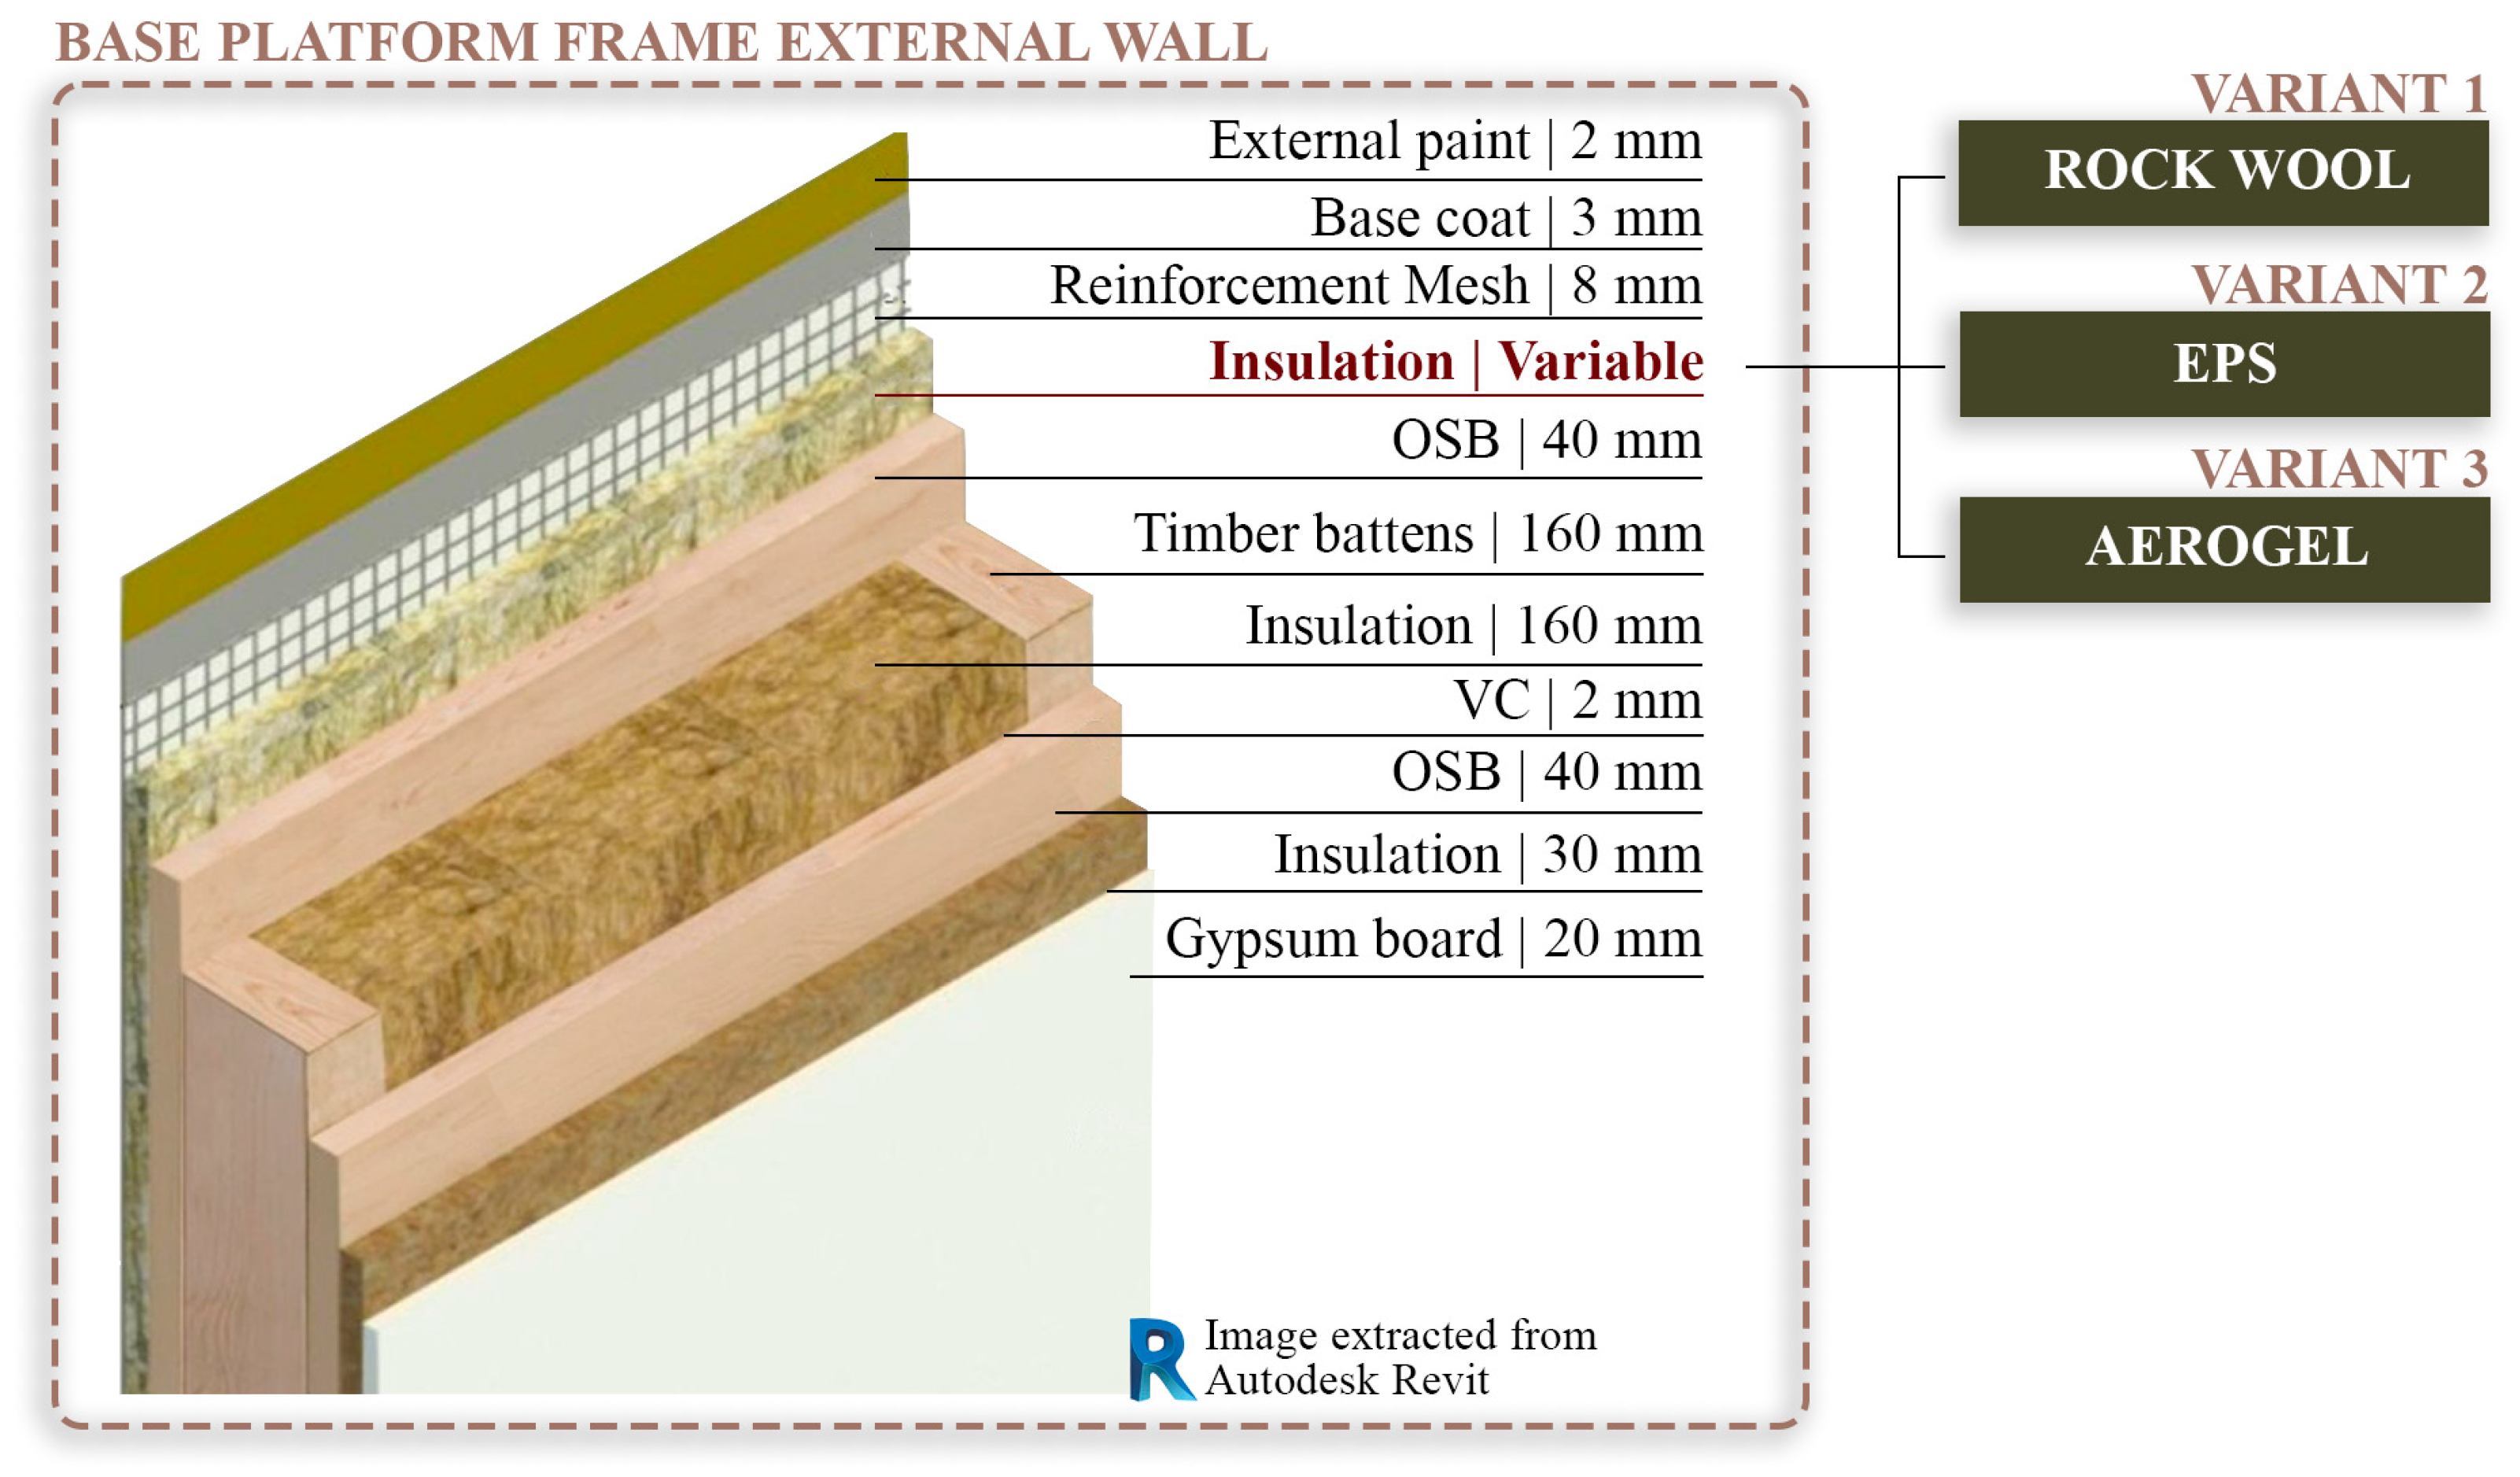
Figure 3 highlights the reference platform-frame wall stratigraphy, with alternative thermal insulation materials implemented.
Specifically, the thermal insulation materials considered are Rock Wool, EPS, and Aerogel. These typologies are alternated within the reference stratigraphy. These thermal insulation materials are selected because they represent three types with different physical, performance-related, and environmental characteristics. Rock Wool is a traditional and widely used insulation material, characterized by good thermal and acoustic performance and high fire resistance. EPS represents a consolidated and widespread solution due to its favorable cost-to-performance ratio. Aerogel, finally, is a high-performance material characterized by low thermal conductivity, but by costs and environmental impacts that differ from those of conventional insulation materials.
Table 1 summarizes the key thermal properties of the insulation materials that are obtained from the manufacturers’ technical datasheets and correspond to the declared thermophysical properties for each insulation material (Rock Wool [
46], EPS [
47], and Aerogel [
48]).
In parallel, in Phase 1, the indicators for evaluating each wall solution are selected. These indicators are divided into three thematic clusters, as reported in
Figure 2: Thermal Performance Indicators (TPI), Environmental Sustainability Indicators (ESI), and Economic Indicators (EI).
The TPIs include the compliance verification of the periodic thermal transmittance (TPI_1) and surface mass (TPI_2) indicators. The verification of these indicators follows the regulatory provisions set out in D.M. 28/10/2025 [
7], which define the minimum performance requirements for the building envelope to ensure adequate thermal comfort. Periodic thermal transmittance is used to assess the wall’s dynamic behavior under summer thermal loads and is calculated in accordance with the UNI EN ISO 13786 [
49] as required by D.M. 28/10/2025:
where
is the periodic thermal transmittance [W/(m
2·K)],
is the amplitude of the internal heat flux density [W/m
2] and
is the amplitude of the external air temperature variation [K].
Also, surface mass is used to estimate the opaque element’s capacity to store heat and contribute to the building’s thermal stability and, in compliance with D.M. 28/10/2025, is calculated according to the UNI EN ISO 13786 standard:
where
is the surface mass [kg/m
2],
is the density of layer
i [kg/m
3] and
is the thickness of layer
i [m].
The ESIs include compliance verification of the criterion reported in Chapter 2.5.7, Thermal Insulation Materials (ESI_1), of the CAM regulation, and of MRc1, Building Life Cycle Impact Reduction, of the LEED green certification protocol (ESI_2). These criteria aim to reduce the environmental impacts of construction materials throughout their life cycle, with a focus on materials that consume fewer resources and emit lower emissions. ESI_1 specifies conditions for thermal insulation materials regarding composition, recycled content, limitations on hazardous substances, and reductions in environmental impacts associated with the production phase. ESI_2 aims to reduce the building’s environmental impacts through an LCA-driven approach. This indicator quantifies and compares the environmental impacts of different insulation alternatives across selected impact categories, supporting a sustainability-oriented comparative evaluation.
The EI includes the evaluation of the Material Purchase Cost (EI_1) indicator, a key parameter for assessing the economic feasibility of the thermal insulation solutions under consideration. This indicator quantifies the procurement cost of insulation materials and enables comparison of alternatives in terms of initial financial impact.
The integration of these verifications into the BIM-MCDM workflow automates regulatory compliance checks and includes these indicators as binding criteria in the subsequent multi-criteria evaluation phase.
3.2. Phase 2—BIM Modeling and Material Database Customization
In the second phase, BIM modeling of the platform-frame stratigraphy is carried out, along with customization of the native material database by implementing three thermal insulation alternatives. The software selected for modeling is Autodesk Revit v2025.3 [
50].
The model is developed with a level of detail (LOD) suitable to ensure the correct geometric and informative representation of the layers constituting the external wall, guaranteeing consistency among geometric parameters, material properties, and performance-related data. Moreover, attention is given to structuring the model’s information parameters to enable automated extraction of the data required for indicator calculation and regulatory compliance verification in the subsequent phases of the workflow.
The BIM model is structured as an information base for integration with VPL and MCDM. Revit material database is customized by adding three insulation materials: Rock wool, EPS, and Aerogel.
Table 2 provides a structured overview of the implemented parameters, highlighting their assignment level, data source, parameter type, and role in the analysis. Implementing these informational parameters within the BIM model is necessary to ensure the reliability of analyses performed in Dynamo for indicator calculation.
The parameters are first grouped by the associated indicators: Thermal Performance Indicators (TPI), Economic Indicators (EI), and Environmental Sustainability Indicators (ESI). Thermal performance indicators (TPI_1 and TPI_2) are based on material-level thermophysical properties, including thermal conductivity, density, specific heat capacity, and thickness. These parameters are primarily derived from product technical datasheets and are defined as material properties within the BIM environment, with thickness parametrically varied in Dynamo and Excel. Based on these inputs, compliance with D.M. 28/10/2025 is evaluated at the wall level and returned as an output parameter.
Environmental sustainability indicators are structured into two main groups. ESI_1 addresses compliance with the CAM requirements for thermal insulation materials and is based on a set of material-level qualitative and quantitative parameters, such as the absence of substances of very high concern (SVHC), the presence of CE marking and Declaration of Performance (DoP), compliance with safety specifications, restrictions on blowing agents and catalysts, absence of ozone-depleting substances and the percentage of recycled and recovered material content. These parameters are sourced from product datasheets and used as inputs to a parametric compliance check implemented in Dynamo, which returns CAM compliance output. ESI_2 focuses on life-cycle–based environmental performance and supports compliance verification for the LEED MRc1 credit. In this case, impact indicators, such as eutrophication potential, acidification potential, global warming potential, non-renewable energy use, and ozone depletion potential, are calculated at the wall level by integrating BIM with Tally and Dynamo. These numerical inputs are then processed to assess LEED compliance, which is an output parameter in the BIM environment.
Economic performance is addressed through EI_1, which corresponds to the purchase cost per square meter of the insulation material. This parameter is introduced as an added material-level attribute and is directly obtained from manufacturers’ datasheets.
3.3. Phase 3—Calculation of Indicator Values
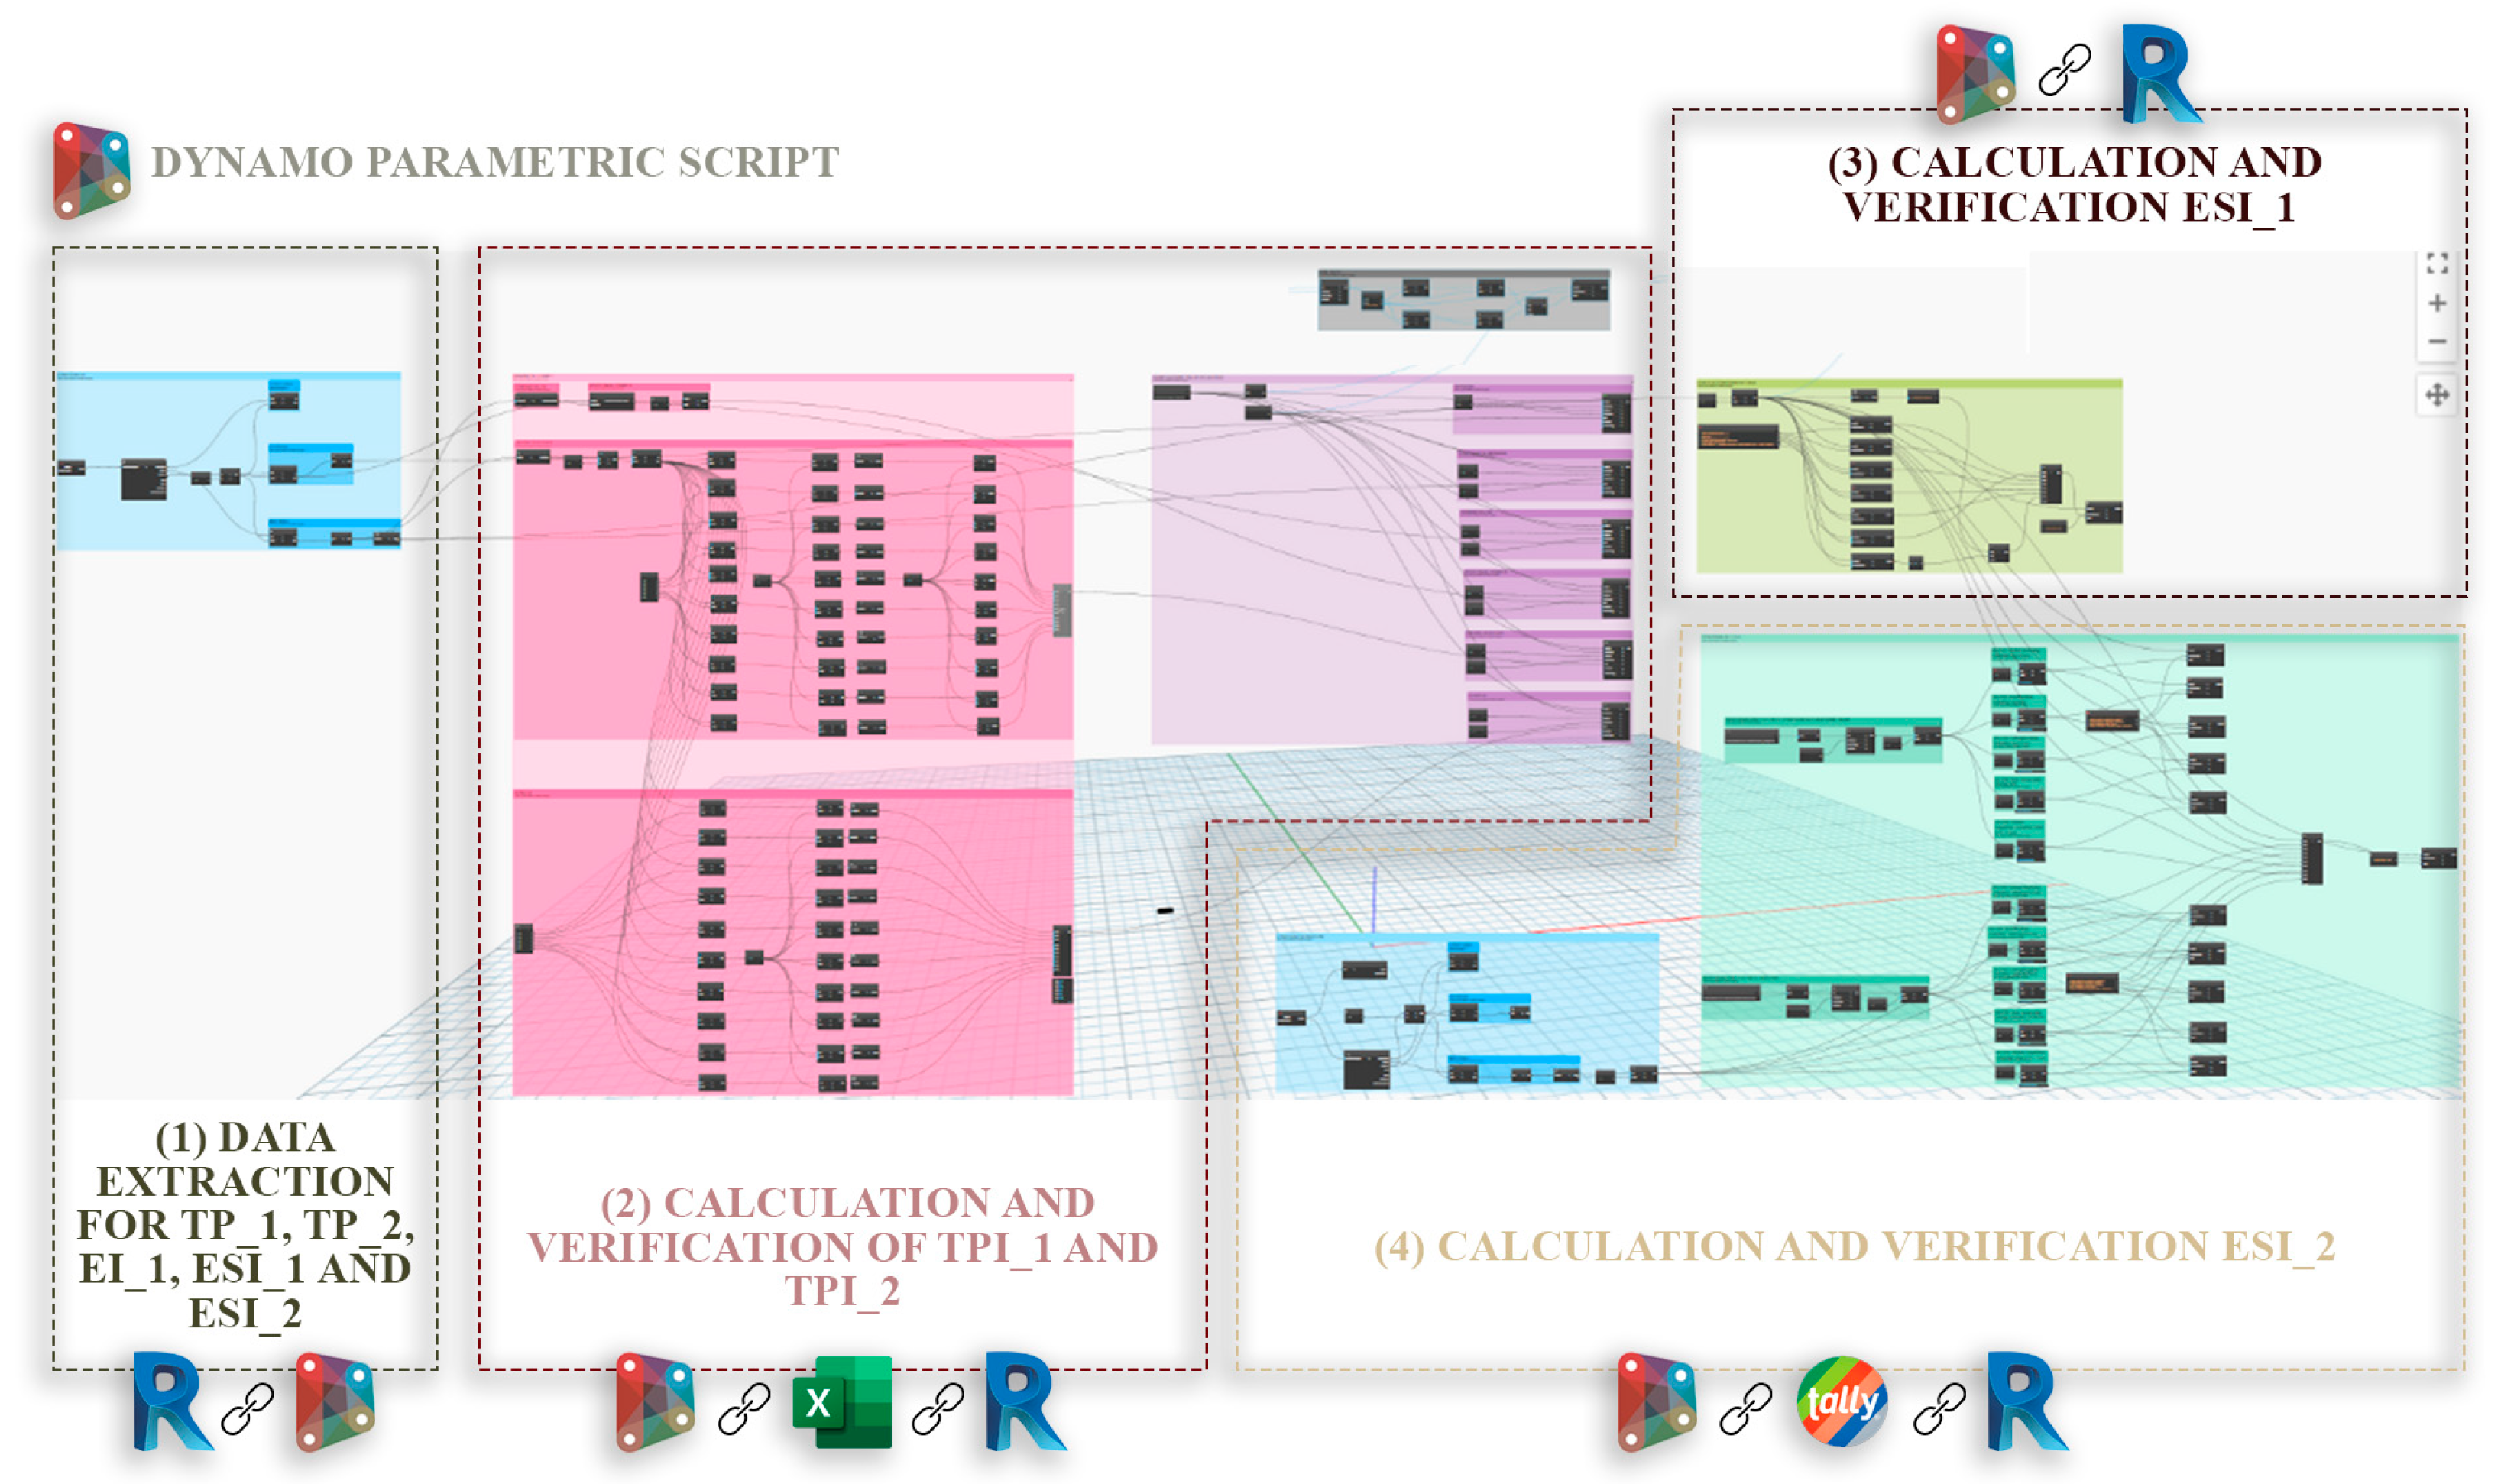
The external wall stratigraphy modeled in Autodesk Revit is linked in Phase 3 to a parametric script that automatically computes thermal, environmental, and economic performance indicators previously selected in Phase 1. The script is developed in Dynamo v2.19.4 [
51] and is divided into four reference macro-areas, each dedicated to automating parameter extraction from Autodesk Revit and to calculating and verifying a specific set of indicators (
Figure 4). In this section, no reference is made to the EI_1 indicator, as its value is directly obtained from the manufacturers’ technical datasheets (see
Table 2) and is not calculated through a parametric workflow.
The first macro-area focuses on developing a parametric script that automatically extracts the input parameters reported in
Table 2 from Autodesk Revit. This information flows between BIM and Dynamo, allowing a direct link between the information model and subsequent calculation and verification phases, reducing the risk of errors from manual data entry and ensuring data consistency and automatic updates as wall stratigraphy configurations change. The second macro-area addresses the automation of thermal performance assessment, in compliance with the requirements of D.M. 28/10/2025. This verification concerns indicators TPI_1 and TPI_2 and is carried out through an information flow obtained by integrating Autodesk Revit, Dynamo, and an Excel calculator. The third macro-area concerns the calculation and verification of the environmental indicator ESI_1, in compliance with the criteria set out in Chapter 2.5.7 Thermal Insulation of the CAM standard. Finally, the last macro-area concerns the calculation and verification of the environmental indicator ESI_2, in accordance with the requirements established by the MRc1 Building Life Cycle Impact Reduction criterion of LEED v4 BD+C: NC.
The output parameters are subsequently reimported into the BIM model, allowing immediate reading of the compliance status directly within the design environment. The proposed study, therefore, establishes a bidirectional workflow between Dynamo and Autodesk Revit, enabling the comparative analysis of design solutions in less time while remaining within BIM.
3.3.1. Calculation of TPI_1 and TPI_2 Indicators
The calculation of the TPI_1 Periodic Thermal Transmittance and TPI_2 Surface Mass indicators is performed through a structured information workflow involving Dynamo, an Excel-based calculator, and Autodesk Revit. This process ensures compliance with the Italian national regulation D.M. 28/10/2025 [
7] and aligns with the broader framework established by the European Energy Performance of Buildings Directive (EPBD IV) [
52]. The proposed parametric methodology can also be adapted to other regulatory standards, including EN ISO 6946 for U-value calculation [
53], EN 13829 for airtightness assessment [
54], and ASHRAE 90.1 for minimum envelope performance in North America [
55]. The parametric workflow’s flexibility enables dynamic replacement of these criteria based on specific project requirements and the relevant regulatory framework.
For this study, the defined performance thresholds concern the periodic thermal transmittance (TPI_1), which must not exceed 0.10 W/m
2K, and the surface mass (TPI_2), which must be at least 230 kg/m
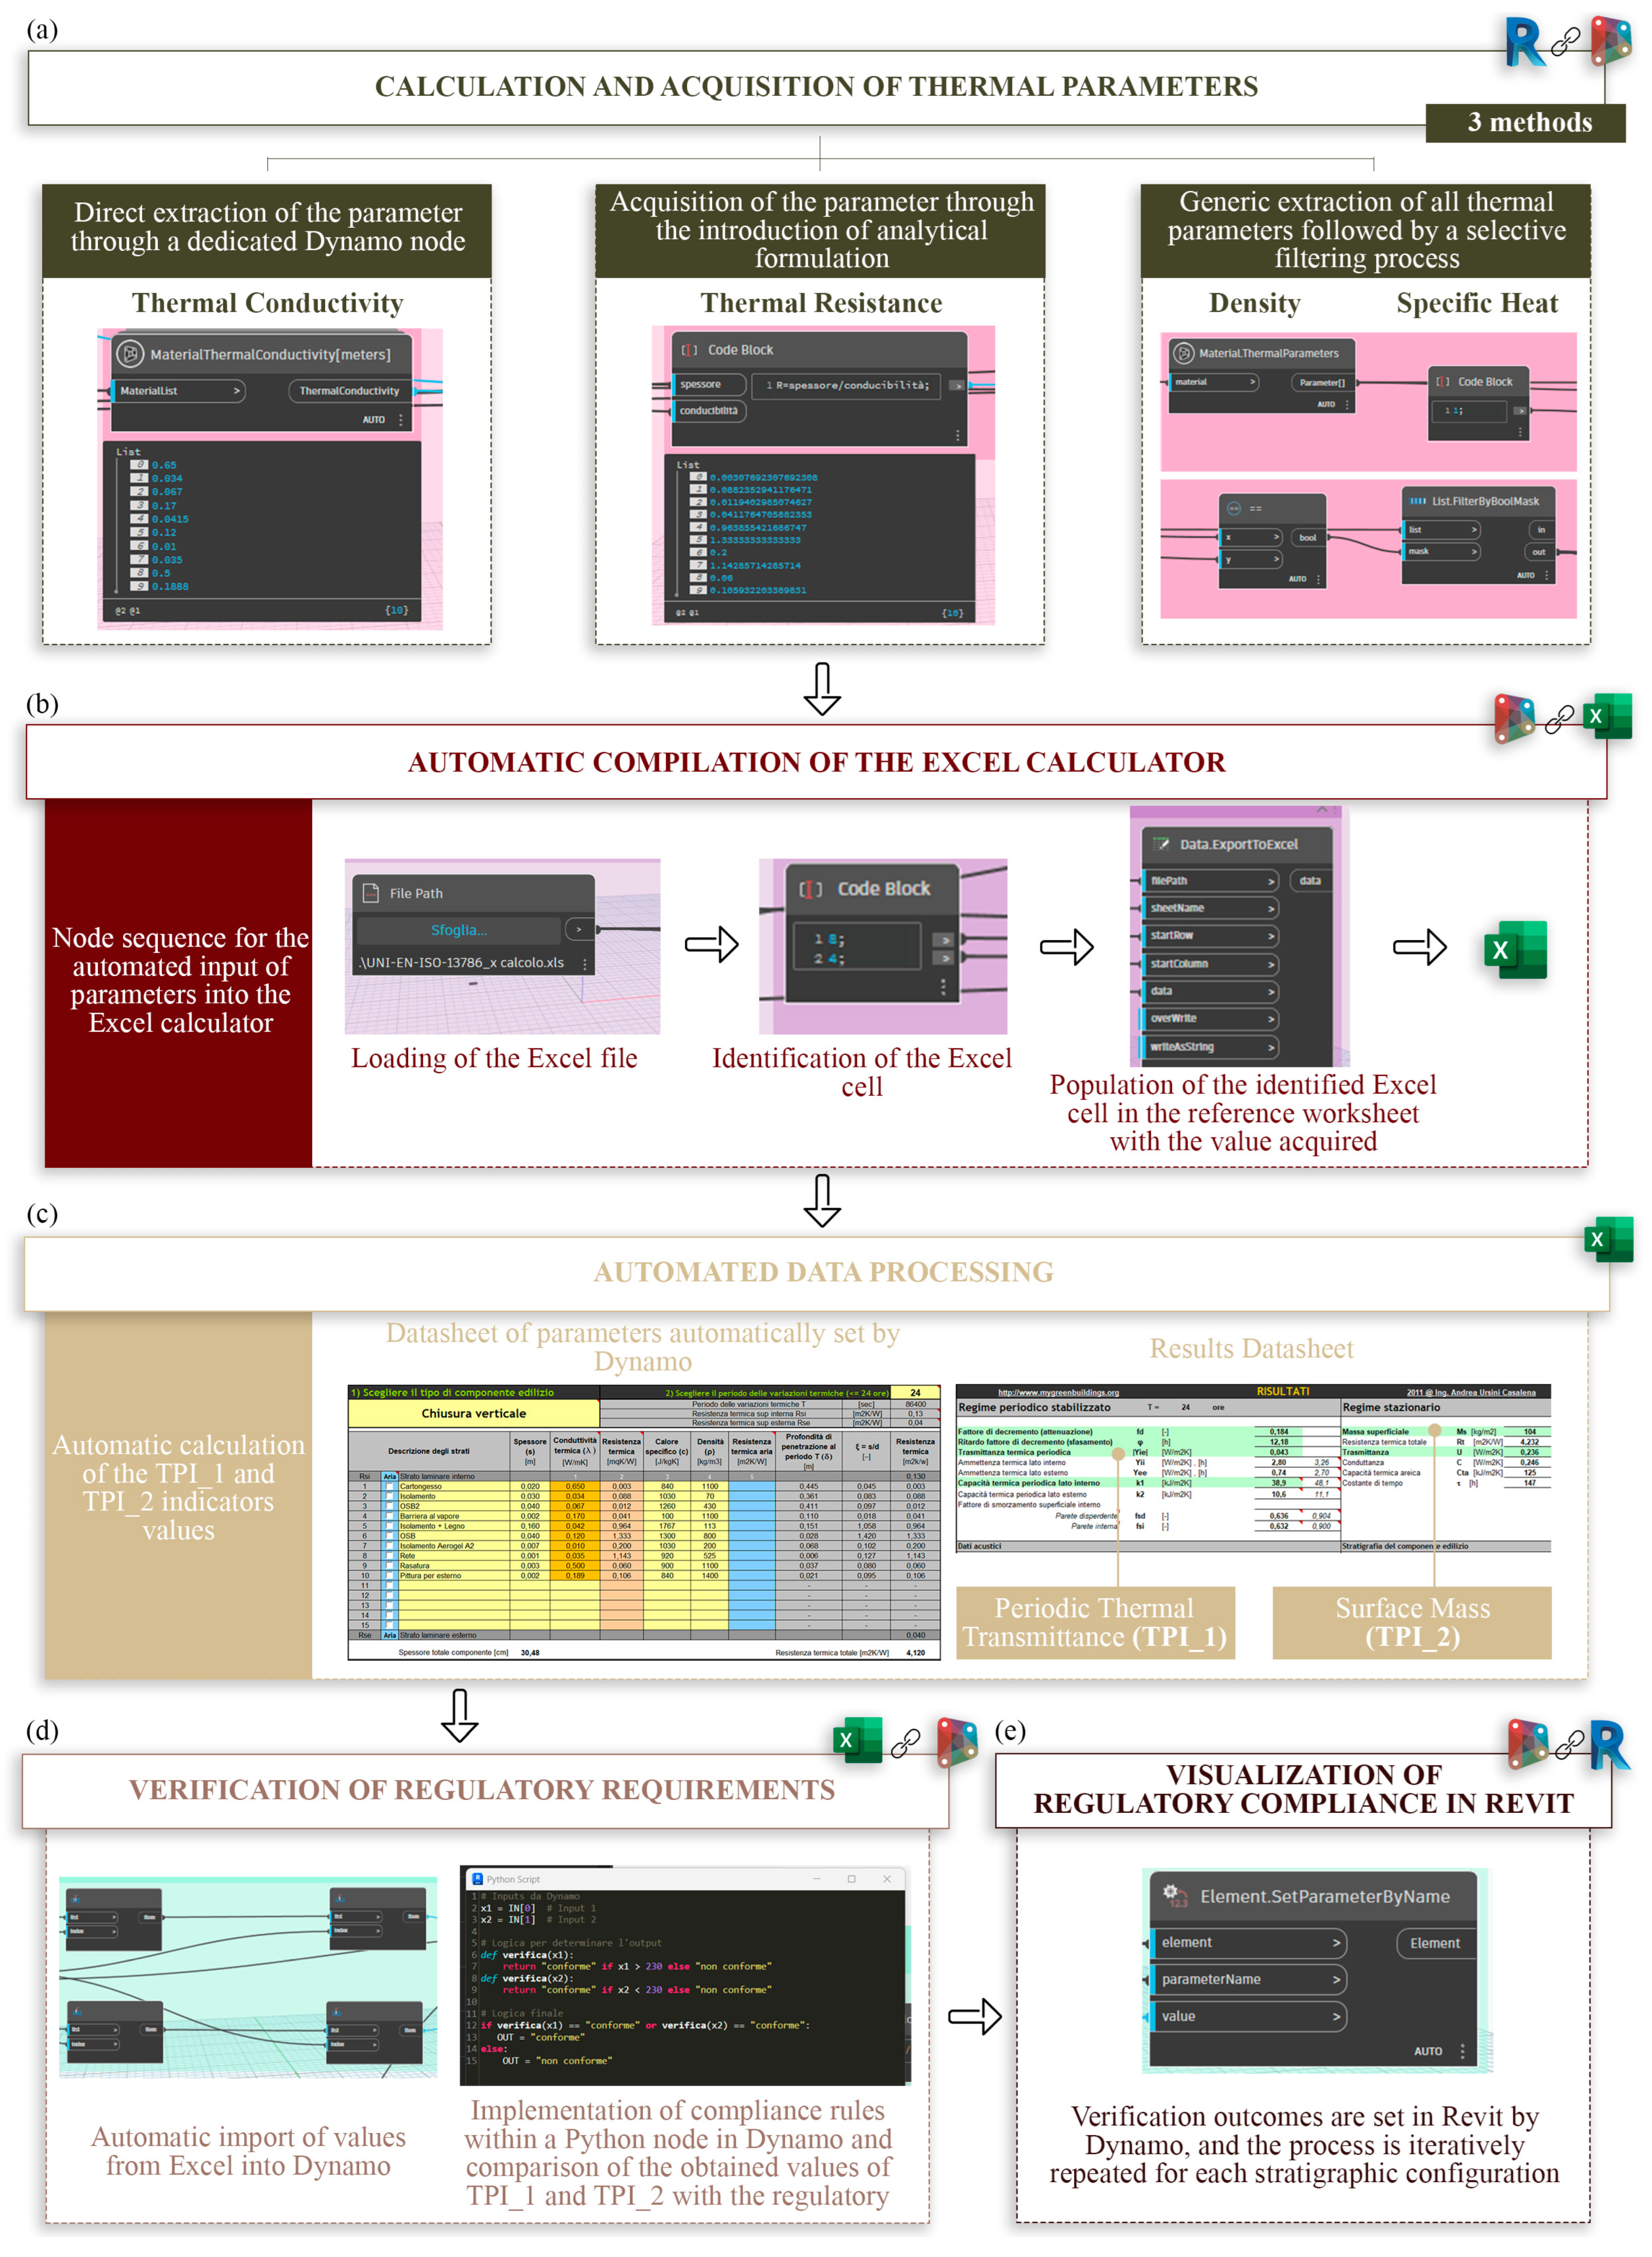
2 to ensure adequate thermal inertia. To perform this verification, the parametric script follows the process shown in
Figure 5.
First, to acquire the required thermal parameters, an information workflow from Autodesk Revit to Dynamo is structured to retrieve Thermal Conductivity, Thermal Resistance, Density, and Specific Heat (see
Figure 5a). To extract these thermal parameters, three different operational approaches are adopted. The first approach involves directly extracting the parameter via a dedicated Dynamo node. For thermal conductivity, the “Material Thermal Conductivity” node retrieves values directly from the Autodesk Revit material browser. The second approach involves calculating the parameter within a “Code Block” node. This approach is adopted because the Thermal Resistance value is obtained by implementing the relevant analytical relationship within the “Code Block”, using material thickness and the previously extracted thermal conductivity as input data, thereby enabling the automatic calculation of the required thermal property.
The third approach is based on a generic extraction of the complete set of thermal parameters for each material, followed by a targeted filtering phase to extract the Density and Specific Heat parameters. This procedure uses the “Thermal Parameters” node, which returns a list of the material’s thermal properties. Through list management operations and index-based selection, the two parameters are isolated.
Subsequently, an additional parametric script automates the transcription of the acquired parameters into the calculator, establishing a dynamic information workflow between Dynamo and Excel (see
Figure 5b). Specifically, the “File Path” node defines the destination Excel file path, thereby establishing a direct link between the parametric modeling environment and the spreadsheet. The worksheet name within the selected file and the reference cells are then specified, ensuring that data are written to the correct sections of the calculator. At this stage, the “Data Export to Excel” node transfers the processed data from Dynamo to the spreadsheet. This operational scheme is applied to the automated compilation of the materials’ thermal parameters, their thicknesses, and the nomenclature of the different layers composing the external wall stratigraphy.
Subsequently, these input data are processed within the Excel-based calculator (see
Figure 5c). The spreadsheet is configured as a black-box tool, enabling reliable results without directly interacting with individual formulas during execution. The Excel-based calculator implements the calculation procedure defined in UNI EN ISO 13786 for the determination of dynamic thermal properties [
49,
56]. This standard provides the methodological basis for evaluating thermal properties required by the Italian D.M. 28/10/2025 [
7], ensuring regulatory consistency between the adopted computational tool and the national legislative framework. The output of this process consists of the calculation of the thermal performance indicators TPI_1, Periodic Thermal Transmittance, and TPI_2 Surface Mass.
These values are then retrieved in Dynamo via parametric scripts, enabling the automated structuring of an information workflow between Excel and Dynamo. The TPI_1 and TPI_2 indicator values are subsequently used as input to a previously configured Python(Version: v. C3Python) node that verifies the regulatory compliance of the analyzed stratigraphic configuration (see
Figure 5d). Within the “Python node”, the compliance ranges defined by the reference regulation are implemented. Based on the input values, the script automatically compares the calculated results with the prescribed limits and returns the verification outcome, classifying the stratigraphy as compliant or non-compliant.
Finally, this outcome is transferred to Autodesk Revit via the “Set Parameter By Name” node, which automatically updates the Compliance parameter to D.M. 28/10/2025 (
Table 2), making the external wall’s compliance status directly visible within the BIM model (see
Figure 5e).
The process is iteratively repeated for each stratigraphic configuration in which the thermal insulation materials, i.e., Rock Wool, EPS, and Aerogel, are alternately substituted. This approach automates regulatory compliance checks, ensuring consistency, repeatability, and direct integration of the verification process into a BIM-based workflow.
3.3.2. Calculation of ESI_1 Indicator
The calculation of ESI_1 “Chapter 2.4.7 Thermal Insulation Materials” is carried out by structuring an information workflow between Dynamo and Autodesk Revit to ensure compliance with the Italian national regulation CAM, as set out in D.M. 24/11/2025 [
12]. This regulation is part of a broader European framework on construction material sustainability, including Regulation (EU) No. 305/2011 (CPR) [
57], the EU Green Deal [
58], and the Circular Economy Action Plan [
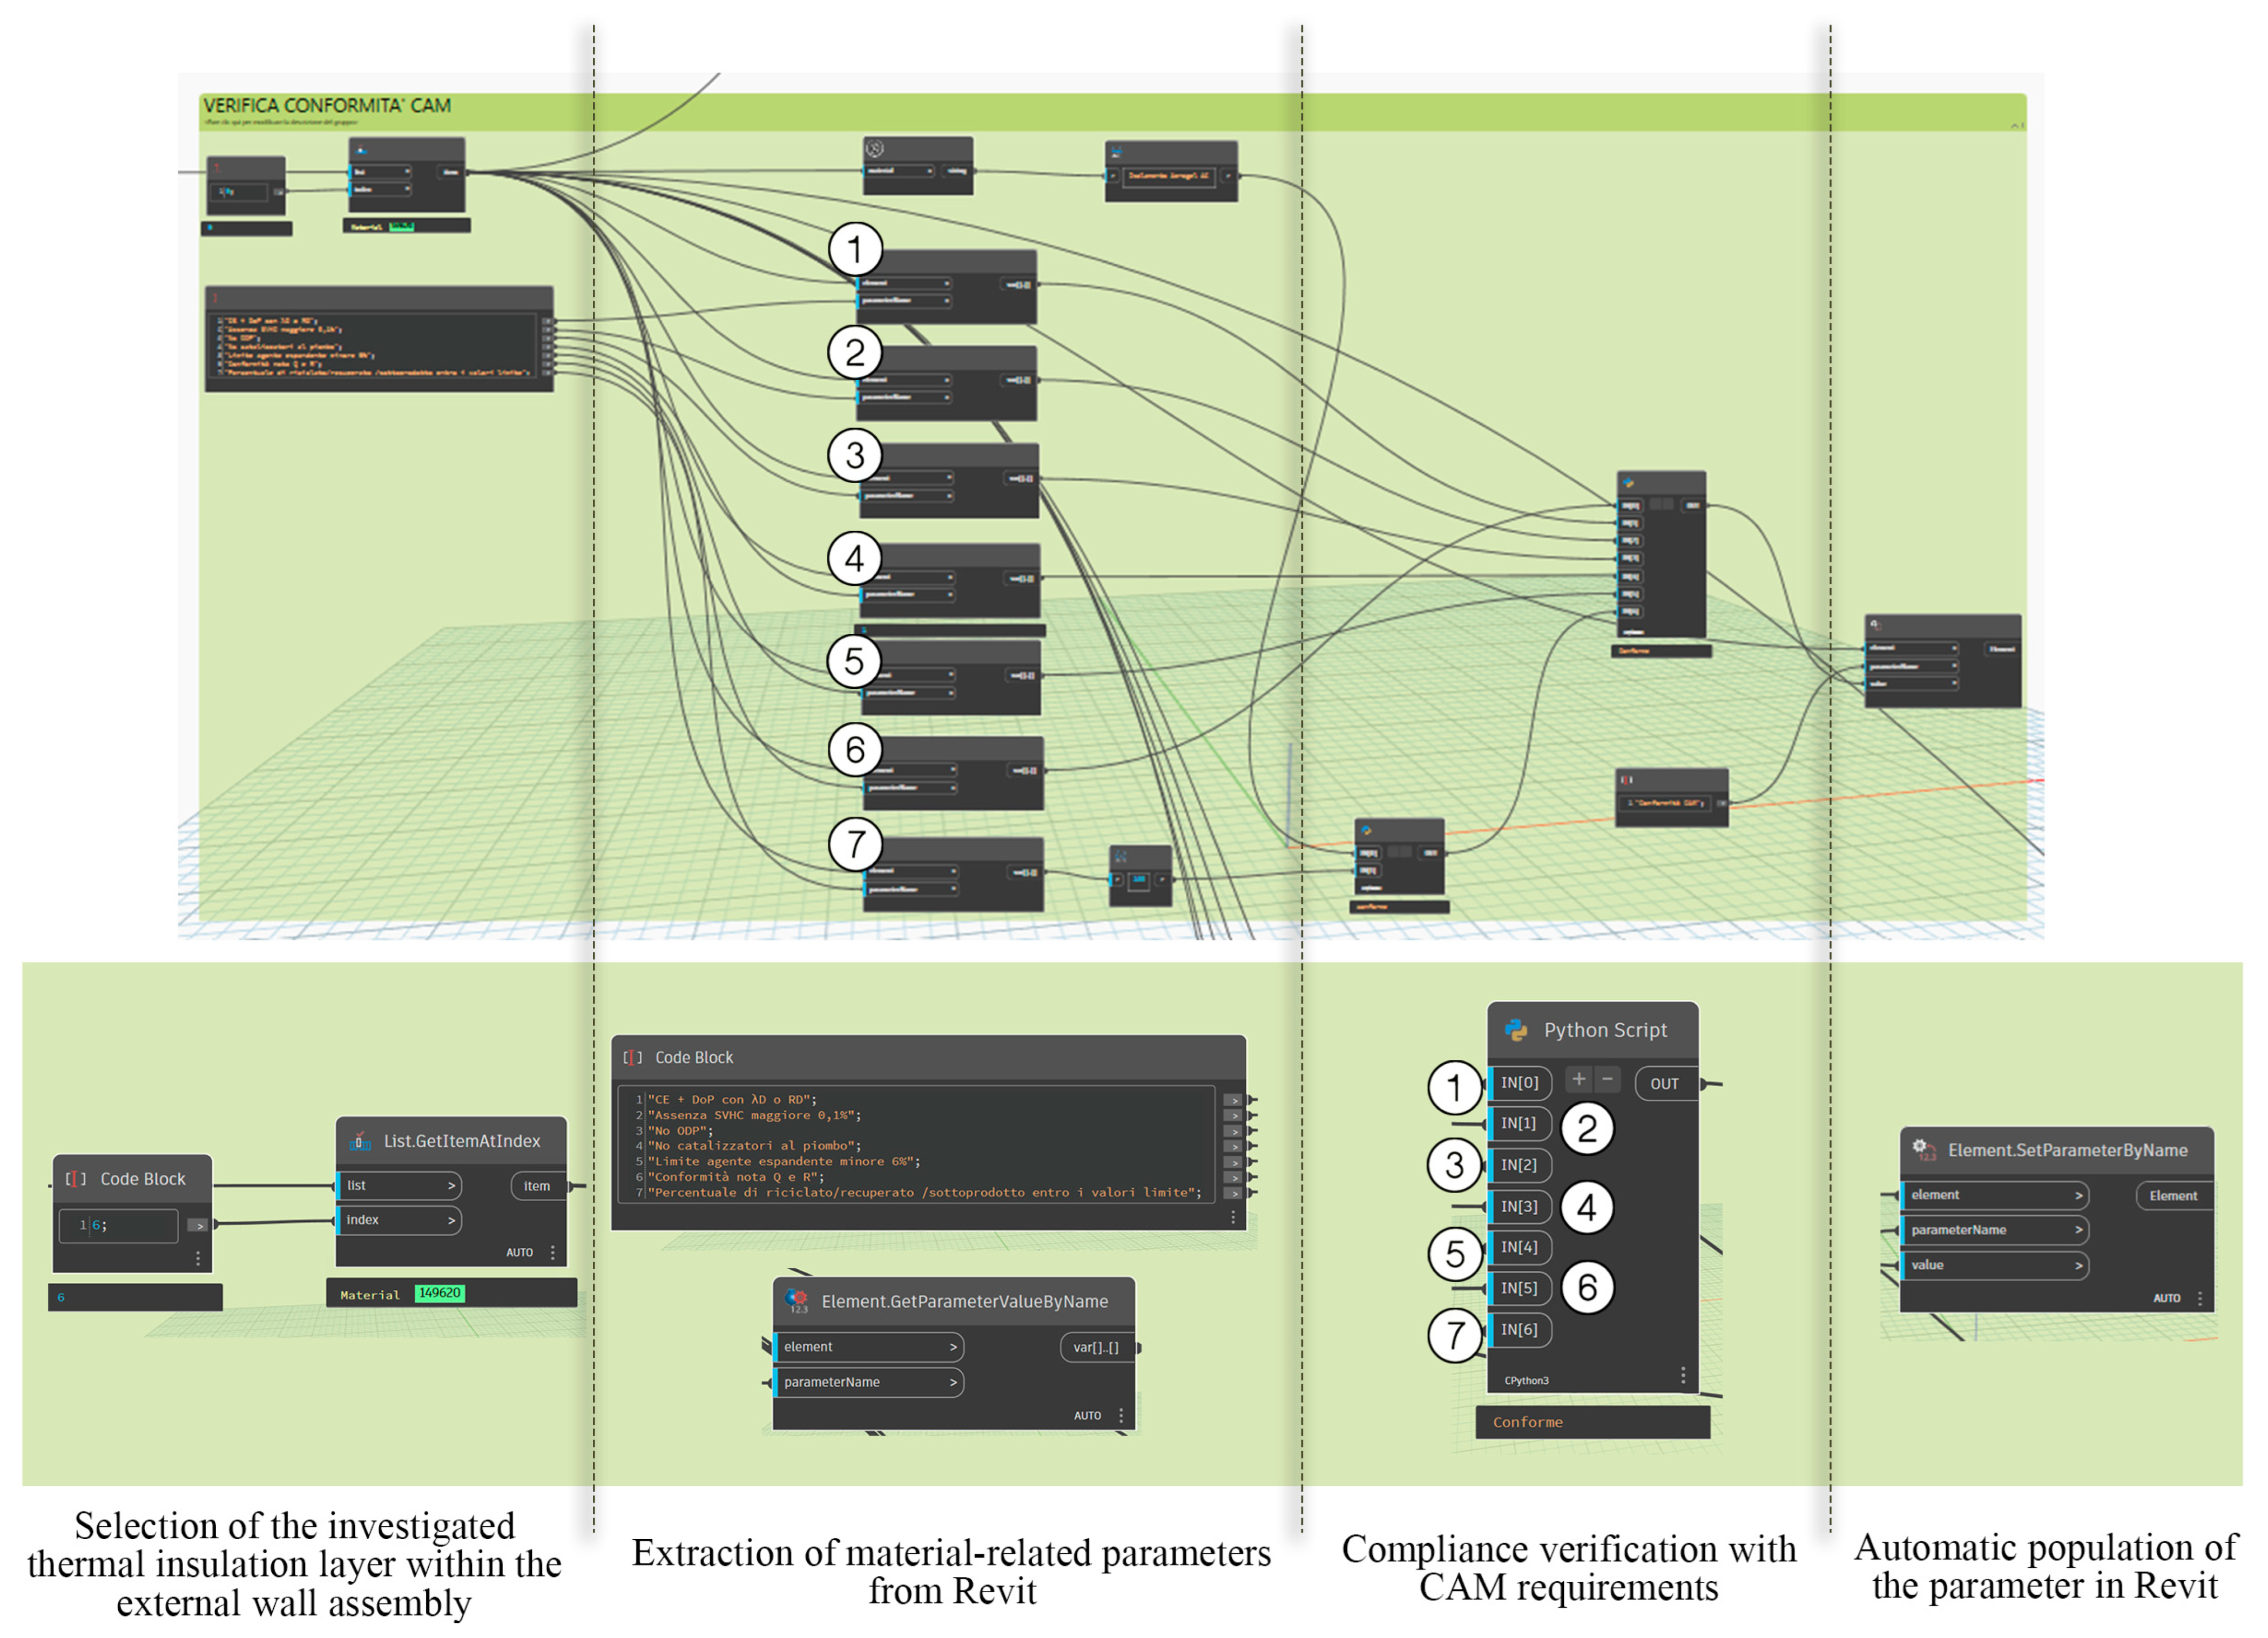
59], which promote low-impact, durable, and recyclable materials. Although the workflow is applied to CAM requirements, its parametric structure allows adaptation to other regulatory frameworks and project contexts. The assessment of ESI_1 is conducted through sequential phases, as shown in
Figure 6.
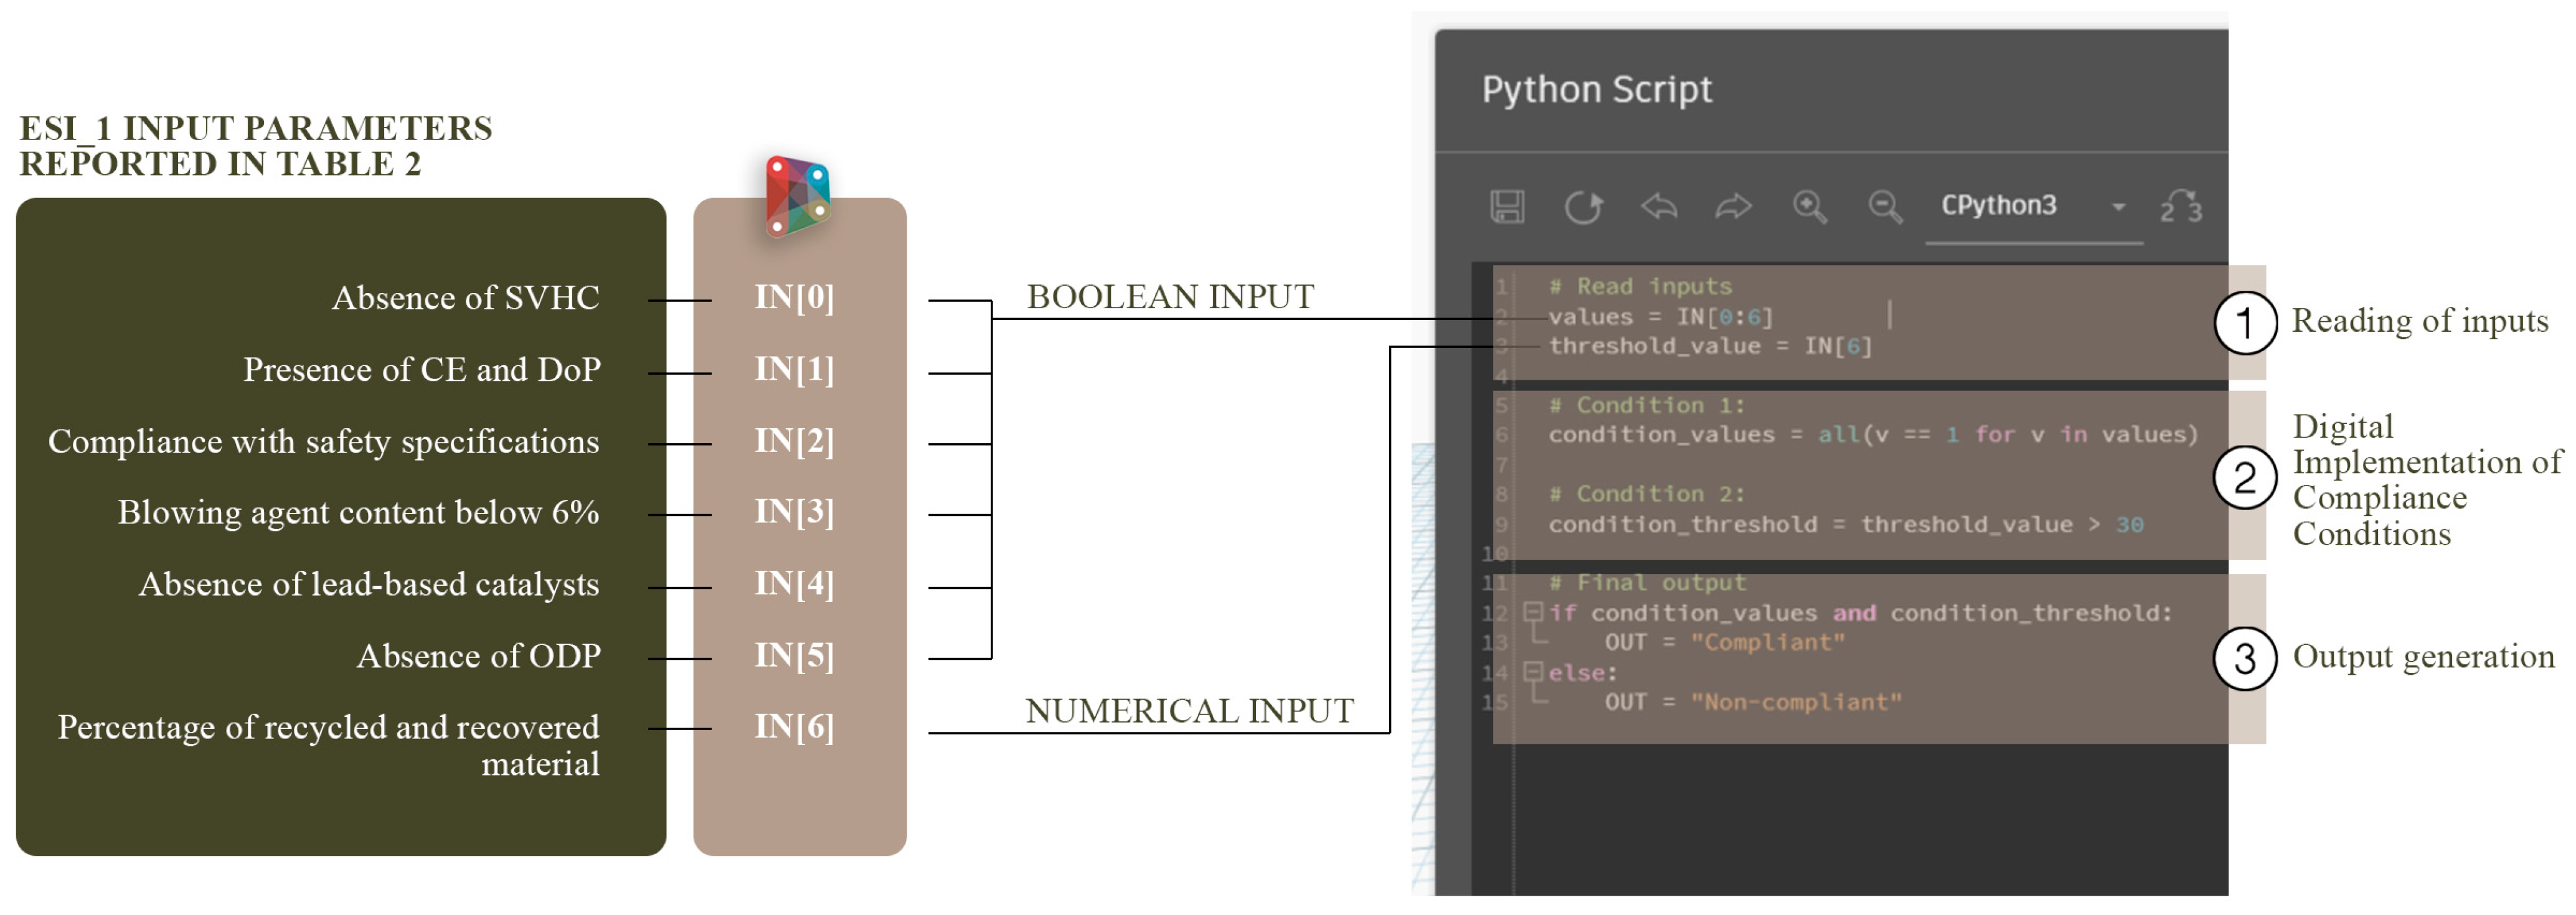
The script implemented in Dynamo receives the seven parameters associated with the ESI_1 indicator, listed in
Table 2, as input. The designer compiles these parameters by consulting product data sheets for defined thermal insulation materials. The parameters are extracted from Autodesk Revit through parametric scripts based on the “Get Item at Index” node, which allows the targeted selection and filtering of the layer assembly component corresponding to the insulation layer, and on the “Get Parameter Value By Name” node, which enables the automatic extraction of the values of the seven parameters associated with the material. The extracted values are used as inputs to a “Python” node. As shown in
Figure 7, inputs 0 to 5 consist of Boolean values (True/False), which are encoded as 1 (true) and 0 (false), while input 6 consists of a numerical value.
Within the “Python” node, the CAM requirements are translated into computational rules so that, after reading the inputs, automated compliance checking of thermal insulation materials is performed. The node returns “compliant” when the material meets the prescribed criteria and “non-compliant” when the requirements are not satisfied. Specifically, to be classified as compliant, inputs 0 to 5 must be true (i.e., equal to 1), and input 6 must indicate a percentage of recycled or recovered material greater than or equal to the thresholds established by the D.M. 24/11/2025. For rock wool and EPS, the percentage must be at least 15%, whereas for aerogel it must be at least 20%. Finally, this outcome is transferred to Autodesk Revit through the “Set Parameter By Name” node, which automatically updates the Compliance with CAM parameter. The process is repeated iteratively for each thermal insulation material: Rock Wool, EPS, and Aerogel.
3.3.3. Calculation of ESI_2 Indicator
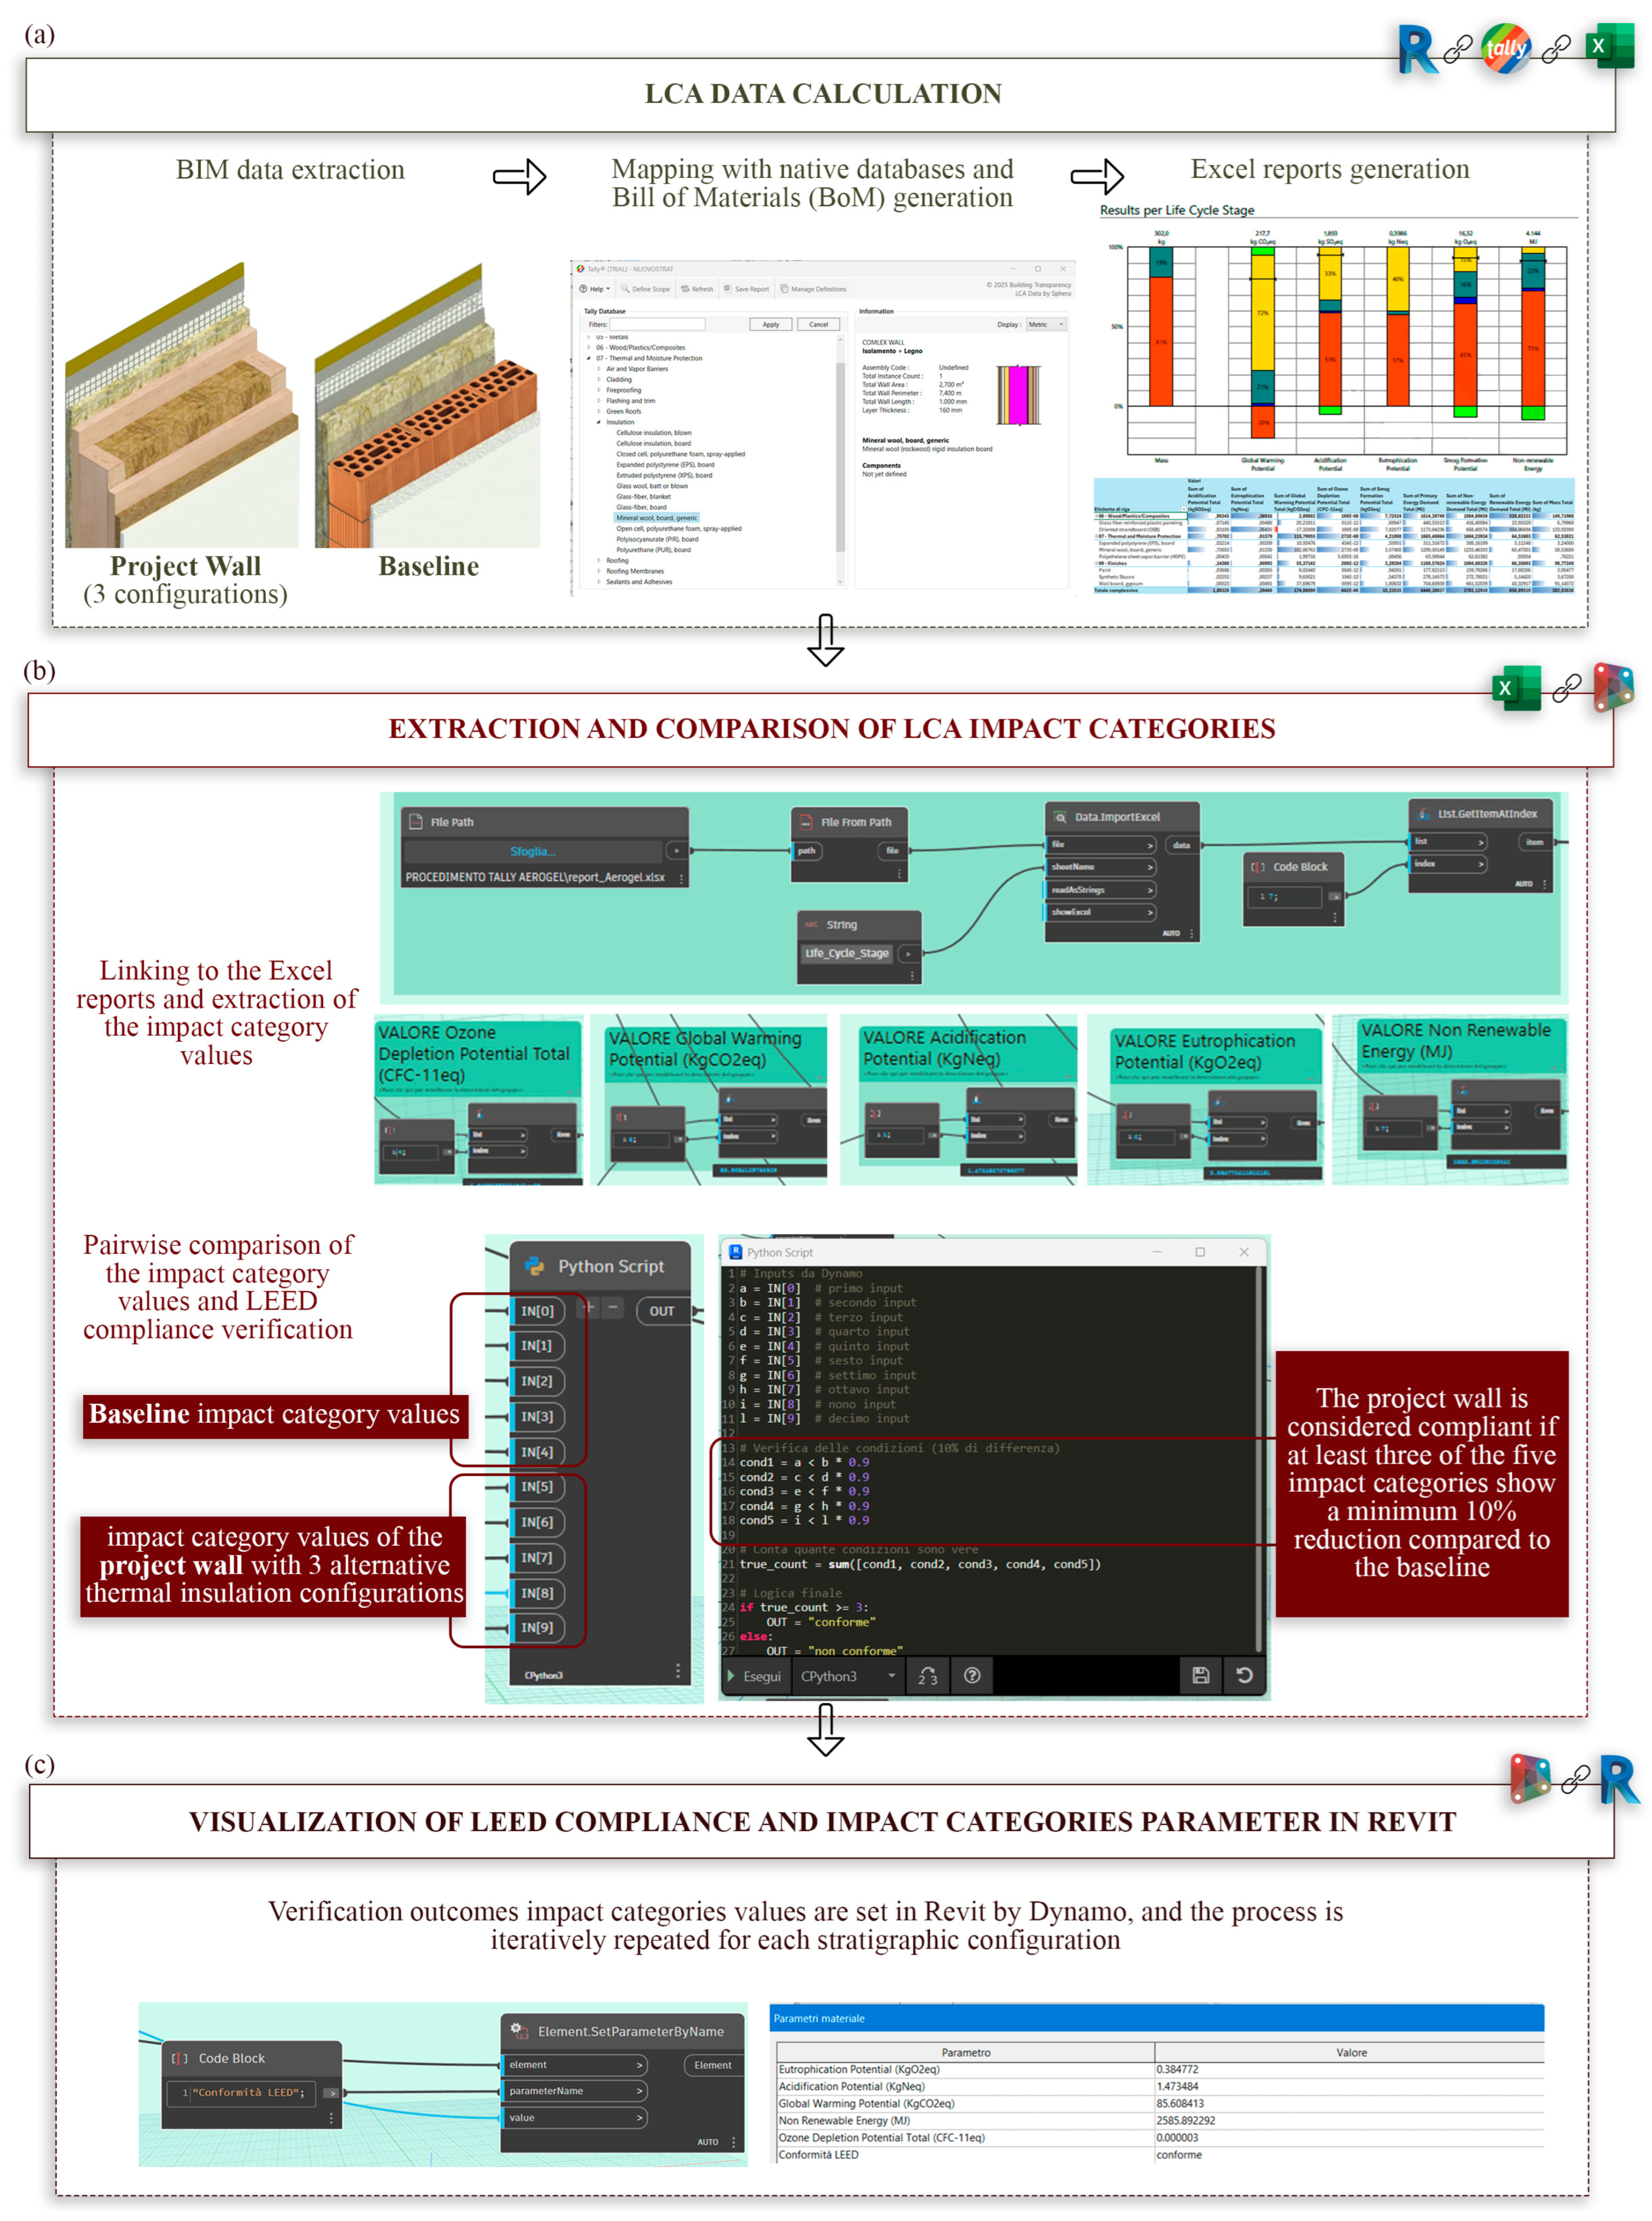
The calculation of ESI_2 “MRc1 Building Life Cycle Impact Reduction” is carried out by structuring an information workflow between Dynamo, the Tally plug-in, and Autodesk Revit to ensure compliance with LEED v4.1 BD+C:NC [
60] requirements (
Figure 8). This credit belongs to the Materials and Resources (MR) category. It is intended to promote the reduction in environmental impacts associated with construction materials through an LCA-based approach. Option 4 of MRc1 requires the development of a comparative LCA, in which a significant project element, in this case the external wall, is compared with a reference element, the baseline. The baseline represents a conventional construction solution typical of the intervention’s local context and serves as the benchmark for evaluating the proposed system’s environmental performance. The LCA assessment is required to demonstrate a reduction of at least 10% in environmental impacts in at least three impact categories, including Eutrophication Potential (EP), Acidification Potential (AP), Global Warming Potential (GWP), Non-Renewable Energy (NRE), and Ozone Depletion Potential (ODP).
Within the context of this study, the baseline is represented by an external wall with external insulation, in which the functional layers are alternated: external and internal finishes, a skim coat, and reinforcement layers typical of external insulation systems, an insulation layer, an adhesive layer, a structural masonry element, and internal plaster. In this configuration, the insulation layer is the primary performance-related element. This layer assembly is modeled in Revit in accordance with the procedures described in
Section 3.2. The comparison between the baseline and the project external wall, in which three different types of insulation, i.e., Aerogel, EPS, and Rock Wool, are alternately adopted, is carried out using a parametric workflow that integrates LCA evaluation within an automated framework.
Tally 2025.06.24.01 is a plug-in for Autodesk Revit [
61] that allows the assessment of environmental impacts of materials by directly extracting information from the BIM model (
Figure 8a). The Tally LCA analysis considers a cradle-to-grave system boundary, including the product stage, construction process stage, use stage, and end-of-life stage. The functional unit adopted for the assessment is 1 m
2 of the analyzed external wall, assuming a building service life of 60 years. The environmental impacts are calculated using the LCA database integrated within the Tally software.
Specifically, the use of Tally enables direct extraction of stratigraphic data and mapping of the correspondence between the project materials and those available in the plug-in’s native database, such as the GaBi database and Environmental Product Declarations (EPDs). Subsequently, the plug-in automatically generates a Bill of Materials (BoM) that lists, in detail, the quantities of materials in the model and their environmental impacts. This BoM is dynamically updated upon any modification to the stratigraphy, material selection, or geometry of the elements, enabling automatic recalculation of ecological impacts and ensuring interoperability within the BIM-based workflow. The environmental impacts for the selected categories are provided in analytical reports that can be exported directly from Tally to Excel, including quantified values for each impact category across the entire life cycle. This process is iteratively repeated to generate one report for the baseline configuration and three reports for the platform frame external wall, one for each thermal insulation configuration.
Subsequently, to compare the data on the impact categories of the baseline stratigraphy with the different platform frame external wall configurations considered, a parametric script is implemented in Dynamo (
Figure 8b). In the first phase, the script automatically extracts data for the five impact categories, establishing a direct information flow from Excel to Dynamo. This data is fed into a “Python” node, where the comparison is performed using pairwise logic. Each project configuration is individually compared with the reference baseline. The comparison is performed through a “Python” node that returns “compliance” or “non-compliance” with the LEED criterion.
Finally, this outcome is transferred to Autodesk Revit through the “Set Parameter By Name” node, which automatically updates the Compliance with LEED parameter (
Figure 8c). In addition, through another set of nodes, a direct information flow is established between Dynamo and Revit, allowing the automatic population of impact category values for each stratigraphic configuration. In this way, these values are available and updated within the BIM model, enabling continuous control of environmental performance directly in Revit.
3.4. Phase 4—Implementation of AHP-Based MCDM Technique
Phase 4 concerns assigning weights to the indicators and implementing the AHP-based MCDM technique. The objective of AHP is to determine the weights of relative importance of five indicators (TPI_1, TPI_2, EI_1, ESI_1, ESI_2) and to use them to select the best stratigraphy among multiple alternatives. The AHP is selected as the decision-support method due to its ability to structure complex multi-criteria problems and integrate both quantitative and qualitative information [
62]. It enables systematic pairwise comparisons and a transparent weighting procedure, adopted in construction and sustainability assessments [
63].
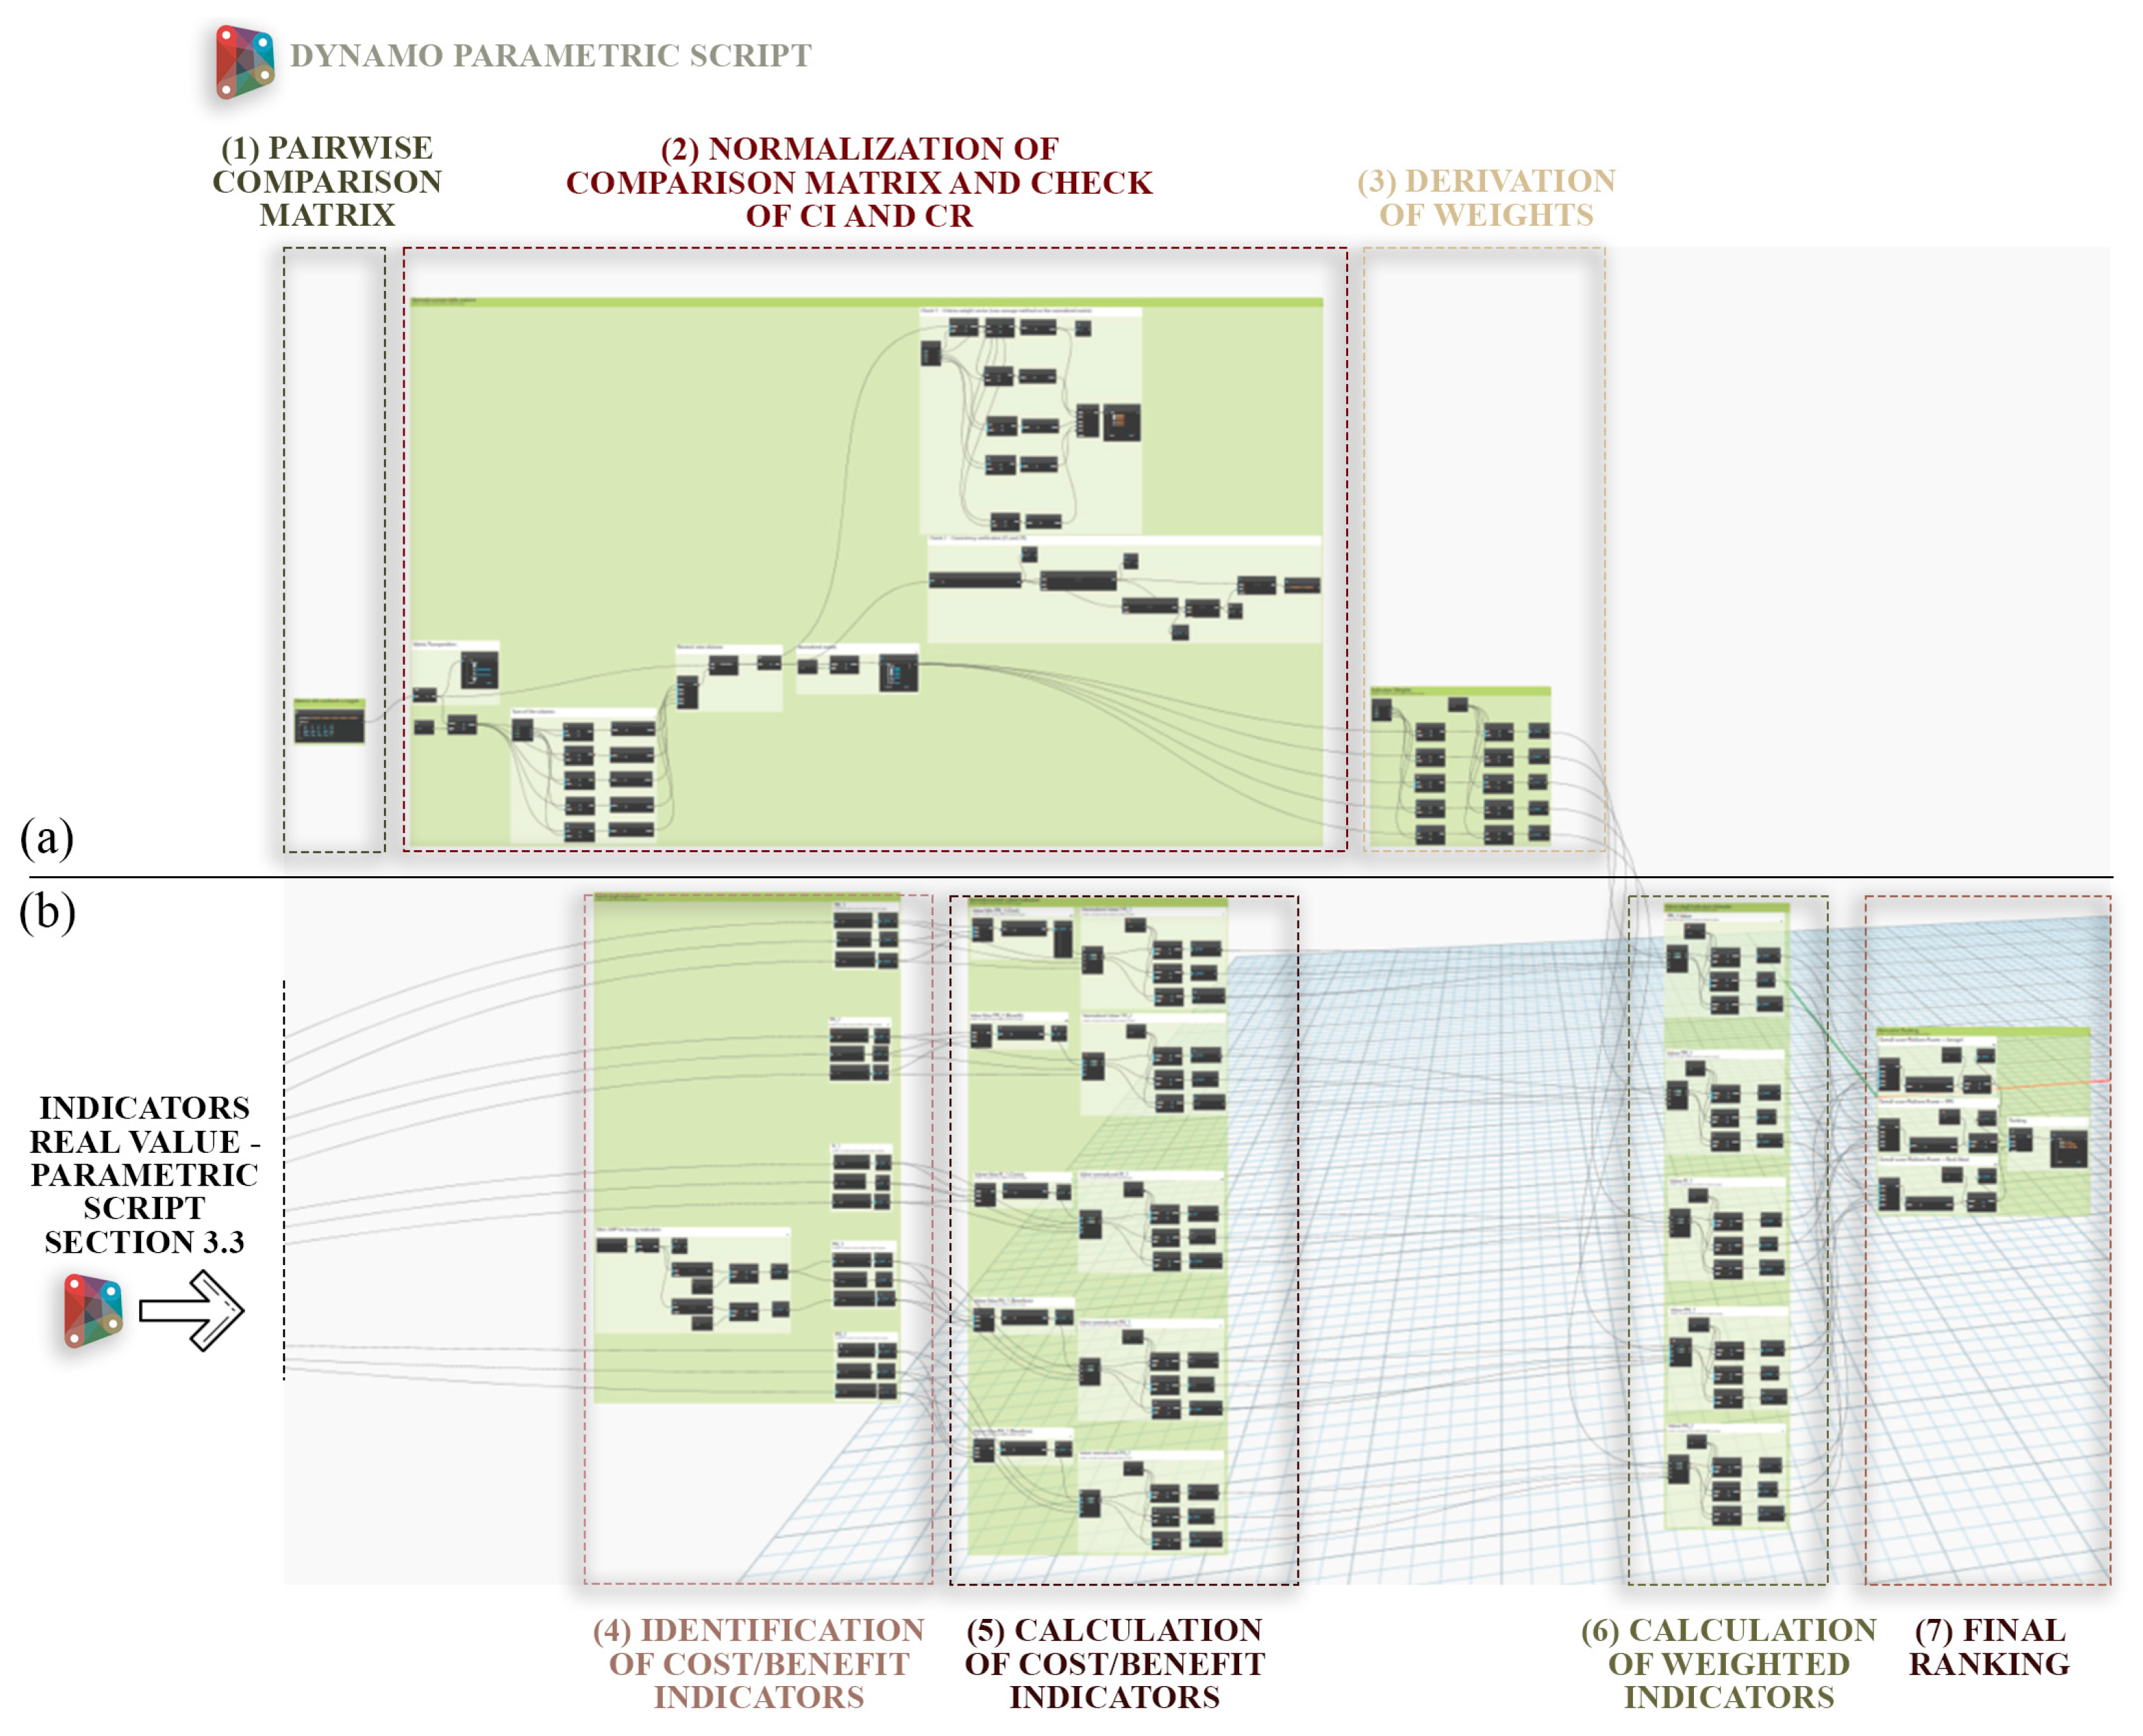
In this research, the analysis is structured into a sequence of macro-phases, all implemented in Dynamo. As highlighted in
Figure 9a, the first phase concerns the determination of indicator weights and includes constructing the pairwise comparison matrix, normalizing it, and verifying consistency by calculating the Consistency Index (
CI) and Consistency Ratio (CR). Once logical coherence is confirmed, the weights are derived from the normalized matrix (see
Section 3.4.1). The second phase concerns the implementation of the AHP method (
Figure 9b). Indicators are classified as cost or benefit criteria, normalized accordingly, multiplied by their respective weights, and aggregated to obtain the final ranking of the alternatives and the optimal solutions (see
Section 3.4.2).
3.4.1. Determination of Indicator Weights
In the proposed framework, regulatory compliance is treated as a preliminary verification step rather than as a direct input to the multi-criteria ranking. In particular, the pass/fail verification associated with TPI_1 and TPI_2 is used only to check whether the threshold values defined by D.M. 28/10/2025 are satisfied during the calculation of the thermophysical indicators. The AHP-based ranking is therefore performed using the quantitative values of the indicators (TPI_1, TPI_2, ESI_2, and EI_1) and the binary environmental compliance indicator (ESI_1).
After defining (Phase 1, see
Section 3.1) and calculating (Phase 3, see
Section 3.3) the selected indicators for the platform-frame stratigraphies, qualitative preferences among the requirements are formalized through a pairwise comparison matrix based on Saaty’s fundamental scale [
64]. The indicators TPI_1, TPI_2, and ESI_1 are assigned equal and higher weights due to their direct relevance to mandatory regulatory requirements. TPI_1 and TPI_2 are related to the requirements established by the Italian D.M. 28/10/2025, where values approaching the prescribed thresholds are associated with higher levels of thermal comfort in building envelope design (see
Section 3.3.1). Similarly, ESI_1 is associated with the requirements introduced by the Italian D.M. 24/11/2025, which considers proximity to threshold values to support achieving greater sustainability and circularity in the project from the early design stages (see
Section 3.3.2). Conversely, the indicators EI_1 and ESI_2 are not associated with mandatory regulatory thresholds. Although these indicators provide relevant environmental and economic information, they are considered less influential within the overall evaluation framework. These qualitative judgments are translated into quantitative values using the Saaty scale and implemented in Dynamo to build the AHP pairwise comparison matrix. The resulting matrix is reciprocal, as each comparison is accompanied by its inverse, and is characterized by a transitive, multiplicatively consistent structure. This setting ensures the logical consistency of the expressed judgments. It allows the correct application of the AHP method to the subsequent calculation of the relative importance weights of the criteria.
Once the values are obtained, the decision matrix for the alternatives is constructed by normalizing the stratigraphies’ performance values according to each indicator’s direction of preference.
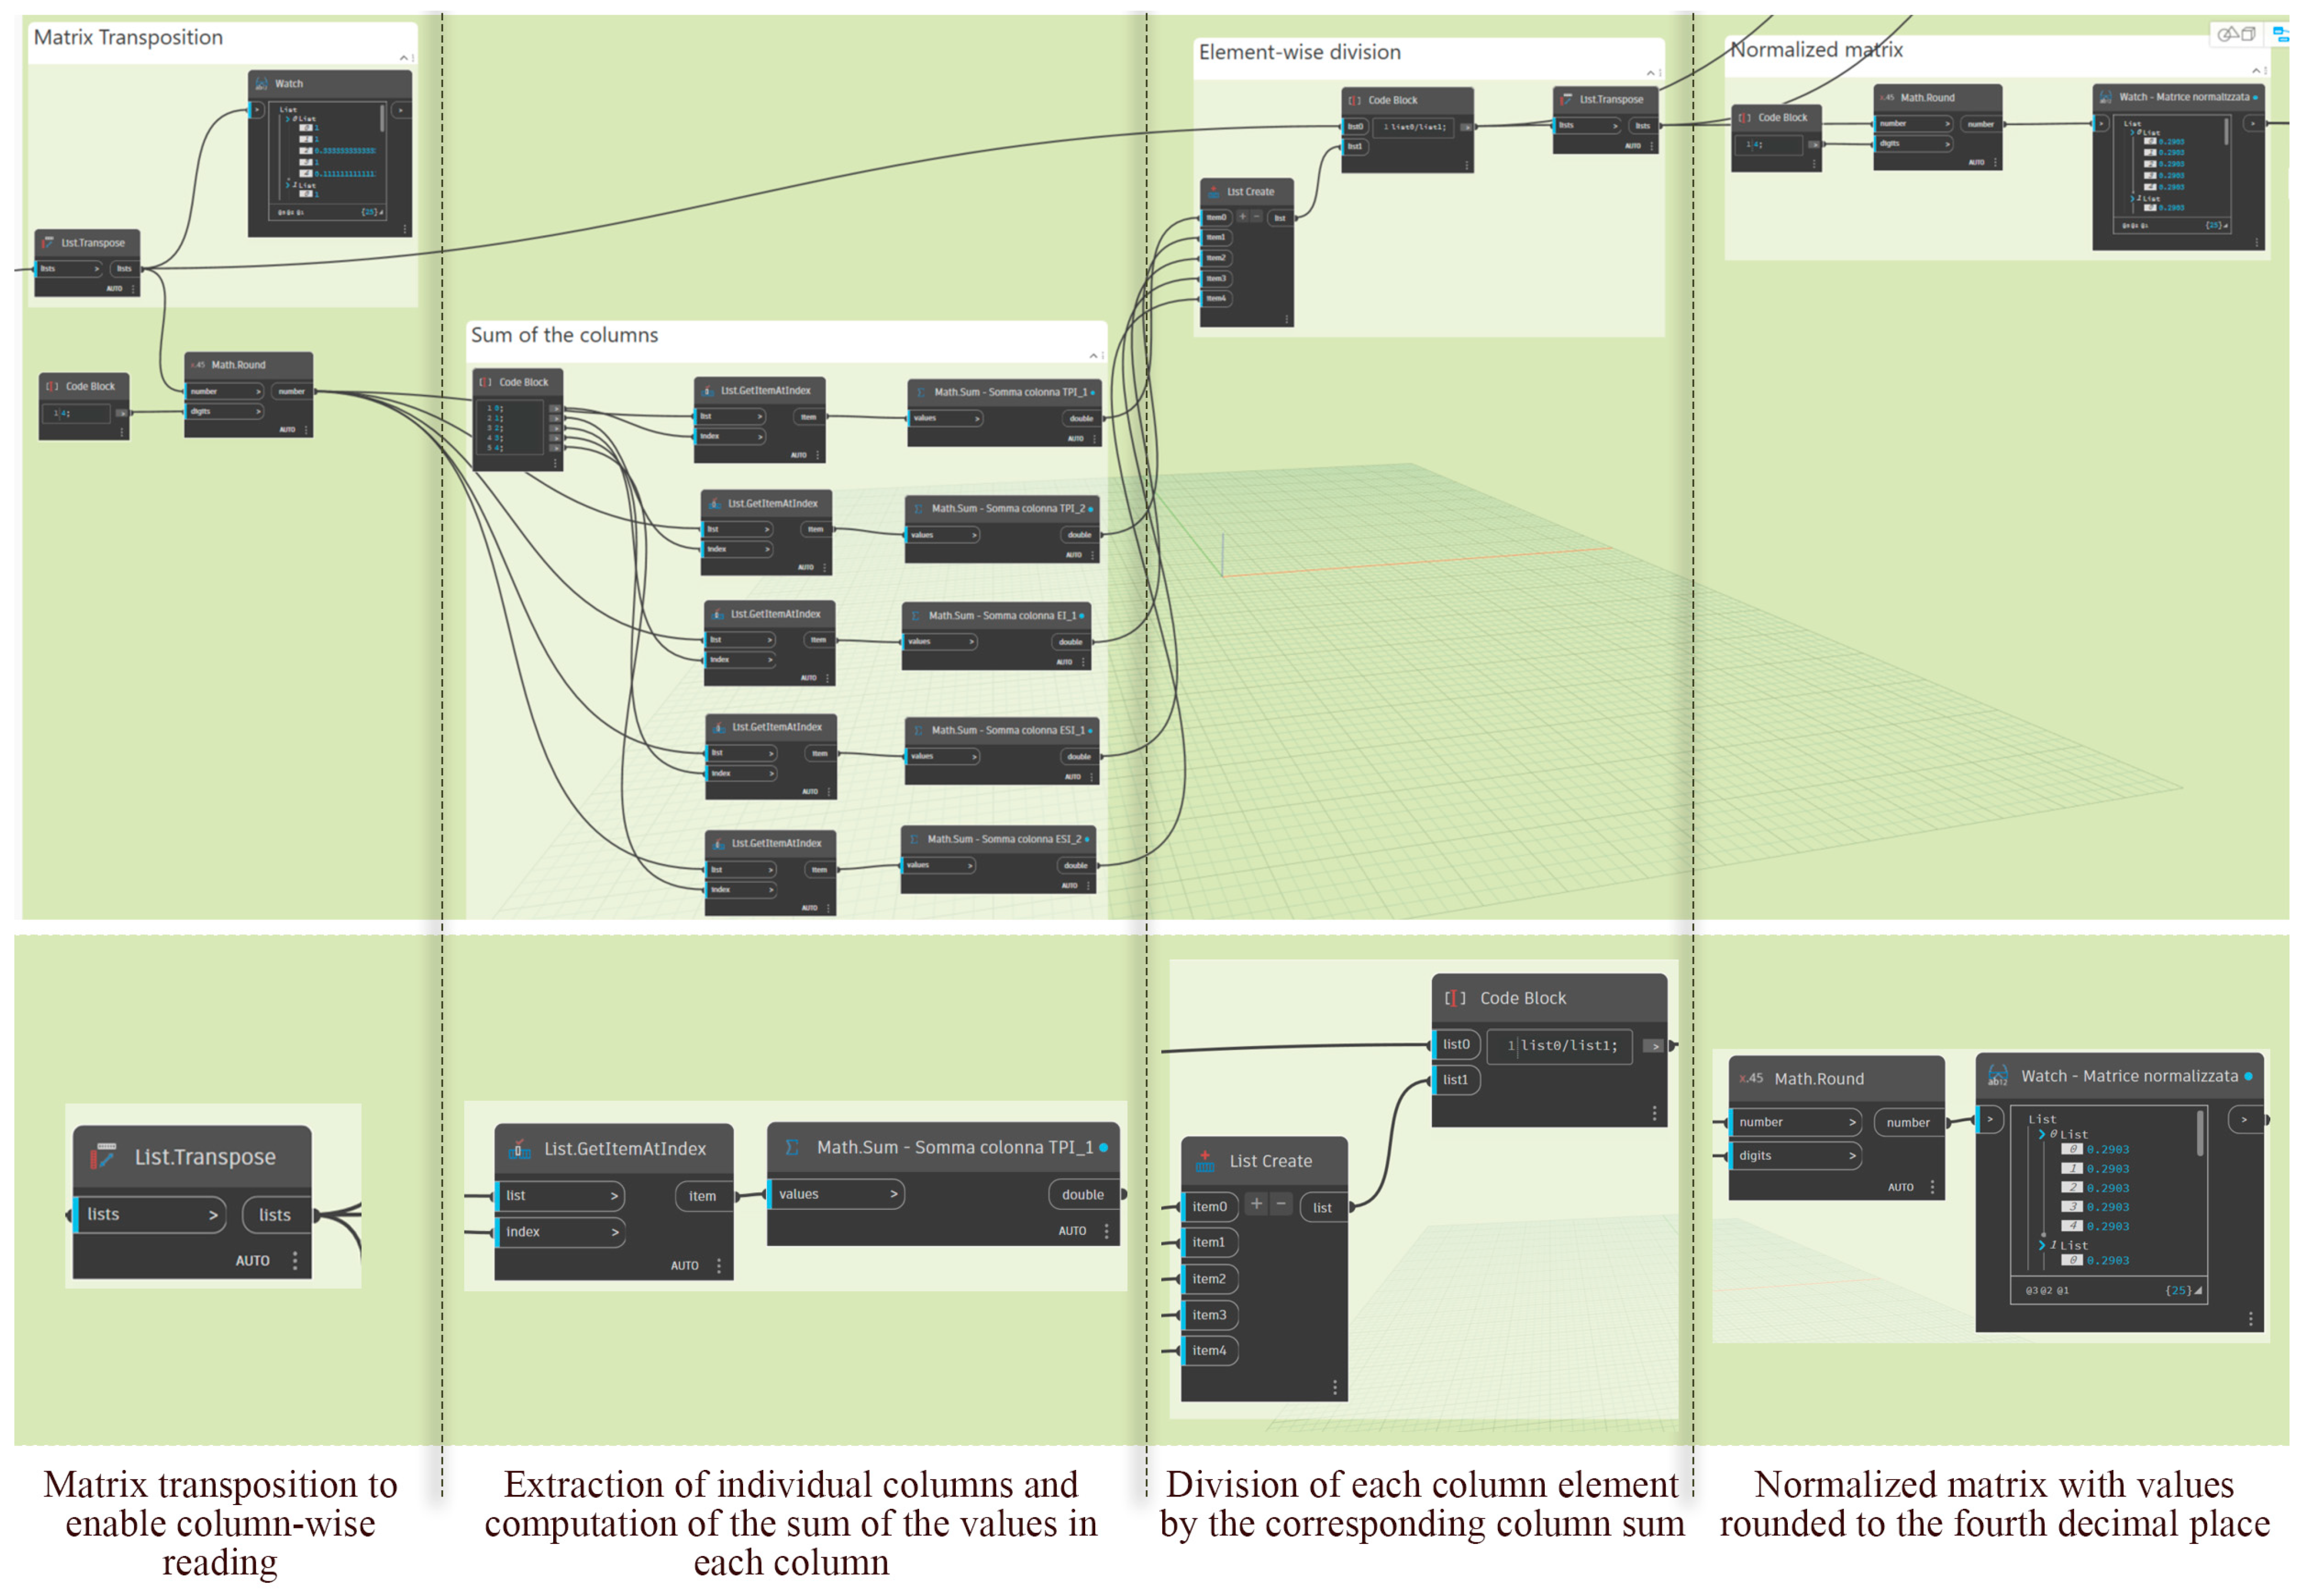
Specifically, the pairwise comparison matrix is normalized column-wise by dividing each element by the sum of its column, expressing comparisons in dimensionless terms and highlighting the relative contribution of each indicator. In Dynamo, as highlighted in
Figure A1, the matrix is first transposed to enable column-wise operations. Each column is extracted and summed, and a “Code Block” node applies the normalization formula. Since the matrix is constructed multiplicatively, the normalized matrix exhibits constant rows, confirming the consistency of judgments and ensuring the derivation of a stable and unique weight vector through row averaging.
A check of the
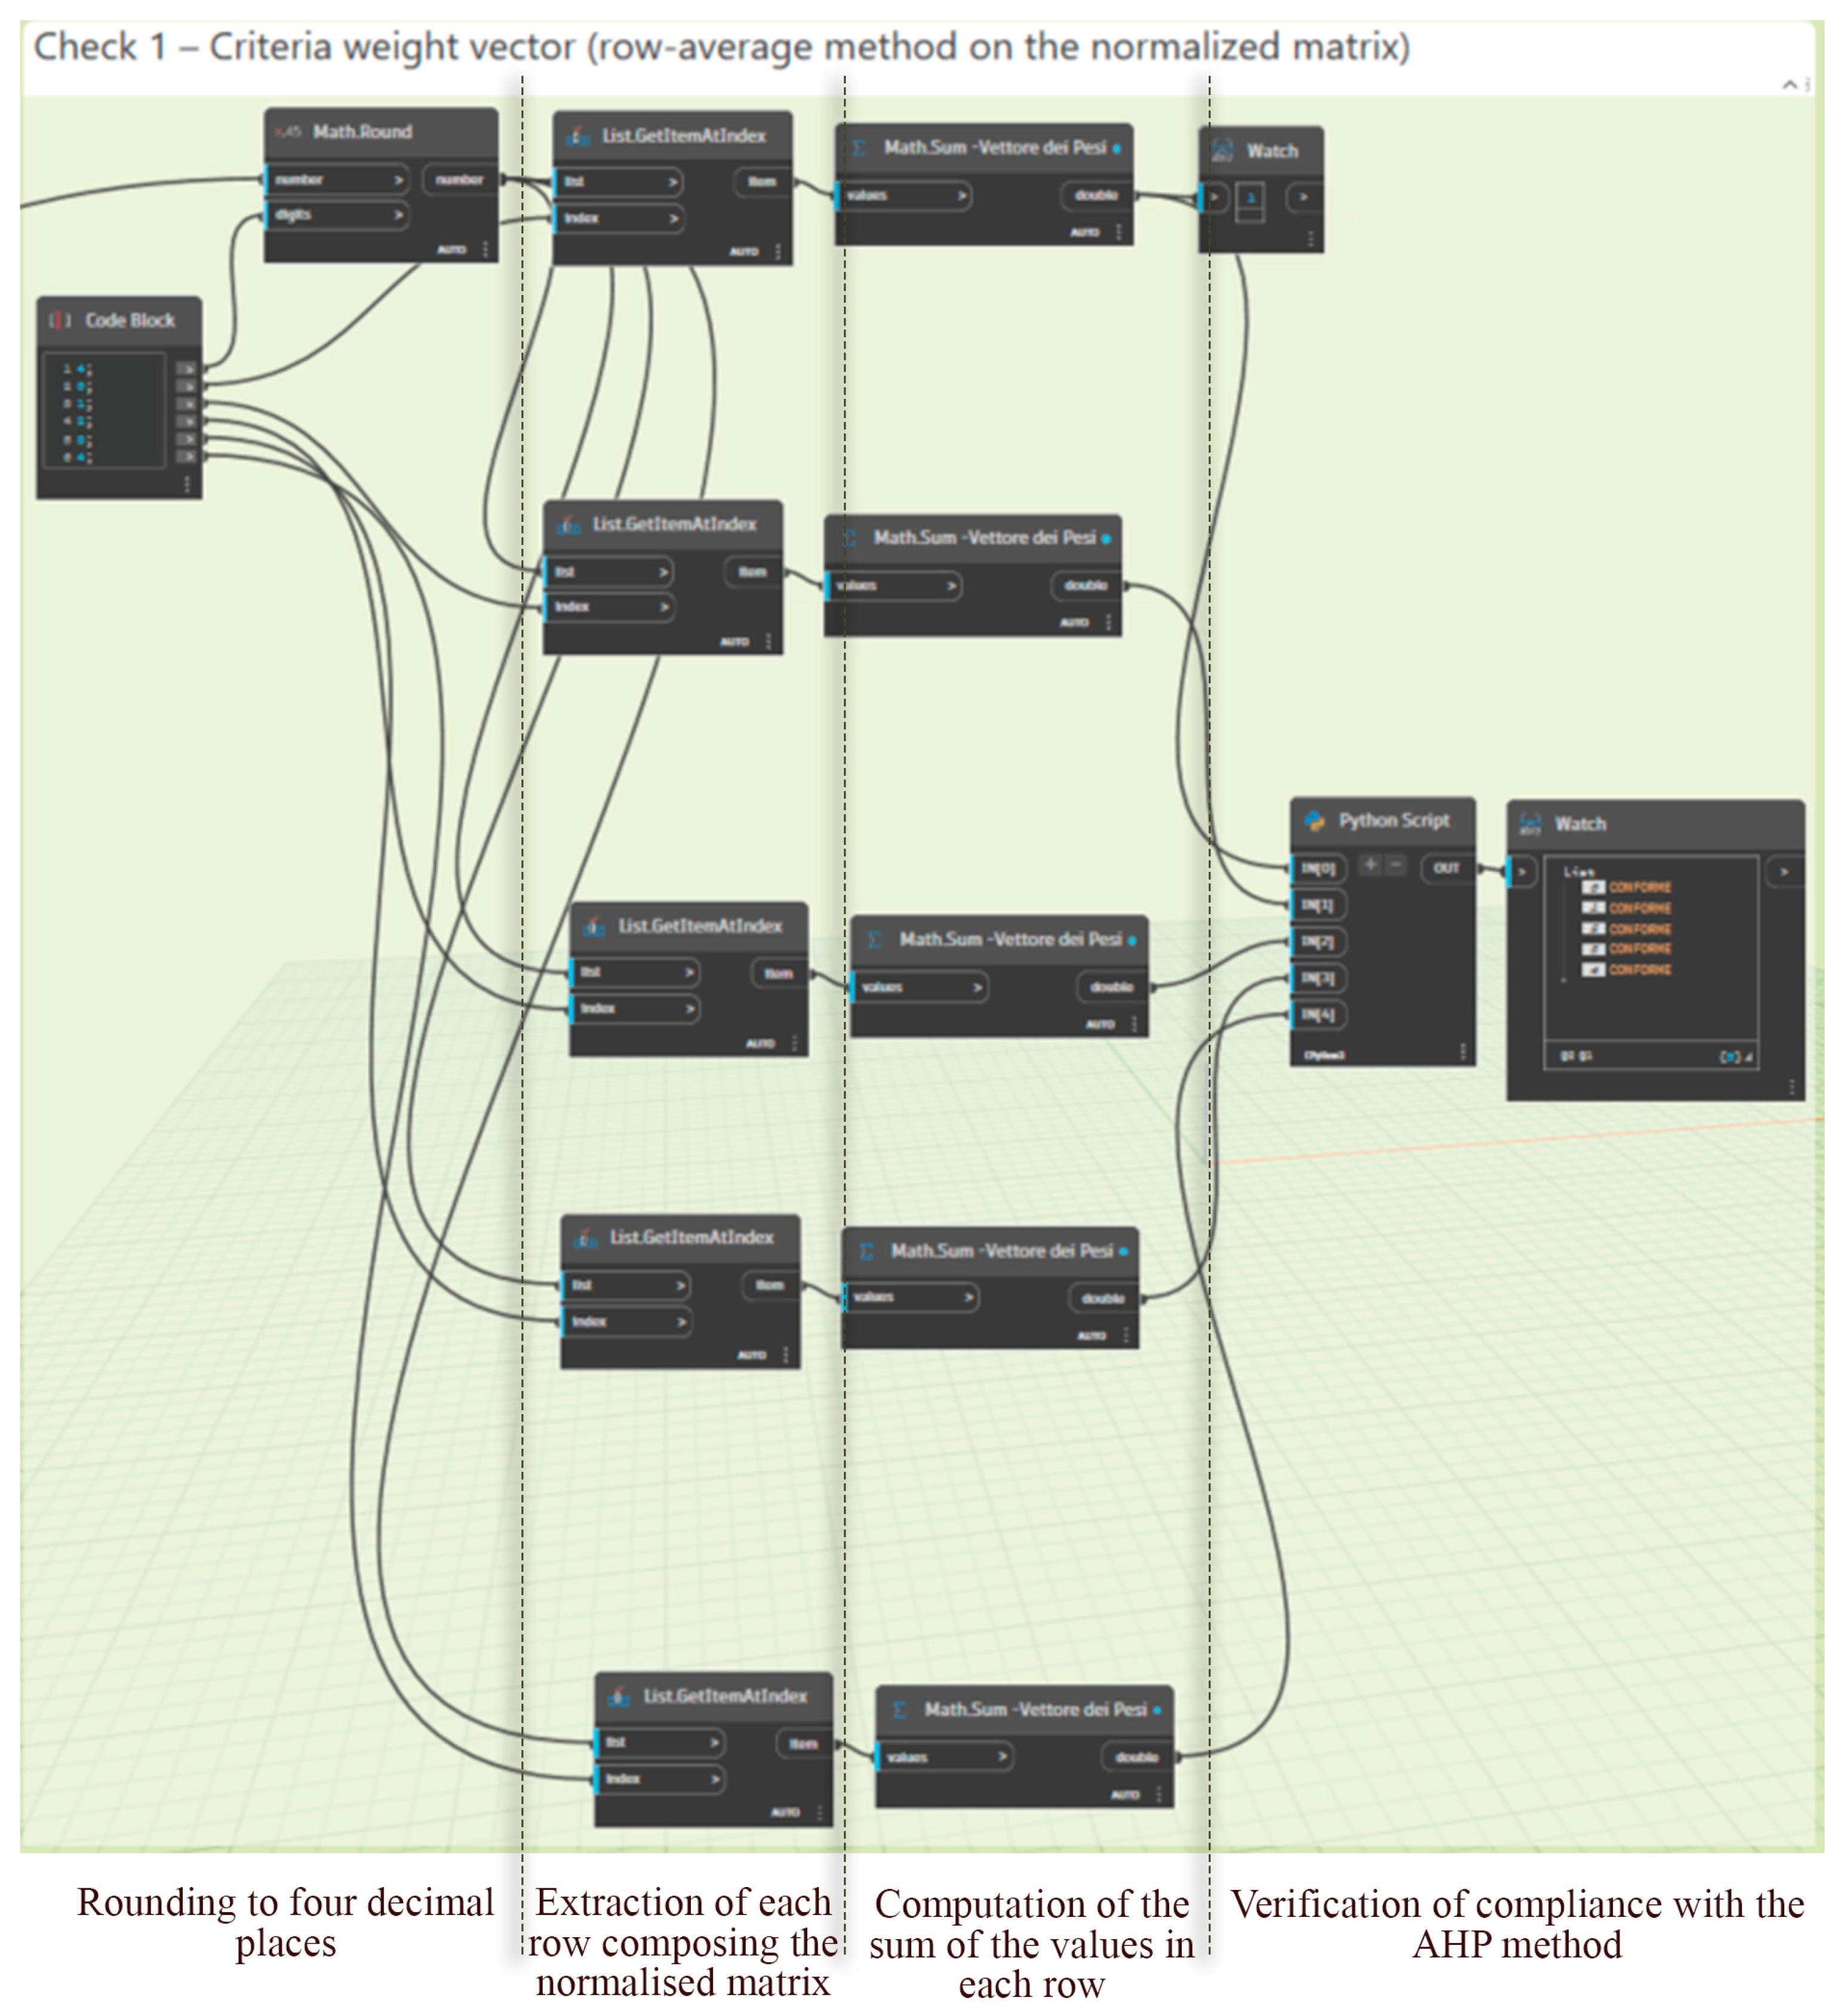
CI and CR indices is then performed, and the weights are derived. In this phase, indicator weights are derived by averaging the rows of the normalized comparison matrix. In Dynamo, as highlighted in
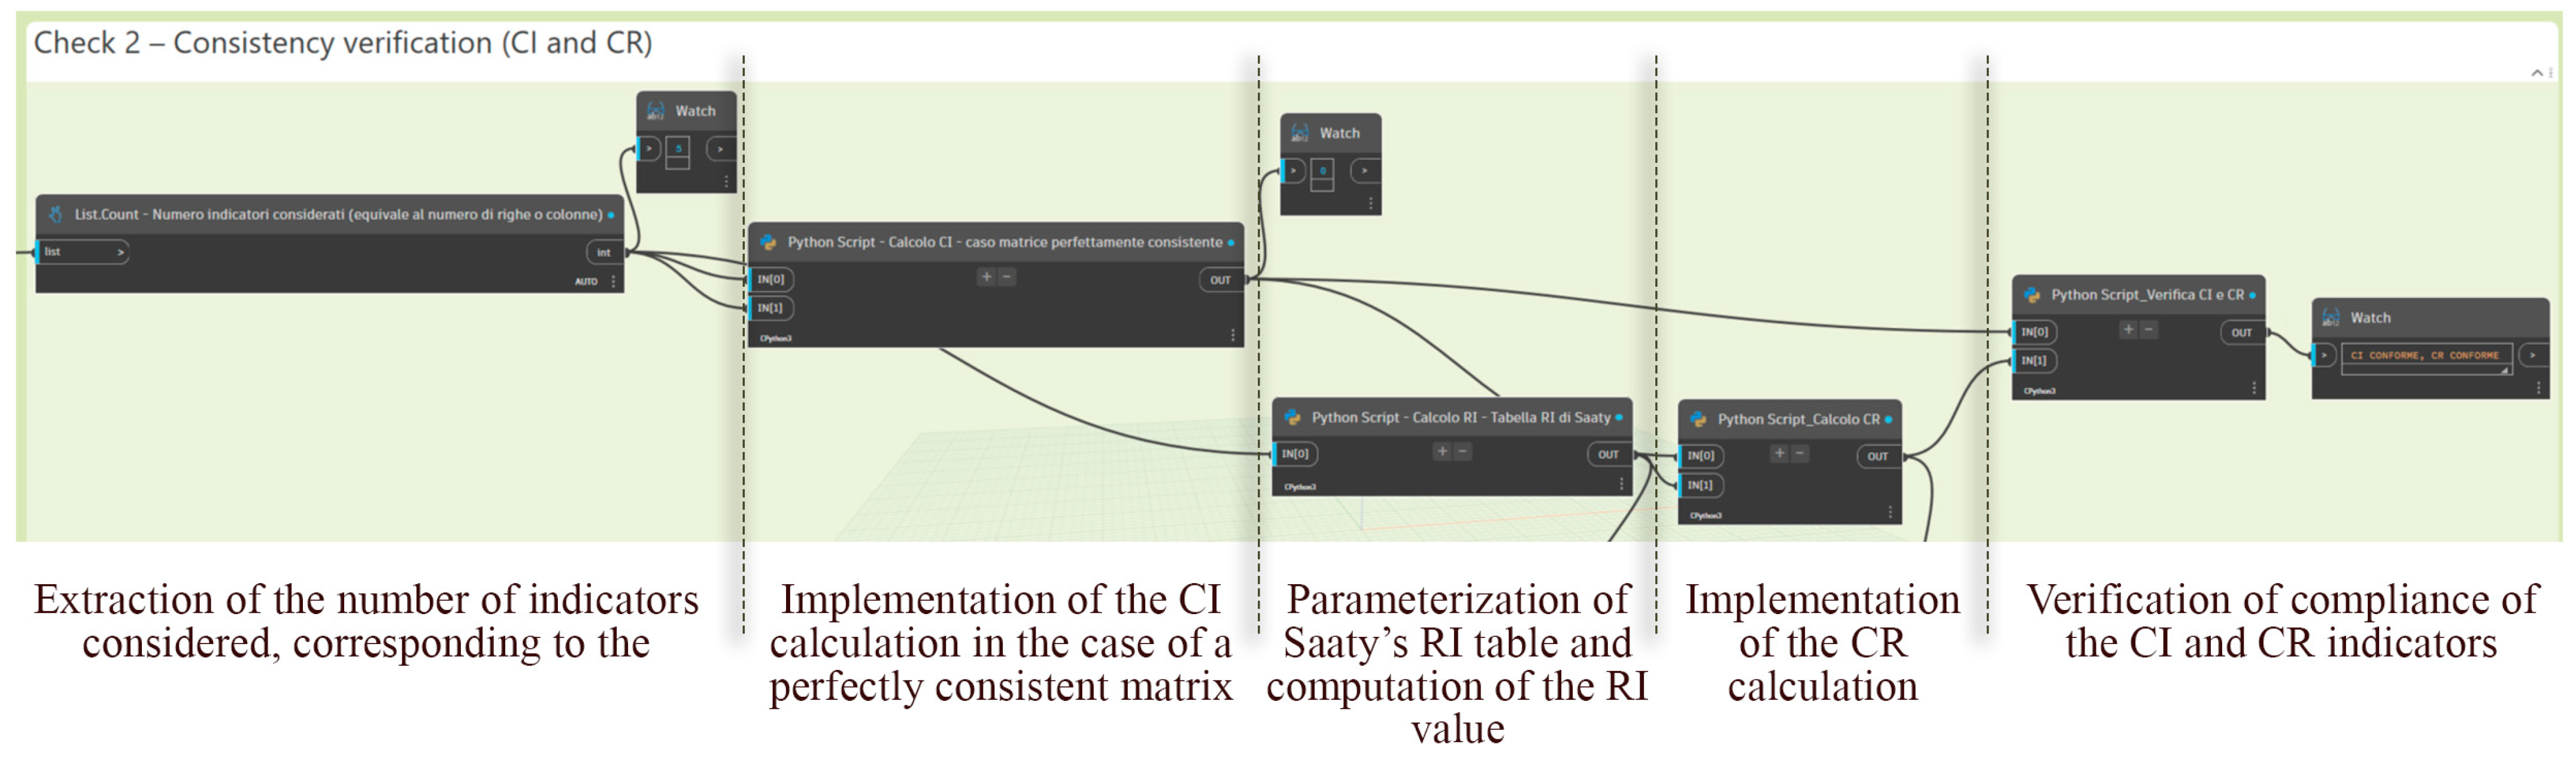
Figure A2, rows are extracted and summed to obtain the priority vector representing each criterion’s relative importance. A “Python” node verifies that the total weight equals 1 and returns a “compliance” or “non-compliance” outcome. Consistency is then assessed through the
CI and CR (
Figure A3). The
CI is calculated as:
where
is the maximum value of the comparison matrix and
is the number of criteria. Since the matrix is constructed according to an exact multiplicative relationship, λ
max equals
n, resulting in
CI = 0 and perfect consistency. The CR is computed as the ratio of
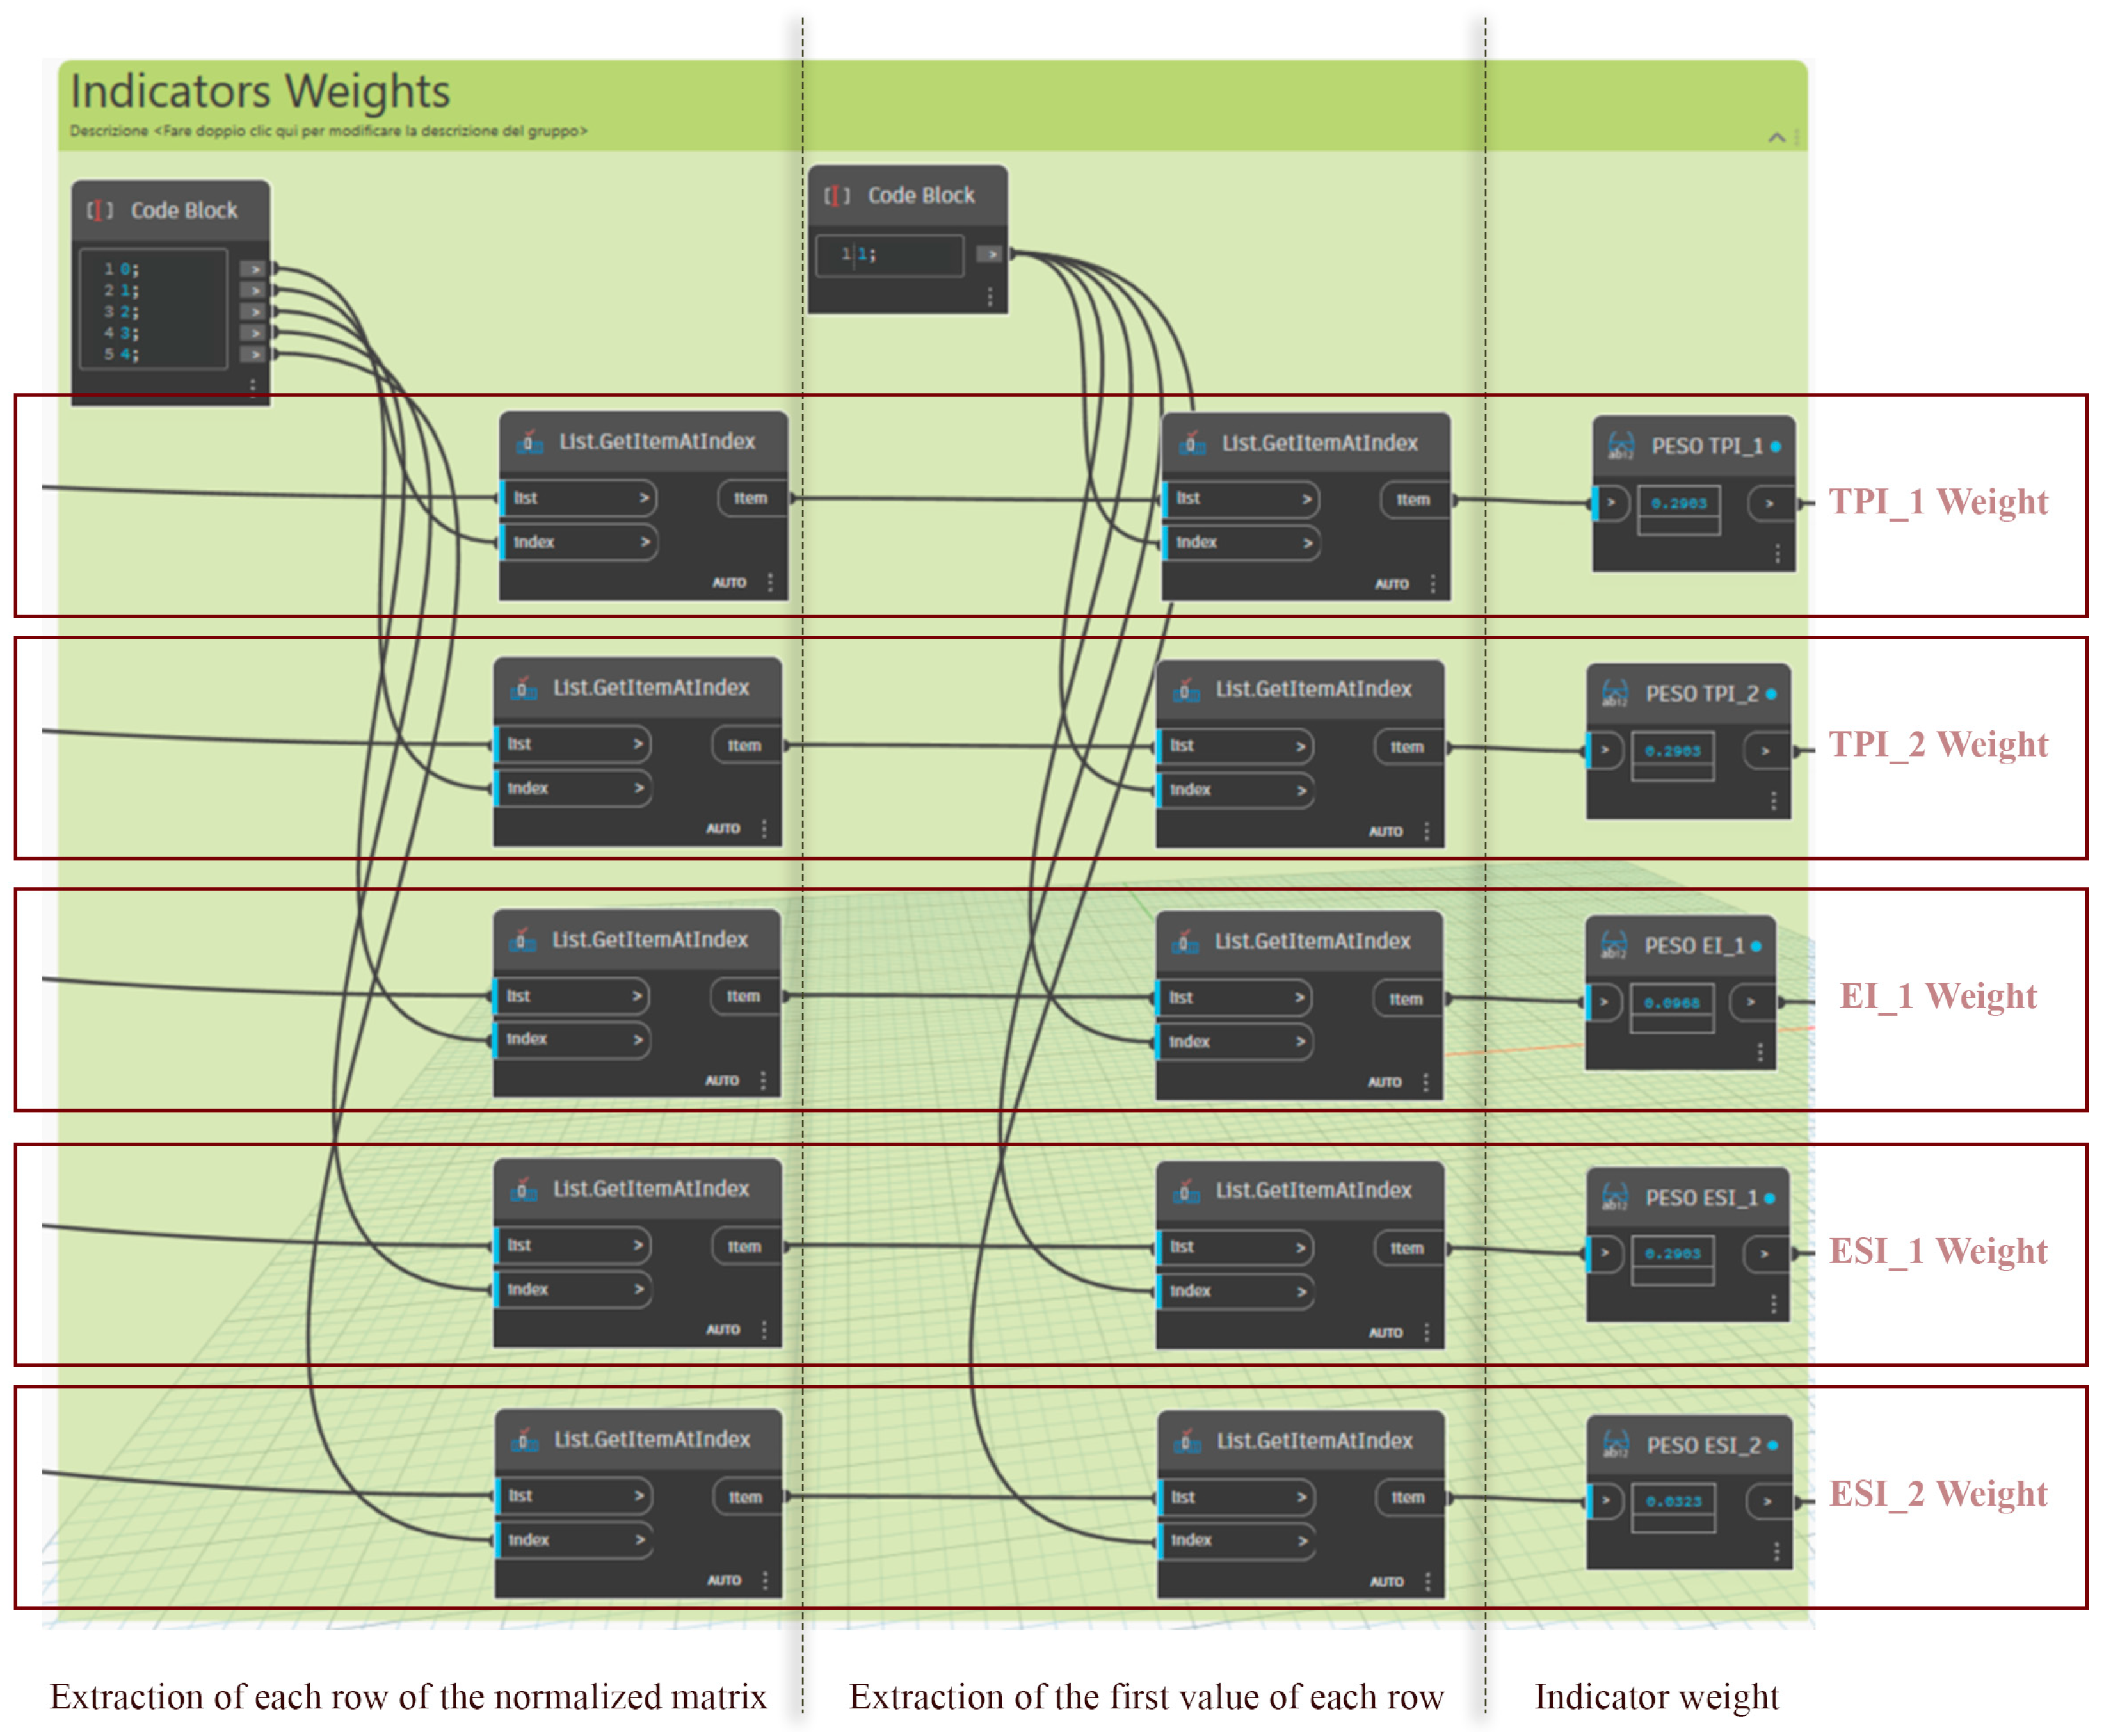
CI to Random Index (RI), which is automatically retrieved from the number of indicators. According to Saaty’s rule, CR ≤ 0.10 indicates acceptable consistency. Given the constant rows of the normalized matrix, indicator weights are automatically extracted as stable and unique values (
Figure A4).
3.4.2. AHP Implementation and Final Ranking of Alternatives
Within the AHP framework, indicators are classified as cost or benefit criteria to define their direction of preference and enable coherent normalization. This distinction is necessary because the five indicators obtained for each stratigraphy are expressed in different units and follow different optimization directions.
In this study, Periodic Thermal Transmittance (TPI_1) and Material Acquisition Cost (EI_1) are treated as cost criteria, since lower values indicate better performance. Conversely, Wall Surface Mass (TPI_2), the CAM indicator (ESI_1), and the LEED indicator (ESI_2) are classified as benefit criteria, as higher values correspond to improved performance.
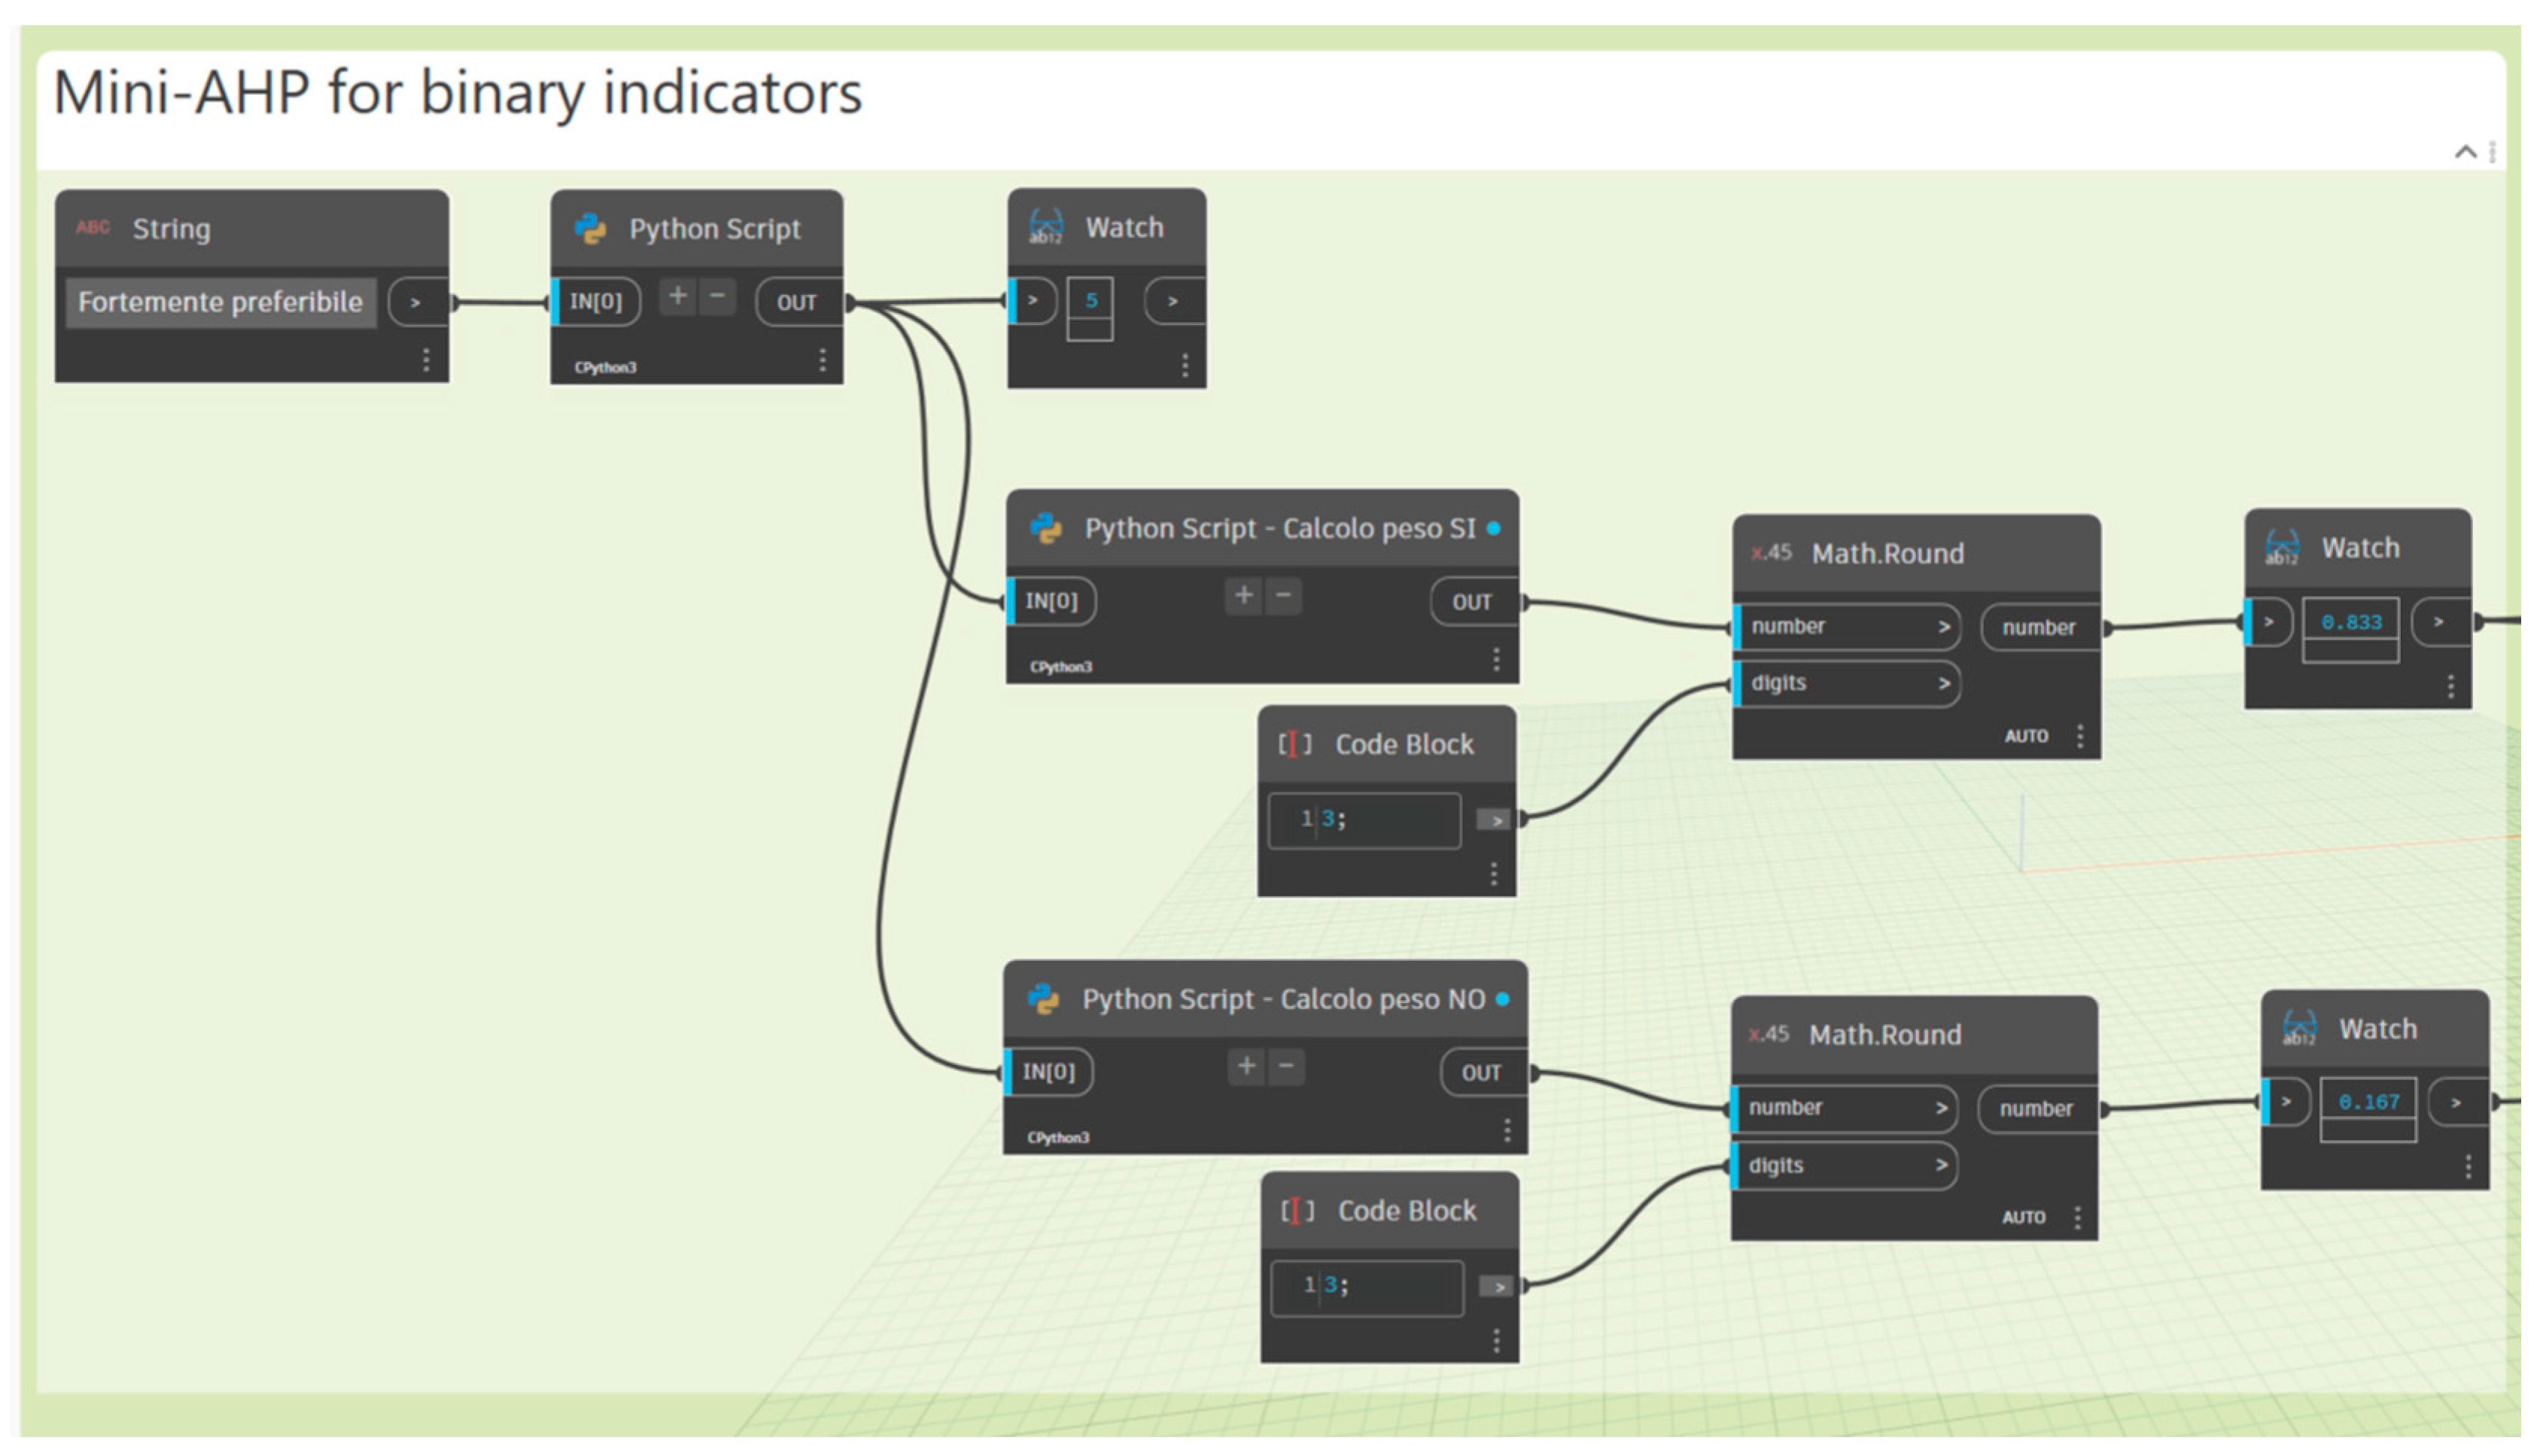
For the binary indicator ESI_1, a simplified AHP procedure is implemented in Dynamo to convert Yes/No conditions into numerical scores (
Figure A5). The associated weights are computed as:
where
represents the degree of preference of the “
Yes” condition over the “
No” condition according to Saaty’s scale,
and
are the normalized weights associated with the “
Yes” and “
No” conditions. The appropriate weight is assigned according to the observed condition.
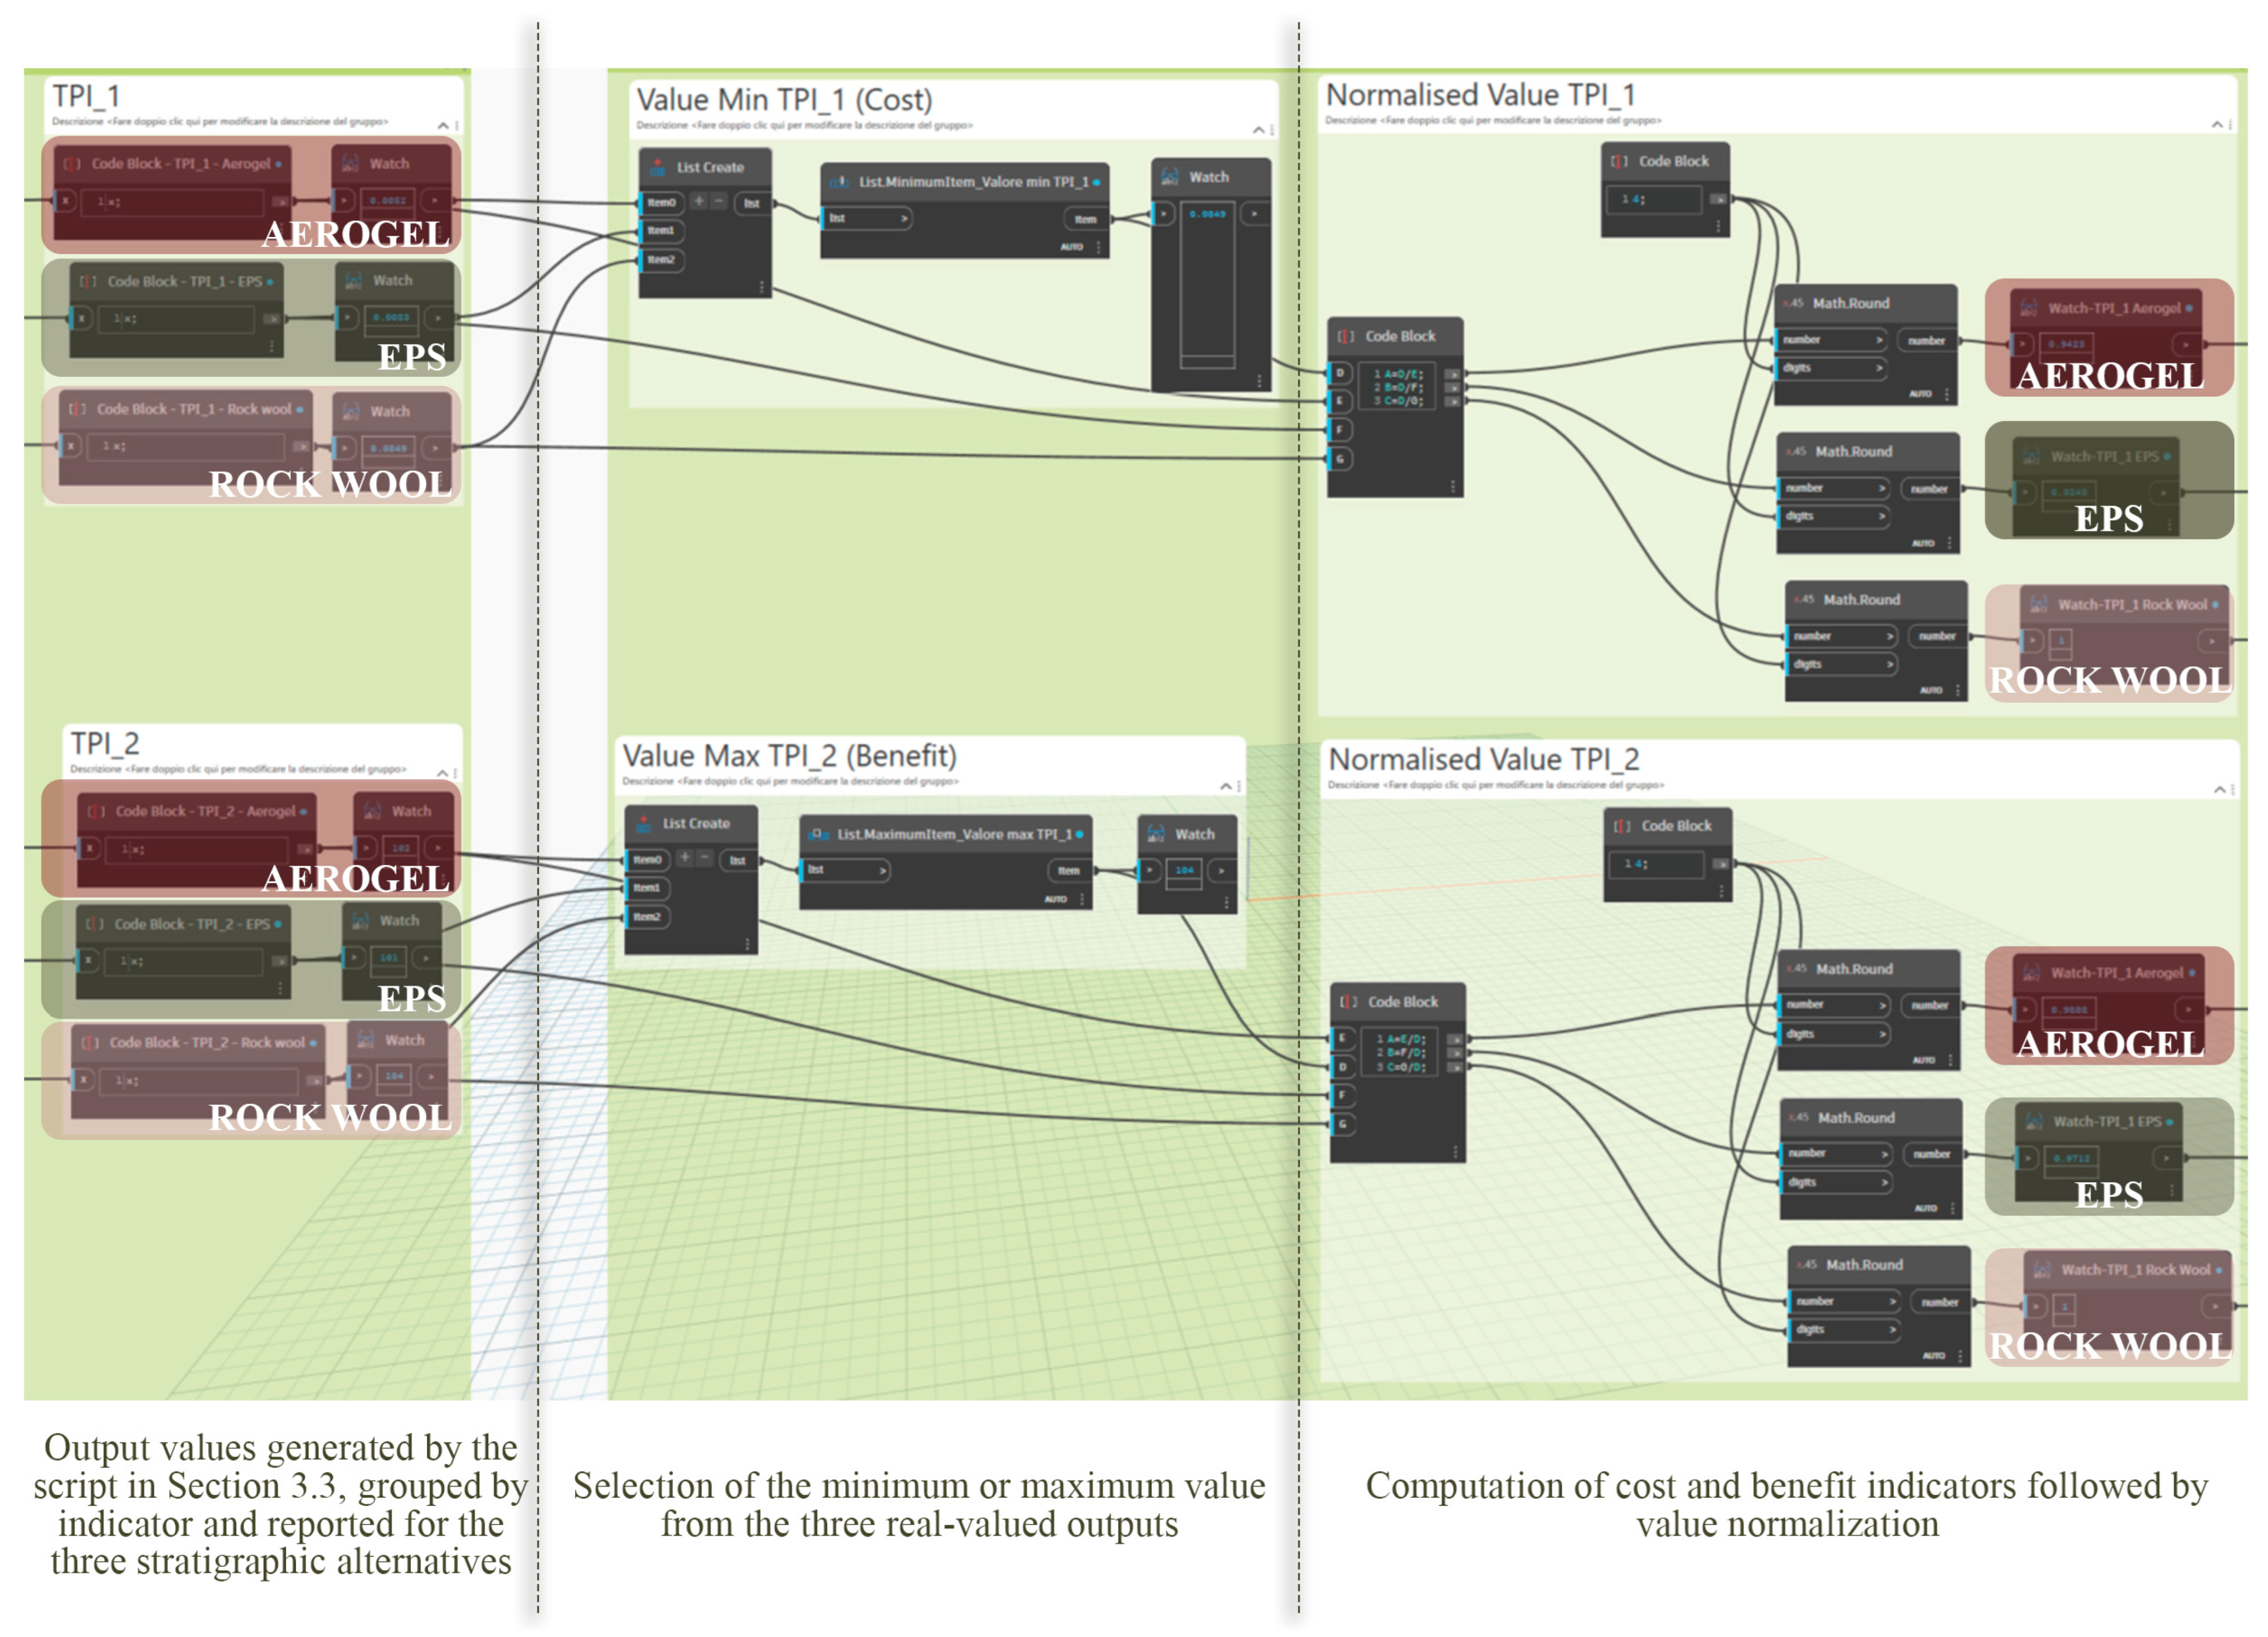
Subsequently, a parametric script in Dynamo is structured to calculate cost and benefit values. This process is shown in
Figure 10 as an example for the cost indicator TPI_1 and the benefit indicator TPI_2.
Cost indicators are normalized using inverse normalization, dividing each alternative’s value by the minimum observed value, thereby assigning the highest score to the most advantageous solution. Benefit indicators are normalized by dividing each value by the maximum observed value, assigning 1 to the best-performing alternative and proportionally lower values to the others.
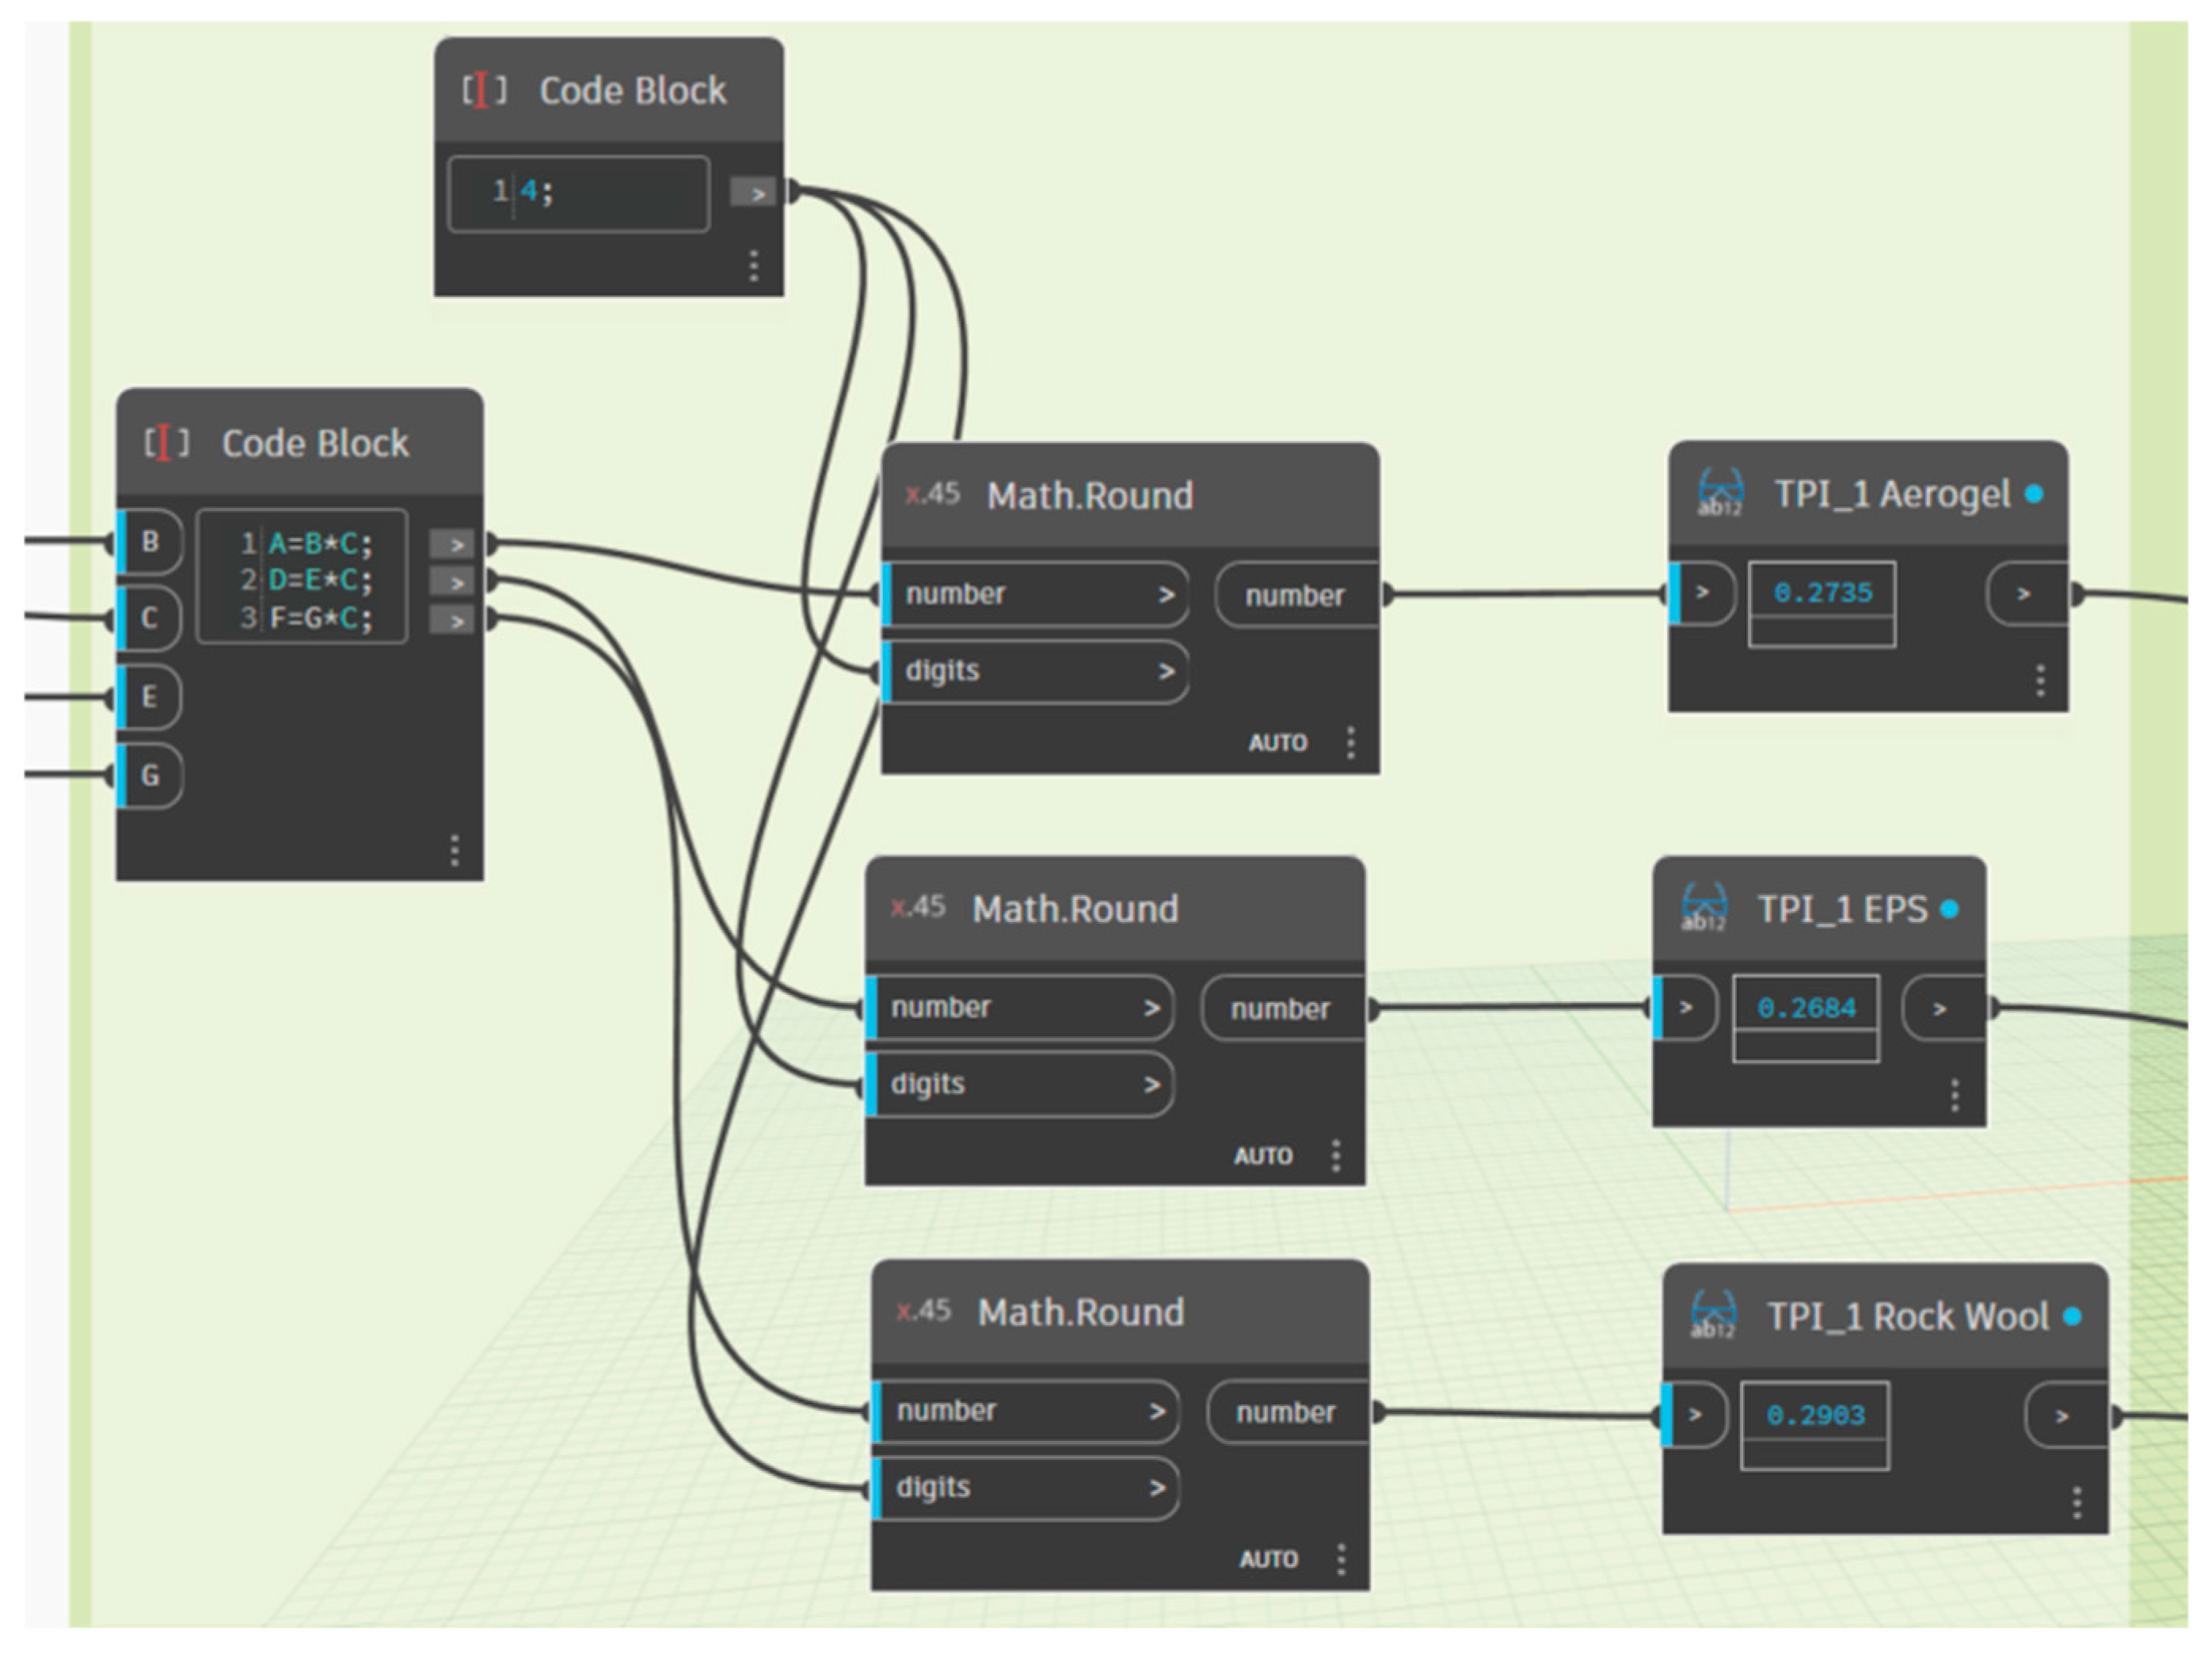
Once normalized, indicator values are multiplied by the AHP-derived weights through a “Code Block” node, ensuring that each indicator contributes proportionally to its relative importance (
Figure A6). The procedure is applied to all five indicators across the three wall configurations.
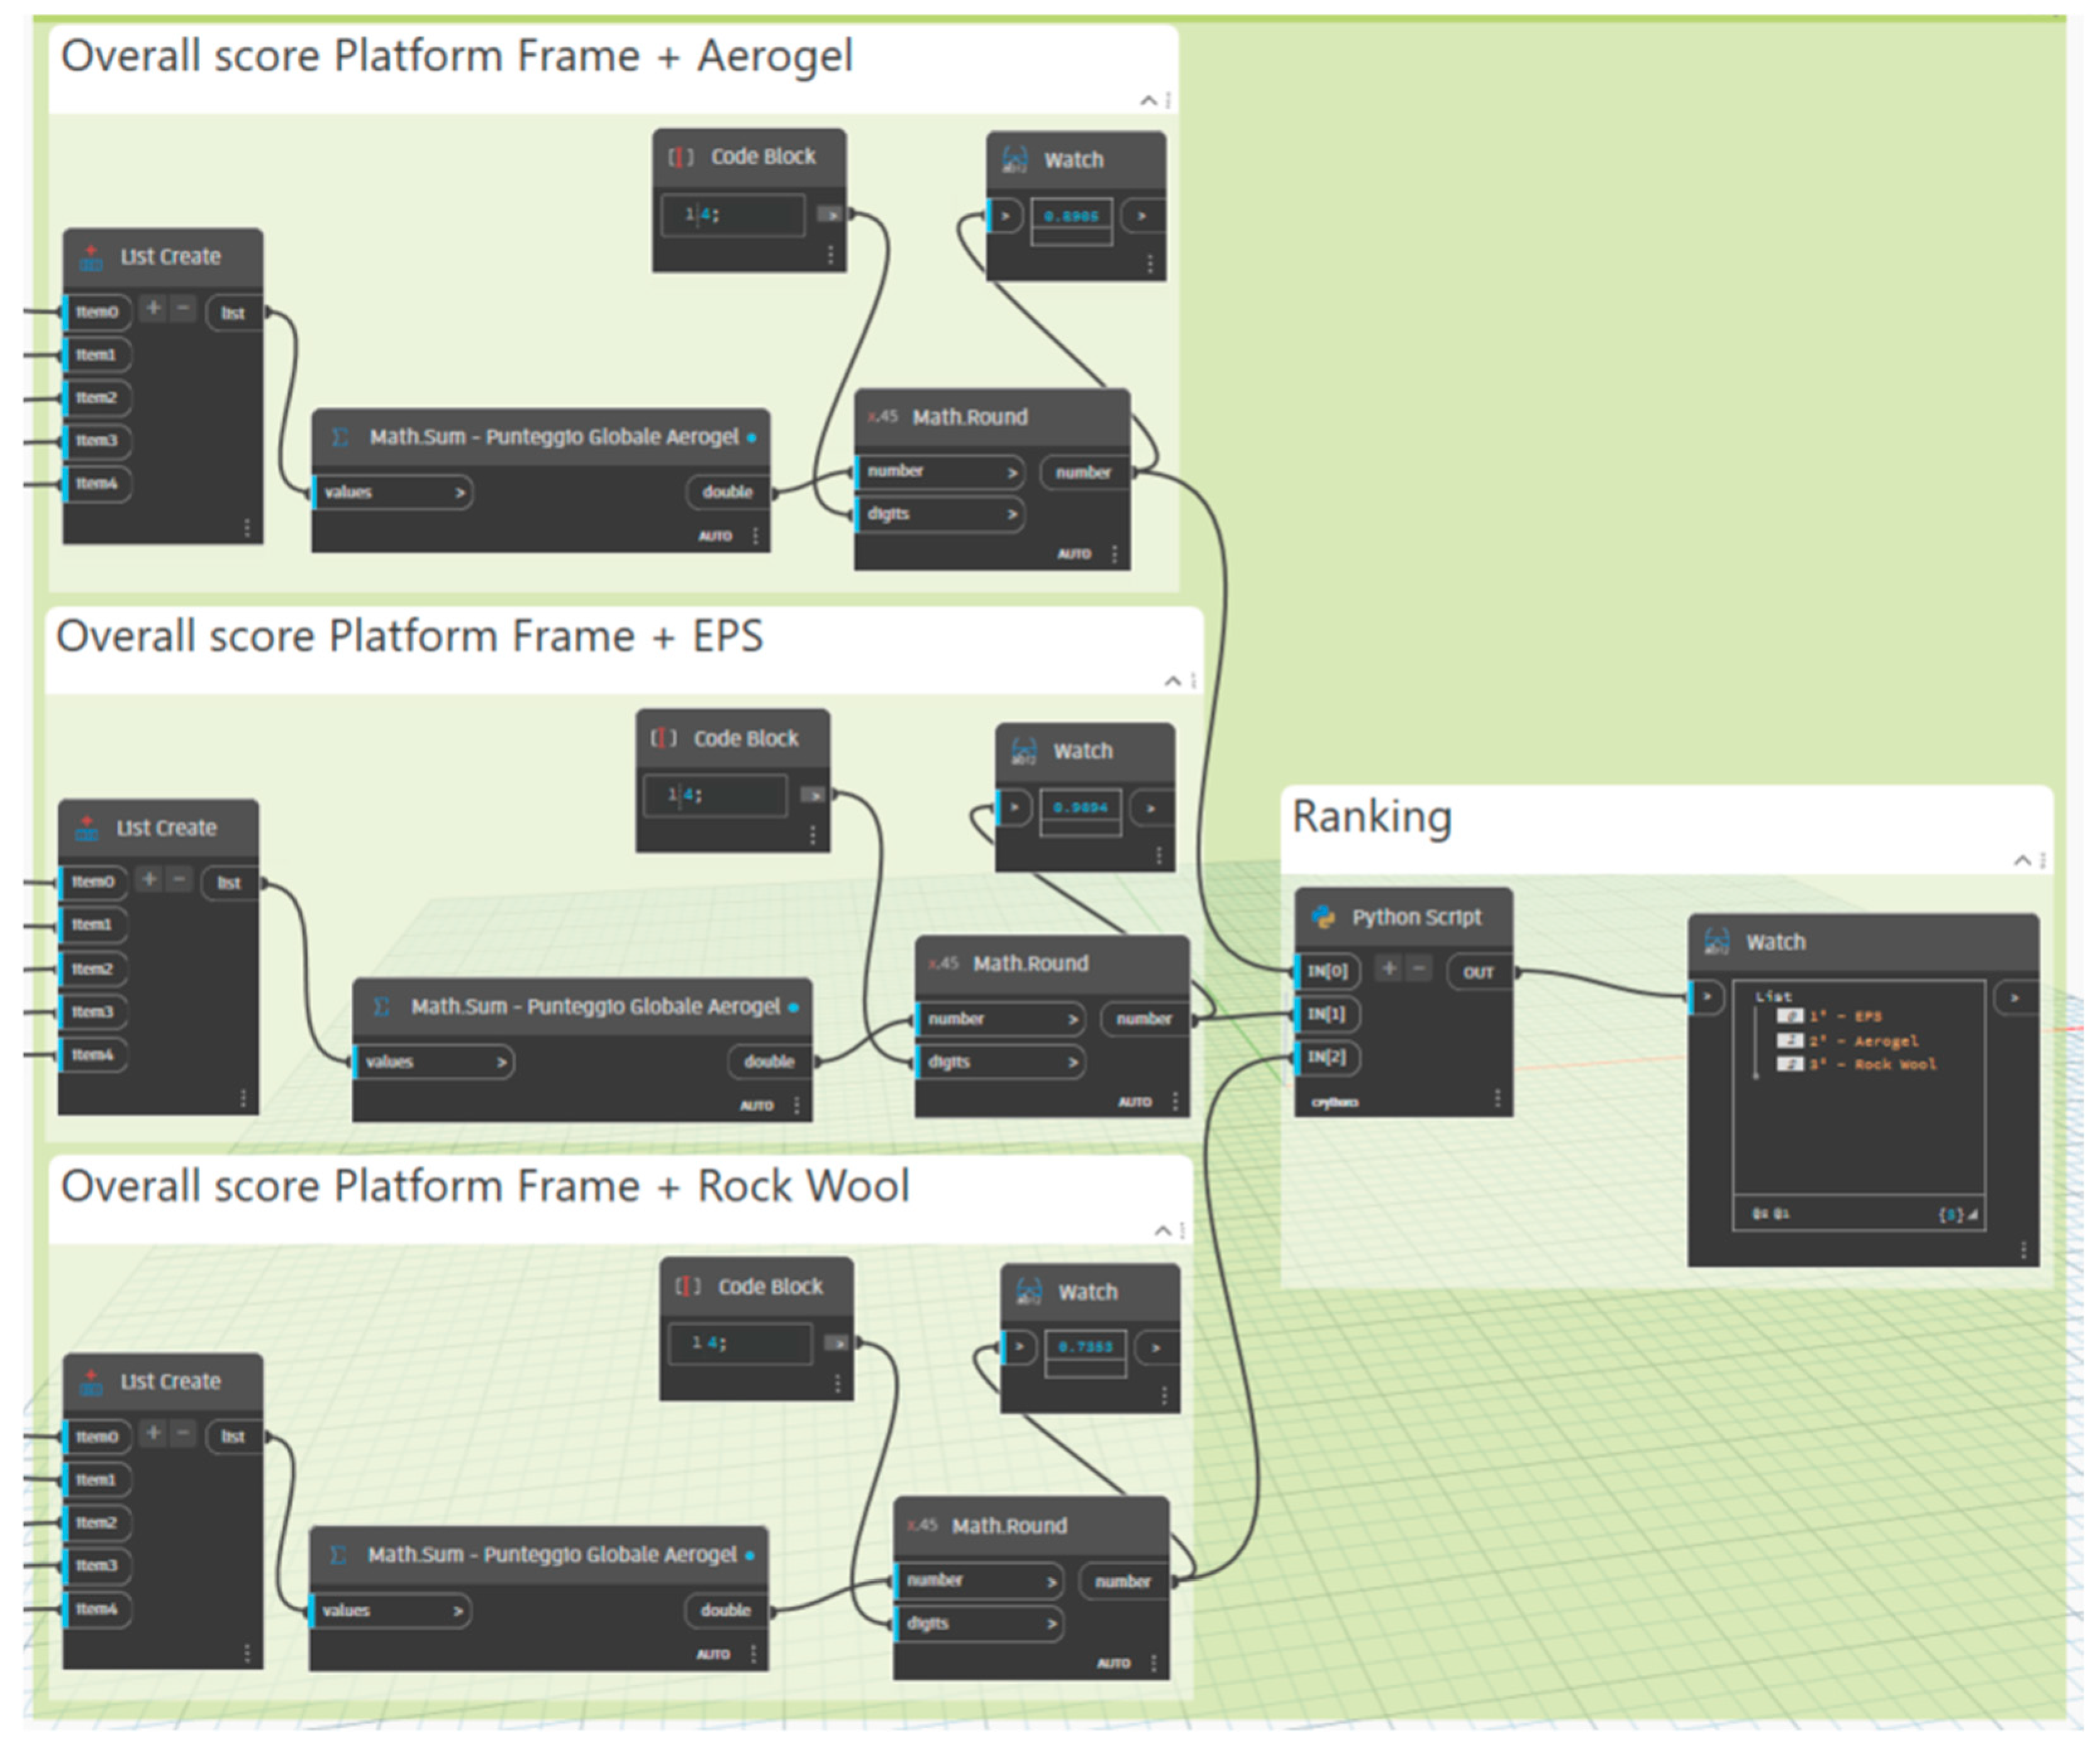
The weighted values are then aggregated for each stratigraphy using “List.Create” and summed via “Math.Sum” to obtain an overall performance score. A “Python” node compares the three scores, ranks the alternatives, and identifies the preferred solution as the one with the highest value, consistent with the defined priorities (
Figure A7).
This script enables a robustness check as part of the decision-making process to verify the stability of the identified solution with respect to limited variations in the criterion weights. This analysis assesses the sensitivity of the ranking of the alternatives to the initial assumptions of relative importance. It verifies that the selected solution is independent of a specific weight configuration. The robustness check is implemented by varying the weights in the AHP pairwise comparison matrix within a ±10% range. For each variation, the weights are renormalized, and the alternative scores are recalculated. The automation of the process allows the analysis to be repeated in real time, ensuring transparency and replicability of the results.
4. Results
4.1. Comparison of Indicator Values Across External Wall Alternatives
This section presents the results obtained from applying the proposed BIM-based automated workflow to the comparative evaluation of the three alternative wall stratigraphies. The selected wall configurations are defined considering typical design constraints related to thermal performance, regulatory compliance, and material availability in a Mediterranean climatic context.
Table 3 summarizes the parametric indicators obtained through the BIM-based workflow.
The values obtained for the TPI_1 indicator in the three stratigraphic solutions comply with the legal limits established by D.M. 28/10/2025, thereby demonstrating compliance with respect to the thermal performance of the building envelope. Moreover, a slight performance advantage of rock wool over Aerogel and EPS is observed. The TPI_2 indicator assumes values lower than the regulatory limit of 230 kg/m2 in all cases. However, this condition does not constitute an element of non-compliance, since D.M. 28/10/2025, the alternative compliance of performance indicators, making the fulfillment of only one of the two requirements sufficient. For TPI_1 and TPI_2, the automation enables the direct and parametric extraction of material physical properties from the BIM model, their processing through consolidated calculation procedures, and the automatic verification of compliance with the limits set by D.M. 28/10/2025. The integration between Dynamo and Excel keeps regulatory sources traceable while avoiding manual interventions in formulas. At the same time, the BIM-based workflow enables the automated extraction from the Excel calculation tool of the minimum thickness required to achieve the thermal performance requirements, corresponding to the tabulated values, as well as the thermal transmittance. In particular, the required thickness is 0.7 cm for Aerogel, 2 cm for EPS, and 3 cm for Rock Wool. This result reflects the different thermophysical properties of the materials, particularly thermal conductivity. From a design perspective, the reduction in thickness required by the Aerogel solution affects envelope bulk, especially in contexts where available space is limited, such as retrofit interventions, refurbishments of existing buildings, or dry construction systems. In such cases, insulation thickness becomes a critical parameter.
Regarding the wall’s thermal transmittance, the calculated values are 0.243 W/m2K for the Aerogel solution, 0.247 W/m2K for EPS, and 0.243 W/m2K for rock wool. All values are below the legal limit of 0.26 W/m2K established by the D.M. 28/10/2025, confirming the compliance of the analyzed solutions with the performance requirements. Thermal transmittance and insulation thickness are not included as indicators in the MCDM process, since they are used as design and regulatory verification parameters rather than as comparative evaluation criteria. Thermal transmittance is used to verify compliance with the legal limit of 0.26 W/m2K. At the same time, thickness is treated as a dependent variable, calculated based on the material to achieve the required performance.
For the environmental indicator ESI_1, the automated extraction through Dynamo enables the formalization of the qualitative and quantitative CAM requirements into computational rules, translating complex regulatory criteria, such as the absence of SVHC substances, the percentage of recycled material, or the presence of the DoP and CE marking, into automated verification logics implemented in Python nodes. In this way, the compliance of insulating materials is not assessed ex post. Still, it has been made a verifiable, dynamically updatable property within the information model, strengthening the role of BIM as a decision-support tool in the design process. From a compliance perspective, the analysis shows that the Aerogel and EPS solutions meet the considered requirements, whereas the rock wool solution does not satisfy the analyzed CAM criteria. It is, however, necessary to specify that this outcome is strictly related to the environmental performance declared in the technical datasheets of the specific product under examination. Consequently, the compliance and non-compliance observed should not be interpreted as an intrinsic characteristic of the material in a general sense, but as a condition referring to the specific solution selected within the study.
For the ESI_2 indicator, the comparison between the baseline configuration and the alternative solutions shows that, for Aerogel, EPS, and Rock Wool, all percentage reductions in the individual environmental indicators exceed 10%, thus satisfying the requirement defined by the LEED MRc1 criteria. In particular, the decrease in ATP ranges from 10.24% to 11.45%, the reduction in GWPT exceeds 86% in all cases, and the decrease in NEDT ranges from 77.53% to 78.46% (
Table 4).
The average percentage reduction, calculated as the arithmetic mean of the reductions in the three indicators, is equal to 58.94% for Aerogel, 58.47% for EPS, and 58.35% for rock wool, confirming a significant overall environmental improvement compared to the baseline and supporting the compliance of the analyzed solutions within the adopted BIM-based evaluation framework. Moreover, for ESI_2, Dynamo plays a strategic role in coordinating the integration between the BIM model and the LCA analysis conducted via the Tally plug-in. The automation enables a systematic comparison of the environmental performance of different wall configurations against a reference baseline, managing, in a parametric manner, the extraction of data from LCA outputs, the comparison across impact categories, and the automatic verification of compliance with LEED MRc1 requirements. This approach allows the LCA evaluation to be incorporated directly into the design workflow, overcoming the limitations of separate, post-process analysis.
For the EI_1 indicator, the price of Aerogel is 100 €/m2, while the EPS and rock wool solutions cost 15 €/m2 and 10 €/m2, respectively. This difference reflects the different nature of the materials, as well as the degree of maturity and the extent of diffusion of the respective production technologies. The higher cost of Aerogel is attributable to the material’s advanced properties and the complexity of its production process, which enable high thermal performance at reduced thicknesses. Conversely, EPS and rock wool are widely consolidated materials in the construction sector, characterized by industrialized production chains and high market availability, which contribute to lower unit costs.
Overall, the automation implemented with Dynamo enables the structuring of a bidirectional, scalable workflow, in which the BIM model and the Dynamo parametric environment are not merely information containers but an active system for performance verification and control. The possibility of automatically updating indicators and compliance statuses based on design variations makes the process more efficient, transparent, and replicable, facilitating rapid, informed comparisons among alternative solutions and supporting the adoption of performance-based and environmental criteria in the early stages of the decision-making process.
4.2. Automated AHP-Based MCDM and External Wall Alternative Ranking
The automation implemented in Dynamo enables the structured application of the AHP method, integrating the outputs of
Section 3.3 (highlighted in
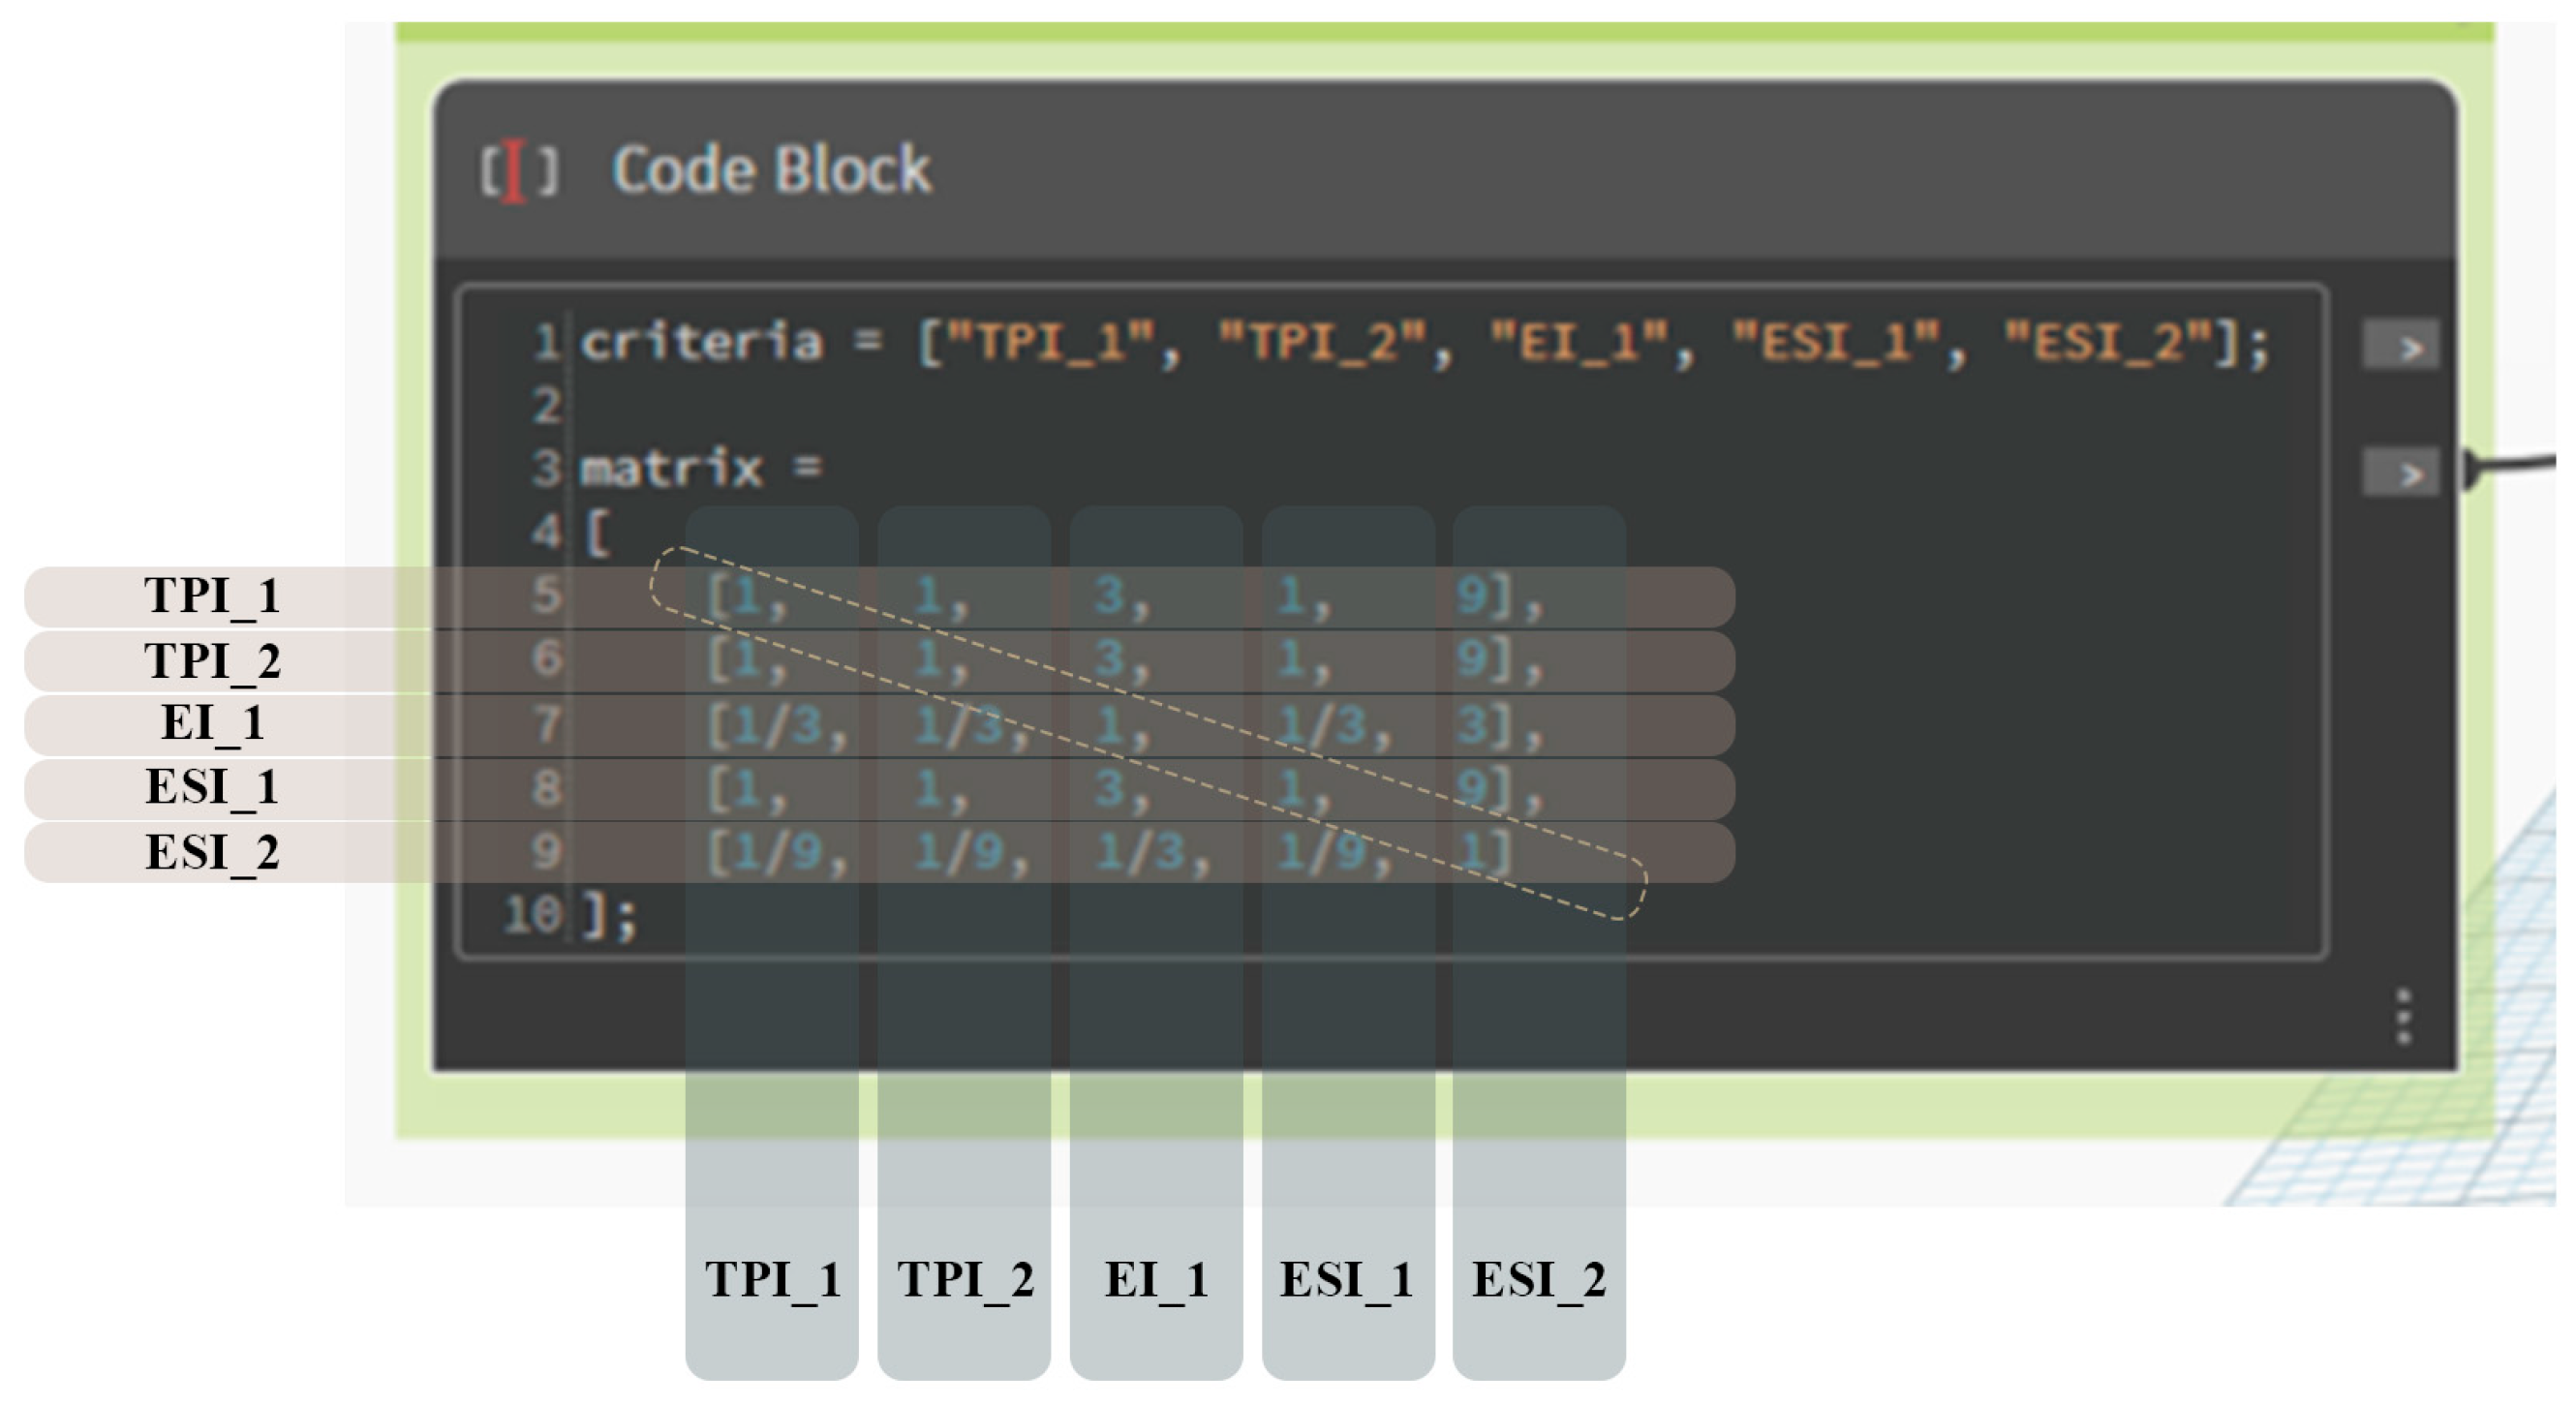
Table 3) within a single parametric workflow. The pairwise comparison matrix is automatically constructed using the Saaty scale, translating design priorities into computable form (
Figure 11).
TPI_1, TPI_2, and ESI_1 are assigned equal and dominant importance due to regulatory relevance. EI_1 is considered moderately less important, while ESI_2 plays a secondary, improvement-oriented role. Accordingly, the criteria TPI_1, TPI_2, and ESI_1 are evaluated as moderately more important than the economic indicator EI_1, corresponding to a value of 3 in the pairwise comparisons. EI_1 is considered moderately more critical than ESI_2, which is also assigned a value of 3. For multiplicative consistency, the main indicators are assessed as more important than ESI_2, a relationship formalized by assigning the value 9. The use of reciprocal values allows the matrix to be completed symmetrically and coherently.
In this study, CI = CR = 0. This result indicates that the judgments in the pairwise comparison matrix are logically consistent and satisfy the transitivity requirement of the method. In particular, the relationships of relative importance among the criteria are free from internal contradictions, as each comparison is compatible with those indirectly derived from the other judgments. The condition CI = 0 implies that the maximum eigenvalue of the matrix equals its dimension. At the same time, CR = 0, which is well below the commonly adopted acceptability threshold of 0.10, confirms the reliability of the obtained weights. Achieving this result required several iterative tests during the application phase, enabled in real time by the Dynamo automation, which allowed real-time recalculation and verification of the consistency indices.
The procedure assigns weights of 0.2903 to the criteria TPI_1, TPI_2, and ESI_1, confirming their equivalence and dominant role in the evaluation. The economic criterion EI_1 is assigned a weight equal to 0.0968, while the indicator ESI_2 is characterized by a weight equal to 0.0323, consistent with the lower influence attributed to it during the preference definition phase. In the final phase, the automation implemented in Dynamo enables the systematic application of AHP weights to normalized indicator values, aggregating the partial contributions into an overall score for each stratigraphic alternative.
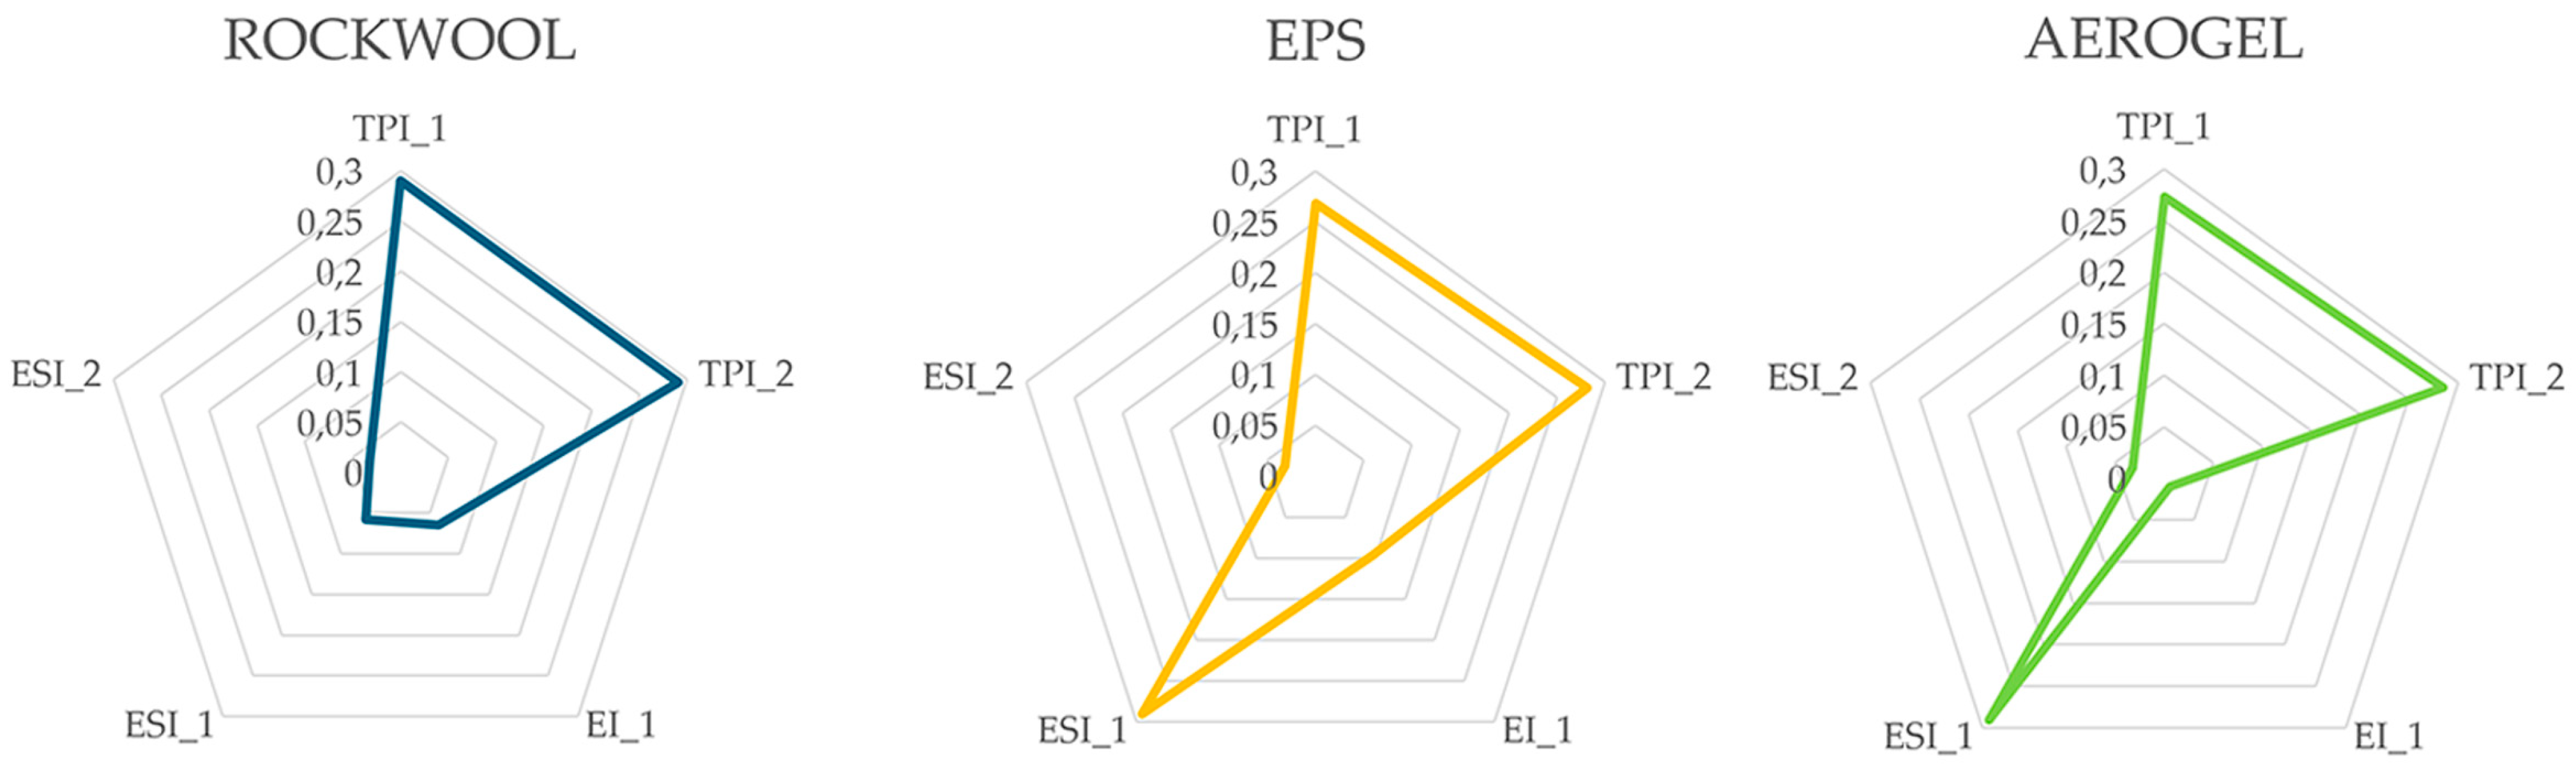
As highlighted in
Figure 12, in the TPI_1 indicator, the values are 0.2735 for Aerogel, 0.2684 for EPS, and 0.2903 for Rockwool. The highest performance is therefore recorded for Rock Wool, although the differences among the three alternatives are limited. A similar trend is observed in TPI_2, with values of 0.2847 for Aerogel, 0.2819 for EPS, and 0.2903 for Rock Wool. Rockwool is favored, but the differences remain marginal, indicating substantial alignment among the alternatives on the more technical criteria. A change is observed in the EI_1 indicator. A low value of 0.0097 is recorded for Aerogel, 0.0645 for Rockwool, and the highest score, 0.0968, is achieved by EPS. This marked difference is considered central in the overall outcome. Aerogel is strongly penalized under this indicator, and Rockwool is also disadvantaged compared to EPS. In the ESI_1, values of 0.2903 are obtained for both Aerogel and EPS, whereas a considerably lower value of 0.0582 is recorded for Rockwool. Under this indicator, Rockwool is at a disadvantage, while Aerogel and EPS are equally favored. Finally, for ESI_2, nearly identical values are recorded: 0.0323 for Aerogel, 0.0320 for EPS, and 0.0320 for Rockwool. Since this indicator is also assigned the lowest weight among the considered criteria, its influence on the final ranking is regarded as limited.
By summing the contributions of all criteria, overall scores of 0.9694 for EPS, 0.8905 for Aerogel, and 0.7353 for Rockwool are obtained. EPS is therefore ranked first, followed by Aerogel and then Rockwool. Moreover, the ranking highlights that the preferred solution is not necessarily the one with the highest performance in a single indicator, but rather the one that offers the best compromise among regulatory requirements, thermal-physical performance, sustainability, and economic feasibility. The result further confirms the effectiveness of the AHP approach integrated within a BIM-based environment in supporting informed design decisions that are coherent with a multidimensional performance framework.
Finally, the introduction of a robustness check procedure, also implemented within the same script, further strengthens the reliability of the results by allowing the stability of the optimal solution with respect to controlled variations in the weights to be verified. Each criterion weight is independently varied by ±10%, while the remaining weights are proportionally adjusted to maintain a unit total weight. The resulting scores are then recalculated and compared with the baseline configuration (
Figure 12). In the baseline scenario, global scores of 0.9694 for EPS, 0.8905 for Aerogel, and 0.7353 for Rock Wool are obtained, resulting in the ranking EPS > Aerogel > Rock Wool. Across all tested scenarios, the scores vary within limited ranges: EPS between 0.9617 and 0.9770, Aerogel between 0.8814 and 0.8994, and Rock Wool between 0.7276 and 0.7429. Although slight variations in the scores are observed when the weights of EI_1 and ESI_1 are modified, the relative ordering of the alternatives is not affected. Overall, the ranking of the alternatives remains unchanged in all tested scenarios, with EPS consistently achieving the highest score, followed by Aerogel and Rock Wool. These results confirm the robustness of the proposed AHP-based evaluation framework with respect to moderate variations in the decision-maker’s preferences. In this way, Dynamo is not limited to supporting numerical computation but is employed as an advanced decision-support tool, capable of ensuring transparency, methodological robustness, and direct integration between multicriteria evaluation and the BIM environment.
5. Discussion
5.1. Positioning of the Present Research Within the Previous Studies
The present study proposes a parametric workflow integrated into BIM to support the evaluation of alternative building-envelope configurations. Thanks to the modular structure of the indicators, the automation of the information flow, and the integration of multi-criteria analysis, a flexible framework can be adapted to different design configurations, regulatory contexts, and performance objectives while maintaining continuity throughout the decision-making process.
The first gap identified in the literature concerns the limited set of indicators considered in several studies, which often neglects other relevant evaluation dimensions. Despite the workflows proposed by Balo et al. [
32], in which only energy indicators are considered, by Zhang et al. [
33], where only technical and economic indicators are included, and by Zigmund et al. [
34], where only cost indicators are evaluated, in this research a set of multidimensional indicators (TPI_1, TPI_2, ESI_1, ESI_2, and EI_1) is considered. These indicators enable an integrated evaluation of building envelope performance by simultaneously considering thermal, environmental, and economic aspects. This multidimensional structure enables the overcoming of the limitations of single-criterion approaches and supports a more comprehensive comparison of design alternatives, ensuring that the decision-making process reflects multiple performance dimensions relevant to sustainable building design.
The second gap highlighted in
Section 2 concerns the reliance on external information flows for calculating indicator values, since performance data are often derived from heterogeneous sources not natively integrated within the BIM environment. Within this perspective, a workflow interoperable within the BIM environment is developed in the present study. The calculation and verification of the indicators are structured through parametric scripts developed in Dynamo, which enable a continuous data flow between Autodesk Revit, Microsoft Excel, and the Tally plug-in. This approach avoids using external tools such as ECHO for acoustic evaluation and deriving data manually from EPDs, as in the work of Cascone et al. [
35]. Similarly, Marzouk et al. [
36] and Jalilzadehazhari et al. [
37] rely on multiple data exchanges between BIM models and external simulation environments, such as IESVE, DesignBuilder, and EnergyPlus, through gbXML and IDF file conversions. In these approaches, the evaluation process depends on sequential data transfers across different platforms, which may compromise information continuity and increase the risk of inconsistencies. Comparable limitations are also observed in the frameworks proposed by Han et al. [
38], Fazeli et al. [
39], and Jalaei et al. [
40], in which external databases, spreadsheets, or additional software environments are required to compute performance indicators or to execute multi-criteria decision-making procedures. In contrast, the workflow proposed in this study aims to reduce reliance on fragmented information flows by integrating data extraction, indicator calculation, regulatory verification, and multi-criteria evaluation within BIM-based workflows through parametric Dynamo scripts and interoperable tools.
Finally, in this research, the AHP analysis is fully developed within the BIM-VPL environment through Dynamo, using advanced parametric scripts integrated with a Python node, thereby minimizing the manual operations observed in previous studies (third gap). For example, Tan et al. [
41] use BIM tools to support parameter weighting, but the comparative evaluation and ranking of alternatives still rely on manual interpretation of the results. Similarly, Saud et al. [
42] combine BIM-based data extraction with MCDM techniques; however, the decision-making logic remains external to the BIM environment, resulting in a workflow that is only partially integrated. Mohanta et al. [
43] propose a decision-support system based on the Best–Worst Method (BWM), but the multi-criteria analysis is implemented manually in MS Excel, thereby reducing automation and increasing the risk of errors. In contrast, the workflow proposed in this study implements the entire MCDM procedure directly within Dynamo, enabling the calculation of indicator weights, normalization aggregation, and ranking of alternatives through parametric scripts integrated with BIM. This approach ensures a higher level of automation and an interoperable workflow, allowing the decision-making process to be embedded directly within the BIM-based design framework.
5.2. Limitations and Future Research Directions
Despite the high level of integration, the framework presents some limitations and, consequently, several opportunities for future research.
First, the selection of indicators, although multidimensional, remains focused on a limited number of performance aspects, excluding relevant properties for thermal insulation materials, such as perceived fire resistance, hygrothermal behavior (particularly the verification of surface and interstitial condensation), acoustic performance, material durability, and life-cycle costs (LCC), which could influence design decisions. However, the parametric, automated, and modular structure of the workflow enables scalability and adaptability, allowing the integration of additional indicators and evaluation criteria in the future without altering the overall methodological framework.
Moreover, the AHP weight attribution is based on qualitative assumptions drawn from literature and regulatory hierarchy. Still, it does not account for variations in design context, building typology, or stakeholder priorities. In future developments of the framework, this step could be further supported by structured expert elicitation and stakeholder validation processes to enhance the robustness and transparency of the weighting procedure. Additional steps in the development of the framework could concern the introduction of Artificial Intelligence (AI) and Machine Learning (ML) techniques to automatically determine criterion weights, thereby overcoming the static setting of traditional AHP. Training models on validated case-study datasets could enable the identification of recurring patterns in performance indicators and dynamically adapt the decision-making process to the project context.
Another limitation concerns the robustness analysis, which is currently semi-automatic and requires manually varying the pairwise comparison matrix to assess the sensitivity of the ranking results. Future developments could therefore include custom Python nodes for weight sensitivity analysis.
Although the case study demonstrates the proposed workflow within the BIM environment, it does not capture the variability across different wall typologies, climatic conditions, and design contexts. Future research could therefore extend the framework to additional envelope systems, material combinations, and climates to further assess its scalability and replicability.
A further limitation concerns the reliance on input data derived from product technical datasheets. Specifically, the workflow relies on multiple input parameters, such as thermophysical properties, environmental indicators, and economic data, that may vary significantly depending on the selected products, data sources, and updates to the underlying databases. This variability introduces a degree of uncertainty that may influence the resulting rankings.
As highlighted in
Section 5.1, the proposed workflow improves interoperability compared to previous studies. However, although data exchange is automated through Dynamo scripts, full integration within a single platform is not yet achieved. Future research could develop dedicated Revit plug-ins, ensuring interoperability through APIs and enabling open-source implementation and sharing via GitHub.
An additional research direction could focus on integrating the ex-post-performance verification phase by leveraging connections to the Internet of Things (IoT), Digital Twins, and in-use monitoring data. In this way, the BIM-MCDM workflow could evolve from a design support tool into an adaptive system for managing the building life cycle. Future research would further strengthen the framework’s contribution to the transition toward intrinsically data-driven decision-making processes oriented toward the overall quality of the built environment.
In conclusion, the BIM-MCDM workflow developed in this study can be considered as a potential technological basis for the future development of patented digital decision-support systems for building design. In recent years, several patented solutions have been proposed to integrate digital building models with automated performance analysis to support design optimization processes. For instance, the patent GB2584614B [
65], entitled “Optimising building energy use”, presents a digital platform in which building energy performance is improved through the integration of digital building models, data-driven analyses, and automated evaluation procedures that allow alternative strategies to be compared to identify optimal energy solutions. Similarly, the patent US20150363537A1 [
66], “Building information modeling system and method for building design and management”, describes a BIM-based framework in which building information is managed, and design decisions are supported through the integration of component data, analytical tools, and performance evaluation within a unified digital environment. Within this context, the methodology proposed in the present study aligns with these technological developments, as BIM modeling, parametric automation through VPL, and multi-criteria decision-making techniques are integrated into a single interoperable workflow, suggesting that further developments could lead to proprietary decision-support tools or patented digital platforms.
6. Conclusions
The study focuses on developing an integrated BIM-based methodology to optimize the selection of the best alternative among a set of external wall stratigraphies with alternating thermal insulation layers, addressing the growing demand for sustainable, energy-efficient, and economically feasible building design aligned with sustainability assessment principles. By integrating BIM with parametric scripts developed in Dynamo and MCDM analyses, specifically AHP techniques, a transparent and replicable Decision Support System (DSS) is developed that supports informed material selection and system configuration during the early stages of the architectural design process.
The considered stratigraphy is a platform-frame external wall, selected for its compositional flexibility. Within this context, three thermal insulation alternatives, Aerogel, EPS, and Rock Wool, are defined. The selection of evaluation indicators is carried out, organized into three thematic clusters: Thermal Performance Indicators (TPI_1 and TPI_2), Environmental Sustainability Indicators (ESI_1 and ESI_2), and an Economic Indicator (EI_1) (see
Section 3.1).
After the BIM model is developed in Autodesk Revit and the material database is customized with the required informational parameters (see
Section 3.2), two Dynamo scripts are structured to constitute the automated core of the proposed methodology. The first parametric script automates data extraction, indicator calculation, and regulatory compliance verification (see
Section 3.3). The workflow integrates Revit, Dynamo, Excel-based calculation tools, and the Tally plug-in to ensure coordinated management of heterogeneous indicators. Verification results are reimported into the BIM model, making compliance directly readable within the design environment. Thanks to its rule-based and parametric structure, the script is scalable and adaptable to different regulatory contexts by modifying thresholds without changing the workflow architecture. The second script implements the AHP-based MCDM technique entirely within Dynamo (see
Section 3.4). Pairwise comparisons among five indicators (TPI_1, TPI_2, EI_1, ESI_1, ESI_2) are structured using the Saaty scale, and weights are calculated through matrix normalization with automatic consistency checks (
CI and CR). Indicators are classified as cost or benefit, normalized, weighted, and aggregated to compute an overall score. The ranking of alternatives is automatically generated through Python nodes, including a robustness check.
Results demonstrate the effectiveness of the BIM-based workflow in enabling a structured, automated, and multidimensional comparison of insulation alternatives. The automated AHP ranking identifies the EPS-based stratigraphy as the best-performing solution, followed by Aerogel and Rock Wool. EPS achieves the highest overall score due to its balanced performance: it complies with thermal and sustainability requirements while maintaining significantly lower costs than Aerogel. This combination of regulatory compliance, adequate technical performance, and economic feasibility leads to the most advantageous compromise among the considered criteria. Aerogel demonstrates strong technical and environmental performance, particularly in terms of reduced insulation thickness, but its high purchase cost significantly penalizes its final score. Rock wool, despite comparable thermal performance and moderate cost, is disadvantaged by non-compliance with the ESI_1 indicator, resulting in the lowest ranking among the alternatives in the decision model.
Overall, the study highlights that the synergistic integration of BIM, parametric scripting, and MCDM can serve as an effective DSS from the early stages of the design process. In this sense, the developed BIM-MCDM framework is configured as a scalable, replicable digital decision environment capable of supporting informed design choices focused on the overall quality of the building envelope and laying the groundwork for future developments toward increasingly data-driven, performance-based design processes.