1. Introduction
Achieving climate neutrality (net-zero greenhouse-gas emissions) in the building sector by 2050 is one of the key objectives of the United Nations Sustainable Development Goals and the European Green Deal. Buildings account for about 40% of global energy consumption and more than one-third of total greenhouse gas emissions. Therefore, improving building-envelope performance and reducing heat losses are among the most effective strategies to meet the European Union Directives on Energy Efficiency [
1] and the Energy Performance of Buildings [
2]. Current international initiatives, including the Concerted Action EPBD [
3], the International Energy Agency (IEA) [
4], and the UNEP Global Alliance for Buildings and Construction [
5], promote the transition towards nearly zero energy buildings (nZEBs) as a means of achieving a climate-neutral building stock. Achieving low-energy and low-carbon buildings depends on multiple interacting factors (envelope performance, airtightness, efficient HVAC systems, controls, and renewable energy supply). This study focuses on one specific and quantifiable envelope component—window installation thermal bridges—by evaluating their impact through linear thermal transmittance (
ψ-values). In the sustainability context, reducing thermal-bridge losses is a direct pathway to lowering operational energy demand and associated CO
2 emissions, while also improving durability by limiting moisture-related degradation.
A significant portion of the total heat loss in buildings occurs through thermal bridges (TBs)—localised areas of increased heat transfer that interrupt the continuity of the insulation layer. These include junctions between walls, roofs, and floors, with particular attention to window-to-wall interfaces (a term that hereafter also encompasses door-to-wall junctions). For modern, high-energy-performance buildings, thermal bridges can represent between 20% and 45% of transmission heat losses [
6,
7], and their contribution becomes even more critical as the insulation level of the envelope increases [
8,
9]. In window assemblies, the share of losses caused by perimeter thermal bridges can reach 8–29% of the total envelope heat loss, depending on glazing ratio and configuration [
10,
11]. Poorly insulated windows can also lower the internal-surface temperature, increasing the risk of surface condensation and mould growth [
8,
10].
The influence of thermal bridges is commonly expressed through the linear thermal transmittance (
ψ-value), measured in W/m·K, which quantifies the additional heat flow per unit length and temperature difference caused by the non-uniformity of the envelope. The determination of
ψ-values follows international standards such as ISO 10211 [
12] and ISO 14683 [
13], which prescribe the use of two- or three-dimensional steady-state numerical methods (finite element method—FEM or Finite Difference Method—FDM). Distinct
ψ-values are typically calculated for window jambs, sills, and lintels, as each zone exhibits different heat-transfer behaviour due to geometry and material combinations.
Research has demonstrated that the installation position of windows strongly influences the transmission heat-loss coefficient (Δ
U): when the frame is improperly aligned with the insulation plane,
ψ-values rise considerably [
14,
15]. Optimised positioning—placing the frame closer to or within the insulation layer—can reduce
ψ by up to 60%, improve internal-surface temperatures by 2–3 °C, and eliminate condensation risk [
10]. To assess and mitigate the effects of thermal bridges, several complementary methods are employed (
Table 1).
Neglecting thermal bridges in energy-performance calculations can result in substantial underestimation of heating demand and undermine the accuracy of nZEB compliance assessments. Conversely, optimised junction design contributes measurably to energy savings and comfort. Economic analyses have shown that TB mitigation is among the most cost-effective retrofit measures for both residential and non-residential buildings, yielding attractive payback periods and improved life-cycle performance [
8,
9]. Quantifying the energy and CO
2 implications of installation choices supports sustainability-oriented decision-making in design and retrofit projects.
Despite extensive research on thermal bridges, most previous studies address window mounting-position effects through isolated parametric investigations rather than comprehensive numerical optimisation that integrates thermal, hygrothermal, and economic factors. Moreover, experimental validation of optimised configurations remains limited. This paper’s novelty lies in a consolidated, optimisation-oriented comparison of practical installation concepts commonly used in practice (traditional mounting, frame extenders, in-layer installation, and insulation overlap). It demonstrates a clear non-monotonic optimum for installation depth in the insulation layer and shows that combining frame extenders with insulation overlap can reduce thermal bridge losses to very low values.
The structure of this paper starts with the numerical modelling framework and evaluation criteria (
Section 2), followed by the simulation results and parametric optimisation of window-to-wall junctions (
Section 3).
Section 4 discusses the main findings and their implications for high-performance building design and retrofit practice, and
Section 5 concludes the paper. The present study, therefore, aims to:
conduct a detailed numerical optimisation of window installation thermal bridges, focusing on the influence of mounting position and junction detailing;
identify installation strategies that minimise the linear thermal transmittance (ψ) and maximise internal-surface temperature (θsi);
evaluate the energy and economic benefits of these optimised configurations through a Passive House retrofit case study.
Although thermal-bridge assessment is often performed under steady-state thermal assumptions, real wall assemblies enable moisture transport, and coupled heat–air–moisture (HAM) processes may affect both
ψ-values and internal-surface temperatures. Moisture accumulation and condensation can change material thermal conductivity (
λ), and airtightness/connection quality at the junction may influence local hygrothermal behaviour. In this study,
ψ-values are evaluated using a steady-state thermal model with constant material properties, consistent with EN ISO 10211 [
12] boundary conditions and EN ISO 10456 [
20] material data, while condensation risk is assessed via internal-surface temperature. Therefore, this work identifies the most influential geometric installation parameters and an optimal mounting range; a fully coupled HAM analysis with moisture-dependent λ and partial vapour pressure fields remains a key research need for future work.
The results provide practical guidelines for architects, designers, and engineers seeking cost-effective and durable solutions for high-performance, energy-efficient nZEB envelopes.
2. Materials and Methods
2.1. Thermal Bridge Simulation Tool and Standards
The numerical simulations were conducted using Flixo Energy, version 8.2 [
22], a validated two-dimensional FEM software developed specifically for the assessment of thermal bridges in building envelopes. The software complies with the requirements of EN ISO 10211 and EN ISO 14683, enabling accurate calculation of linear thermal transmittance for complex junction geometries. This approach supports EU energy-performance assessment practice (Energy Efficiency Directive and EPBD) by quantifying thermal-bridge losses using the aforementioned standards.
The linear thermal transmittance (
ψ-value) was calculated according to EN ISO 10211 using the following formula:
where
—calculated thermal coupling coefficient from the 2D numerical model (W/(m·K)) for the specific junction geometry, which includes both the main heat flow and the thermal-bridge effect,
—the sum of contributions from all 1D elements in the junction, calculated as the U-value of each element (W/(m2·K)) multiplied by its length lⱼ in the junction,
—numerically calculated linear heat flow rate (W/m),
—temperature difference between internal and external environments (K).
Representative window-to-wall junctions were modelled under steady-state, two-dimensional conditions. The reference wall represents a highly insulated nZEB-type assembly with a total U-value of 0.12 W/(m2·K). The window was a Passive House-certified triple-glazed unit with a frame depth of 92 mm and Uw = 0.80 W/(m2·K).
Following EN ISO 10211, the analysed junctions were treated as geometrically uniform along their length, and ψ-values were therefore calculated using a 2D steady-state model. Potential three-dimensional effects at window corners (interaction of jamb/lintel/sill) and point thermal bridges (e.g., mechanical brackets/anchors or other localised highly conductive elements) are not captured by the present 2D approach; where such effects are critical, 3D modelling is recommended and will be addressed in future work.
The computational domain encompassed the entire wall-to-frame connection zone, with an extended buffer region exceeding 250 mm in all directions to prevent boundary effects. Adaptive meshing was applied, ranging from 1 mm to 5 mm in zones of high temperature gradients, and refined at all material transitions. Convergence was achieved when mesh refinement resulted in less than 1% deviation in ψ-values.
All installation variants were modelled, and the results were compared under identical boundary conditions, as defined in EN ISO 10211 [
12]:
internal air temperature: 20 °C,
external air temperature: −20 °C,
internal-surface resistance: 0.13 m2·K/W,
external surface resistance: 0.04 m2·K/W.
Outdoor meteorological variability and time-dependent temperature fluctuations were not simulated because the analysis is steady-state; the results, therefore, provide a consistent comparison at a representative winter design condition.
Thermal conductivities for materials were taken from manufacturer datasheets or according to values specified in EN ISO 10456 [
13] (see
Table 2). Perfect contact was assumed between all elements, and heat transfer was considered purely conductive in accordance with the steady-state modelling approach. In additional internal checks, detailed junction models including airtightness tapes and small air cavities changed
ψ only in the 4th decimal place; therefore, the simplified layer-based model is considered sufficiently accurate for this parametric optimisation. Other material properties (e.g., density and specific heat capacity) are relevant for transient analyses and therefore were not used in the present modelling.
The junction between all materials was assumed airtight, i.e., no air-leakage (infiltration) paths through installation gaps were modelled. Airtightness/infiltration effects are important in practice but are outside the scope of the present ψ-based thermal-bridge modelling and should be assessed separately (e.g., airflow/HAM modelling).
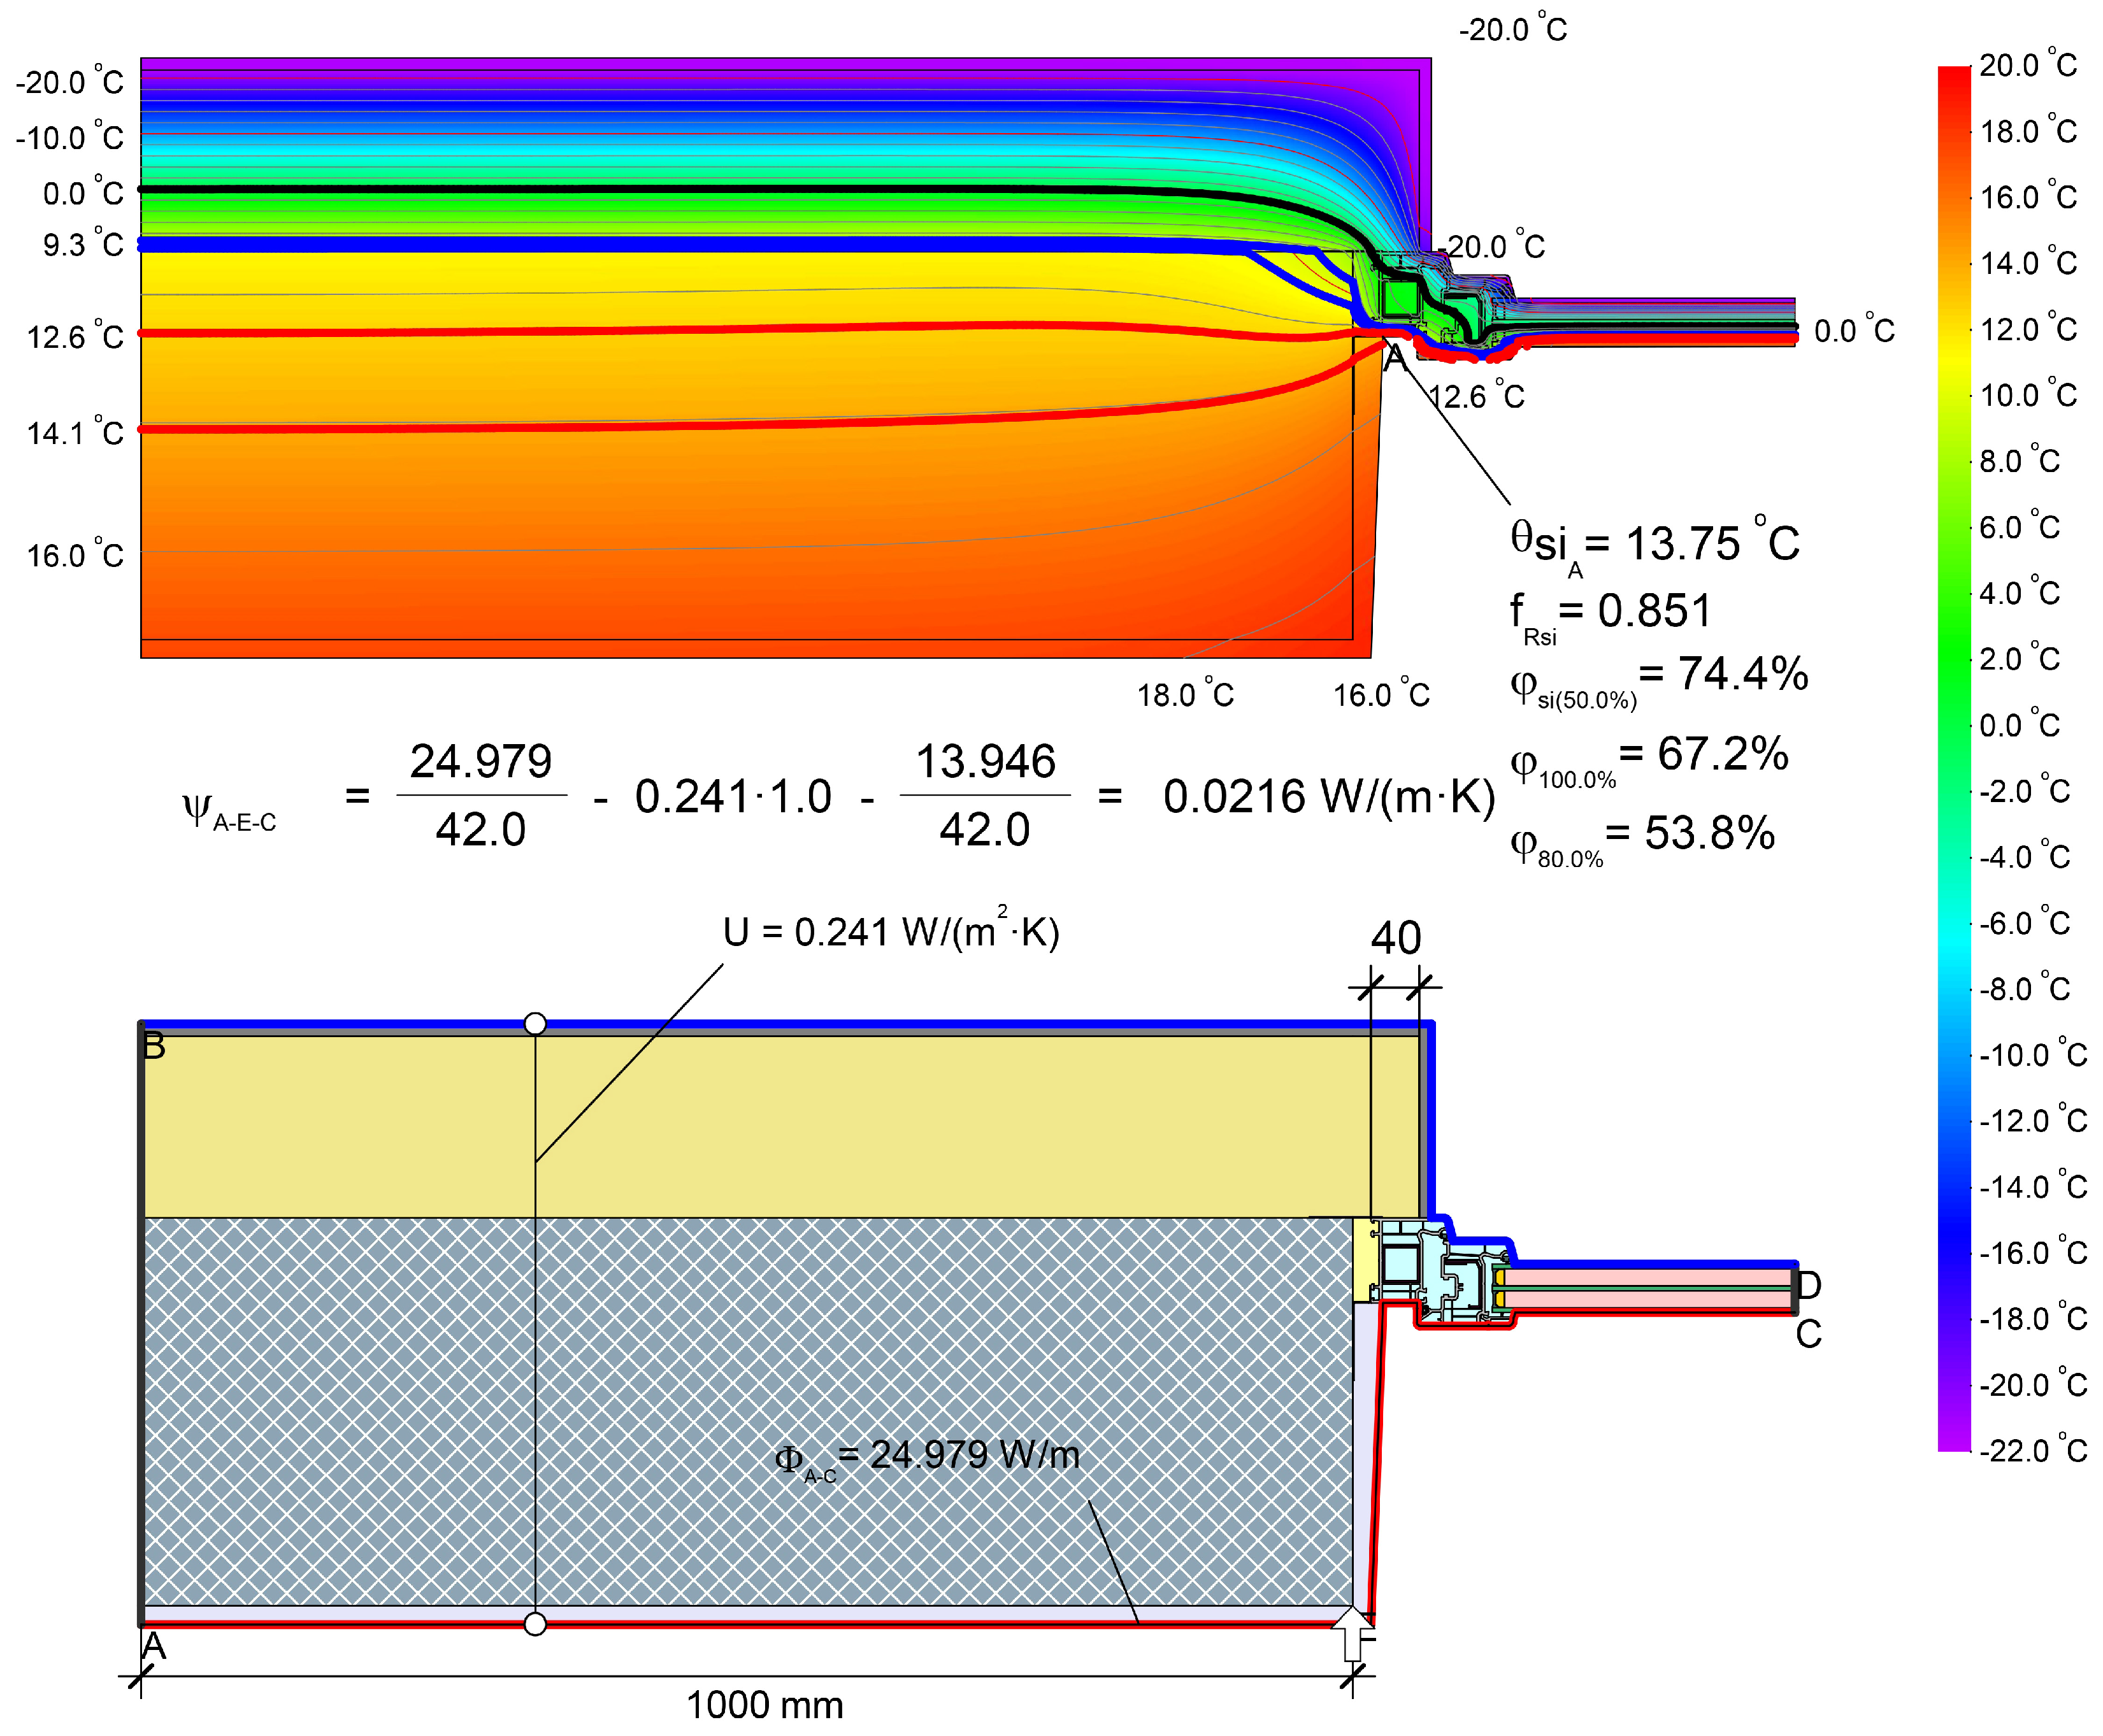
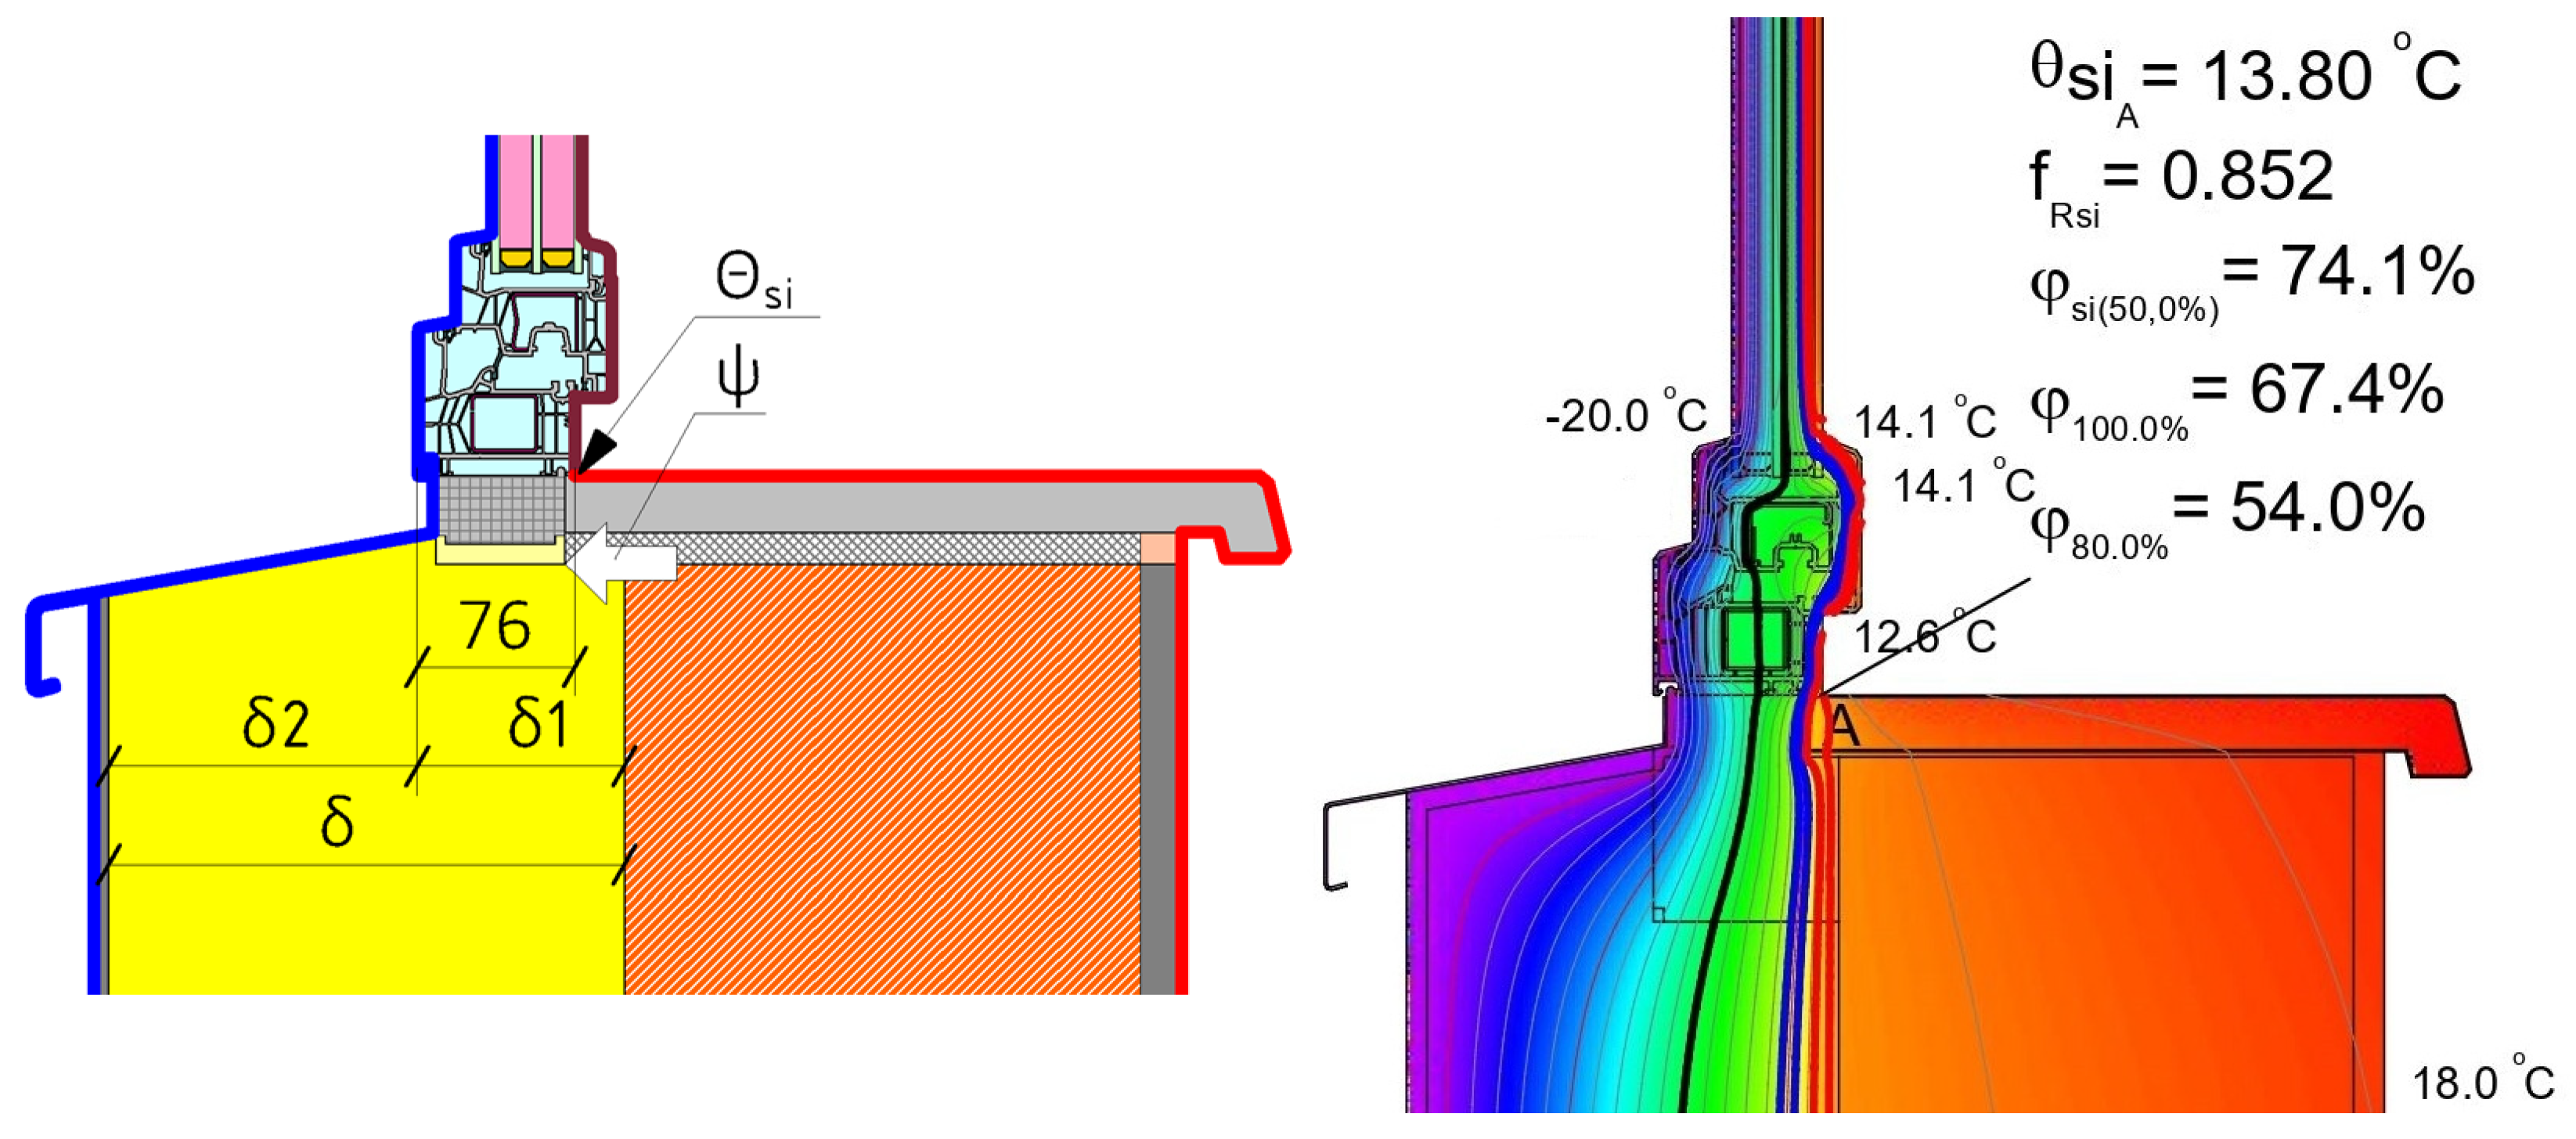
To illustrate the modelling approach,
Figure 1 shows an example of the simulated temperature field at a window-to-wall junction in an expanded clay concrete wall, including the calculation of the associated thermal bridge.
2.2. Surface Temperature and Condensation Risk Analysis
To assess the condensation risk in the simulated junctions, the temperature factor
at the internal surface was calculated as:
where
is the internal-surface temperature, but
and
are indoor and outdoor air temperatures (K) accordingly.
According to EN ISO 13788 [
23], condensation risk is considered negligible when the temperature factor exceeds a critical threshold:
= 0.75. When applying the Passive House standard, this threshold varies from 0.65 to 0.80 depending on climatic zones [
24]. This criterion was used to assess the suitability of each modelled window-to-wall junction configuration from the perspective of interior surface temperature stability under cold outdoor conditions.
2.3. Different Types of Window-to-Wall Junction
In construction practice, numerous methods have been developed to reduce heat loss in different window-to-wall junctions. The choice of a specific installation strategy depends on many factors and must be optimised for the individual project by designers, builders, and energy auditors. Four of the commonly used junction types have been numerically modelled and analysed, with optimal configurations identified for each case.
Table 3 provides an overview of these window-to-wall junction types along with their typical usage contexts in new construction versus retrofit applications.
In this study, the 2D window-to-wall junctions are modelled under identical boundary conditions and evaluated using ψ-values and internal-surface temperature criteria. The work does not compare different wall insulation technologies or exterior finishing systems; instead, it focuses on comparing and optimising window installation strategies for highly insulated envelopes.
2.3.1. Traditional Mounting (Mounting in the Core Plane)
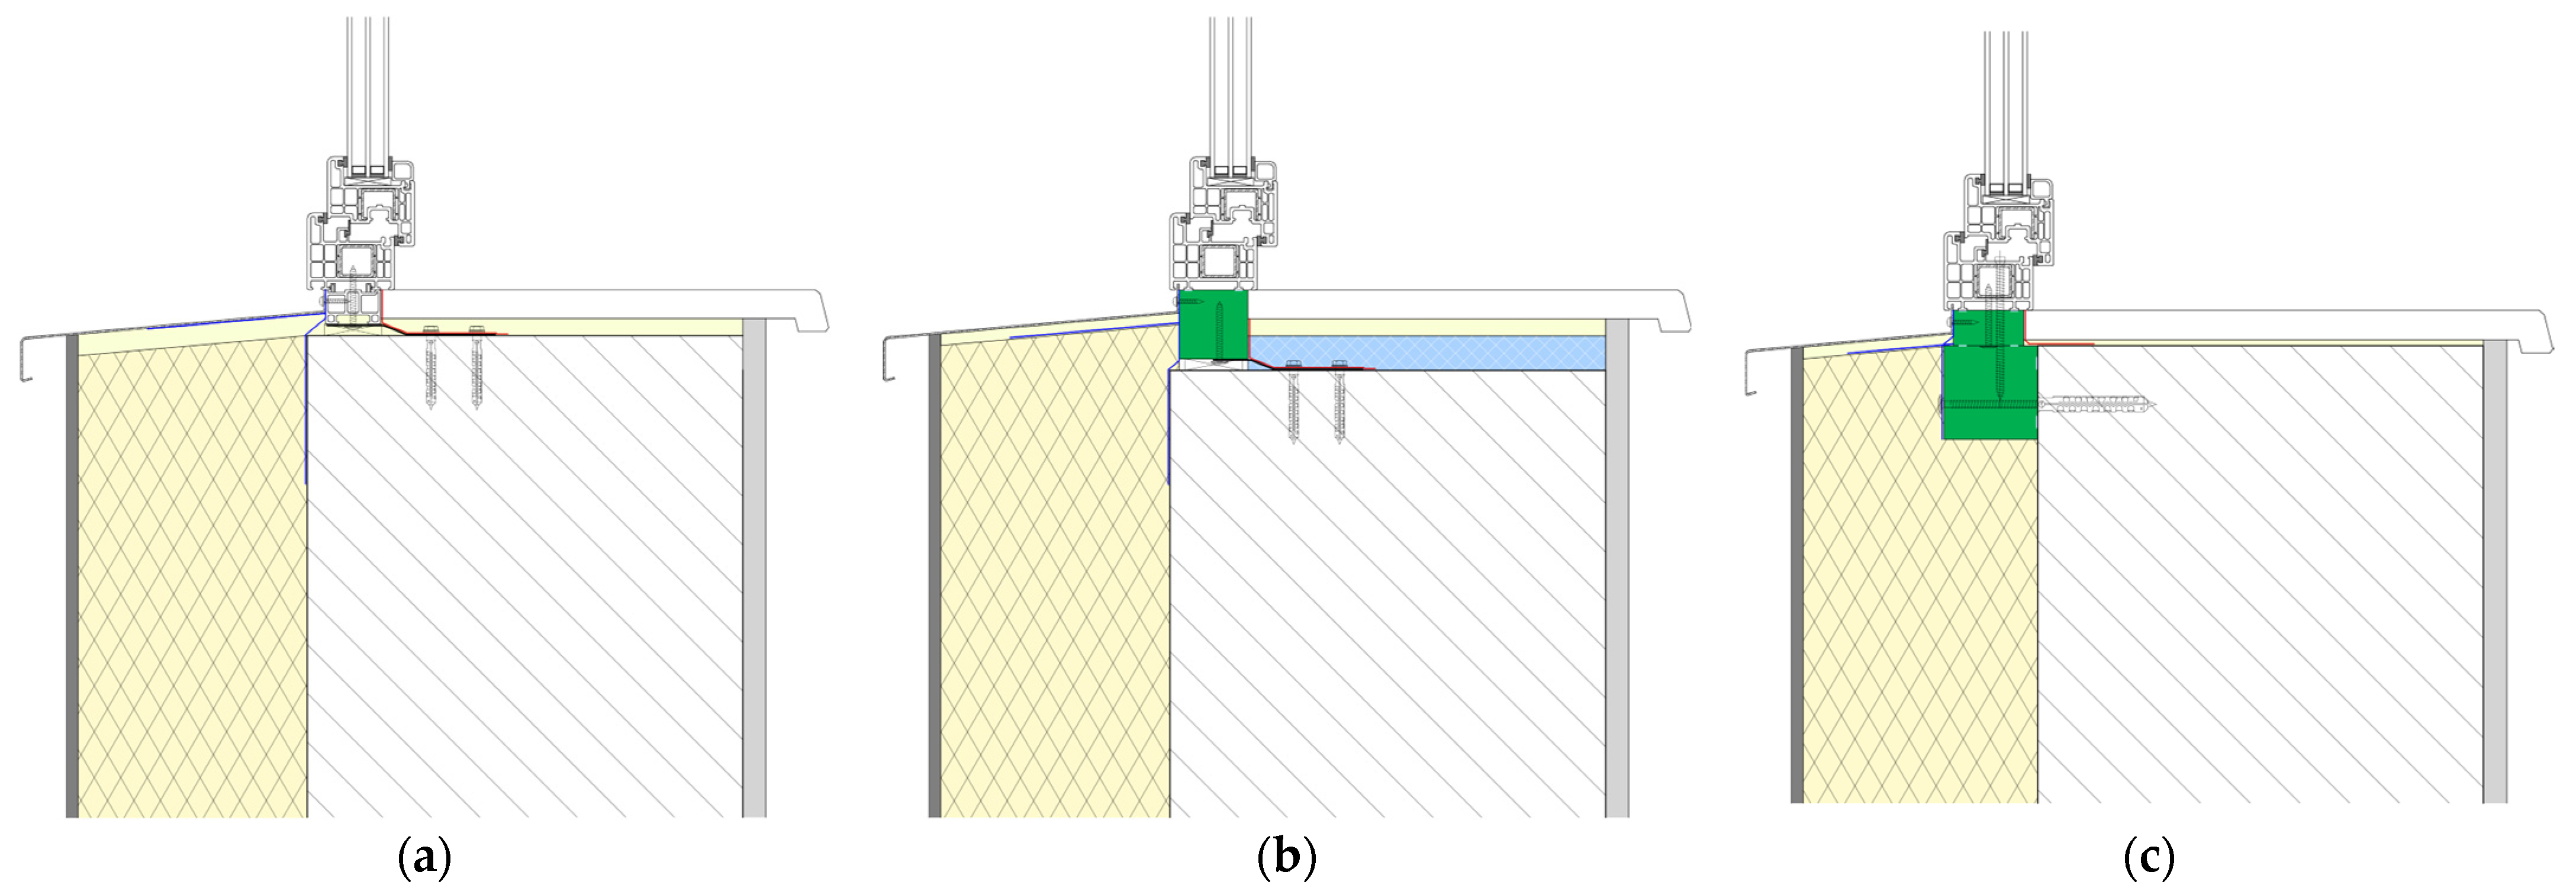
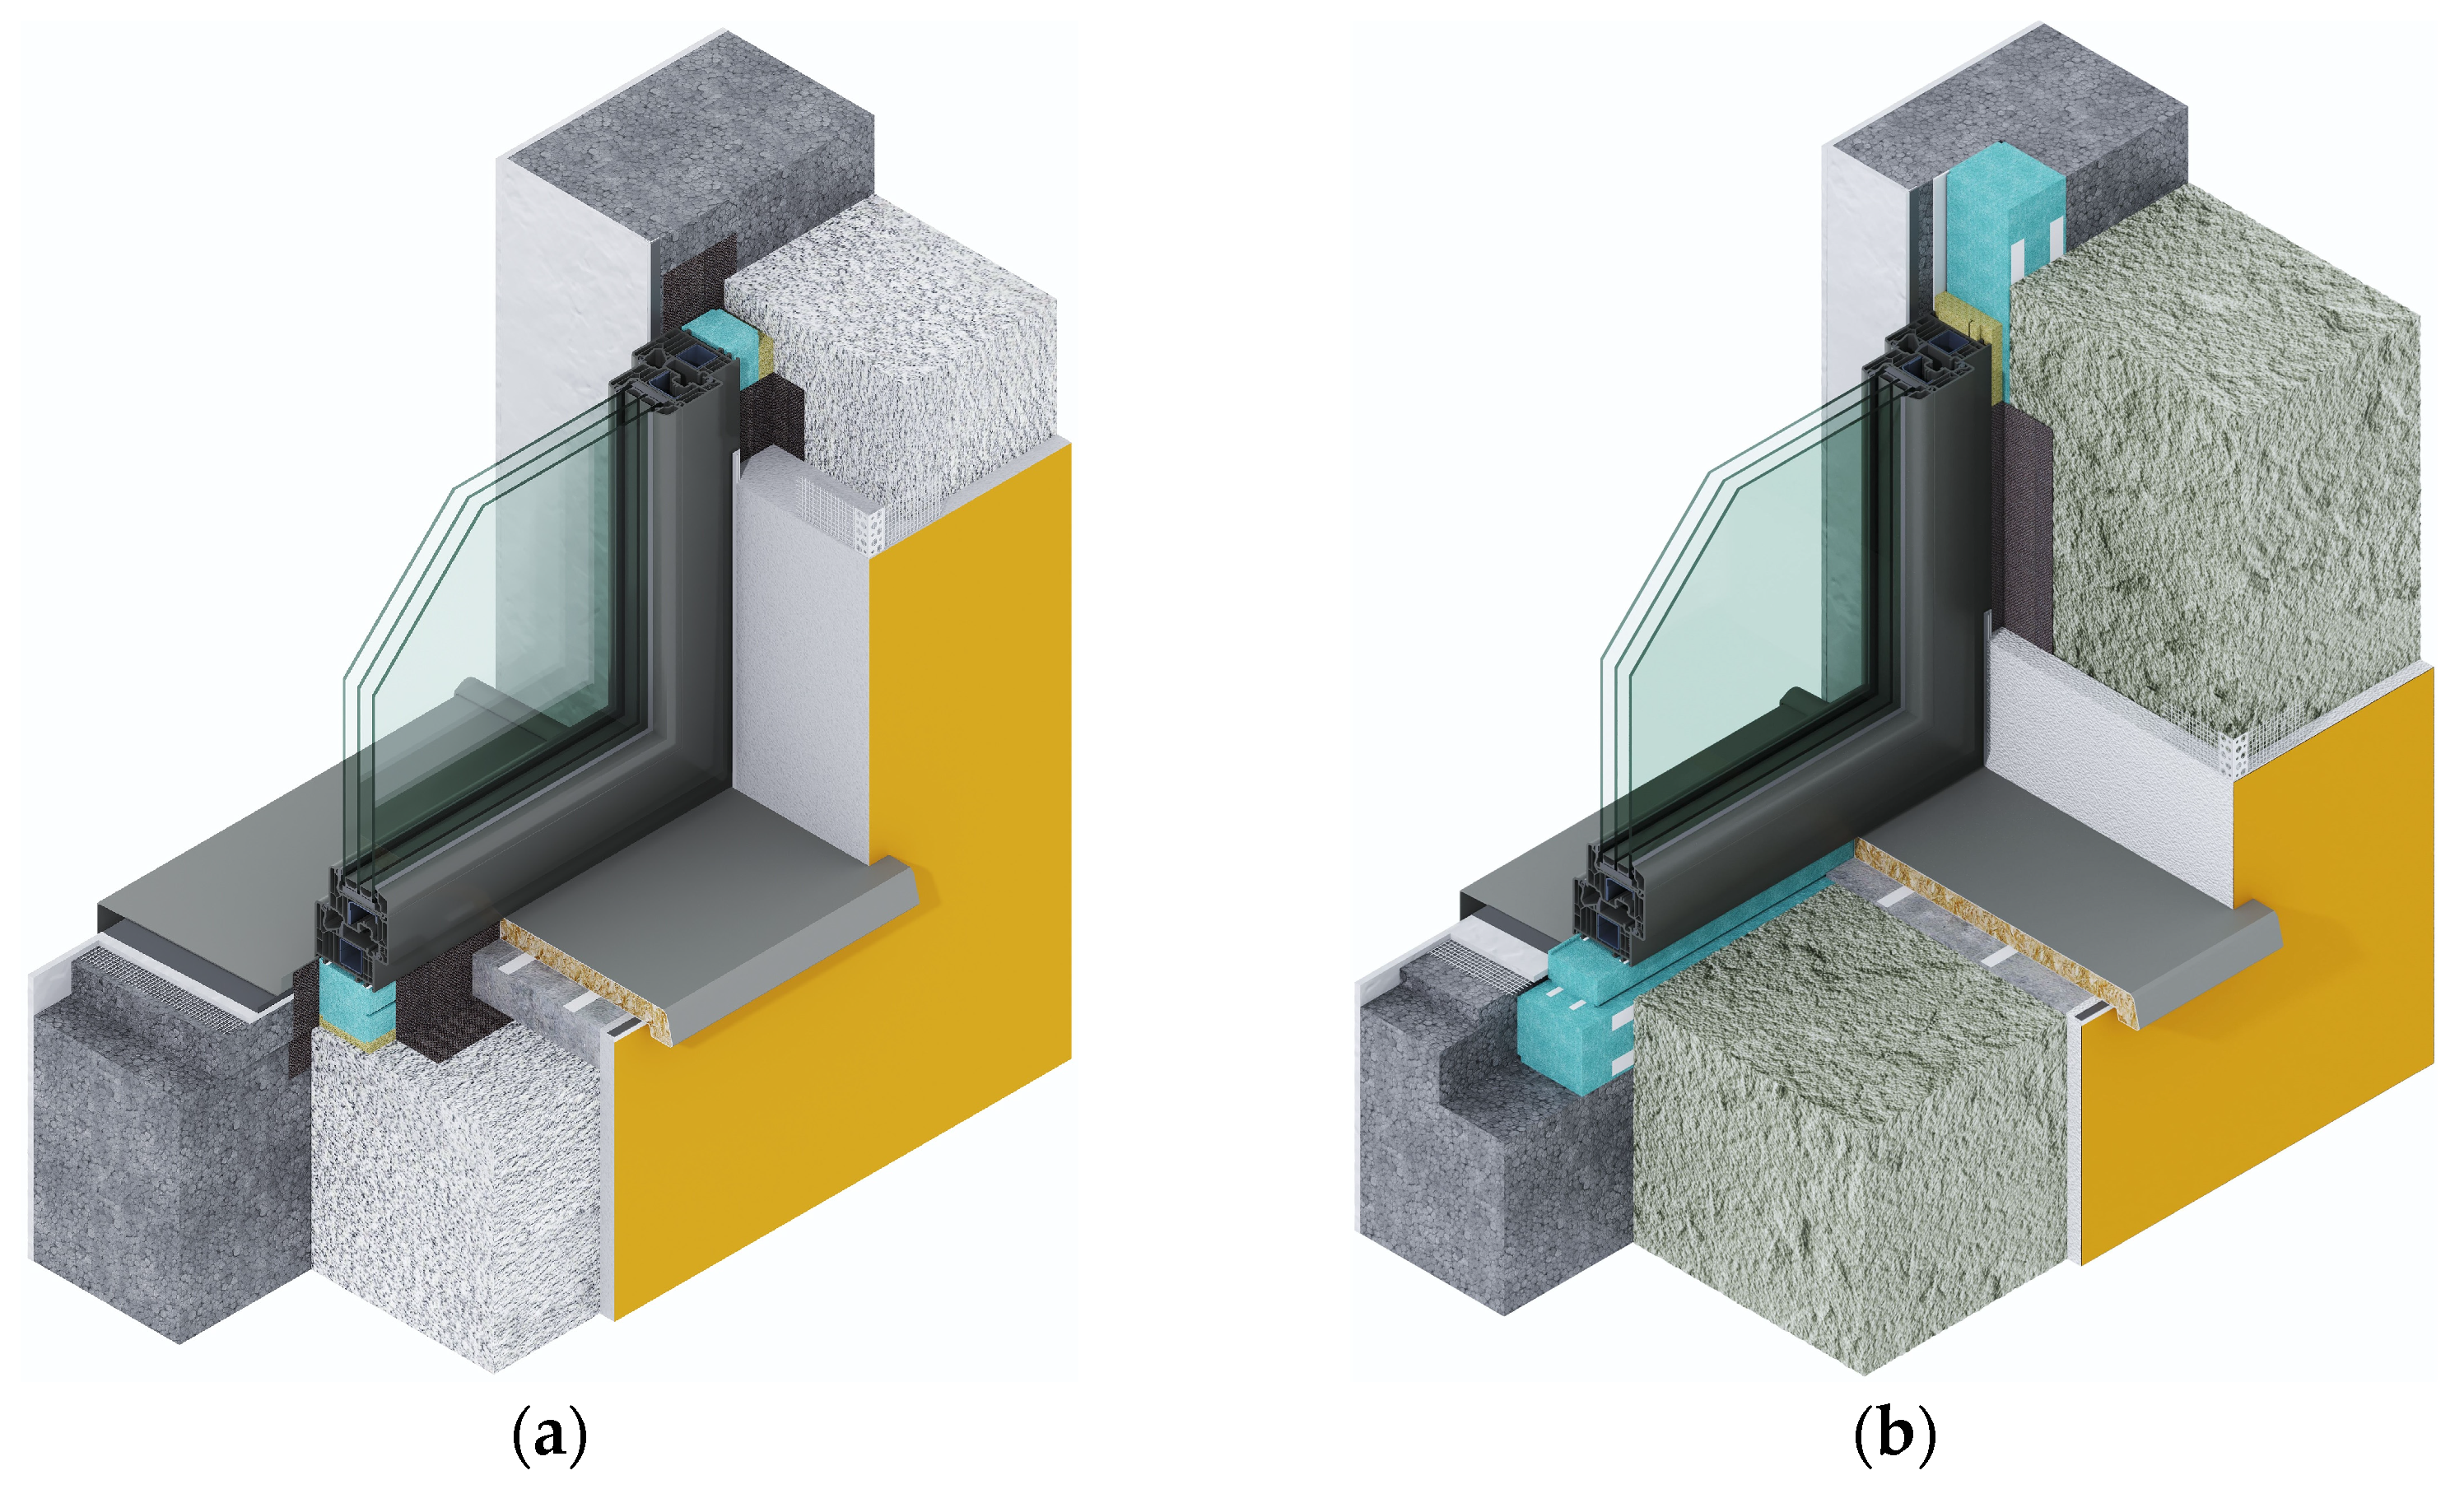
In the traditional mounting method, the outer plane of the window frame is aligned with the outer plane of the structural layer of the wall (
Figure 2a). Although this installation typically results in more pronounced thermal bridging and often fails to comply with nZEB or Passive House standards [
24], it remains common in practice due to its simplicity and low cost. This method is particularly widespread in renovation projects, as it allows windows to remain in place while thermal insulation is added externally.
When the structural core consists of materials with low thermal conductivity (e.g., lightweight expanded clay aggregate concrete), the linear thermal transmittance at the junctions—head, jamb, and sill—can be significantly reduced. This makes the traditional mounting strategy potentially suitable even for new buildings designed to meet nZEB or PH requirements, provided the envelope materials are sufficiently insulating.
2.3.2. Installation on Frame Extenders
In this method, the window frame is positioned outward from the structural core of the enclosing structure using specialised frame extension profiles (e.g., system expanders), maintaining a connection to the core material (
Figure 2b and
Figure 3a). This approach represents an intermediate solution between traditional mounting in the core plane and full installation within the insulation layer, offering a balance of thermal performance and installation flexibility.
Compared to installation directly in the insulation layer, this approach results in slightly higher linear thermal transmittance ψ-values, yet these typically remain within acceptable limits for nearly zero energy buildings (nZEB) or zero energy buildings (ZEB). Its benefits often stem from technological, logistical, or economic considerations, such as easier integration with existing window systems or reduced on-site adjustments, making it a practical choice without compromising the building’s overall energy efficiency.
However, this method is not widely used for renovations, as it requires the removal of the existing windows, and reusing them is often impossible due to the added extenders altering the dimensions, which no longer fit the existing opening—thus, new windows are typically needed. In contrast, it performs well for new constructions. This method is recommended to combine with overlapping the window frame by insulation, as described in the next chapter.
2.3.3. Installation in the Insulation Layer
In this method, the window frame is installed approximately within the plane of the external thermal insulation layer of the enclosing structure, with its perimeter surrounded by insulation or a dedicated load-bearing thermal insulating profile (
Figure 2c and
Figure 3b). This approach significantly reduces linear thermal bridging compared to traditional mounting by positioning the frame closer to the building’s thermal envelope.
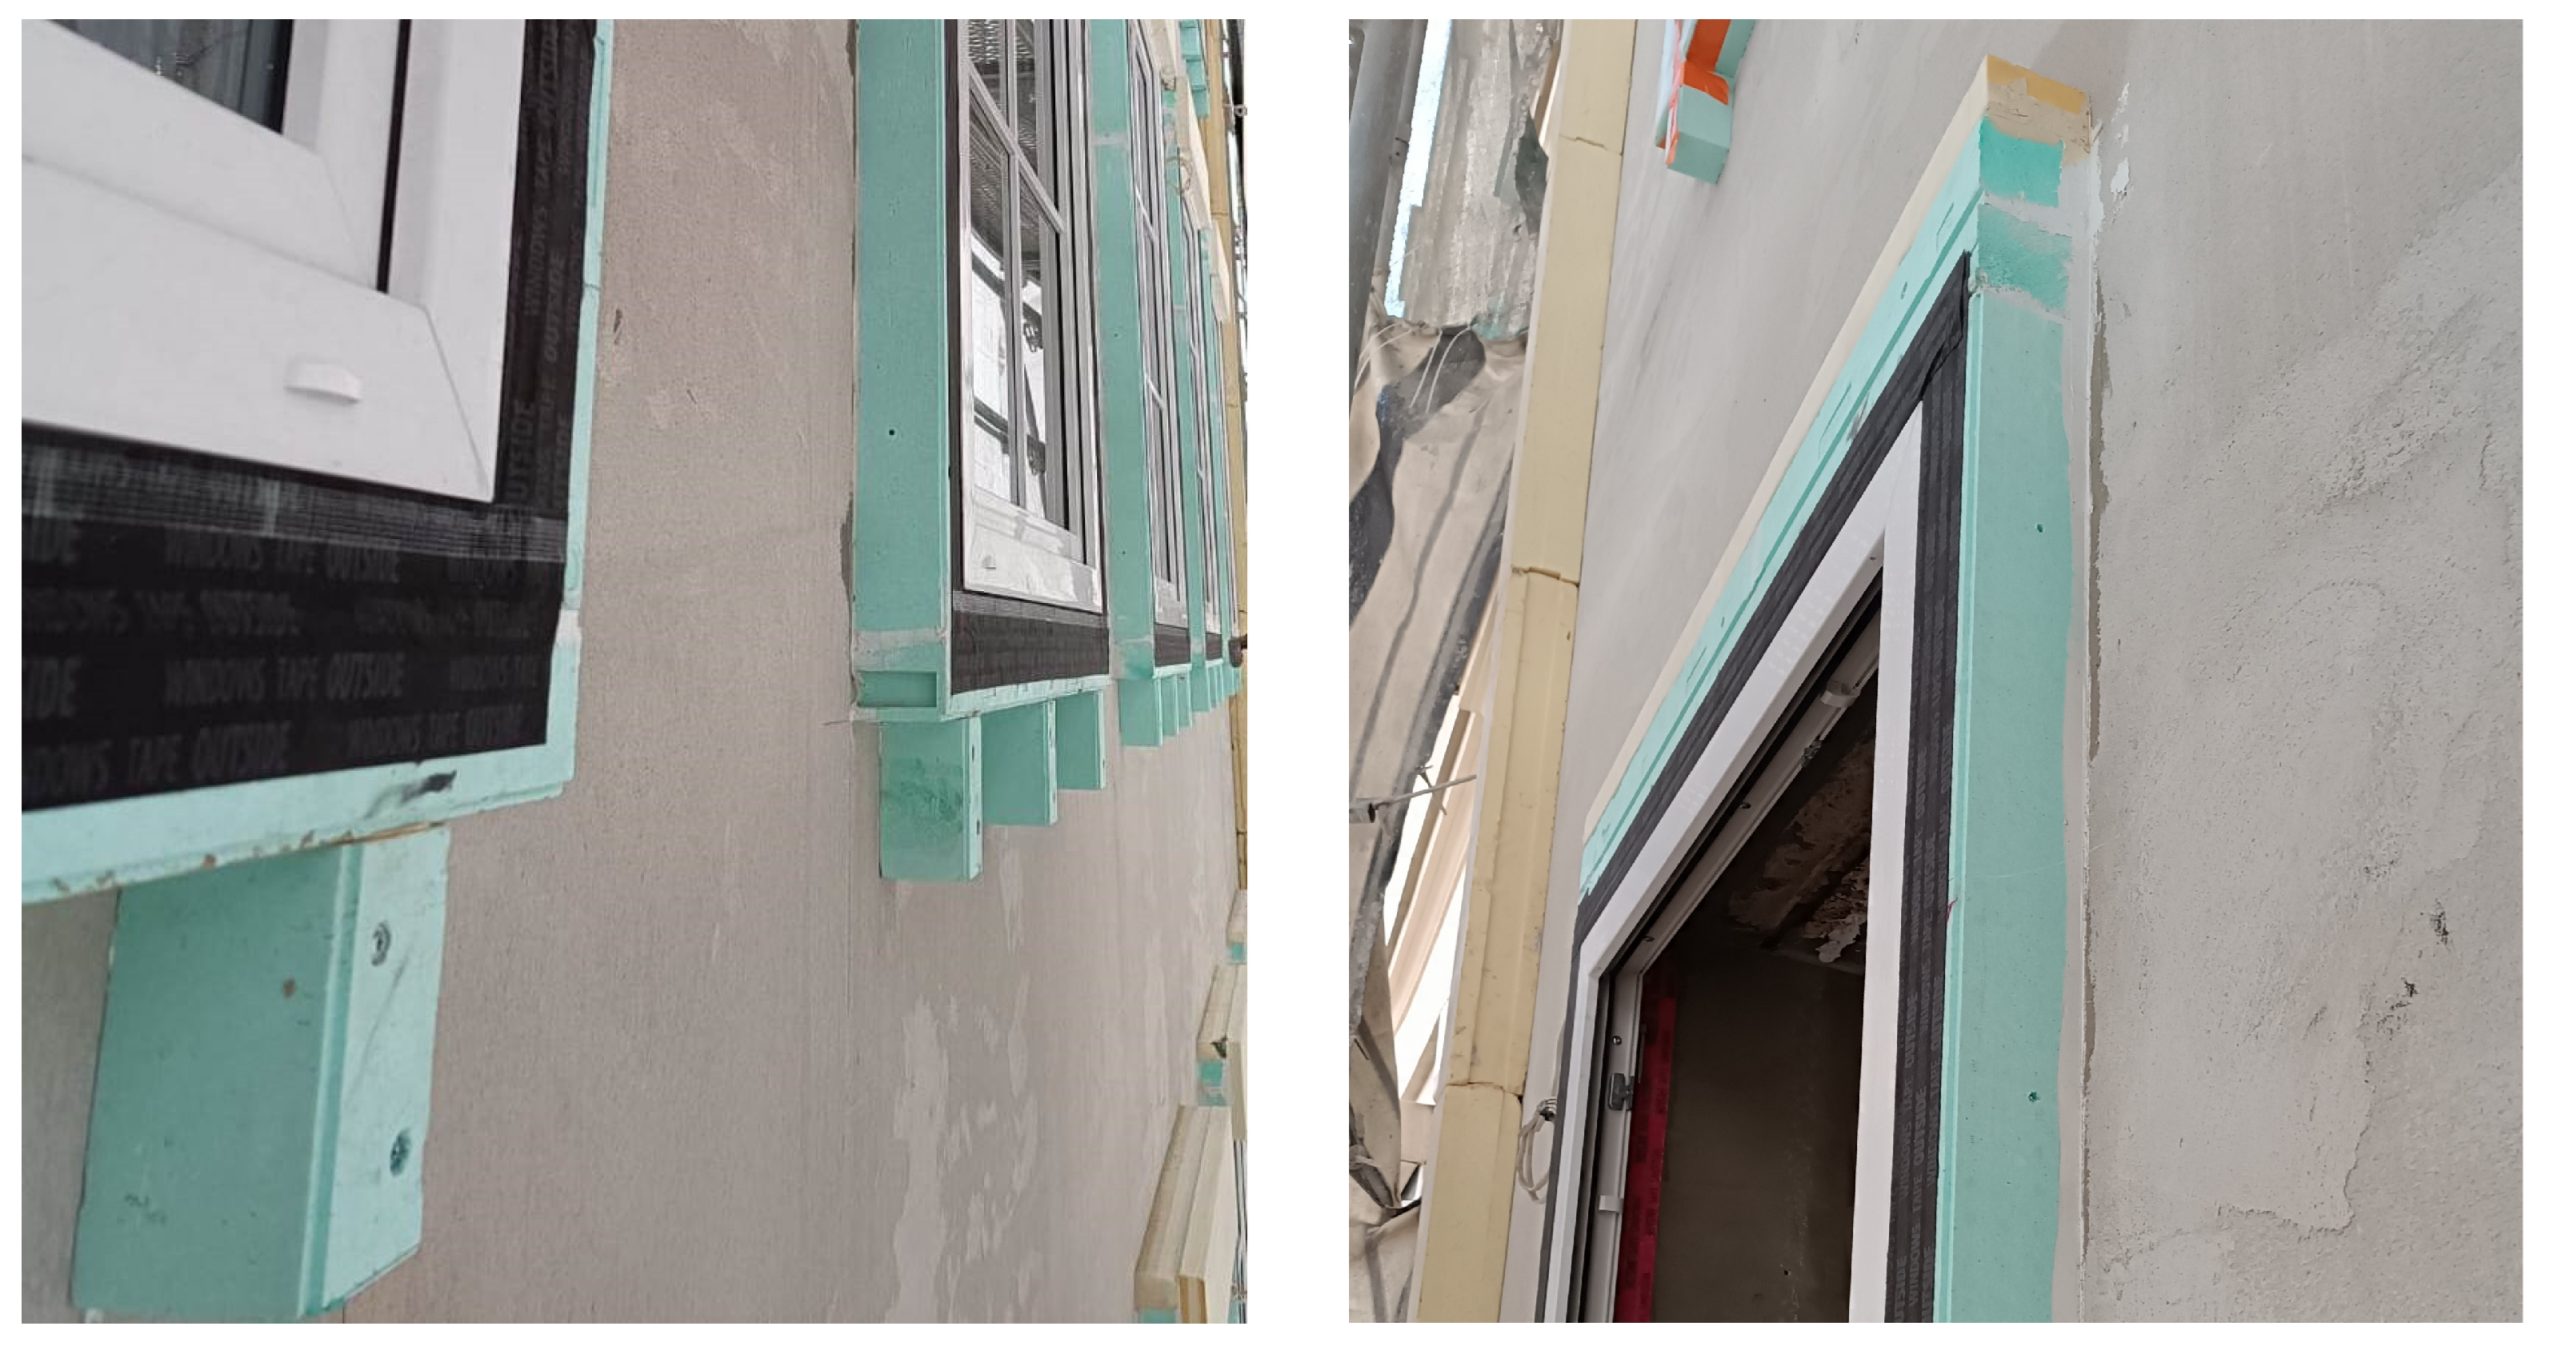
Figure 4 shows a practical example of this installation technique from a construction site.
Such placement improves interior surface temperatures (by approximately 2–4 °C), reducing condensation and mould growth risk while also improving the overall U-value of the envelope and reducing transmission heat losses and heating energy demand.
The insulation profiles used around the window frame must be both thermally efficient and structurally capable of withstanding window weight and mechanical loads. Suitable materials typically have thermal conductivities of λ = 0.04–0.06 W/(m·K) and sufficient compressive strength. When applied correctly, this installation strategy yields linear thermal transmittance (ψ-values) compatible with nZEB and PH standards. Commercial solutions of such window installation profiles include VSthermo, Warmotech Pro, GreenteQ Climate Conformal, Blaugelb Triotherm, etc.
2.3.4. Overlapping the Window Frame by Insulation
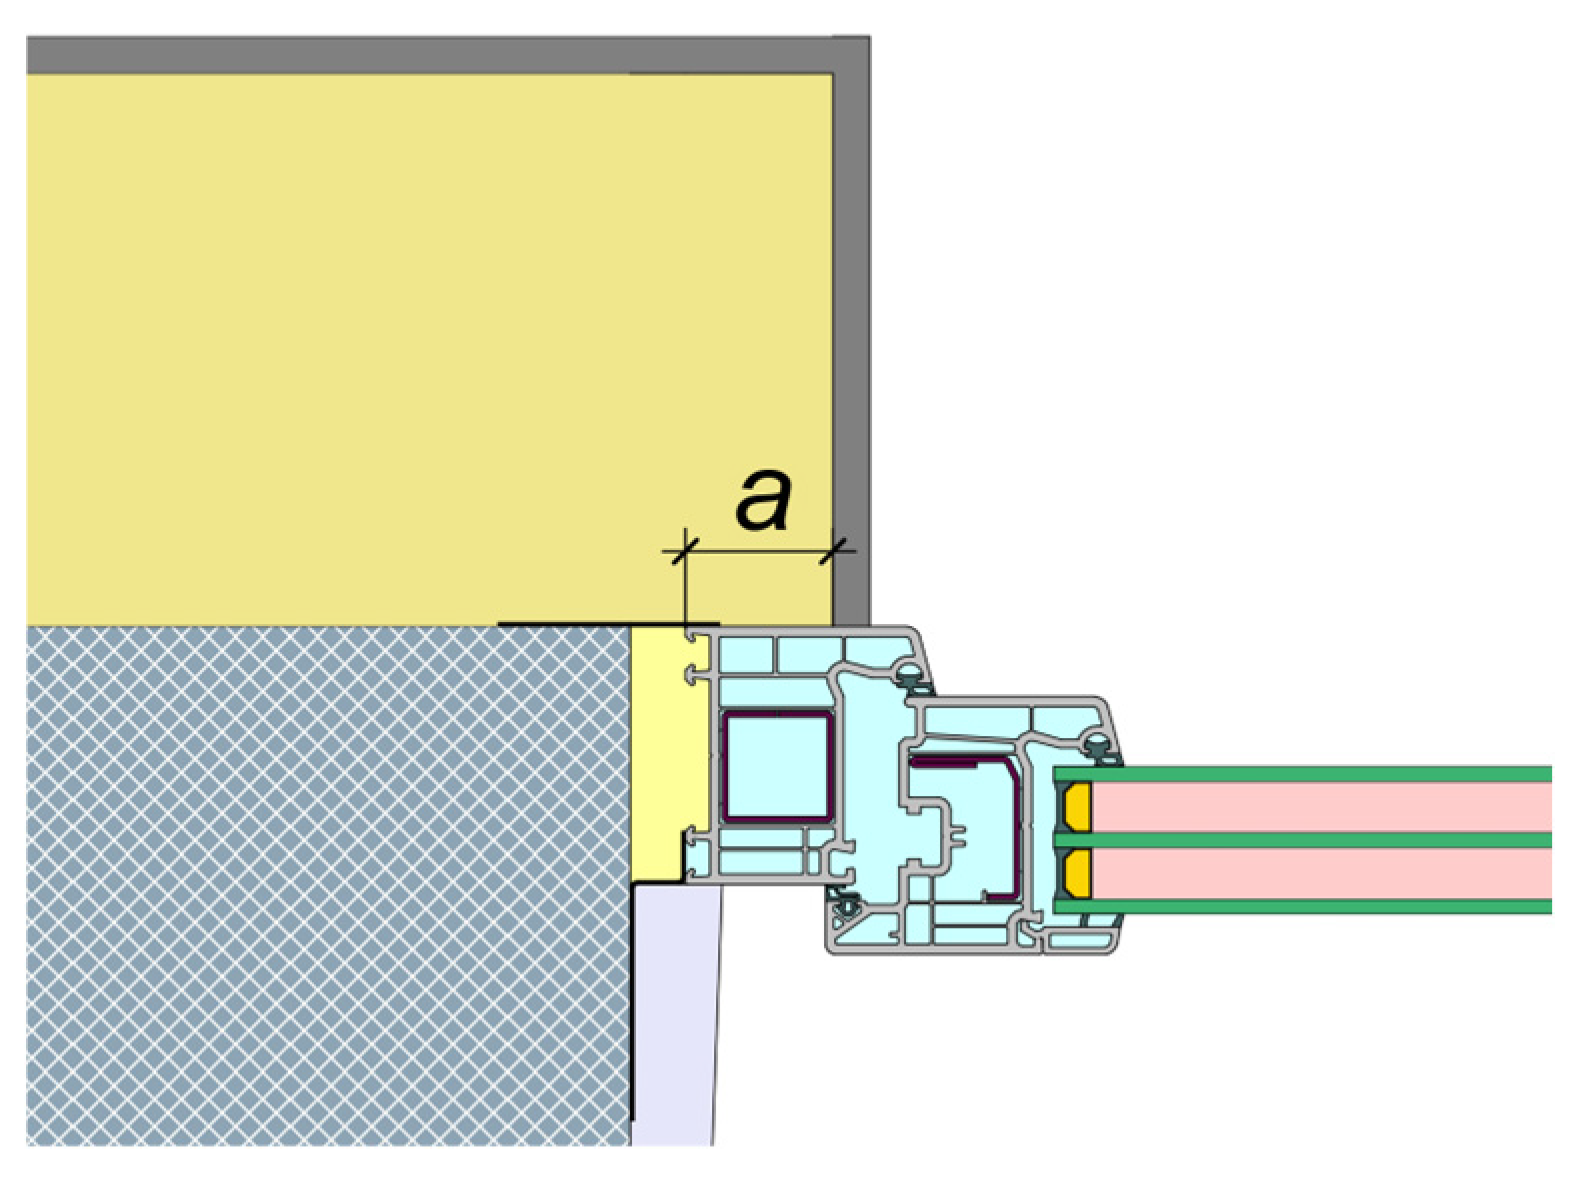
An effective approach to reduce heat transmission losses through windows is to apply additional insulation to the frame profile positioned within the structural core material. The outer surface of the window frame is partially overlaid around its perimeter with insulation material to minimise thermal bridges and enhance internal-surface temperatures (
Figure 5).
This strategy is particularly widespread in building retrofits, where it enables significant reductions in thermal bridging around window perimeters without the need to remove or reposition existing frames. In such cases, thermal insulation is applied over the visible outer surface of the frame, which also improves façade aesthetics by concealing the window frame from the exterior.
The thickness of the overlapping insulation (parameter
a in
Figure 5) plays a crucial role in determining its thermal effectiveness. However, in retrofit scenarios, this thickness is often constrained by the existing window installation method, leaving only a few centimetres for the insulation layer. After accounting for required finishing layers such as plaster or cladding, the remaining space for thermal insulation becomes very limited.
In contrast, new constructions offer much greater flexibility. Frame width and installation position can be optimised to accommodate thicker overlapping insulation, improving both the thermal performance and durability of the junction while simplifying architectural integration.
3. Results
This section presents the results of a detailed numerical investigation into the thermal and economic implications of various window installation strategies. The study includes a comparative analysis and optimisation of linear thermal transmittance (ψ-values) across different installation configurations, the evaluation of internal-surface temperatures to assess hygrothermal risk, and a case study examining the economic performance of an optimised solution applied in a Passive House retrofit project. The findings provide evidence-based guidance for selecting window installation techniques that balance energy efficiency, occupant comfort, and cost-effectiveness.
3.1. Thermal Bridge Simulation and Optimisation
A series of numerical simulations was conducted for multiple window installation techniques using Flixo Energy software, version 8.2 [
22] to evaluate the influence of installation geometry and placement on total heat flux and the resulting thermal bridging. The linear thermal transmittance (
ψ-value) was calculated in accordance with Equation (1), using internal dimensions to determine the construction length.
3.1.1. Installation on Frame Extenders
In the case of traditional mounting—the simplest and most cost-effective method, commonly used in existing buildings where the window is installed within the wall core (
Figure 2a)—the linear thermal transmittance (
ψ-value) varies widely depending on the wall type (e.g., solid masonry, cavity wall), frame material (PVC, timber, aluminium), frame depth, installation details, and workmanship quality. In worst-case scenarios, it can reach as high as 0.4 W/(m·K), which corresponds to approximately 50 W of heat loss for a 1 × 2 m window under a 20 °C temperature difference. For objective comparison with other installation types, one representative traditional mounting configuration was selected as a reference, with a calculated
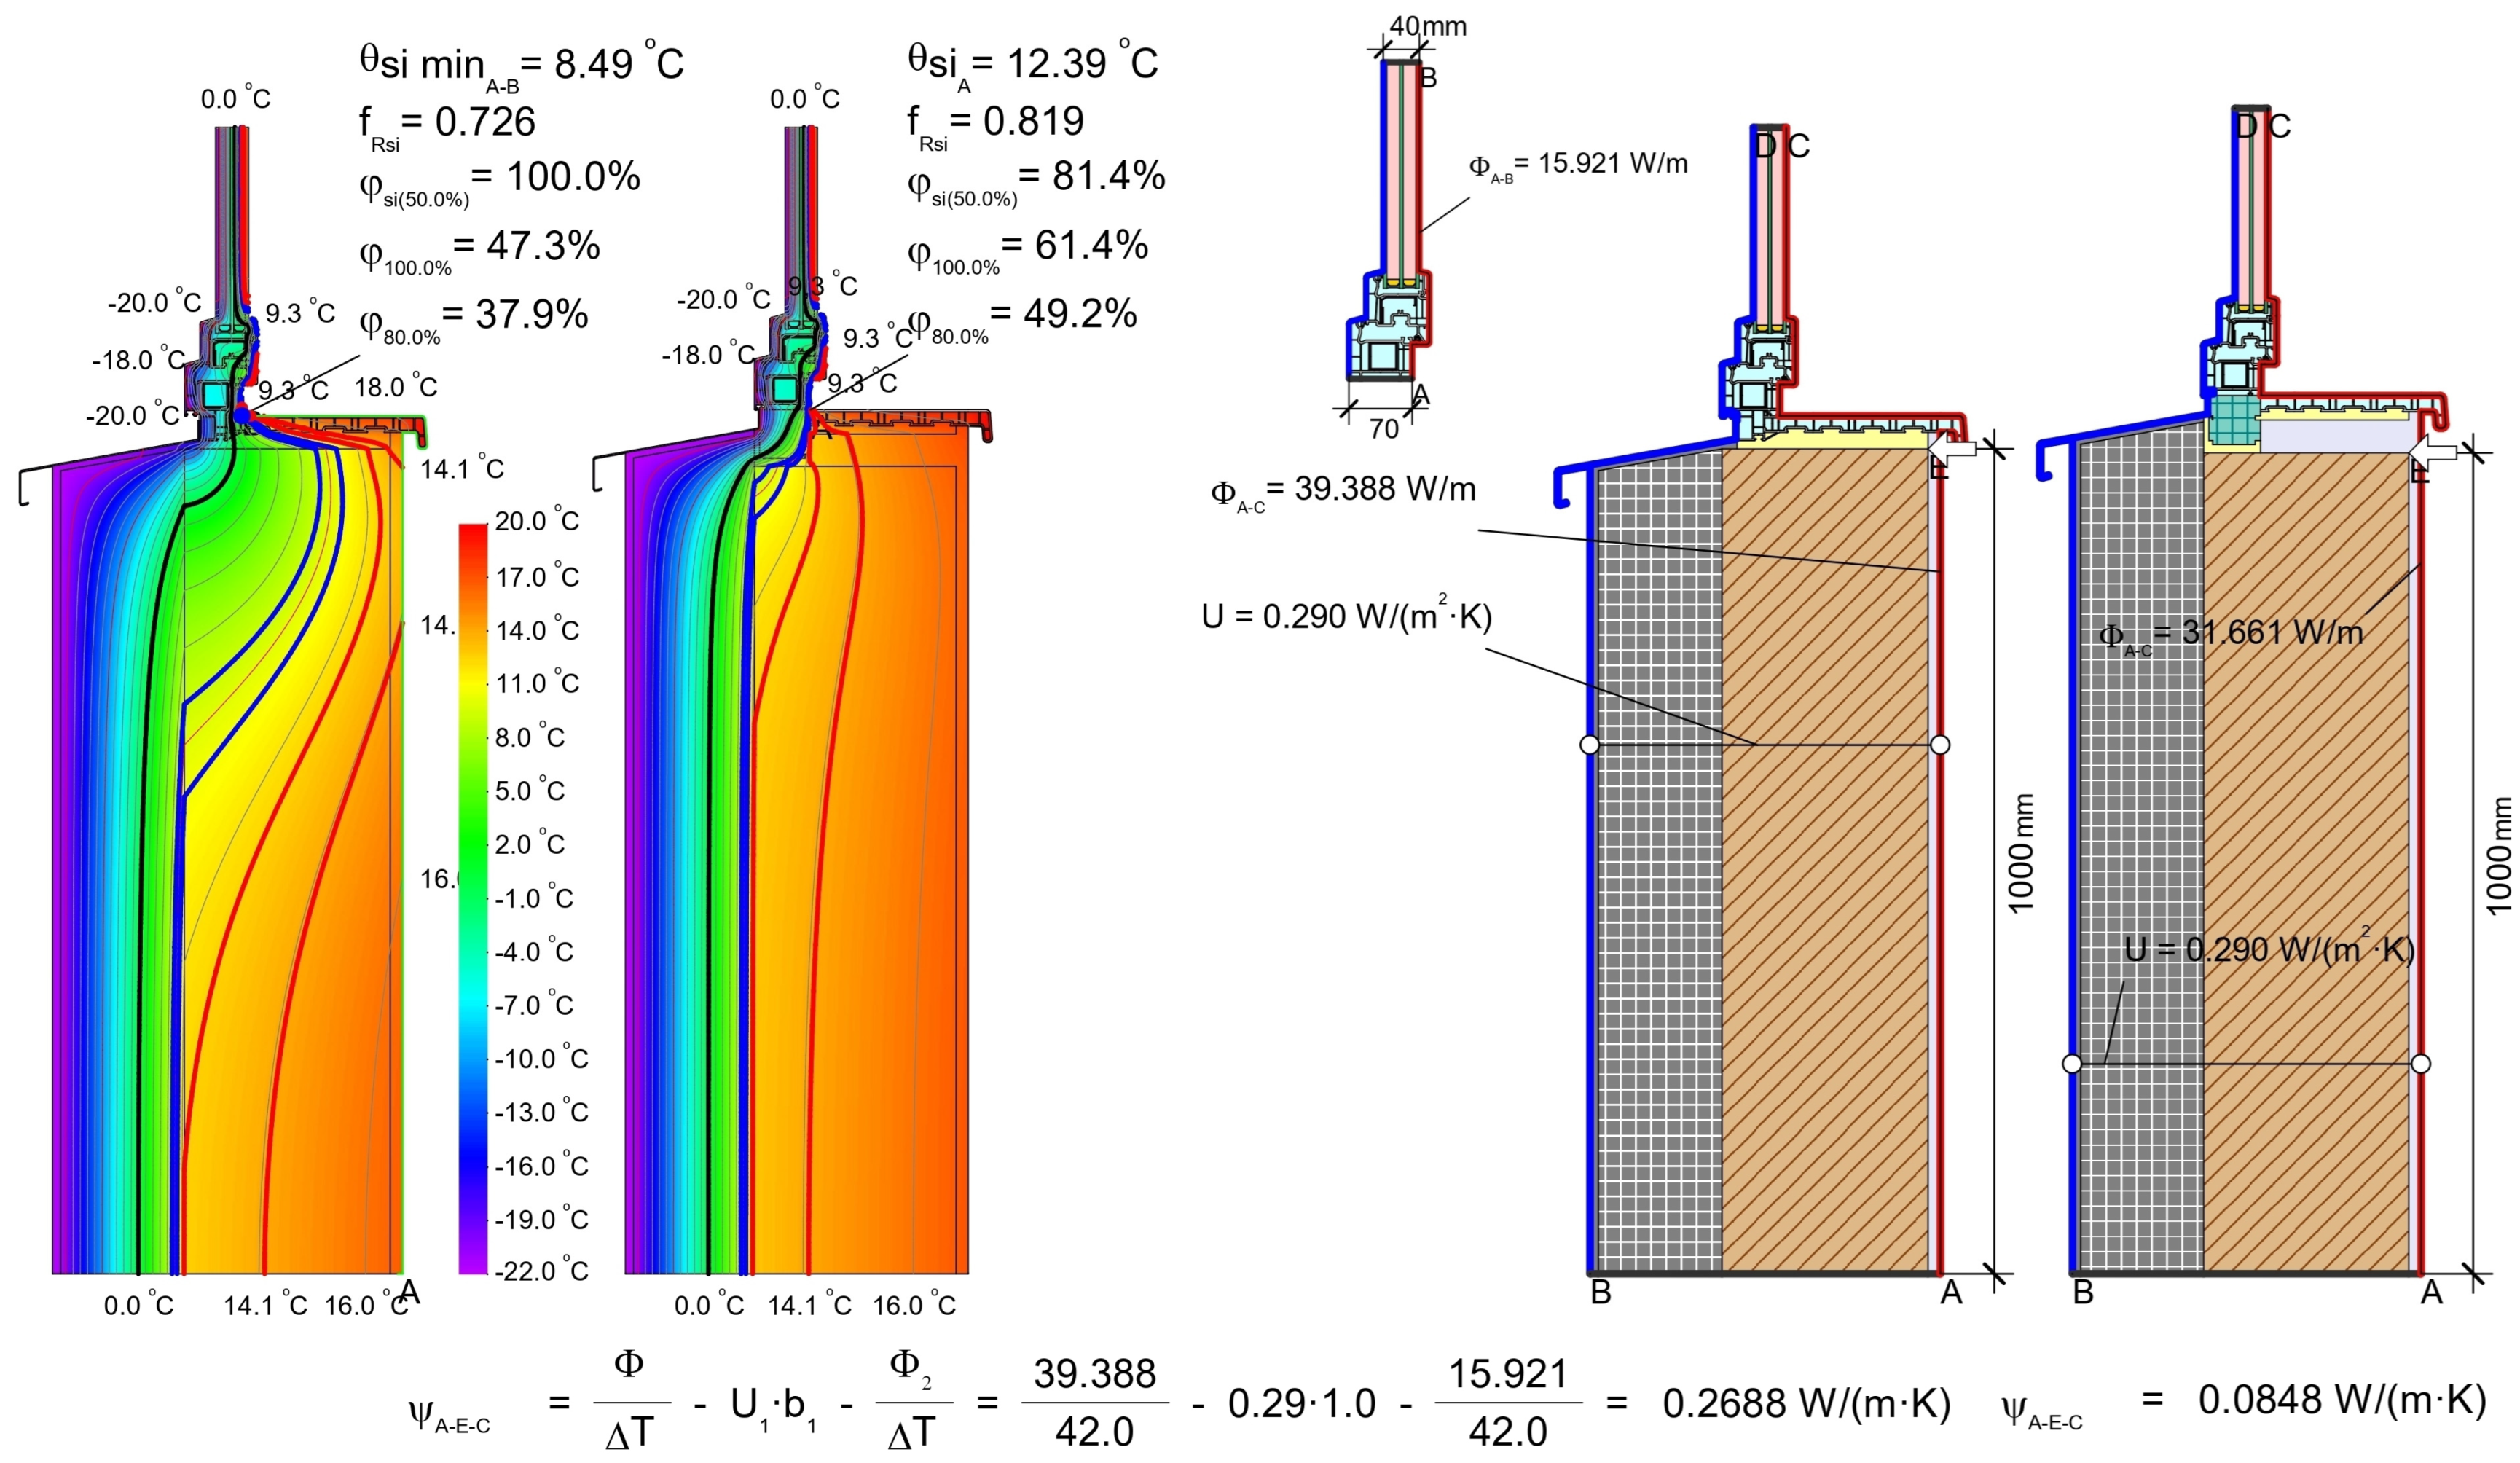
ψ-value of 0.27 W/(m·K) (see
Figure 6).
A relatively low-cost yet effective method for improving the thermal performance of window installations is the use of a specialised frame extender system. In this approach, a proprietary extension profile with enhanced thermal resistance is applied around the window perimeter (
Figure 2b and
Figure 3a), creating a thermal break between the wall and the frame.
Figure 6 shows the simulated temperature field and the calculated
ψ-value of 0.08 W/(m·K) for the installation with frame extenders—as can be seen, this reduces the thermal-bridge effect by 68% relative to the reference model.
The use of a frame extender significantly alters the temperature field near the window junction. As shown in
Figure 6, in the traditional installation (left), the cold external temperature isotherms penetrate deeper into the wall structure. In contrast, the configuration with frame extenders (right) limits this thermal intrusion, resulting in a different isotherm distribution and warmer interior surfaces near the window perimeter (see also
Section 3.2).
However, frame extenders reduce the effective transparent area of the window while the opening dimensions remain unchanged, resulting in decreased solar heat gains. This reduction is particularly significant for smaller windows/doors, where the frame thickness represents a substantial proportion of the opening area, whereas for larger transparent structures, the impact on overall solar gains becomes less pronounced.
3.1.2. Installation in the Insulation Layer
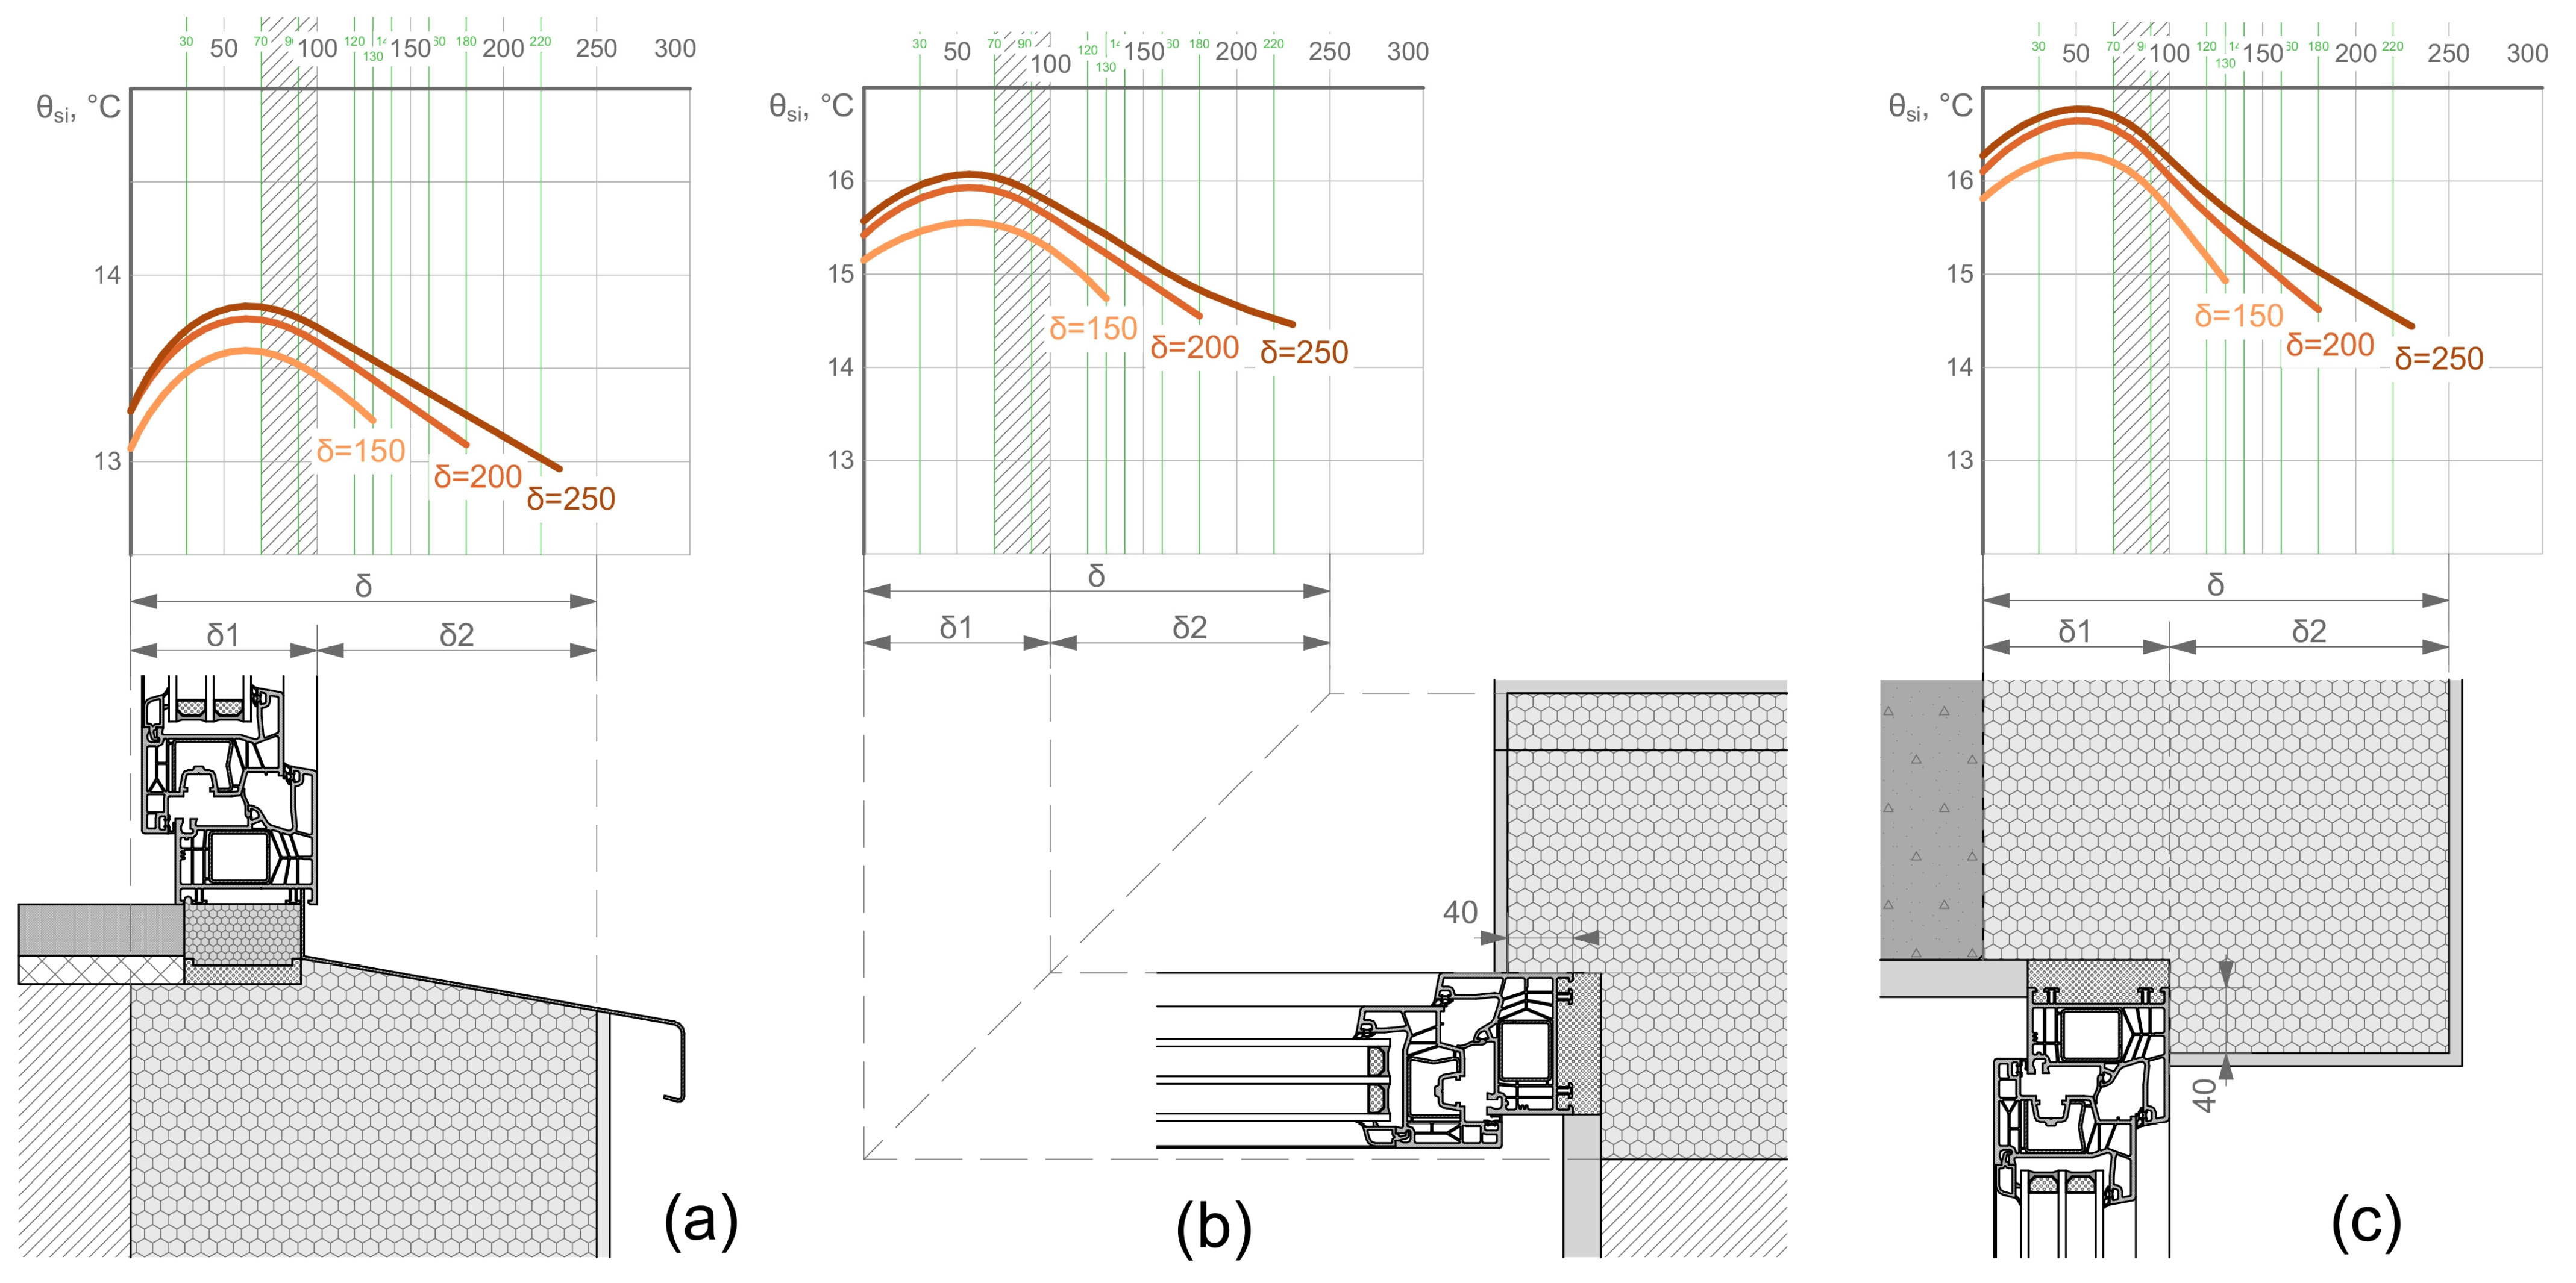
The most effective way to avoid thermal bridges at the wall–window junction is to install the window within the insulation layer. The junction geometry shown in
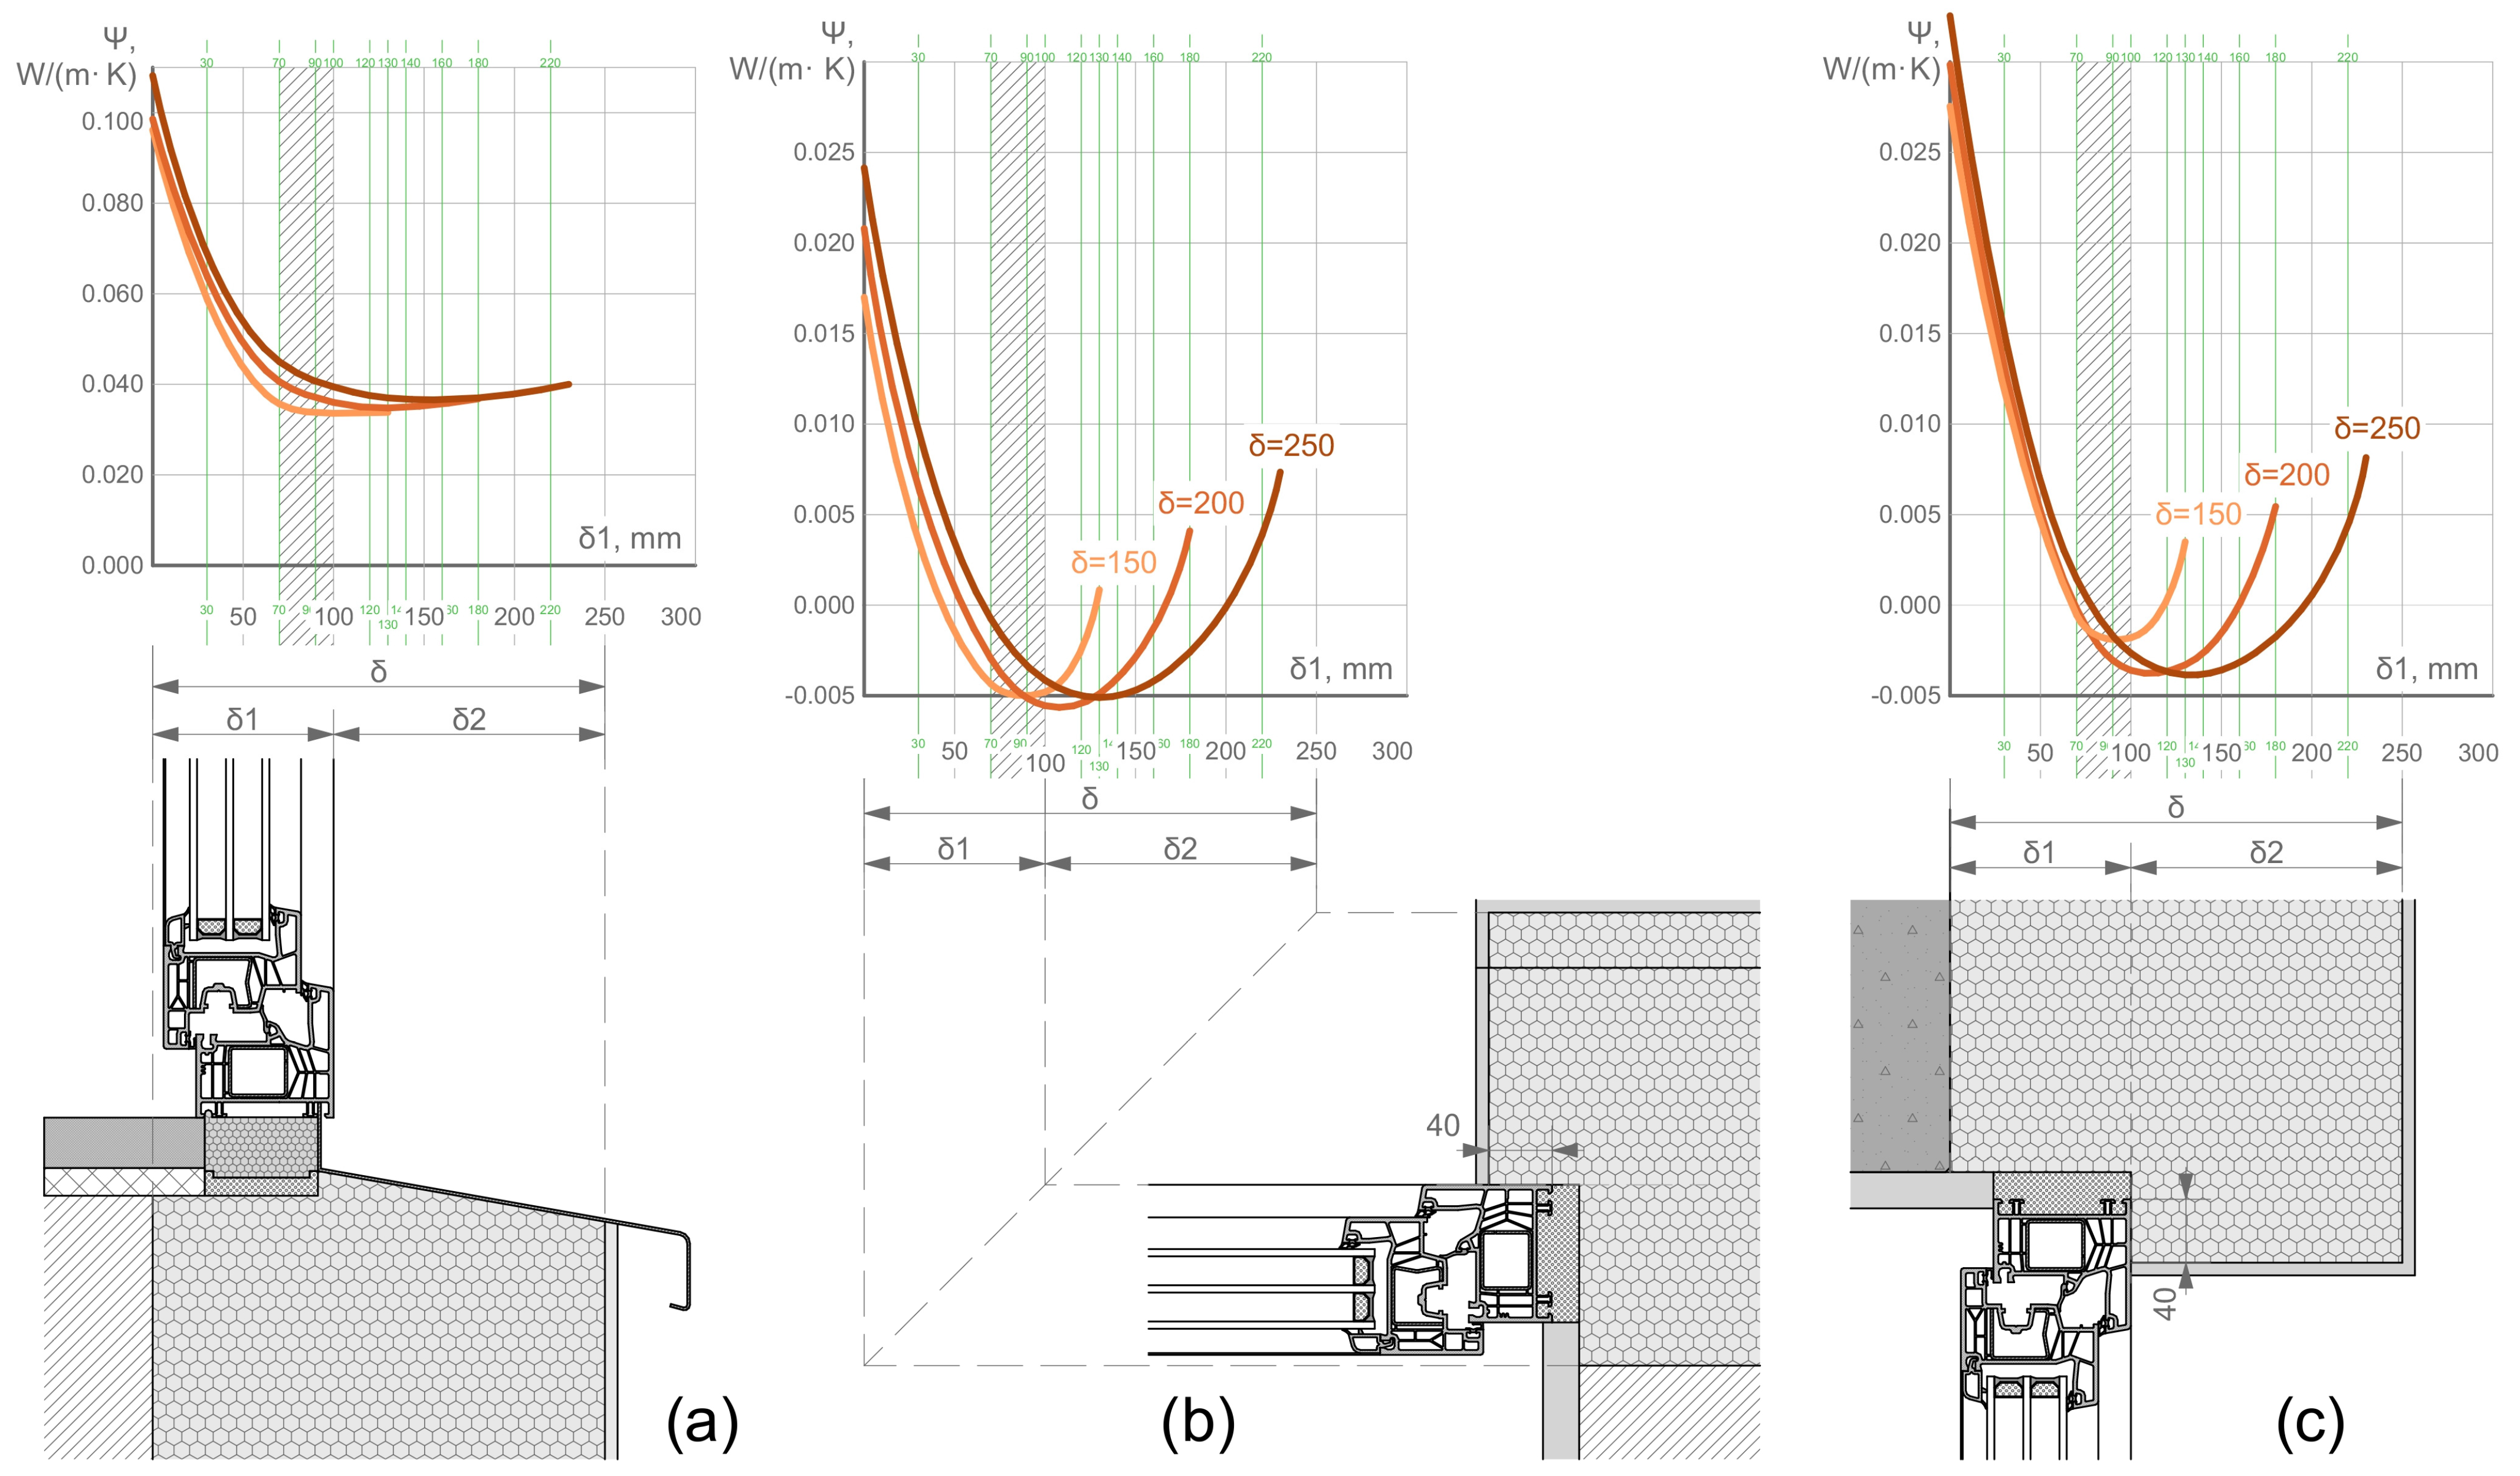
Figure 7 illustrates a model of the bottom window junction used for optimisation calculations, in which the window installation depth (
δ1) and EPS insulation thickness (
δ) are varied for three common insulation layer thicknesses: 100, 150, and 200 mm. An example of the numerical modelling results, including the temperature field and temperature factor, is presented on the right side of
Figure 7Numerical simulations evaluated the influence of installation depth, starting from
δ = 0 mm. As shown in
Figure 8, the resulting linear thermal transmittance (
ψ-value) depends strongly on the installation depth relative to the structural wall and on the insulation thickness. The most important finding is a clear minimum in the
ψ-value curve versus installation depth within the insulation layer. The greatest window displacement does not improve—and even worsens—the overall thermal performance of the junction. This effect is especially pronounced at the side and top junctions, where there is no windowsill providing additional thermal bridging. The optimum zone for the observed model lies between 7 and 12 cm (striped area in
Figure 8) and shifts deeper with thicker insulation layers—thicker insulation requires greater installation depth. This optimum installation depth is a general feature that persists for other wall-core/insulation thermal conductivities, although the optimum position may shift with material properties and insulation thickness.
Similar research [
25,
26] also confirms the finding that the installation of a window in the insulation layer at varying depths exhibits a clear optimum in the linear thermal transmittance curve, and increasing the insulation layer thickness applied to different wall core materials (aerated concrete, ceramic block, and silicate brick) consistently increases the
ψ-value at the bottom window–wall junction.
A particularly interesting finding is the negative
ψ-values at the side and top junctions, indicating that this installation method not only avoids additional thermal losses around the frame perimeter but also creates extra thermal resistance there. Numerical values near the optimum zones (striped areas in
Figure 8) are below 0.04 W/(m·K) for the bottom junction and negative for the side/top junctions. Note that
ψ-values may vary for different buildings and insulation materials, but the curve minimum will remain.
3.1.3. Overlapping the Window Frame by Insulation
When window replacement or relocation is not feasible, overlapping the existing frame with external insulation (
Figure 5) is the primary method for improving thermal performance around the window perimeter. This technique applies an insulation layer directly over the frame, effectively extending the thermal barrier and minimising linear thermal bridges at the window–wall junction. Widely adopted in building renovations, it provides a cost-effective retrofit solution without major structural alterations. In new construction, combining frame overlap with installation of the window within the insulation layer yields optimal thermal performance by further reducing thermal transmittance values.
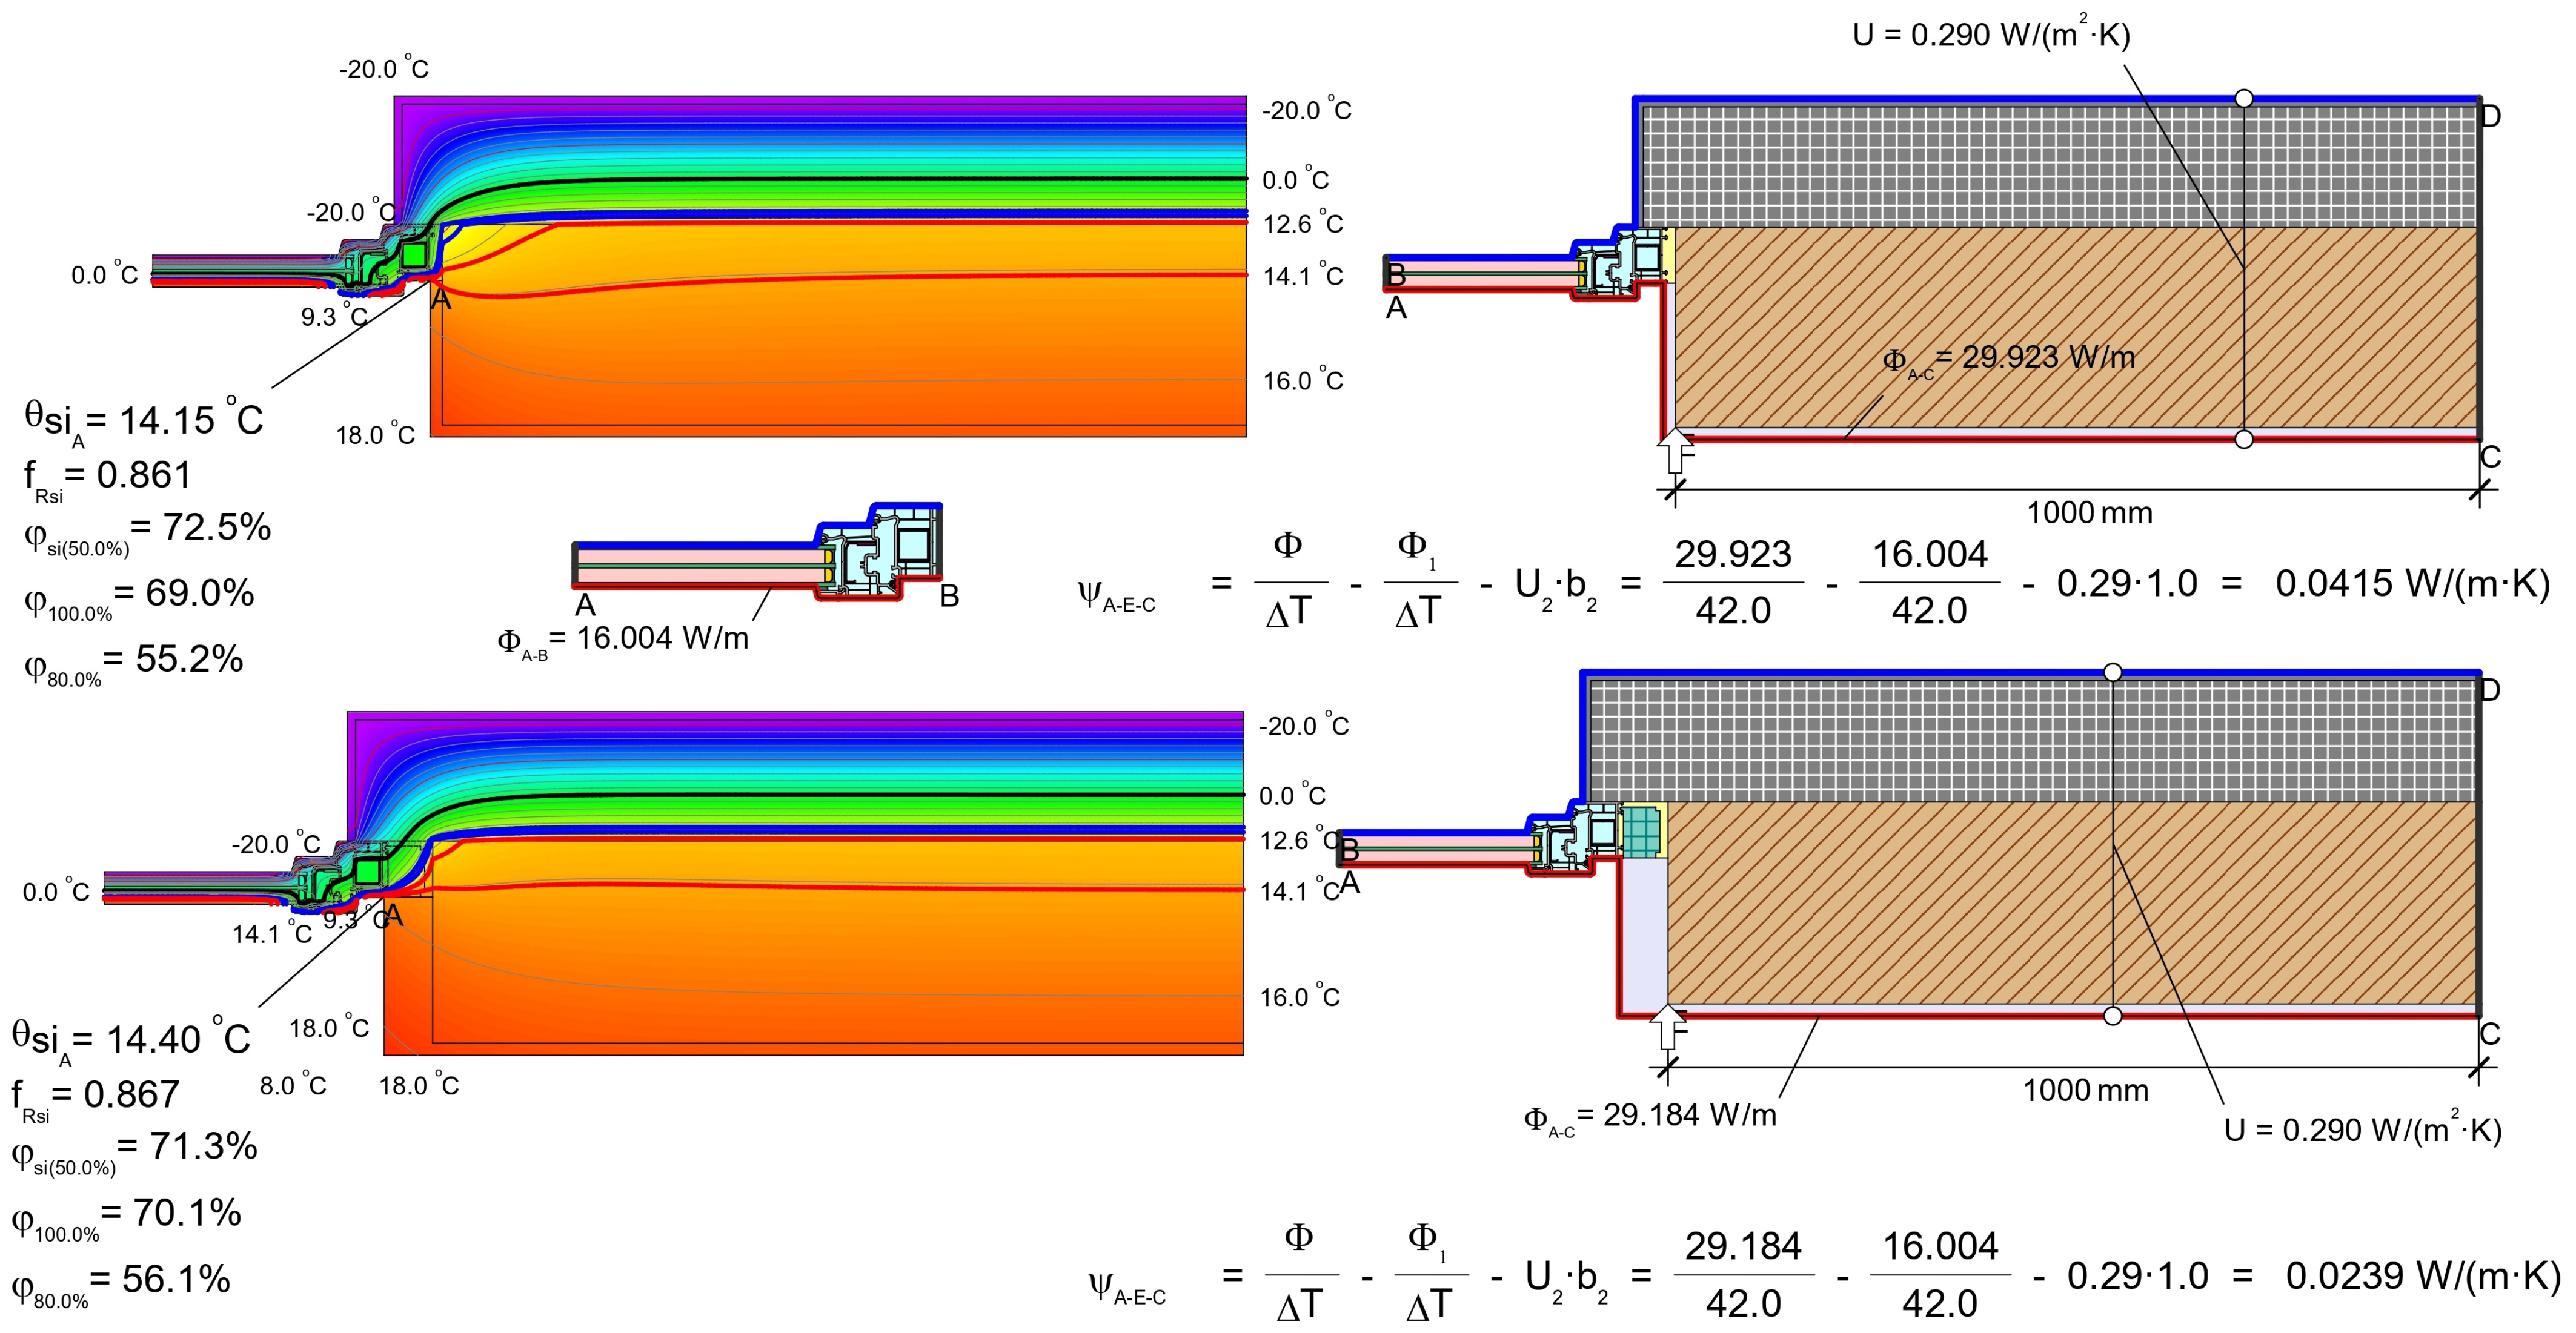
As shown in
Figure 9, insulation overlap has a significant influence on the linear temperature field across the window–wall junction. Half-frame overlap (20 mm from 40 mm frame size) reduces the
ψ-value to 0.04 W/(m·K) even in the case of a traditional mounting method, whereas, when the window is mounted using a special frame extension system, the
ψ-value is reduced by approximately half, down to about 0.02 W/(m·K). In practice, such frame extension systems offer an excellent means of achieving nearly thermal-bridge-free installation in new buildings, where the opening geometry and sequencing can be planned. However, their application in renovation projects is often limited.
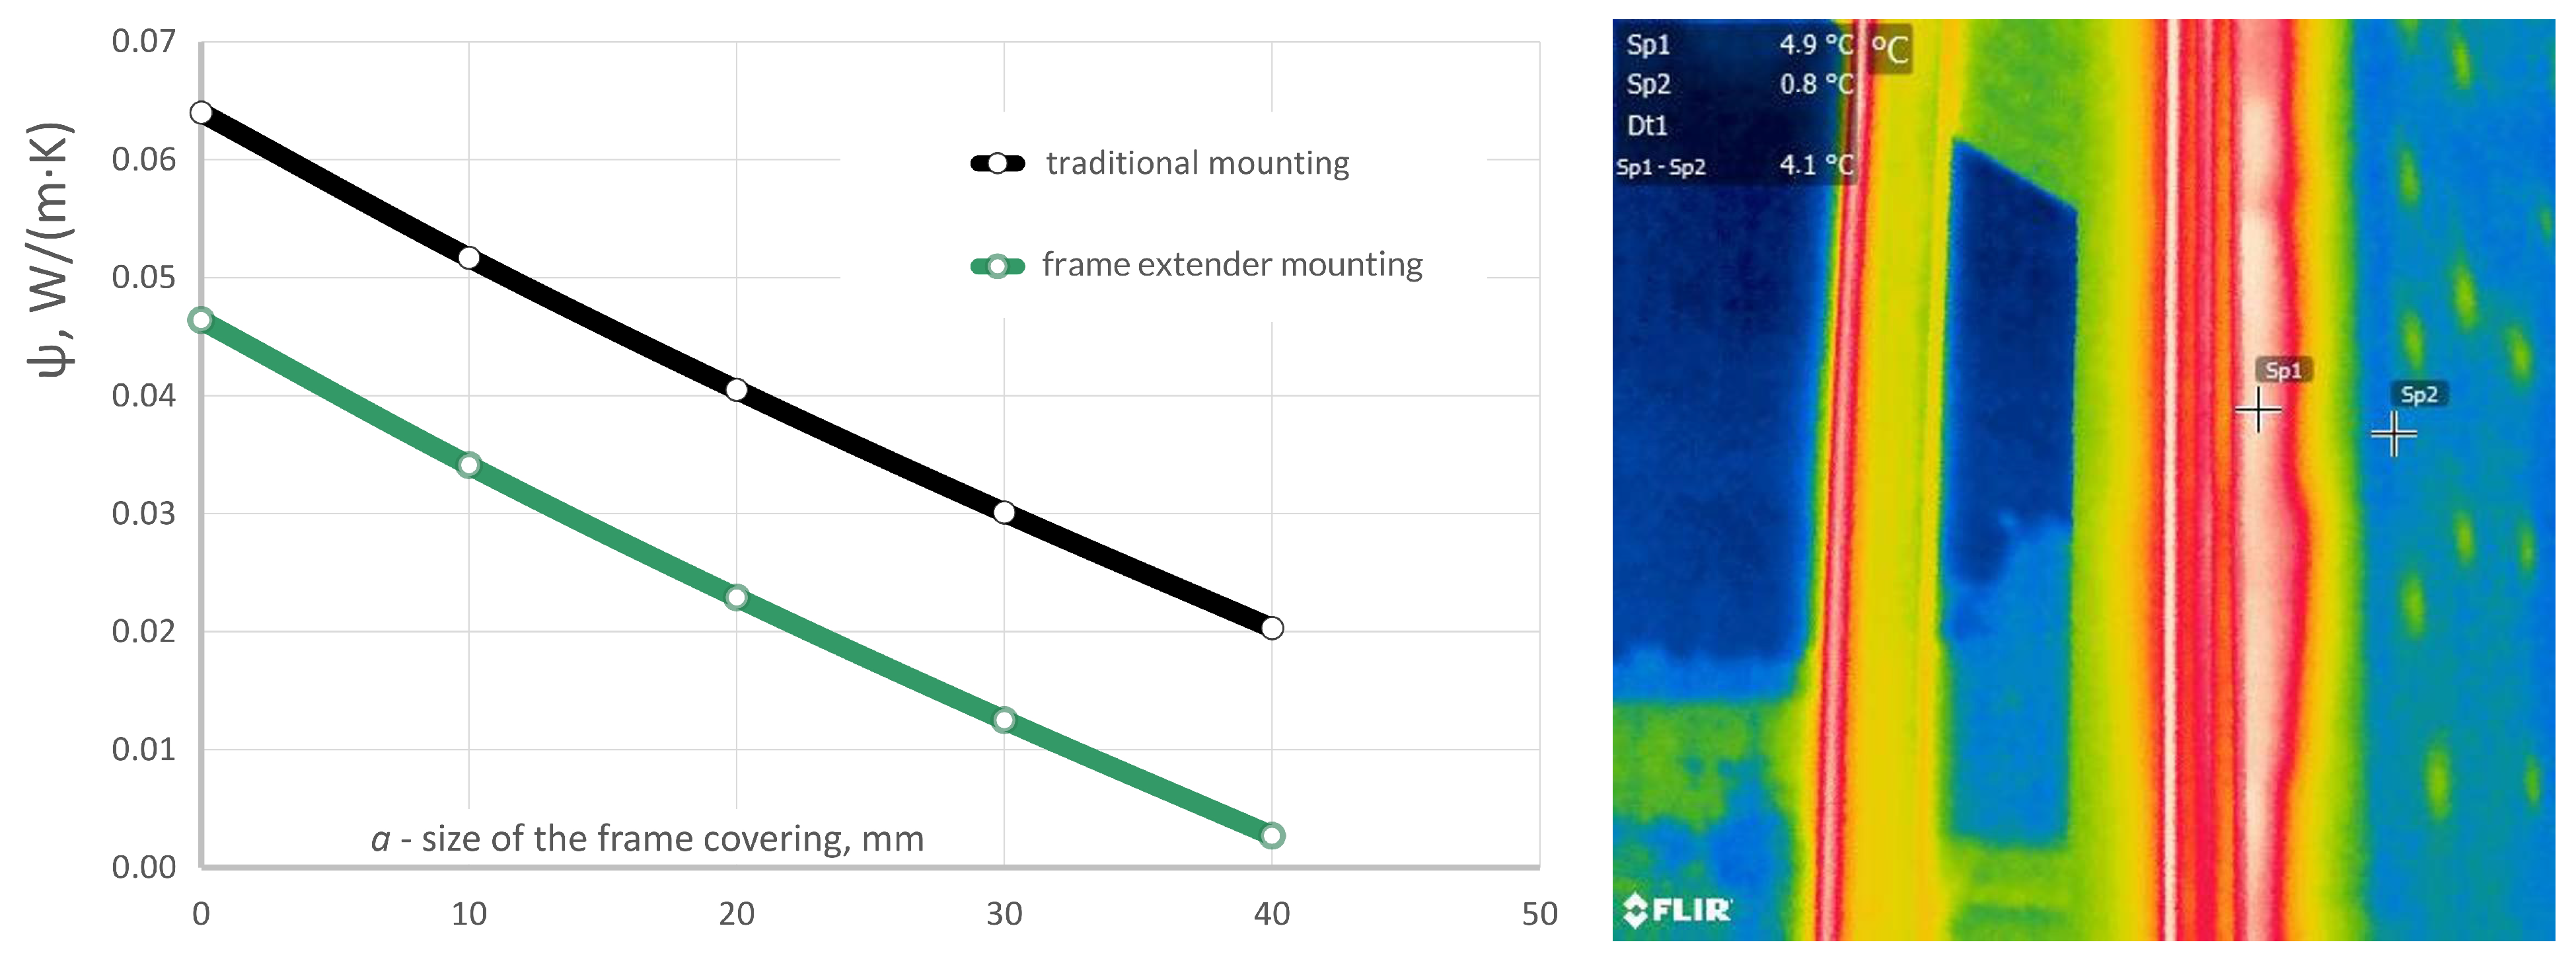
A study of the frame overlapping depth was carried out, since full coverage of the window frame is not always feasible in practice due to architectural or structural constraints. The calculated
ψ-values shown in
Figure 10 decrease almost linearly with increasing frame overlapping depth
a (
Figure 5) for both traditional mounting and mounting with frame extenders. As the overlap increases to the maximum considered size (
a = 40 mm), the
ψ-value falls to about 0.02 W/(m·K) for traditional mounting and approaches 0.005 W/(m·K) with frame extenders, demonstrating that deeper covering of the frame edge substantially reduces linear thermal losses and allows the detail to approach the Passive House rule [
24] for a thermal-bridge-free condition, i.e.,
ψ < 0.01 W/(m·K).
The effect of external insulation can be observed using infrared thermography, which reveals the surface temperature distribution and thermal-bridge effects at the window–wall junction [
27]. To illustrate this, an infrared thermography image of a traditionally mounted window without insulation overlap (
a = 0) is shown in
Figure 10; the image shows a pronounced temperature anomaly along the window–wall perimeter (Δ
T ≈ 4.1 °C between the marked points on the wall), indicating a strong thermal-bridge effect when the frame is not covered by external insulation.
3.2. Internal-Surface Temperature
Every thermal bridge is not only a source of additional heat loss but also a potential cause of surface condensation, mould growth, and gradual degradation of building components. Therefore, careful window installation design is essential to maintain sufficiently high internal-surface temperatures at reveals and junctions to prevent moisture-related damage over the building’s service life.
In this context, two key hygrothermal indicators are evaluated during numerical simulations: the internal-surface temperature at the most critical point of the junction and the corresponding temperature factor is calculated according to Equation (2). Calculations were performed using indoor and outdoor air temperatures of 20 °C and −20 °C, respectively. The following analysis compares these parameters across different window–wall junction configurations—traditional mounting, frame extenders, installation in the insulation layer, and frame overlap solutions.
The numerical analysis of internal-surface temperatures and corresponding temperature factors confirms that all investigated window–wall junction concepts, with the exception of traditional mounting without insulation overlapping, can be designed to satisfy the mould-prevention criterion
for cool and temperate climate zones,
for a cold climate zone or
for the Arctic climate zone [
24]. The use of frame extender systems without additional insulation overlapping increases
from 0.73 to 0.82 (
Figure 6). However, combining both frame extenders and frame insulation overlapping yields substantially higher performance, with
values reaching 0.87 for side junctions (
Figure 9), indicating minimal temperature drop around the window perimeter even under severe external conditions.
For window installation within the insulation layer, the calculated internal minimum surface temperatures at the bottom, side, and top junctions increase with growing external insulation thicknesses of 150, 200, and 250 mm, respectively (
Figure 11). In each case, the temperature curves exhibit a distinct maximum within the insulation layer, indicating an optimal installation depth where reduced thermal bridging improves internal-surface temperature. Parametric analysis shows that
is maximised at installation depths corresponding to the
ψ-value minima (see
Figure 8), with the optimal position located approximately 50–60 mm into the insulation layer.
This behaviour is consistent across all three junction types, although the absolute temperature levels differ, with the side and top junctions generally attaining higher values due to reduced influence of structural thermal bridges in those regions. The curves further demonstrate that positioning the frame too far towards either the exterior or interior leads to a reduction in surface temperature, which corresponds to an increase in -value and thermal bridging intensity.
For the bottom junction (
Figure 11a), increasing the insulation thickness from 150 mm to 250 mm raises the internal minimum surface temperature by approximately 1–2 °C at the optimal installation depth, directly translating into higher
values and a larger safety margin against condensation. At the side junction (
Figure 11b), the same trend is observed, but the relative gain in temperature with increasing insulation thickness is more pronounced, as the heat flow path is less constrained by structural elements and the continuous insulation layer is more effective. The top junction (
Figure 11c) exhibits the highest internal-surface temperatures among the three configurations, with minimum temperatures remaining well above the critical mould threshold of approximately 12.6 °C for standard indoor conditions (20 °C indoor temperature and 50% relative humidity, ref. [
23]). Consequently, no mould growth risk is observed in any of the modelled junctions. These results highlight that installation in the insulation layer is particularly effective for preventing surface condensation and mould growth at window–wall junctions; however, the bottom junction remains the most critical location and therefore demands careful detailing to ensure adequate thermal performance.
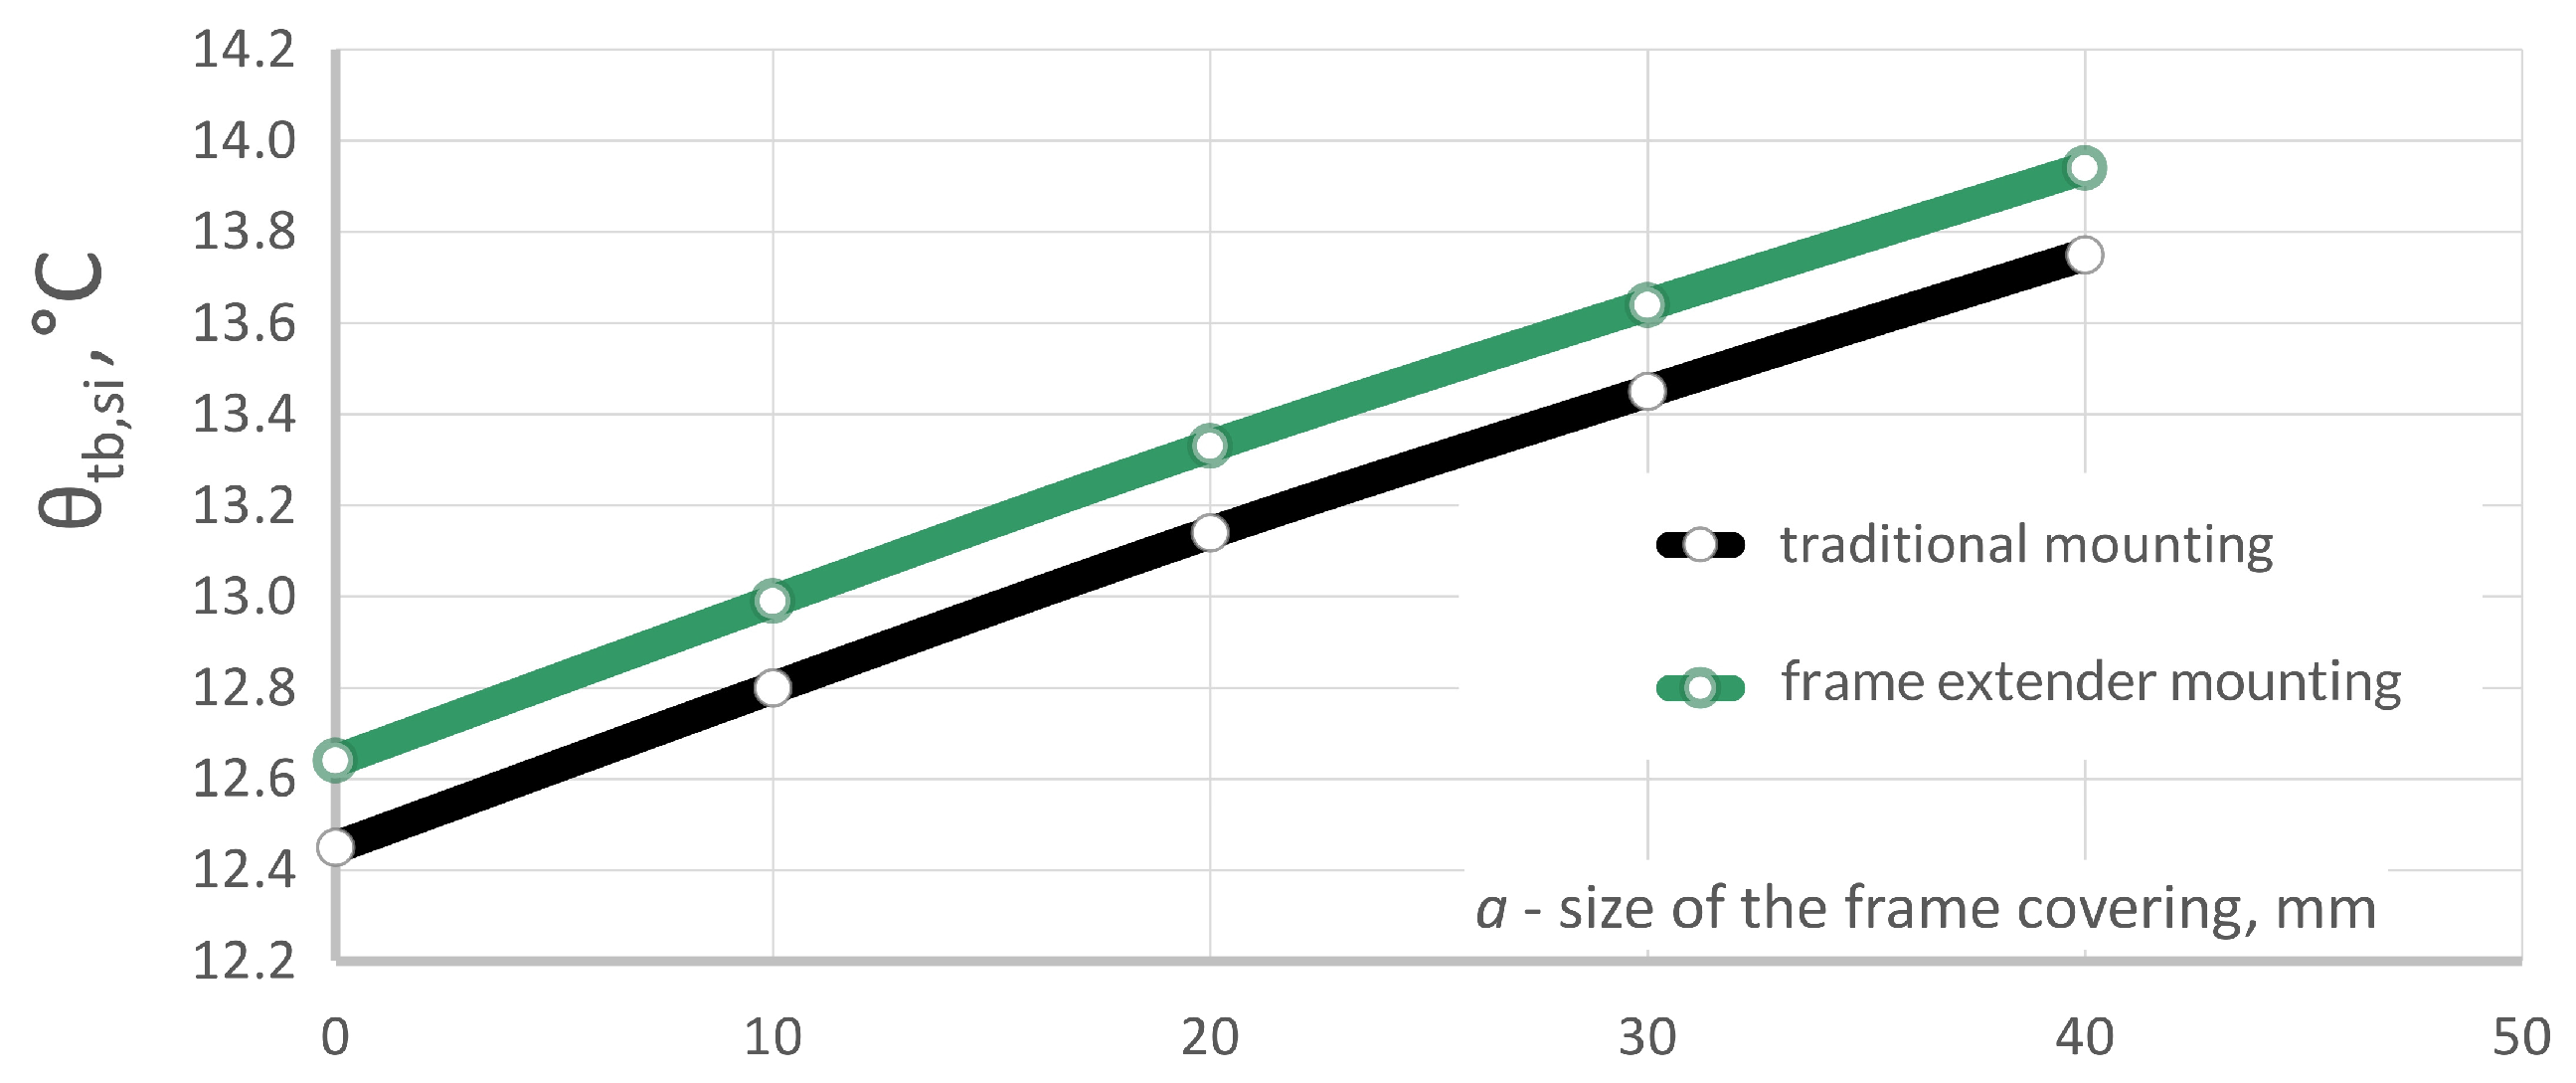
Figure 12 demonstrates the influence of insulation overlapping for traditional and frame-extender window mountings on the internal-surface temperature
as a function of frame covering depth
a for both concepts. The results show that with a full frame overlap of 40 mm, the minimum internal-surface temperature remains safely above the critical mould threshold of 12.6 °C, whereas with zero or minimal overlap, it falls substantially below this critical value, presenting a significant condensation and mould risk. A nearly linear increase in
is observed with increasing overlap depths for both traditional mounting and installation on frame extenders, indicating that additional external covering of the frame effectively lengthens the heat-flow path and reduces the intensity of the thermal bridge. The frame-extender solution consistently yields higher internal-surface temperatures than traditional mounting, corresponding to relevant improvements in the temperature factor
. For overlap depths of 20 mm and greater, the internal-surface temperatures for both configurations exceed 13 °C, effectively eliminating the risk of surface condensation and associated mould growth. Consequently, frame overlapping of at least 20 mm is highly recommended for all window installation types to ensure adequate hygrothermal performance and building durability.
From a design perspective, the most effective strategy for achieving favourable internal-surface temperatures at window–wall junctions combines two complementary approaches: installing the window within the external insulation layer at an optimal depth of 5–6 cm, and applying sufficient frame overlap by insulation or façade covering. For renovation scenarios where full relocation of the window into the insulation layer is not feasible, a frame overlap of 3–4 cm can secure mould-free internal-surfaces, provided that the minimum internal-surface temperature is maintained above the critical threshold. The use of frame extenders in combination with frame covering depths provides a robust alternative to in-layer installation, delivering comparable internal surface temperatures. Consequently, both installation depth and frame overlap should be treated as key design parameters in numerical thermal-bridge calculations and optimisation of window–wall junctions, particularly in climates and indoor use conditions where surface moisture control is critical for long-term building durability and indoor environmental quality.
3.3. Economic Analysis of Optimised Window Installation: Case Study on a Residential Building
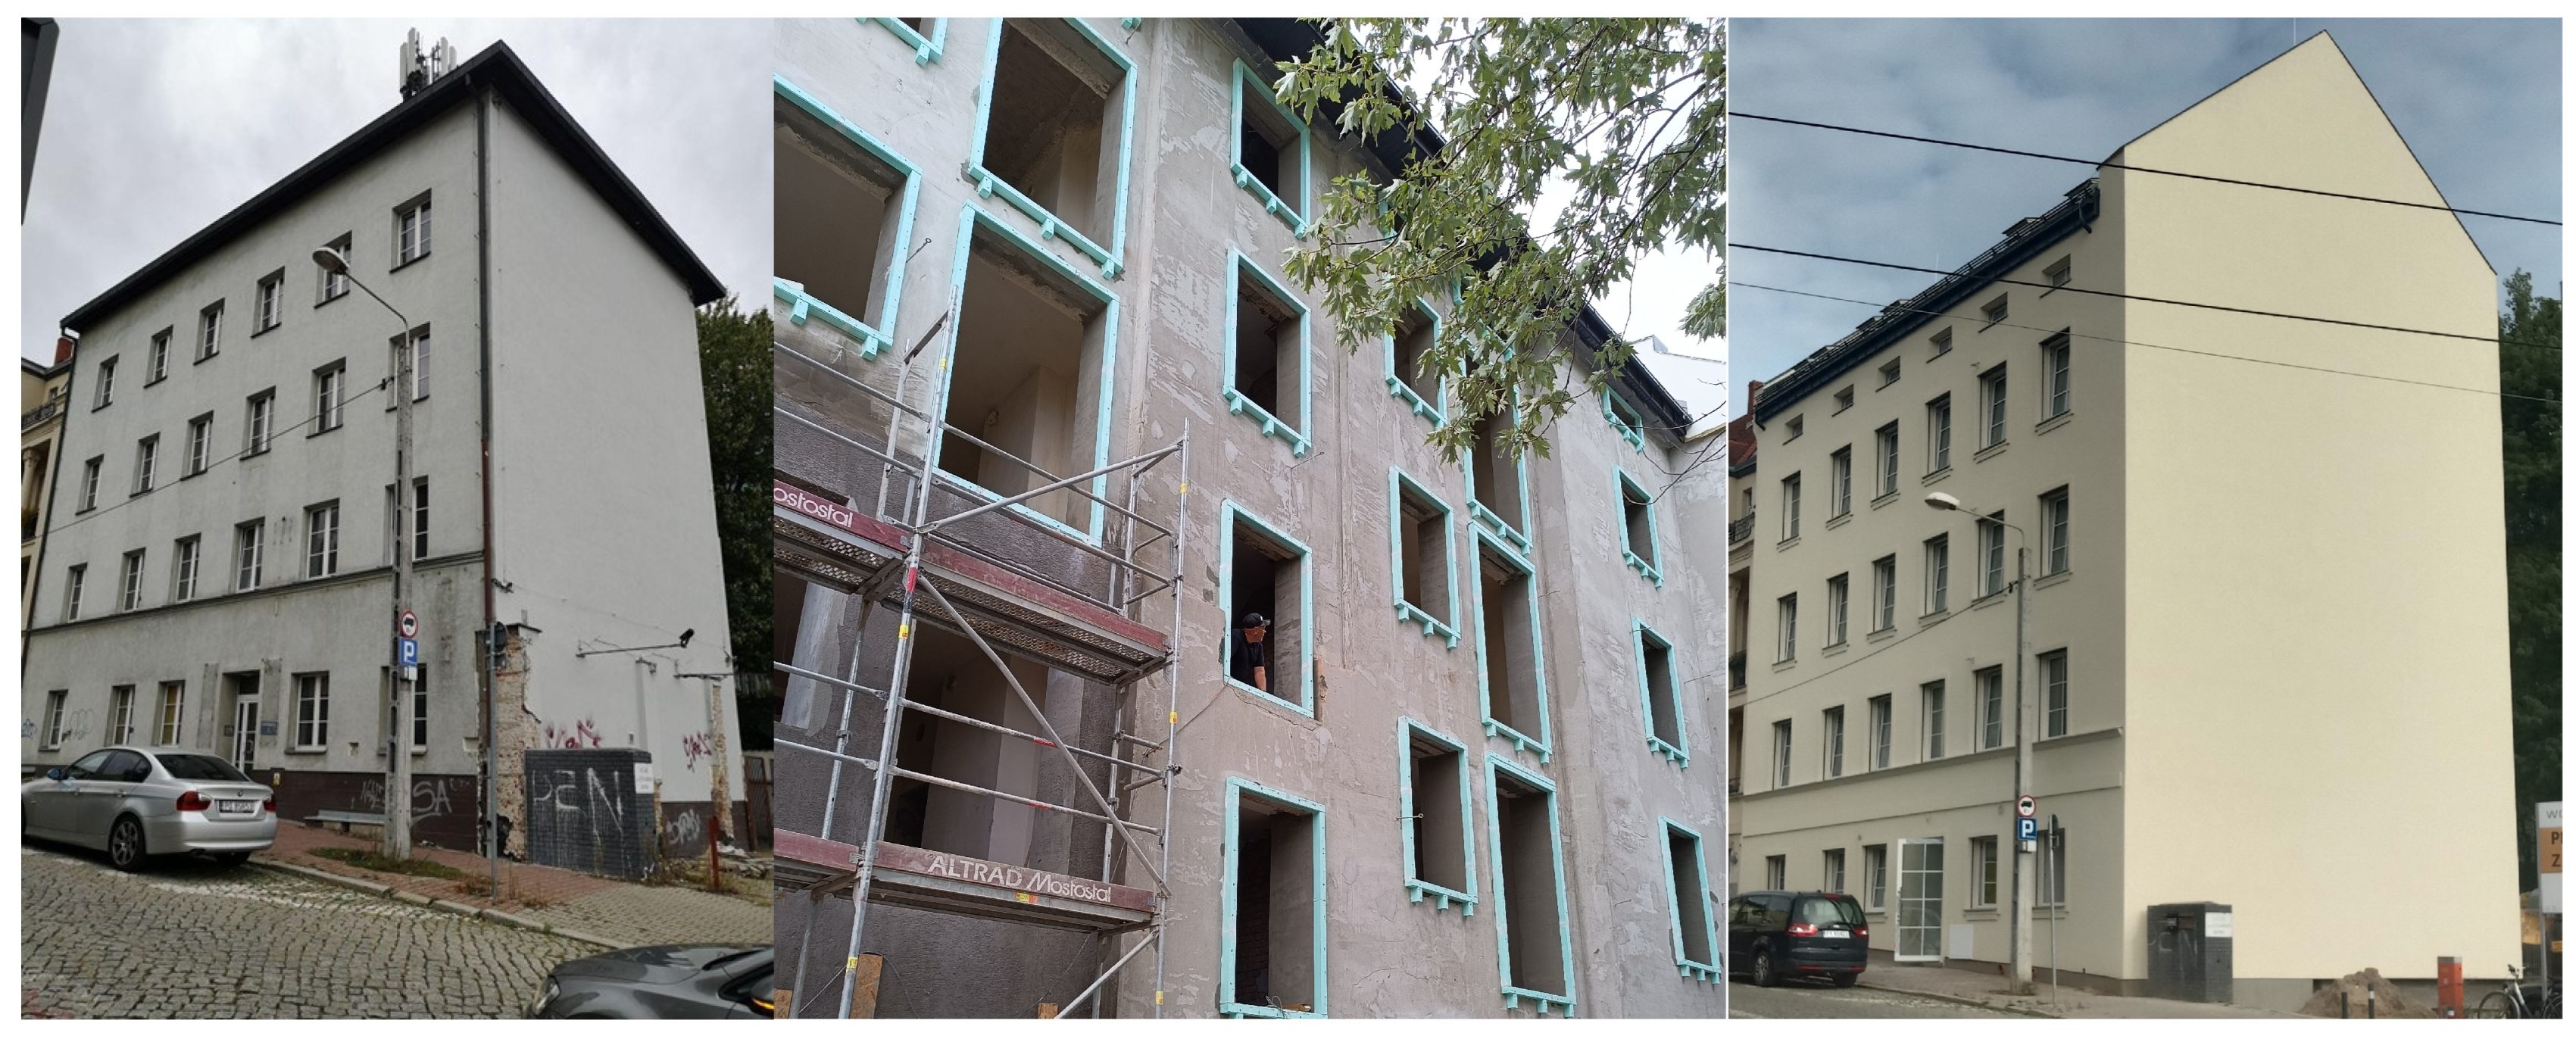
To evaluate the economic benefits of window installation within the insulation layer (also called pre-wall mounting), a case study was conducted on an older residential building in Poznań, Poland (
Figure 13), renovated in 2025. The building was selected for retrofitting according to Passive House [
28] requirements due to its architectural simplicity and favourable solar orientation. The renovation strategy integrated such energy efficiency measures: enlargement of south-facing windows to maximise solar heat gains, addition of external thermal insulation to the façade and roof structure, and complete replacement of fenestration with high-performance triple-glazed units with emphasis on eliminating installation thermal bridges at junctions. The critical intervention for this economic analysis was the selection of a pre-wall mounting system VSThermo [
29] for anchoring windows within the external insulation layer, ensuring optimised thermal performance at the window–wall junction as detailed in the preceding sections.
The building’s energy balance was calculated using the Passive House Planning Package (PHPP) [
29], a tool for assessing compliance with the Passive House standard and predicting annual heating demand. The PHPP calculation methodology incorporates detailed thermal-bridge modelling for different building junctions, including the linear thermal transmittance at window and door installation perimeters (denoted in PHPP as thermal-bridge loss coefficient of the respective installation situation,
ψinst). Two scenarios were modelled: traditional window mountings within the structural wall with calculated installation thermal bridge
ψinst values of 0.27 W/(m·K) for bottom, 0.19 W/(m·K) for side, and 0.19 W/(m·K) for top junctions; and window installation in the insulation layer with
ψinst values ranging from 0.02 to 0.05 W/(m·K). The total installation perimeter of window–wall junctions on both building façades is 435 m.
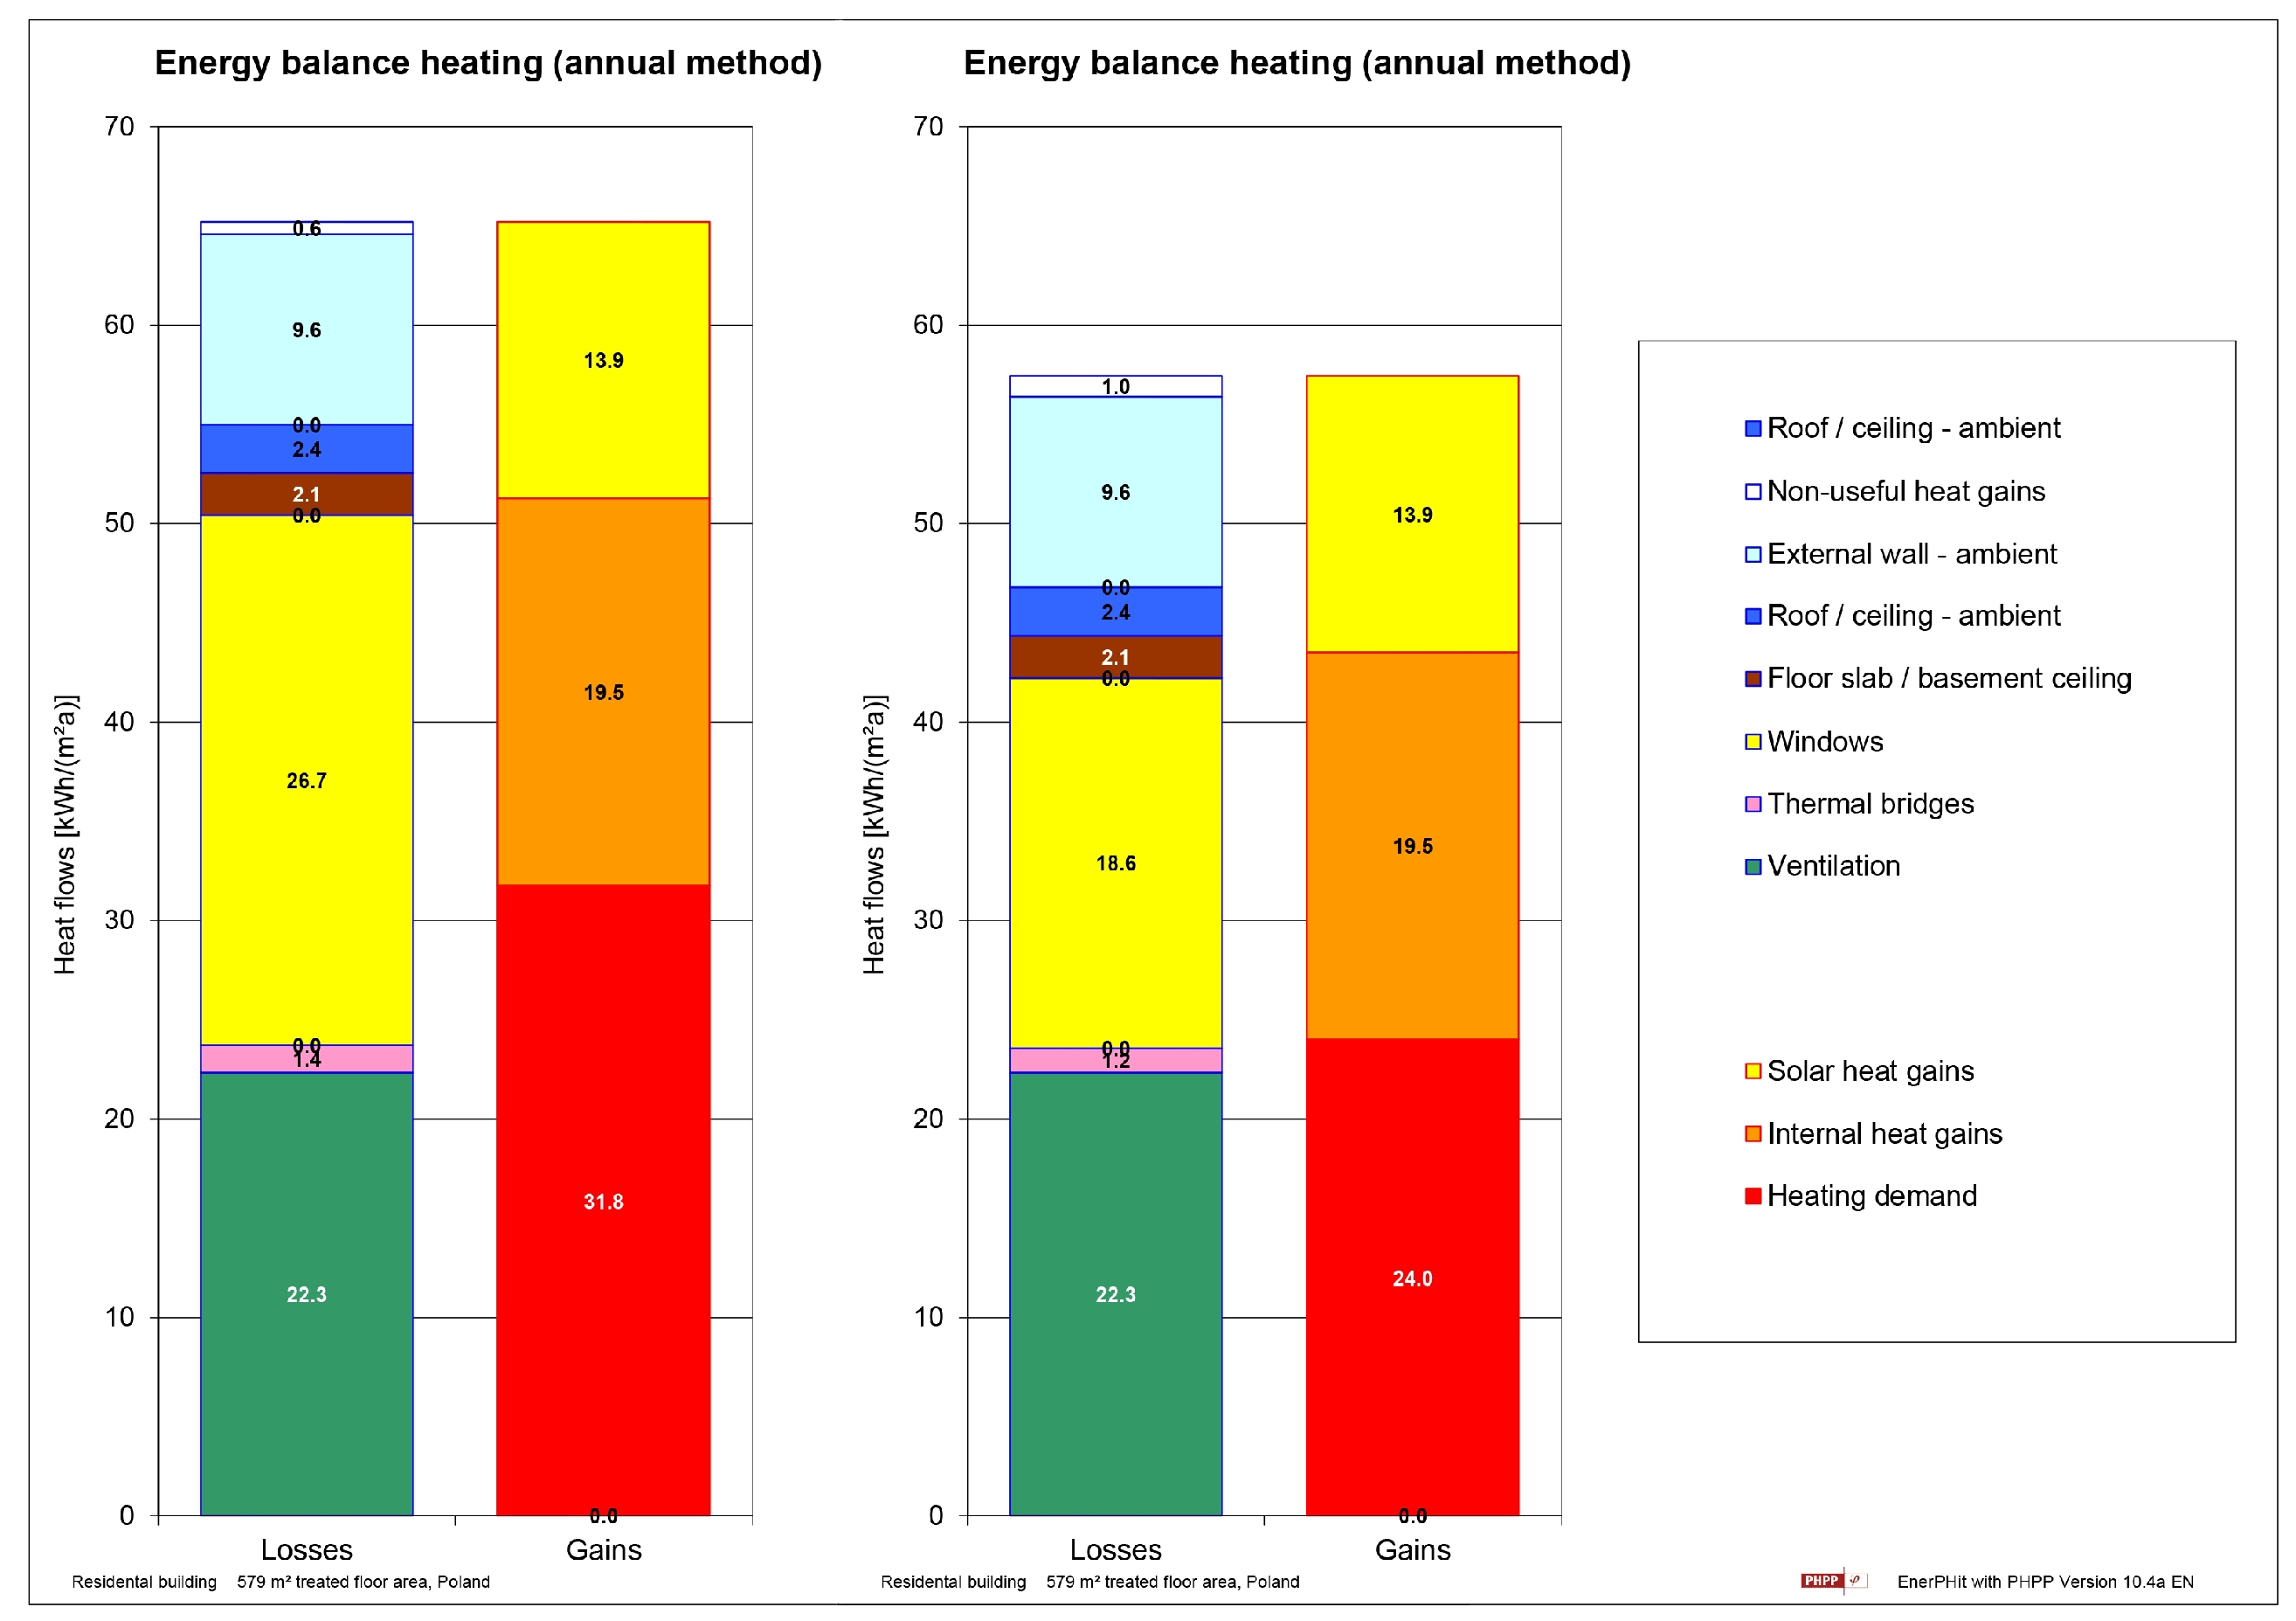
The annual energy balance results for both installation methods are presented in
Figure 14, which displays the building’s heat balance for the traditional and installation in the insulation layer scenarios. The most significant finding is the substantial reduction in transmission heat losses when applying pre-wall window installation—the annual heating energy demand is reduced from 31.8 kWh/m
2 to 24.0 kWh/m
2. Since the only parameter changed between the two models is the installation of windows and balcony doors within the insulation layer, the reduction in heat losses by approximately 30% is attributable solely to the minimization of thermal bridges at window–wall junctions, which is explained by the improved thermal continuity of the insulation layer when windows are positioned within it, as demonstrated in the preceding sections. The remaining heat losses and gains are identical across both scenarios, confirming that the energy benefit is solely dependent on the window installation method. This energy saving directly translates into substantial operational cost reductions over the building’s service life of 50 years.
To assess the financial viability of window installation in the insulation layer, a simplified lifecycle cost analysis was performed over a 50-year design period, representing a typical building operational lifespan. The analysis compares the additional initial investment required, which serves as the baseline cost reference. Annual heating costs are calculated using PHPP-derived heating demands and a natural gas heating system with an energy price of 0.9 €/m3. The analysis assumes constant energy tariffs, representing a conservative scenario.
Key findings from the analysis are presented in
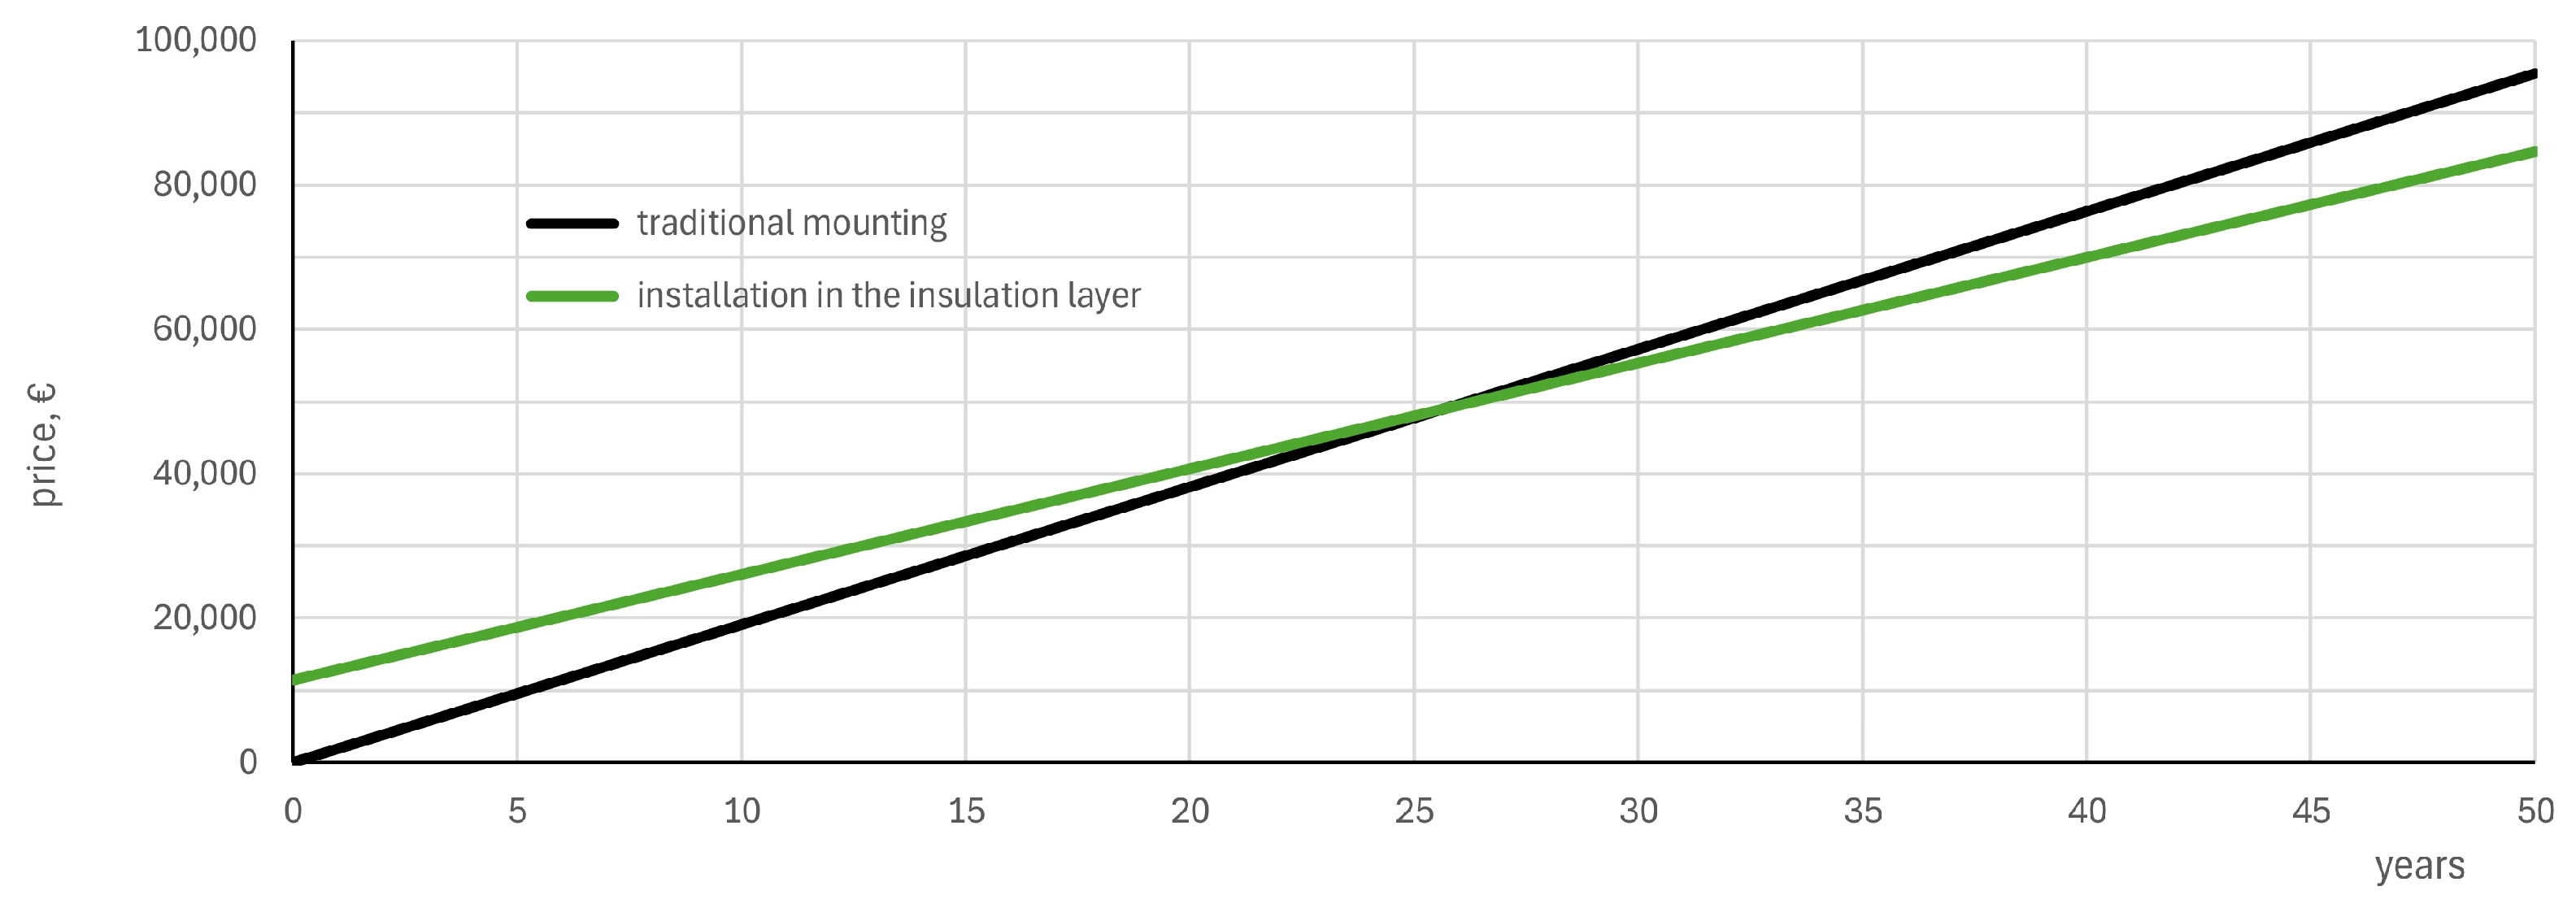
Table 4: the initial additional cost for window installation in the insulation layer (pre-wall mounting) is approximately €11,423, with annual operational savings of approximately €445 per year based on the calculated reduction in heating demand. Over a 50-year lifecycle, the cumulative operational savings (€10,827) exceed the initial investment premium, yielding a net positive return on investment. The cumulative heating costs for both installation methods are shown in
Figure 15, where the curves intersect at year 25, indicating the simple payback period for the additional investment. This payback period is well within the typical service lifespan of building-envelope components (windows and insulation systems are designed for 30–50 years) and represents a financially acceptable return for energy efficiency investments.
The economic viability of window installation in the insulation layer is sensitive to energy tariffs, upfront costs, and heating demand reduction. The base-case analysis assumes constant tariffs; however, with a typical energy escalation of 3% annually, the payback period reduces to approximately 20 years, and lifecycle savings increase substantially. Regional variations in labour costs and installation expertise may affect the upfront investment, but the analysis confirms that window installation in the insulation layer is economically justified for residential building retrofits in cold and temperate climates.
4. Discussion
In buildings with low heating energy demand, such as nZEB, where overall heat losses are minimised, the relative impact of small thermal bridges becomes more pronounced. Window junctions alone can account for up to 30% of heat losses through window assemblies, underscoring the critical importance of precise mounting strategies for compliance with standards such as Passive House and for avoiding condensation and mould growth at interior surfaces.
Installing windows on specialised insulation frames, overlapping window frames with insulation material, or placing them within the thermal insulation layer are effective strategies to reduce installation-related thermal bridges. Numerical simulations demonstrate that linear thermal transmittance (ψ-values) at window-to-wall junctions can be reduced by up to 80% compared to traditional in-plane installations, depending on insulation thickness and frame detailing. For new buildings, in-layer installation combined with frame overlapping provides optimal performance, reducing ψ-values by approximately 90%, while for renovations, frame overlap of 30–40 mm emerges as the most practical and effective solution, reducing ψ-values by roughly 50%.
A key finding is the non-linear relationship between ψ-values and installation depth; rather than improving monotonically with deeper placement, the performance curves exhibit distinct minima. This optimum shifts further into the insulation layer as its thickness increases, indicating that thermal performance depends on balancing the thermal coupling of the frame with structural considerations. The occurrence of negative ψ-values at side and top junctions further confirms the benefit of in-layer installations.
All optimised variants—frame extenders, in-layer installation, and frame overlapping—maintain internal-surface temperature factors ≥ 0.75 under design winter conditions, effectively eliminating the risk of surface condensation and mould. Traditional mounting without insulation overlap remains the only configuration where these hygrothermal risks persist, particularly at sill regions.
Although initial investment costs are higher, the simple payback period of 25 years is competitive with other energy efficiency measures. Sensitivity analysis shows that, assuming a conservative 3% annual increase in energy costs (in line with European trends), the payback period can be reduced to around 20 years.
Beyond economic returns, the reduction in annual heating demand translates into significant greenhouse gas emissions reductions. For the case study building, the shift to in-layer installation with frame overlap reduces annual CO
2 emissions by approximately 0.92 tonnes CO
2eq/year (based on natural gas combustion with 90% efficiency and IPCC emission factors [
30]), or 46 tonnes over the 50-year lifecycle, contributing meaningfully to climate mitigation objectives and supporting broader decarbonization targets for the building stock.
These results position optimised window installation as a critical and economically viable strategy for achieving high-performance building envelopes, offering practical guidance for architects and engineers in thermal-bridge mitigation.
A comprehensive technical catalogue [
31] containing detailed thermal-bridge calculations for over 40 modelled window–door junction variants across multiple building typologies is available as a
Supplementary Material. The catalogue systematically documents
ψ-value optimisation strategies for all major window and door installation types; each junction variant includes calculated
ψ-values, internal-surface temperatures
, temperature factor
and applicability criteria for different wall core materials (aerated concrete, ceramic brick, silicate brick, expanded clay concrete) and insulation thicknesses. This technical resource enables practitioners to rapidly identify optimised junction details suited to their specific project requirements and building typology, significantly accelerating the design process for nZEB and Passive House compliance.
There are also a few limitations to this study that must be noted. The analysis is based on steady-state 2D FEM thermal-bridge modelling under fixed boundary conditions, using constant material properties; therefore, time-dependent outdoor meteorology, moisture-dependent behaviour, and coupled HAM effects are not represented. In addition, the junction models assume ideal workmanship (perfect contact/airtight installation), and the case-study impacts are derived from PHPP scenario calculations rather than dedicated in situ validation measurements.
5. Conclusions
The present study demonstrates that thermal bridges at window-to-wall junctions, which represent a substantial share of transmission losses in high-efficiency buildings with large window areas, can be significantly reduced through optimised installation strategies tailored to building type (new construction versus renovation) and associated construction constraints.
For renovation projects, frame overlap emerges as the most effective and practicable solution, approximately halving linear thermal transmittance and raising internal-surface temperatures above mould-safety criteria. For new buildings, pre-wall mounting combined with frame overlapping provides superior performance, reducing ψ-values significantly and systematically achieving > 0.8 for all junction types. These optimised variants maintain hygrothermal safety and energy efficiency standards across all configurations, whereas traditional mounting without insulation overlap remains inadequate.
From a lifecycle perspective, the additional investment associated with optimised installation is recovered within approximately 20–25 years through reduced heating demand, which aligns with the service life of window and insulation systems. This economic viability, combined with reductions in greenhouse gas emissions, supports both financial and environmental sustainability objectives.
These results provide a concise decision framework for sustainable envelope design: frame overlap should be considered a minimum requirement in renovation, whereas in-layer installation with overlap should be regarded as the preferred option in new construction. Adopting these strategies enables practitioners to systematically limit thermal-bridge effects, enhance indoor environmental quality, and support climate mitigation objectives associated with high-performance building stocks.





 ,
,