Article

Spatiotemporal Evolution, Regional Differences, and Configurational Paths of Green Total Factor Productivity in China’s Power Industry Driven by Digital Economy Factors

by
Junqi Zhu
1,
Keyu Jin
1,
Huayi Jin
1,*,
Yuchun He
2 and
Sheng Yang
3
1
School of Economics and Management, Anhui University of Science and Technology, Huainan 232000, China
2
Business School, University of Shanghai for Science and Technology, Shanghai 200093, China
3
Institute of Scientific and Technological Information, Nanjing University of Aeronautics and Astronautics, Nanjing 211106, China
*
Author to whom correspondence should be addressed.
Sustainability 2026, 18(7), 3377; https://doi.org/10.3390/su18073377
Submission received: 6 March 2026 / Revised: 26 March 2026 / Accepted: 27 March 2026 / Published: 31 March 2026
(This article belongs to the Section Energy Sustainability)

Abstract

Under the dual strategic imperatives of carbon neutrality and digital transformation, the power industry plays a pivotal role in advancing green and low-carbon development. Green Total Factor Productivity (GTFP) provides a comprehensive measure of efficiency in the power sector under energy and environmental constraints. Using panel data from 31 Chinese provinces over the period 2012–2023, this study employs a super-efficiency Slacks-Based Measure (SBM) model, kernel density estimation, standard deviation ellipse analysis, the Gini coefficient, and fuzzy-set Qualitative Comparative Analysis (fsQCA) to systematically examine the spatiotemporal evolution, regional disparities, and digital-driven improvement pathways of power industry GTFP. The results indicate that national power-sector GTFP exhibits a fluctuating upward trend, accompanied by pronounced regional heterogeneity. A distinct spatial pattern has emerged, characterized by rapid improvement in the western region, relative stability in the eastern region, contraction in the central region, and persistent lagging in the northeastern region. Spatially, the distribution has evolved from an initial east–west dual-core structure to a three-tier gradient pattern led by the west, stabilized in the east, and depressed in the central region. Kernel density estimation reveals a clear multi-peak polarization trend, while standard deviation ellipse analysis shows a relatively stable spatial center with continuously expanding dispersion along the northeast–southwest axis. Further analysis demonstrates that interregional differences remain the primary source of overall inequality, with rapidly widening intraregional disparities in the western region. Configurational analysis identifies five digital-economy-driven pathways to high GTFP, highlighting that no single optimal configuration exists. Instead, multiple combinations of technological, organizational, and environmental conditions jointly facilitate GTFP enhancement. These findings provide empirical evidence to support differentiated and precision-oriented policy design for promoting coordinated digital transformation and green development in China’s power industry.

1. Introduction

Against the dual backdrop of advancing global climate governance and China’s “carbon peaking and carbon neutrality” strategy, the green transformation of the energy and power system has become central to both global energy restructuring and high-quality economic development. As China’s largest source of carbon emissions, the power sector plays a decisive role in achieving the dual-carbon goals [1]. This transition is embedded in a broader global context: China’s commitments under the Paris Agreement link domestic decarbonization to its credibility in international climate governance. Recent geopolitical tensions and volatility in fossil fuel markets since 2022 have highlighted the importance of energy security and system resilience, accelerating global investment in renewable energy. At the same time, the reorganization of global supply chains for key green technologies—driven by policies such as the U.S. Inflation Reduction Act and the EU Carbon Border Adjustment Mechanism—has generated external pressures affecting equipment costs, technology diffusion, and provincial investment decisions. From an international political economy perspective, progress in the global green transition depends in part on whether domestic regions and industries can achieve coordinated transformation and technological complementarities. International developments in decarbonization increasingly influence domestic transition processes through channels such as trade, technology standards, and capital flows, thereby shaping the incentives and constraints faced by different regions. If disparities in regional green efficiency persist, a pattern of “regional fragmentation” may emerge, in which relatively advanced transition regions coexist with areas constrained by structural dependence on carbon-intensive energy systems. Such divergence may complicate the distribution of transition costs and create challenges for maintaining consistent policy implementation in support of long-term climate commitments, including Nationally Determined Contributions (NDCs). In this context, examining the regional dynamics of GTFP in China’s power industry from a multi-level governance perspective provides insights that extend beyond conventional assessments of sectoral efficiency. Within this context, GTFP provides a comprehensive measure of performance in the power sector by incorporating conventional inputs alongside energy use and environmental impacts. It has therefore become an important indicator of the quality and sustainability of the green transition. Meanwhile, digital technologies such as big data, artificial intelligence, and the Internet of Things are reshaping power generation, transmission, and consumption [2]. By improving system intelligence, resource allocation, and organizational efficiency, digitalization has become an important driver of GTFP growth in the power industry [3]. Against the combined trends of low-carbon transition and digitalization, understanding the evolution and improvement pathways of power-sector GTFP is essential for both theory and policy, and for promoting high-quality sectoral development.
A substantial body of research has examined GTFP. In terms of measurement, Zhong et al. (2025) [1] applied the SBM model to estimate provincial GTFP in China from 2011 to 2020. Zaman et al. (2025) [4] combined a slack-based directional distance function with the Malmquist–Luenberger productivity index (MLPI), enabling dynamic decomposition while addressing input redundancy in traditional DEA models. Chen et al. (2025) [5] incorporated functional spatial technology externalities into a mediation framework and improved measurement accuracy using a super-efficiency SBM-DEA model with the Malmquist–Luenberger index. Liu (2025) [6] integrated the SBM-GML model with a spatial Durbin model to jointly analyze efficiency and spatial spillovers. Methodologically, Tian et al. (2025) [7] combined Necessary Condition Analysis (NCA) and fsQCA, showing that high GTFP depends on the interaction of multiple conditions. Wang et al. (2024) [8] used a two-way fixed-effects model and robustness tests including PSM-DID and instrumental variables to estimate the impact of digital transformation on firm-level GTFP. Regarding mechanisms, Chen et al. (2025) [9] identified heterogeneous digital economy effects moderated by human capital. Wan et al. (2025) [10] examined a U-shaped relationship between technical efficiency and GTFP. Shah et al. (2023) [11] decomposed productivity growth into efficiency and technological change and found substantial input redundancy in energy use across South Asia.
Despite the growing literature, several gaps remain. First, the dynamic and systematic analysis of spatiotemporal evolution requires further development. Most studies focus on static GTFP measurement and lack an integrated perspective on distributional change, spatial shifts, and structural differentiation. Second, research on regional disparities is largely limited to aggregate comparisons, with insufficient attention to the temporal evolution and spatial heterogeneity of intra-regional and interregional differences, as well as the role of super-variable density. Third, the integration of influencing factors and improvement pathways remains incomplete. Existing studies are often confined to specific industries or firm-level analyses and rarely incorporate the distinctive features of the power sector within a unified technology–organization–environment (TOE) framework. As a result, multiple pathways through which digital economy factors influence GTFP—and their adaptation to heterogeneous regional conditions—remain insufficiently explored.
In response to these limitations, this study makes three main contributions. First, it develops an integrated framework combining efficiency measurement, dynamic distribution, spatial trajectories, and disparity decomposition, providing a multidimensional view of GTFP evolution. Second, using Gini coefficient decomposition, the study shows that interregional disparities are the main source of overall inequality and clarifies the structural dynamics of regional differences. Third, based on the TOE framework and fsQCA, the study identifies multiple configurational pathways through which the digital economy improves GTFP and explains their regional adaptation. These findings offer empirical support for differentiated digitalization strategies and coordinated green transformation in China’s power sector.

2. Research Design

2.1. Construction of Indicator System

Green Total Factor Productivity in the power industry is a comprehensive efficiency evaluation indicator derived from traditional total factor productivity. Its defining feature lies in the explicit incorporation of undesirable outputs—such as energy consumption and environmental pollution—into the analytical framework. Drawing on existing studies [12,13], this paper categorizes the measurement system into two components: input indicators and output indicators. Regarding inputs, labor is measured by the number of employees, reflecting the fundamental human capital supporting industry operations. Installed capacity is used as a proxy for capital input because it reflects the power system’s production capacity. Energy input is captured by power generation energy consumption, which serves to characterize the efficiency of the energy conversion process. On the output side, electricity generation is treated as the desirable output, corresponding to the power industry’s core function of ensuring a stable and reliable electricity supply. Meanwhile, carbon dioxide emissions are incorporated as an undesirable output to reflect the environmental externalities associated with power generation. The detailed definitions of all input and output indicators are presented in Table 1.

2.2. Research Method

2.2.1. Super-Efficiency SBM Model Incorporating Undesirable Outputs

The super-efficiency SBM model proposed by Tone [14] effectively mitigates measurement bias arising from slack variables when evaluating the relative efficiency of decision-making units with multiple inputs and multiple outputs. By simultaneously incorporating both desirable and undesirable outputs, the model overcomes a key limitation of the conventional SBM approach, which is unable to differentiate and rank multiple decision-making units with efficiency scores equal to one [15,16]. Accordingly, this study adopts the super-efficiency SBM model to estimate GTFP. The model is specified as follows:
min γ = 1 m ∑ i = 1 m x ¯ x ik 1 w 1   +   w 2 ( ∑ s = 1 w 1 y ¯ u y sk u + ∑ q = 1 w 2 y ¯ v y qk v )
x ¯ ⩾ ∑ j = 1 ,   ≠ k n x i j θ j ,   i = 1 ,   … ,   m y ¯ u ⩽ ∑ j = 1 ,   ≠ k n y sj u θ j ,   s = 1 ,     … ,     w 1 y ¯ v ⩾ ∑ j = 1 ,     ≠ k n y qj v θ j ,   q = 1 ,     … ,     w 2 θ j ⩾ 0 ,     j = 1 ,   … ,   n ,   j ≠ 0 x ¯ ≥ x k ,   y ¯ u ≤ y k u ,   y ¯ v ≥ y k v
In Equations (1) and (2), γ denotes the efficiency score of the decision-making unit (DMU); n represents the number of DMUs; and m denotes the number of input indicators. w1 and w2 indicate the numbers of desirable and undesirable outputs of the DMUs, respectively. x represents the input variables, while yu and yv denote the desirable and undesirable output indicators, respectively. x ¯ , y ¯ u , y ¯ v are the corresponding slack variables.

2.2.2. Kernel Density Estimation

Kernel density estimation is a nonparametric statistical technique used to estimate the distribution of a variable based on observed sample values. By fitting a kernel density curve, this method effectively reveals the underlying distributional characteristics of the data. Specifically, the location of the curve reflects the magnitude of GTFP, the height and width of the peaks indicate the degree of concentration and dispersion, and the number of peaks represents the extent of polarization [17,18]. To provide a more intuitive analysis of the spatiotemporal evolution of Green Total Factor Productivity in the power industry at both the national level and across the eastern, central, western, and northeastern regions, this study adopts the kernel density estimation approach. The corresponding calculation formula is presented as follows:
f ( x ) = 1 n h ∑ i = 1 n K x i − x ¯ h
In the equation, f(x) denotes the kernel density estimator; K(x) represents the kernel density function; i refers to the province; and n denotes the sample size. The parameter h is the bandwidth, which is closely related to the smoothness of the kernel density function and the accuracy of the estimation results. A larger bandwidth produces a smoother kernel density curve but lower estimation precision, whereas a smaller bandwidth results in a rougher curve with higher estimation precision. xi represents the observed value, and x ¯ denotes the sample mean.

2.2.3. Standard Deviational Ellipse

The standard deviation ellipse method, implemented using ArcGIS software, employs centroid coordinates and other fundamental parameters across multiple years to examine the spatial distribution characteristics of relevant factors. By generating an intuitive elliptical representation, this approach effectively reveals the degree of spatial concentration, dispersion, and dominant directional trends of Green Total Factor Productivity in the power industry at the national scale [19,20]. The key parameters of the standard deviation ellipse include the coordinates of the ellipse center, the lengths of the major and minor semi-axes, the orientation angle, the ellipse area, and the flattening ratio. The corresponding calculation formulas are presented as follows:
G x ¯ w m c ,   y ¯ w m c = ∑ i = 1 n w i x i ∑ i = 1 n w i ,   ∑ i = 1 n w i y i ∑ i = 1 n w i
x ˜ i = x i − x ¯ wmc ,   y ˜ i = y i − y ¯ w m c
tan θ = ∑ i = 1 n w i 2 x ˜ i 2 − ∑ i = 1 n w i 2 y ˜ i 2 + ∑ i = 1 n w i 2 x ˜ i 2 − ∑ i = 1 n w i 2 y ˜ i 2 2 + 4 ∑ i = 1 n w i 2 x ˜ i 2 y ˜ i 2 ∑ i = 1 n 2 w i 2 x ˜ i 2 y ˜ i 2
∂ x = ∑ i = 1 n w i x ˜ i cos θ − w i y ˜ i sin θ 2 ∑ i = 1 n w i 2
∂ y = ∑ i = 1 n w i x ˜ i sin θ − w i y ˜ i cos θ 2 ∑ i = 1 n w i 2
In this context, G ( x ¯ w m c ,   y ¯ w m c ) denotes the centroid coordinates of GTFP; x ˜ i and y ˜ i represent the deviations of each province’s location from the mean center. ∂x and ∂y are the standard deviations of the major and minor axes, respectively. xi and yi also correspond to the spatial regions of Green Total Factor Productivity in the power industry, tanθ reflecting the primary directional trend of the geographic distribution. wi denotes the weight, and θ represents the angle between true north and the major axis of the ellipse.

2.2.4. Gini Coefficient

The Dagum Gini coefficient is an enhanced and refined version of the traditional Gini coefficient, enabling a detailed decomposition of intra-regional disparities, interregional differences, and the contribution of transvariation. Following the methodology outlined in [21,22], this study applies the Dagum Gini coefficient to quantify regional disparities and their sources in Green Total Factor Productivity within China’s power industry. The corresponding calculation formula is presented as follows:
G = 1 2 ⋅ n 2 ⋅ Y ¯ ⋅ ( ∑ j = 1 k ∑ h = 1 k ∑ i = 1 n j ∑ r = 1 n h | y j i − y h r | )
In the equation, G denotes the overall Gini coefficient; n is the number of provinces; k represents the number of subgroups; nj and nh are the numbers of provinces within regions j and h, respectively; and Y ¯ represents the average GTFP of the power industry across all provinces in a given year. The overall Gini coefficient G can be decomposed into intra-regional disparities Gw, interregional disparities Gb, and the contribution of transvariation Gt, satisfying the following relationship:
G = G W + G b + G t

2.2.5. Fuzzy Set Qualitative Comparative Analysis

fsQCA constructs parameters based on varying degrees of set membership and employs Boolean algebra to represent causal relationships configurationally, thereby identifying sufficient and necessary conditions within complex causal structures. The evaluation of these relationships relies on two key metrics: consistency and coverage [23]. Consistency measures the strength of the causal relationship among different configurations and quantifies the extent to which one set is a subset of another (i.e., Xi ≤ Yi), with values ranging from 0 to 1. Coverage assesses the explanatory power of a causal configuration with respect to the outcome. In this context, Xi denotes the membership score of case i in set X, and Yi denotes the membership score of case i in set Y, both ranging from 0 to 1. The corresponding calculation formulas are presented as follows:
C o n s i s t e n c y ( X i ⩽ Y i ) = ∑ min ( X i ,   Y i ) ∑ X i
C o v e r a g e ( X i ⩽ Y i ) = ∑ min ( X i ,   Y i ) ∑ Y i
In the equation, Consistency denotes the consistency score; Coverage represents the coverage score; X refers to the combination of conditions; Y represents the outcome; and i indexes the individual cases in the sample.

2.2.6. Methodological Justification

The methodological framework adopted in this study is designed to capture the multidimensional characteristics of GTFP in the power industry. Each method serves a distinct analytical purpose and together they form a complementary system. The super-efficiency SBM model is selected because it allows for the incorporation of undesirable outputs and enables efficiency comparisons among decision-making units with scores exceeding unity. This feature is particularly suitable for the power industry, where environmental constraints constitute an essential component of performance evaluation. Kernel density estimation and standard deviation ellipse analysis are employed to reveal dynamic distributional changes and spatial evolution patterns. These approaches provide information on structural transformation that cannot be captured by single-point efficiency estimates. The Dagum Gini coefficient is used to analyze regional disparities because it enables the decomposition of inequality into intra-regional, interregional, and transvariation components, thereby offering a more detailed understanding of spatial heterogeneity. Finally, This study adopts fsQCA rather than traditional panel regression models for three main reasons. (1) it aligns with our research goal of identifying joint effects of digital economy factors on GTFP, rather than estimating the net effect of individual variables. (2) fsQCA effectively handles causal complexity, including nonlinear relationships and multiple conjunctural causation, which are common in the green transformation of the power industry. (3) given our medium-sized sample of 31 provinces over 12 years, fsQCA is particularly suitable for detecting common configurational patterns without relying on large-sample assumptions.

2.3. Technology–Organization–Environment Framework

Building on the TOE theoretical framework and considering both the intrinsic characteristics of the digital economy and the practical performance of GTFP, this study categorizes antecedent conditions into three dimensions: technology, organization, and environment. The technology dimension encompasses digital infrastructure and applications of digital technologies, which directly enhance energy conversion and allocation efficiency through system intelligence upgrades and operational optimization. The organization dimension includes digital organizational innovation and digital organizational capabilities, which, through process reengineering and resource reallocation, facilitate and strengthen the translation of technological enablement into tangible efficiency gains. The environment dimension comprises government digital policies and digital economy environment, which, through institutional safeguards and market incentives, externally shape enabling conditions and guide development trajectories. Collectively, these three dimensions constitute a synergistic system of “technology-driven, organization-adapted, and environment-enabled” mechanisms that promote systematic improvements in GTFP under the digital economy. The specific operationalization of each variable is presented in Table 2.
Technology Dimension: The internet penetration rate reflects the overall accessibility of internet services, indicating the breadth of information transmission channels and serving as a fundamental prerequisite for building a digital society. The broadband access rate measures the availability of high-quality, high-bandwidth internet connections, reflecting the depth and quality of infrastructure and providing a critical foundation for digital economic development. The telephone penetration rate represents a basic mode of information access, capturing the reach of both traditional and mobile voice communication and indicating the fundamental strength of social connectivity. The length of long-distance optical cable lines provides a direct measure of the physical scale and transmission capacity of communication networks, serving as the physical basis for cross-regional digital interconnection and reflecting, at the hardware level, the infrastructure’s carrying capacity and expansion potential. The number of artificial intelligence companies reflects the industrial aggregation of digital technologies and represents a key outcome in translating research and development into market applications. The number of industrial enterprises above a designated size is included not as a direct measure of digital technology stock, but as an indicator of the breadth of potential application scenarios for digital transformation. A larger industrial base provides a wider market for technology diffusion and reflects the structural conditions conducive to digital–industrial integration.
Organization Dimension: Green technological innovation is measured by the number of green patent applications, combining digital innovation with environmental benefits and directly relating to pathways for improving GTFP, thereby serving as a key indicator of organizational innovation for sustainable development. The number of invention and utility patents reflects the total output of practical technological achievements generated by organizations in digital and related fields, serving as a measure of overall technological innovation and knowledge accumulation. Digital economy talent, measured by the proportion of personnel in computer services and software industries, indicates the availability of core professional human capital supporting the digital economy and evaluates an organization’s capacity to absorb, retain, and apply digital technologies. Telecommunications industry output captures the market realization and operational efficiency of digital services and communications, reflecting an organization’s ability to convert digital infrastructure and technologies into tangible economic value.
Environment Dimension: Government digital attention [25] is measured by the frequency of digital economy-related keywords in government work reports (it should be emphasized that this approach captures the strategic attention and policy orientation of local governments, rather than the actual intensity of policy implementation). Although tensions may exist between the allocation of attention and the deployment of resources, keyword frequency analysis has been widely validated as an effective proxy for assessing government priority setting in macro-level panel data analyses. R&D intensity, measured as the proportion of science and technology expenditures in local fiscal spending, reflects the level of direct financial support provided by local governments for research and development activities. Digital financialization, represented by the Digital Inclusive Finance Index, evaluates both the depth and breadth of digital financial services within a region, indicating the maturity of digital technologies in reshaping the financial ecosystem and providing essential capital and payment infrastructure to support the digital economy. Finally, an advanced industrial structure increases demand for digital technology applications and provides a stronger foundation for integration; it reflects the extent to which the economy has evolved toward service orientation and higher value-added activities.

2.4. Data Source

Considering the unavailability of data for Macao, Hong Kong, and Taiwan, this study examines 31 provinces, municipalities, and autonomous regions in China over the period 2012–2023. The data were primarily obtained from the China Statistical Yearbook, China Electricity Yearbook, China Communication Statistical Yearbook, China Energy Statistical Yearbook, Work Reports of Provincial Governments, the China National Research Data Service Platform (CNRDS), the Peking University Digital Finance Research Center, as well as the CEADs and CSMAR databases. Any missing values were addressed using interpolation methods. Digital economy indicators for the Xizang Autonomous Region are largely missing due to late digital development, incomplete statistical coverage, and gaps in authoritative databases. Filling these gaps via interpolation could introduce significant bias; therefore, Xizang was excluded from the analysis. Given its small power market and limited digital economy, this omission is unlikely to affect the robustness of the main conclusions. Future research with more complete data could include Xizang for comparative analysis.

3. Spatiotemporal Feature Analysis

3.1. Temporal Feature Analysis

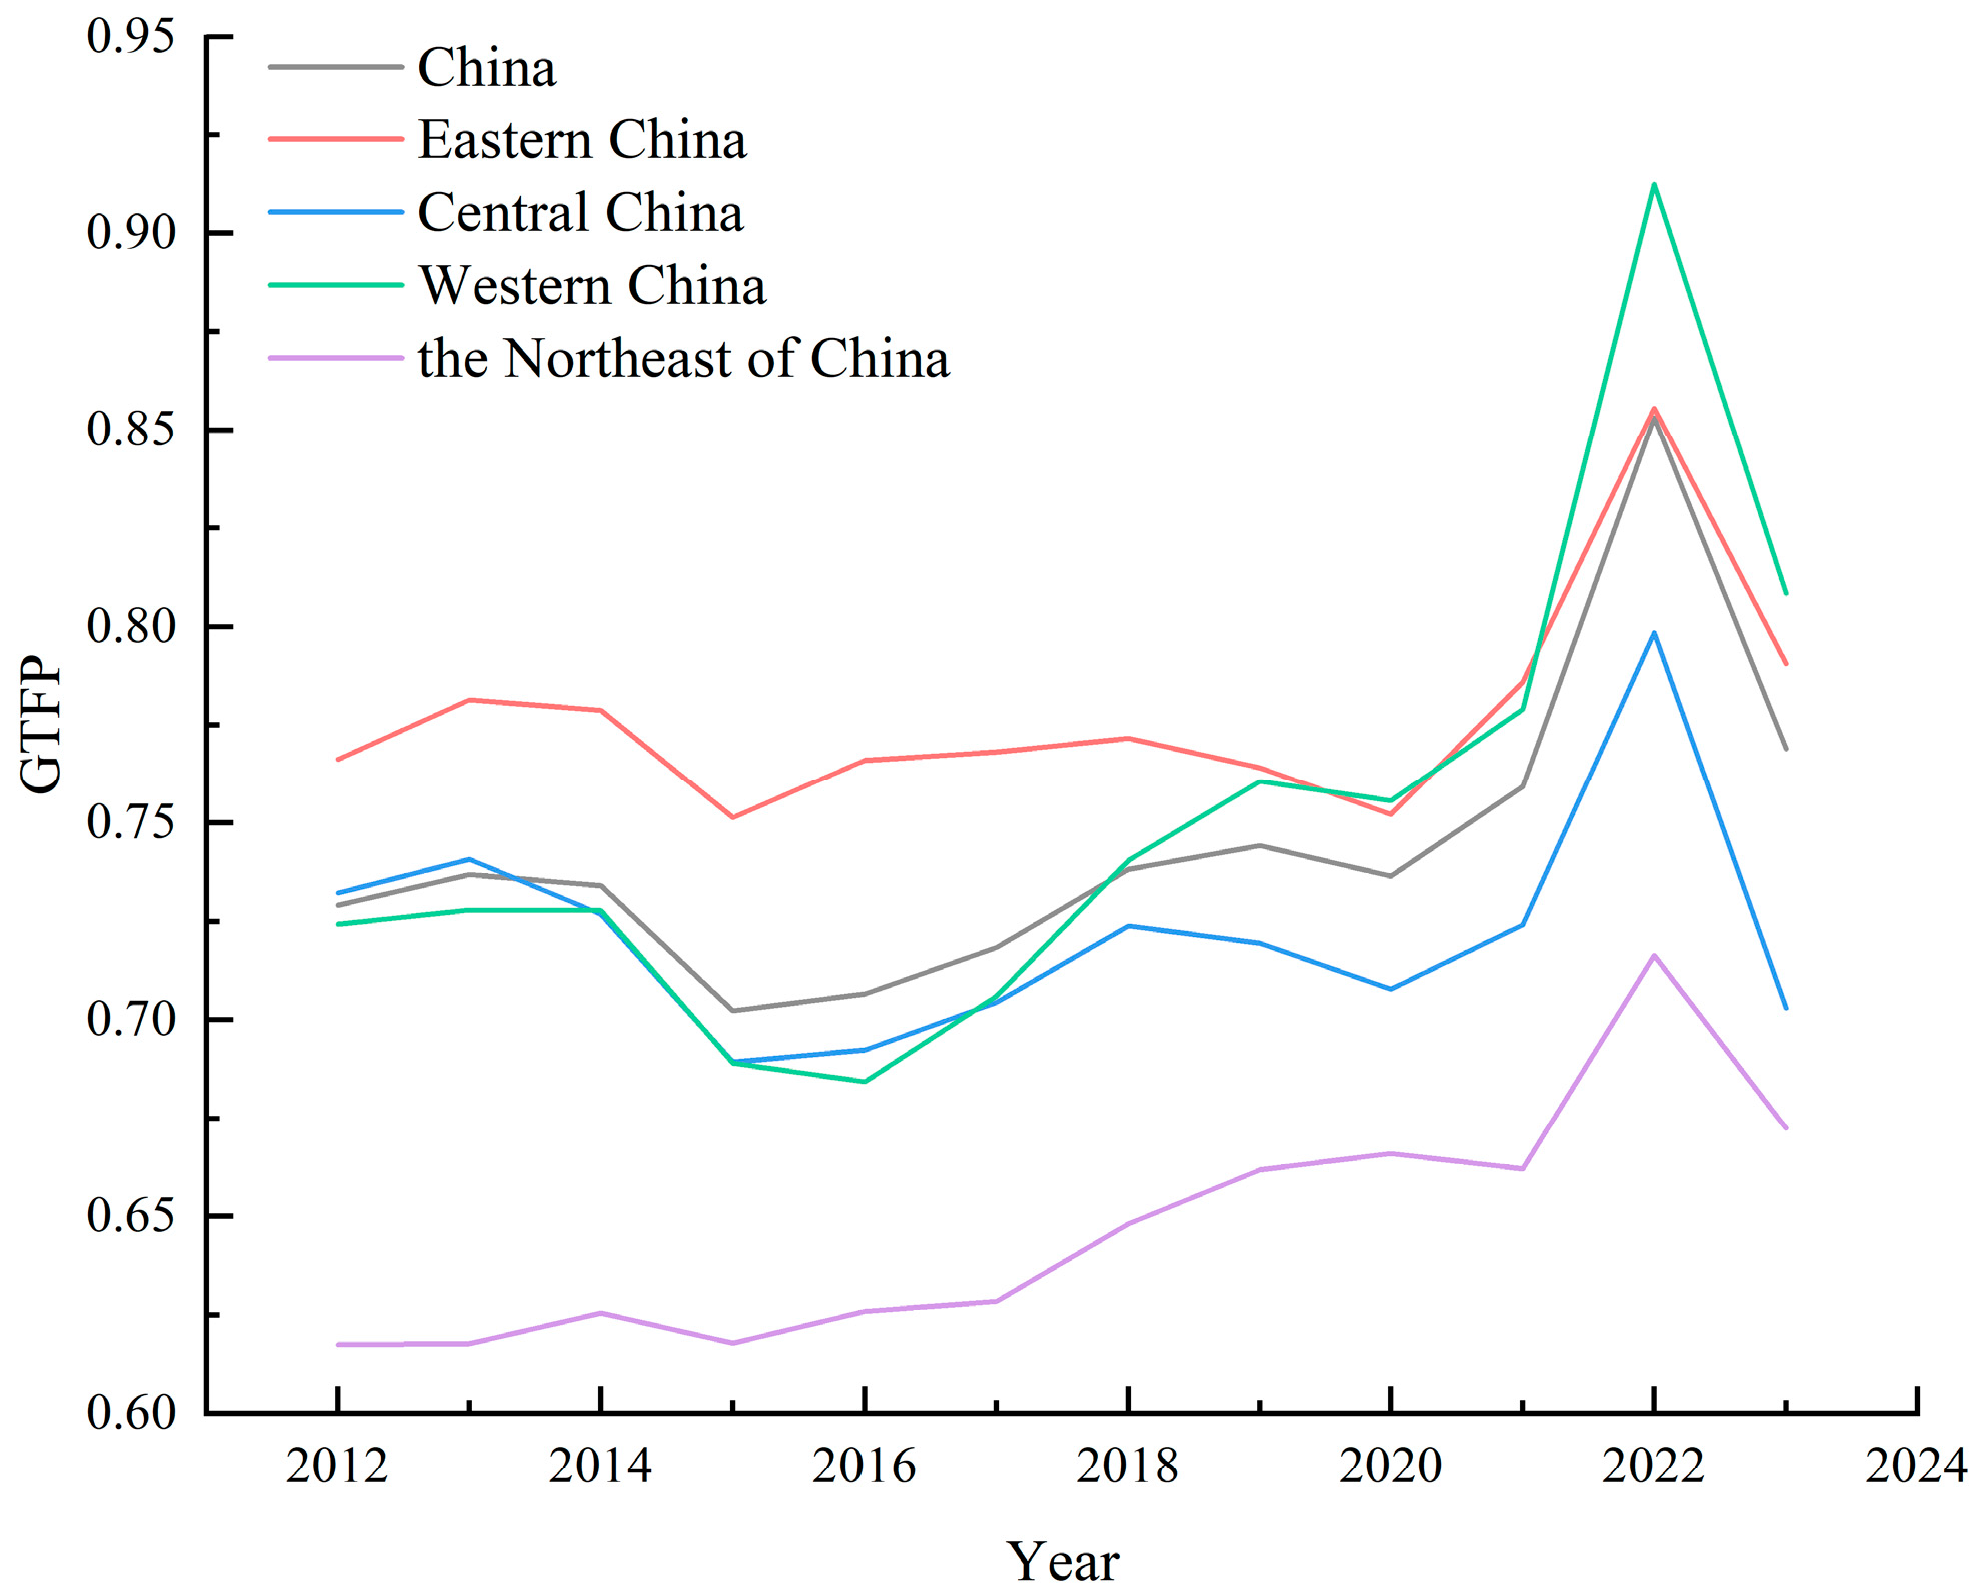
As shown in Figure 1, the average GTFP of China’s power industry increased from 0.729 in 2012 to 0.769 in 2023, exhibiting a fluctuating trajectory characterized by a sequence of “gradual rise–adjustment–surge–correction”. During 2012–2019, average GTFP fluctuated within a narrow range of 0.702–0.744, indicating relatively modest growth. It increased slightly to 0.759 during 2020–2021, followed by a pronounced surge in 2022, when the average reached 0.853. This sharp increase is likely associated with the concentrated commissioning of renewable energy capacity and the strengthening of policy incentives. In 2023, GTFP declined to 0.769, suggesting that efficiency gains tended to stabilize after a short-term acceleration. The eastern region consistently maintained an average GTFP above the national level, rising from 0.766 in 2012 to 0.790 in 2023 and remaining at a relatively high and stable level. However, provincial trajectories within the region diverged. Traditional power-generation provinces such as Jiangsu and Shandong entered an adjustment phase after achieving early high performance, whereas Fujian and Zhejiang sustained steady growth and emerged as new regional growth poles. This divergence reflects a broader structural transition in the eastern region from scale expansion toward optimization and technology-driven development, with improvements in green efficiency increasingly supported by a higher share of non-fossil energy and enhanced energy efficiency management. The northeastern region’s average GTFP increased from 0.617 in 2012 to 0.673 in 2023, representing a rise of approximately 9.1%. Despite this upward trend, the region consistently recorded the lowest GTFP nationwide. Liaoning, Jilin, and Heilongjiang exhibited similar trajectories, characterized by slow growth, a peak in 2022, and a subsequent decline in 2023. The lagging pace of transformation reflects persistent structural constraints, including heavy reliance on coal-fired power, limited system flexibility, and insufficient progress in renewable energy deployment. In contrast, the western region experienced the most pronounced improvement, with average GTFP rising steadily from 0.724 in 2012 to 0.808 in 2023—an increase of approximately 11.6%, the largest among the four regions. The evolution followed a U-shaped recovery pattern: after a slight decline during 2015–2016, rapid growth commenced after 2017 and peaked at 0.913 in 2022. Resource-rich provinces such as Inner Mongolia, Ningxia, and Xinjiang emerged as key growth poles, consistently outperforming the regional average. This pattern underscores the strong efficiency-enhancing effects of renewable energy development and cross-regional power transmission. By contrast, provinces such as Shaanxi and Gansu experienced intermittent declines, resulting in an internally differentiated structure in which high-efficiency provinces drive regional performance while traditional provinces lag behind. The central region was the only region to experience a decline in average GTFP, falling from 0.732 in 2012 to 0.703 in 2023. Although some provinces, such as Hubei and Anhui, achieved steady improvement, others—including Henan and Hunan—recorded notable declines. This pattern indicates that the central region faces significant structural challenges in its green power transition, with provinces characterized by strong dependence on coal-fired power and relatively lagging renewable energy development experiencing particularly acute transformation pressures.
To further examine the drivers of the pronounced GTFP fluctuations around 2022, this study selects four representative provinces—Tianjin, Hubei, Qinghai, and Hunan—for case analysis. Tianjin’s GTFP increased from 0.745 in 2021 to the efficiency frontier (1.000) in 2022 before declining to 0.752 in 2023. This surge may be associated with recent efforts to promote the coordinated digital and green transformation of energy-intensive industries, where the adoption of industrial internet platforms and intelligent energy management improved energy efficiency and reduced emission intensity. Hubei, a major hydropower province, experienced severe drought in 2022 that sharply reduced hydropower generation. Nevertheless, its GTFP increased from 0.777 to 0.834, suggesting that enhanced flexibility of thermal power units and digitally enabled cross-regional dispatch partially offset the hydropower shortfall and improved operational efficiency. Qinghai, benefiting from abundant wind and solar resources, connected several large-scale renewable energy bases to the grid in 2022. Improved intelligent dispatching reduced curtailment of wind and solar power, bringing GTFP to the efficiency frontier, with the 2023 value remaining above the 2021 level. In contrast, Hunan’s GTFP fell sharply from 0.707 in 2022 to 0.427 in 2023 (–39.6%). This decline may be related to its heavy reliance on coal-fired power generation. Under pressures to ensure energy security, environmental control facilities may have operated at reduced capacity, leading to increased undesirable outputs such as CO2 emissions. These cases highlight the complex trade-offs among climate shocks, energy security, and green efficiency during the energy transition, where short-term disturbances may temporarily offset long-term efficiency improvements.
The descriptive statistics above preliminarily illustrate the temporal volatility of GTFP in China’s power industry and its regional heterogeneity. However, these average measures obscure the structural differentiation among provinces. To more comprehensively capture the dynamic evolution of GTFP distribution, spatial patterns, and the sources of regional disparities, the following sections employ kernel density estimation, standard deviation ellipses, and the Dagum Gini coefficient for systematic analysis.

3.2. Spatial Distribution Pattern

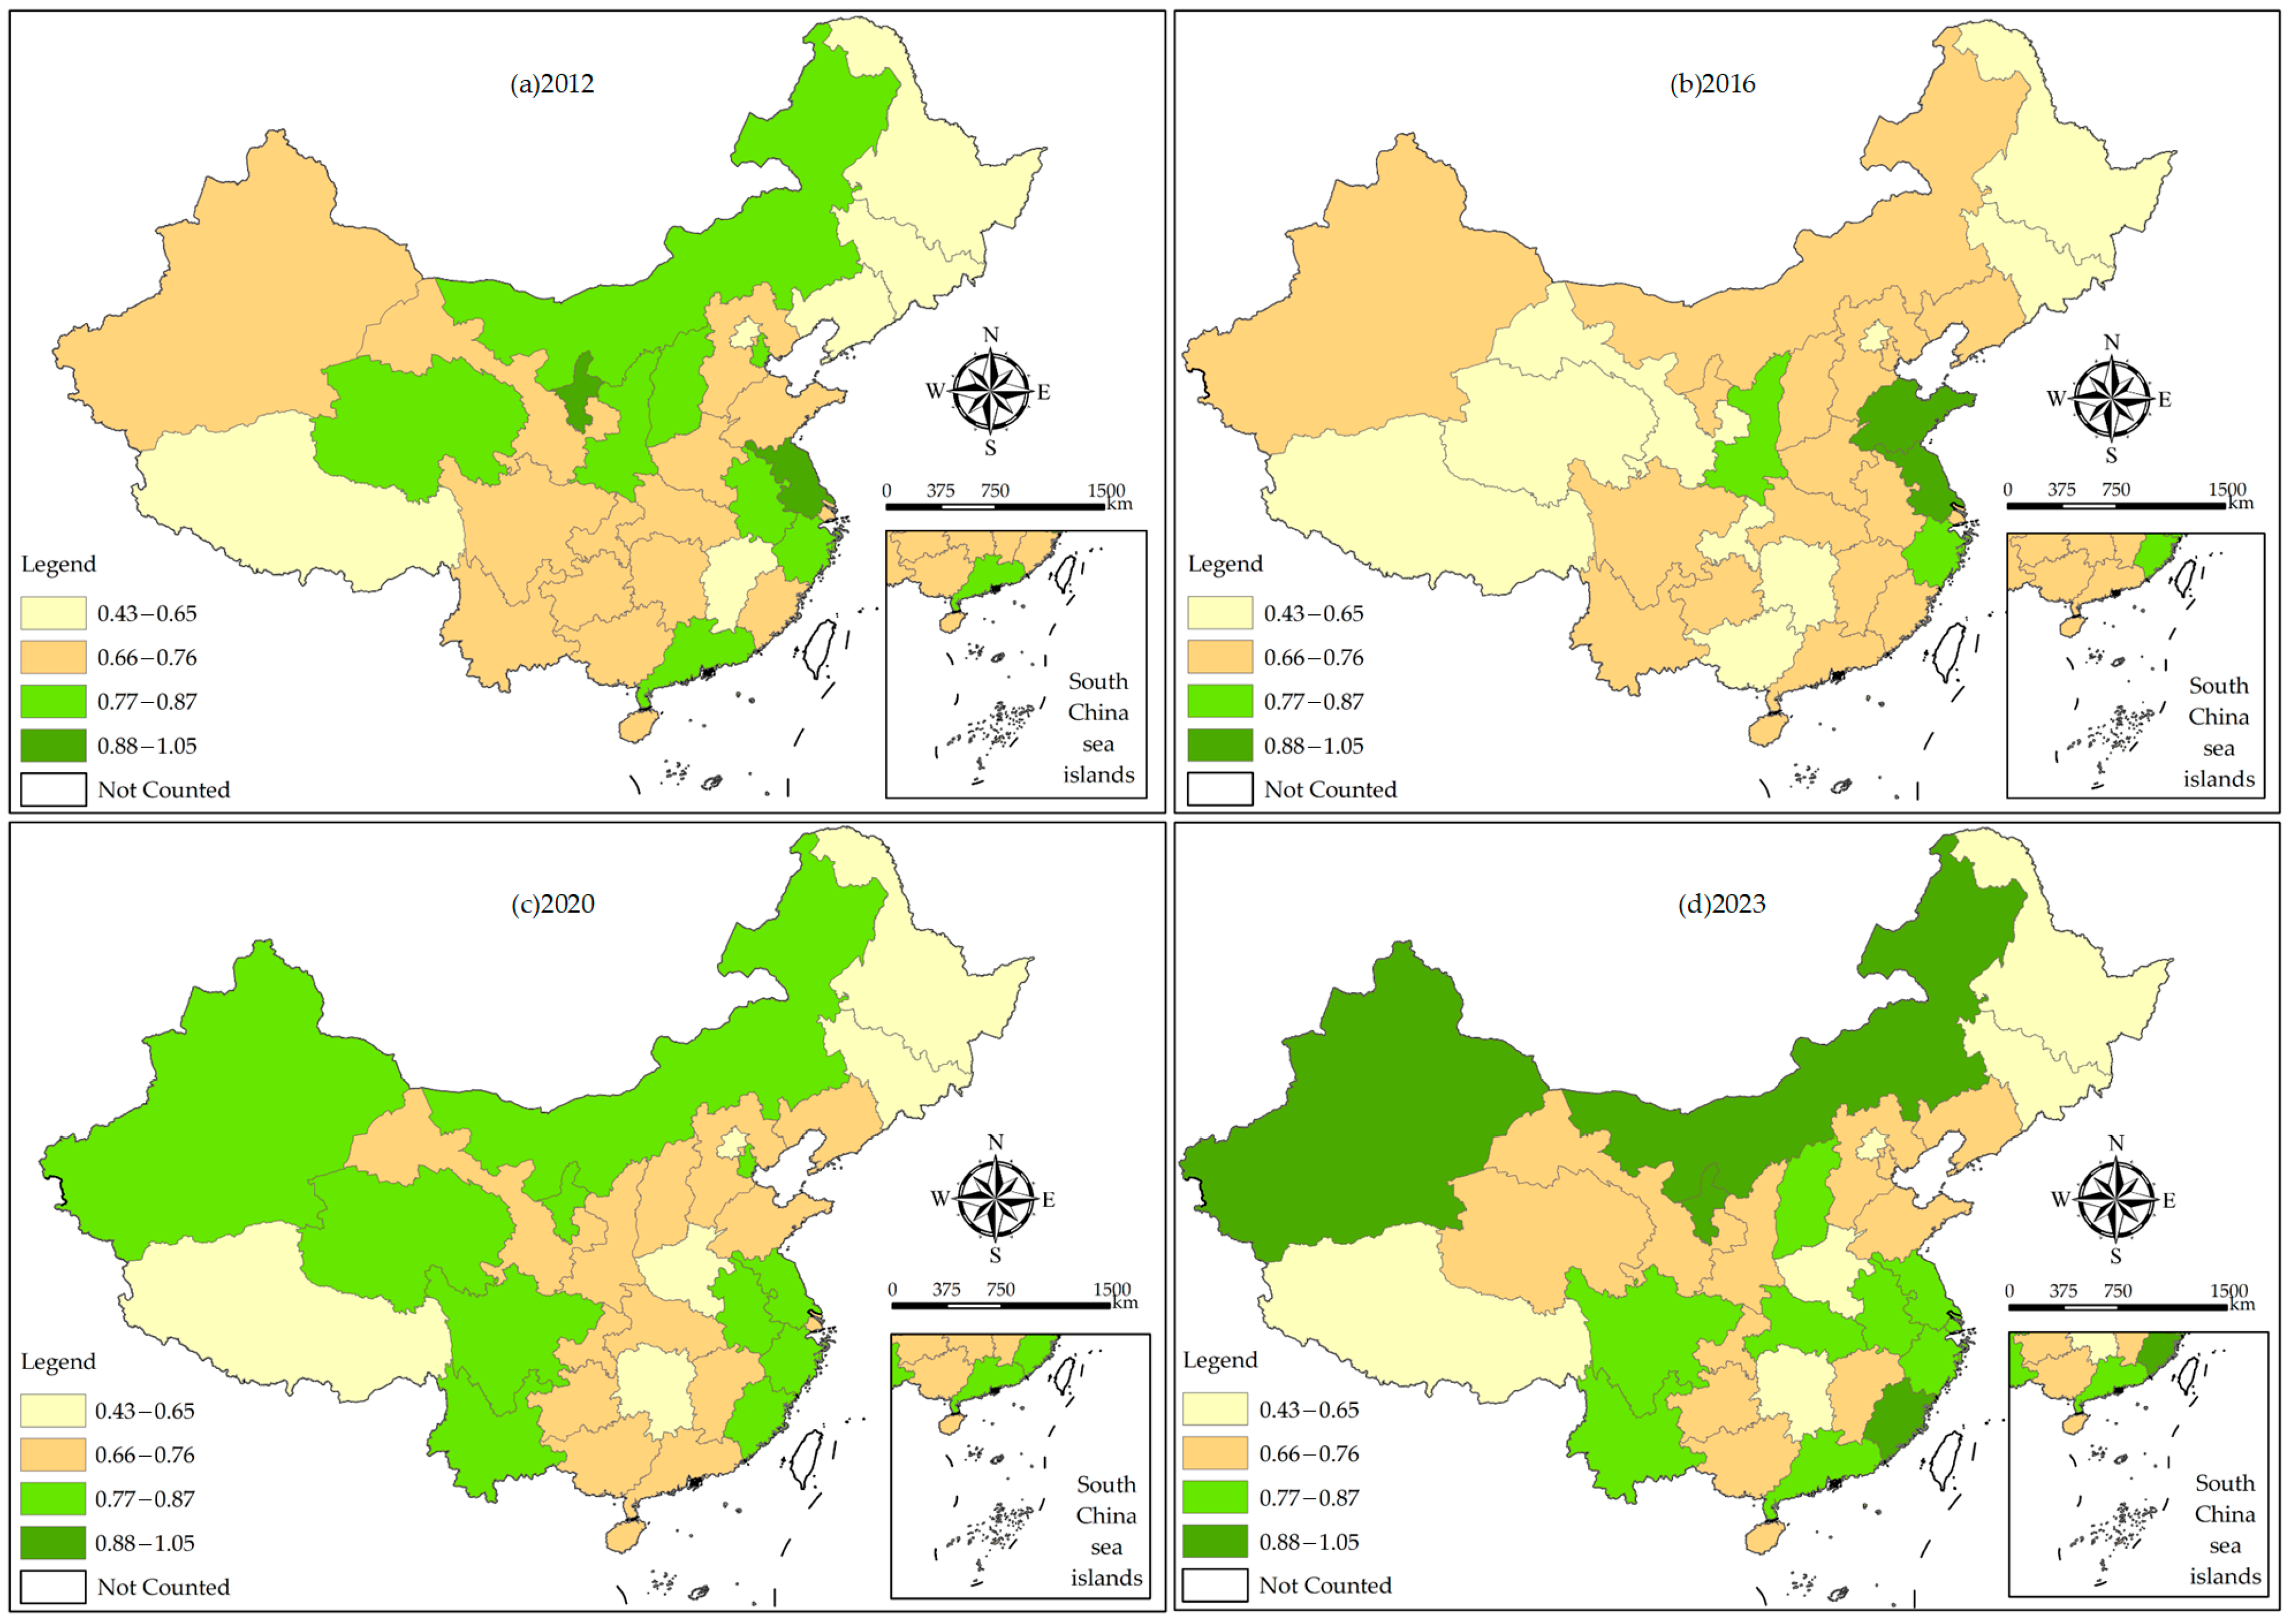
This study selects four benchmark years—2012, 2016, 2020, and 2023—and employs ArcGIS 10.8 for spatial visualization. Using the natural breaks classification method [30,31,32], GTFP in China’s power industry is categorized into four levels, which are depicted using different colors in Figure 2.
The spatial distribution of GTFP in China’s power industry exhibits pronounced dynamic restructuring, evolving overall from a pattern of “dual cores in the east and west” to one characterized by “a rising western highland and an emerging central depression”. In 2012, the spatial distribution of GTFP had already displayed distinct structural features, with two relatively clear high-value agglomerations taking shape. The first was a western, resource-driven high-value zone centered on Ningxia, Inner Mongolia, and Qinghai, together with Shaanxi and Xinjiang, forming a geographically contiguous area with relatively high GTFP levels in northwestern China. This pattern reflects the early energy-efficiency advantages of resource-abundant regions. The second was an eastern, economy- and technology-driven high-value zone, with Jiangsu representing the national peak, while coastal provinces such as Zhejiang, Shandong, and Fujian also exhibited relatively high values, closely associated with higher levels of economic development and technological investment. Although both eastern and western regions demonstrated clustering tendencies, a clear gradient differentiation between them had not yet emerged, resulting in an overall pattern of “dual-core leadership with multiple coexisting poles”. By 2016, the eastern high-value zone exhibited noticeable fluctuations, showing a trend toward point-wise weakening and dispersion of agglomeration. In contrast, the western high-value zone continued to strengthen steadily, with provinces such as Yunnan beginning to rise, leading to greater spatial contiguity across the western region. Meanwhile, a low-value tendency began to emerge in the central region, as provinces such as Hunan and Henan experienced persistent declines, signaling the potential formation of a continuous low-value area. In 2020, under the impetus of the “dual carbon” goals and energy transition policies, the spatial pattern underwent a structural transformation marked by the pronounced rise of the western highland and the formation of a central depression. The western highland expanded rapidly, with Inner Mongolia, Ningxia, and Xinjiang advancing to higher GTFP tiers, and Yunnan also entering the high-value range. Together, these provinces formed a contiguous high-value belt extending from the northwest to the southwest, with the spatial agglomeration pattern shifting from a block-like to a belt-like configuration. Meanwhile, the eastern high-value zone was further restructured: Jiangsu and Shandong experienced downward adjustments, while Fujian and Zhejiang remained stable or exhibited slight rebounds, resulting in a more dispersed, multi-centered pattern of medium-to-high GTFP levels. The central depression became increasingly evident, as provinces such as Hunan, Henan, and Jiangxi consistently remained at medium-to-low levels, leading to the initial formation of a contiguous low-value zone in central China. By 2023, a three-tier spatial structure characterized by “high values in the west, medium values in the east, and low values in the central region” had become firmly established. The western high-efficiency contiguous zone was fully consolidated, with Inner Mongolia, Ningxia, Xinjiang, and Yunnan forming a stable high-value cluster, demonstrating strong momentum in green development. The eastern medium-to-high-value block tended toward stabilization, with provinces such as Fujian, Zhejiang, and Jiangsu constituting a relatively stable eastern cluster, reflecting enhanced adaptability under transformation pressures. In contrast, the central low-value depression further deepened: Hunan’s GTFP declined sharply to 0.427, the lowest level nationwide, and together with Henan and Jiangxi formed a pronounced low-value agglomeration in the central region, highlighting the persistent lag in regional transformation.

3.3. Dynamic Evolution Analysis

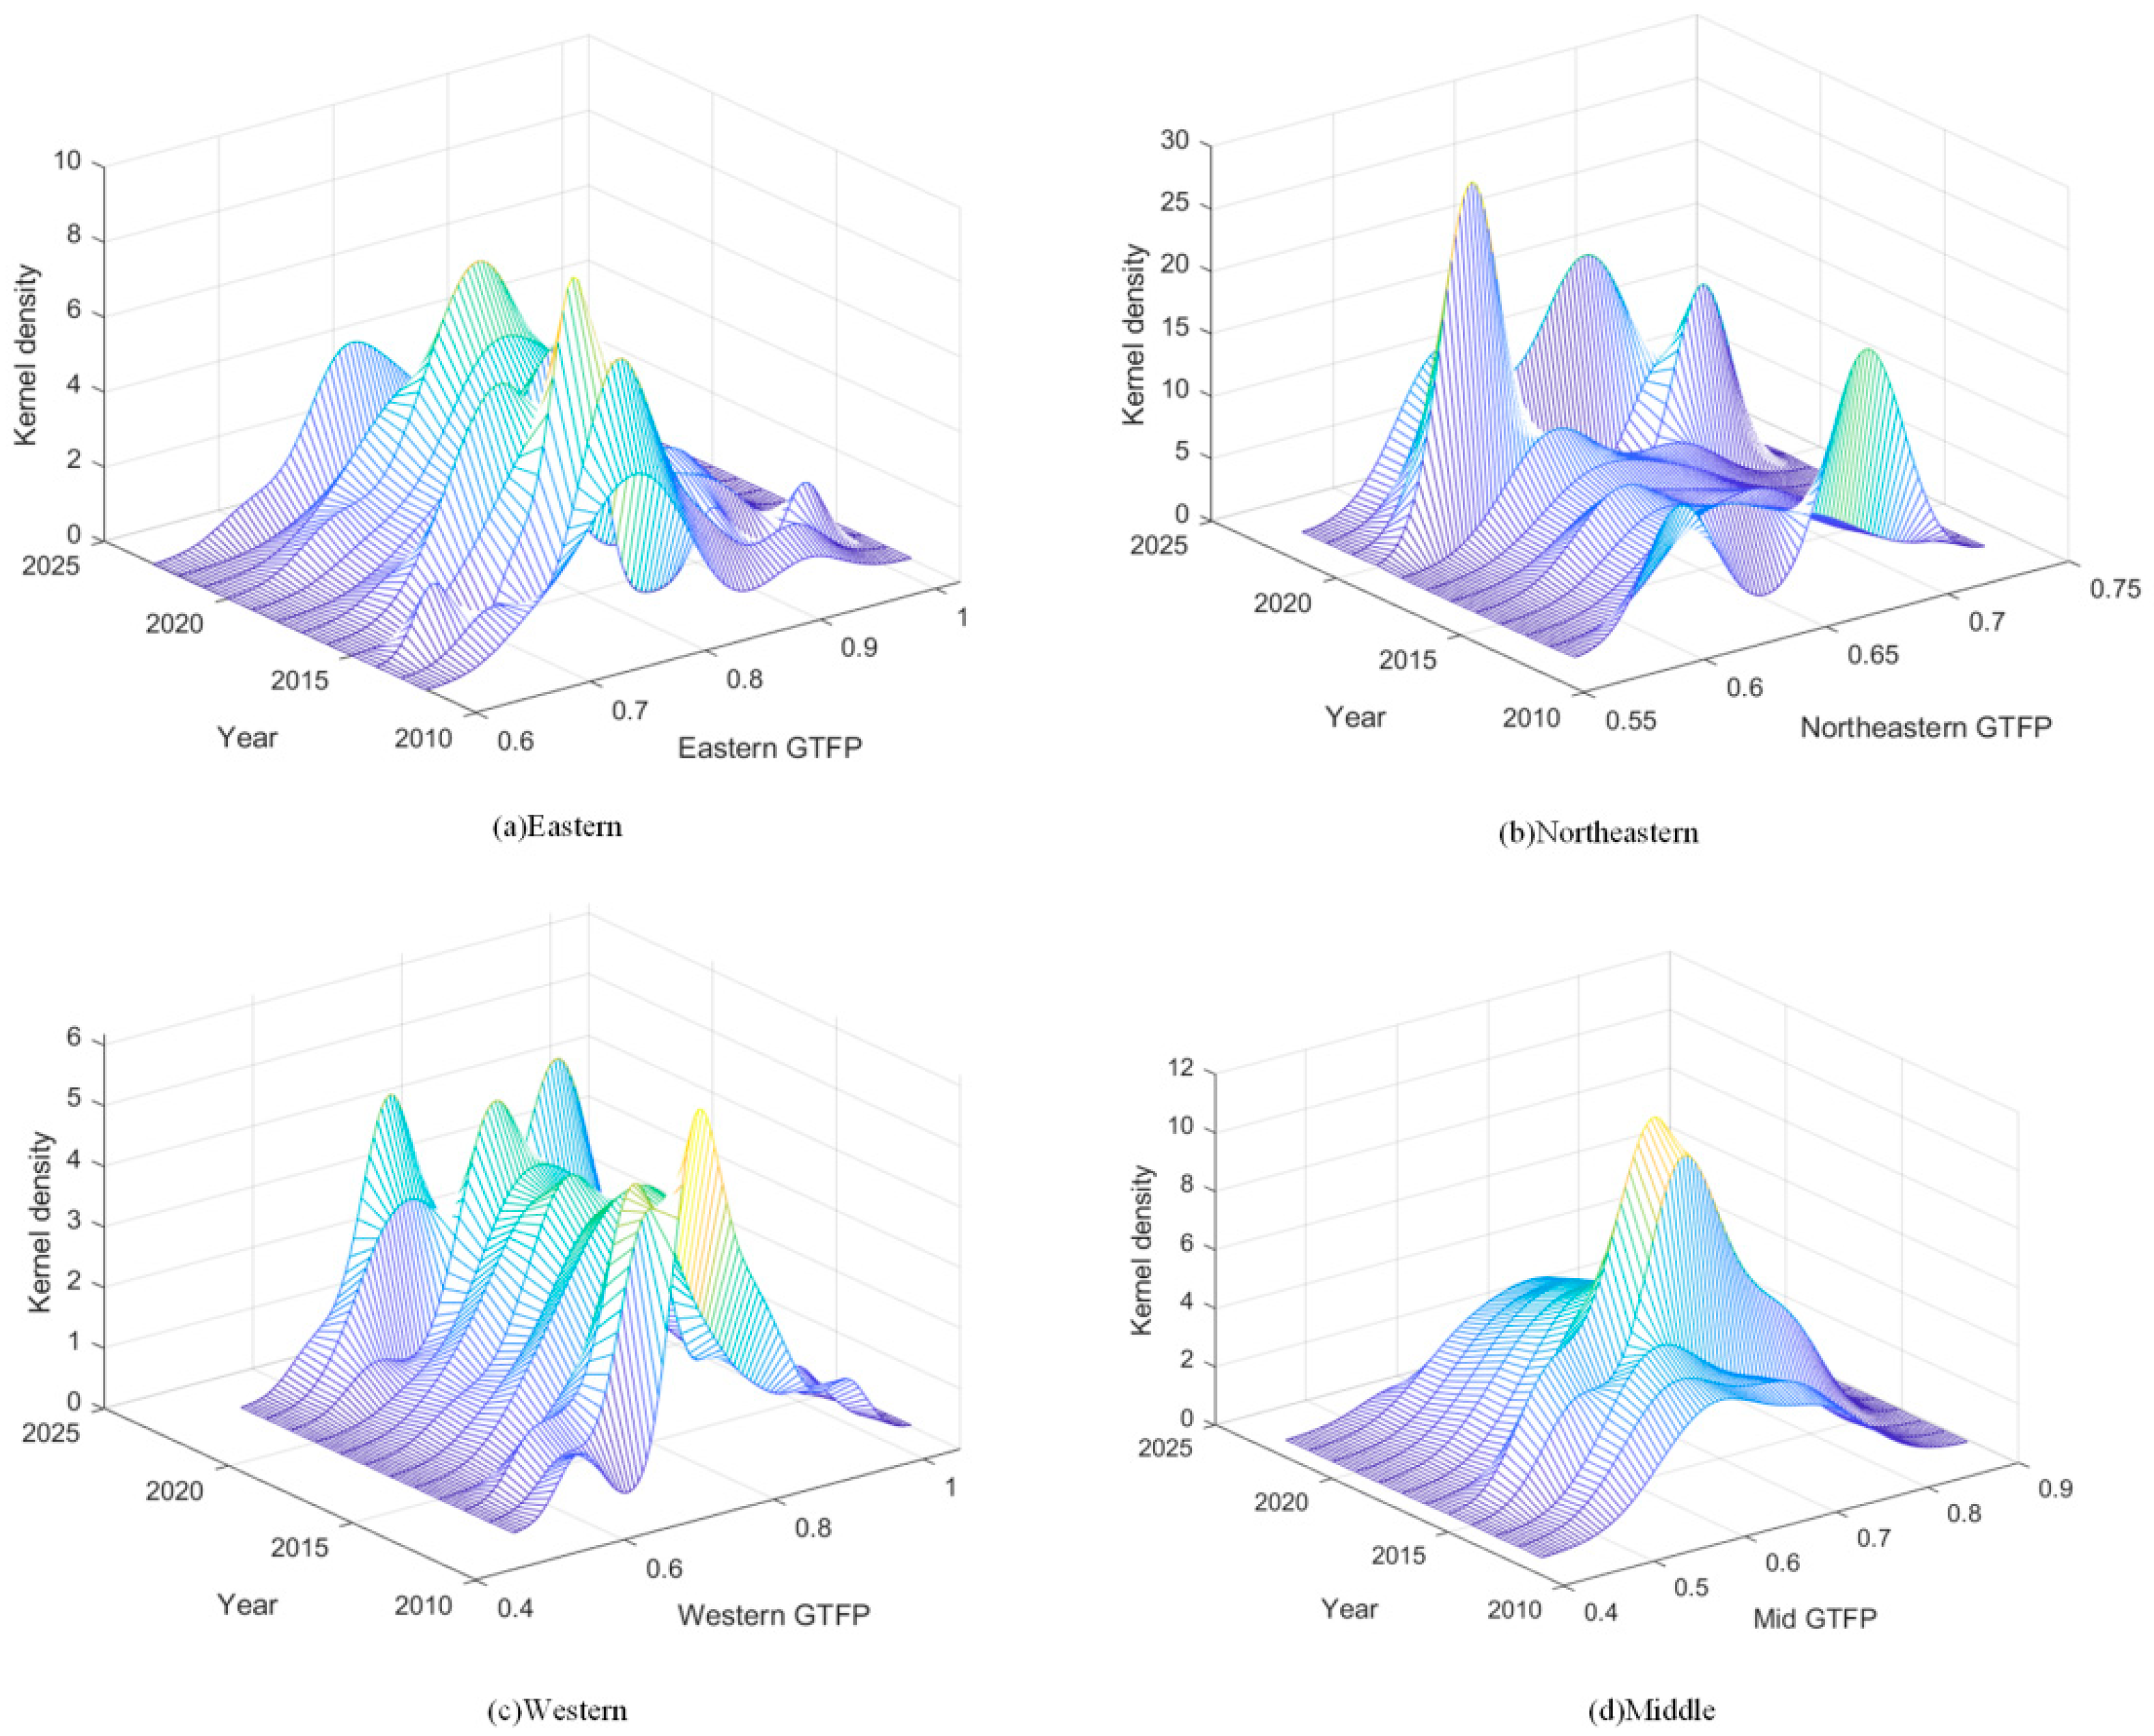
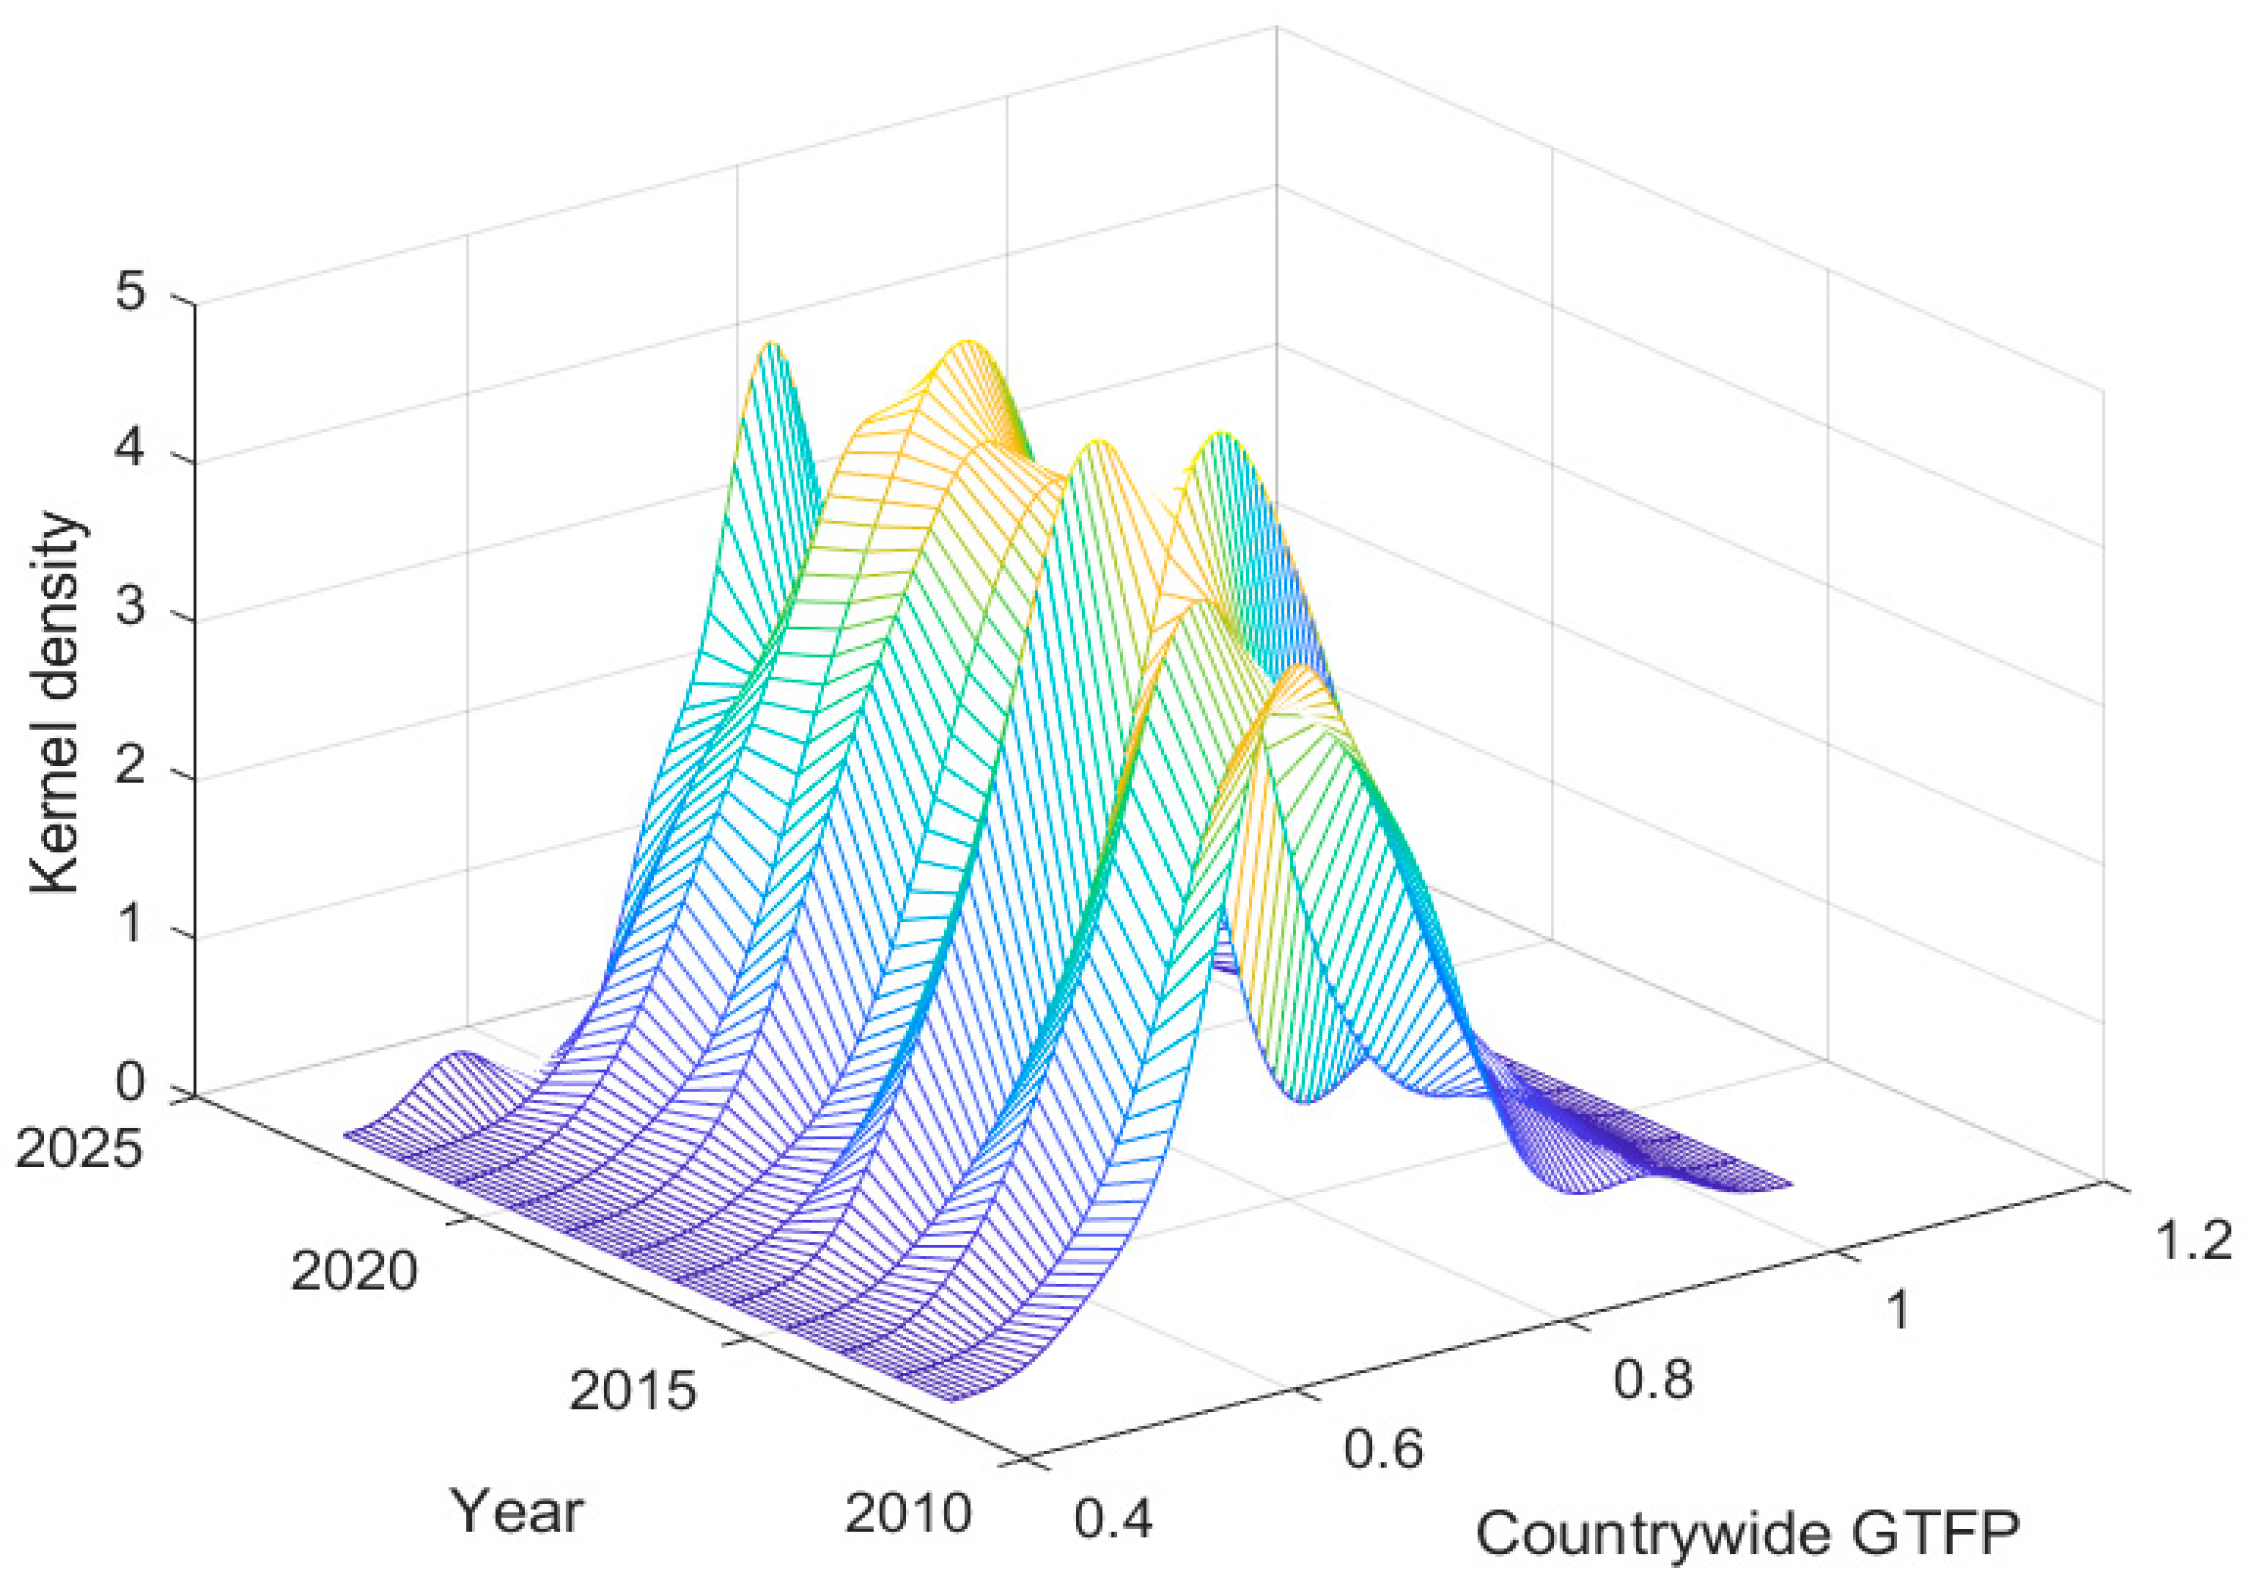
Based on provincial panel data spanning 2012–2023, this study classifies China’s power industry into four regions—eastern, northeastern, western, and central—as presented in Table 3. Kernel density estimation is conducted using MATLAB 2024a to examine the distributional dynamics of GTFP at both the national and regional levels (Figure 3 and Figure 4). At the national level, GTFP exhibits pronounced features of dynamic convergence and polarization. The overall distribution evolves systematically from a “single right-skewed peak” to a pattern characterized by “attenuation of the main peak and differentiation of the right tail”, and ultimately toward a clearly “multi-peak polarized” structure. Around 2012, the distribution displays a typical single-peaked, right-skewed form, with the main peak representing the medium efficiency level shared by the majority of provinces, while the extended right tail is driven by a small number of high-performing provinces, such as Jiangsu and Ningxia. Although the distribution is relatively concentrated at this stage, an initial interregional efficiency gradient has already begun to emerge. Over time, the height of the main peak gradually declines while its width expands, accompanied by the continuous extension and internal differentiation of the right tail. This evolution reflects asynchronous GTFP growth across provinces and increasing heterogeneity in development trajectories. By around 2023, the distribution further transforms into a distinctly polarized, multi-peak configuration, indicating the formation of several efficiency “clubs” nationwide. Within each cluster, efficiency levels tend to converge, whereas disparities between clusters remain substantial. High-efficiency and low-efficiency groups coexist with clearly defined boundaries, revealing a long-term transition from a continuous distribution to a discrete, tiered structure.
From a regional perspective, the eastern region’s kernel density curve is characterized by “stable peak positioning with right-side adjustments”. The location of the main peak remains relatively stable over time, suggesting that most provinces in the region consistently maintain medium-to-high efficiency levels. However, fluctuations in the shape of the right tail during 2016–2020 indicate shifts in relative efficiency rankings among provinces such as Jiangsu, Shandong, and Fujian, driven by differences in the pace and direction of structural transformation. In the northeastern region, the kernel density curve exhibits a relatively stable structure marked by slow rightward movement, a tall and narrow shape, and slight left skewness. The high peak and concentrated distribution imply limited efficiency disparities among Liaoning, Jilin, and Heilongjiang. Nevertheless, the region as a whole remains within the national medium-to-low efficiency range, and its pace of rightward evolution lags noticeably behind that of other regions. This pattern underscores the transformation challenges associated with strong path dependence on traditional energy systems. The western region demonstrates the most pronounced kernel density evolution. Its distribution shifts from an initially low and relatively flat profile to one characterized by a prominent peak and strong right skewness. This transformation is largely driven by the sustained and robust growth of GTFP in green-energy-rich provinces such as Inner Mongolia, Ningxia, and Xinjiang, which has pulled the entire regional distribution rightward. Meanwhile, other provinces in the region have followed this upward trend, resulting in a “sharp-peaked, right-tailed” distribution that reflects high-efficiency leadership and spillover effects. In contrast, the central region’s kernel density curve exhibits risk-prone characteristics, marked by a leftward shift of the main peak and an increasingly pronounced low-value tail. The cliff-like decline in GTFP observed in provinces such as Hunan may generate new low-density areas on the left side of the distribution, leading to further leftward extension and increased dispersion. This pattern signals intensifying internal differentiation within the region and highlights the potential risk of the emergence of a “low-efficiency trap”.

3.4. Trajectory Transfer Analysis

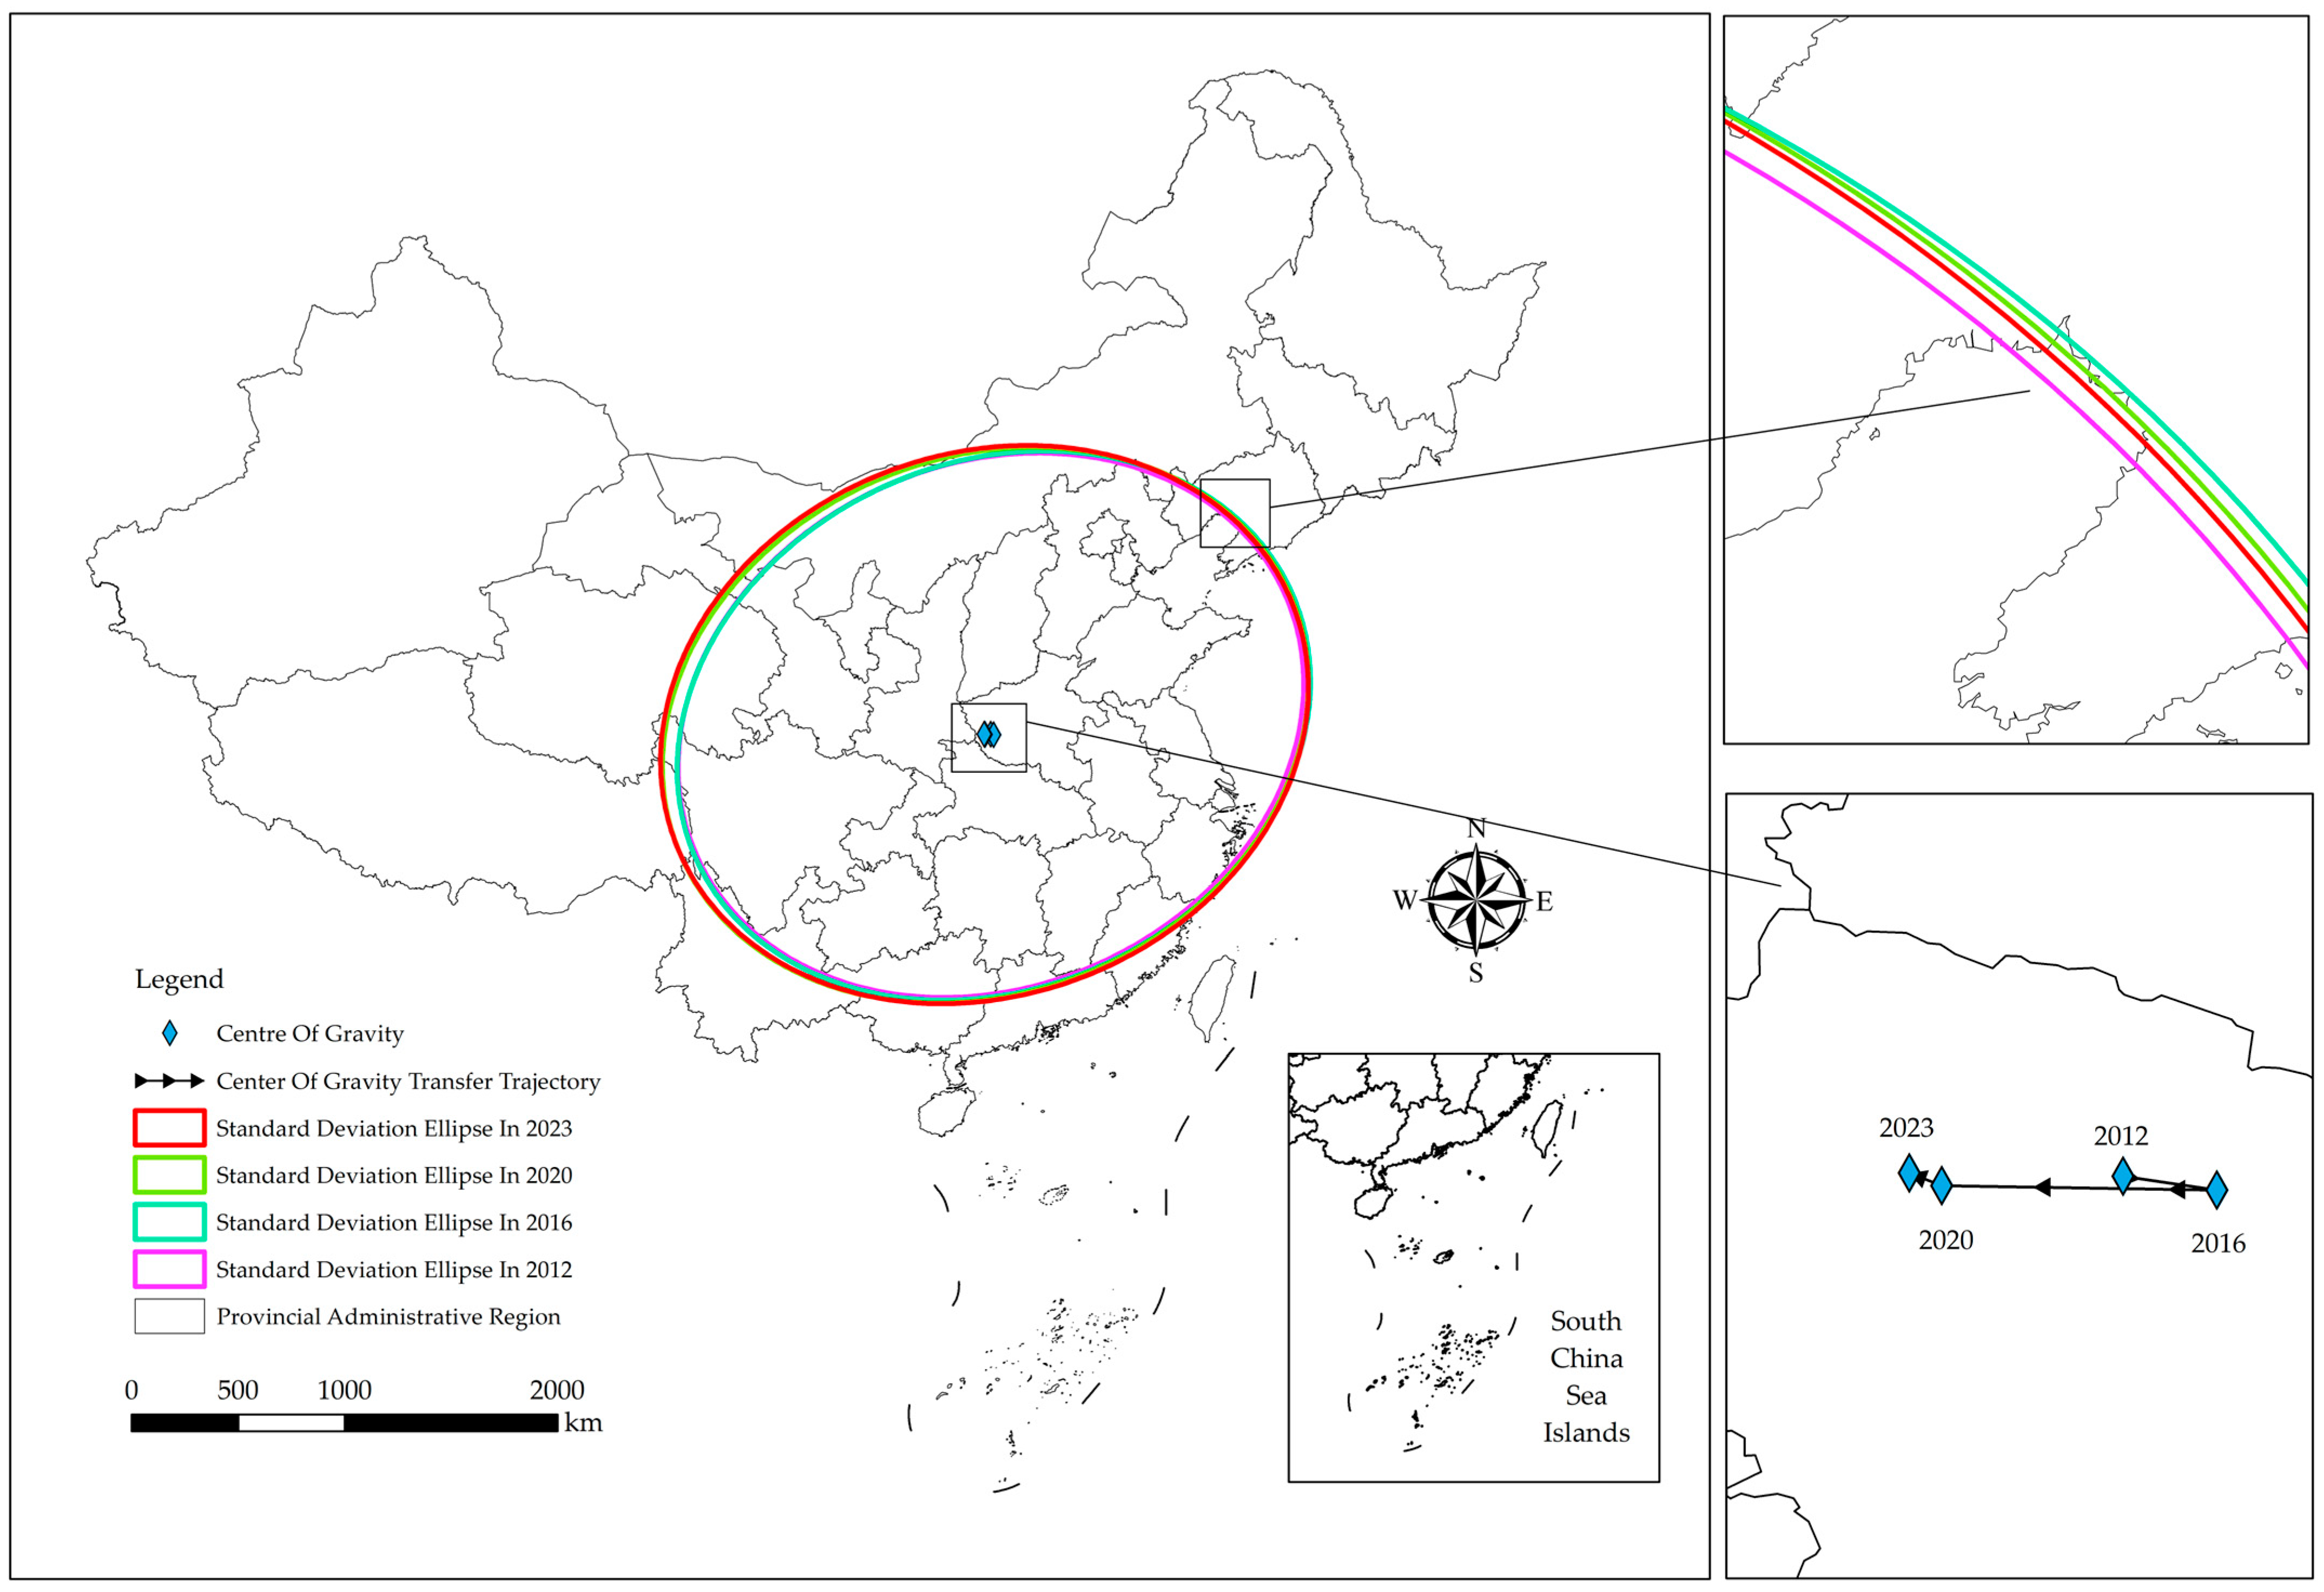
While the previous section examined the evolution of GTFP distribution using kernel density estimation, this section employs the standard deviation ellipse and center-of-gravity shift models to further analyze the spatial characteristics of GTFP in the power industry. Specifically, these methods are used to identify overall trends in spatial dispersion and agglomeration, dominant development directions, and the migration of high-value GTFP areas from a macro-spatial perspective. Such analysis contributes to a better understanding of the spatial mismatch between energy resources and electricity demand and its implications for the evolving spatial pattern of efficiency. Using ArcGIS 10.8, this study maps the spatial centroid migration trajectories and standard deviation ellipses of GTFP in China’s power industry for the years 2012, 2016, 2020, and 2023 (Figure 5). Throughout the study period, the spatial centroid of national power-sector GTFP remains consistently located within Nanyang City, Henan Province, indicating a high degree of geographical stability in the spatial mean center of GTFP. However, the centroid exhibits slight longitudinal oscillations characterized by an “eastward shift followed by a westward return”, which may reflect a dynamic balance between structural adjustments in the eastern region and efficiency improvements in the western region.
Each standard deviation ellipse encompasses approximately 68% of national GTFP. As shown in Table 4, the ellipse area expands gradually from 5,830,573.09 km2 in 2012 to 6,209,635.85 km2 in 2023, representing an increase of about 6.5%. This expansion indicates a clear trend of spatial diffusion in GTFP across provinces, with interprovincial disparities extending further in geographic space. The overall increase in both the major and minor axis lengths further confirms the intensification of spatial heterogeneity in GTFP, as high-efficiency and low-efficiency regions become increasingly dispersed. The orientation angle of the ellipse increases from 66.21° in 2012 to 69.32° in 2023, indicating a continued clockwise rotation of the major axis along the northeast–southwest direction. This shift suggests that the spatial distribution of GTFP is becoming increasingly concentrated along this axis, with the spatial association of high-efficiency regions gradually restructuring toward a northeast–southwest alignment. This pattern may be associated with the strengthening spatial linkages among high-efficiency areas, such as the Chengdu–Chongqing economic zone and the Inner Mongolia–Ningxia–Xinjiang corridor. Ellipse flattening reaches its peak in 2016 and subsequently declines to 0.181 by 2023, indicating a transition from a more elongated shape toward a relatively circular form. The increase in flattening around 2016 suggests enhanced directional concentration of the spatial distribution during this period, potentially driven by efficiency pullbacks in certain high-value eastern provinces alongside the initial rise of western regions, which collectively stretched the distribution along the principal axis. By contrast, the decline in flattening by 2023 reflects a more balanced spatial dispersion across multiple directions, with high-efficiency regions expanding along several axes. In particular, development along the northwest–southeast direction appears to have mitigated the previously dominant axial concentration.
In summary, the westward shift of the GTFP center of gravity, together with the northeast–southwest elongation of the standard deviation ellipse, spatially reflects the significant influence of the rise of western energy bases on the national pattern of green efficiency in the power industry. Meanwhile, the continuous expansion of the ellipse area indicates that, despite the rapid emergence of high-efficiency regions in the west, the efficiency gap between eastern coastal provinces and the northeastern and central regions has continued to widen, suggesting an intensification of spatial heterogeneity.

3.5. Regional Difference Analysis

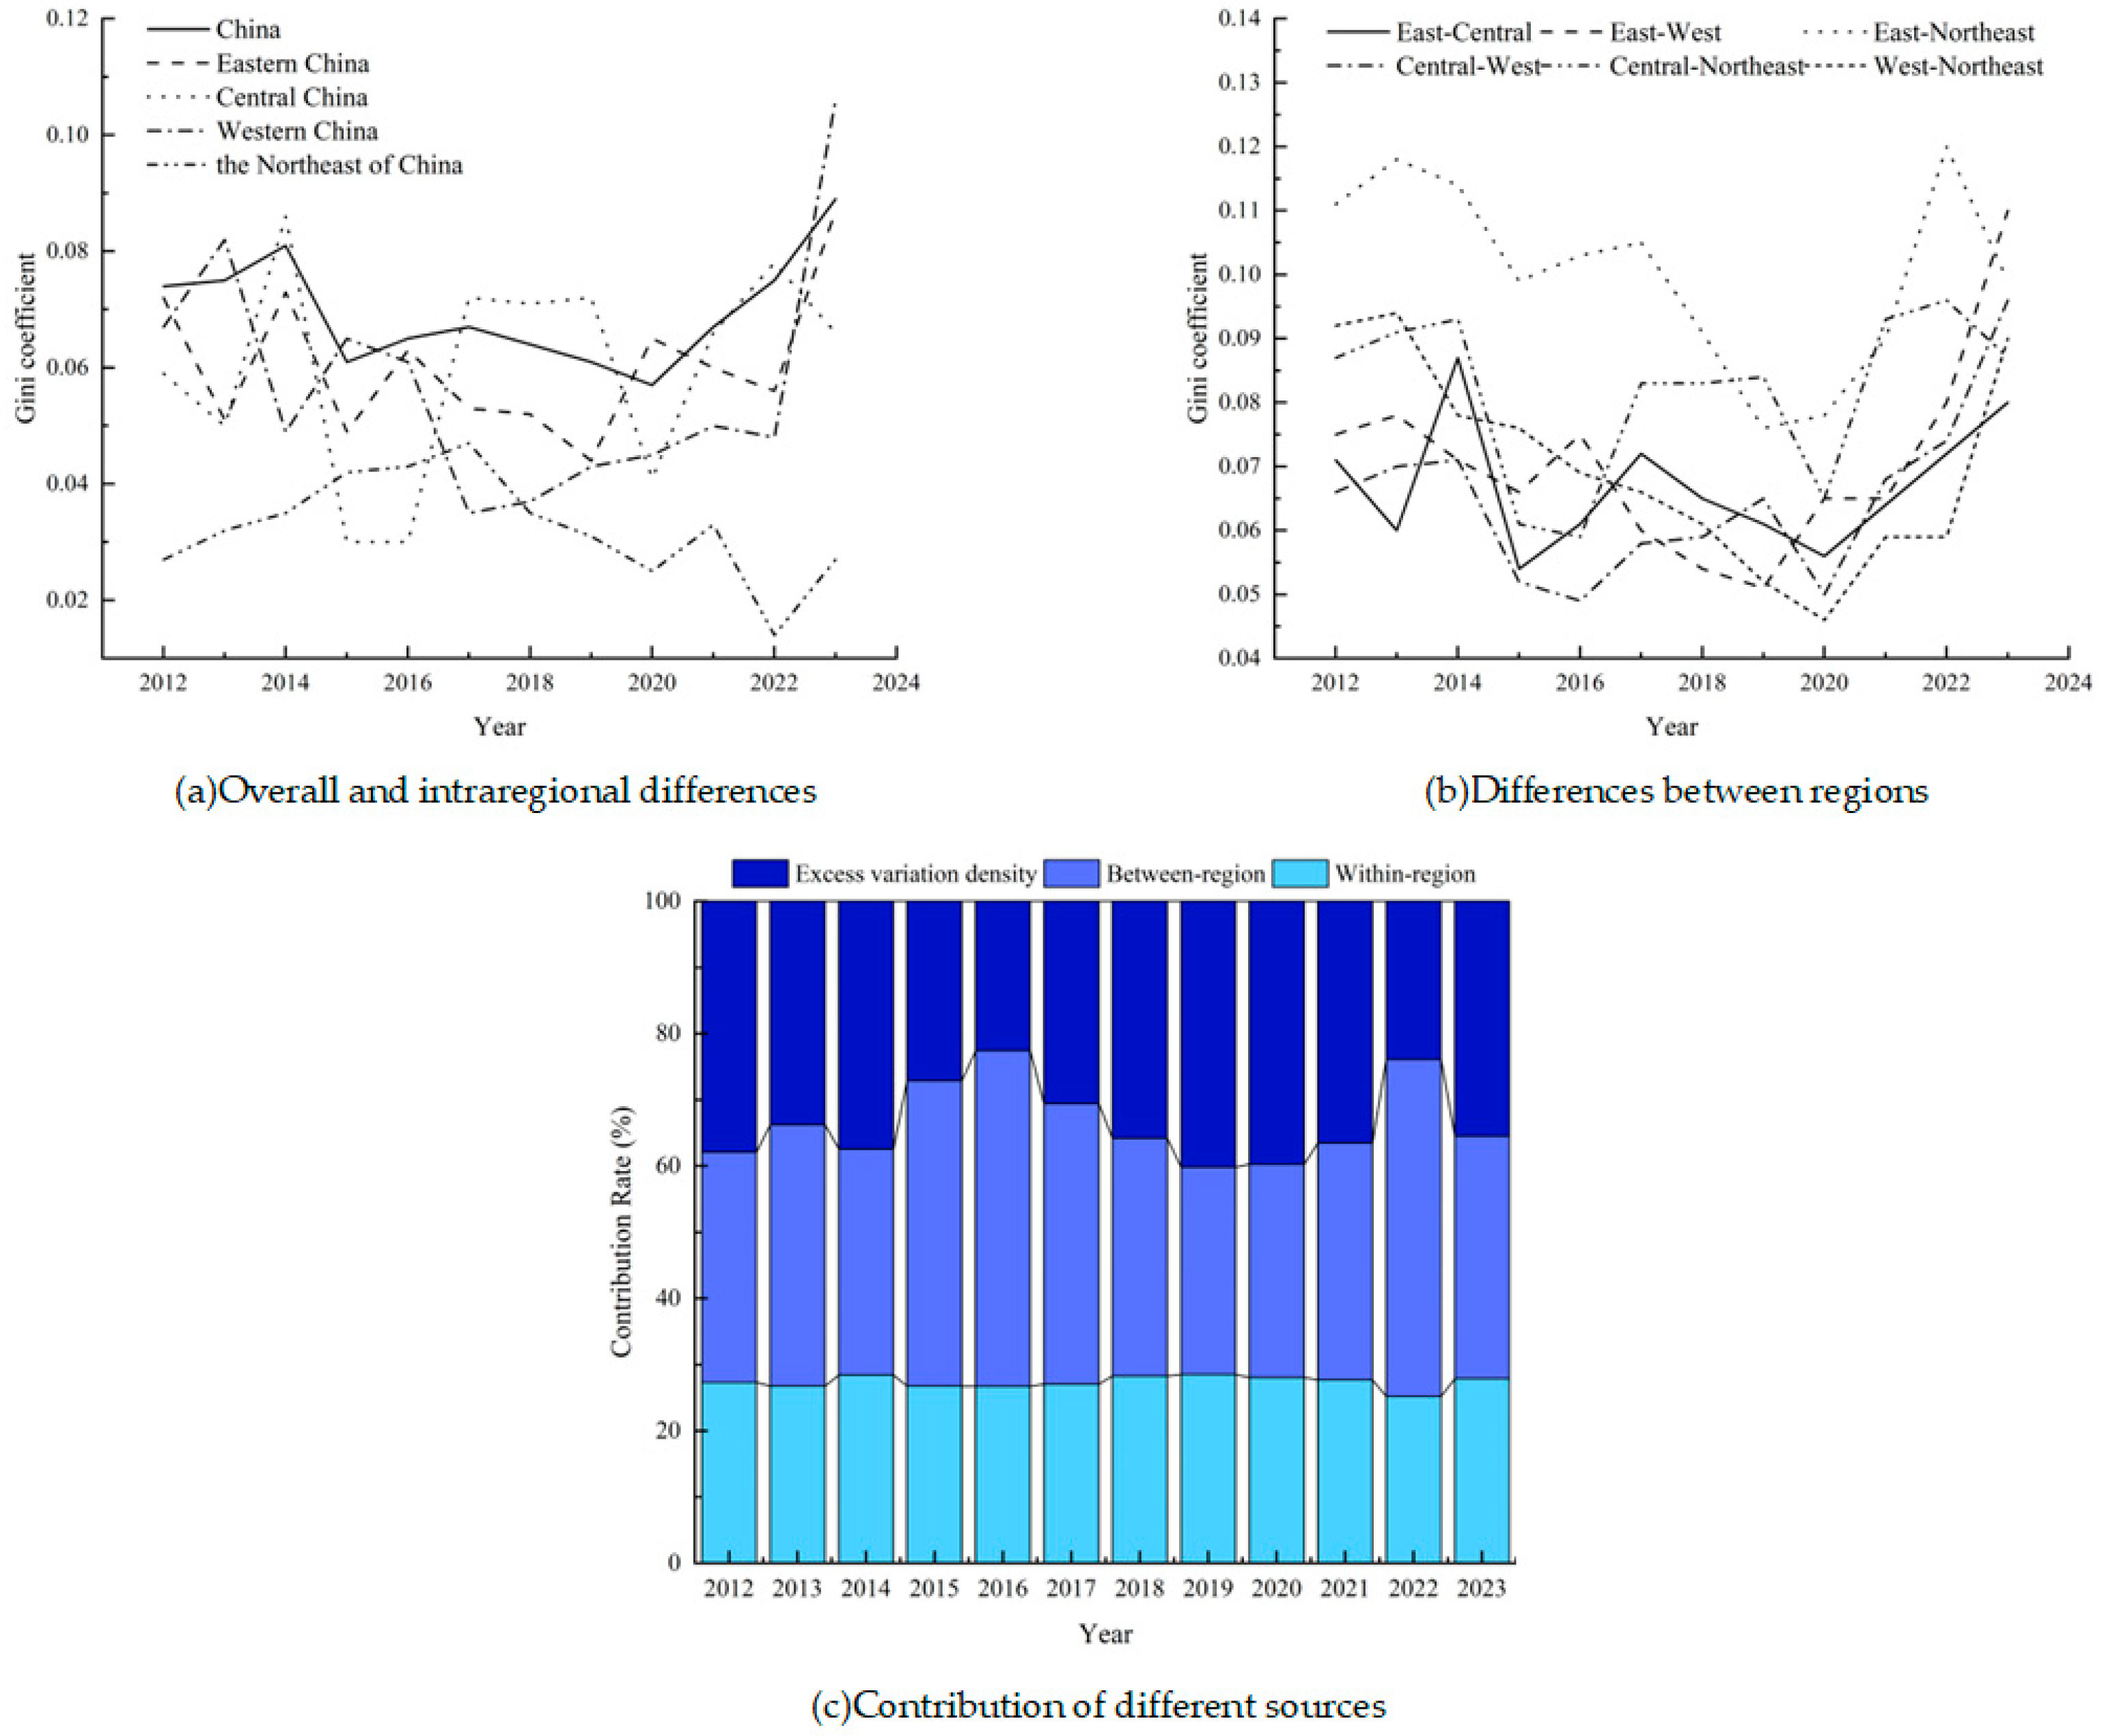
As shown in Figure 6, the average overall Gini coefficient of GTFP in China’s power industry is 0.070, exhibiting pronounced stage-specific dynamics over time. During 2012–2016, the overall Gini coefficient declined from 0.074 to 0.065, indicating a convergence of GTFP across regions. This pattern suggests that coordinated regional development policies and technology diffusion effects began to take hold during this period. From 2017 to 2021, the Gini coefficient fluctuated within a narrow range of 0.057–0.067, reflecting a relatively stable level of regional disparity. However, between 2022 and 2023, the overall Gini coefficient increased sharply, reaching a peak of 0.089 in 2023. This surge indicates a renewed intensification of interregional GTFP divergence and an expansion of spatial differentiation in recent years. The contribution of interregional differences to overall disparity reached two notable peaks in 2016 and 2022, at 50.66% and 50.83%, respectively, closely coinciding with periods of widening overall inequality. This finding indicates that interregional imbalance has been the primary driver of the observed increase in total GTFP differentiation. Meanwhile, the contribution of the transvariation density component peaked at 40.166% in 2019, suggesting that interregional interactions and spatial dependence effects were particularly pronounced during this stage.
Substantial heterogeneity is observed in the intraregional GTFP Gini coefficients across the four major regions. The eastern and central regions exhibit the highest average levels of internal disparity, followed by the western region, while the northeastern region consistently maintains relatively low internal inequality. In terms of dynamic evolution, intraregional disparities in the western region expanded markedly, with the Gini coefficient rising sharply to 0.103 in 2023—making it the region with the most pronounced internal differentiation. This result indicates that, amid the rapid expansion of renewable energy, western provinces vary significantly in their ability to convert resource endowments and policy incentives into efficiency gains, leading to substantial internal divergence in GTFP. Further analysis of interregional disparities reveals that the Gini coefficient between the eastern and northeastern regions is the highest, indicating the largest GTFP gap between any pair of regions. This outcome reflects the persistently lagging transformation of the northeastern region relative to the eastern region. The disparity between the eastern and western regions has increased steadily since 2018, reaching a peak of 0.11 in 2023, suggesting that the east–west GTFP gap has widened again in recent years. Although several high-performing provinces have emerged in the western region, a substantial aggregate gap relative to the eastern region remains. By contrast, disparities between the central region and both the western and northeastern regions exhibit an overall declining and fluctuating trend, indicating a gradual narrowing of efficiency gaps between the central region and these two regions.

4. Analysis of Improvement Path

4.1. Data Calibration

This study employs the entropy-weighted TOPSIS method to conduct a comprehensive evaluation of the conditional variables [33,34,35]. The research data are then calibrated using the direct calibration method. Based on the 95th, 50th, and 5th percentiles of the sample data, three breakpoints are determined to represent full membership, crossover points, and full non-membership, respectively [36,37,38]. The results are presented in Table 5. It should be noted that all conditional variables used in this fsQCA analysis (Table 2) are derived from digital economy-related indicators. Due to substantial missing data for Xizang, this region was excluded from the analysis. Consequently, the configurational analysis is based on a sample of 30 provinces.

4.2. Necessary Condition Analysis

Necessary condition analysis is a key method for determining whether any single variable exerts a decisive influence on the outcome. Consistency is used as the standard for identifying a necessary condition; a variable is considered necessary if its consistency exceeds 0.9 [39,40,41,42]. As shown in Table 6, none of the variables meet this threshold, indicating that no single variable serves as a necessary condition for the outcome.

4.3. Sufficiency Analysis of Conditional Configuration

Using the truth table algorithm in fsQCA 3.0, 26 configurational paths were identified. Given the small sample size of 31, following references [26,27], the raw consistency threshold was set at 0.8, the frequency threshold at 1, and the PRI consistency threshold at 0.5. The software generated complex, parsimonious, and intermediate solutions. For this study, both the intermediate and parsimonious solutions were considered. Conditions appearing in both solutions were classified as core conditions, those appearing only in the intermediate solution were classified as supporting conditions, and conditions not appearing in either solution were regarded as optional conditions. As shown in Table 7, overall and individual configuration consistencies exceed 0.75, indicating that the identified configurations possess strong explanatory power.
Technology-Infrastructure-and-Application-Dominant Type. Configuration 1 demonstrates a consistency of 0.883 and a raw coverage of 0.352, indicating that it accounts for 35.2% of the cases, with a unique coverage of 0.003. This pathway is characterized by TDIC and TDTA as core conditions, while TDOI functions as a complementary condition. Notably, TDOA is absent as a core condition within this configuration. This pathway is particularly applicable to eastern provinces characterized by strong economic fundamentals, substantial electricity demand, and stringent requirements for power supply reliability. As a critical infrastructure underpinning regional economic operations, the power sector in these areas must satisfy rigid real-time balancing constraints across generation, transmission, distribution, and consumption, while simultaneously addressing high-frequency peak regulation and dispatching demands. Intensive investment in digital infrastructure—including ultra-high-voltage (UHV) backbone grids, integrated power communication networks, and the comprehensive deployment of distribution automation terminals—has enabled system-wide data acquisition and real-time control at the physical layer of the power system. These advancements have effectively mitigated persistent challenges such as data fragmentation and dispatching inefficiencies in traditional grid operations. The extensive application of artificial intelligence and big data analytics in areas such as load forecasting, grid self-healing, and optimal resource allocation has shifted decision-making from experience-based judgment to algorithm-driven optimization. This transition has significantly enhanced the accuracy and efficiency of dispatch operations, improved the utilization of existing power assets, and reduced unplanned outages and energy losses. Digital organizational innovation, functioning as a complementary condition, supports technological implementation through the formation of specialized teams and the development of cross-functional coordination mechanisms. These institutional arrangements help bridge the gap between technological investment and operational practice. Fundamentally, this pathway capitalizes on the technology-intensive characteristics of the power industry: deep digitalization of the physical system offsets the relative lag in organizational transformation and exerts a technology-led impetus for productivity enhancement. Accordingly, even in the absence of fully mature digital organizational capabilities, sustained improvements in GTFP can be realized through substantial technological investment. Jiangsu Province exemplifies this configuration. As both a major economic hub and a large electricity-consuming region, Jiangsu has leveraged its strengths in digital infrastructure and advanced technological applications to achieve nationally leading levels of power supply reliability and resource allocation efficiency. Its GTFP has consistently ranked among the highest in the country.
Technology-Application-Driven Supporting Collaborative Type. Configuration 2 exhibits a consistency of 0.875 and a raw coverage of 0.355, explaining 35.5% of cases, with a unique coverage of 0.004. The core feature of this path is the intensive focus of limited resources on the application of TDTA in specific production scenarios, using this as the primary lever for efficiency improvements. TDIC and the external TRDF act as supportive conditions, while the path is constrained by the core absence of internal TDOA. The mechanism underpinning this pathway is consistent with the resource endowment orientation and scenario-specific technological adaptation that characterize the development of the power sector. It is particularly relevant to western provinces endowed with abundant renewable energy resources but constrained by relatively weak economic foundations and traditionally structured power system management models. These regions confront structural challenges associated with the large-scale integration of wind and photovoltaic generation, including forecasting inaccuracies, low renewable energy absorption rates, and heightened grid balancing pressures. Simultaneously, fiscal limitations and shortages of skilled personnel restrict their ability to pursue comprehensive digital infrastructure expansion and broad-based organizational reform. In this context, strategically concentrating limited resources on targeted digital technology innovations within specific operational scenarios represents a rational development pathway. By advancing adaptive technological systems—such as renewable power forecasting models and dispatch optimization solutions tailored to complex geographic and climatic conditions—these provinces can directly alleviate critical efficiency bottlenecks in renewable energy utilization. This approach enhances renewable integration rates while reducing curtailment and generation-related losses. Concurrently, incremental improvements in digital infrastructure, together with support from the broader digital economy ecosystem, provide the necessary technical platforms and institutional environment for the effective implementation of these innovations. This results in a structured empowerment framework characterized by focused technological breakthroughs reinforced by enabling foundational conditions. Fundamentally, this pathway responds to the core imperatives of renewable energy transition in the power sector. By employing scenario-driven technological applications as the primary lever, it facilitates efficiency improvements through concentrated, high-impact interventions that subsequently generate wider systemic gains, thereby mitigating constraints arising from limited organizational capabilities and incomplete infrastructure development. Gansu Province exemplifies this configuration. As a major renewable energy hub in northwestern China, Gansu has substantially improved renewable energy utilization efficiency—and consequently enhanced its GTFP—by prioritizing the development of renewable dispatch optimization technologies and intelligent computing-based big data platforms.
Systemic Coordination Driven by Policy. Configuration 3 exhibits a consistency of 0.818, a raw coverage of 0.479, explaining 47.9% of cases, with a unique coverage of 0.159. This path is characterized by TDIC, TDTA, TDOI, and TGDF as core conditions. It represents a typical policy-driven, multi-dimensional collaborative enhancement model, whose mechanism closely aligns with the core characteristics of the power industry: strong planning orientation and high policy sensitivity. As a capital-intensive and heavily regulated foundational sector, the power industry’s digital transformation and green, low-carbon development cannot be realized without government top-level design and policy guidance. This is particularly true for provinces dominated by traditional energy, where power systems are characterized by large-scale existing assets and strong path dependence in their transformation, making systemic efficiency improvements difficult to achieve through market forces alone. The central guiding role of government digital policies manifests at three levels. First, by issuing targeted transformation plans and clarifying development goals, the government delineates the direction of the power industry’s digital transformation, addressing issues of insufficient motivation and unclear direction among regional power enterprises. Second, by securing key resources such as land, capital, and talent, the government supports the construction of digital infrastructure and the application of digital technologies, thereby reducing the costs and risks associated with enterprise transformation. Third, through coordinated policy planning, it breaks down barriers across the generation, transmission, distribution, and consumption segments of the power sector, promoting comprehensive deployment of digital infrastructure, cross-scenario applications of digital technologies, and full-chain implementation of digital organizational innovations. The core synergy among digital infrastructure, technology application, and organizational innovation forms a complete system of “hardware paving the way–software bridging gaps–organizational safeguarding”, enabling a systematic transformation from physical system digitization to operational model digitization. This approach enhances the power system’s energy conversion efficiency, resource allocation efficiency, and environmental governance efficiency across all dimensions, ultimately driving a systemic improvement in GTFP. Shandong Province exemplifies this approach. As both a major traditional energy base and an economically significant province, it has steadily improved the green efficiency of its power industry under the guidance of targeted government policies through coordinated measures such as constructing energy big data platforms, applying virtual power plant technologies, and implementing clean coal-fired power retrofits.
Policy-Driven Constrained Adaptive Type. Configuration 4 demonstrates a consistency of 0.888, a raw coverage of 0.312, explaining 31.2% of cases, with a unique coverage of 0.055. This path is defined by TGDP as the core condition, with TDTA and TDOI serving as supporting conditions. TDOA and TRDF are absent as core and supporting conditions, respectively. The mechanism of action arises from the dual characteristics of rigid transformation constraints and strong policy-driven pressures in provinces dominated by traditional energy sources. These provinces rely on coal and other fossil fuels as their primary industrial backbone, with power systems deeply integrated with the coal sector, resulting in entrenched path dependencies. Corporate organizational structures are rigid, market-oriented and digital awareness is limited, and the development of the digital economy environment is relatively lagging, making systemic digital transformation difficult to achieve. As pilot regions for the national energy revolution and green transition, these provinces face stringent policy assessments and transformation requirements. In this context, government digital policies serve as the central driving force for improving efficiency in the power sector. The underlying logic is policy-targeted precision alignment: the government issues mandatory transformation policies that compel power enterprises to concentrate their limited resources on core technological applications and organizational innovations aligned with policy objectives—for example, the application of digital twin technologies for clean and efficient coal-fired power utilization, and the development of dispatching platforms to integrate renewable energy. These measures directly address the core environmental and efficiency challenges emphasized in policy evaluations. The complementary synergy between digital technology applications and organizational innovation establishes a precise system for technological implementation and organizational adaptation aligned with policy goals. This enables efficiency improvements and green transformation under policy constraints, even without systemic organizational reform or comprehensive environmental infrastructure development. This pathway represents an adaptive transformation for traditional energy provinces under rigid constraints, whereby policy guidance mitigates path dependence and targeted technological and organizational adjustments drive improvements in GTFP. Shanxi Province, as a pilot for comprehensive national energy reform, exemplifies this approach. By focusing on clean coal-fired power retrofits and digitalized renewable energy dispatching, the province has enhanced green efficiency in the power sector while ensuring stable energy supply, representing a typical case of this policy-driven, adaptive transformation.
Infrastructure-Ecology Synergy-Driven Type. Configuration 5 exhibits a consistency of 0.898, a raw coverage of 0.286, explaining 28.6% of cases, with a unique coverage of 0.027. This path is anchored by high-quality TDIC, supported by strong TGDP, and reinforced by a mature TRDF. TDOA is the absence of core condition, and TDOI is the absence of auxiliary condition. The mechanism of action relies on the strategic characteristics of cross-regional resource allocation in the power industry and the trend toward integrated technology applications. It is primarily applicable to regions located at key nodes of the national energy strategy that benefit from both policy and resource advantages. Although local power systems in these regions are relatively small and their digital organizational and innovation capacities are limited, they serve as core hubs for cross-regional power resource allocation, leveraging national strategic initiatives such as the West-to-East Power Transmission project. Government digital policies provide top-level design and targeted support for digital infrastructure development, while a mature digital economy environment offers nationwide technological, equipment, and industrial chain support. The construction of high-quality digital infrastructure—such as the digital support systems for UHV transmission projects and comprehensive power data collection networks—directly establishes the physical foundation for efficient cross-regional power resource allocation, meeting the power industry’s requirements for long-distance, high-capacity transmission. Government policies provide essential support by offering regulatory endorsement and resource allocation, addressing coordination challenges in cross-regional infrastructure development. Meanwhile, a mature digital economy enables these regions to efficiently integrate the most advanced digital technologies and equipment nationwide, ensuring that digital infrastructure is built to a high standard and operates efficiently. The core logic of this pathway is to leverage the advantages of strategic nodes and external ecological benefits, with high-quality digital infrastructure at its center, to overcome organizational capacity limitations. By achieving highly efficient digitalization at the physical level of the power system, it directly enhances cross-regional resource allocation efficiency and energy utilization efficiency, driving GTFP to a nationally leading level. Ningxia exemplifies this configuration. By relying on its strategic position within the West-to-East Power Transmission initiative and the policy benefits of the National New Energy Comprehensive Demonstration Zone, it has established a world-leading ultra-high-voltage digital support system. By efficiently integrating technology and equipment through the nationwide mature industrial chain, Ningxia has maintained a nationally leading GTFP ranking despite local organizational capacity constraints.


4.4. Robustness Test for Configuration Analysis

Robustness testing is an essential step in configurational analysis. It is typically performed by increasing the consistency threshold or adjusting the calibration thresholds; if the new configurations generated are subsets of the original configurations, the results are considered robust. Following reference [43], the raw consistency threshold was raised from 0.8 to 0.85, while keeping all other conditions unchanged. The results indicate that the influencing conditions in the new configurations remain largely consistent with those in the original configurations (Table 8), with no changes in the composition of core or complementary conditions. Furthermore, the overall consistency of the configurations under this stricter threshold increased to 0.847, confirming the strong robustness of the findings.

5. Conclusions and Implications

5.1. Research Conclusions

Under the dual background of digital transformation and low-carbon development, improving GTFP has become a key pathway for enhancing the sustainability of China’s power industry. Using panel data from 30 provinces over the period 2012–2023, this study systematically examined the spatiotemporal evolution, regional disparities, and configurational drivers of power-sector GTFP. A comprehensive analytical framework was constructed by integrating super-efficiency SBM measurement, spatial analysis methods, Dagum Gini decomposition, and fsQCA. Several main conclusions can be drawn.
(1)
The overall level of GTFP in China’s power industry shows a gradual upward trend, indicating steady progress in green transformation. However, the improvement process is characterized by considerable regional variation. The western region has experienced relatively rapid growth, while the eastern region maintains a stable efficiency advantage. In contrast, the central and northeastern regions show slower improvement and greater structural constraints.
(2)
The spatial distribution of GTFP exhibits clear regional clustering and evolving spatial patterns. The center of gravity of efficiency has gradually shifted toward the west, reflecting the increasing importance of renewable energy development in western China. At the same time, the spatial distribution has become more dispersed, indicating growing differentiation among provinces.
(3)
Regional disparities remain an important feature of power-sector GTFP. The decomposition results show that interregional differences constitute the primary source of overall inequality. Although some regions have achieved rapid improvement, the gap between regions has not been fully narrowed.
(4)
The configurational analysis reveals that multiple pathways can lead to high GTFP. Different combinations of technological, organizational, and environmental conditions are capable of supporting efficiency improvement. These results indicate that the digital-driven transformation of the power industry does not follow a single development trajectory but instead depends on region-specific structural conditions.
This study contributes to the literature in several respects. First, by integrating efficiency measurement, spatial analysis, and configurational analysis, the study provides a comprehensive perspective on the mechanisms underlying green transformation in the power industry. Second, the configurational approach highlights the role of interacting factors in shaping productivity outcomes, complementing conventional single-factor analyses. Third, the findings provide empirical evidence on the regional heterogeneity of digital-driven green development in China’s power sector. The results suggest that improving GTFP in the power industry requires coordinated progress in technological development, organizational adaptation, and institutional support. Recognizing regional differences and multiple transformation pathways is essential for understanding the dynamics of green transformation in the power sector.

5.2. Discussion

The pronounced regional disparities identified in this study have significant implications beyond the provincial level, influencing China’s ability to achieve its national strategic objectives in the energy transition.

5.2.1. Impact on the Unified National Electricity Market

The coexistence of a high-efficiency western cluster and a low-efficiency central region—hereafter referred to as the “central depression”—indicates that cross-provincial power transmission, a cornerstone of the West-to-East Power Transmission strategy, operates under suboptimal conditions. When power-receiving provinces in the central region exhibit persistently low GTFP, the system-wide benefits of renewable-rich generation in the west are partially offset by inefficiencies in transmission, distribution, and consumption. This misalignment increases the average cost of decarbonization and undermines the economic rationale for long-distance power trading. The persistent lag in the northeastern region further exacerbates the problem, as its limited integration into national transmission networks reduces the potential for efficiency-enhancing interregional exchanges.

5.2.2. Impact on International Climate Commitments

Under the ratchet mechanism of the Paris Agreement, China’s nationally determined contributions are expected to become increasingly ambitious over time. If lagging regions—particularly those in Northeast and Central China—fail to accelerate their green transitions, the national emission reduction trajectory could be constrained by these regional “bottlenecks”. This may impose disproportionate adjustment costs on leading regions or necessitate politically costly interventions, thereby increasing the overall cost of compliance. In international climate negotiations, the credibility of China’s commitments depends not only on aggregate outcomes but also on the perceived feasibility of the transition pathway. Persistent regional fragmentation could invite scrutiny from international partners and potentially undermine China’s negotiating position in global climate diplomacy.

5.2.3. Impact on Global Competitiveness in Green Technologies

The eastern region serves as the primary hub for green technology innovation, while the central and northeastern regions function as the “absorption market” for these technologies. If provinces in these midstream and downstream regions lack absorptive capacity—due to weak organizational capabilities, policy inertia, or external constraints—the diffusion of domestically developed technologies will be hindered. This limitation constrains the scale economies and learning-by-doing effects that are crucial for Chinese green technology firms to achieve global cost leadership and technological parity with international competitors. In the context of intensifying green technology competition among major economies, such internal fragmentation could undermine the international competitiveness of China’s green industrial base. Foreign competitors may capture market share precisely in those regions where domestic technologies fail to penetrate, creating long-term dependencies that complicate industrial policy.
Regional differentiation may shape the broader dynamics of China’s energy transition in several ways. Persistent efficiency gaps in the central and northeastern regions could weaken the effectiveness of cross-regional resource allocation and increase the overall cost of achieving carbon neutrality in the power system. At the same time, large regional disparities may raise questions about the feasibility and inclusiveness of the transition pathway in international climate discussions. Uneven domestic development may also slow the formation of scale advantages in emerging green technology markets. In the absence of a more integrated domestic market, firms could face greater difficulty participating in international standard-setting and responding to evolving regulatory frameworks such as the Inflation Reduction Act (IRA) and the Carbon Border Adjustment Mechanism (CBAM).

5.3. Policy Implications

The policy implications proposed in this study are derived from the empirical results obtained through multiple analytical approaches. Spatiotemporal analysis provides the basis for regionally differentiated strategies, regional disparity decomposition informs cross-regional coordination mechanisms, and configurational analysis identifies transformation pathways under different structural conditions. This integrated framework ensures that the policy recommendations are grounded in empirical evidence and reflect the multidimensional nature of digital-driven green development in the power industry.

5.3.1. Regionally Differentiated Transformation Strategies

The spatiotemporal analysis reveals substantial regional heterogeneity in power-sector GTFP, indicating that uniform policy approaches are unlikely to be effective. Differentiated strategies are therefore required to accommodate diverse regional conditions. The western region should consolidate its advantages in renewable energy development while reducing growing internal disparities. Emphasis should be placed on improving the efficiency of renewable energy utilization and promoting technology diffusion among provinces. Strengthening coordination in digitalized renewable energy management may help transform resource endowments into sustained productivity gains. The eastern region should continue to strengthen its role as a technological leader. Given its relatively stable and high GTFP levels, future policy efforts should focus on advanced digital technologies and innovative operational models. Enhancing technological spillovers through interregional cooperation would support more balanced development at the national level. The central region requires targeted transformation policies to address structural constraints associated with traditional energy systems. Expanding digital infrastructure and improving organizational capabilities are essential for preventing the persistence of low-efficiency patterns. Policy efforts should focus on coordinated technological upgrading and institutional adaptation. The northeastern region faces long-standing structural rigidities that limit efficiency improvement. Targeted policy support and strengthened integration into national electricity markets may help improve resource allocation efficiency and accelerate technological upgrading.

5.3.2. Cross-Regional Coordination Mechanisms

Regional disparity decomposition indicates that interregional differences constitute the main source of overall inequality in GTFP. This finding underscores the importance of strengthening cross-regional coordination mechanisms. Technological collaboration and market integration between regions with different efficiency levels should be encouraged. The upgrading of cross-regional transmission systems through smart grid technologies and digital dispatching platforms can enhance the efficiency of electricity allocation and facilitate renewable energy integration. The development of unified electricity markets and green electricity trading mechanisms may further improve resource allocation efficiency. These institutional arrangements can reduce mismatches between renewable energy supply and electricity demand across regions. Particular attention should be given to regions experiencing rapid growth in internal disparities, especially in western China. Coordinated development policies are necessary to prevent excessive polarization and to ensure that efficiency improvements are broadly shared.

5.3.3. Configuration-Based Transformation Pathways

The fsQCA results indicate that improvements in GTFP can be achieved through multiple configurational pathways. These findings suggest that transformation strategies should be aligned with regional structural conditions rather than relying on uniform policy models.
Configuration 1 represents a technology-led pathway characterized by strong digital infrastructure and technological applications. This pathway is most relevant for economically developed eastern provinces. Continuous investment in digital infrastructure and intelligent grid technologies should be encouraged, together with organizational adjustments that facilitate the effective use of digital systems.
Configuration 2 highlights the importance of targeted technological applications under resource constraints. This pathway is particularly suitable for renewable-energy-rich western provinces. Concentrating limited resources on key technological applications, such as renewable energy forecasting and intelligent dispatching systems, can generate significant efficiency improvements without requiring large-scale infrastructure expansion.
Configurations 3 and 4 emphasize the role of policy-driven transformation. In regions characterized by strong policy influence, governments should strengthen coordination mechanisms and provide clear strategic direction for digital transformation. The establishment of unified digital standards and integrated data platforms can support systematic improvements in operational efficiency. For traditional energy-producing regions, policy support should be combined with market-based incentives to promote technological upgrading.
Configuration 5 reflects a pathway based on infrastructure and ecosystem advantages. This pathway is particularly relevant for strategic-node regions within the national energy system. Coordinated development of digital infrastructure and large-scale transmission projects can enhance cross-regional resource allocation efficiency. External technological ecosystems may also help compensate for local capacity constraints.
5.3.4. Institutional Support for Long-Term Transformation

In addition to configuration-specific strategies, several institutional measures are necessary to support long-term efficiency improvement. First, a comprehensive data governance framework should be established to ensure the secure and efficient use of power-sector data. Clear classification standards and appropriate protection mechanisms are necessary to safeguard system reliability while supporting digital innovation. Second, interdisciplinary talent development should be strengthened to support digital transformation in the power industry. Collaboration between universities and enterprises can facilitate the training of professionals with expertise in both power systems and digital technologies. Such human capital development will provide a stable foundation for sustained productivity growth.

5.4. Limitations and Future Work

This study has several limitations. First, although the measurement of GTFP incorporates carbon dioxide emissions, it does not account for other pollutants or the full life-cycle environmental impacts. Future research should develop more comprehensive environmental efficiency indicators to capture the broader ecological implications of power sector operations. Second, while this study uses standard deviation ellipses and Gini coefficient decomposition to examine spatial patterns and sources of GTFP disparities, it does not employ spatial econometric models to quantify the direct and spillover effects of digital economy factors. Given the power industry’s trans-regional connectivity and the spatial dependence of policy learning and technology diffusion, this limits our ability to separate local impacts from cross-regional externalities. Future research could combine spatial econometrics with fsQCA, first identifying variables with significant spatial spillovers and then exploring their configurational effects across regions, providing a more complete understanding of the digital–green transformation in China’s power sector. Third, potential endogeneity issues warrant careful consideration. In empirical studies of digital transformation and productivity, reverse causality may arise because regions with higher GTFP are better able to invest in digital technologies. Omitted variables may also simultaneously affect both digital development and efficiency outcomes. The fsQCA method adopted in this study differs fundamentally from regression-based approaches: rather than estimating marginal effects, it identifies configurations of sufficient conditions associated with the outcome. Its set-theoretic logic emphasizes conjunctural causation and causal asymmetry, focusing on the sufficiency of condition combinations rather than average causal effects, which reduces sensitivity to reverse causality in the conventional econometric sense. Moreover, this study mitigates simultaneity concerns by leveraging multi-year panel data and structurally distinct TOE dimensions. Nonetheless, fsQCA cannot fully eliminate bias from omitted variables. Future research could adopt a mixed-methods design, first identifying the causal effects of core variables through rigorous econometric models (e.g., instrumental variables, difference-in-differences) and then applying fsQCA to examine their complex configurations, thereby more systematically elucidating the mechanisms underlying digital-driven green transformation. Fourth, because fsQCA emphasizes conditional configurations within a bounded subnational case system, it is not well suited to capturing systemic shocks that simultaneously affect all provinces. This study primarily investigates the determinants of domestic GTFP within the TOE framework and therefore does not explicitly account for the influence of the international macroeconomic environment. Future research could adopt a multilevel design to systematically examine interactions between global forces and subnational responses, expanding the unit of analysis from provinces within a single country to cross-border cases. Such an approach would illuminate configurational differences between global influences and local responses across diverse institutional contexts.

Author Contributions

Conceptualization, K.J. and H.J.; methodology, K.J.; software, K.J.; validation, H.J., Y.H. and S.Y.; formal analysis, K.J.; investigation, J.Z.; resources, H.J.; data curation, H.J.; writing—original draft preparation, K.J.; writing—review and editing, H.J.; visualization, H.J.; supervision, J.Z.; project administration, J.Z.; funding acquisition, Y.H. All authors have read and agreed to the published version of the manuscript.

Funding

This research was funded by Anhui Provincial Scientific Research Projects in Higher Education Institutions (2023AH040152), and Anhui Philosophy and Social Science Planning Projects (AHSKQ2024D025, AHSKYY2025D41).

Institutional Review Board Statement

Not applicable.

Informed Consent Statement

Not applicable.

Data Availability Statement

The original data presented in the study are openly available in FigShare at https://doi.org/10.6084/m9.figshare.31553047.

Conflicts of Interest

The authors declare no conflicts of interest.

Abbreviations

The following abbreviations are used in this manuscript:
CBAMCarbon Border Adjustment Mechanism
CEADsChina Emissions Accounts and Datasets
CNRDSChina National Research Data Service Platform
CSMARChina Stock Market & Accounting Research Database
DEAData Envelopment Analysis
DMUDecision-making unit
EUEuropean Union
fsQCAfuzzy-set Qualitative Comparative Analysis
GMLGeometric Mean Luenberger
GTFPGreen Total Factor Productivity
IRAInflation Reduction Act
MLPIMalmquist–Luenberger productivity index
NDCsNationally Determined Contributions
NCANecessary Condition Analysis
PSM-DIDPropensity Score Matching—Differences-in-Differences
SBMSlacks-Based Measure
TOETechnology–organization–environment
UHVUltra-high-voltage
U.S.United States

References

  1. Zhong, S.; Fang, Y. The impact of electricity consumption on green total factor productivity: Evidence from Chinese provinces. J. Knowl. Econ. 2025, 16, 3921–3947. [Google Scholar] [CrossRef] [Scilit]
  2. Jiang, Y.; Wang, R.; Mei, Y. Impact Mechanism of the Digital Economy in Promoting Carbon Emission Reduction in the Yangtze River Delta Urban Agglomeration: A Moderated Mediation Effect Approach. J. Resour. Ecol. 2025, 16, 1613–1625. [Google Scholar] [CrossRef] [Scilit]
  3. Qian, J.; Zhou, Y.; Hao, Q. The effect and mechanism of digital economy on green total factor productivity-Empirical evidence from China. J. Environ. Manag. 2024, 372, 123237. [Google Scholar] [CrossRef] [Scilit] [PubMed]
  4. Zaman, A.U.; Valiyattoor, V. Evaluating the green total factor productivity and convergence among emerging and resource intensive economies. Discov. Sustain. 2025, 6, 1053. [Google Scholar] [CrossRef] [Scilit]
  5. Chen, L.; Hu, L.; He, F.; Rao, Z. Fiscal science and technology expenditure, industrial agglomeration and green total factor productivity: Experiences from China. Financ. Res. Lett. 2025, 85, 108199. [Google Scholar] [CrossRef] [Scilit]
  6. Liu, X. Analysis of the impact of digital financial development on green total factor productivity and its spatial spillover effects. J. Appl. Econ. Policy Stud. 2025, 18, 104–122. [Google Scholar] [CrossRef] [Scilit]
  7. Tian, Z.; Li, Y. Synergistic mechanisms of digital economy and multi-actor environmental regulation on green total factor productivity. J. Environ. Manag. 2025, 393, 126943. [Google Scholar] [CrossRef] [Scilit]
  8. Wang, X.; Shi, X. Impact of digital transformation on green production: Evidence from China. Heliyon 2024, 10, e35526. [Google Scholar] [CrossRef] [Scilit]
  9. Chen, H.; Yu, Z.; Hu, S. Digital economy, human capital accumulation, and corporate green total factor productivity: Based on strategic emerging industries. Int. Rev. Financ. Anal. 2025, 103, 104152. [Google Scholar] [CrossRef] [Scilit]
  10. Wan, A.W.; Cui, W. Has the green total factor productivity increased in the early stage of the establishment of smart city. PLoS ONE 2025, 20, e0322922. [Google Scholar] [CrossRef] [Scilit] [PubMed]
  11. Shah, W.U.H.; Hao, G.; Yan, H.; Yasmeen, R.; Lu, Y. Energy efficiency evaluation, changing trends and determinants of energy productivity growth across South Asian countries: SBM-DEA and Malmquist approach. Environ. Sci. Pollut. Res. 2023, 30, 19890–19906. [Google Scholar] [CrossRef] [Scilit]
  12. Meng, M.; Pang, T.; Li, X. Assessing the total factor productivity of China’s thermal power industry using a network DEA approach with cross-efficiency. Energy Rep. 2023, 9, 5196–5205. [Google Scholar] [CrossRef] [Scilit]
  13. Wei, W.; Han, Y.; Abedin, M.Z.; Ma, J.; Chai, S. Empirical study on the technical efficiency and total factor productivity of power industry: Evidence from Chinese provinces. Energy Econ. 2023, 128, 107161. [Google Scholar] [CrossRef] [Scilit]
  14. Tone, K. A slacks-based measure of super-efficiency in data envelopment analysis. Eur. J. Oper. Res. 2002, 143, 32–41. [Google Scholar] [CrossRef] [Scilit]
  15. Shu, T.; Liao, X.; Yang, S.; Yu, T. Towards sustainability: Evaluating energy efficiency with a super-efficiency SBM-DEA model across 168 economies. Appl. Energy 2024, 376, 124254. [Google Scholar] [CrossRef] [Scilit]
  16. Shah, W.U.H.; Zhu, N.; Hao, G.; Yan, H.; Yasmeen, R. Energy efficiency evaluation, technology gap ratio, and determinants of energy productivity change in developed and developing G20 economies: DEA super-SBM and MLI approaches. Gondwana Res. 2024, 125, 70–81. [Google Scholar] [CrossRef] [Scilit]
  17. He, W.; Zhao, L.; Kong, Y.; Peng, Q.; Yuan, L.; Ramsey, T.S.; Degefu, D.M.; Wu, X. Prediction and Early Warning of Water Environmental Carrying Capacity Based on Kernel Density Estimation Method and Markov Chain Model. Water 2025, 17, 3414. [Google Scholar] [CrossRef] [Scilit]
  18. Jinuntuya, P.; Jinuntuya, N. Propagation of uncertainty with arbitrarily distributions by kernel density estimation method. J. Phys. Conf. Ser. 2025, 2934, 012002. [Google Scholar] [CrossRef] [Scilit]
  19. Wang, Z.; Hu, T.; Liu, J.; Xia, B.; Chileshe, N. Spatial differences, evolutionary characteristics and driving factors on economic resilience of the construction industry: Evidence from China. Eng. Constr. Archit. Manag. 2025, 32, 6888–6916. [Google Scholar] [CrossRef] [Scilit]
  20. Mao, X.; Zhuang, Y. Spatiotemporal heterogeneity of carbon emission intensity distribution in the tourism industry and its calculation methods. Sustain. Energy Res. 2025, 12, 14. [Google Scholar] [CrossRef] [Scilit]
  21. Zhuang, R.; Yang, J.; Mi, K.; Zhou, X. Urban-rural disparity in China’s residential energy consumption: Spatiotemporal dynamics, key drivers, and future trends. Energy Rep. 2026, 15, 108950. [Google Scholar] [CrossRef] [Scilit]
  22. Yuan, Z.; Wu, R.; Fang, W.; Liu, Y. Analysis of the spatiotemporal evolution and drivers of agricultural carbon emissions: Evidence from provincial-level regions of China. Sci. Rep. 2026, 16, 925. [Google Scholar] [CrossRef] [Scilit]
  23. Li, S.; Hu, S.; Tong, N.; Xie, W.; Tong, L.; Hu, S. How urban resilience shapes residents’ immediate emotions during heatwaves: A panel fuzzy-set qualitative comparative analysis (fsQCA)-based configurational analysis. Sustain. Cities Soc. 2026, 136, 107067. [Google Scholar] [CrossRef] [Scilit]
  24. Liu, Z.; Li, B. How Does Digital Economy Drive High-Quality Agricultural Development?-Based on a Dynamic QCA and NCA Combined Approach. Sustainability 2025, 17, 10683. [Google Scholar] [CrossRef] [Scilit]
  25. Chen, L.; Fu, F.; Xu, H. Unveiling How the Digital Economy Empowers Green Productivity: Machine Learning and FsQCA Methods. Sustainability 2025, 17, 8023. [Google Scholar] [CrossRef] [Scilit]
  26. Gao, L. Research on the Development Path of the Digital Economy Empowered by Multiple Factors under the TOE Framework: An fsQCA Analysis of 280 Cities. Procedia Comput. Sci. 2025, 266, 1050–1057. [Google Scholar] [CrossRef] [Scilit]
  27. He, N.; Ding, R. A dual-method approach integrating dynamic QCA and LightGBM-SHAP algorithms to uncover the configuration paths and key drivers of water resource green efficiency in China. Ecol. Indic. 2025, 175, 113540. [Google Scholar] [CrossRef] [Scilit]
  28. Wang, S.; Xue, Z. Has the development of the digital economy improved green total factor productivity in China?-A study based on data at the provincial level in China. Front. Environ. Sci. 2023, 11, 1073997. [Google Scholar] [CrossRef] [Scilit]
  29. Zeng, H.; Wang, C.; Chen, J.; Tang, D.; Xu, A. Pathways to tourism industry ecologization: A technology-organization-environment configuration framework. Ecol. Indic. 2023, 156, 111119. [Google Scholar] [CrossRef] [Scilit]
  30. Zhang, P.; Yi, X.; Yu, H.; Li, T.; Mao, Y. Spatio-temporal evolution and driving mechanisms of rural resilience under ecological protection policies: A multi-scale analysis of technology-governance synergy in the Changsha-Zhuzhou-Xiangtan Green Heart, China. Environ. Sustain. Indic. 2026, 29, 101091. [Google Scholar] [CrossRef] [Scilit]
  31. Zhang, Z.; Wang, Q.; Feng, Y.; Sun, Y.; Liu, N.; Yan, S. The spatio-temporal evolution of spatial structure and supply-demand relationships of the ecological network in the Yellow River Delta region of China. J. Clean. Prod. 2024, 471, 143388. [Google Scholar] [CrossRef] [Scilit]
  32. Sun, K.; Han, J.; Wu, Q.; Xie, W.; He, W.; Yang, Z.; Wang, Y.; Liu, J.; Shi, E. The coupling coordination and spatiotemporal evolution of industrial water-energy-CO2 in the Yellow River Basin. Sci. Total Environ. 2024, 912, 169012. [Google Scholar] [CrossRef] [Scilit]
  33. Dehdasht, G.; Ferwati, M.S.; Zin, R.M.; Abidin, N.Z. A hybrid approach using entropy and TOPSIS to select key drivers for a successful and sustainable lean construction implementation. PLoS ONE 2020, 15, e0228746. [Google Scholar] [CrossRef] [Scilit] [PubMed]
  34. Li, X.; Meng, X.; Ji, X.; Zhou, J.; Pan, C.; Gao, N. Zoning technology for the management of ecological and clean small-watersheds via k-means clustering and entropy-weighted TOPSIS: A case study in Beijing. J. Clean. Prod. 2023, 397, 136449. [Google Scholar] [CrossRef] [Scilit]
  35. Wei, Z.; Ji, D.; Yang, L. Comprehensive evaluation of water resources carrying capacity in Henan Province based on entropy weight TOPSIS—Coupling coordination—Obstacle model. Environ. Sci. Pollut. Res. 2023, 30, 115820–115838. [Google Scholar] [CrossRef] [Scilit]
  36. Liao, X.; Yu, W.; Ji, S. When green feels real: The impact of green brand authenticity on consumer green behaviour and eWOM with PLS-SEM, NCA, and fsQCA. J. Retail. Consum. Serv. 2026, 90, 104720. [Google Scholar] [CrossRef] [Scilit]
  37. Huang, Y.; Li, S.; Xiang, X.; Bu, Y.; Guo, Y. How can the combination of entrepreneurship policies activate regional innovation capability? A comparative study of Chinese provinces based on fsQCA. J. Innov. Knowl. 2022, 7, 100227. [Google Scholar] [CrossRef] [Scilit]
  38. Fu, H.; Xu, M.; Wu, Y.; Wang, W. What facilitates frugal innovation?-A configurational study on the antecedent conditions using fsQCA. J. Innov. Knowl. 2024, 9, 100522. [Google Scholar] [CrossRef] [Scilit]
  39. Qiu, Q.; Thoo, A.C.; Sarker, M.; Zhan, Z.; Huam, H.T. More than a green choice: How personal and environmental drivers shape EV intentions through a human-focused lens. Res. Transp. Bus. Manag. 2026, 65, 101589. [Google Scholar] [CrossRef] [Scilit]
  40. Dul, J. Identifying single necessary conditions with NCA and fsQCA. J. Bus. Res. 2016, 69, 1516–1523. [Google Scholar] [CrossRef] [Scilit]
  41. Cervelló-Royo, R.; Moya-Clemente, I.; Perelló-Marín, M.R.; Ribes-Giner, G. Sustainable development, economic and financial factors, that influence the opportunity-driven entrepreneurship. An fsQCA approach. J. Bus. Res. 2020, 115, 393–402. [Google Scholar] [CrossRef] [Scilit]
  42. Huang, Y.; Li, K.; Li, P. Innovation ecosystems and national talent competitiveness: A country-based comparison using fsQCA. Technol. Forecast. Soc. Change 2023, 194, 122733. [Google Scholar] [CrossRef] [Scilit]
  43. Zuo, C.; Zhang, X.; Zhang, Q.; Jin, Y. Exploring Continuance Usage Behavior of Autonomous Ride-Hailing Vehicles: An Integrated SEM and fsQCA Approach from Wuhan, China. Sustainability 2025, 17, 10040. [Google Scholar] [CrossRef] [Scilit]
Figure 1. Time series characteristic diagram of green total factor productivity in the electric power industry.
Sustainability 18 03377 g001
Figure 2. Spatiotemporal distribution characteristics of green total factor productivity in the electric power industry. Note: This map is produced based on the standard map with the approval number GS (2024) 0650 from the standard map service website of the National Administration of Surveying, Mapping and Geoinformation. The base map has not been modified.
Sustainability 18 03377 g002
Figure 3. Kernel density plot of green total factor productivity in the national electric power industry.
Sustainability 18 03377 g003
Figure 4. Kernel density plot of green total factor productivity in the power industry by region.
Sustainability 18 03377 g004
Figure 5. Standard deviation ellipse and centroid shift of green total factor productivity in the electric power industry. Note: This map is produced based on the standard map with the approval number GS (2024) 0650 from the standard map service website of the National Administration of Surveying, Mapping and Geoinformation. The base map has not been modified.
Sustainability 18 03377 g005
Figure 6. Gini coefficient and its decomposition results of green total factor productivity in the power industry.
Sustainability 18 03377 g006
Table 1. Measurement index system.
Indicator TypeTier 1 IndicatorsTier 2 Indicators
Input IndicatorsLabor InputNumber of employees in the power industry
Capital InputInstalled capacity
Energy InputEnergy consumption for power generation (electricity generation in the power industry × standard coal)
Output IndicatorsExpected OutputElectricity generation in the power industry
Undesired OutputCarbon dioxide emissions in the power industry
Table 2. Indicator system for conditional variables.
Causal ConditionsTier 1 IndicatorsTier 2 IndicatorsCalculation Methods
Technology FactorsDigital InfrastructureThe internet penetration rate [24]Number of Internet users/Total population
The broadband access rate [24]Number of broadband Internet users/Total population
The telephone penetration rate [24,25]Total number of telephones (including mobile phones)/Total population
The length of long-distance optical cable lines [24]Direct data
Digital TechnologiesThe number of artificial intelligence companies [26]Direct data
The number of industrial enterprises above a designated size [24]Direct data (Reflects the market foundation for technology diffusion rather than direct technology stock)
Organizational FactorsDigital Organizational InnovationGreen technological innovation [27]The number of regional green patent applications
The number of invention and utility patents [25]Direct data
Digital Organizational CapabilitiesDigital economy talent [28]Personnel engaged in computer services and software work/Urban unit staff
Telecommunications industry output [28]Per capita telecommunication business volume
Environmental FactorsGovernment Digital PoliciesGovernment digital attention [25]Total frequency of keywords related to the digital economy in the government work report
R&D intensity [26]Direct data
Digital Economy EnvironmentDigital financialization [24,25]Data from “The Peking University Digital Financial Inclusion Index of China”
Industrial structure [29]Output value of the tertiary industry/GDP
Table 3. Geographical zoning of China’s power industry.
RegionProvince
EasternBeijing, Tianjin, Hebei, Shanghai, Jiangsu, Zhejiang, Fujian, Shandong, Guangdong, Hainan
NortheasternLiaoning, Jilin, Heilongjiang
WesternInner Mongolia, Guangxi, Chongqing, Sichuan, Guizhou, Yunnan, Shaanxi, Gansu, Qinghai, Ningxia, Xinjiang, Xizang
MiddleShanxi, Anhui, Jiangxi, Henan, Hubei, Hunan
Table 4. Parameters of standard deviation ellipse.
YearCenter Point CoordinatesSemi-Major Axis (km)Semi-Minor Axis (km)Azimuth (°)Area (km2)Ellipticity
2012111°38′27.84″ E, 33°18′30.61″ N1511.131228.2466.215,830,573.090.187
2016111°45′39.66″ E, 33°17′15.06″ N1531.611235.1465.875,942,786.720.194
2020111°24′28.25″ E, 33°17′27.99″ N1556.111257.8367.726,148,765.610.192
2023111°22′17.88″ E, 33°18′26.34″ N1553.351272.5369.326,209,635.850.181
Table 5. Calibration result.
Variable ClassificationVariable NameVariableComplete AffiliationIntersectionComplete Disaffiliation
Outcome VariableGreen total factor productivity in the electric power industryGTFP0.9360.7400.611
Condition Variablesdigital infrastructureTDIC0.1680.1010.031
digital technologiesTDTA0.3110.0600.005
digital organizational innovationTDOI0.2920.0340.003
digital organizational capabilitiesTDOA0.4170.0720.021
government digital policiesTGDP0.7240.2260.099
digital economy environmentTRDF0.6900.4510.122
Table 6. Analysis results of necessary conditions.
Condition VariablesGreen Total Factor Productivity in the High-Power Industry
ConsistencyCoverage
TDIC0.7301010.703796
~TDIC0.5820700.551114
TDTA0.6668880.720033
~TDTA0.6615080.566672
TDOI0.6542040.702111
~TDOI0.6832050.588069
TDOA0.6406600.666804
~TDOA0.6851770.604877
TGDP0.6786810.694067
~TGDP0.6536690.585875
TRDF0.6749180.668824
~TRDF0.6512670.600560
Note: “~” represents “not”.
Table 7. The path to enhancing green total factor productivity in the power industry.
Green Total Factor Productivity in the High-Power Industry
S1S2S3S4S5
TDIC⬤●⬤-⬤
TDTA⬤⬤⬤●-
TDOI●-⬤●⊘
TDOA⭙⭙-⭙⭙
TGDP--⬤⬤⬤
TRDF-●-⊘⬤
Consistency0.8830.8750.8180.8880.898
Raw coverage0.3520.3550.4790.3120.286
Unique coverage0.0030.0040.1590.0550.027
Solution consistency0.807
Solution coverage0.615
Note: ⬤ indicates core conditions, and ⭙ indicates the absence of core conditions; ● indicates auxiliary conditions, and ⊘ indicates the absence of auxiliary conditions.
Table 8. Results of robustness test.
Green Total Factor Productivity in the High-Power Industry
S1S2S3S4S5
TDIC⬤●⬤-⬤
TDTA⬤⬤●⬤-
TDOI●-●●⊘
TDOA⭙⭙-⊘⊘
TGDP--⬤⬤⬤
TRDF-●⊘⭙●
Consistency0.8830.8750.9050.8880.898
Raw coverage0.3520.3550.2850.3120.286
Unique coverage0.0030.0040.0270.0550.027
Solution consistency0.847
Solution coverage0.483
Note: ⬤ indicates core conditions, and ⭙ indicates the absence of core conditions; ● indicates auxiliary conditions, and ⊘ indicates the absence of auxiliary conditions.
Disclaimer/Publisher’s Note: The statements, opinions and data contained in all publications are solely those of the individual author(s) and contributor(s) and not of MDPI and/or the editor(s). MDPI and/or the editor(s) disclaim responsibility for any injury to people or property resulting from any ideas, methods, instructions or products referred to in the content.