Article

Research on Collaborative Emission Reduction Between Ports and Shipping Companies in the Context of New Energy


1
School of Maritime Economics and Management, Dalian Maritime University, Dalian 116026, China
2
Faculty of Logistics, University of Maribor, 3000 Celje, Slovenia
3
Faculty of Maritime and Transportation, Ningbo University, Ningbo 315211, China
*
Author to whom correspondence should be addressed.
Sustainability 2026, 18(7), 3345; https://doi.org/10.3390/su18073345
Submission received: 10 February 2026 / Revised: 18 March 2026 / Accepted: 27 March 2026 / Published: 30 March 2026

Abstract

Collaborative decarbonization between ports and shipping companies is critical to the low-carbon transition of maritime supply chains. Driven by the new energy transition, vertical technology spillovers have become a key force shaping vertical collaborative emission reduction. However, the mechanisms through which spillovers affect strategic interactions remain unclear, the theoretical basis for emission reduction strategies is insufficient, and practical issues such as benefit sharing and coordination mechanisms are underexplored. To fill these gaps, this study makes three contributions. Theoretically, we incorporate vertical technology spillovers and joint benefit–cost sharing into the port–shipping collaborative emission reduction framework, enriching supply-chain-level spillover theory. Methodologically, we combine an evolutionary game model with a scale-free network to simulate strategy diffusion and conduct scenario comparisons, linking theoretical modeling with industrial practice. Empirically, we confirm that ports act as leaders in collaborative decarbonization, and port-centered resource allocation drives the systemic low-carbon transition of the maritime sector. The findings show that the share of agents adopting active emission reduction strategies first rises and then falls with vertical technology spillover intensity, peaking at a moderate level. The impacts of core factors vary significantly across spillover scenarios. Port-centered resource allocation and benefit distribution are crucial to improving overall participation willingness. Ports are not merely participants but irreplaceable coordinators in the maritime supply chain. These results provide targeted policy and practical guidance for ports and shipping companies to promote global green and low-carbon maritime development.

1. Introduction

The International Maritime Organization (IMO) has proposed that the global shipping industry strive to achieve net zero emissions before and after 2050 and to set phased indicators [1]. China has also proposed to reach its peak of carbon dioxide emissions before 2030 and to strive for the dual carbon goal of carbon neutrality before 2060 [2]. However, due to the impact of events such as COVID-19 and the Red Sea crisis in recent years, shipping emission reduction has been hindered [3,4], and the overall target has fallen 12% behind IMO [5].
The traditional strategies for reducing emissions in shipping rely mainly on optimizing speed and upgrading fuel. However, many studies have found that the reduction capacity of these strategies has reached a bottleneck. For instance, Van et al. [6] have pointed out that, under the increasing pressure of carbon emission regulations, it is only by optimizing speed that one can achieve limited emission reduction effects, by approximately 10% to 15%. Inal et al. [7] have also indicated that, although advanced conventional fossil fuels (e.g., upgraded distillate oil) can reduce sulfur oxide emissions when compared with low-sulfur fuel oil, their potential for greenhouse gas (GHG) emission reduction is still limited, and their related costs are more than 30% higher than those of conventional fuels. In contrast, emerging alternative fuels (e.g., hydrogen, ammonia, and methanol, etc.) have low-carbon or nearly zero-carbon characteristics. Their combustion-generated carbon dioxide emissions are almost negligible and will become a highly promising and scalable solution for the deep decarbonization of the shipping industry [8,9].
Reduction of shipping emissions cannot be accomplished by any singular body independently; it fundamentally necessitates tight coordination between ports and shipping corporations, a notion referred to as “port–shipping collaborative emissions reduction.” The widespread adoption of new energy fuels is heavily contingent upon effective operational integration at the port–shipping nexus [10]. Shipping firms are increasingly incorporating new energy fuels as principal propulsion mechanisms or essential components of dual-fuel configurations, tailored to diverse vessel categories, including container ships and oil tankers, thereby enabling reductions in life-cycle emissions [11,12,13,14]. To support this shift, ports must proactively upgrade handling equipment with new energy powertrains, establish clean energy supply systems for on-port transport vehicles, and fully implement shore power infrastructure alongside new energy fuel bunkering facilities. These enhancements provide essential, unified support for both emissions mitigation at the port and new energy replenishment aboard the vessel [15,16,17].
In 2024, the ports of Los Angeles and Long Beach, alongside Maersk and CMA CGM, began collaborating on green shipping corridors. To meet emissions reduction goals specific to each route, ports and shipping companies advanced clean fuel bunkering infrastructure and low-carbon operational practices [18]. That same year, the Port of Singapore and X-Press Feeders ran a trial program, demonstrating the safe and efficient bunkering of methanol and handling of cargo. The port revamped its methanol bunkering infrastructure—storage, transfer, and safety protocols—while partner shipping companies brought in methanol-capable dual-fuel vessels to support the initiative. This joint initiative aims to help the region adapt to low-carbon maritime transport [19]. In 2024, Royal Caribbean Group and Carnival Corporation partnered with the Port of Vancouver Fraser to establish passenger shipping decarbonization corridors. The port concentrated on enhancing shore power infrastructure at cruise terminals and constructing dedicated methanol bunkering facilities. Participating cruise lines designed and ordered methanol-ready vessels for low-carbon trans-Pacific and intercontinental operations [20]. Duqm Port in Oman and ECOLOG signed a collaborative development agreement in April 2025 to create a liquid hydrogen shipping corridor between the Middle East and the Netherlands and Germany. This agreement requires the port to build integrated green hydrogen liquefaction, storage, and export infrastructure, while partner shipping companies will commission safe, efficient, and scalable liquid hydrogen carriers [21].
Compared with conventional energy technologies, emerging energy technologies exhibit three distinguishing features: a broad application scope, substantial greenhouse gas emission reduction potential, and rapid innovation and iteration cycles [22,23]. Currently, the shipping industry worldwide shows different and uneven levels of commitment to, and implementation of, emission reduction efforts. As new energy sources are adopted, these emission reduction initiatives have created real challenges for collaboration between ports and ships. These challenges include unclear ways to measure benefits and a lack of formal coordination [24]. Therefore, it is imperative to investigate port–ship collaborative emission reduction strategies grounded in vertical technology spillovers under the new energy paradigm.
Against this backdrop, three interrelated questions emerge: First, how do ports and shipping companies negotiate the sharing of risks and benefits in their collaborative efforts to achieve emissions reductions enabled by new energy technologies? Second, as a pivotal coordination mechanism, how do changes in the magnitude, direction, and transmission pathways of vertical technology spillovers—driven by new energy technologies—reconfigure governance structures, incentive mechanisms, and performance outcomes in port–shipping decarbonization collaborations? Third, how do external regulatory instruments—such as carbon trading markets and targeted government interventions—influence the strategic behavior of port and shipping actors, and thereby shape the overall effectiveness of their collaborative emissions reduction initiatives?
We consider the cost sharing of new energy facilities’ R&D and the sharing of collaborative emission reduction benefits in constructing the evolutionary game model, analyze the strategic stability of ports and shipping companies in collaborative emission reduction, discuss the influence of different degrees of vertical technology spillovers on the port–shipping cooperative emission reduction strategy while accounting for the transfer effect of vertical technology spillovers in the port–shipping network, and distinguish different spillover scenarios to simulate the impacts of factors such as carbon trading price and government subsidies on the port–shipping cooperative emission reduction strategy.
The remainder of this paper is organized as follows. Section 2 reviews the relevant literature. Section 3 constructs and analyzes an evolutionary game model of port–shipping collaborative emission reduction in the context of new energy. Section 4 implements a complex network-based evolutionary simulation to examine the dynamics of collaborative emission reduction in port–shipping systems in the context of new energy. Section 5 concludes the paper by summarizing key findings and outlining directions for future research.

2. Literature Review

This section presents a literature review structured along two thematic dimensions: (i) the current state of research on collaborative emission reduction of ports and shipping companies, and (ii) the current state of research on technology spillovers induced by new energy technologies.

2.1. Research Status of Collaborative Emission Reduction of Ports and Shipping Companies

As an important branch of supply chain environmental governance and operations research optimization, port–shipping collaborative emission reduction aligns with research on logistics network collaborative environmental performance and operational efficiency—all centering on multi-agent interest balance, policy intervention effects, and system optimization. In the broader supply chain and operations research field, mature game frameworks and methodologies have been developed: Liu et al. [25] proposed a supplier–manufacturer game model for green supply chain collaborative emission reduction, exploring external factors (e.g., government subsidies, penalties) and internal factors (e.g., collaborative benefits, “free-rider” behavior), and confirming that system evolutionary stability depends on the benefit–cost dynamic balance; Jo et al. [26] integrated machine learning prediction, multi-criteria decision-making, and multi-objective optimization to coordinate cost efficiency, supplier quality, and carbon reduction in steam procurement, providing an implementable approach for multi-objective decision-making. These studies lay a theoretical and methodological foundation for port–shipping research, which focuses on port–shipping interaction scenarios and mainly adopts game theory as the core analytical framework and is divided into two specific parts: (1) research on investment decisions based on Stackelberg game theory, and (2) research on the evolutionary mechanism of emission reduction strategies based on evolutionary game theory.

2.1.1. Research on Investment Decisions Based on Stackelberg Game Theory

A substantial number of scholars have applied Stackelberg game theory to model optimal investment decisions in port–shipping collaborative emission reduction, with particular attention to power structures, energy investment choices, and emission reduction policy design.
For instance, Xue et al. [27] pioneered the integration of mental accounting theory into this framework—modeling shipping companies as leaders and ports as followers—thereby overcoming a key limitation of conventional game-theoretic models: their neglect of decision-makers’ psychological preferences. Their finding that carbon asset accounts exert greater influence on investment decisions than operational accounts provide a microfoundational basis for understanding firms’ low-carbon behavior. Building on this work, Yang et al. [28] further relaxed the assumption of fixed power structures and compared leader–follower dynamics across different power distributions. They drew the conclusion that the Nash game outperforms the dominant Stackelberg game in terms of dual benefits (economic and emission reduction). This finding reveals the drawbacks of one-sided power dominance and thus supplements the static power setting proposed by Xue et al. [27]. However, both studies focus on binary energy choices (traditional fuel vs. shore power/low-sulfur fuel) and overlook inter-chain competition. To address this limitation, Takebayashi et al. [29] developed a multi-agent model. This model included two ports and two shipping companies. They found that the costs of reducing emissions at the port level significantly limited the effectiveness of carbon taxes. However, their analysis of the “prisoner’s dilemma” arising from vertical integration under high competition overlooks the potential role of information collaboration. Subsequently, Meng L. et al. [30] addressed this issue by including information-sharing methods in a three-stage Stackelberg game. Their research showed that strategically investing in information-sharing ports allows for the simultaneous achievement of both emission reduction and profit maximization. This contribution not only extends Xue et al.’s [27] decision-making framework to incorporate inter-organizational collaboration as a key strategic factor but also complements Takebayashi et al.’s [29] cost-constraint perspective.

2.1.2. Research on the Evolutionary Mechanism of Emission Reduction Strategies Based on Evolutionary Game Theory

Other scholars have used evolutionary game theory to examine the evolutionary processes and key factors that shape collaborative emission reduction strategies in port shipping. This approach is better suited than the Stackelberg game framework for analyzing the long-term, dynamic adaptation of boundedly rational agents; however, its application in port–shipping research remains underdeveloped and warrants further refinement.
Liu et al. [31] created an evolutionary game model with two players, representing ports and shipping companies. This model used the adoption of low-sulfur fuel oil (LSFO) and shore power as the strategic choices. Their research provides a valuable contribution by showing that carbon trading prices and the way that shippers respond significantly influence how much emissions are reduced. However, their assumption that “long-term low-carbon investment is independent of government-allocated emission quotas” may lack practical validity: quota allocation directly shapes firms’ short-term cost burdens, thereby affecting their willingness to commit to long-term decarbonization investments. Ye et al. [1] addressed this limitation by explicitly incorporating key government decision variables—including supervision cost, subsidy intensity, and penalty intensity—and demonstrated that integrated, cooperative policy frameworks consistently outperform isolated economic instruments (e.g., carbon pricing alone). Their inclusion of IMO supervision further enriches the policy dimension, though the model simplifies government behavior as “passive response” rather than “active dynamic adjustment.” Meng L. et al. [32] have advanced the field by expanding to a tripartite game (government + ports + shipping companies) and new energy fuels (methanol, hydrogen, ammonia), identifying “active supervision + active emission reduction” as the evolutionarily stable strategy. Nevertheless, their assumption that “ports/shipping companies independently bear transformation costs” deviates from reality—new energy infrastructure investment requires collaborative cost-sharing mechanisms. In contrast, Gao Y. and Gao J. [33] focused on value co-creation theory, highlighting the importance of initial cooperation probability and high carbon tax/subsidy rates. It is verified that, when the initial probability of both parties participating in value co-creation is close to 1, and a high carbon subsidy rate and carbon tax rate of 15% are implemented, the development process of green ports is the fastest.

2.2. Research Status of Technology Spillovers Induced by New Energy Technologies

Research on technology spillovers induced by new energy technologies can be broadly categorized into two strands: (1) research on technology spillovers in the port and shipping sector induced by new energy technologies, and (2) research on technology spillovers in other sectors induced by new energy technologies.

2.2.1. Research on Technology Spillovers in the Port and Shipping Sector Induced by New Energy Technologies

Technology spillovers represent a critical yet underexplored issue in the port and shipping sector, particularly amid the ongoing energy transition. Existing studies mainly focus on horizontal spillover mechanisms and gradually extend from firm-level interactions to supply chain and network perspectives.
Building on the analysis of firm-level interactions, Ye et al. [34] investigated horizontal spillover effects between green and conventional shipping companies. They developed an evolutionary game model based on the Watts–Strogatz small-world network framework, and proposed context-sensitive strategies to promote low-carbon shipping across different scenarios. Extending this line of inquiry from firms to port entities, Liu et al. [35] incorporated port heterogeneity into their analysis. Using game-theoretic methods, they explored how technologically advanced ports generate horizontal spillovers for traditional ports under the new energy paradigm, and further examined how these spillovers affect operational costs and benefit distribution between ports and shipping companies. On this basis, research has further expanded to the supply chain level**, where Wang W. [36] introduced inter-chain competition within port–shipping supply chains. They studied cooperative decision-making among these chains and explicitly modeled horizontal technology spillovers between ports as a key driving factor.
While the above studies primarily rely on theoretical and simulation-based approaches, recent research has begun to provide empirical evidence from technological collaboration networks and patent data, thereby enriching the understanding of spillover pathways. Yin et al. [37] conducted a global patent analysis to examine technological collaboration networks for green shipping technologies (GSTs) and confirmed that technology spillovers mainly occur within closely connected enterprise groups, while cross-block and cross-regional spillovers remain weak. They pointed out that insufficient industry–university–research cooperation and low network density restrict the wide diffusion of green technologies in maritime decarbonization. Consistent with this network-based perspective, Meng Q. et al. [38] verified that marine technological innovation has significant spatial spillover effects, and that new quality productivity can promote high-quality marine economic development through cross-regional knowledge diffusion and technology externalities. Overall, these studies collectively suggest that technology spillovers in the shipping sector evolve from localized horizontal interactions to broader network-based diffusion processes, and that strengthening collaborative networks is key to amplifying spillover effects.

2.2.2. Research on Technology Spillovers in Other Sectors Induced by New Energy Technologies

Compared with the shipping sector, research in other sectors—particularly the automotive and blockchain sectors—has developed a more mature analytical framework, with a stronger emphasis on complex networks, cross-sector interactions, and policy effects.
Focusing on intra-industry interactions within the new energy vehicle (NEV) sector, Sun and Zhang [39] examined inter-firm technology spillovers between power battery manufacturers and vehicle manufacturers. They developed a complex network model and identified the core determinants of such spillovers, including the degree of industrial chain collaboration and the proportion of R&D investment. Further extending the scope to competition between emerging and traditional technologies, Wang L. et al. [40] analyzed technology spillovers from NEV manufacturers to conventional fuel vehicle manufacturers. By constructing an NEV diffusion model based on evolutionary game theory within a complex network framework, they found that consumer group size and preference heterogeneity can generate reverse feedback effects, thereby driving technological innovation among manufacturers. Chen et al. [41] incorporated technology spillover effects into a complex network evolutionary game model for the NEV industry and found that reducing excessive spillovers can enhance firms’ incentives for independent R&D.
Beyond the automotive sector, similar spillover mechanisms have also been identified in digital technology contexts, such as blockchain. Li et al. [42] focused on blockchain technology spillovers within enterprise clusters. Using an evolutionary game model based on the BA scale-free network, they found that government subsidies, consumer demand for product traceability, and willingness to pay premium prices significantly promote the diffusion of blockchain technology. Moreover, recent studies have highlighted that technology spillovers are not limited to within-industry interactions but also occur across sectors, playing a decisive role in large-scale technology diffusion. From a broader cross-industry perspective, Dugoua and Dumas [43] have pointed out that the rapid popularization of battery electric vehicles (BEVs) largely benefits from knowledge spillovers from the electronic information sector, rather than policy coordination alone. These findings offer valuable insights for understanding spillover mechanisms in new energy technologies.

2.3. Research Limitations and Contributions

As shown in Table 1, synthesizing the literature reviewed above, two critical research gaps emerge in the context of new energy-driven port–shipping collaboration.
Regarding collaborative emission reduction, current research primarily concentrates on established energy alternatives, such as low-sulfur fuel and shore power, within the maritime supply chain. Meng L. et al. [32] are the exception, broadening the analysis to encompass novel energy sources like methanol, hydrogen, and ammonia; however, their model presupposes that either ports or shipping companies will unilaterally absorb the associated costs. Simultaneously, investigations into vertical cooperation continue to emphasize conventional energy contexts, overlooking collaborative governance structures, such as benefit-sharing arrangements, which are critical for the long-term viability of joint investments in new energy infrastructure. This leaves a clear gap in the academic understanding of how port and shipping stakeholders can effectively allocate benefits, bear risks, and accelerate the adoption of zero-carbon fuels.
Turning to technology spillovers, current research in the port–shipping sector is limited to horizontal spillovers between homogeneous entities (e.g., green vs. conventional shipping companies, innovative vs. traditional ports) [34,35,36], with no integration of vertical spillover channels driven by the expansion of new energy upstream and downstream industrial chains (e.g., technology transfer from new energy shipyards to shipping companies, standard spillover from ports to fuel suppliers). Wang L. et al. [40] examines vertical spillovers in the automotive industry; however, their findings are not directly transferable to the maritime sector due to substantial differences in operational structures and infrastructural characteristics. Consequently, this constraint hinders a comprehensive understanding of the emission reduction processes arising from spillovers within the maritime supply chain.
This research makes three important contributions to address the existing gaps. First, it improves the collaborative emission reduction framework by explicitly modeling how ports and shipping companies share the costs of joint research and development, and how they fairly distribute the benefits. This is done within the context of new energy scenarios, thus filling a significant gap in the existing research on collaborative governance in the maritime sector’s new energy initiatives. Second, it innovatively incorporates vertical technology spillovers into port–shipping emission reduction analysis, moving beyond the field’s current exclusive focus on horizontal spillovers and thereby enriching the theoretical understanding of multi-dimensional spillover effects in the maritime industry. Third, it integrates an evolutionary game model with a Barabási–Albert scale-free complex network to simulate strategy diffusion among heterogeneous agents; conducts comparative analyses of key parameters—including the benefit distribution ratio and carbon trading price—under varying spillover intensity scenarios; and delivers a more nuanced, policy-relevant decision-support framework that effectively bridges the gap between theoretical modeling and practical implementation in new energy-driven port–shipping collaboration.

3. Construction and Analysis of an Evolutionary Game Model of Port–Shipping Collaborative Emission Reduction in the Context of New Energy

Port–shipping collaborative emission reduction in the context of new energy deployment hinges on mutually reinforcing institutional and operational linkages between ports and shipping companies. Moreover, advances in new energy technologies generate substantial vertical technology spillovers across the maritime logistics chain. This section develops an evolutionary game-theoretic model to analyze port–shipping collaboration for emission reduction under new energy transitions, followed by a rigorous analysis of strategy stability and the conditions required for equilibrium stability.

3.1. Model Assumptions and Parameter Definitions

This section models ports and shipping companies—key stakeholders in the port and shipping supply chain—as the primary players in an evolutionary game, with “active emission reduction” and “passive emission reduction” as their two strategic choices. The model explicitly incorporates critical factors such as vertical technology spillover and inter-firm revenue sharing, and examines how these factors influence the strategic choice of emission reduction behavior by port and shipping enterprises. The following assumptions are made:
Assumption 1. 
Both ports and shipping companies exhibit bounded rationality. For shipping companies, the probability of adopting active emission reduction—defined as proactively collaborating with ports on novel energy-related emission reduction strategies—is denoted by x ( x [ 0 , 1 ] ) , while the probability of adopting passive emission reduction is denoted by 1 x . Similarly, for ports, the probability of adopting active emission reduction strategies is y ( y [ 0 , 1 ] ) , and the probability of adopting passive emission reduction is 1 y .
Assumption 2. 
If both the port and the shipping company actively collaborate on emission reduction, the resulting benefit is R ; if either party chooses passive emission reduction, the specified carbon emission reduction target cannot be achieved, and the benefit obtained is R ( R > R ). Additionally, assume the benefit distribution coefficient of a shipping company from collaborative emission reduction is ω : the shipping company’s benefit from collaboration is ω R or ω R , and the port’s benefit is ( 1 ω ) R  or ( 1 ω ) R .
Assumption 3. 
When shipping companies and ports jointly pursue active emission reduction, they must share the collaborative R&D costs associated with constructing new energy infrastructure. According to the relevant literature [44,45], the total R&D investment cost is a quadratic function of the carbon emission reduction level achieved through port–shipping cooperation. Under this framework, the shipping company’s share of the investment cost is ρ m e d 2 2  (where  ρ  denotes the proportion of the total R&D cost borne by the shipping company), and the port’s share is ( 1 ρ ) m e d 2 2 .
Assumption 4. 
When both shipping companies and ports adopt active emission reduction strategies, they can jointly benefit from vertical technology spillovers arising from their collaboration. The magnitude of this vertical spillover benefit depends on two key factors: (i) the overall collaborative emission reduction benefit, and (ii) each party’s capacity to internalize and leverage the resulting spillover gains. Specifically, the shipping company’s vertical technology spillover benefit—originating from the port—is denoted by ε 1 δ e d R , while the port’s vertical technology spillover benefit—originating from the shipping company—is denoted by ε 2 δ e p R . Here, ε 1  and  ε 2  represent the respective profit-increment coefficients associated with vertical technology spillovers, contingent upon the shipping company and the port independently choosing active emission reduction.
Assumption 5. 
Under the cap-and-trade program [28], the government sets a carbon emission quota  K  for ports. Ports and shipping company generate carbon emissions  q e m  when providing services to customers, and ports gain or lose funds p c ( K q e m )  based on the regional emission and quota situation (where  p c  is the carbon trading unit price,  q  is the market scale, and  e m  is the unit carbon emission within the port area). When both shipping company and ports choose active emission reduction strategies, their synergy improves the overall carbon reduction level  e d  of the port–shipping supply chain. Referring to relevant literature [46], the funds gained or lost by ports in the carbon trading market become  p c ( K q e m + e d ) . When either the shipping company or the port chooses passive emission reduction, the synergy effect disappears, and  e d = 0 .
Assumption 6. 
When port and shipping companies adopt a passive emission reduction strategy, capital and resources originally earmarked for investment in emerging clean-energy infrastructure—such as hydrogen and ammonia production and utilization systems—are instead redirected toward conventional low-carbon facilities, notably grid-connected wind power generation. This reallocation ultimately yields additional profits: O s  for shipping companies and O p  for ports.
Assumption 7. 
The government will provide incentive subsidies—denoted by  S s  for shipping companies and  S p  for ports—to those adopting active emission reduction strategies, thereby encouraging coordinated, proactive decarbonization across the port–shipping system. Conversely, the government will impose penalty costs—denoted by  F s  for shipping companies and  F p  for ports—on entities that adopt only passive emission reduction strategies.
Based on the underlying model assumptions, the parameters of the evolutionary game model are specified in Table 2.

3.2. Construction of the Evolutionary Game Payoff Matrix

Based on the underlying model assumptions and parameter specifications, we construct the evolutionary game payoff matrix for collaborative emission reduction between ports and shipping companies, as presented in Table 3.

3.3. Stability Analysis of Port and Shipping Strategies

Based on the payoff matrix in Table 3, we conduct a strategic stability analysis of ports and shipping companies.

3.3.1. Strategy Stability Analysis of Shipping Company

To analyze the strategy stability of a shipping company, first, their expected payoffs need to be determined. The expected payoffs E x (for active emission reduction) and E 1 x (for passive emission reduction) of the shipping company, as well as their average expected payoff E ¯ s , are defined as follows:
E x = y [ ω R ρ m e d 2 2 + S s + ε 1 δ e d R ] + ( 1 y ) [ ω R ρ m e d 2 2 ]
E 1 x = y [ ω R F s + O s ] + ( 1 y ) [ ω R F s + O s ]
E ¯ s = x E x + ( 1 x ) E 1 x
Based on the expected payoffs of the shipping company under various scenarios, the replicator dynamic equation for the strategy selection of shipping company is constructed as follows:
F ( x ) = d x d t = x ( E x E ¯ s ) = x ( 1 x ) ( E x E 1 x ) = x ( 1 x ) [ F s ρ m e d 2 2 O s + y ( ω ( R R ) + S s + ε 1 δ e d R ) ]
According to the stability criterion theorem of differential equations, the strategy of the shipping company reaches a stable state when two conditions are satisfied: F ( x ) = d x d t = 0 and d F ( x ) d x < 0 . The discussion is as follows: Let F ( x ) = d x d t = 0 , and two solutions x = 0 and x = 1 can be obtained, meaning that the equilibrium strategies of the shipping company are “active emission reduction” and “passive emission reduction”.
By differentiating the replicator dynamic equation of shipping company’s strategy selection, we get the following:
d F ( x ) d x = ( 1 2 x ) [ F s ρ m e d 2 2 O s + y ( ω ( R R ) + S s + ε 1 δ e d R ) ]
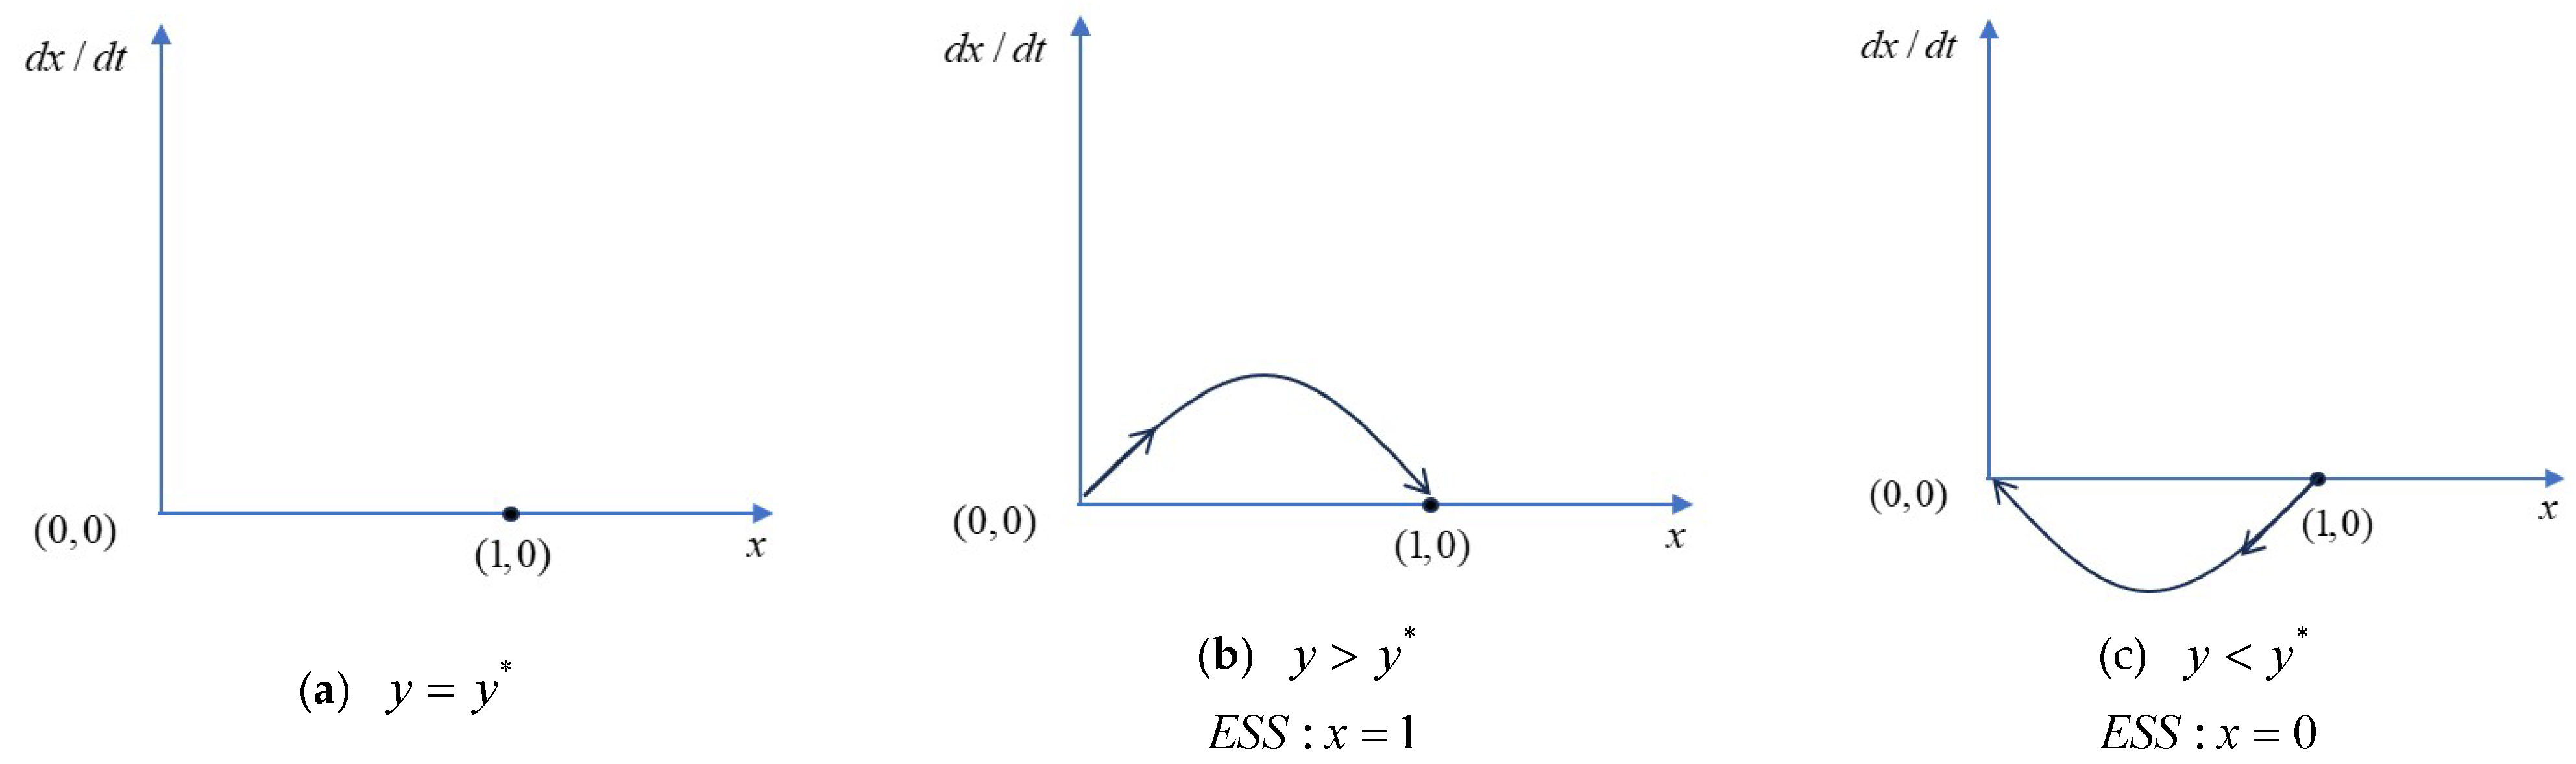
Let φ ( y ) = [ F s ρ m e d 2 2 O s + y ( ω ( R R ) + S s + ε 1 δ e d R ) ] , when φ ( y ) = 0 , we have the following: y = y * = ρ m e d 2 2 F s + O s ε 1 δ e d R + S s + ω ( R R ) . As ε 1 δ e d R > 0 , S s > 0 and ω ( R R ) > 0 form an increasing function. Based on the given conditions, the strategy evolution phase diagram of shipping company is plotted as shown in Figure 1. The following discusses various scenarios of φ ( y ) :
  • When φ ( y ) = 0  ( y = y * ). At this point, F ( x ) = 0 and d F ( x ) d x = 0 . The strategy selection of the shipping company does not change over time, and the stable strategy of the shipping company cannot be determined, as shown in Figure 1a.
  • When φ ( y ) > 0  ( y > y * ). The conditions d F ( x ) d x x = 1 < 0 and d F ( x ) d x x = 0 > 0 are satisfied. At this point, x = 1 is the evolution stable strategy (ESS) of the shipping company, meaning shipping company will choose active emission reduction, as shown in Figure 1b.
  • When φ ( y ) < 0  ( y < y * ). The conditions d F ( x ) d x x = 1 > 0 and d F ( x ) d x x = 0 < 0 are satisfied. At this point, x = 0 is the evolution stable strategy (ESS) of the shipping company, meaning that the shipping company will choose passive emission reduction, as shown in Figure 1c.

3.3.2. Strategy Stability Analysis of Port

To analyze the strategy stability of the port, their expected payoffs first need to be determined: the expected payoffs E y (for active emission reduction) and E 1 y (for passive emission reduction) of the port, as well as their average expected payoff E ¯ p , are defined as follows:
E y = x [ ( 1 ω ) R ( 1 ρ ) m e d 2 2 + S p + p c ( K q e m + e p + e s ) + ε 2 δ e d R ] + ( 1 x ) [ ( 1 ω ) R ( 1 ρ ) m e d 2 2 + p c ( K q e m ) ]
E 1 y = x [ ( 1 ω ) R F p + p c ( K q e m ) + O p ] + ( 1 x ) [ ( 1 ω ) R F p + p c ( K q e m ) + O p ]
E ¯ p = y E y + ( 1 y ) E 1 y
Based on the expected payoffs of the port under various scenarios, the replicator dynamic equation for the strategy selection of the port is constructed as follows:
H ( y ) = d y d t = y ( E y E ¯ p ) = y ( 1 y ) ( E y E 1 y ) = y ( 1 y ) [ x ( ε 2 δ e d R + p c e d + S p + ( 1 ω ) ( R R ) ) ( 1 ρ ) m e d 2 2 + F p O p ]
According to the stability criterion theorem of differential equations, the strategy of the port reaches a stable state when two conditions are satisfied: H ( y ) = d y d t = 0 and d H ( y ) d y < 0 . The discussion is as follows: Let H ( y ) = d y d t = 0 so that two solutions, y = 0 and y = 1 , can be obtained, meaning that the equilibrium strategies of the port are “active emission reduction” and “passive emission reduction”.
By differentiating the replicator dynamic equation of port’s strategy selection, we get the following:
d H ( y ) d y = ( 1 2 y ) [ x ( ε 2 δ e d R + p c e d + S p + ( 1 ω ) ( R R ) ) ( 1 ρ ) m e d 2 2 + F p O p ]
Let μ ( x ) = [ x ( ε 2 δ e d R + p c e d + S p + ( 1 ω ) ( R R ) ) ( 1 ρ ) m e d 2 2 + F p O p ] , when  μ ( x ) = 0 , we have the following:
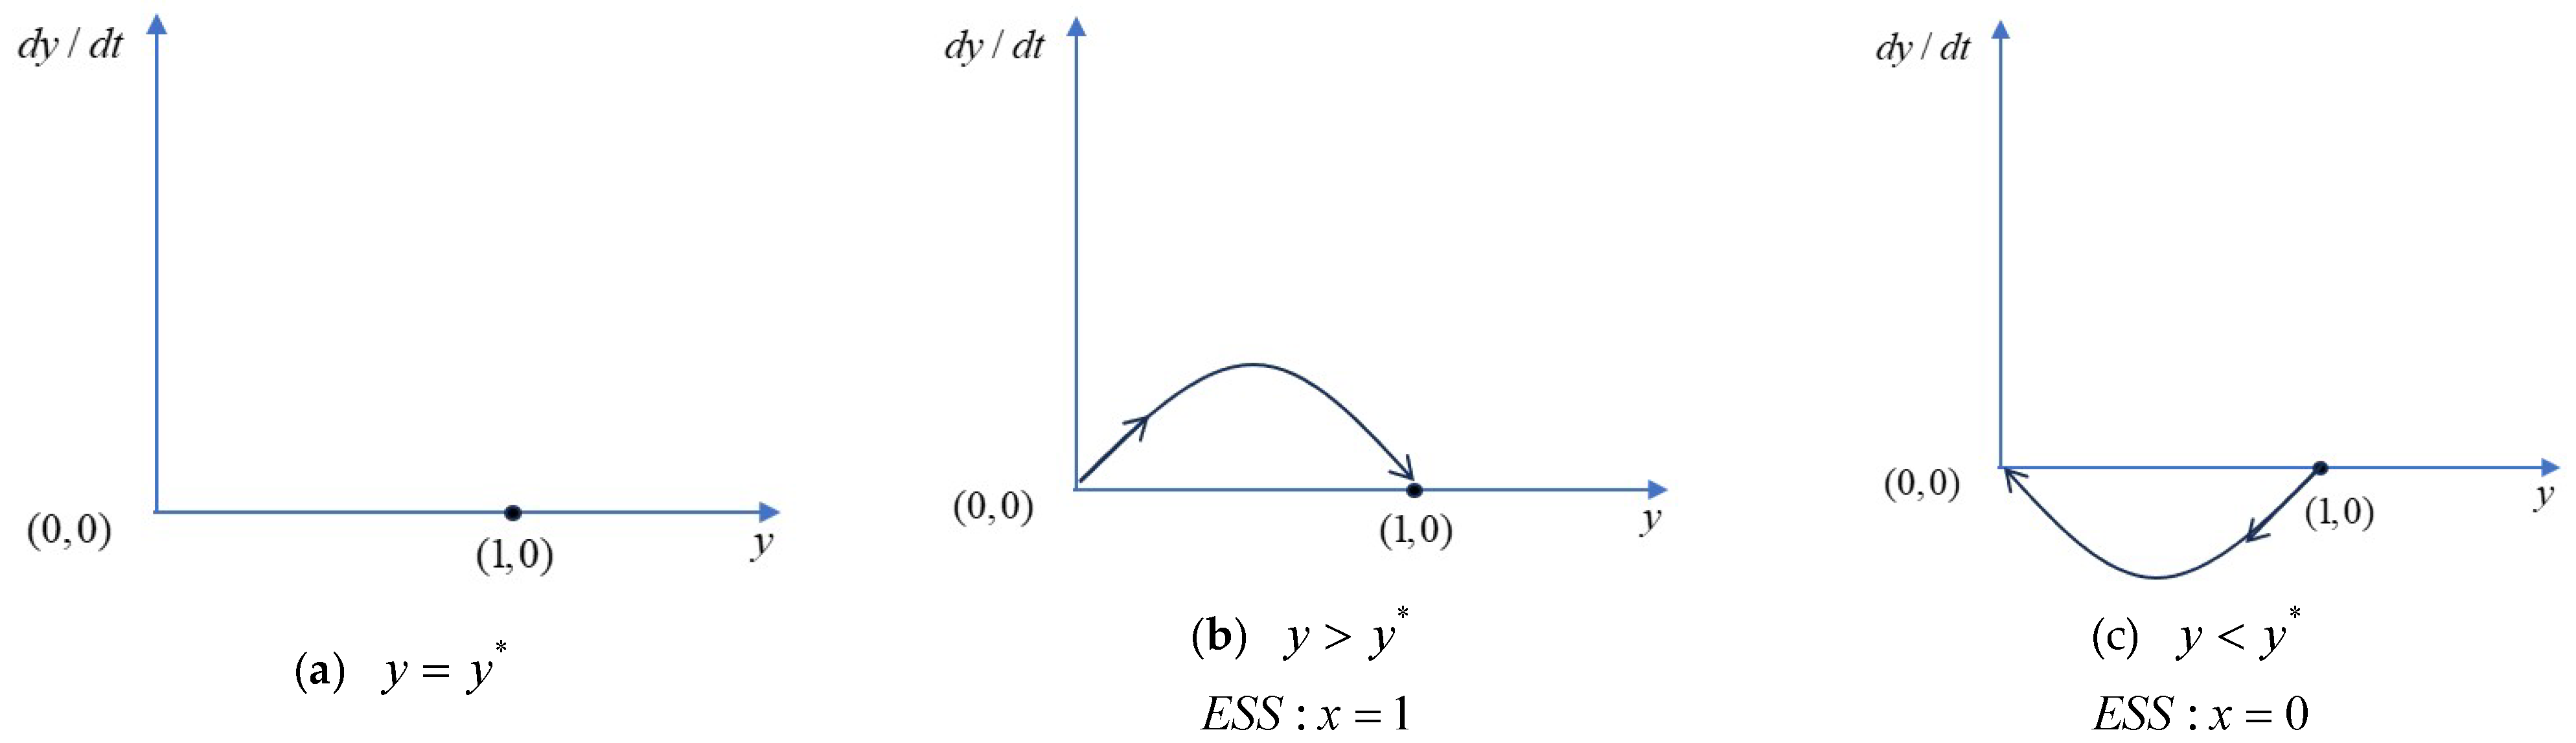
x = x * = ( 1 ρ ) m e d 2 2 F p + O p ε 2 δ e d R + p c e d + S p + ( 1 ω ) ( R R ) . As ε δ e d R p > 0 , p c e d > 0 , S p > 0 and  ( 1 ω ) ( R R ) > 0 form an increasing function. Based on the given conditions, the strategy evolution phase diagram of the port is plotted as shown in Figure 2. The following discusses various scenarios of μ ( x ) :
  • When μ ( x ) = 0  ( x = x * ). At this point, H ( y ) = 0 and d H ( y ) d y = 0 . The strategy selection of the port does not change over time, and the stable strategy of the port cannot be determined, as shown in Figure 2a.
  • When μ ( x ) > 0  ( x > x * ). The conditions d H ( y ) d y x = 1 < 0 and d H ( y ) d y x = 0 > 0 are satisfied. At this point, y = 1 is the evolution stable strategy (ESS) of the port, meaning that the port will choose active emission reduction, as shown in Figure 2b.
  • When μ ( x ) < 0  ( x < x * ). The conditions d H ( y ) d y x = 1 > 0 and d H ( y ) d y x = 0 < 0 are satisfied. At this point, y = 0 is the evolution stable strategy (ESS) of port, meaning the port will choose passive emission reduction, as shown in Figure 2c.

3.4. Stability Analysis of Equilibrium Points

By solving the system of replicator dynamic equations for the shipping company and the port, namely F ( x ) = 0 H ( y ) = 0 , the evolutionary equilibrium points of the system are identified as E 1 ( 0 , 0 ) , E 2 ( 0 , 1 ) , E 3 ( 1 , 0 ) , E 4 ( 1 , 1 ) , and E 5 ( x * , y * ) . As E 5 corresponds to a mixed-strategy equilibrium, it fails to satisfy the necessary conditions for an evolutionarily stable strategy (ESS) in an asymmetric evolutionary game; consequently, its stability is not examined.
By computing the partial derivatives of the replicator dynamic equations for the port–shipping collaborative emission reduction evolutionary game system, the corresponding Jacobian matrix is obtained as follows:
J ( x , y ) = ( 1 2 x ) [ y ( ε 1 δ e d R + S s + ω ( R R ) ) + F s ρ m e d 2 2 O s ] x ( 1 x ) [ ε 1 δ e d R + S s + ω ( R R ) ] y ( 1 y ) [ ε 2 δ e d R + p c e d + S p + ( 1 ω ) ( R R ) ] ( 1 2 y ) [ x ( ε 2 δ e d R + p c e d + S p + ( 1 ω ) ( R R ) ) + F p ( 1 ρ ) m e d 2 2 O p ]
Based on Friedman’s theory [47], Table 4 lists the determinant D e t ( J ) and trace T r ( J ) associated with each of the four equilibrium points.
As the signs of D e t ( J ) and T r ( J ) at each equilibrium point depend jointly on multiple model parameters, the stability of the four equilibrium points identified above is analyzed in detail under the following five scenarios:

3.4.1. Scenario One

ρ m e d 2 2 ε 1 δ e d R ω ( R R ) > F s + S s O s ( 1 ρ ) m e d 2 2 ε 2 δ e d R p c e d ( 1 ω ) ( R R ) > F p + S p O p
This scenario typically arises in a stage marked by low carbon prices, limited subsidy incentives, lax emission reduction regulations, and weak inter-industry technology spillover effects. Ports and shipping companies confront substantial upfront investments in low-carbon technology R&D and coordinated decarbonization initiatives; however, the resulting benefits—including technology spillovers, joint operational efficiencies, and carbon trading revenues—prove insufficient to offset these incremental costs. Compounded by lenient enforcement and minimal penalties for non-compliance with emission reduction targets, ports and shipping companies may even realize higher net returns by retaining conventional infrastructure and operations. Consequently, intrinsic motivation for proactive decarbonization is severely undermined. Under such conditions—whether acting independently or collaboratively—the net benefits of emission reduction fail to compensate for the associated costs for both ports and shipping companies, readily giving rise to a prisoner’s dilemma wherein “the first mover bears disproportionate costs”. Ultimately, both parties opt for passive, rather than proactive, emission reduction strategies. Through equilibrium point analysis, E 1 ( 0 , 0 ) is identified as the stable equilibrium point under this scenario, E 2 ( 0 , 1 ) and E 3 ( 1 , 0 ) are saddle points, and E 4 ( 1 , 1 ) is an unstable point.

3.4.2. Scenario Two

ρ m e d 2 2 ε 1 δ e d R ω ( R R ) > F s + S s O s F p O p > ( 1 ρ ) m e d 2 2
This scenario reflects a policy environment characterized by stringent port-side low-carbon regulations alongside relatively lax constraints on the shipping side. Ports operate under stricter local environmental protection standards and low-carbon access requirements, and face substantial penalties for noncompliance. Concurrently, the profitability of conventional, high-carbon operational models has been significantly eroded. As a result, unilateral low-carbon retrofits become economically rational for ports—even in the absence of coordinated emission reduction efforts by shipping companies. In contrast, shipping companies confront disproportionately high abatement costs that cannot be fully offset by technology spillovers, port–shipping synergies, or existing subsidy mechanisms. Moreover, the financial and regulatory costs of noncompliance remain low, and traditional operational models continue to yield robust returns. These factors collectively incentivize shipping companies to adopt a wait-and-see stance—or even engage in “free-riding” on port-led decarbonization initiatives. Under such asymmetric regulatory and economic conditions, ports are likely to pursue proactive, self-driven emission reduction strategies, whereas shipping companies tend to adhere to passive, reactive approaches. Through equilibrium point analysis, E 2 ( 0 , 1 ) is identified as the stable equilibrium point under this scenario, E 1 ( 0 , 0 ) and E 4 ( 1 , 1 ) are saddle points, and E 3 ( 1 , 0 ) is an unstable point.

3.4.3. Scenario Three

F s O s > ρ m e d 2 2 ( 1 ρ ) m e d 2 2 ε 2 δ e d R p c e d ( 1 ω ) ( R R ) > F p + S p O p
Conversely to Scenario Two, this context is characterized by a regulatory environment that imposes stringent emission reduction mandates on the maritime sector, while simultaneously offering comparatively weak policy support and enforcement mechanisms for the port industry. Shipping firms, bound by internationally mandated regulations—particularly those set forth by the International Maritime Organization (IMO)—are obligated to meet energy efficiency standards and adhere to carbon emissions limits. Non-compliance with these requirements incurs substantial consequences, including considerable financial sanctions and operational constraints. Consequently, the marginal cost of proactively implementing emission reduction measures is lower than the expected economic loss from regulatory violations. By contrast, jurisdictions hosting major ports have yet to establish robust low-carbon governance frameworks. Low-carbon retrofits necessitate substantial initial capital outlays and are characterized by extended payback durations; concurrently, the financial returns from carbon markets and the ancillary advantages stemming from technological synergies are inadequate to spur voluntary decarbonization efforts. Furthermore, the enforcement of emission reduction requirements for ports is insufficient, with few penalties imposed for non-compliance or delayed implementation. Consequently, shipping companies prioritize proactive, compliance-focused emission reductions, whereas ports demonstrate a passive, reactive stance, which stems from the absence of strong economic or regulatory incentives for immediate action. Through equilibrium point analysis, E 3 ( 1 , 0 ) is identified as the stable equilibrium point under this scenario, E 1 ( 0 , 0 ) and E 4 ( 1 , 1 ) are saddle points, and E 2 ( 0 , 1 ) is an unstable point.

3.4.4. Scenario Four

F s O s > ρ m e d 2 2 F p O p > ( 1 ρ ) m e d 2 2
This scenario embodies the ideal state aligned with the carbon neutrality objective—characterized by robust policy intensity, rigorous regulatory oversight, and a well-calibrated balance between incentives and constraints. By implementing relatively high carbon prices, stringent penalty mechanisms, and restrictions on traditional high-carbon investments, the economic viability of maintaining non-emission-reduction behaviors is substantially diminished. Consequently, the marginal cost of unilaterally adopting emission-reduction measures falls below the opportunity cost—and associated losses—of inaction. Under such conditions, ports and shipping enterprises independently opt for low-carbon transition based on their own internal cost–benefit analyses, without requiring coordination or reciprocal action from counterparties. This dynamic naturally yields a stable Nash equilibrium, wherein both ports and shipping companies proactively pursue emissions reductions—constituting the optimal pathway toward deep decarbonization of the maritime supply chain. Through equilibrium point analysis, E 4 ( 1 , 1 ) is identified as the stable equilibrium point under this scenario, E 2 ( 0 , 1 ) and E 3 ( 1 , 0 ) are saddle points, and E 1 ( 0 , 0 ) is an unstable point.

3.4.5. Scenario Five

ρ m e d 2 2 ε 1 δ e d R ω ( R R ) < F s + S s O s < ρ m e d 2 2 ( 1 ρ ) m e d 2 2 ε 2 δ e d R p c e d ( 1 ω ) ( R R ) < F p + S p O p < ( 1 ρ ) m e d 2 2
This scenario signifies a transitional phase, characterized by the deployment of moderately assertive policy tools in conjunction with an evolving market framework. Although carbon pricing schemes, subsidies, fines, and other regulatory interventions have exhibited a discernible impact, their current efficacy is insufficient to incentivize businesses to independently reduce emissions absent collaborative efforts. Passive emission reduction continues to yield modest profitability, whereas active emission reduction entails substantial cost burdens. At the same time, the benefits of technology and the collaborative efforts between ports and shipping companies are limited, which leads to a strong reliance on existing practices within the system. Collaboration between ports and shipping companies can foster a virtuous cycle of cooperation, thereby facilitating carbon emission reduction. However, without enough trust and institutional coordination, the system might remain in an inefficient state. In this state, both groups would continue to use passive strategies to reduce emissions. Consequently, stronger policy guidance—or alternatively, robust industry-level coordination mechanisms—is typically necessary to catalyze the system’s shift toward full-scale, proactive emission reduction. Through equilibrium point analysis, E 1 ( 0 , 0 ) and E 4 ( 1 , 1 ) are identified as the stable equilibrium points under this scenario, E 2 ( 0 , 1 ) and E 3 ( 1 , 0 ) are the unstable points.
Based on the above analysis of the five scenarios, it is evident that only Scenario 5 features two evolutionarily stable equilibria: (passive emission reduction, passive emission reduction) and (active emission reduction, active emission reduction). In this transitional scenario, ports and shipping companies may converge toward either equilibrium, depending on the interplay among several critical determinants. Specifically, the strategic choices of both stakeholders are closely contingent upon the technology spillover ratio between ports and shipping companies, the benefit distribution coefficient, the intensity of government subsidies, carbon trading prices, and the maturity of policy–market coordination mechanisms. Nevertheless, this section has focused primarily on a qualitative characterization of scenario-specific features and strategic tendencies, without quantifying the marginal effects of these key factors or explicitly modeling the multi-dimensional propagation of technology spillovers across the port–shipping network. These limitations—along with the dynamic evolution of strategies under varying policy intensity thresholds—will be systematically addressed in the subsequent section through rigorous quantitative modeling and empirical analysis.

4. Complex Network-Based Evolutionary Simulation of Port–Shipping Collaborative Emission Reduction in the Context of New Energy

The preceding section established an evolutionary game model to analyze port–shipping collaborative emission reduction under the new energy transition context, and identified stable strategic equilibria for ports and shipping companies across various scenarios. However, this analysis did not quantify the effects of key influencing factors, nor did it account for technology spillovers transmitted through the port–shipping network. Building upon the evolutionary game framework developed earlier, this section integrates numerical simulations with complex network theory. Specifically, we explicitly incorporate the network-mediated transmission of technology spillovers to investigate—under varying spillover intensities—how such spillovers, alongside other critical factors, shape the evolution of collaborative emission reduction strategies and influence the adoption rates of multiple heterogeneous agents within the port–shipping network.

4.1. Network Construction and Algorithm Assumptions

Wang et al. [48] have empirically demonstrated that the degree distribution of most port and shipping nodes follows a power–law pattern that is characterized by a small number of “hub-dominant” nodes that possess a disproportionately large share of connections. Accordingly, this study adopts the Barabási–Albert (BA) model—a canonical generative mechanism for scale-free networks—to construct a scale-free network representing port–shipping collaborative emission reduction under the new energy paradigm. To further investigate how technology spillovers within such complex networks shape the evolutionary dynamics of port–shipping collaborative emission reduction in the context of new energy adoption, this paper introduces the following additional assumptions, building upon those specified in Section 3.1:
Assumption 8. 
The complex network for port–shipping collaborative emission reduction is denoted as  G ( V , E ) . Its node set V  includes port nodes  P i = { p 1 , p 2 , p 3 , , p N }  and shipping company nodes  S i = { s 1 , s 2 , s 3 , , s M } . The edge set  E  is divided into port–shipping collaboration edges  E P S P × S , inter-port collaboration edges  E P P P × P , and inter-shipping company collaboration edges  E S S S × S .The initial degree  k P i  or  k S i  is determined by the number  g  of connected nodes,  i . e . , k P i = g  or  k S i = g .
Assumption 9. 
Ports and shipping companies in the complex network are assumed to be bounded rational agents. This paper mainly focuses on cooperation between ports and shipping companies, so it targets the edges E P S  (connecting port nodes and shipping company nodes), which represent strategy choices of ports and shipping companies in new energy emission reduction. Payoffs in the game are calculated according to Table 3.
Assumption 10. 
Port and shipping company nodes are assumed to choose strategies that maximize their expected payoffs. At time t , they face two strategy options (active emission reduction, passive emission reduction): the strategy choices of the  i - t h  port node  P i  and  i - t h  shipping company node  S i  at time  t  are denoted as  S P i t  and  S S i t , respectively. Considering bounded rationality, each node has a certain probability of not choosing the optimal strategy, and the rule for strategy update remains consistent in each round.
Assumption 11. 
At time  t , two strategy options (active emission reduction, passive emission reduction) are available. That is, the strategy choices of the  i - t h  port node  P i  and  i - t h  shipping company node  S i  at time  t  are determined. Meanwhile, considering bounded rationality, it is assumed that each node has a certain probability of not choosing the optimal strategy, and that the rule used by each node for strategy update remains consistent in each round.

4.2. Algorithm Evolution Process

The detailed procedure of the complex network evolution algorithm for collaborative emission reduction in port–shipping systems under the context of new energy is outlined as follows:

4.2.1. Network Construction and Initialization

  • Network creation and growth
Based on a random network with h 0 nodes, a new node is added each time and connected to h existing nodes (ensuring h 0 h ), until the total number of network nodes reaches N . Referring to the “preferential attachment” characteristic of port and shipping companies identified by Wang et al. [48], the probability that a new node connects to an existing node i is set to be proportional to the degree k i of node i , as follows:
Π i = k i j = 1 N 1 k J
where k i denotes the degree of existing node i , and N is the total number of network nodes.
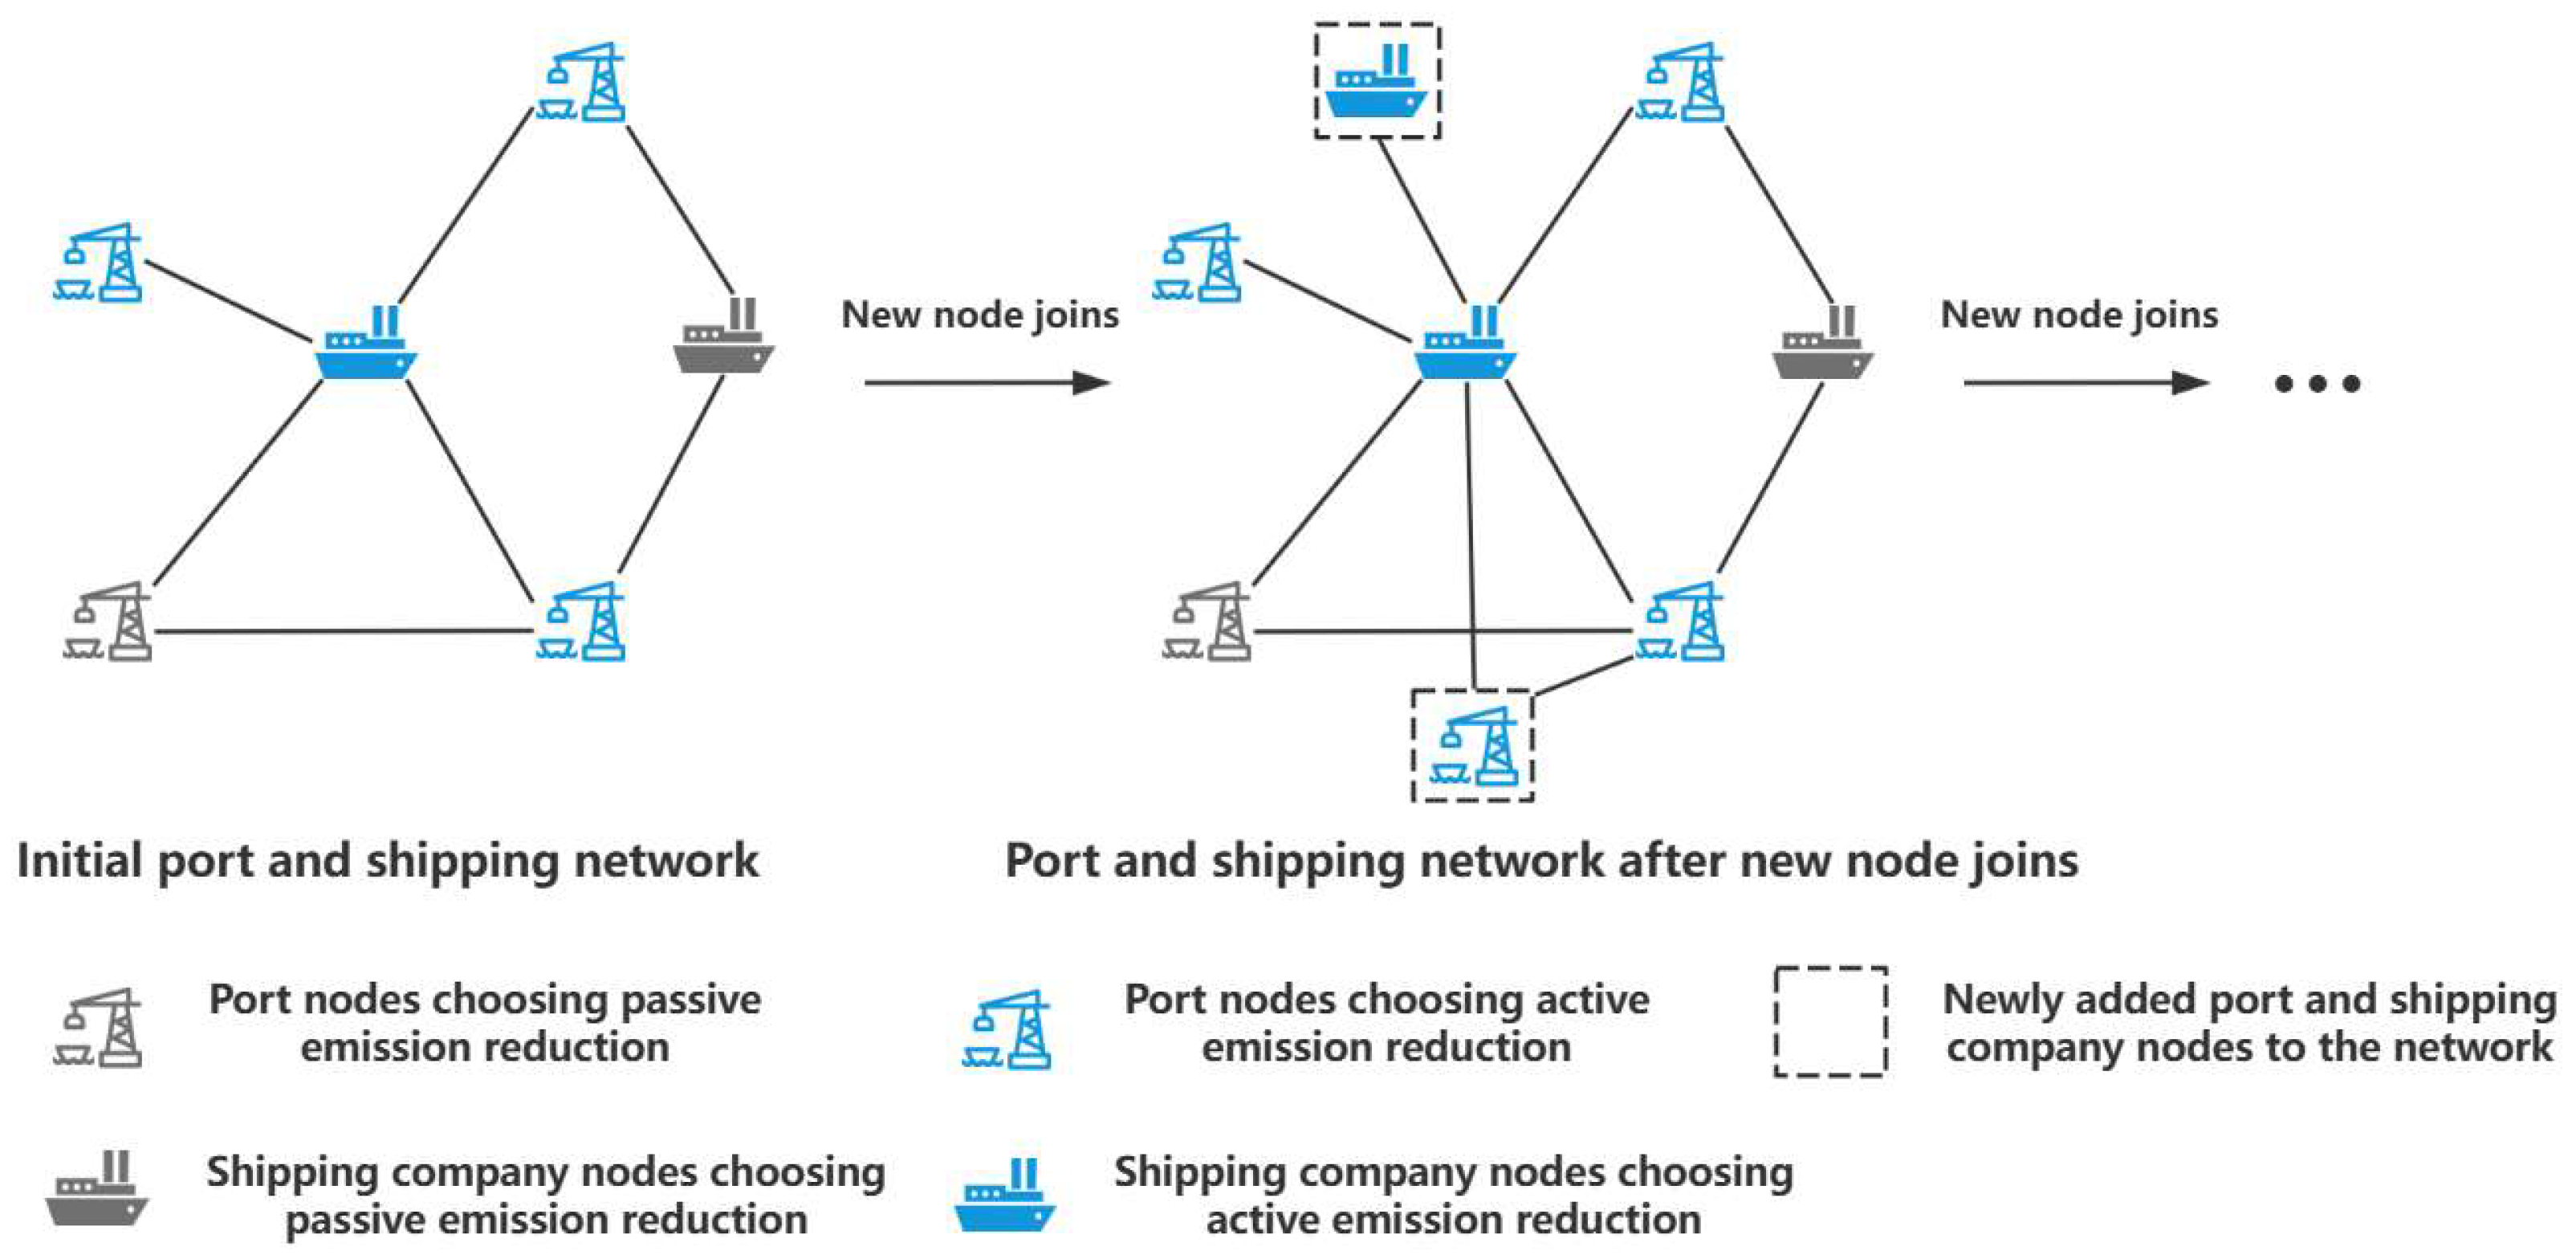
Figure 3 depicts the initialization and node connection process within the port–shipping network. Internal edges, which signify cooperative relationships between port and shipping company nodes, facilitate the direct computation of node degrees. Edges that connect port nodes to shipping company nodes represent strategic interactions, particularly game-theoretic relationships, stemming from collaborative emission reduction initiatives supported by novel energy technologies. Nodes are colored blue to indicate a preference for active involvement in these collaborative emission reduction efforts; nodes without this preference are displayed in gray. During the node connection phase, newly introduced nodes preferentially attach to existing nodes with higher degrees—a mechanism consistent with the principle of preferential attachment. The network’s evolution persists until it establishes complete connectivity.
  • Parameter setting and strategy selection
Set the initial proportion of port–shipping companies choosing active emission reduction in the network as η . Assign each node an initial strategy (active or passive emission reduction) according to this proportion.

4.2.2. Evolutionary Game and Technology Spillover Effect Transmission

  • Evolutionary game payoff calculation
In each round of the game, each port node P i conducts an evolutionary game with every connected shipping company node S j and each shipping company node S i conducts an evolutionary game with every connected port node P j . Their payoff functions are as follows:
π P i = S j λ P i S P i A P i , S j S S j T π S i = P j λ S i S S i A S i , P j S P j T
π P i denotes the game payoff of port node P i ; S j is the shipping company node that plays the game with port P i ; λ P i represents all shipping company nodes connected to port P i ; S P i and S S j are the respective strategies of port node P i and shipping company node S j in the game; and A P i , S j is the payoff matrix under their corresponding strategies.
Similarly, π S i denotes the game payoff of shipping company node S i ; P j is the port node that plays the game with the shipping company S i ; λ S i represents all port nodes connected to the shipping company S i ; S S i and S P j are the respective strategies of shipping company node S i and port node P j in the game; and A S i , P j is the payoff matrix under their corresponding strategies.
  • Calculation of vertical technology spillover transmission effect
After each evolutionary game, if both the port node P i and the shipping company node S j adopt active emission reduction strategies, they mutually benefit from vertical technology spillovers. Such spillovers lower the carbon emission reduction targets each party must achieve, thereby reducing their respective investment costs in emission abatement. To illustrate, consider the vertical technology spillover from shipping companies to ports: the port’s carbon emission reduction target at the subsequent time step is determined by subtracting the spillover received from the shipping company from its target level at the preceding time step.
e d P i ( t + 1 ) = e d P i ( t ) φ j = 1 λ P i M S j ( t ) δ e d S j ( t )
where e d P i ( t ) and e d S i ( t ) respectively represent the carbon emission reduction target levels that the port and the shipping company need to meet at time t ; M S j ( t ) { 0 , 1 } represents the strategy of the shipping company node connected to port node P i at time t (0 for passive emission reduction, 1 for active emission reduction); λ P i represents all shipping company nodes connected to port P i ; δ is the vertical technology spillover level; and φ is the technology spillover absorption coefficient.
Unlike the unrestricted spillover scope of horizontal technology spillovers that cover all homogeneous peers in the network (Ye et al. [34], Liu et al. [35]), this study limits vertical technology spillovers to only actually cooperative port–shipping node pairs through the index set λ P i , strengthening the vertical chain attribute; unlike horizontal technology spillovers that only affect costs, benefits, or strategy adoption rates (Ye et al. [34], Liu et al. [35]), the vertical technology spillovers in this study directly update cross-tier carbon emission reduction targets, reflecting the characteristic of collaborative dynamic adjustment; unlike horizontal technology spillovers that mostly adopt static modeling (Liu et al. [35], Wang [36]), this study realizes real-time dynamic transmission from “spillover source to recipient” through time-step iteration ( t > t + 1 ), breaking through the limitations of horizontal spillovers.

4.2.3. Strategy Update

  • Calculate virtual payoff
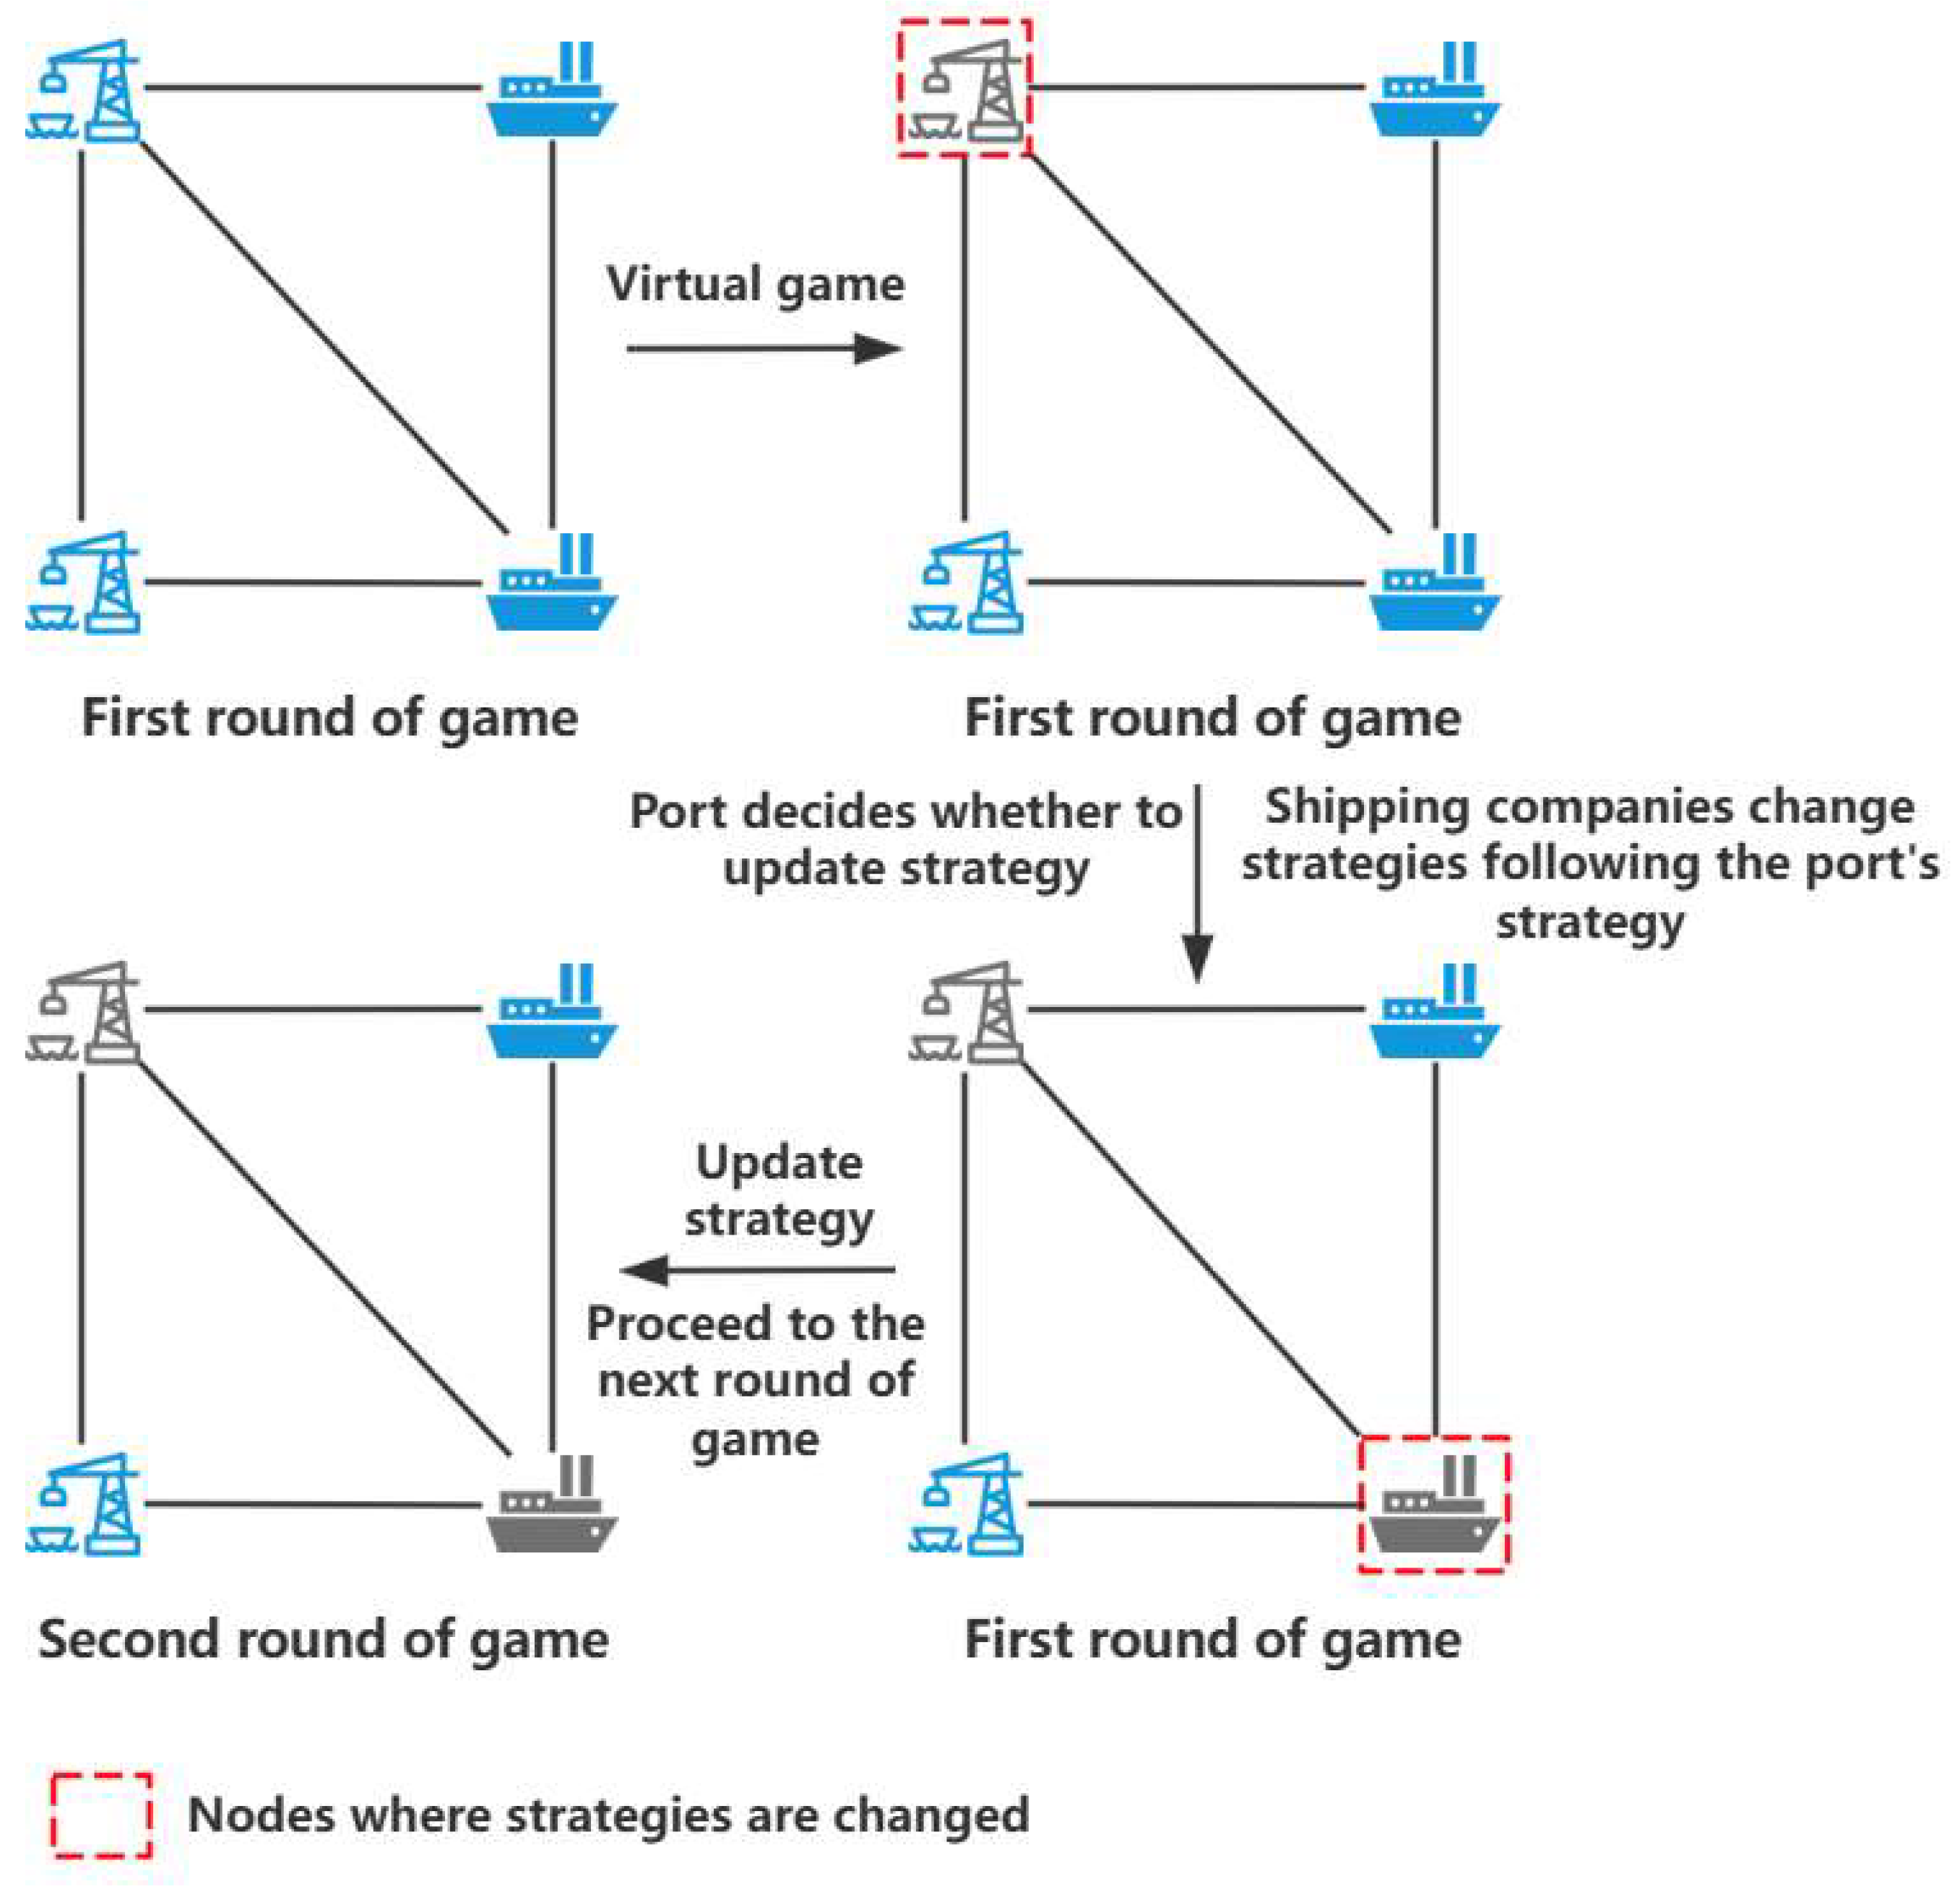
After each round of the evolutionary game, every port node and shipping company node assesses the effectiveness of its current strategy to determine whether a strategic update is warranted. Specifically, each network node assumes that its counterpart’s strategy remains fixed and conducts a unilateral virtual experiment—varying only its own strategy while holding the counterpart’s strategy constant. This procedure generates virtual payoffs for both the port and the shipping company. The node then compares its virtual payoff with the actual payoff realized in the current round: if the virtual payoff is strictly greater, the node updates its strategy with a certain probability.
  • Fermi dynamics update rule
According to the Fermi dynamics rule [49], if the payoff of a network node in a round of evolution is lower than the virtual payoff, the node will change its strategy in this round with a certain probability in the next round of game. Taking the shipping company node S i as an example, the formula for the probability of updating the strategy in the next round (related to the current payoff π S i and virtual payoff π S i ) is as follows:
P S P i S P i = 1 1 + e ( π P i π P i ) / κ
where S P i and S P i respectively represent the shipping company’s strategy in the current round of the game and the opposite virtual strategy; κ is the system noise parameter for irrational choices (generally greater than 0). When κ , this indicates that the node is in a severely noisy external environment and cannot make rational decisions and when κ 0 , the impact of the external environment on the node’s strategy update is almost negligible.
Nodes in the port–shipping network update their strategies according to the Fermi update rule, which is based on their virtual payoffs. An illustrative diagram of this strategy-updating process is presented in Figure 4.

4.2.4. Determine Whether Evolution Terminates

If the evolution time reaches the preset T , the process ends and the corresponding results are output; otherwise, repeat the steps in (2) and (3) until the preset T is reached, and then the evolution ends.

4.3. Numerical Simulation and Analysis

4.3.1. Parameter Value Setting

In this part, Python 3.13 will be used to conduct 40 rounds of evolutionary game simulation experiments according to the network evolutionary algorithm of 4.2, and the complex network evolutionary game of port and shipping cooperative emission reduction will be simulated and analyzed, including 100 shipping company nodes and 100 port nodes.
All parameter values are determined by referring to the relevant literature and to actual industrial data. Specifically, the investment cost coefficient m is a dimensionless scaling parameter that reflects the marginal increasing characteristic of emission reduction investment costs. Following the standard quadratic cost function settings widely adopted in maritime decarbonization and green technology research [45,50], the coefficient m is calibrated based on typical cost structures in the shipping sector. Accordingly, the value of m is determined as 31 in this study. Other parameters are determined in a similar manner by comprehensively referring to existing studies and practical conditions. The final values of all parameters are presented in Table 5.
As random numbers are involved in the simulation experiment, the average value of 40 rounds of simulation results is used as the final calculation result in this part. We systematically examine the influence of five key factors on the adoption and persistence of active emission-reduction strategies: (i) vertical technology spillover level; (ii) benefit distribution ratio; (iii) carbon reduction target level; (iv) government subsidy schemes; and (v) carbon trading price. Except for the analysis of the technology spillover ratio—which is investigated as a standalone variable—the remaining four factors are evaluated under both low- and high-technology-spillover scenarios to assess their conditional effects.

4.3.2. Simulation Analysis

  • Analysis of simulation results on the diffusion of active emission reduction strategies among ports and shipping companies
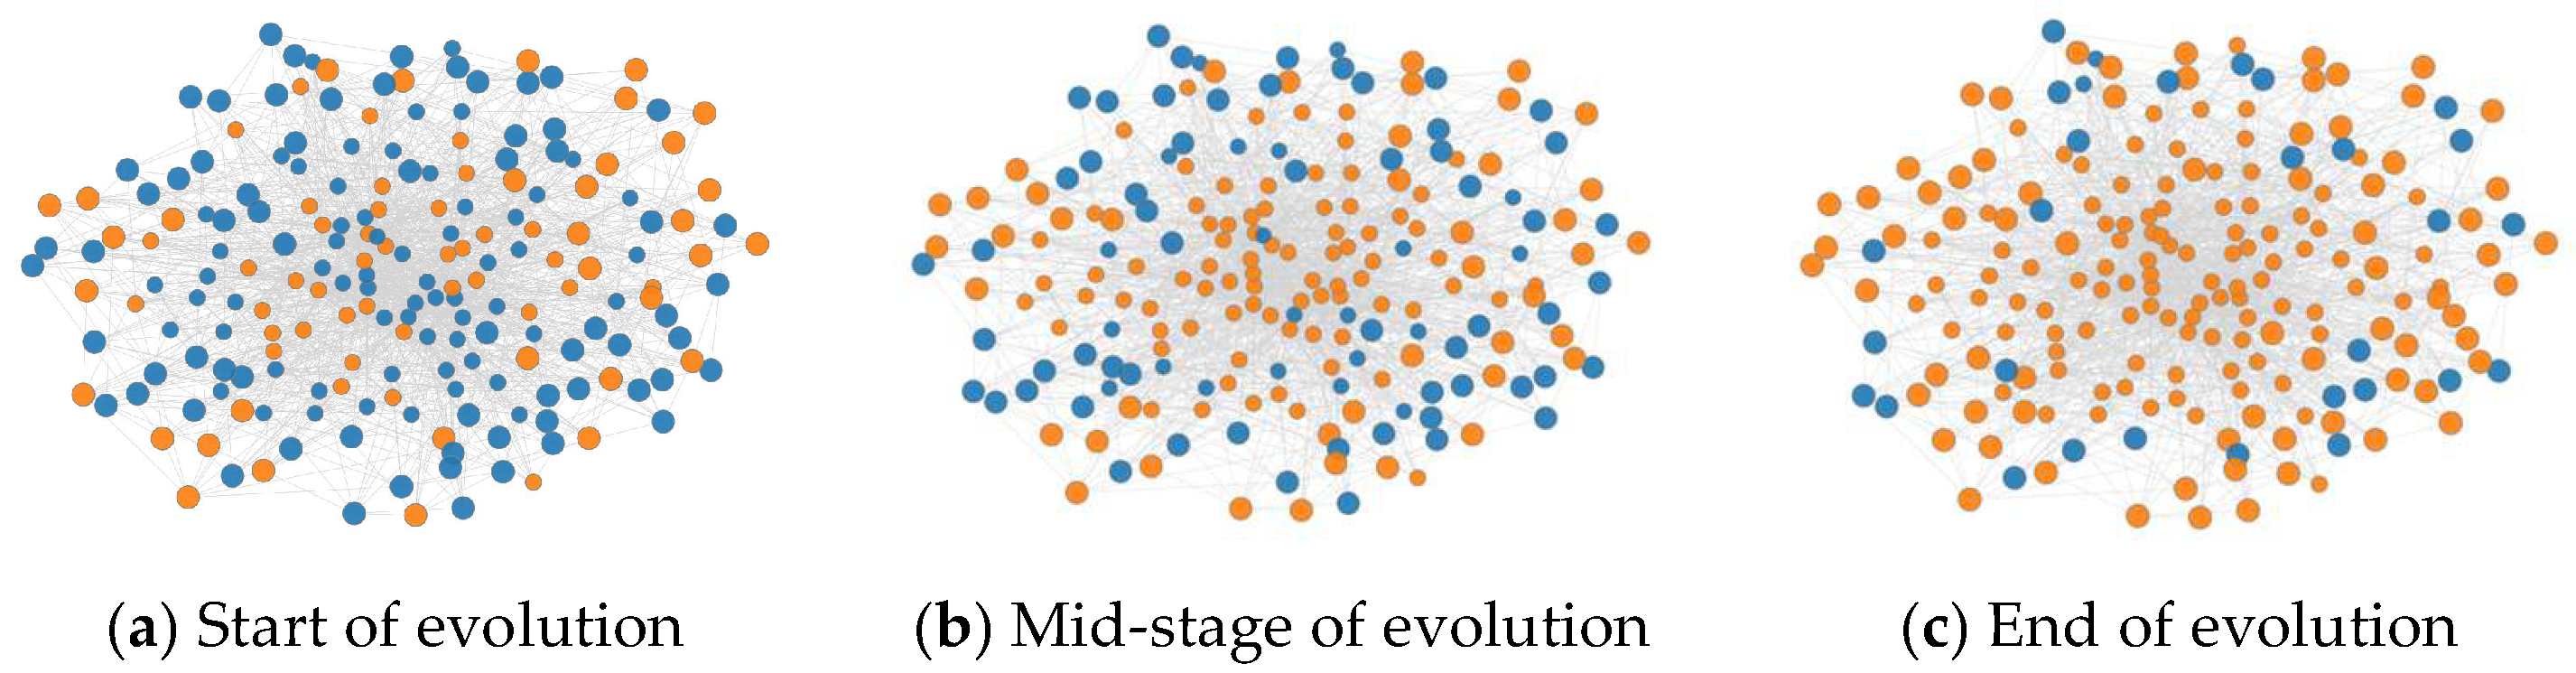
The diffusion process of active emission reduction strategies across the port–shipping network is illustrated in Figure 5:
Figure 5 illustrates the diffusion of active emission reduction strategies across ports and shipping companies within a complex network. In this network, orange nodes denote entities that have adopted active emission reduction strategies, whereas blue nodes represent those pursuing passive emission reduction approaches. Figure 5a shows the initial state of the network at the onset of evolutionary dynamics, wherein 30% of port–shipping nodes have opted for active strategies. As the evolutionary game proceeds through successive iterations, certain nodes shift from blue to orange, as illustrated in Figure 5b. By the end of the evolutionary process—depicted in Figure 5c—more than 80% of ports and shipping companies are projected to adopt active emission reduction strategies, leading the network toward a relatively stable equilibrium.
  • Impact of technology spillover level between ports and shipping companies
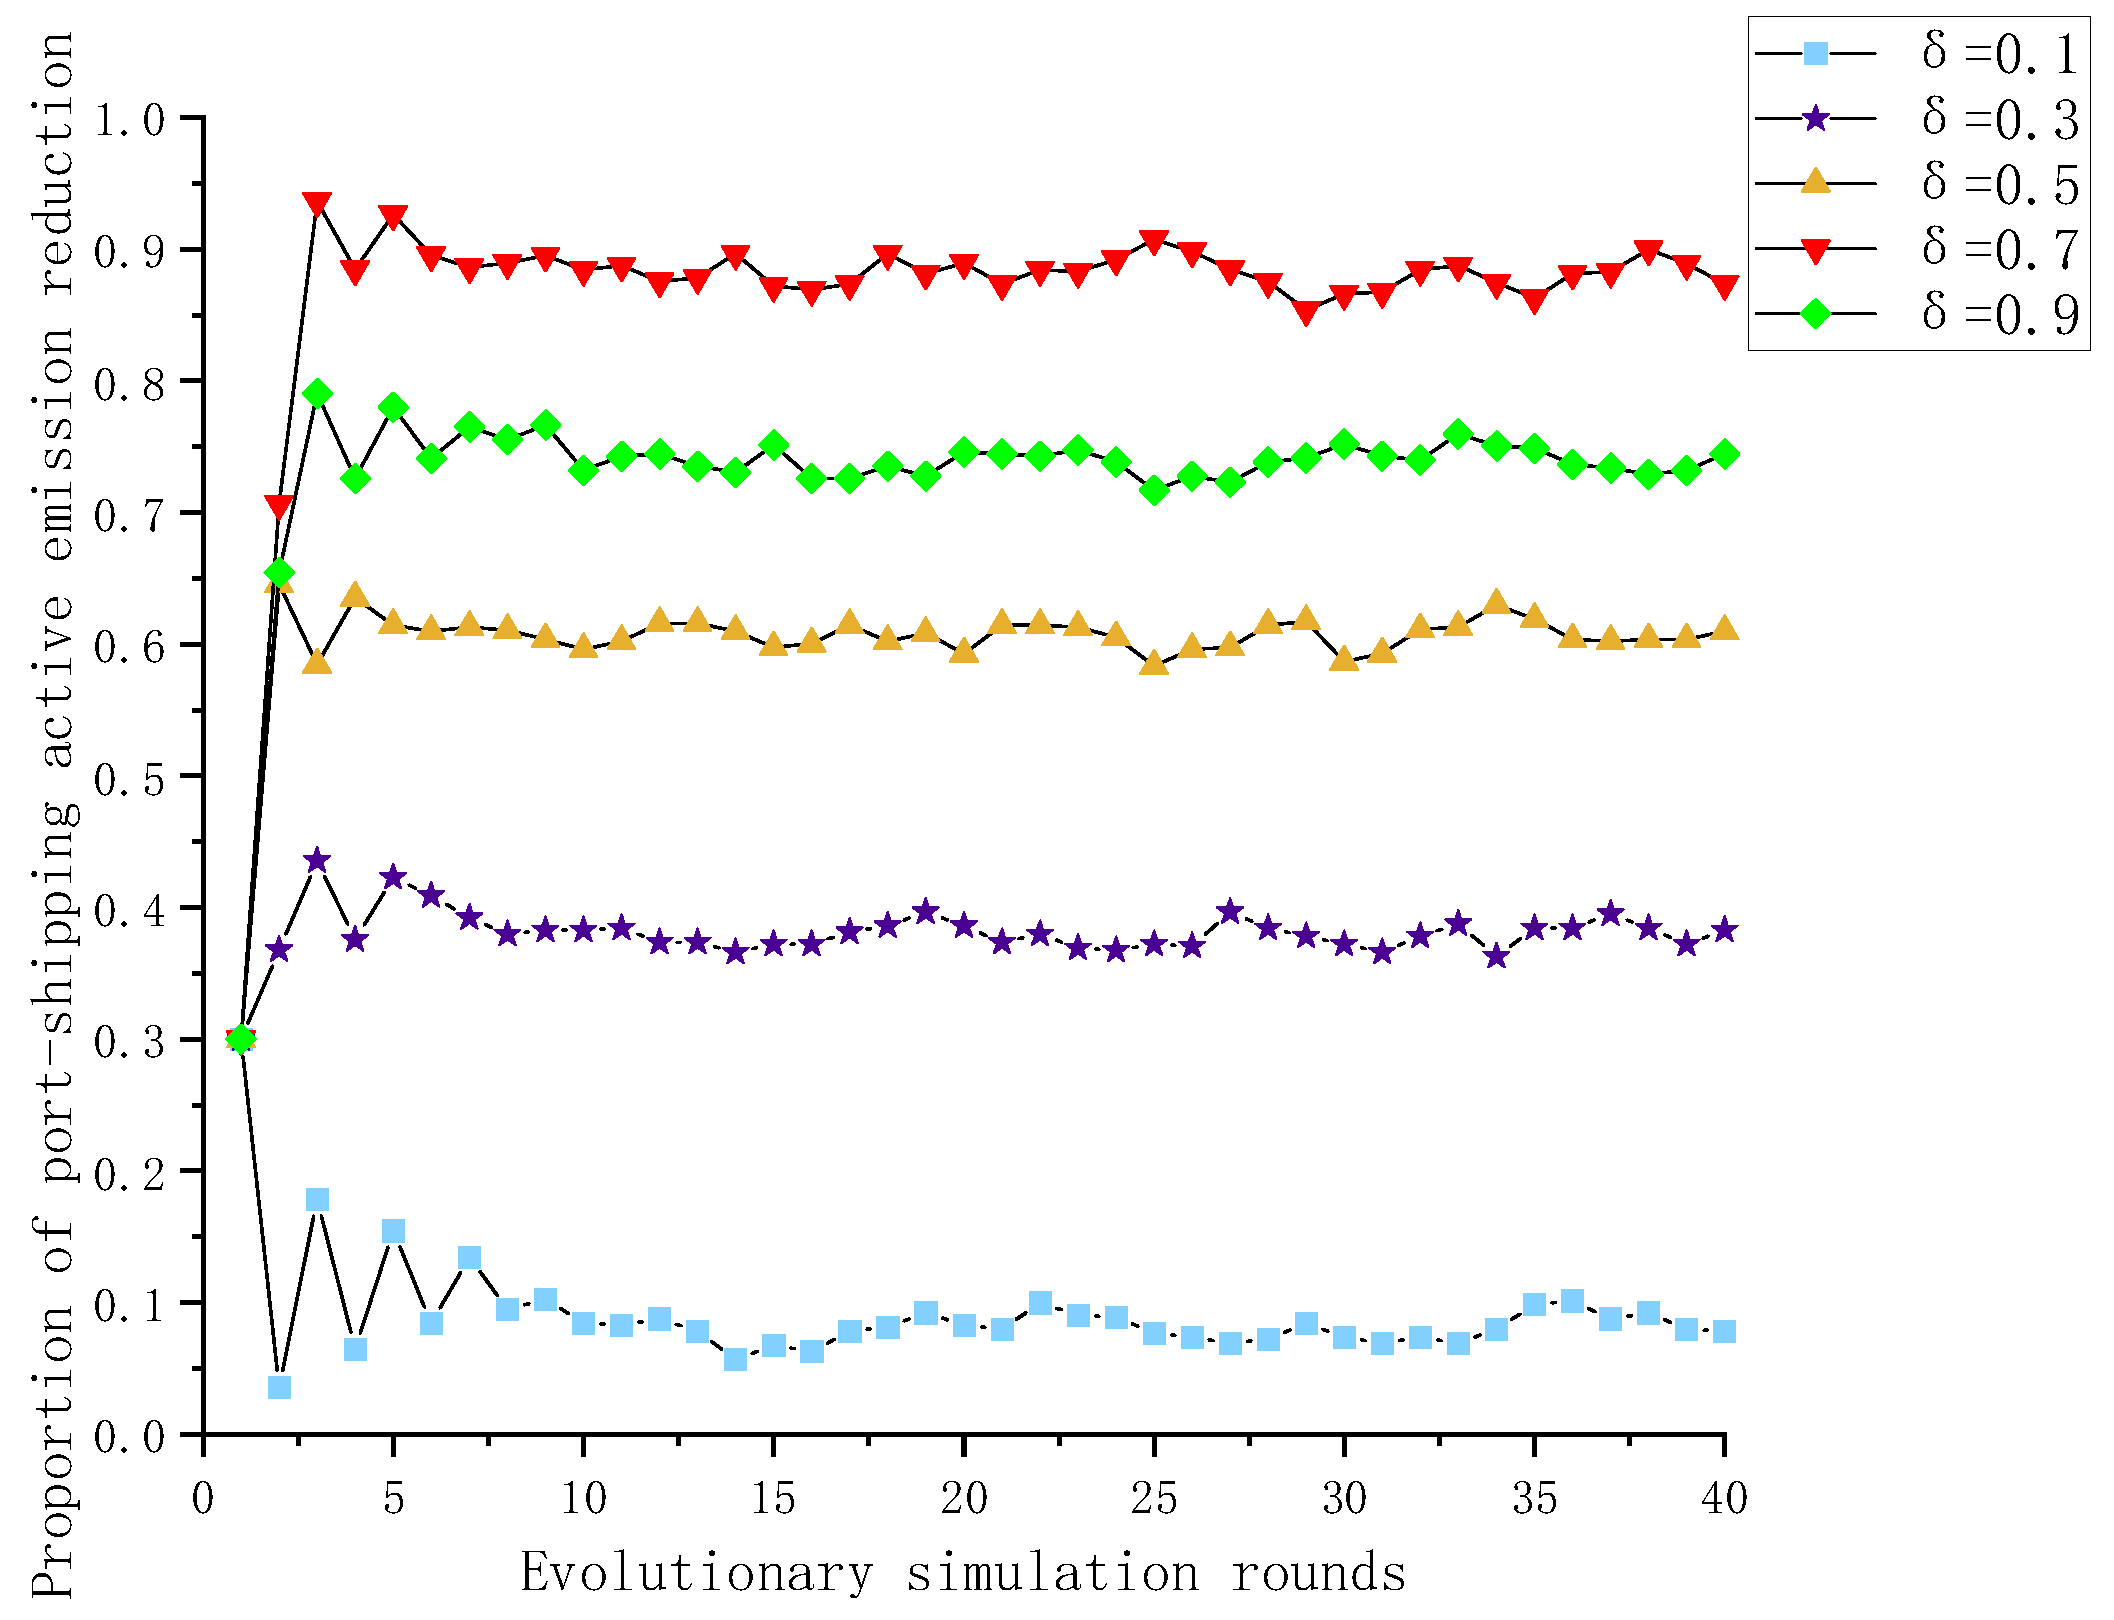
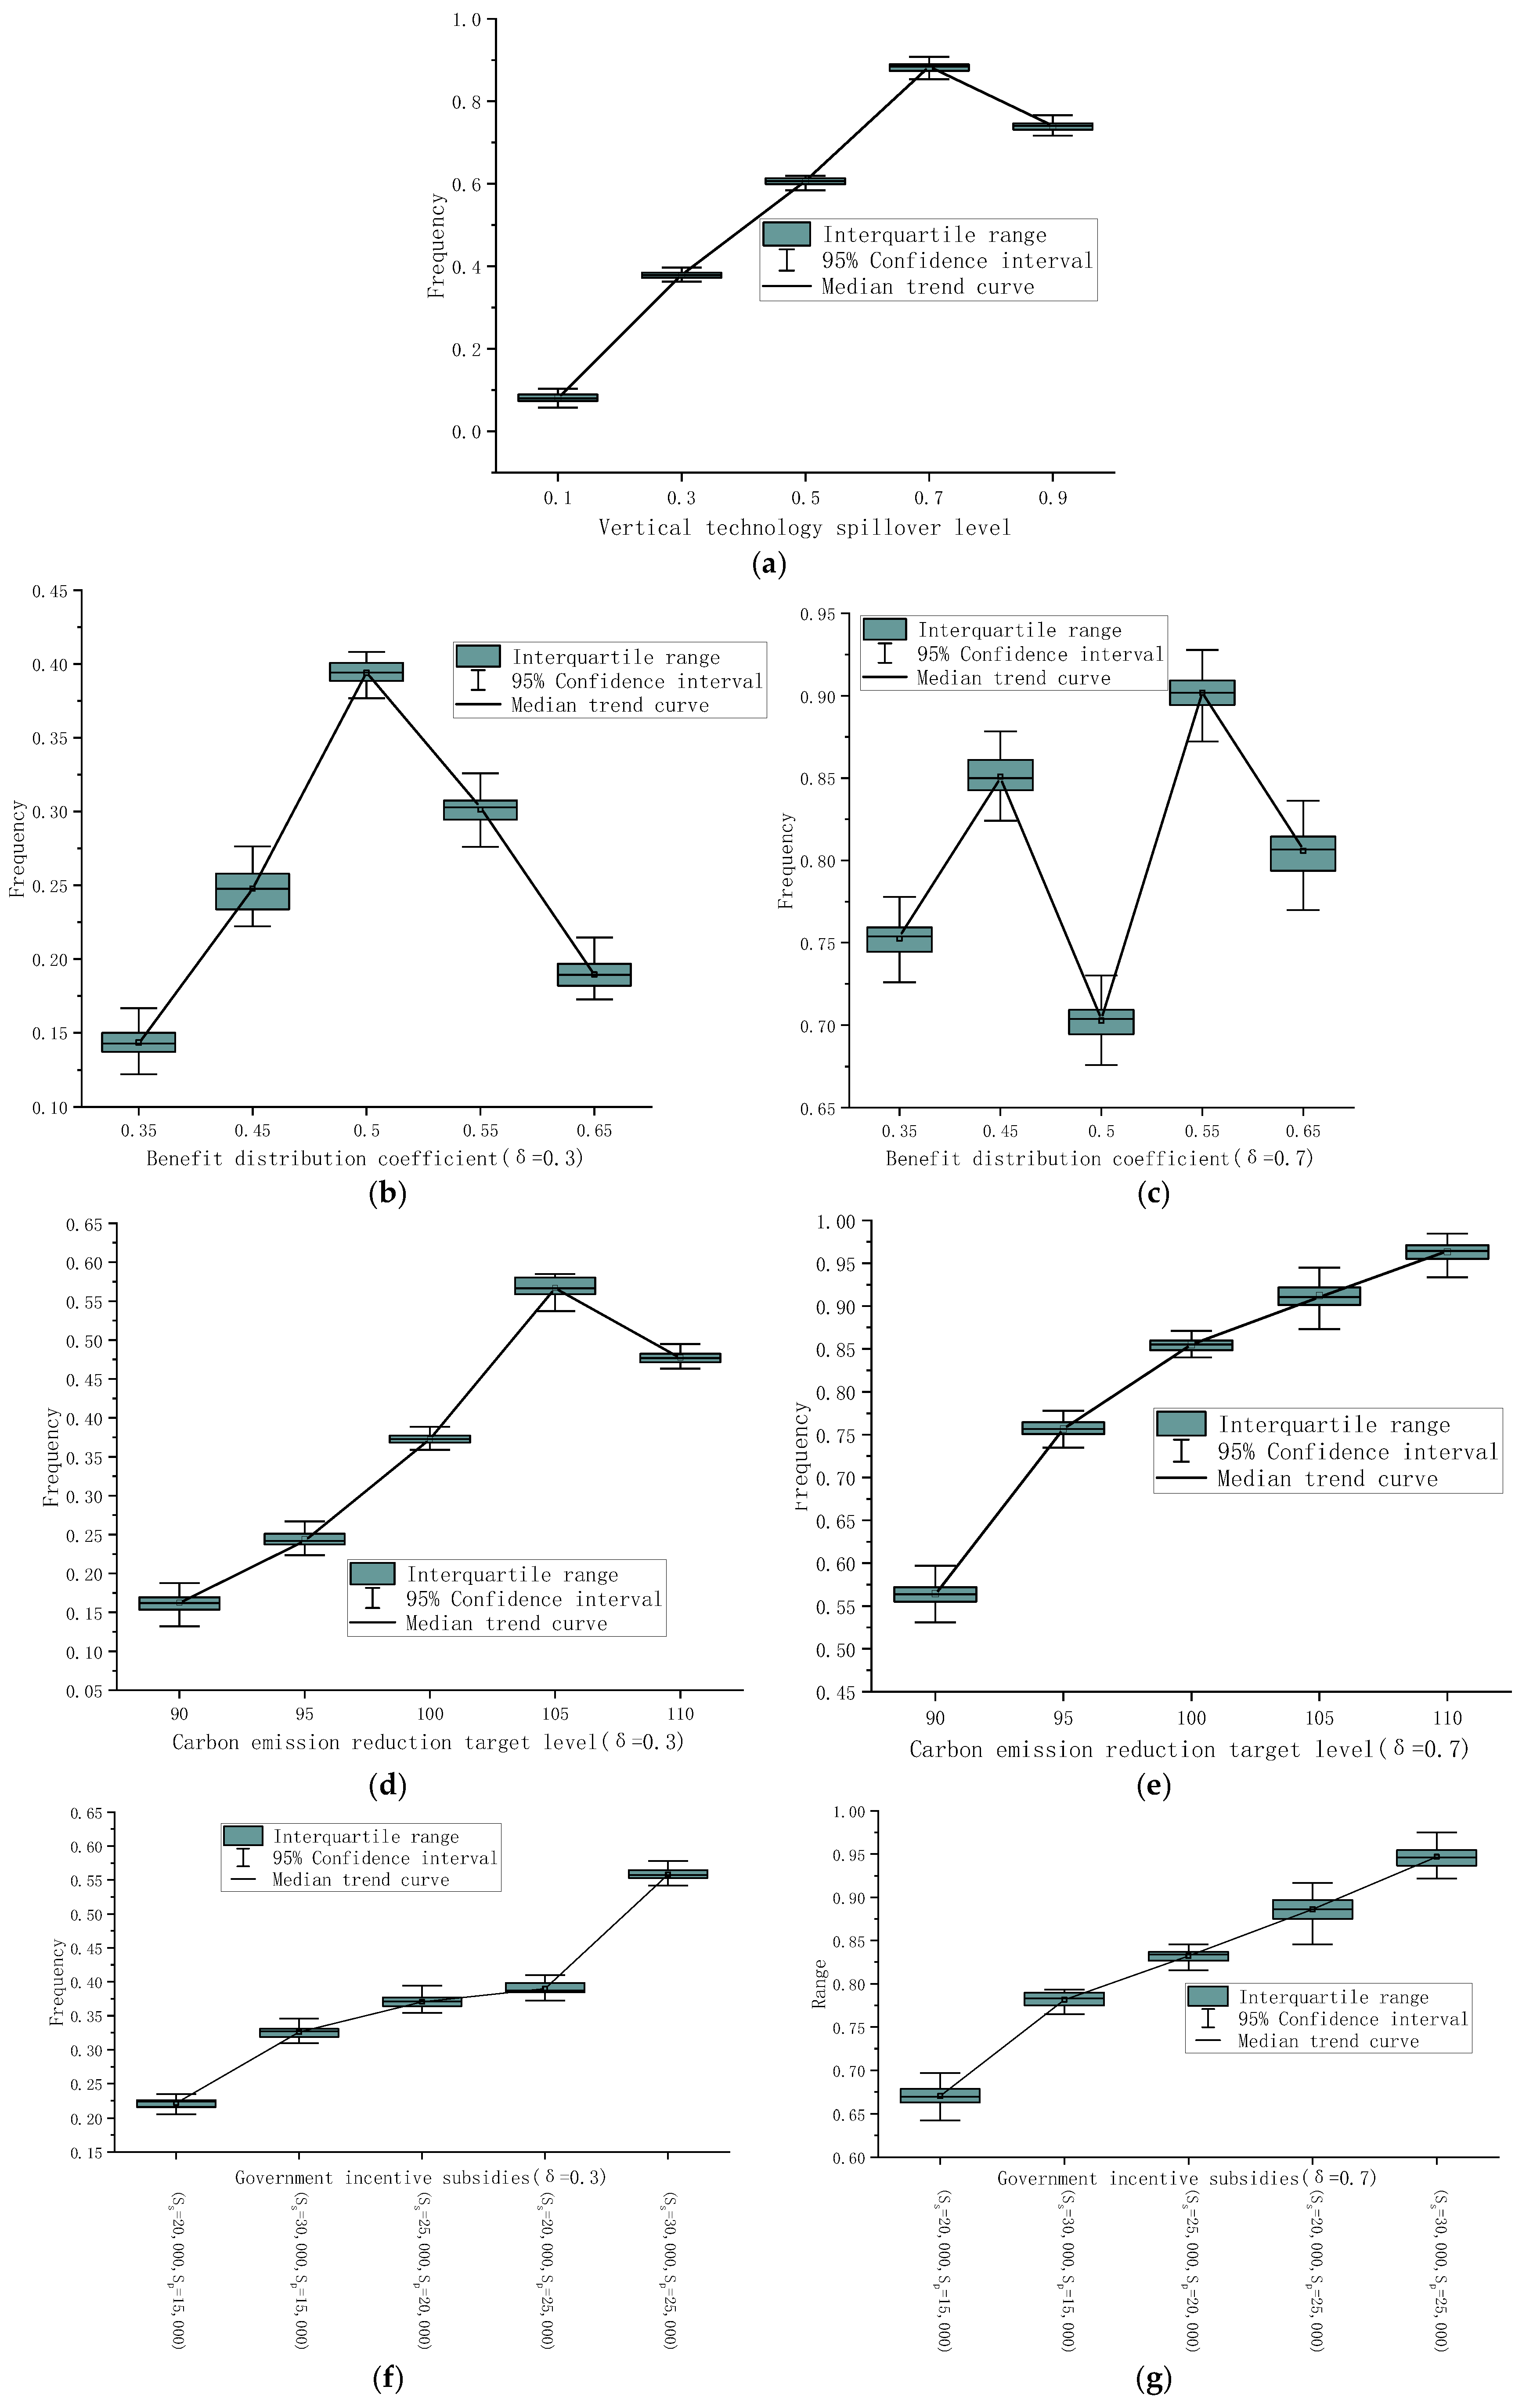
To examine the impact of the vertical technology spillover level (denoted as δ ) on the evolutionary outcomes of the port–shipping collaborative emission reduction network game, all other parameter values are held constant. The evolution of the proportion of ports and shipping companies actively engaging in emission reduction within the port–shipping complex network is analyzed across varying levels of δ , as shown in Figure 6 below.
As shown in Figure 6, the proportion of ports and shipping companies adopting active emission reduction strategies first rises and then falls with the increase in the vertical technology spillover ratio. This indicates that the promotion effect of vertical technology spillovers on active emission reduction strategies presents a diminishing marginal effect. Specifically, an initial increase in δ significantly improves the active emission reduction level of port and shipping enterprises through technological synergy. However, when δ becomes excessively high (e.g., δ = 0.9 ), firms rely too heavily on spilled technologies instead of independent innovation, resulting in a lower proportion of active emission reduction than at δ = 0.7 .
At a low level of vertical technology spillover ( δ = 0.3 ), the marginal benefits of active emission reduction can hardly cover the implementation costs, so the adoption rate remains below the 30% baseline, and most firms choose passive emission reduction. This stage corresponds to the EU MRV, IMO DCS, and early emission control area regulations in China. These policies only focus on basic compliance requirements and do not provide effective incentives for active emission reduction, so firms naturally tend to adopt low-cost passive measures such as using low-sulfur fuel and optimizing navigation speed. When the vertical technology spillover ratio rises to a moderate level ( δ = 0.7 ), the net benefits of active emission reduction exceed the costs, driving a substantial increase in the adoption rate compared with the initial state. This stage aligns with the coordinated global policy efforts: the IMO EEXI and CII regulations, the inclusion of shipping in the EU ETS, the clean energy support policies in China’s 14th Five-Year Plan for transportation, and local subsidies for shore power and LNG bunkering facilities have jointly formed a policy system combining mandatory constraints and economic incentives, encouraging port and shipping enterprises to actively deploy methanol/ammonia-fueled ships and port low-carbon retrofits. When the vertical technology spillover ratio becomes excessively high ( δ = 0.9 ), port and shipping enterprises will increasingly rely on mature off-the-shelf technologies to meet carbon reduction targets, thereby reducing investment in new clean-energy emission reduction solutions, weakening the incremental benefits of further technology spillovers and the motivation for collaborative innovation, and eventually leading to a decline in the proportion of active emission reduction. The high-spillover stage lacks mature policy practice and typical experience in reality, but its simulation results carry important implications: if technology diffusion is too extensive without effective guidance for independent innovation, the industry may rely excessively on existing mature technologies, which is not conducive to the research and development of cutting-edge emission reduction technologies. Therefore, future policies should maintain a reasonable balance between technology promotion and innovation incentives.
The impact of the low-spillover level ( δ = 0.3 ) and the moderate-spillover level ( δ = 0.7 ) on the proportion of active emission reduction in port and shipping sectors differs by more than 50%, showing a significant gap. Research based on a single spillover level will seriously weaken the explanatory power and guiding value of the conclusions for real-world decision-making. Therefore, this paper will further explore the heterogeneous impacts of other factors on the evolutionary outcomes of the port–shipping collaborative emission reduction network game under low-spillover and high-spillover scenarios respectively.
  • Impact of benefit distribution coefficient
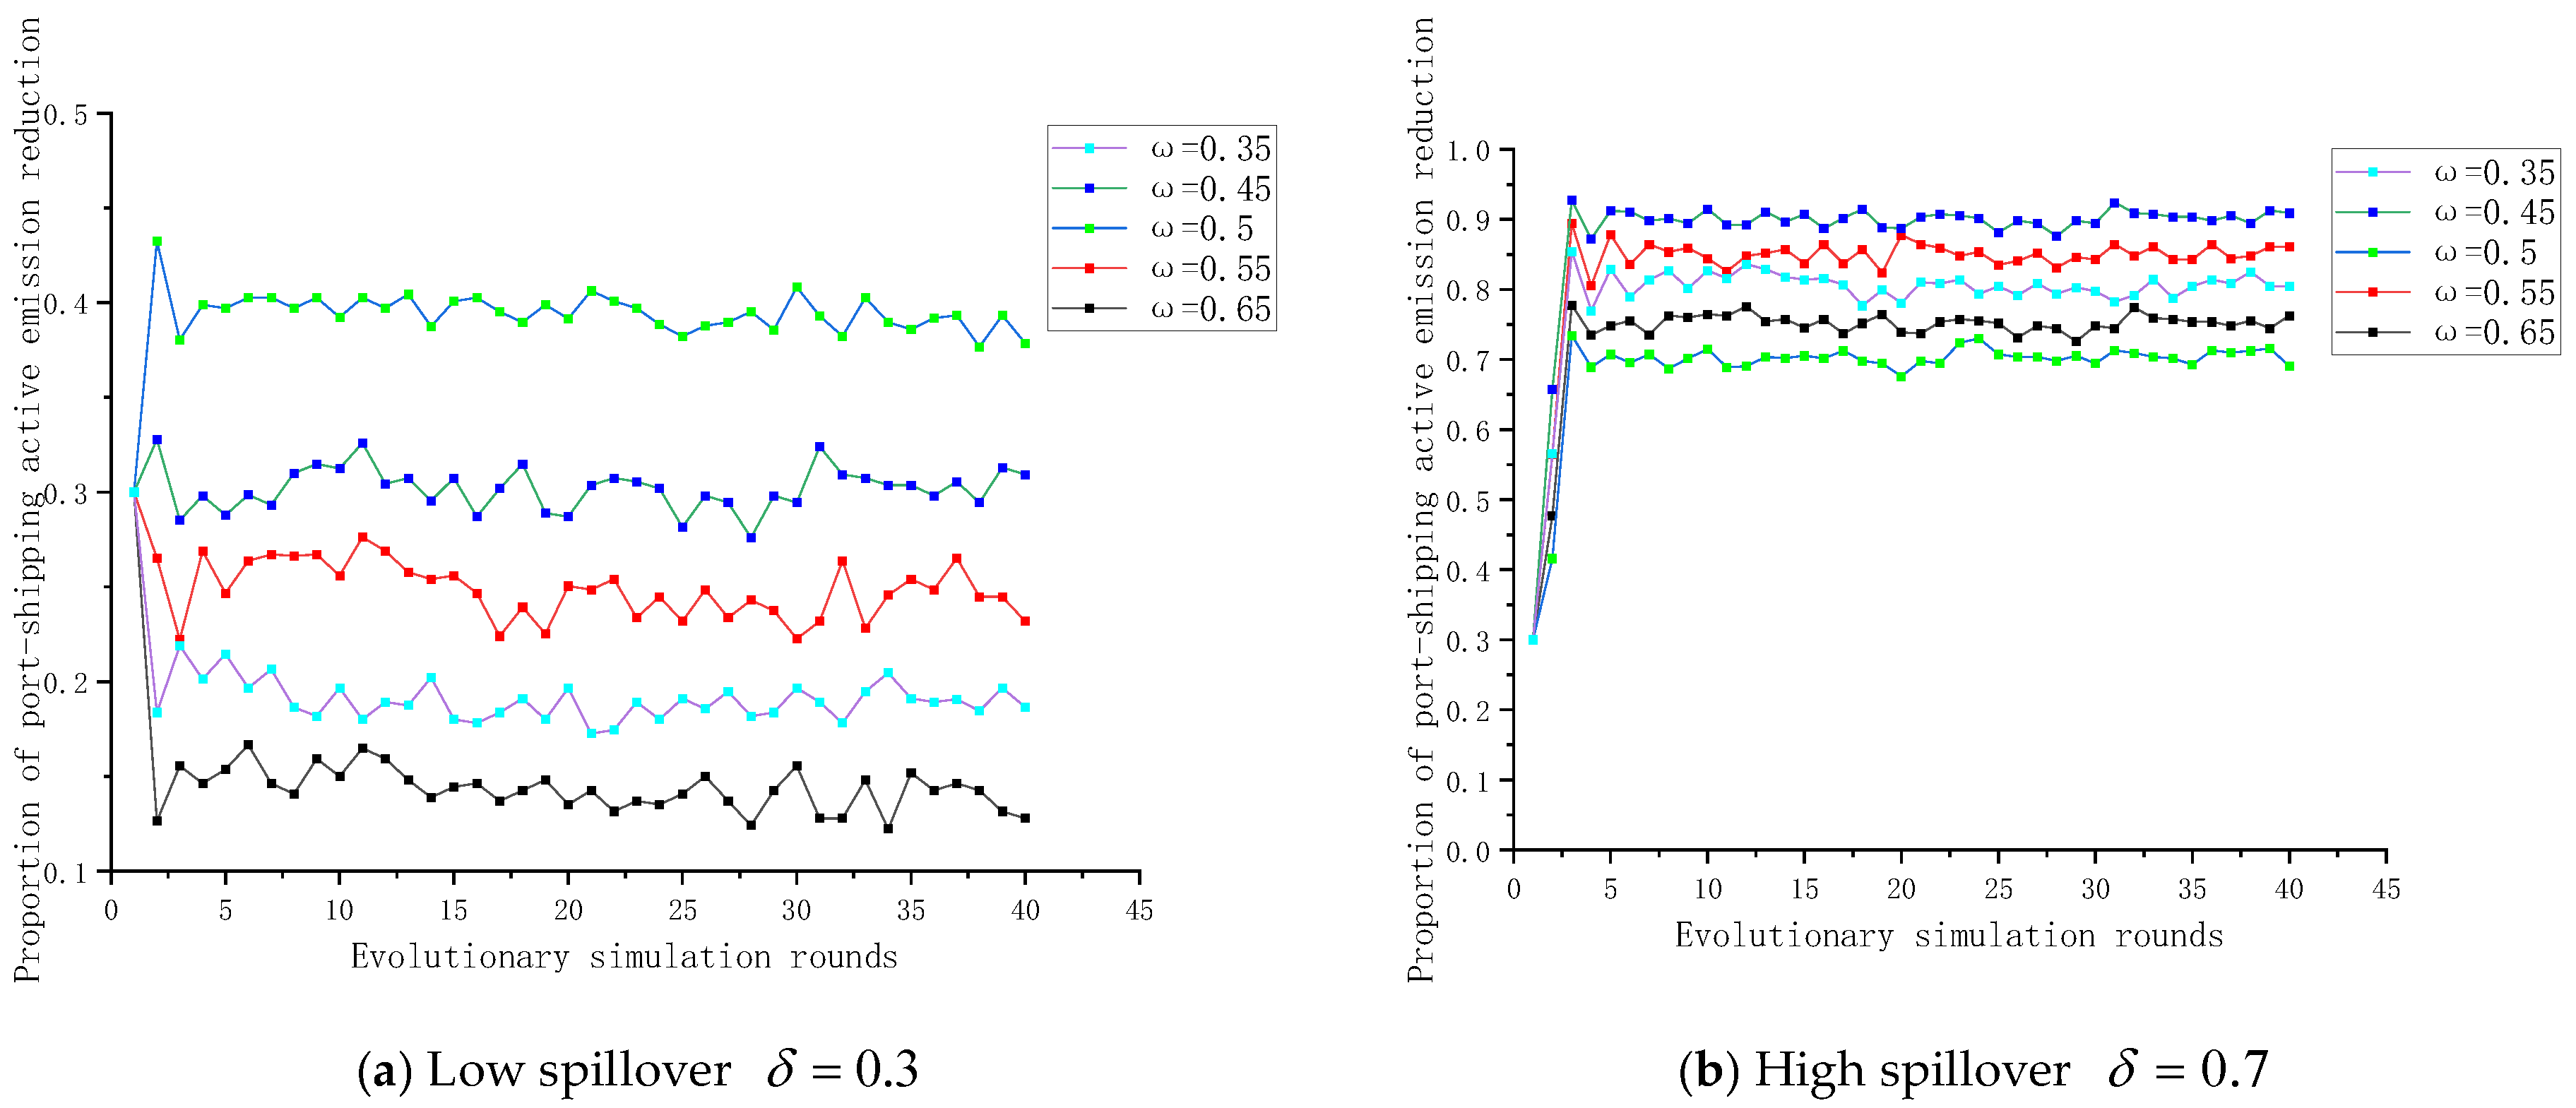
To examine how variations in the port–shipping benefit distribution coefficient ω influence the evolutionary outcomes of the port–shipping collaborative emission reduction network game under two distinct spillover scenarios, we systematically perturb ω —either increasing or decreasing it—from its baseline value of ω = 0.5 , while holding all other parameters constant. The corresponding simulation results are shown in Figure 7.
From Figure 7, the following conclusions can be drawn: Under low technology spillover conditions, the proportion of nodes adopting active emission reduction is higher when benefits are evenly distributed between ports and shipping companies than when benefits are disproportionately allocated to either party. Because low spillover attenuates the strategic advantages associated with active emission reduction, a highly skewed benefit distribution further reinforces the tendency toward passive emission reduction. In practice, this aligns with early-stage port–shipping emission reduction policies, such as China’s initial emission control area regulations and the EU MRV system, where benefit-sharing mechanisms for clean energy investments were absent. For instance, port-side shore power construction costs were mostly borne by ports, while shipping companies only paid low usage fees, creating a skewed benefit distribution that dampened mutual incentives for proactive investment—leading most entities to prioritize low-cost passive measures like speed optimization and low-sulfur fuel use rather than collaborative active emission reduction projects.
In contrast, under high technology spillover conditions, the proportion of nodes pursuing active emission reduction exceeds 65% across all benefit-distribution regimes. Notably, this proportion is lower under even benefit distribution than under skewed distributions. This is because high technology spillovers make up for the cost of emission reduction, and the benefit skew encourages one party to adopt active emission reduction, while the other party will choose to adopt active emission reduction if it follows its strategy with higher benefits. This mirrors the current policy landscape, where targeted subsidies and preferential policies create skewed benefit incentives: for example, China’s local governments provide higher subsidies for port-side LNG and methanol bunkering infrastructure, tilting benefits toward ports, while the EU ETS imposes carbon costs on shipping companies, pushing them to adopt clean fuel vessels. Such asymmetric policy incentives have led to a higher uptake of active emission reduction than fully equal benefit-sharing models, as one party’s proactive investment (e.g., ports building bunkering facilities) drives the other party (shipping companies) to follow suit with fleet upgrades.
Furthermore, when benefits are biased in favor of ports, the proportion of active emission reduction is consistently higher than when benefits favor shipping companies. This suggests that ports receiving a larger share of the benefits possess greater capacity—and likely stronger motivation—to coordinate and catalyze collaborative action toward active emission reduction within the port–shipping supply chain. Real-world policies reflect this advantage: ports like Shanghai and Shenzhen, which receive preferential land use and financial support for green port construction (e.g., photovoltaic power generation, automated low-carbon terminals), have taken a leading role in promoting collaborative emission reduction. Collaborating with shipping firms, they have established projects like shared LNG bunkering networks and platforms for tracking carbon footprints. This approach shows that distributing benefits centered around the port enhances their role as supply chain coordinators, thereby speeding up the implementation of active emission reduction strategies. In comparison, policies that primarily benefit shipping companies (e.g., vessel purchase subsidies for clean fuel ships) have shown weaker spillover effects on port-side infrastructure investment, resulting in a lower overall rate of collaborative active emission reduction.
  • Impact of port–shipping carbon emission reduction target level
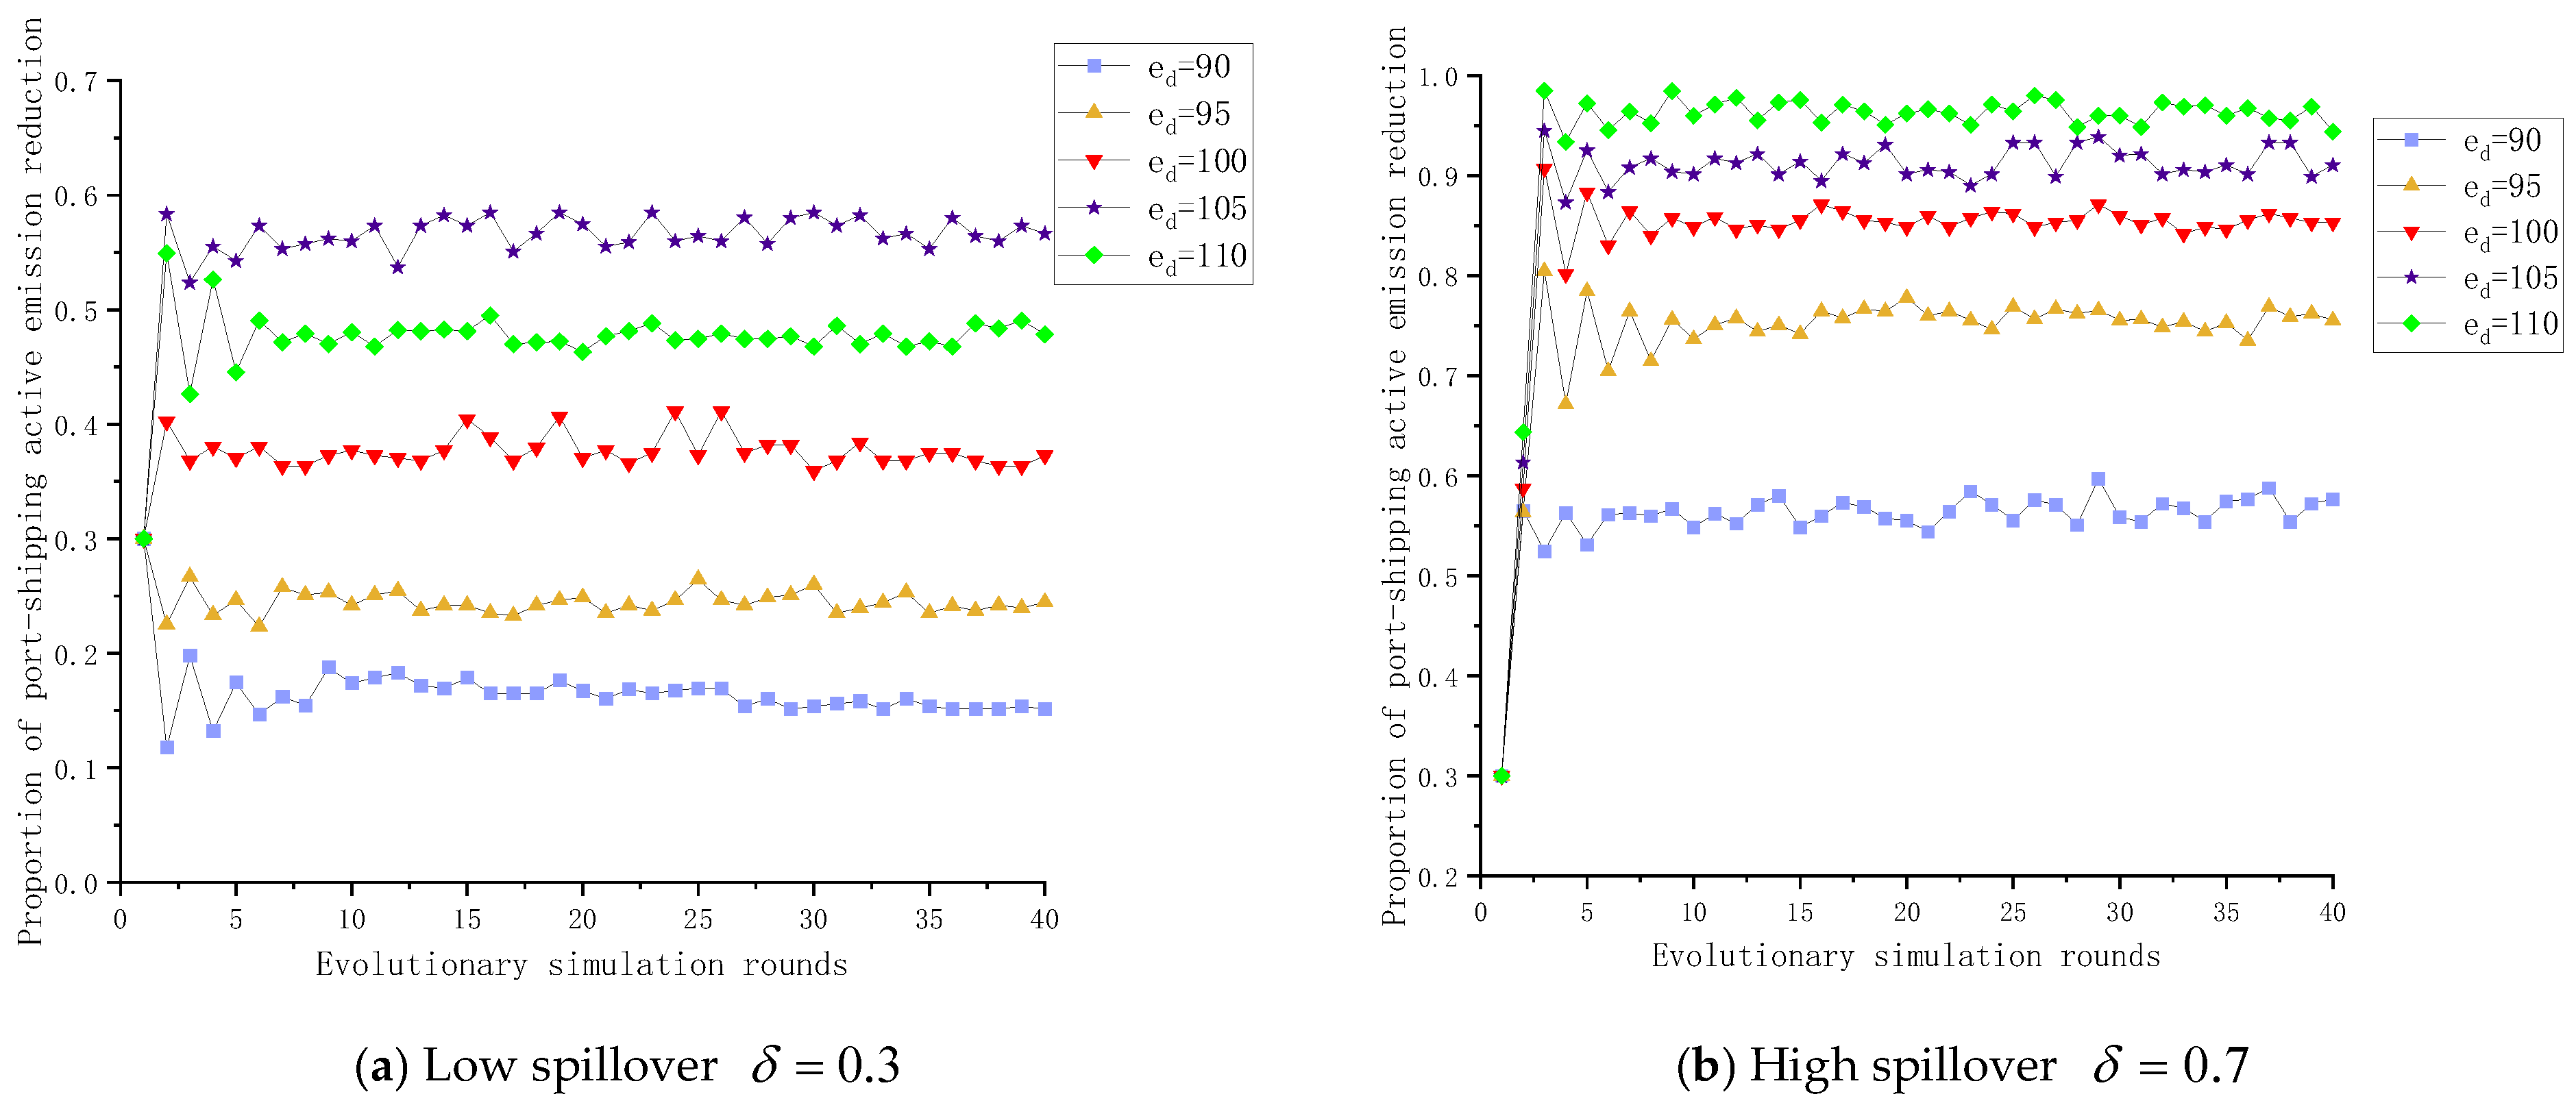
To examine how the port–shipping carbon emission reduction target level e d —under two distinct spillover scenarios—affects the evolutionary outcomes of the port–shipping collaborative emission reduction network game, we vary the initial target level ( e d = 100 ) by incrementally increasing or decreasing it, while holding all other parameter values constant. The corresponding simulation results are shown in Figure 8.
From Figure 8, the following conclusions can be drawn: Under low technology spillover conditions, the share of active emission reduction in the port–shipping sector first increases and then declines as the carbon emission reduction target intensifies. At lower target thresholds, the benefits of active emission reduction strategies, including enduring cost-effectiveness and operational adaptability, are more pronounced. This observation is consistent with the initial regulatory structures, exemplified by the early IMO DCS and China’s inaugural emission control area regulations, where moderate carbon reporting and emission limitations provided adequate incentives for ports and shipping firms to allocate resources to incremental active measures, such as basic shore power retrofits, speed optimization, and the adoption of low-sulfur fuels. Conversely, when targets are set too stringently, the high costs of emission-reduction technologies, such as ammonia fuel retrofits and large-scale carbon capture systems, put significant financial strain on port and shipping companies. This situation then encourages a strategic shift towards less active methods of reducing emissions.
In practice, this mirrors the concerns of industry stakeholders during the implementation of IMO’s Carbon Intensity Indicator (CII) rules: overly aggressive carbon reduction targets have led some small- and medium-sized shipping companies to rely on short-term passive measures (e.g., slow steaming, vessel idling) rather than long-term capital-intensive active investments, due to concerns over profitability and uncertain returns.
In contrast, under high technology spillover conditions, the share of active emission reduction in the port–shipping sector rises monotonically with increasing carbon emission reduction targets and remains substantially higher than that under low-spillover conditions. This is because higher technology spillovers will greatly enhance the additional benefits of active emission reduction, relieve the cost pressure, and promote active and coordinated emission reduction between ports and shipping companies. This trend is reflected in current policy initiatives designed to amplify technology spillovers alongside stringent targets: for example, the EU’s Fit for 55 package couples strict emission reduction targets with mechanisms for technology sharing (e.g., the Clean Energy Transition Fund and knowledge-sharing platforms for green port technologies), while China’s “14th Five-Year Plan for Transportation” links high carbon reduction requirements with subsidies for collaborative R&D in clean fuel bunkering and smart port systems. These policies leverage the advantages of advanced technology to lessen the financial burden of strict goals. This approach encourages collaboration between ports and shipping companies, prompting them to adopt sophisticated, proactive measures. These include the development of infrastructure for methanol and ammonia fuels, as well as the integration of smart energy management systems, rather than merely adhering to existing regulations.
  • Impact of government incentive subsidies
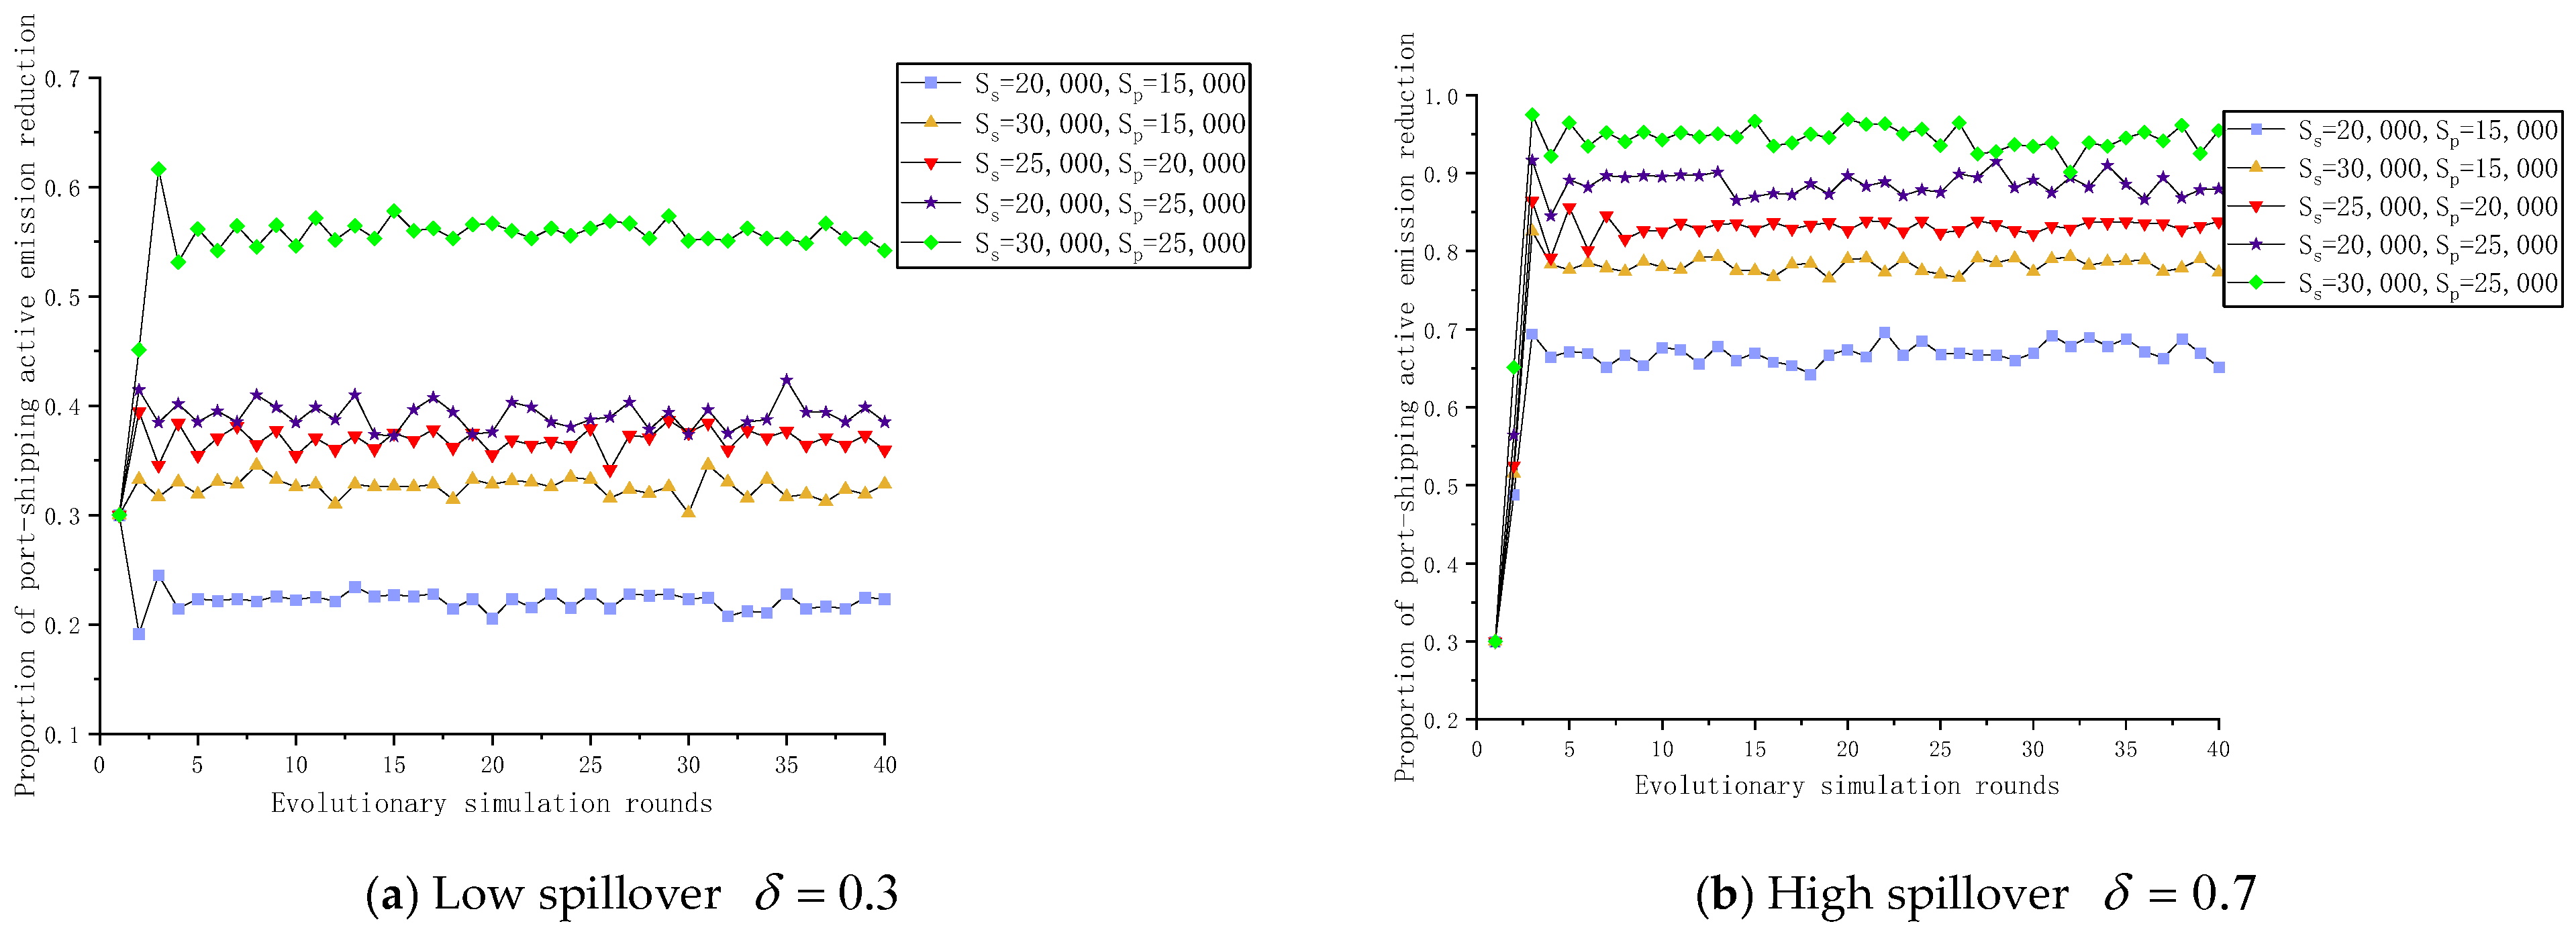
To examine the impact of government incentive subsidies ( S s S p ) on the evolutionary outcomes of the port–shipping collaborative emission reduction network game—under two distinct spillover scenarios—we systematically vary the initial subsidy levels ( S s =  25,000, S p =  20,000) upward or downward while holding all other parameter values constant. The corresponding simulation results are shown in Figure 9.
From Figure 9, the following conclusions can be drawn: Under conditions of low technology spillover, increasing government incentive subsidies enhances the proportion of active emission reduction in port shipping, though the overall magnitude remains relatively modest. This observation is consistent with nascent policy implementations, including China’s initial subsidies for shore power utilization and the European Union’s grants for small-scale port decarbonization. Under such circumstances, the limited technology diffusion implied that subsidies merely marginally reduced the upfront costs of proactive mitigation measures. These measures included important shore power infrastructure and the switch to low-sulfur fuels. Consequently, in the absence of robust technological synergies, subsidies proved ineffective in fostering the broad adoption of capital-intensive solutions, including LNG bunkering and clean fuel vessel retrofits, given the persistent uncertainty regarding the long-term advantages for both port authorities and shipping companies.
Conversely, under high technology spillover conditions, the increase of government incentive subsidies will lead to a sharp increase in the peak value of the proportion of active emission reduction. This mirrors current policy frameworks that pair high subsidies with technology-sharing mechanisms; for example, China’s “14th Five-Year Plan” provides large-scale subsidies for port-side clean energy infrastructure (e.g., methanol/LNG bunkering stations) alongside cross-enterprise technology sharing platforms, while the EU’s CEF Transport funding links subsidy eligibility to collaborative R&D in green shipping technologies. These policies leverage high technology spillovers to amplify subsidy effects, turning targeted incentives into widespread adoption of active emission reduction solutions.
In addition, by comparing the three sets of data curves in the middle, it can also be found that, when the port gets more incentives, it has a better effect on promoting the active emission reduction of port and shipping. This provides an important implication: appropriately tilting subsidy allocation toward ports can more effectively stimulate collaborative emission reduction in the port–shipping system, strengthen their enthusiasm for large-scale upgrading and transformation, and further improve the overall level of active emission reduction. All of the above results show that technology spillovers can cooperate with government incentives to relieve the great pressure of carbon emission reduction, thus encouraging ports and shipping companies to adopt active emission reduction.
  • Impact of unit carbon trading price in the carbon trading market
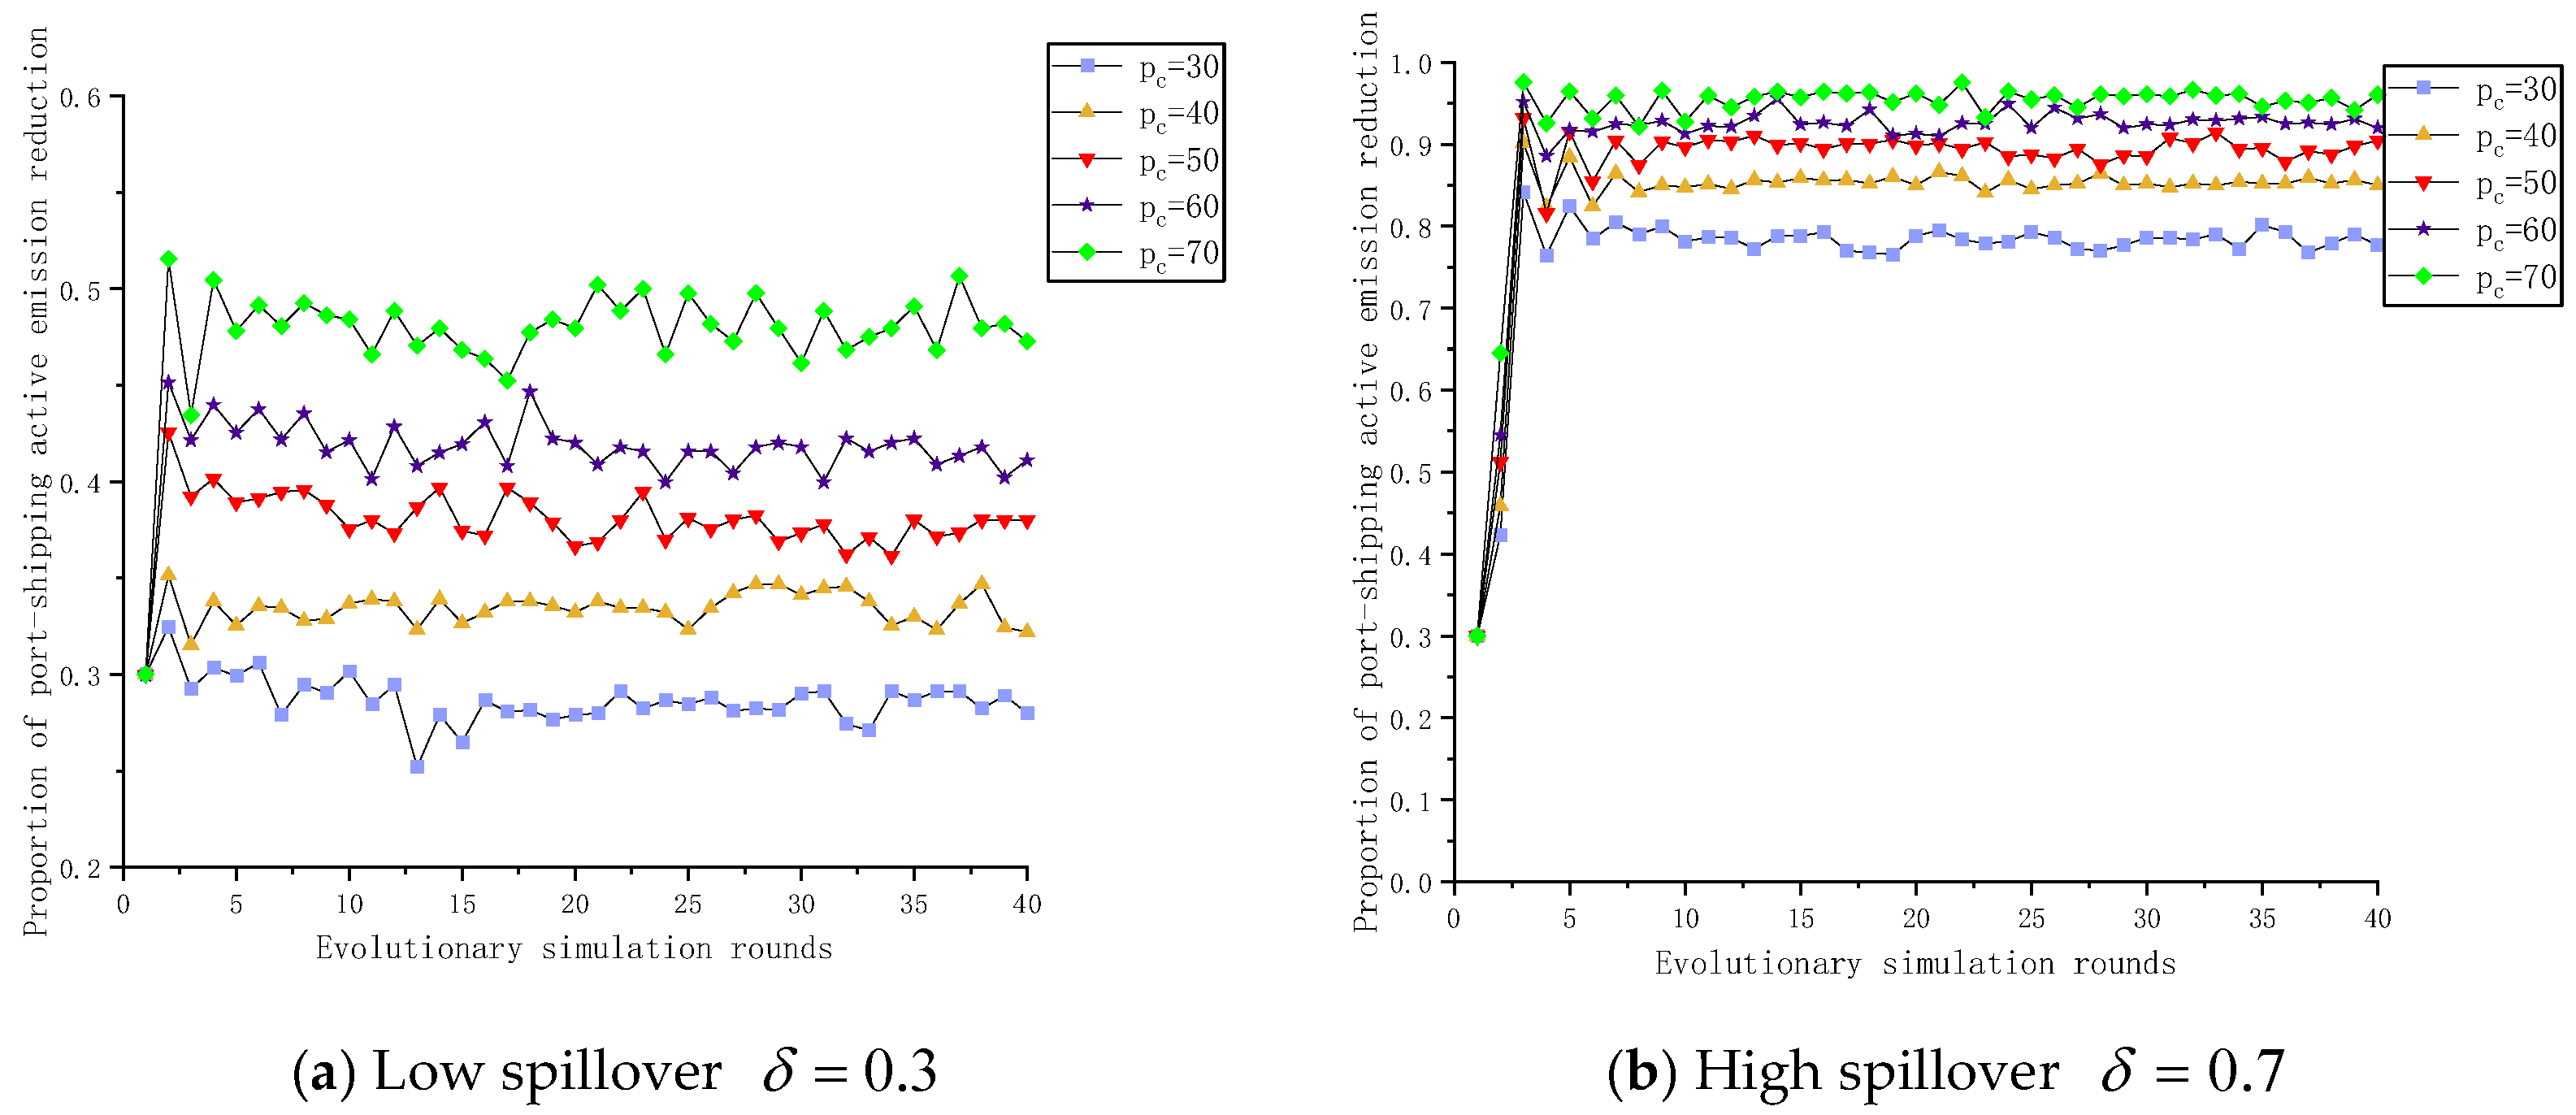
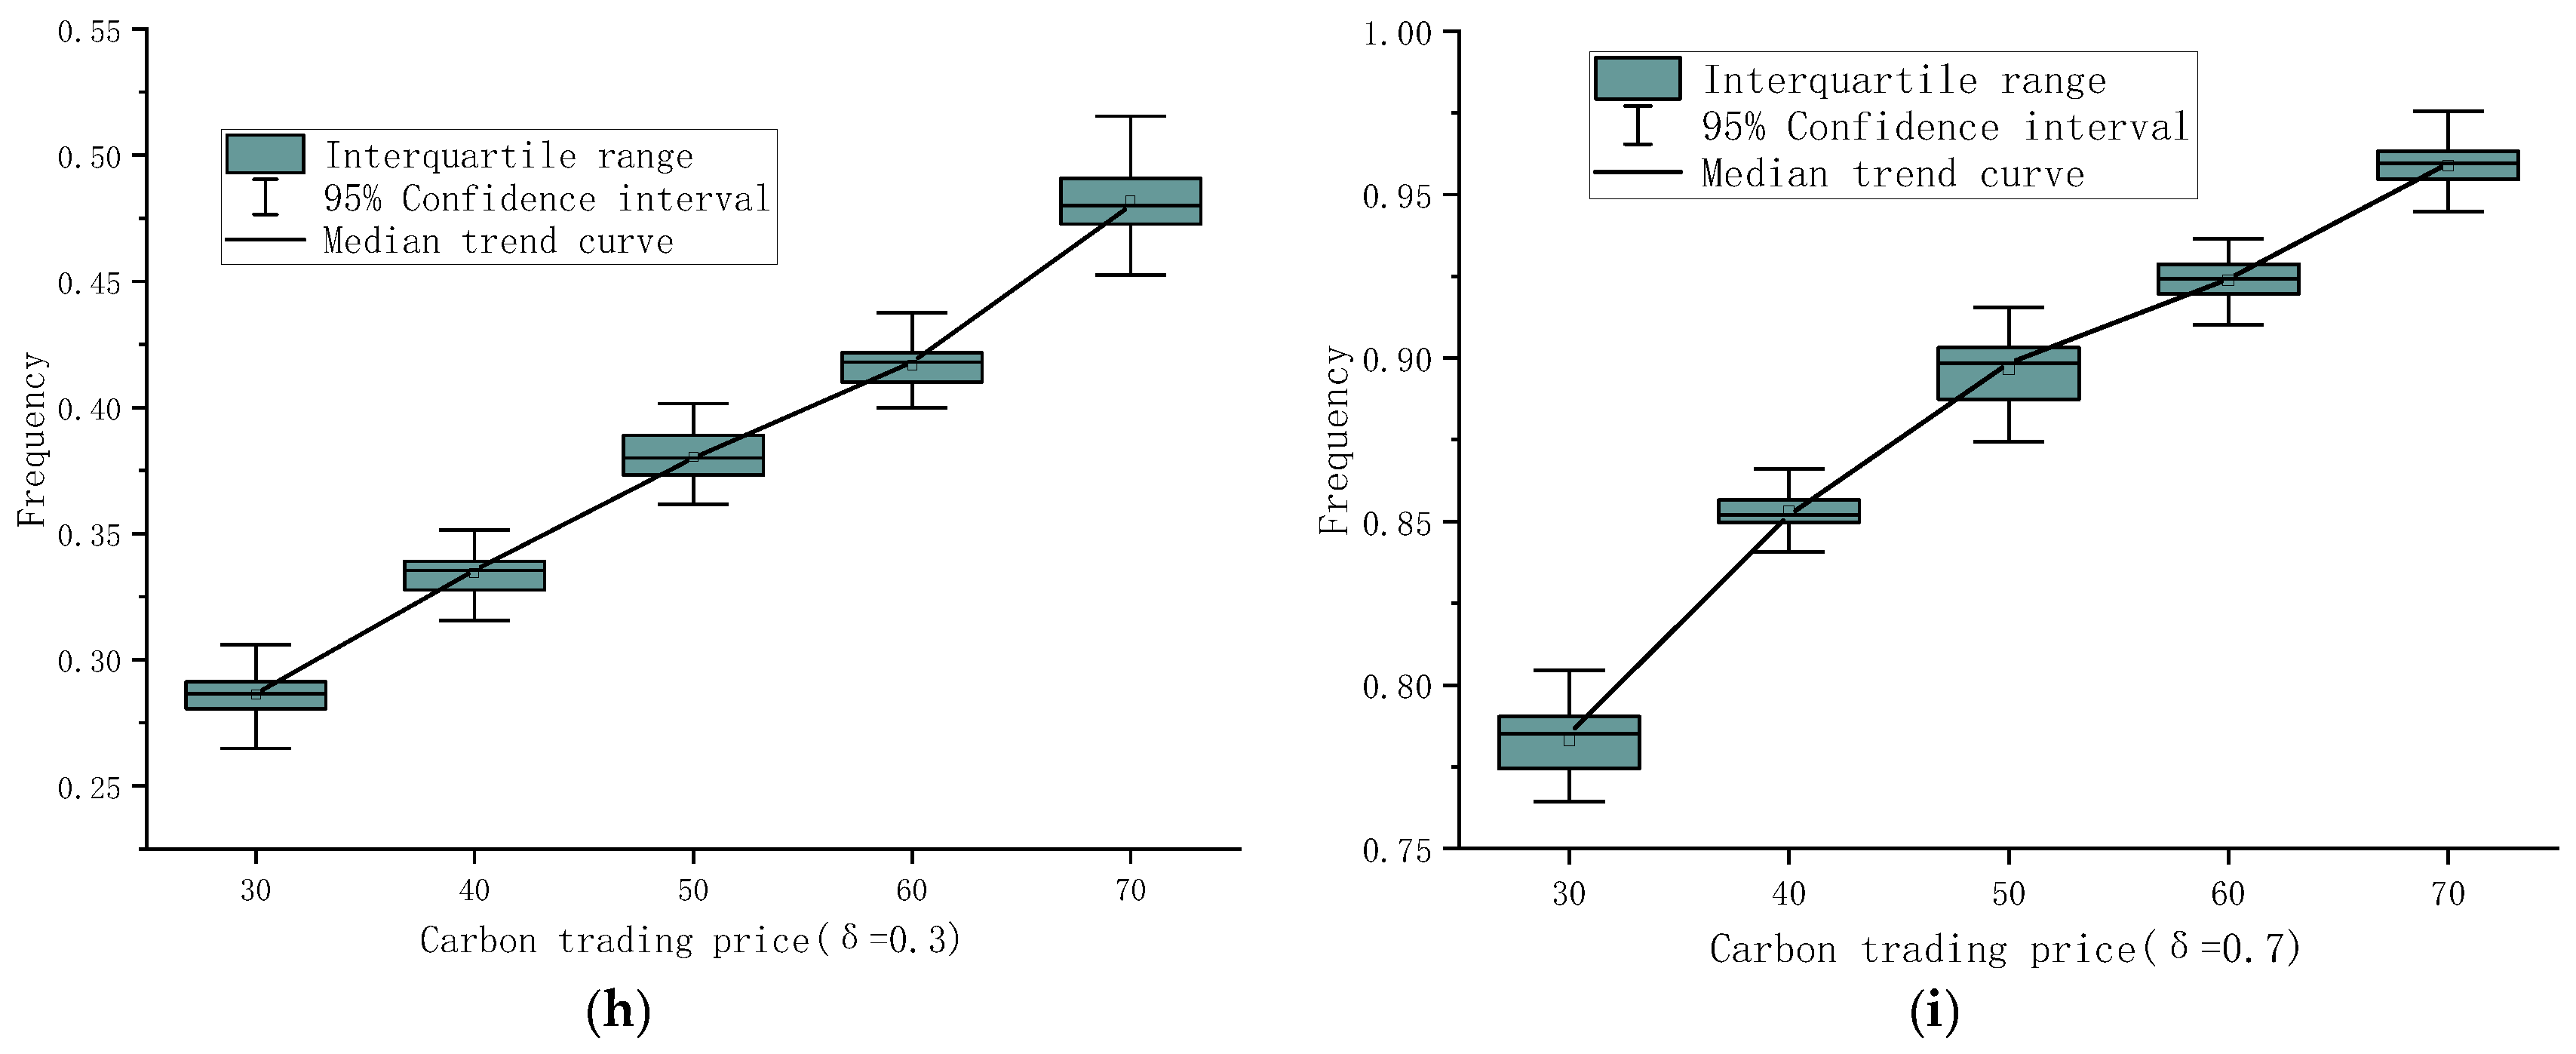
To examine the influence of the unit carbon trading price p c on the evolutionary outcomes of the port–shipping collaborative emission reduction network game—under two distinct spillover scenarios—we vary the initial price ( p c = 50 ) upward or downward while holding all other parameter values constant. The corresponding simulation results are shown in Figure 10.
From Figure 10, the following conclusions can be drawn: Under low vertical technology spillover conditions, an increase in carbon trading prices only marginally increases the proportion of port–shipping entities adopting active emission reduction strategies. The majority of port–shipping nodes continue to prefer passive emission reduction approaches. This outcome stems from the fact that ports derive minimal additional financial benefits from carbon trading—benefits that are insufficient to offset the substantial costs associated with implementing active emission reduction measures. This is consistent with the early stage of carbon trading implementation in China’s port and shipping industry, where carbon price signals have been weak and low technology diffusion has made it hard for ports and shipping companies to recover costs through carbon revenue alone, in turn meaning that most firms still choose low-cost passive measures such as slow steaming and low-sulfur fuel switching.
Conversely, under high vertical technology spillover conditions, a rise in carbon trading prices significantly increases the proportion of port–shipping nodes opting for active emission reduction strategies. At elevated carbon trading prices, ports stand to realize substantially greater net financial gains from active emission reductions, thereby incentivizing collaborative mitigation efforts across the port–shipping system. Even though the shipping companies’ profit calculations remain unchanged, they still use active strategies to reduce emissions, aiming to maximize their individual benefits. This is supported by current policy practices, such as the inclusion of shipping in the EU ETS and the gradual improvement of China’s national carbon market for transport. With higher carbon prices and stronger technology spillovers, the economic returns of active mitigation measures such as LNG/methanol bunkering, shore power, and energy-saving renovation have increased significantly, driving ports and shipping companies to carry out coordinated active emission reduction for higher carbon benefits and long-term sustainable development.
  • Robustness check of simulation outcomes
To better illustrate the stability and dispersion of the simulation results, the median values and 95% confidence intervals obtained from 40 randomly initialized simulations are presented in Figure 11. As shown in the figure, the results under different initial conditions cluster closely around the mean, with narrow confidence intervals, indicating that the derived average proportion results exhibit satisfactory stability and reliability, which in turn can effectively reflect the performance of the model under various random initial states.

5. Conclusions and Policy Implications

5.1. Conclusions

This study makes three key contributions to the literature on port–shipping collaborative emission reduction. First, it advances the collaborative emission reduction framework by integrating vertical technology spillovers and joint benefit–cost sharing mechanisms—thereby shifting scholarly attention beyond conventional horizontal spillovers and enriching the theoretical foundation of supply chain-level emission reduction spillover mechanisms. Second, methodologically, it innovatively combines an evolutionary game model with a scale-free complex network to simulate strategy diffusion and conduct multi-scenario parameter comparisons. This approach clarifies the distinct behavioral logics of core influencing factors and bridges the gap between abstract theoretical modeling and real-world implementation. Third, it empirically validates the pivotal leadership role of ports, uncovers the mechanism through which port-centric resource allocation drives low-carbon transformation, and addresses a critical gap in the literature regarding the heterogeneous emission reduction responsibilities of ports and shipping companies. Through systematic simulation analysis of the port–shipping collaborative emission reduction complex network, this study yields the following three core conclusions:

5.1.1. Active Emission Reduction Ratio Rises Then Falls with Vertical Technology Spillover

The proportion of ports and shipping enterprises adopting active emission reduction strategies first rises and then falls as the vertical technology spillover ratio increases. Specifically, an initial rise in vertical technology spillover significantly enhances the level of active emission reduction among such enterprises, primarily through technological synergy effects. However, when the degree of vertical technology spillover becomes excessively high, enterprises tend to over-rely on externally spilled technologies, thereby reducing their investment in independent innovation and collaborative R&D. Consequently, the proportion of enterprises implementing active emission reduction declines relative to that observed under a moderate spillover level. This finding underscores the idea that a moderate level of vertical technology spillover represents the optimal condition for driving the port–shipping system toward a high level of active emission reduction.

5.1.2. Core Factors Show Heterogeneous Impacts Under Different Spillover Scenarios

The benefit distribution coefficient, carbon emission reduction target, government incentive subsidies, and unit carbon trading price all exhibit significant heterogeneity in their effects on port–shipping collaborative emission reduction under high- versus low-technology spillover scenarios.
In the low-spillover scenario, the regulatory influence of all factors remains relatively weak: even benefit distribution yields only marginally superior outcomes compared with unbalanced distribution, yet the overall adoption rate of active emission reduction strategies remains low; the proportion of firms adopting active emission reduction first increases and then declines as emission reduction targets tighten, with excessively stringent targets inducing a strategic shift toward passive emission reduction. Additionally, though increases in government subsidies and carbon trading prices lead to modest improvements in the adoption rate of active emission reduction, low-cost passive measures—such as the use of low-sulfur fuel and navigation speed optimization—continue to dominate industry practice.
In the high-spillover scenario, all four factors exert pronounced positive effects: unbalanced benefit distribution proves more effective than even distribution in promoting active emission reduction; the proportion of active emission reduction rises monotonically with increasingly stringent emission reduction targets; higher government subsidies trigger a sharp increase in the peak adoption rate of active emission reduction; and rising carbon trading prices significantly incentivize collaborative, system-wide active emission reduction across the port–shipping sector, thereby fostering a market-driven emission reduction mechanism.

5.1.3. Port-Centric Allocation Boosts Overall Emission Reduction Level

Port-centric resource allocation and benefit orientation are pivotal to enhancing the overall level of active emission reduction across the port–shipping system. Ports serve as the central coordinating and leadership node within the collaborative emission reduction supply chain linking ports and shipping companies.
Under a high-spillover scenario, the proportion of active emission reduction in the port–shipping system remains consistently higher when collaborative emission reduction benefits and government incentive subsidies are directed preferentially toward ports, rather than toward shipping companies. Ports receiving greater benefit support and policy incentives demonstrate enhanced capacity for low-carbon infrastructure development and stronger motivation for collaborative innovation. Through industrial linkages, such ports can effectively incentivize shipping companies to modernize their fleets and adopt active emission reduction strategies.
In contrast, incentive policies centered on shipping companies generate only limited spillover effects on low-carbon infrastructure investment at the port level, thereby constraining the system-wide advancement of collaborative active emission reduction. This finding underscores the irreplaceable role of ports as the “core node” of the port–shipping supply chain in driving industrial low-carbon transformation.

5.2. Policy Implications

Based on the above findings, the following policy recommendations and implications for the shipping sector in the context of new energy are proposed:

5.2.1. Policy Recommendations for the Stage with Low Initial Technology Spillover

At this stage, the marginal benefits of active emission reduction fall short of offsetting associated implementation costs, prompting most enterprises to adopt passive—rather than proactive—emission reduction strategies. Therefore, policy development should prioritize three interconnected goals: reducing costs, promoting fairness, and creating realistic, context-specific emission reduction targets.
First, a fair system for sharing benefits in port–shipping partnerships must be established. This requires a clear definition of how costs and benefits are distributed for investments in green infrastructure, which will help align the long-term interests of ports and shipping companies.
Second, emission reduction targets should be differentiated by enterprise size and operational profile. For small- and medium-sized enterprises (SMEs), emphasis should be placed on implementing low-cost, foundational active measures—such as energy-efficient equipment upgrades or optimized logistics scheduling—rather than imposing uniform, high-intensity obligations.
Third, we suggest offering financial subsidies designed to be accessible and easy to navigate. These should specifically target cost-effective solutions, such as the use of shore power.

5.2.2. Policy Recommendations for the Stage with Mature Technology and Pronounced Spillover

At this stage, technological synergy emerges, and the net benefits of active emission reduction surpass associated costs—rendering it the optimal window for scaling up such strategies. Policy design should therefore prioritize amplifying positive spillover effects, strategically reallocating resources toward ports, and integrating ambitious, internationally aligned emission reduction targets with institutionalized technology sharing.
First, policymakers should direct technology spillovers to maintain an optimal level—neither excessive nor insufficient—by establishing open, collaborative platforms for non-core technologies while simultaneously protecting core innovative assets through strong intellectual property safeguards.
Second, the distribution of benefits and the allocation of subsidies should be strategically designed to favor port facilities. This will help strengthen their leadership and improve how they work with different sectors.
Third, national emission reduction targets should be elevated to conform with leading international standards; compliance with these targets must be formally linked to mandatory technology transfer by large enterprises, accompanied by transparent, performance-based financial compensation to offset associated R&D and implementation costs.
Fourth, carbon pricing in the port and shipping sector should be increased, the coverage of the carbon market expanded to include more maritime-related activities, and adherence to carbon quota requirements explicitly tied to investments in active emission reduction measures.
Moreover, the central coordinating role of ports remains indispensable across both developmental stages. To institutionalize this function, ports should be formally designated as decarbonization coordination centers; port-led industry associations should be established to facilitate multi-stakeholder collaboration; and coordination capacity—including governance, data integration, and intermodal alignment—should be explicitly incorporated into the green port evaluation framework.

5.3. Future Works

This study still has several limitations that can be addressed in future research. First, the spillover transmission mechanism is mainly reflected through parameter settings rather than a complete modeling of technology diffusion processes. Second, the model is simplified and ignores the realistic differences between ports and shipping companies, including cost structures, scale, investment capacity, and technological benefits. In addition, this study relies on theoretical simulation and lacks empirical tests based on real micro-data of ports and shipping companies.
Future research can explicitly model the transmission process of vertical technology spillovers; consider the heterogeneity of actors in terms of cost, scale, investment capacity and technical benefits; and use real micro-data for empirical testing to improve the theoretical rigor and practical applicability of the model.

Author Contributions

Conceptualization, L.S. and X.P.; software, X.P. and X.L.; validation, X.P.; formal Analysis, X.L. and T.K.; investigation, L.S., X.L. and Y.W.; writing—original draft preparation, X.P. and X.L.; writing—review and editing, L.S., T.K. and Y.W.; supervision, L.S.; funding acquisition, L.S. All authors have read and agreed to the published version of the manuscript.

Funding

This project is partially supported by the Liaoning Province social science planning Fund of China (L22AGL006).

Institutional Review Board Statement

Not applicable.

Informed Consent Statement

Not applicable.

Data Availability Statement

All relevant data are provided within the manuscript.

Acknowledgments

The authors wish to express their gratitude to the funding body for financial support.

Conflicts of Interest

The authors declare no conflicts of interest.

References

  1. Ye, J.; Chen, J.; Zhou, J.S. Novel synergy mechanism for carbon emissions abatement in shipping decarbonization. Transp. Res. Part D Transp. Environ. 2024, 127, 104051–104059. [Google Scholar] [CrossRef]
  2. Zhao, C.; Guo, Q.D.; Zuo, M.; He, M.K. Multi-Scenario Tripartite Evolutionary Game Analysis of Emission Reduction Strategies in the Contract Manufacturing Industry: A Dual-Carbon Perspective on Local Government–Foreign Brand Owner Interactions. Chin. J. Manag. Sci. 2023, 31, 35–44. [Google Scholar] [CrossRef]
  3. Tang, Z.; Wang, L. Shipping decarbonization and public emergencies: How does COVID-19 impact container shipping carbon emissions? J. Transp. Geogr. 2025, 123, 104124. [Google Scholar] [CrossRef]
  4. Peng, H.; Wang, M.; An, C.J. Implied threats of the Red Sea crisis to global maritime transport: Amplified carbon emissions and possible carbon pricing dysfunction. Environ. Res. Lett. 2024, 19, 074053. Available online: https://iopscience.iop.org/article/10.1088/1748-9326/ad59b7 (accessed on 17 October 2025). [CrossRef]
  5. Sea Cargo Charter. 2025 Annual Disclosure Report; Sea Cargo Charter: Copenhagen, Denmark, 2025; Available online: https://www.seacargocharter.org/wp-content/uploads/2025/06/SCC-Annual-Disclosure-Report-2025.pdf (accessed on 12 October 2025).
  6. Van Hoecke, L.; Laffineur, L.; Campe, R.; Perreault, P.; Verbruggen, S.W.; Lenaerts, S. Challenges in the use of hydrogen for maritime applications. Energy Environ. Sci. 2021, 14, 815–843. Available online: https://pubs.rsc.org/en/content/articlelanding/2021/ee/d0ee01545h (accessed on 4 March 2025). [CrossRef]
  7. Inal, O.B.; Deniz, C.; Kazmerski, L. Hybrid power and propulsion systems for ships: Current status and future challenges. Renew. Sustain. Energy Rev. 2022, 156, 111965. [Google Scholar] [CrossRef]
  8. Stark, C.; Xu, Y.; Zhang, M.; Yuan, Z.; Tao, L.; Shi, W. Study on Applicability of Energy-Saving Devices to Hydrogen Fuel Cell-Powered Ships. J. Mar. Sci. Eng. 2022, 10, 388. [Google Scholar] [CrossRef]
  9. Wang, Y.; Cao, Q.; Liu, L.; Wu, Y.; Liu, H.; Gu, Z.; Zhu, C. A review of low and zero carbon fuel technologies: Achieving ship carbon reduction targets. Sustain. Energy Technol. Assess. 2022, 54, 102762. [Google Scholar] [CrossRef]
  10. Xu, L.; Chen, Y.L. Overview of Sustainable Maritime Transport Optimization and Operations. Sustainability 2025, 17, 6460. [Google Scholar] [CrossRef]
  11. Ban, D.; Bebić, J. An introduction of future fuels on working ship for GHGs reduction: Trailing suction hopper dredger case study. J. Clean. Prod. 2023, 405, 137008. [Google Scholar] [CrossRef]
  12. Ahmed, S.; Li, T.; Yi, P.; Chen, R. Environmental impact assessment of green ammonia-powered very large tanker ship for decarbonized future shipping operations. Renew. Sustain. Energy Rev. 2023, 188, 113774. [Google Scholar] [CrossRef]
  13. Tomos, B.A.D.; Stamford, L.; Welfle, A.; Larkin, A. Decarbonising international shipping—A life cycle perspective on alternative fuel options. Energy Convers. Manag. 2024, 299, 117848. [Google Scholar] [CrossRef]
  14. Malmgren, E.; Brynolf, S.; Fridell, E.; Grahn, M.; Andersson, K. The environmental performance of a fossil-free ship propulsion system with onboard carbon capture—A life cycle assessment of the HyMethShip concept. Sustain. Energy Fuels 2021, 5, 2753–2770. [Google Scholar] [CrossRef]
  15. Holder, D.; Percy, S.D.; Yavari, A. A Review of Port Decarbonisation Options: Identified Opportunities for Deploying Hydrogen Technologies. Sustainability 2024, 16, 3299. [Google Scholar] [CrossRef]
  16. Wang, W.; Huo, Q.; Liu, Q.; Ni, J.; Zhu, J.; Wei, T. Energy Optimal Dispatching of Ports Multi-Energy Integrated System Considering Optimal Carbon Flow. IEEE Trans. Intell. Transp. Syst. 2024, 25, 4181–4191. [Google Scholar] [CrossRef]
  17. Pivetta, D.; Dall Armi, C.; Sandrin, P.; Bogar, M.; Taccani, R. The role of hydrogen as enabler of industrial port area decarbonization. Renew. Sustain. Energy Rev. 2024, 189, 113912. [Google Scholar] [CrossRef]
  18. C40 Cities. The Green Shipping Corridor Connecting Los Angeles, Long Beach, and Shanghai Has Successfully Achieved the Milestone Objectives of Its First Phase. Available online: https://www.c40.org/zh-CN/news/los-angeles-long-beach-and-shanghai-green-shipping-corridor-successfully-complete-phase-one-milestone-targets/ (accessed on 25 December 2025).
  19. Port Circle. Singapore Port Achieves Simultaneous Methanol Bunkering and Cargo Handling Operations. Available online: https://news.csi.com.cn/d3be151b-be5a-4438-b250-eb15672471b8.html (accessed on 25 December 2025).
  20. Dolatabadi, S.H.; Masodzadeh, P.G.; Ishaq, H.; Crawford, C. Green shipping corridors: An overview of Pacific Northwest region and key ports. Ocean. Coast. Manag. 2025, 269, 107745. [Google Scholar] [CrossRef]
  21. Hydrogen-Energy Outlook. Signing Ceremony Held for the World’s First Intercontinental Liquid Hydrogen Corridor. Available online: https://www.ne21.com/news/show-212346.html (accessed on 25 December 2025).
  22. Seck, G.S.; Hache, E.; Sabathier, J.; Guedes, F.; Reigstad, G.A.; Straus, J.; Wolfgang, O.; Ouassou, J.A.; Askeland, M.; Hjorth, I.; et al. Hydrogen and the decarbonization of the energy system in Europe in 2050: A detailed model-based analysis. Renew. Sustain. Energy Rev. 2022, 167, 112779. [Google Scholar] [CrossRef]
  23. Xu, L.; Wang, C.; Li, H. Decision and coordination of low-carbon supply chain considering technological spillover and environmental awareness. Sci. Rep. 2017, 7, 3107–3114. [Google Scholar] [CrossRef]
  24. Cellini, R.; Lambertini, L. Dynamic R&D with spillovers: Competition vs cooperation. J. Econ. Dyn. Control 2009, 33, 568–582. [Google Scholar] [CrossRef]
  25. Liu, Z.; Qian, Q.; Hu, B.; Shang, W.; Li, L.; Zhao, Y.; Zhao, Z.; Han, C. Government regulation to promote coordinated emission reduction among enterprises in the green supply chain based on evolutionary game analysis. Resour. Conserv. Recycl. 2022, 182, 106290. [Google Scholar] [CrossRef]
  26. Jo, S.; Na, H.S.; Yoon, S.; Kweon, S.J. An integrated framework for solving the green supplier selection and order allocation problem in steam procurement. Expert Syst. Appl. 2026, 312, 131386. [Google Scholar] [CrossRef]
  27. Xue, Y.; Lai, K.; Wang, C. How to invest decarbonization technology in shipping operations? Evidence from a game-theoretic investigation. Ocean Coast. Manag. 2024, 251, 107076. [Google Scholar] [CrossRef]
  28. Yang, L.; Cai, Y.; Wei, Y.; Huang, S. Choice of technology for emission control in port areas: A supply chain perspective. J. Clean. Prod. 2019, 240, 118101–118105. [Google Scholar] [CrossRef]
  29. Takebayashi, K. The effects of vertical integration and carbon tax on supply chain performance and economic welfare in the maritime industry. Marit. Policy Manag. 2025, 52, 208–228. [Google Scholar] [CrossRef]
  30. Meng, L.; Qu, H.; Wang, X.; Yan, W. Vertical cooperation strategy of ports and shipping companies considering emission reduction. Comput. Ind. Eng. 2025, 207, 111357. [Google Scholar] [CrossRef]
  31. Liu, J.G.; Kong, Y.D.; Zhen, L. A Study on Sustainable Investment in Port–Shipping Supply Chains Considering Dual Equilibria. Chin. J. Manag. Sci. 2022, 30, 142–153. [Google Scholar] [CrossRef]
  32. Meng, L.; Liu, K.; He, J.; Han, C.; Liu, P. Carbon emission reduction behavior strategies in the shipping industry under government regulation: A tripartite evolutionary game analysis. J. Clean. Prod. 2022, 378, 134556. [Google Scholar] [CrossRef]
  33. Gao, Y.Y.; Gao, J. Evolutionary Game Analysis of Value Co-Creation between Local Governments and Ports. J. Shanghai Marit. Univ. 2022, 43, 71–77. [Google Scholar] [CrossRef]
  34. Ye, J.; Huang, X.; Chen, W. Diffusion of low-carbon shipping along the 21st century maritime silk road: From complex network perspective. Ocean Coast. Manag. 2025, 266, 107662. [Google Scholar] [CrossRef]
  35. Liu, J.; Lyu, Y.; Wu, J.; Wang, J. Adoption strategies of carbon abatement technologies in the maritime supply chain: Impact of demand information sharing. Int. J. Logist. Res. Appl. 2022, 28, 70–97. [Google Scholar] [CrossRef]
  36. Wang, W. A Study on Competitive–Cooperative Decision-Making in Port–Shipping Supply Chains Considering Green Technology Investment and Sharing. Logist. Technol. 2025, 44, 37–48. [Google Scholar] [CrossRef]
  37. Yin, C.; Ji, J.; Huang, Z. Examining the technological collaboration network for green shipping technologies in sustainable transition: Insights from a global patent analysis. Res. Transp. Bus. Manag. 2026, 65, 101586. [Google Scholar] [CrossRef]
  38. Meng, Q.; Di, Q.; Liu, Y.; Chen, X. How New Quality Productivity Becomes a New Driving Force for Marine Economy High-Quality Development: An Empirical Analysis Based on New Technology, New Forms, and New Economy. Water 2025, 17, 987. [Google Scholar] [CrossRef]
  39. Sun, W.W.; Zhang, Z. A Game-Theoretic Study on the Diffusion of Electric Vehicle Innovation Based on Complex Networks. Complex Syst. Complex. Sci. 2024, 21, 45–51. [Google Scholar] [CrossRef]
  40. Wang, L.; Ma, Q.Q.; Yang, J.; Zheng, J.J. A Study on the Impact of Green Consumers on the Diffusion of New Energy Vehicles Based on Evolutionary Game Theory in Complex Networks. Chin. J. Manag. Sci. 2022, 30, 74–85. [Google Scholar] [CrossRef]
  41. Chen, F.; Wu, B.; Lou, W.; Zhu, B. Impact of dual-credit policy on diffusion of technology R & D among automakers: Based on an evolutionary game model with technology-spillover in complex network. Energy 2024, 303, 132019. [Google Scholar] [CrossRef]
  42. Li, F.Y.; Su, Q.; Zhang, Z.M. A Study on the Diffusion of Blockchain Technology Based on Complex Networks—Incorporating the Influences of Government, Enterprise, and Consumer Preferences. Sci. Technol. Manag. Res. 2025, 45, 165–174. [Google Scholar]
  43. Dugoua, E.; Dumas, M. Coordination dynamics between fuel cell and battery technologies in the transition to clean cars. Proc. Natl. Acad. Sci. USA 2024, 121, e1976362175. [Google Scholar] [CrossRef]
  44. Li, Z.; Wang, L.; Wang, G.; Xin, X.; Chen, K.; Zhang, T. Investment and subsidy strategy for low-carbon port operation with blockchain adoption. Ocean Coast. Manag. 2024, 248, 106966. [Google Scholar] [CrossRef]
  45. Zeng, Y.; Dong, P.; Shi, Y.; Wang, L.; Li, Y. Analyzing the co-evolution of green technology diffusion and consumers’ pro-environmental attitudes: An agent-based model. J. Clean. Prod. 2020, 256, 120384. [Google Scholar] [CrossRef]
  46. Yang, M.; Chen, H.; Long, R.; Sun, Q.; Yang, J. How does government regulation promote green product diffusion in complex network? An evolutionary analysis considering supply side and demand side. J. Environ. Manag. 2022, 318, 115642. [Google Scholar] [CrossRef]
  47. Qu, G.H.; Wang, Y.F.; Xu, L.; Qu, W.H.; Zhang, Q.; Xu, Z.S. Low-Carbon Supply Chain Emission Reduction Strategy Considering the Supervision of Downstream Enterprises Based on Evolutionary Game Theory. Sustainability 2021, 13, 2827. [Google Scholar] [CrossRef]
  48. Wang, L.; Zheng, J. Research on low-carbon diffusion considering the game among enterprises in the complex network context. J. Clean. Prod. 2019, 210, 1–11. [Google Scholar] [CrossRef]
  49. Gay, B.; Dousset, B. Innovation and network structural dynamics: Study of the alliance network of a major sector of the biotechnology industry. Res. Policy 2005, 34, 1457–1475. [Google Scholar] [CrossRef]
  50. Chen, Y.H.; Ma, M.M.; Mi, J.J. The impact of R&D investment on the new orders received by the shipbuilding enterprises under the background of innovation-driven development. J. Mar. Eng. Technol. 2024, 23, 247–258. [Google Scholar] [CrossRef]
  51. Du, S.X.; Chen, S.H.; Su, H.H. Research on Emission Reduction Decision of Construction Supply Chain Considering Carbon Emission Reduction Technology Spillover Under Carbon Trading Policy. J. Eng. Manag. 2024, 38, 59–64. [Google Scholar] [CrossRef]
  52. Shi, X.; Dong, C.; Zhang, C.; Zhang, X. Who should invest in clean technologies in a supply chain with competition? J. Clean. Prod. 2019, 215, 689–700. [Google Scholar] [CrossRef]
  53. Wang, W.; Chen, L.H.; Gong, T.X. Wholesale Price Commitment and R&D Collaboration Strategy under Technology Spillovers. Syst. Eng. 2015, 33, 7. [Google Scholar]
  54. Cheng, Z.; Li, L.; Liu, J. The emissions reduction effect and technical progress effect of environmental regulation policy tools. J. Clean. Prod. 2017, 149, 191–205. [Google Scholar] [CrossRef]
  55. Li, W.; Hu, Z. Pathways in the governance of shipping decarbonization from perspective of balancing the conflicting interests. Front. Mar. Sci. 2024, 11, 1479528. [Google Scholar] [CrossRef]
  56. Zhang, G.; Xu, J.; Zhang, Z.; Chen, W. Optimal decision-making and coordination of the shipping logistics service supply chain cooperation mode under the carbon quota and trading mechanism. Ocean Coast. Manag. 2024, 255, 107240. [Google Scholar] [CrossRef]
  57. Wang, Q.; Wang, H.; Zhang, Z.; Li, Y.; Liu, Y.; Perc, M. Heterogeneous investments promote cooperation in evolutionary public goods games. Phys. A Stat. Mech. Its Appl. 2018, 502, 570–575. [Google Scholar] [CrossRef]
Figure 1. Phase diagram of the shipping company strategy evolution.
Sustainability 18 03345 g001
Figure 2. Phase diagram of the port’s strategy evolution.
Sustainability 18 03345 g002
Figure 3. Complex network initialization and node connection diagram.
Sustainability 18 03345 g003
Figure 4. Strategy update diagram of port and shipping network nodes.
Sustainability 18 03345 g004
Figure 5. Schematic diagram illustrating the active coordination of port–shipping network emission reduction strategies.
Sustainability 18 03345 g005
Figure 6. The impact of technology spillover on the proportion of active emissions reduction in the ports and shipping companies.
Sustainability 18 03345 g006
Figure 7. The impact of the benefit distribution coefficient on the proportion of active emissions reduction in the port and shipping company.
Sustainability 18 03345 g007
Figure 8. The impact of the carbon emission reduction target level on the proportion of active emissions reduction in the port and shipping company.
Sustainability 18 03345 g008
Figure 9. The impact of government incentive grants on the proportion of active emissions reduction in the port and the shipping company.
Sustainability 18 03345 g009
Figure 10. The impact of the carbon trading price on the proportion of active emissions reduction in the port and shipping company.
Sustainability 18 03345 g010
Figure 11. Robustness check of simulation outcomes based on confidence intervals.
Sustainability 18 03345 g011aSustainability 18 03345 g011b
Table 1. A comparison of the related literature.
Maritime Supply Chain New Energy Fuels Vertical CooperationComplex
Network
Emission ReductionTechnology Spillover
Xue et al. [27]
Takebayashi et al. [29]
Meng L. et al. [30]
Liu et al. [31]
Meng L. et al. [32]
Ye et al. [34]
Liu et al. [35]
Wang W. [36]
Yin et al. [37]
Wang L. et al. [40]
Chen et al. [41]
This study
Table 2. Parameter setting table.
ParameterDescription
x Probability of shipping company choosing active emission reduction
y Probability of ports choosing active emission reduction
q Market scale
R Benefit when both ports and shipping company actively collaborate on emission reduction
R Benefit when either ports or shipping company choose passive emission reduction
ω Benefit distribution ratio of shipping company from collaborative emission reduction
ρ Proportion of investment cost borne by shipping company when both parties choose active emission reduction
m Investment cost coefficient of port–shipping collaborative emission reduction
e d Carbon reduction target level required for port–shipping collaborative emission reduction based on new energy
K Free carbon quota of ports
p c Unit price of carbon trading
e m Unit carbon emission within port operation area
δ Vertical technology spillover level of new energy between ports and shipping company when both choose active emission reduction
ε 1 Coefficient of shipping company’s profit increment from technology spillover
ε 2 Coefficient of port’s profit increment from technology spillover
φ Technology spillover absorption coefficient
O s Additional profit of shipping company from reallocating resources to other businesses when choosing passive emission reduction
O p Additional profit of ports from reallocating resources to other businesses when choosing passive emission reduction
S s Government incentive subsidy for shipping company choosing active emission reduction
S p Government incentive subsidy for ports choosing active emission reduction
F s Government penalty for shipping company failing to meet emission reduction targets due to passive emission reduction
F p Government penalty for ports failing to meet emission reduction targets due to passive emission reduction
Table 3. Profit matrix table.
Port
Active Emission Reduction  y Passive   Emission   Reduction   1 y
Shipping companyActive emission reduction x ω R ρ m e d 2 2 + S s + ε 1 δ e d R ( 1 ω ) R ( 1 ρ ) m e d 2 2 + S p + p c ( K q e m + e d ) + ε 2 δ e d R ω R ρ m e d 2 2 ( 1 ω ) R F p + p c ( K q e m ) + O p
Passive emission reduction 1 x ω R F s + O s ( 1 ω ) R ( 1 ρ ) m e d 2 2 + p c ( K q e m ) ω R F s + O s ( 1 ω ) R F p + p c ( K q e m ) + O p
Table 4. Local equilibrium point analysis table.
Equilibrium Point D e t ( J ) T r ( J )
E 1 ( 0 , 0 ) ( F s ρ m e d 2 2 O s ) [ F p ( 1 ρ ) m e d 2 2 O p ] ( F s ρ m e d 2 2 O s ) + [ F p ( 1 ρ ) m e d 2 2 O p ]
E 2 ( 0 , 1 ) [ ε 1 δ e d R + S s + F s ρ m e d 2 2 O s + ω ( R R ) ] [ F p ( 1 ρ ) m e d 2 2 O p ] [ ε 1 δ e d R + S s + F s ρ m e d 2 2 O s + ω ( R R ) ] [ F p ( 1 ρ ) m e d 2 2 O p ]
E 3 ( 1 , 0 ) ( F s ρ m e d 2 2 O s ) [ ( ε 2 δ e d R + p c e d ) + ( 1 ω ) ( R R ) + S p + F p ( 1 ρ ) m e d 2 2 O p ] ( F s ρ m e d 2 2 O s ) + [ ( ε 2 δ e d R + p c e d ) + ( 1 ω ) ( R R ) + S p + F p ( 1 ρ ) m e d 2 2 O p ]
E 4 ( 1 , 1 ) [ ε 1 δ e d R + S s + ω ( R R ) + F s ρ m e d 2 2 O s ] [ ( ε 2 δ e d R + p c e d ) + ( 1 ω ) ( R R ) + S p + F p ( 1 ρ ) m e d 2 2 O p ] [ ε 1 δ e d R + S s + ω ( R R ) + F s ρ m e d 2 2 O s ] [ ( ε 2 δ e d R + p c e d ) + ( 1 ω ) ( R R ) + S p + F p ( 1 ρ ) m e d 2 2 O p ]
Table 5. Parameter value settings table.
ParameterDescriptionValueUnit
x Probability of shipping company choosing active emission reduction0.5None
y Probability of ports choosing active emission reduction0.5None
q Market scale500TEU
R Benefit when both ports and shipping company actively collaborate on emission reduction200,000Yuan
R Benefit when either ports or shipping company choose passive emission reduction160,000None
ω Benefit distribution ratio of shipping company from collaborative emission reduction0.5None
ρ Proportion of investment cost borne by shipping company when both parties choose active emission reduction0.5None
m Investment cost coefficient of port–shipping collaborative emission reduction31 [45,50]None
e d Carbon reduction target level required for port–shipping collaborative emission reduction based on new energy100 [28] tCO2e
K Free carbon quota of ports500tCO2e
p c Unit price of carbon trading50Yuan/TEU
e m Unit carbon emission within port operation area0.5tCO2e/TEU
δ Vertical technology spillover level of new energy between ports and shipping company when both choose active emission reduction0.6None
ε 1 Coefficient of shipping company’s profit increment from technology spillover0.006 [51]None
ε 2 Coefficient of port’s profit increment from technology spillover0.006 [51]None
φ Technology spillover absorption coefficient0.05 [52,53]None
O s Additional profit of shipping company from reallocating resources to other businesses when choosing passive emission reduction70,000Yuan
O p Additional profit of ports from reallocating resources to other businesses when choosing passive emission reduction65,000Yuan
S s Government incentive subsidy for shipping company choosing active emission reduction25,000 [54,55]Yuan
S p Government incentive subsidy for ports choosing active emission reduction20,000 [54,55]Yuan
F s Government penalty for shipping company failing to meet emission reduction targets due to passive emission reduction20,000 [56]Yuan
F p Government penalty for ports failing to meet emission reduction targets due to passive emission reduction18,000 [56]Yuan
h 0 Initial number of network nodes3Constant
h Number of connections for new nodes3Constant
η Initial proportion of active collaboration0.3None
N Total number of nodes in the network200Constant
κ Fermi dynamics noise parameter0.1 [57]None
Disclaimer/Publisher’s Note: The statements, opinions and data contained in all publications are solely those of the individual author(s) and contributor(s) and not of MDPI and/or the editor(s). MDPI and/or the editor(s) disclaim responsibility for any injury to people or property resulting from any ideas, methods, instructions or products referred to in the content.