Unlocking Natural Capital Through Land Tenure Reform and Spatial Reconfiguration: Evidence from the “Spatial-First” Mode in Nanhai, China

Abstract
1. Introduction
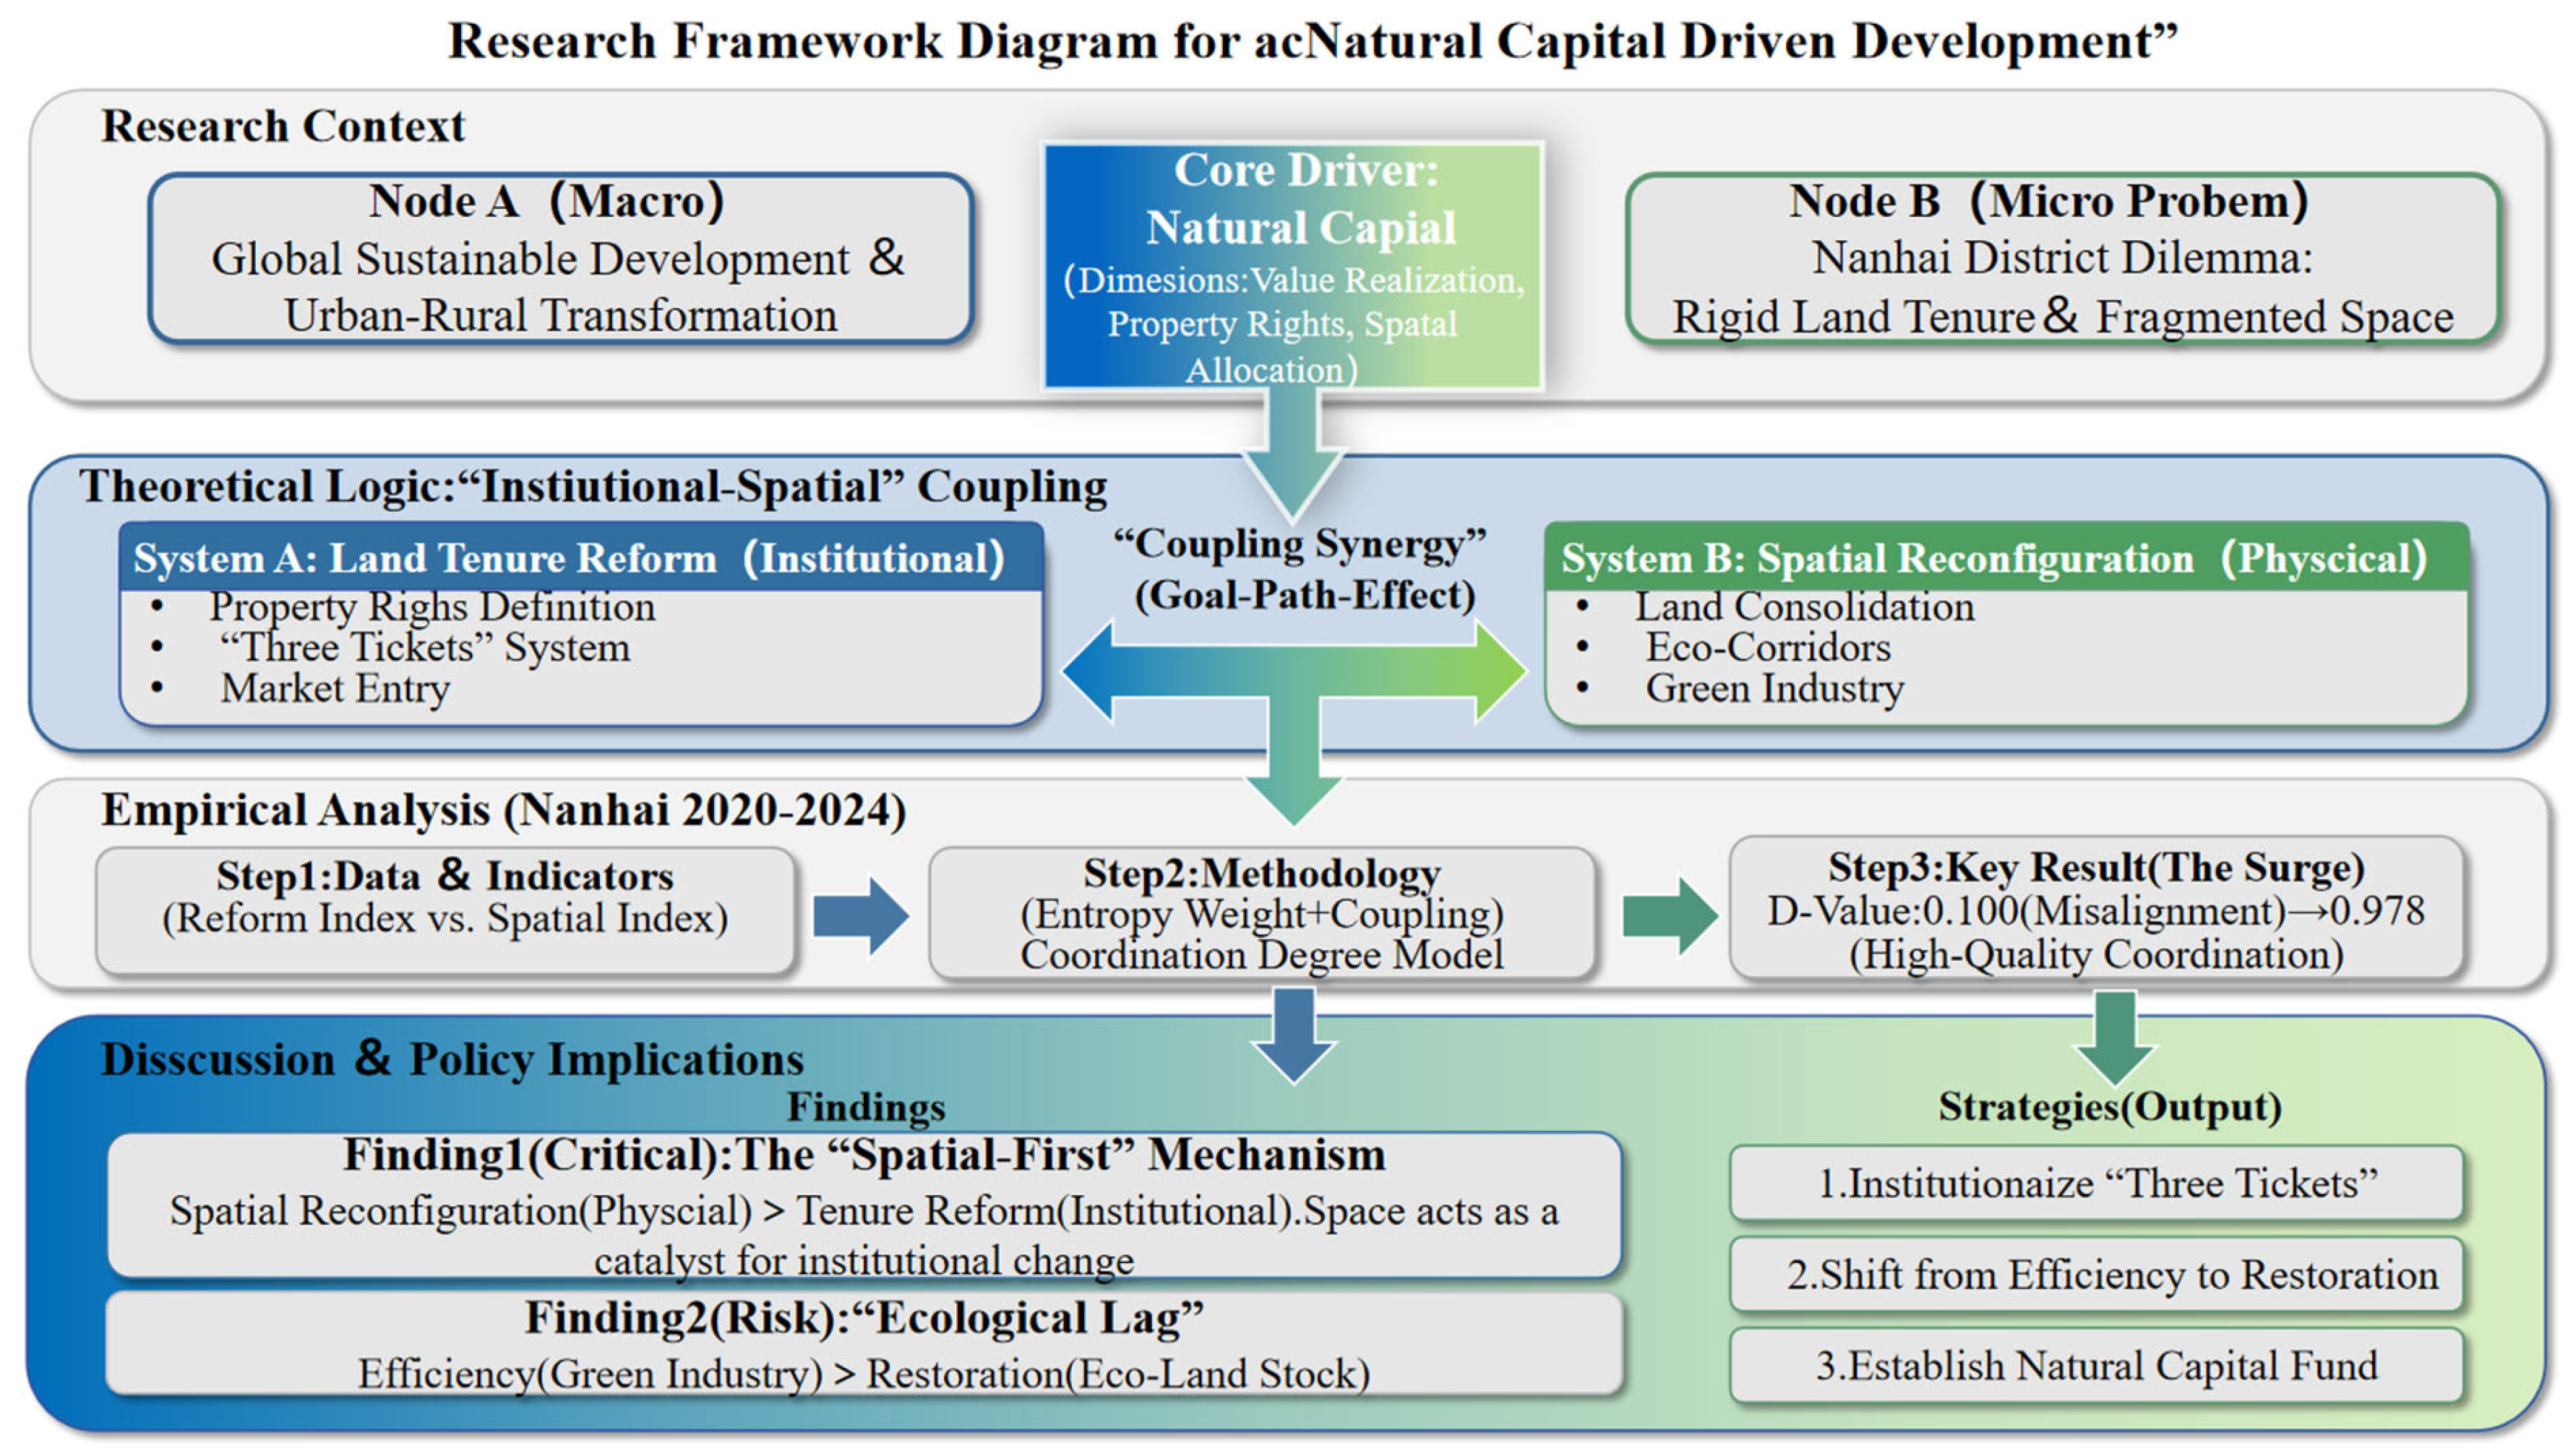
2. Core Concepts, Theoretical Foundations, and Research Framework of Natural Capital
3. Practicing Contextual and Coupling Logic in Learning Zones
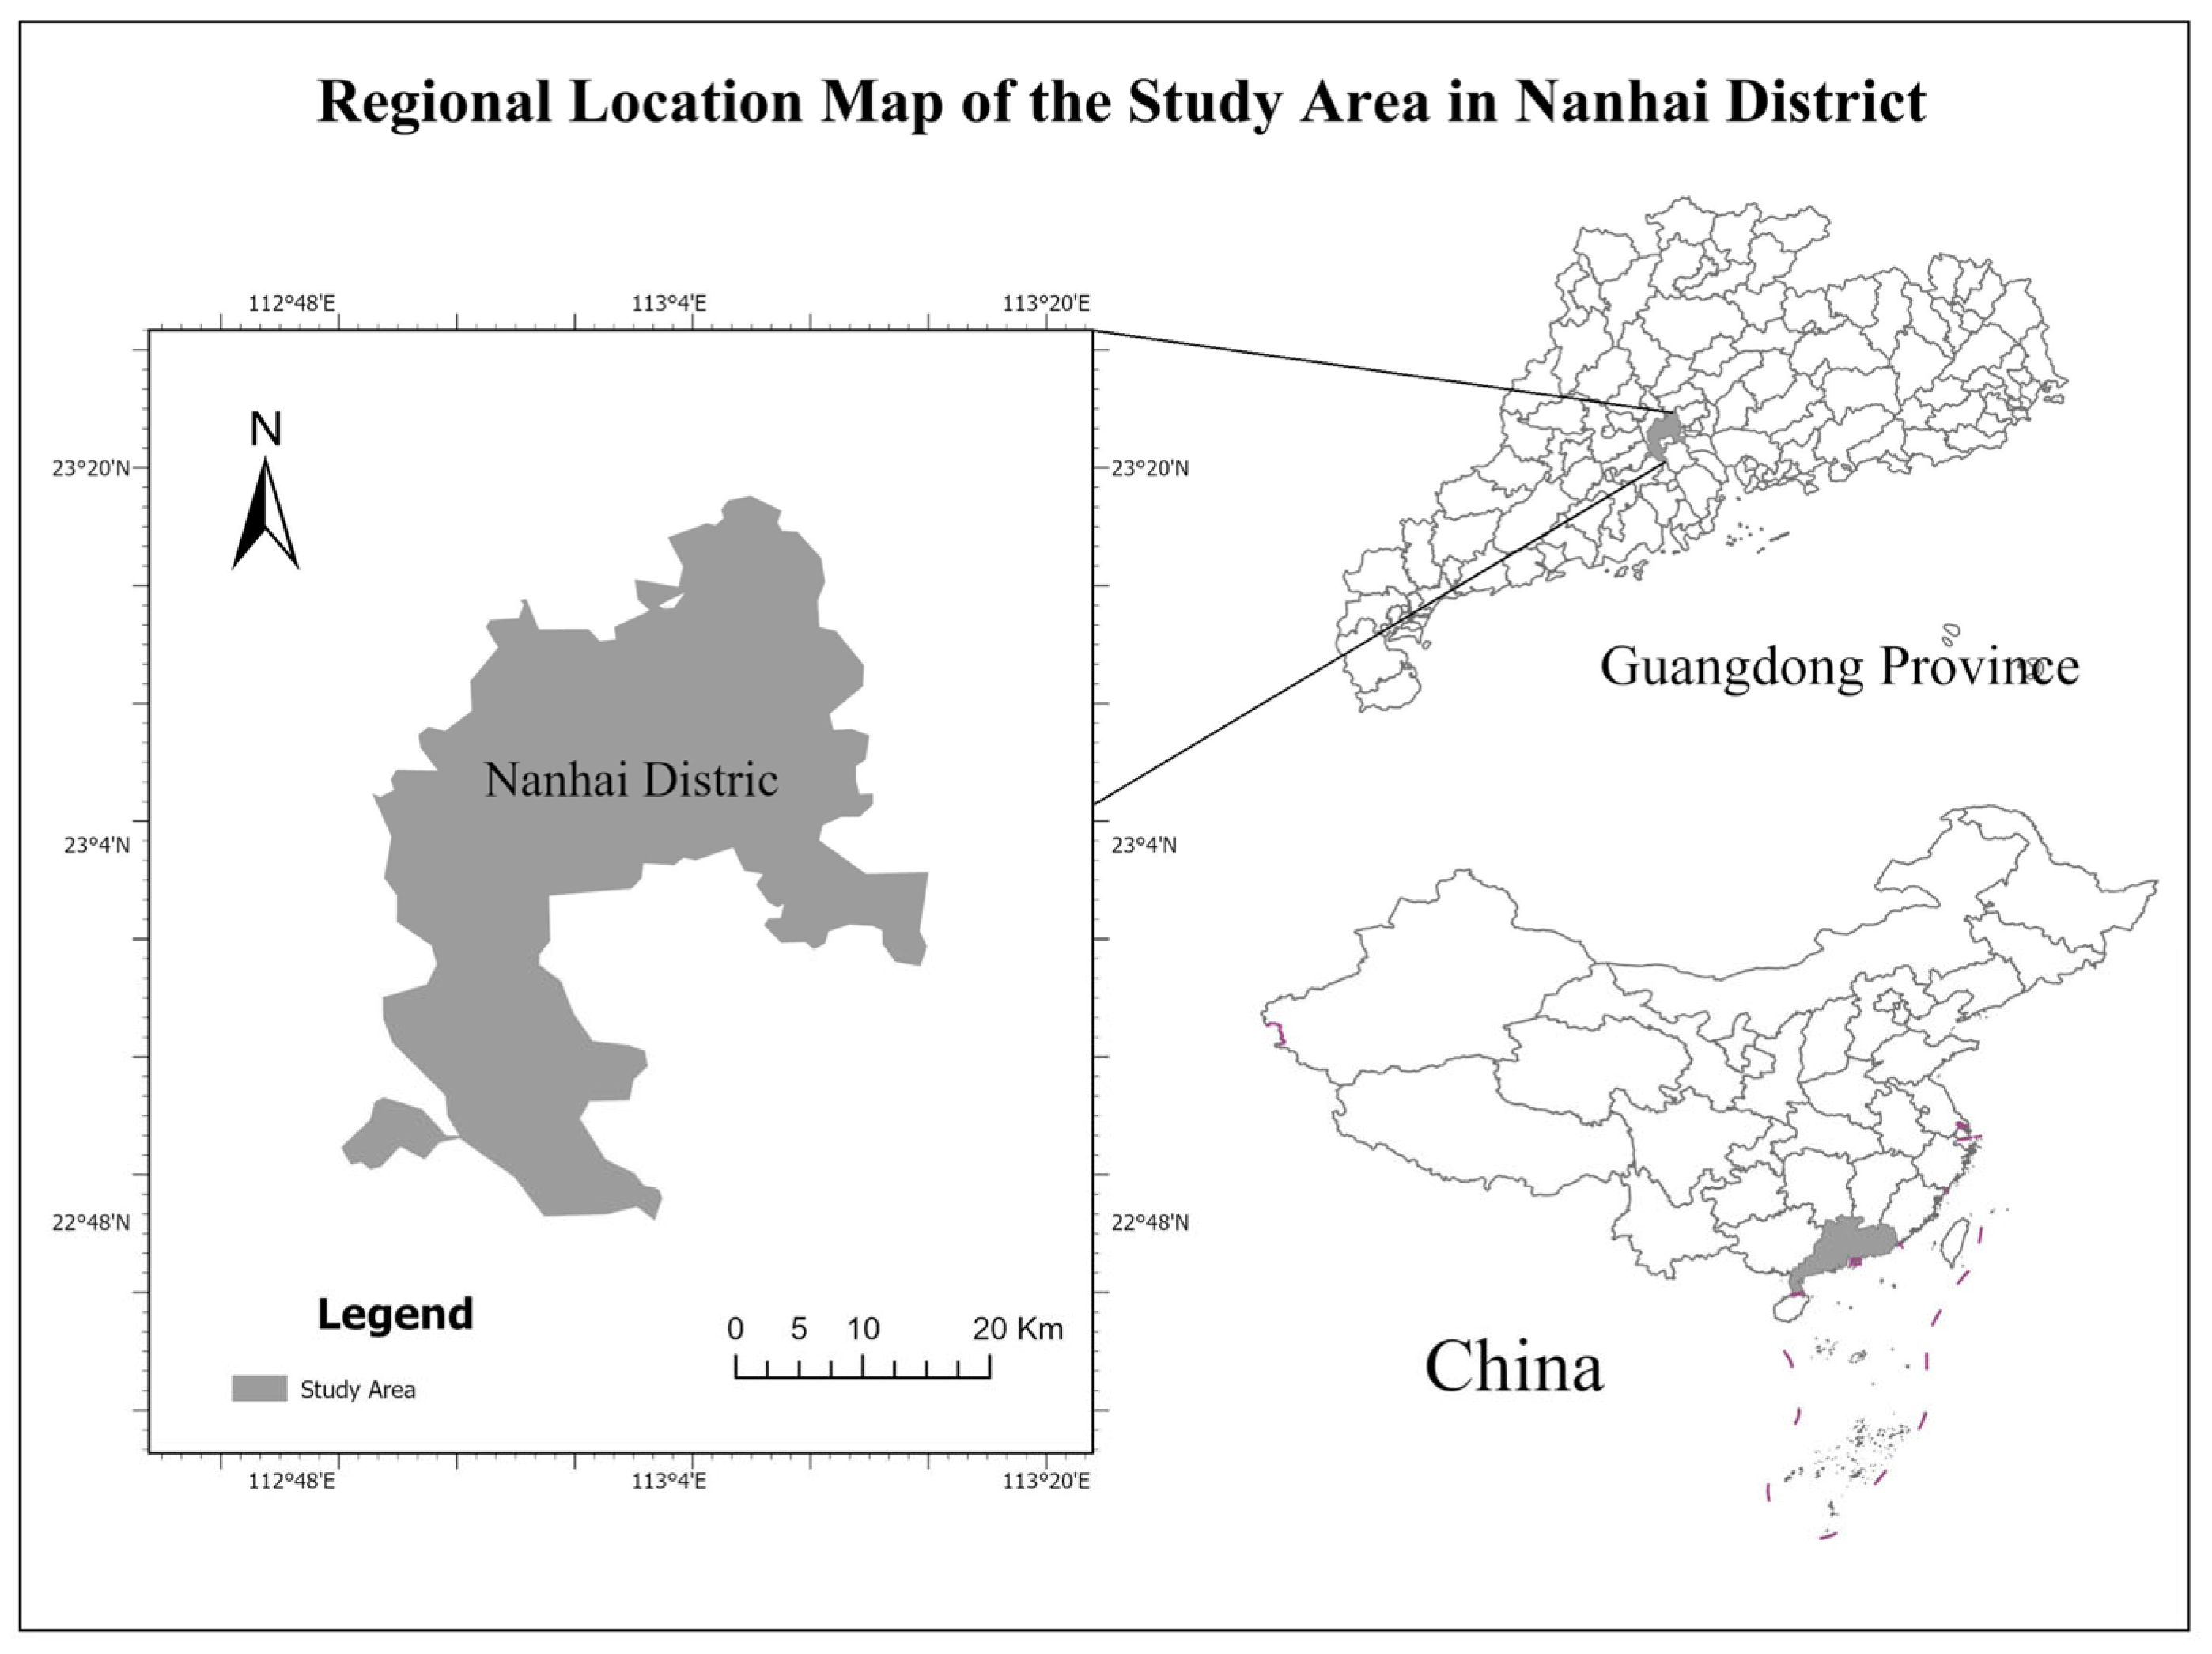
3.1. Nanhai District: A Laboratory for Land Reform Theory
3.2. Three-Dimensional Collaborative Mechanism
4. Materials and Methods
4.1. Data Sources and Study Period Justification
4.2. Indicator System Construction and Theoretical Grounding
4.3. Research Methods
4.3.1. Data Processing and Statistical Reliability Validation
- (1)
- Data Standardization
- (2)
- Statistical Reliability Validation and Determining Indicator Weights
4.3.2. Coupling Coordination Degree Model Construction
- (1)
- Subsystem Division and Comprehensive Development Index Calculation for Land System Reform and Spatial Reconfiguration
- (2)
- Calculation of Coupling Index C, Coordination Index T, and Coupling Coordination Degree D
4.3.3. Methodological Reflections and Limitations
5. Empirical Findings and Analysis
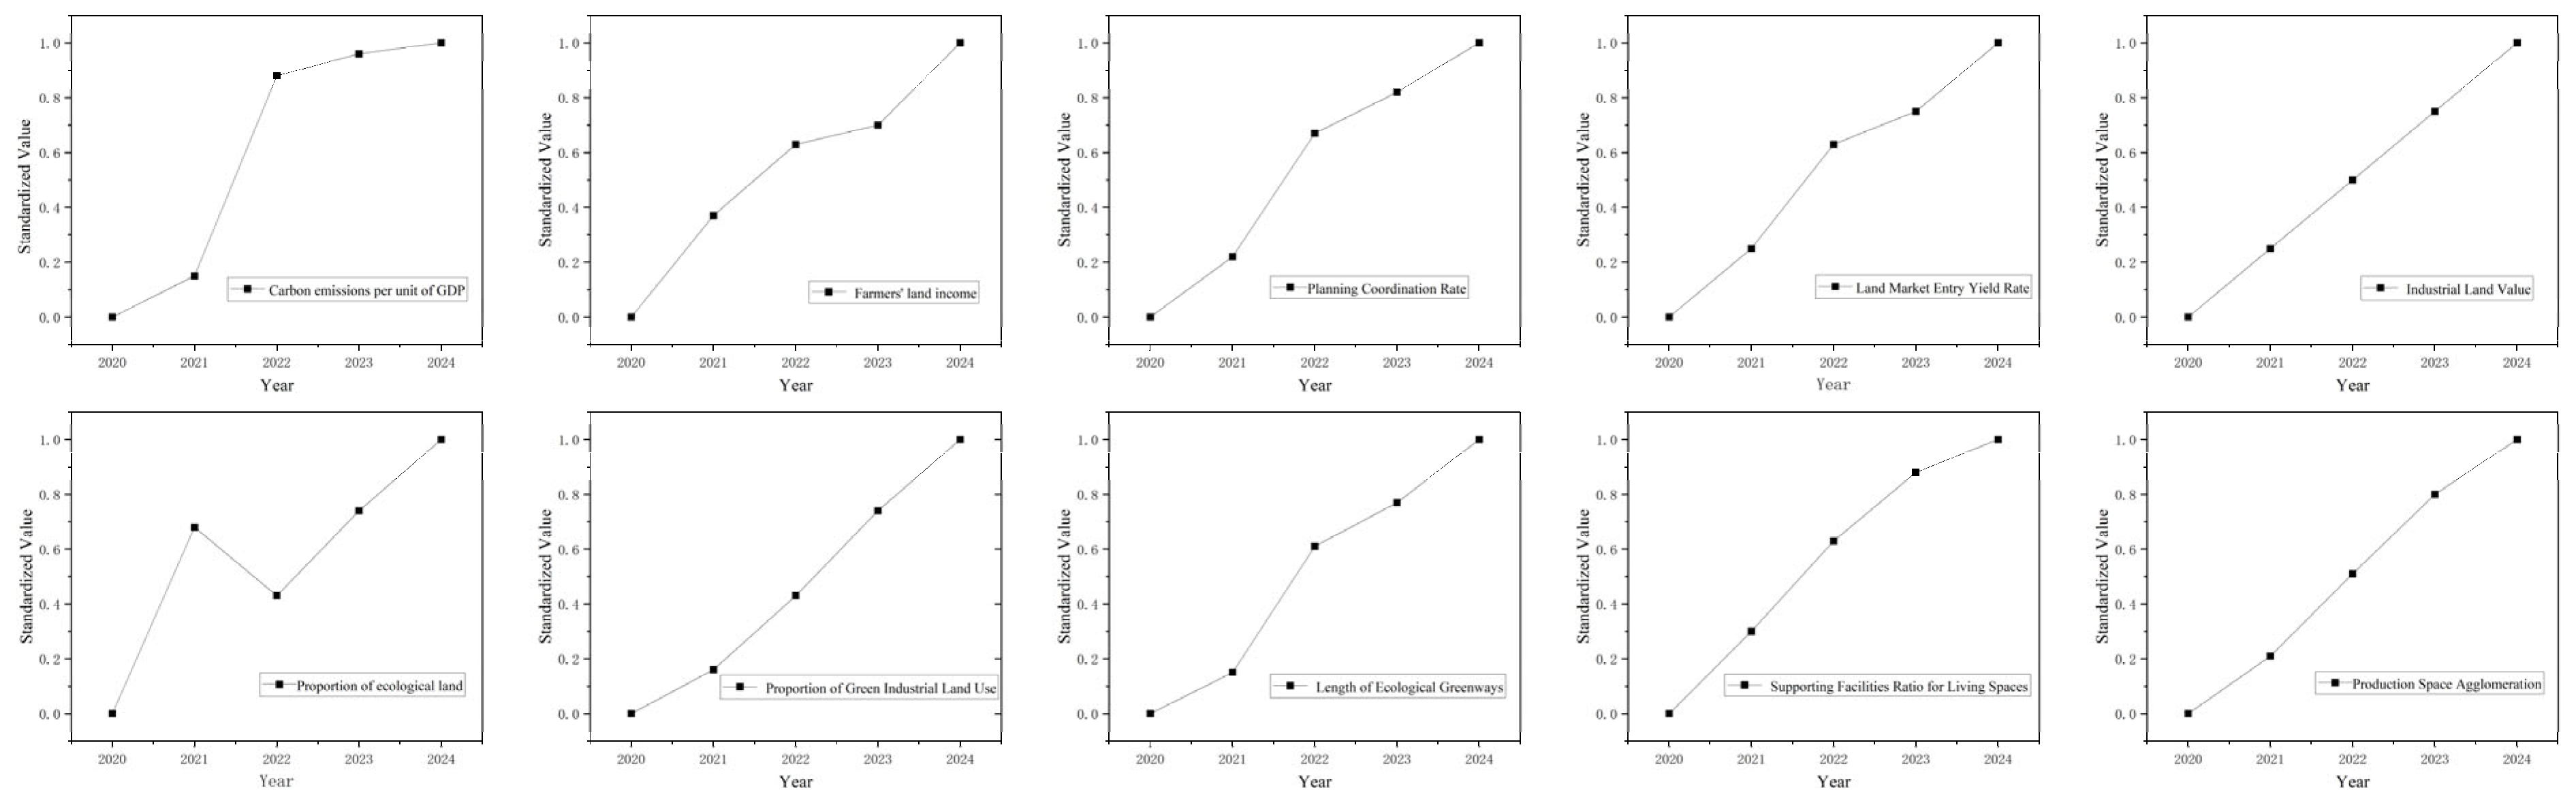
5.1. Evaluation of Subsystem Development Levels: Validating the Evolutionary Characteristics of “Space First”
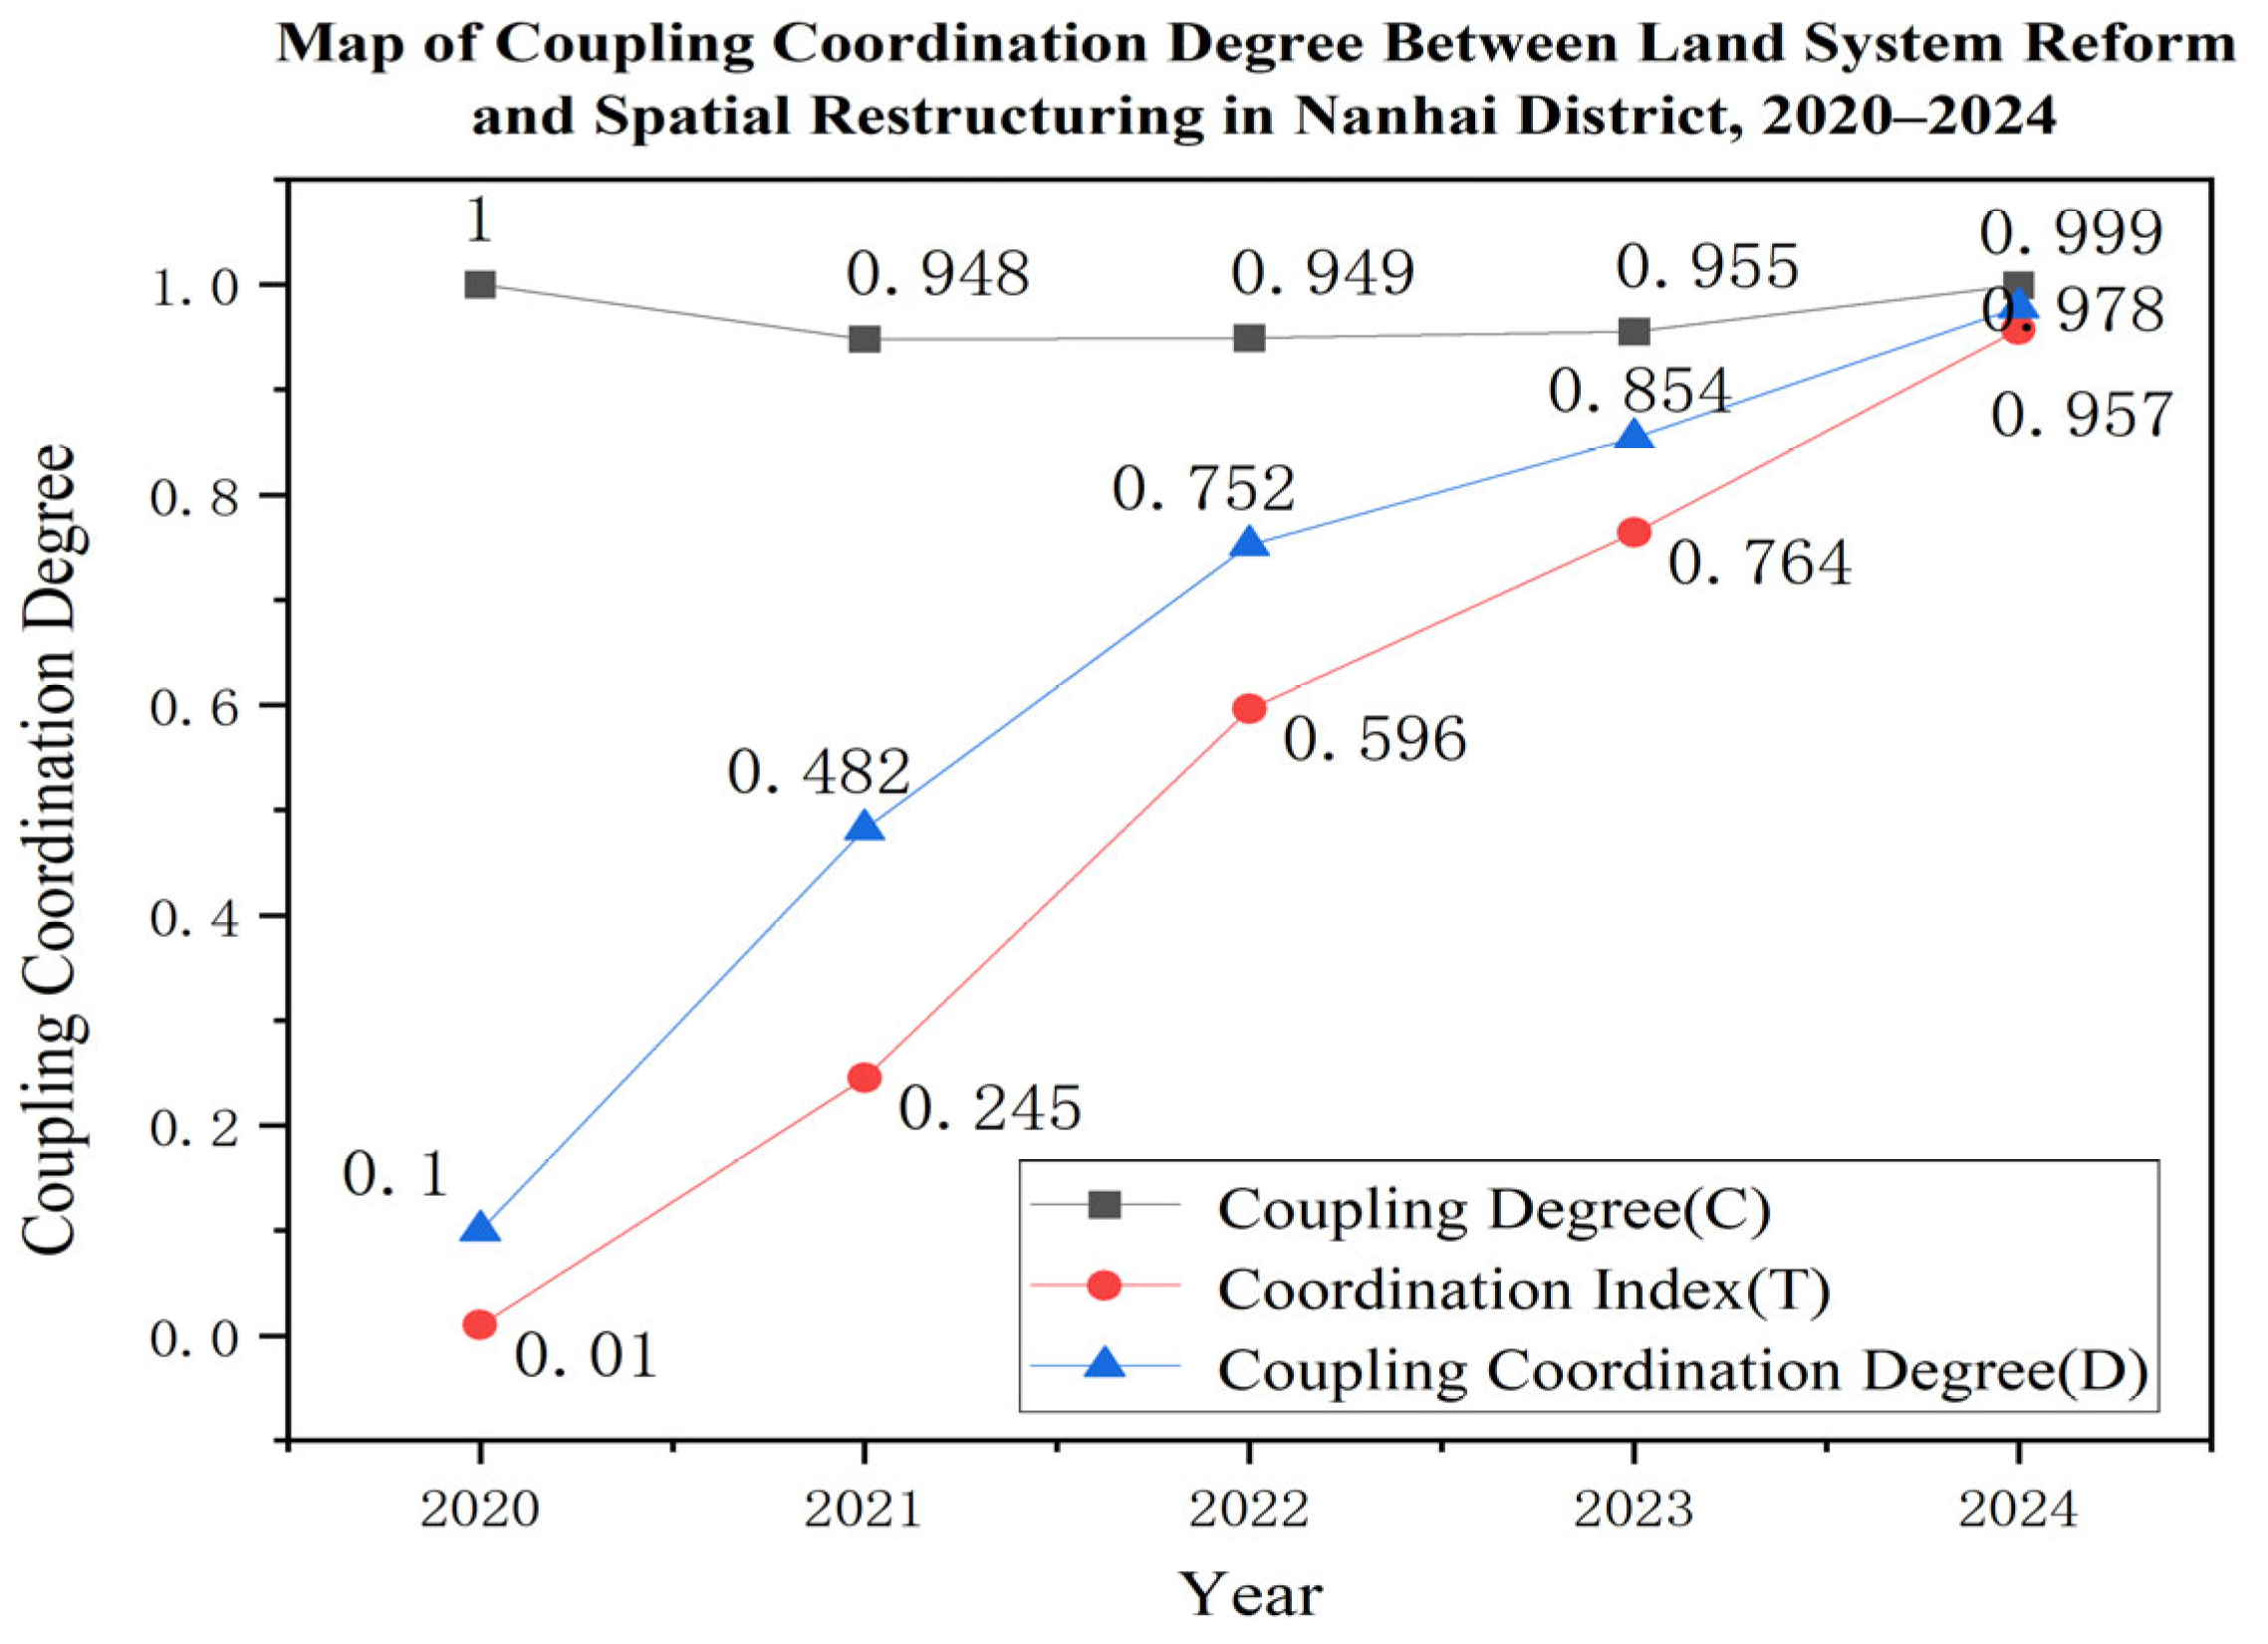
5.2. Evolutionary Dynamics of Coupling Coordination: A Qualitative Interpretation of Policy-Driven Shocks
6. Discussion
7. Conclusions
Author Contributions
Funding
Institutional Review Board Statement
Informed Consent Statement
Data Availability Statement
Conflicts of Interest
References
- Marino, D.; Barone, A.; Marucci, A.; Pili, S.; Palmieri, M. The Integrated Analysis of Territorial Transformations in Inland Areas of Italy: The Link between Natural, Social, and Economic Capitals Using the Ecosystem Service Approach. Land 2024, 13, 1455. [Google Scholar] [CrossRef]
- Nemouchi, H. Peri-urban pressures: The interplay of land strategies and urbanization in Algeria’s Oran metropolis. J. Contemp. Urban Aff. 2023, 7, 1–19. [Google Scholar] [CrossRef]
- Nguah, E.; K’Akumu, O. Strategies for Streamlined Urban Development: A Case Study of Land Use Succession in Upper Hill, Nairobi. J. Contemp. Urban Aff. 2024, 8, 1–15. [Google Scholar] [CrossRef]
- Qiao, Z.; Xu, X.; Wang, X.; Zhang, Y. Comprehensive evaluation of urban renewal based on entropy and TOPSIS method: A case of Shandong Province. J. Contemp. Urban Aff. 2025, 9, 1–15. [Google Scholar] [CrossRef]
- Deng, M.; Chen, H. The Farmers’ Willingness to Enter the Collective Construction Land Market from the Perspective of Transaction Cost Economics: An Empirical Analysis of Nanhai District. IOP Conf. Ser. Earth Environ. Sci. 2020, 440, 052054. [Google Scholar] [CrossRef]
- Pan, H.; Wu, Y.; Choguill, C. Optimizing the rural comprehensive land consolidation in China based on the multiple roles of the rural collective organization. Habitat Int. 2023, 132, 102743. [Google Scholar] [CrossRef]
- Garrido Mateos, L.; Rodríguez-López, F.; Sánchez-Macías, J.I. The three-stage evolution in the economic valuation of nature: Externalities, ecosystem services, and natural capital accountability. J. Clean. Prod. 2025, 518, 145899. [Google Scholar] [CrossRef]
- Blignaut, J.N. Making investments in natural capital count. Ecosyst. Serv. 2019, 37, 100927. [Google Scholar] [CrossRef]
- Teytelboym, A. Natural capital market design. Oxf. Rev. Econ. Policy 2019, 35, 138–161. [Google Scholar] [CrossRef]
- Hu, X.; Hu, J.; Wang, Z.; Zou, L. Ecological Priority-Oriented Performance Evaluation of Land Use Functions and Zoning Governance by Entropy–Catastrophe Progression Model. Land 2025, 14, 2296. [Google Scholar] [CrossRef]
- Bateman, I.J.; Mace, G.M. The natural capital framework for sustainably efficient and equitable decision making. Nat. Sustain. 2020, 3, 776–783. [Google Scholar] [CrossRef]
- Liu, F.; Wang, L.; Gao, J.; Liu, Y. Study on the Coupling Coordination Relationship Between Rural Tourism and Agricultural Green Development Level: A Case Study of Jiangxi Province. Agriculture 2025, 15, 874. [Google Scholar] [CrossRef]
- He, H.; He, Z.; Nie, X. Analysis and study of digital economy level measurement index. J. Internet Digit. Econ. 2024, 4, 187–217. [Google Scholar] [CrossRef]
- Ma, L.; Hong, Y.; Chen, X. Can green economy and ecological welfare achieve synergistic development? The perspective of the “Two Mountains” theory. Int. J. Environ. Res. Public Health 2022, 19, 6460. [Google Scholar] [CrossRef] [PubMed]
- Chen, T.; Chen, A.; Liu, L.; Shi, C.; Zhang, J. Synergistic effects of pollution reduction and carbon mitigation from socioeconomic factors, land use and urban innovation: A case study of Wuhan metropolitan area. Front. Environ. Sci. 2024, 12, 1511026. [Google Scholar] [CrossRef]
- North, D.C. Institutions, Institutional Change and Economic Performance; Cambridge University Press: Cambridge, UK, 1990; Available online: https://books.google.com.hk/books?hl=zh-CN&lr=&id=oFnWbTqgNPYC&oi=fnd&pg=PR6&dq=Institutions,+institutional+change+and+economic+performance+Cambridge+University+Press.+New+York.&ots=s-osPgMiP7&sig=NDBVktJUAYWjVNs2yghBfMkgt2g&redir_esc=y#v=onepage&q=Institutions%2C%20institutional%20change%20and%20economic%20performance%20Cambridge%20University%20Press.%20New%20York.&f=false (accessed on 19 November 2025).
- Cui, D.; Wu, D.; Liu, J.; Xiao, Y.; Yembuu, B.; Adiya, Z. Understanding urbanization and its impact on the livelihood levels of urban residents in Ulaanbaatar, Mongolia. Growth Change 2019, 50, 745–774. [Google Scholar] [CrossRef]
- Williamson, O.E. The economics of organization: The transaction cost approach. Am. J. Sociol. 1981, 87, 548–577. [Google Scholar] [CrossRef]
- Costanza, R.; De Groot, R.; Braat, L.; Kubiszewski, I.; Fioramonti, L.; Sutton, P.; Farber, S.; Grasso, M. Twenty years of ecosystem services: How far have we come and how far do we still need to go? Ecosyst. Serv. 2017, 28, 1–16. [Google Scholar] [CrossRef]
- Mostafavi, M.; Doherty, G. Ecological Urbanism; Lars Müller Publishers: Baden, Switzerland, 2010; Available online: https://www.academia.edu/388560/Ecological_Urbanism_2010_ (accessed on 19 November 2025).




| Objective Layer | Primary Indicators | Second-Level Indicators | Tertiary Indicators | Indicator Attribute |
|---|---|---|---|---|
| Land System Reform and Spatial Restructuring Coupling Synergy Effects | Reform–Restructuring Coupling Effects | Natural Capital Appreciation Effect | Proportion of Ecological Land Use | + |
| Carbon Emissions per Unit of GDP | − | |||
| Share of Green Industry Land Use | + | |||
| Length of ecological greenways | + | |||
| Economic coupling effect | Ecological space concentration | + | ||
| Land Market Entry Yield Rate | + | |||
| Industrial Land Value | + | |||
| Social Coupling Effects | Farmers’ Land Income | + | ||
| Living Space Support Rate | + | |||
| Mechanism Coupling Effect | Planning Coordination Rate | + |
| Indicator Name | Unit | Indicator Meaning | Calculation Method | Data Source |
|---|---|---|---|---|
| Planning coordination rate | % | Measure the alignment between the reform pilot boundary and the high-level territorial spatial planning, and reflect the ability of the mechanism to reduce internal friction costs. | Nanhai District Bureau of Natural Resources (DNRB) | |
| The yield of land entering the market | % | It reflects the excess economic premium brought about by the coupling of property rights definition and spatial allocation, and measures the efficiency of realizing the value of natural capital. | Nanhai District DNRB (Market Entry Ledgers) | |
| per capita land income of farmers | CNY/ person | Measuring the degree to which reform benefits give back to social space aims to establish positive feedback from social capital on the maintenance of natural capital. | Nanhai District Bureau of Agriculture and Rural Affairs (BARA) and Bureau of Statistics (BoS) | |
| It Proportion of ecological land | % | The absolute reserves of physical carriers of natural capital are measured, reflecting the direct contribution of spatial reorganization to physical ecological stocks. | Nanhai District DNRB (Land Use Census Data) | |
| 10,000 yuan of GDP carbon emissions | tone/10k CNY | Measure the degree of decoupling between economic growth and ecological loss, reflecting the contribution of green industrial restructuring to reducing the pressure on natural capital. | Nanhai District Bureau of Ecology and Environment (BEE) and BoS | |
| The proportion of green industrial land | % | Measure the intensity of the transition of economic space from “brown assets” to sustainable natural capital carriers. | Nanhai District DNRB (Green Classification Records) | |
| Length of ecological corridor | km | The effect of spatial reorganization on the spatial connectivity of ecosystem service functions was measured. | Nanhai District DNRB (Consolidation Planning Data) | |
| Industrial Ha land output value | CNY/ha | It reflects the effect of physical contiguous remediation on economic spatial density. | Nanhai District BoS and DNRB | |
| Production space agglomeration index | Dimensionless | The degree to which industrial plaque agglomeration is achieved and the cost of fragmentation friction is reduced by physical engineering means is measured. | Nanhai District DNRB (Spatial GIS Analysis) | |
| Living space security rate | % | The ability of spatial restructuring to provide social support is measured, reflecting the support of social capital for the protection of natural capital. | Nanhai District DNRB and Community Ledgers |
| Third-Level Indicator | Information Value Entropy ej | Coefficient of Variation gj | Weight Coefficient wj | Weight Proportion |
|---|---|---|---|---|
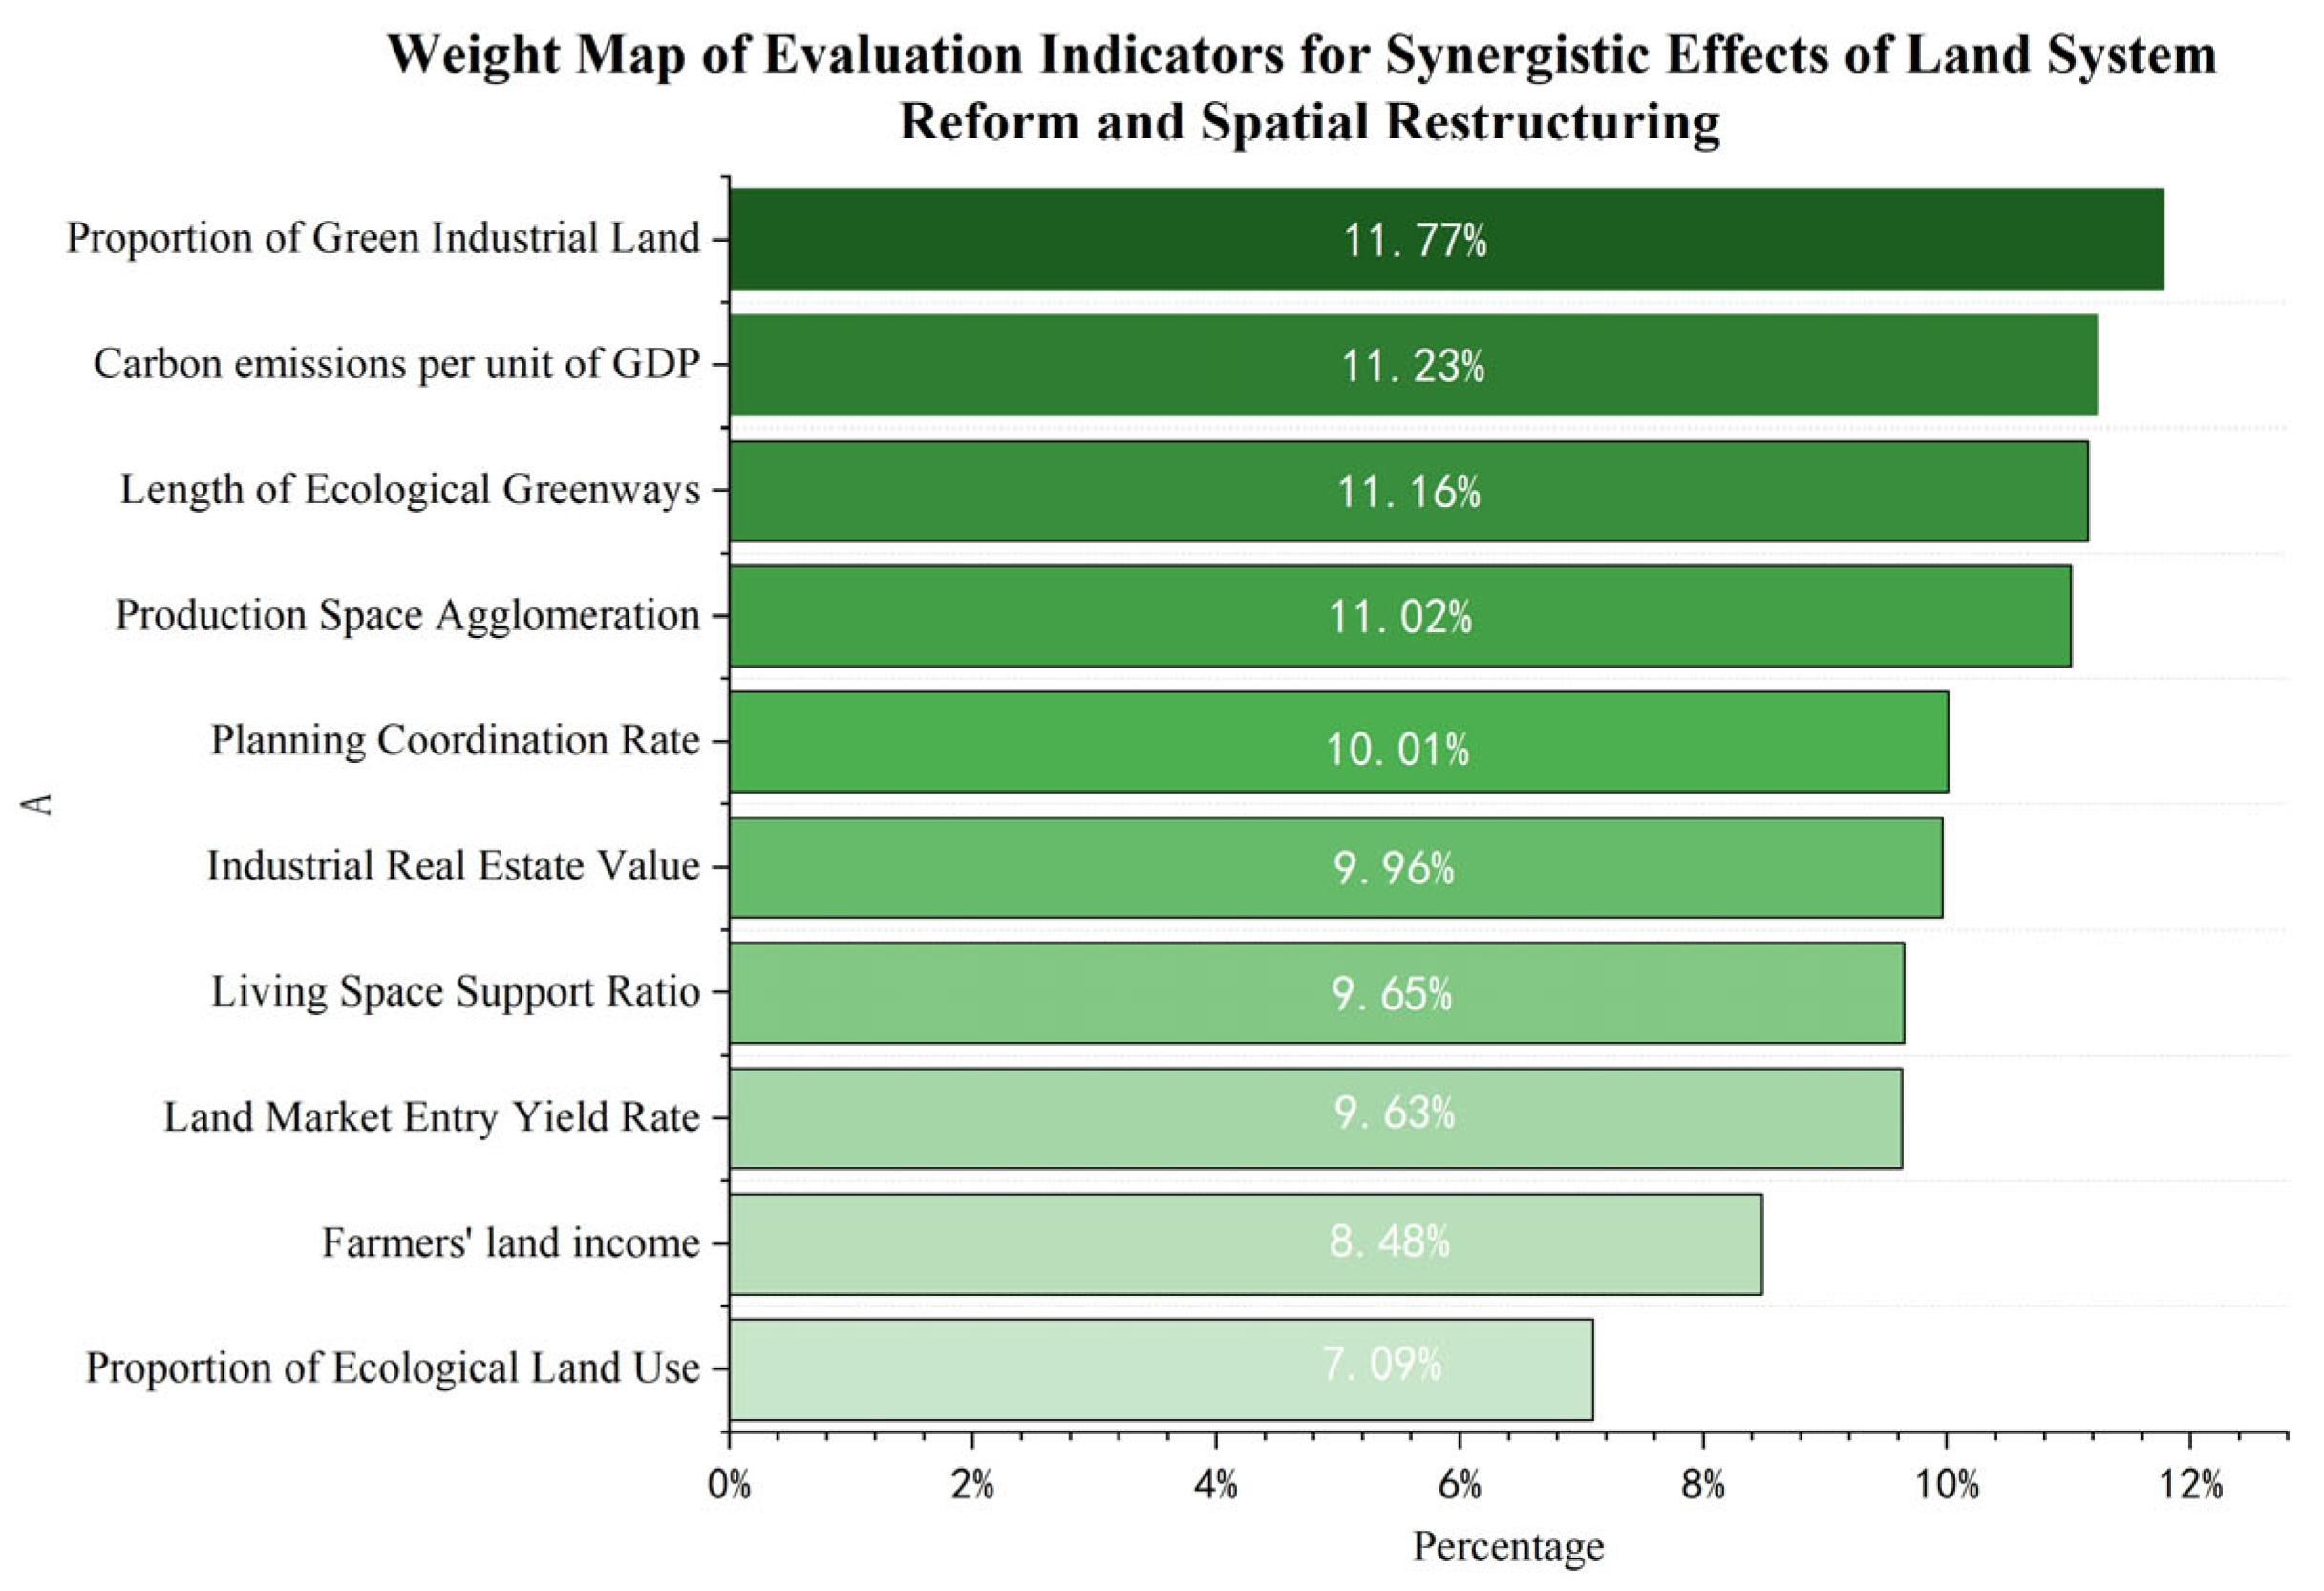
| Carbon Emissions per Unit of GDP | 0.79 | 0.21 | 0.11 | 11.23% |
| Planning alignment rate | 0.81 | 0.19 | 0.10 | 10.01% |
| Farmers’ Land Income | 0.84 | 0.16 | 0.08 | 8.48% |
| Industrial Land Value | 0.81 | 0.19 | 0.10 | 9.96% |
| Land Market Entry Yield Rate | 082 | 0.18 | 0.10 | 9.63% |
| Green Industry Land Use Ratio | 0.78 | 0.22 | 0.12 | 11.77% |
| Proportion of ecological land use | 0.87 | 0.14 | 0.07 | 7.09% |
| Length of ecological greenways | 0.79 | 0.21 | 0.11 | 11.16% |
| Production Space Aggregation Degree | 0.79 | 0.21 | 0.11 | 11.02% |
| Subsystem Name | Included Tier-3 Indicators (and Entropy Method Weights) | Core Logic |
|---|---|---|
| Land System Reform Subsystem | Land Market Entry Yield Rate (), Farmer Land Income (), Planning Coordination Rate () | Focusing on the core objectives of land system reform: activating land assets, safeguarding farmers’ income, and promoting interdepartmental coordinated reform |
| Spatial Reconfiguration Subsystem | Proportion of Ecological Land (), Carbon Emissions per Unit of GDP (), Proportion of Green Industrial Land (), Industrial Land Output Value (), Length of Ecological Greenways (), Production Space Aggregation Index (), Living Space Support Rate () | Focusing on the core objectives of spatial restructuring: optimizing ecological space, enhancing economic space efficiency, improving social space amenities, and strengthening planning coordination |
| D Value Range | Coordination Level | Coupling Coordination Level | Interpretation of Synergy Effects |
|---|---|---|---|
| [0.0, 0.1) | 1 | Extreme Mismatch | Subsystems exhibit minimal interaction, with synergistic effects absent |
| [0.1, 0.2) | 2 | Severe Dysfunction | Weak subsystem interaction with significant contradictions |
| [0.2, 0.3) | 3 | Moderate Dysfunction | Limited subsystem interaction with collaborative shortcomings |
| [0.3, 0.4) | 4 | Mild Dysfunction | Preliminary interaction among subsystems, but insufficient coordination |
| [0.4, 0.5) | 5 | Borderline Dysfunction | Subsystem interaction has been enhanced, but further optimization is still required |
| [0.5, 0.6) | 6 | Barely coordinated | Preliminary coordination effects emerging, requiring consolidation and enhancement |
| [0.6, 0.7) | 7 | Primary Coordination | Synergy effect is stable, with overall positive trends |
| [0.7, 0.8) | 8 | Intermediate Coordination | Synergy is pronounced, with subsystems interacting favorably |
| [0.8, 0.9) | 9 | Good Coordination | Synergistic effects are prominent, supporting the transformation of “Two Mountains” |
| [0.9, 1.0) | 10 | High-Quality Coordination | Optimal synergy, highly compatible subsystems |
| Year | Land System Reform Subsystem Index A | Spatial Integration Subsystem Index B | Difference Between A and B | Subsystem Development Trend Analysis |
|---|---|---|---|---|
| 2020 | 0.000 | 0.000 | 0.000 | Both systems are in their initial stages with weak collaborative foundations |
| 2021 | 0.096 | 0.115 | −0.019 | The spatial integration subsystem is slightly ahead, while the reform has started somewhat slower |
| 2022 | 0.238 | 0.292 | −0.054 | Accelerated growth in spatial integration (increase in green industrial land) |
| 2023 | 0.301 | 0.387 | −0.086 | Widening Gap Between Two Systems: Spatial integration benefits from comprehensive land consolidation reform but constrained by ownership negotiations |
| 2024 | 0.281 | 0.719 | −0.438 | Both systems reach relatively high levels, with spatial integration advantages remaining stable |
| Year | Coupling Degree (C) | Coordination Index (T) | Coupling Coordination Degree (D) | Coordination Level | Degree of Coupling Coordination | Synergy Effect Stages |
|---|---|---|---|---|---|---|
| 2020 | 1.000 | 0.010 | 0.100 | 2 | Severe Dysfunction | Initial Synergy Phase (No Interaction) |
| 2021 | 0.948 | 0.245 | 0.482 | 5 | Near Dysfunction | Preliminary Synergy Phase (Low Interaction) |
| 2022 | 0.949 | 0.596 | 0.752 | 8 | Intermediate Coordination | Stable Coordination Phase (Positive Interaction) |
| 2023 | 0.955 | 0.764 | 0.854 | 9 | Well-coordinated | Highly Efficient Synergy Phase (Prominent Effects) |
| 2024 | 0.999 | 0.957 | 0.978 | 10 | High-Quality Coordination | Optimal Synergy Phase (Highly Compatible) |
Disclaimer/Publisher’s Note: The statements, opinions and data contained in all publications are solely those of the individual author(s) and contributor(s) and not of MDPI and/or the editor(s). MDPI and/or the editor(s) disclaim responsibility for any injury to people or property resulting from any ideas, methods, instructions or products referred to in the content. |
© 2026 by the authors. Licensee MDPI, Basel, Switzerland. This article is an open access article distributed under the terms and conditions of the Creative Commons Attribution (CC BY) license.
Share and Cite
Li, Z.; Jiang, X. Unlocking Natural Capital Through Land Tenure Reform and Spatial Reconfiguration: Evidence from the “Spatial-First” Mode in Nanhai, China. Sustainability 2026, 18, 3336. https://doi.org/10.3390/su18073336
Li Z, Jiang X. Unlocking Natural Capital Through Land Tenure Reform and Spatial Reconfiguration: Evidence from the “Spatial-First” Mode in Nanhai, China. Sustainability. 2026; 18(7):3336. https://doi.org/10.3390/su18073336
Chicago/Turabian StyleLi, Zhi, and Xiaomin Jiang. 2026. "Unlocking Natural Capital Through Land Tenure Reform and Spatial Reconfiguration: Evidence from the “Spatial-First” Mode in Nanhai, China" Sustainability 18, no. 7: 3336. https://doi.org/10.3390/su18073336
APA StyleLi, Z., & Jiang, X. (2026). Unlocking Natural Capital Through Land Tenure Reform and Spatial Reconfiguration: Evidence from the “Spatial-First” Mode in Nanhai, China. Sustainability, 18(7), 3336. https://doi.org/10.3390/su18073336