1. Introduction
The increasing integration of manufacturing and services has led to the growing trend of the “servitization of manufacturing” [
1]. For example, many well-known manufacturing enterprises, such as IBM, Intel, and General Motors, have adopted servitization strategies. An important form of implementing this strategy is that companies provide product–service integration solutions to meet the diverse demands of different subjects, i.e., providing Product–Service Systems (PSSs) [
2]. Compared to the product manufacturing system, the PSS not only offers products to fulfill the functionality and reliability needs of customers, but also delivers services to customers satisfying requirements such as after-sales support and maintenance. For instance, in addition to offering smartphones that meet customers’ needs in terms of functionality and esthetics, Apple Inc. also provides warranty and technical support services. Therefore, customer satisfaction with PSS solutions is jointly influenced by product quality and functionality as well as by the effectiveness of service delivery and realization.
The delivery and realization of services, as critical determinants of customer satisfaction, play a pivotal role in enhancing manufacturing enterprises’ profitability and promoting social welfare [
3,
4]. Sarkar and Dey [
5] analyzed the delivery and realization of services in the retail industry as factors affecting customer satisfaction, which helped the retail industry achieve 16.7% profit. In addition, Jiaxipera’s focus on localized production in Mexico has improved service delivery, boosting customer satisfaction and operational efficiency. A
$60 million investment in the Coahuila plant, creating 600 jobs, highlights the clear link between enhanced service delivery and company growth (
https://www.prodensa.com/). This investment not only drives revenue but also improves local living standards, contributing to broader social welfare. Bellary, Kumar Bala and Chakraborty [
6] studied the shift from traditional healthcare to telemedicine and found that customer satisfaction was significantly enhanced, with the telemedicine market growing from
$41.63 billion in 2019 to
$79.79 billion in 2020, a 91.66% increase. Similarly, Nike leverages the service delivery of its ‘Nike+’ digital platform to enhance customer interactions, leading to increased satisfaction and brand loyalty. In 2021, Nike Digital contributed to a 30% increase in sales in certain quarters (
https://sgbonline.com/). These examples demonstrate that effective service delivery not only strengthens customer satisfaction but also significantly improves enterprise performance and social benefits. From the perspective of the PSS, it is therefore essential to incorporate service delivery and realization into an investigation of optimal PSS configuration.
“Configuration” first emerged in the field of product design to address the design issues of modular product series [
7]. Subsequently, with the advent of PSS research, a modular PSS configuration was proposed by Aurich et al. [
8]. PSS configuration is the construction of technical systems by selecting and assembling preferred modules from a predefined product and service library according to customers’ needs under certain constraints. Existing research on PSS configuration primarily focuses on the value propositions of customers, manufacturers, and the environment [
9,
10], while paying limited attention to the non-cooperative game relationships between two key stakeholders: the PSS provider and the service providers. Generally, PSS providers outsource services to service enterprises. Product manufacturers, acting as the PSS provider, and service providers are two kinds of stakeholders involved in the configuration of PSS schemes, and they are required to extend their responsibilities throughout the product life cycle [
11]. Typically, a PSS provider offers product solutions and seeks service providers to provide service supply solutions [
12]. For example, Haier’s COSMOPlat Cloud platform collaborates with the textile and apparel industry to provide customized dressing services to customers, accurately meeting customer needs. A global semiconductor company seeks cooperation with specialized advanced factories, where advanced factories act as service providers to offer online support services such as design support services and engineering analysis to customers. In this hierarchical decision-making structure, the PSS provider prioritizes customer experience and utility value, aiming to maximize customer satisfaction by optimizing utility per unit cost, whereas service providers focus on minimizing service supply costs to enhance operational efficiency and market competitiveness. Given the heterogeneous nature of conflicting objectives between PSS providers and service providers in hierarchical decision-making, coordination and resolving conflicts of interest are essential topics to be addressed through game theory in this paper.
Scholars have investigated the interactive configuration of products and services. For instance, Aurich, Fuchs and Wagenknecht [
13] obtained solutions that satisfied individual demands through product–service interaction design from the perspective of considering the interrelationships between products and services. Wang, Zheng and Pan [
14] investigated the interaction between products and services, with a view to providing customers with the best combination of products and services. Geng et al. [
10] considered the interaction between products and services by calculating the importance ranking of product–service engineering characteristics. Luo, Jiang and Song [
15] proposed a modular PSS architecture configuration for interactive environments with customers. However, these studies mainly employed single- or multi-objective optimization models and largely overlooked the interaction between PSS configuration and the delivery and realization of services. In practice, service delivery and realization significantly influence customer experience and satisfaction, which in turn affect the outcomes of PSS configuration. Raza et al. [
16] conducted a case study on RedX’ s drone delivery system and demonstrated that its carefully designed service provision and delivery model ensured efficient and reliable product delivery, thereby improving operational efficiency and customer satisfaction. Neglecting service delivery during the configuration stage may reduce the perceived utility of services and ultimately impair the effectiveness of PSS solutions. The interactions pose difficulties to the PSS configuration problem. During the process of interaction, the PSS provider and service providers have different interests in terms of resource allocation, service quality, and cost control, often resulting in conflicts. Therefore, it is necessary to balance the objective of enhancing customer satisfaction with the objective of minimizing service supply costs. Considering the hierarchical decision-making structure and conflicting interests between the PSS provider and service providers, this paper adopts the Stackelberg game theory to develop a bi-level optimization model to solve the PSS configuration problem. Specifically, PSS schemes are first configured based on the customer’s requirements to achieve the objective of maximizing customer satisfaction, and then service solutions are decided to achieve the objective of minimizing service supply cost.
In summary, it makes sense to study the interactions between PSS configuration and the delivery and realization of services, as well as various conflicting objectives between the PSS provider and the service providers from the coordinated negotiation perspective based on Stackelberg game theory decision-making. Moreover, based on the analysis of problem characteristics, an improved Dual-Population Co-evolutionary Hybrid Algorithm of NSGA-II and MOPSO (DPC-NMHA) is proposed to obtain the optimal solutions. The principal contributions of this work are summarized as follows:
- (1)
From the leader–follower game perspective, the interaction of the PSS provider and service providers is investigated for PSS configuration to obtain the optimal PSS schemes.
- (2)
We propose a bi-level optimization model for PSS configuration to maximize customer satisfaction and minimize service supply cost. The improved DPC-NMHA is introduced to solve the joint optimization model.
The remainder of the paper is structured as follows.
Section 2 provides a review of the relevant literature. The leader–follower joint optimization model of PSS configuration and service configuration is established in
Section 3. The development of the improved DPC-NMHA is described to solve the problem in
Section 4.
Section 5 introduces a case study for a refrigerator service system and demonstrates the computation analysis. Finally,
Section 6 concludes and describes potential future work. To ensure the rigor of this work, the construction logic and sequence of the mathematical model follow the format of the literature [
17]. In the case study, the implementation logic and sequence follow the format of literature [
18].
2. Literature Review
2.1. PSS Configuration
The existing studies on how to find reasonable configuration schemes within the PSS have obtained many achievements. And some scholars have taken customer needs, environmental value propositions, etc., as a perspective on PSS schemes’ configuration, instead of focusing on the relationships between products and services [
7,
9]. However, due to the heterogeneous nature of the PSS [
8], it is significant to investigate the correlations between products and services in PSS configuration. For example, Shen, Wang and Sun [
19] extended current product-based configuration ontologies from a service perspective by taking the component-based nature of services, the mutual relationships of products and services, and customer knowledge into account. Guillon et al. [
20] analyzed the correlations between products and services from the perspective of the commercial bidding configuration and proposed a universal knowledge-based model. Although these studies consider the relevance of products and services, the ontology-based approach is unable to deal with the multi-objective problem that exists in PSS configuration. Besides that, some scholars adopted a complex network approach to analyze the relationships between products and services and constructed multi-objective optimization models [
21,
22]. However, they neglected the fact that the demands of other stakeholders are considered in the PSS configuration in addition to those of the customers.
In addition, influenced by customer demand preferences, manufacturers considered the match between products and services to provide customized PSS schemes for their customers [
23,
24]. Haber and Fargnoli [
25] obtained products and service prioritization relationships for PSS scheme configuration from a perspective on products and services by translating customer requirements. Dong et al. [
26] analyzed the dynamic changes in customer demands for products and services and considered the matching relationships between products and services for large-scale personalized PSS configuration. Existing studies have analyzed the matching of products and services with different attribute characteristics and customer demand preferences, but they ignore the association relationships between products and services at different levels.
It has been shown that the stronger the dependence on products and services, the more likely it is to result in higher market acceptance of PSS schemes [
27]. Until now, there have been many scholars who have analyzed the dependencies between products and services from different perspectives to provide PSS schemes that satisfy the individual needs of customers. Fargnoli and Haber [
28] described the interactions between PSS elements by analyzing their relationships. Zhang, Chen and Jiang [
29] considered the pairing utility of product and service modules to maximize expected customer satisfaction through the development of a multi-objective optimization model. However, these studies considered the dependency relationships between products and services, and ignored that there are interactions between the configurations of products and the delivery and realization of services.
Interactive configuration has been investigated by many scholars. Aurich, Fuchs and Wagenknecht [
13] obtained solutions that satisfied individual demands through product–service interaction design from the perspective of considering the interrelationships between products and services. Luo and Wu [
30] discussed the relationships between existing product and service modules from the perspective of customer and manufacturer interaction and constructed a bi-level optimization model to determine the PSS scheme configuration. Luo, Jiang and Song [
15] constructed a multi-objective optimization model to efficiently configure hybrid products by considering the relevance of services and products as well as the matching preferences of manufacturers and customers in an interactive environment. Nevertheless, they only considered the interactions between products and services, omitting the conflicting interests of the PSS provider and service providers involved in PSS configuration. Research on product and service relationships from different perspectives in PSS configuration are summarized in
Table 1.
In conclusion, the literature analyses the relationships between products and services from different perspectives to configure PSS solutions that fulfill the individual requirements of customers. However, previous studies do not consider that PSS configuration and subsequent service delivery and realization belong to different levels of the decision-making process. Moreover, many studies also focus only on the interests of customers and manufacturers, neglecting the conflicts of interest between the PSS provider and service providers in PSS configuration. Therefore, it is necessary to investigate the interactions between the PSS configuration and the delivery and realization of services from the perspective of leader–follower interactions to obtain PSS configuration schemes that satisfy the interests of both the PSS provider and the service providers.
2.2. Multi-Level Optimization of Product/PSS Configuration Design Domains
The multi-level optimization model was first proposed by Bracken and McGill [
31]. It refers to those mathematical programming models whose constraints contain suboptimization problems. It abstracts a class of hierarchical decision-making problems including the leader–follower decision-making problem. With the development of engineering design, many important design problems have been shown to have complex structures with leader–follower hierarchy characteristics, which are difficult to solve by the traditional single-level optimization models [
12,
32,
33]. In recent years, scholars have begun to study the bi-level optimization problem in the traditional domain of product configuration design. Hossain et al. [
34] proposed a multi-objective leader–follower joint optimization model considering the hierarchy of decision-making structures between the product family structure system and the assembly configuration. Pakseresht et al. [
35] proposed a collaborative reconfiguration of product families and supply chains based on three objectives, given that the level of demand for products and customer requirements was dynamically changing. Liu, Gong and Jiao [
36] proposed a leader–follower interactive decision-making mechanism for distributed collaborative product fulfillment in low-carbon product family planning and manufacturer load balancing, to solve product family optimization issues. Hossain et al. [
37] proposed a bi-level optimization model to determine the optimal granularity of modules under a coherent framework of product family modularity and supply chain modularity. Du et al. [
38] gave an overview of leader–follower joint optimization issues that are widely present in the product development and design literature.
In the context of PSS, a few scholars have turned their attention to the application of bi-level optimization models. Luo and Wu [
30] depicted the PSS scheme configuration process in supply–demand interactions and built a bi-level optimization model to sequentially optimize customer satisfaction and enterprise cost. Ren and Zhao [
39] researched the coordinated optimization of PSS and supply chain configuration, constructing a bi-level optimization model to sequentially optimize perceived utility per unit cost for customers and total supply chain costs. These studies considered the hierarchical decision-making process in PSS configuration and balanced conflicting objectives by establishing bi-level optimization models. The application of ordinary multi-objective optimization models in PSS configuration is described in
Table 2.
By analyzing the above-mentioned literature, most existing studies establish ordinary multi-objective optimization models to configure PSS schemes. However, this model fails to address the heterogeneous characteristics of conflicting objectives requiring hierarchical decision-making and does not fully represent the decision-making process of individual stakeholders. In fact, PSS configuration is a complex process involving not only intricate interactions among components but also manufacturing and service delivery. Therefore, it is essential to balance conflicting objectives such as customer satisfaction with unit cost and service supply cost. Furthermore, due to the presence of multiple decision-makers in hierarchical organizations, each decision-maker will seek to optimize their objectives at their respective levels in a hierarchical manner. Consequently, a bi-level optimization model is developed to sequentially optimize customer satisfaction and service supply cost to satisfy the interests of both the PSS provider and service providers.
Due to the NP-hard nature of bi-level programming, heuristic algorithms have been widely developed for bi-level optimization, including single-level transformation methods [
41], multi-objective approaches [
42], and co-evolutionary methods [
43]. Traditional heuristic algorithms like NSGA-II effectively cope with multi-objective optimization problems and perform well in terms of convergence and maintaining solution diversity. However, when coping with complex bi-level multi-objective optimization problems, the convergence speed and performance of NSGA-II may be affected. Given that the bi-level optimization model in this study aims to maximize customer satisfaction and minimize service supply costs, an improved DPC-NMHA method is proposed. This method leverages the global search capability of Particle Swarm Optimization (PSO) and the fast sorting and crowding distance preservation strategies of NSGA-II to find higher-quality Pareto solution sets. When solving bi-level problems, it ensures a more balanced performance of the population across different levels, particularly in coordinating the complex dependencies between upper-level and lower-level objectives. Therefore, the improved DPC-NMHA is employed in this study to solve the leader–follower joint optimization model for PSS configuration.
2.3. Research Gaps
Based on a review of existing studies, several research gaps in PSS configuration modeling can be identified: (1) Most of the existing studies only focus on the economic benefits of manufacturing enterprises from the perspective of cost, profit, efficiency, and the sustainability of configuration. They fail to consider that service delivery and realization, as factors affecting customer satisfaction, may have an impact on the revenues of manufacturing enterprises. (2) In the PSS configuration, in addition to considering product and service dependencies, it is necessary to coordinate conflicts of interest that arise from stakeholders’ perspectives regarding PSS configuration and service delivery and realization. Existing research has considered dependencies between products and services, as well as factors such as customer demands, manufacturer interests, or environmental value propositions. Nonetheless, the interests of service providers are rarely considered in PSS configuration. (3) The PSS provider and service providers are engaged in a non-cooperative game in PSS configuration delivery. However, existing research mainly focuses on building ordinary multi-objective models, overlooking the conflicts among these objectives that need to be sequentially optimized through coordination and negotiation. A leader–follower optimization model is established to iteratively optimize the objectives of both upper and lower levels to find the optimal solution.
The above-mentioned gaps suggest the need for research work, that the PSS scheme should be configured from the perspective of the coordinated negotiation of conflicting interests between the PSS provider and service providers, as well as that service delivery and realization are also considered. Consequently, this paper develops a leader–follower joint optimization model for PSS configuration and service configuration to optimize customer satisfaction and service supply cost sequentially to find a PSS solution that satisfies the PSS provider’s and service providers’ objectives.
3. Proposed Model
This section presents the mathematical formulation of the leader–follower joint optimization model for PSS configuration. The model aims to determine the optimal combination of product modules and service modules while coordinating the interests of the PSS provider and service providers. First, the notation used in the model is introduced. Then, the upper-level and lower-level optimization models are formulated. Finally, the integrated bi-level optimization model is presented.
3.1. Nomenclature
The notation used in the proposed model is summarized in
Table 3, including indices, parameters, and decision variables.
3.2. Problem Description and Assumption
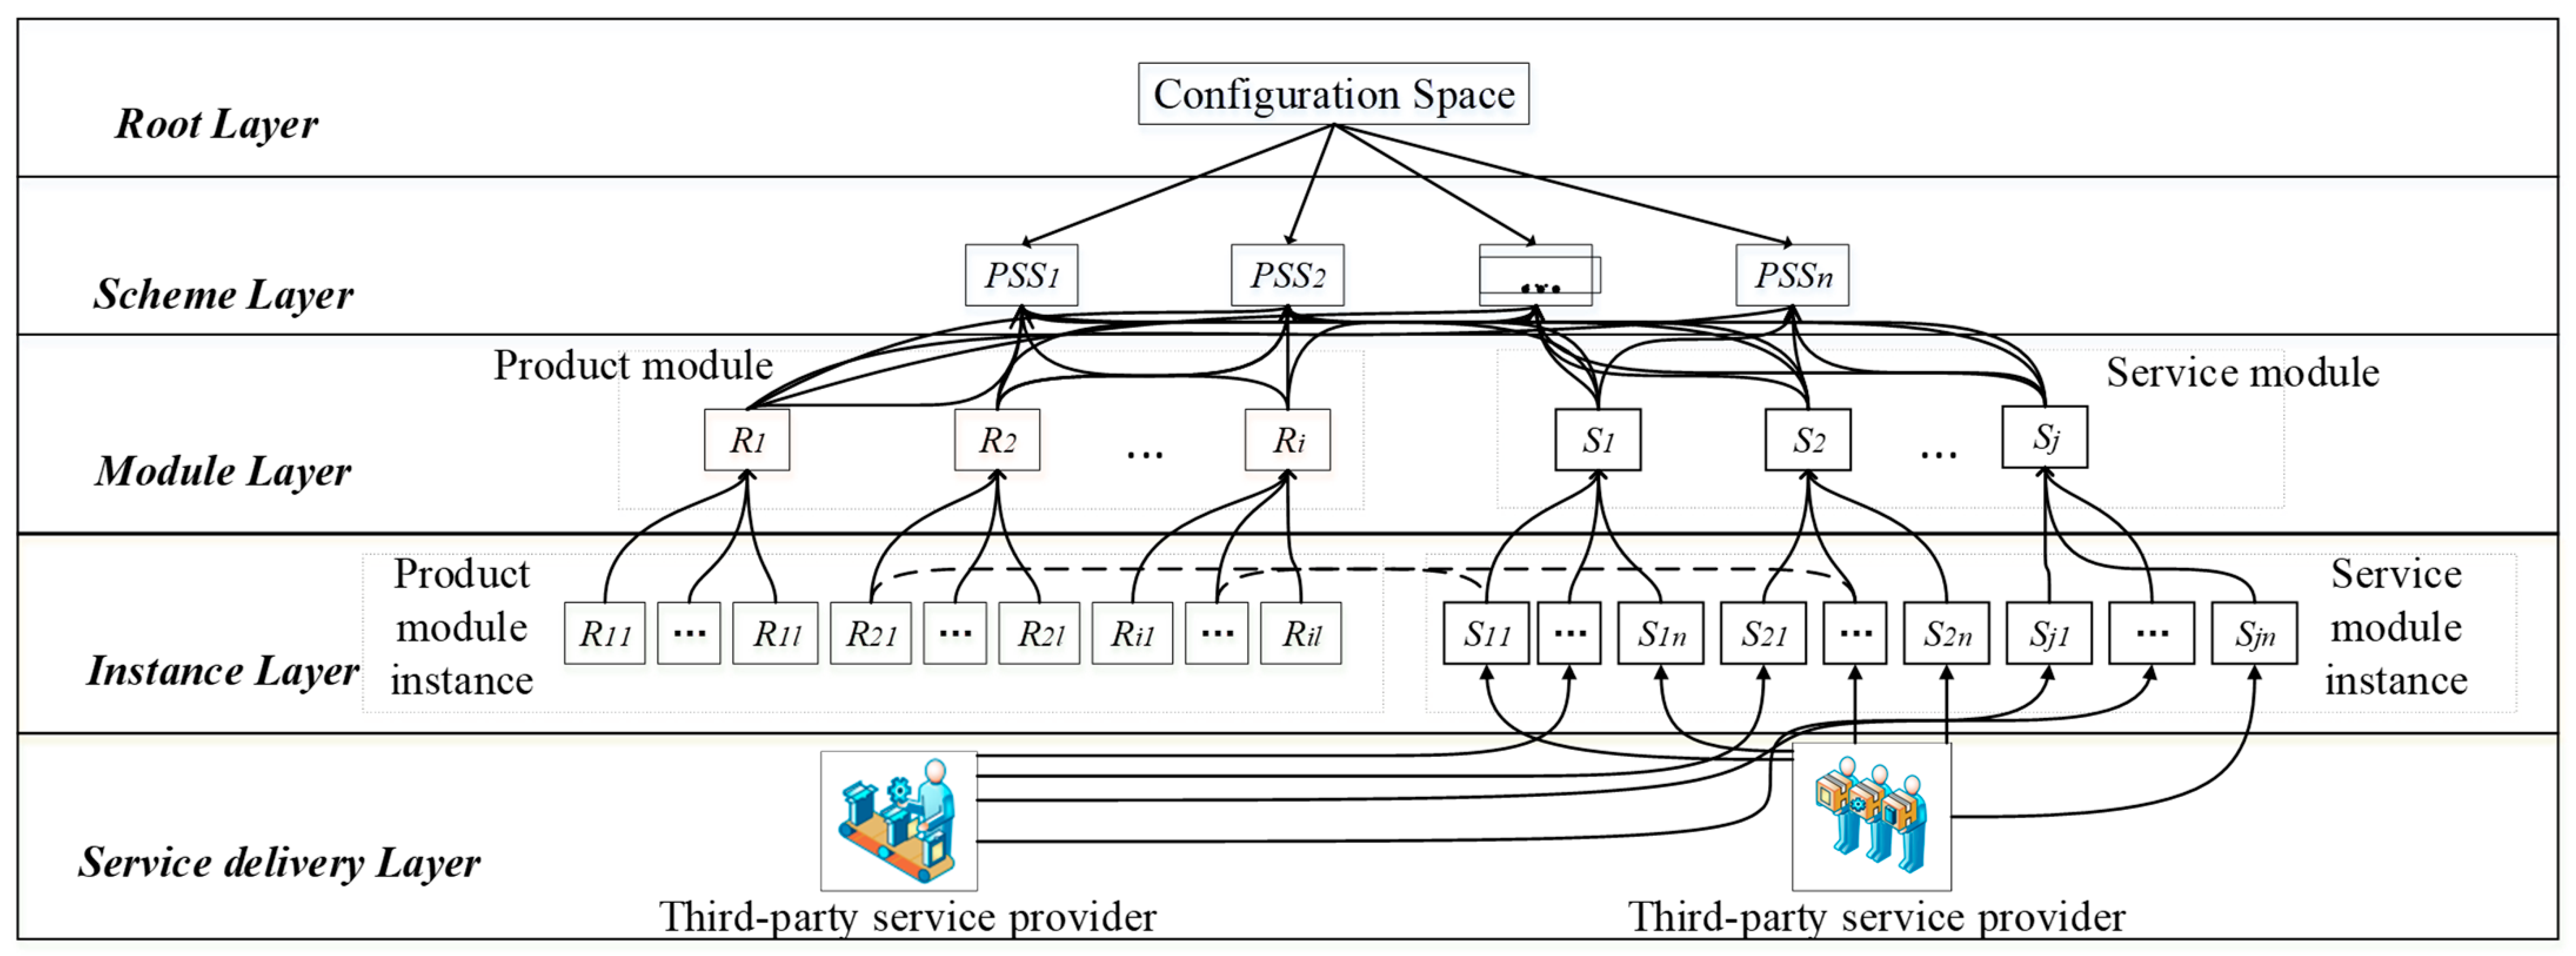
The PSS scheme is composed of several product modules and service modules, as shown in
Figure 1. All the modules are combined to satisfy individual customer requirements, and some service modules must be delivered to customers by service providers.
Figure 1 establishes the PSS configuration space with a hierarchical structure for demonstrating the composition of the PSS solution. The PSS configuration space consists of a root layer, a scheme layer, a module layer, an instance layer, and a service delivery layer. The root layer represents the PSS family formed by all possible PSS schemes. The scheme layer is a collection of
n candidate PSS schemes. Each PSS scheme meets the design constraints and has different performances. The module layer is a collection of m configurable PSS modules, and there are also constraint relationships between product and service modules. The instance layer is a collection of instances contained in each PSS module. The service delivery layer indicates that the services are delivered and realized by service providers.
The configuration decision problem of PSS design schemes based on a leader–follower decision-making mechanism is described as follows. The PSS provider and service providers plan to work together to deliver PSS schemes to customers. The PSS provider configures the products and services based on the customer’s requirements to obtain PSS schemes with the goal of maximizing customer satisfaction. Based on the PSS configuration results, service providers are asked to make decisions about the service supply solutions to minimize the service supply cost as much as possible. The service supply cost for the lower-level model is variable in the upper-level model. After the lower-level service configuration is completed, the decision results will be fed back to the PSS configuration of the upper-level model. Then the upper level will adjust the initial PSS schemes according to the feedback results. In the whole process of PSS design scheme configuration, the PSS provider and service providers have a non-cooperative game relationship involving conflicts. Although the decision-making process follows the sequential and one-shot structure of the Stackelberg game, an iterative procedure is employed to obtain the optimal solution. Specifically, the improved optimization algorithm performs iterative searching until the predefined termination criterion is satisfied.
Assumption 1: A PSS configuration scheme typically comprises various product modules and service modules. Each PSS scheme applies to a specific market segment where all customer groups share similar demand preferences.
Assumption 2: Different configurations of product and service modules influence customer satisfaction with the PSS configuration schemes. Customer utility primarily includes the perceived utility of product functions and service levels. The perceived utility may vary across different module candidates.
Assumption 3: The total cost of configuring a PSS scheme consists of the manufacturing cost of product modules and the service supply cost. Specifically, the service supply cost encompasses the module candidates selected for the service module.
3.3. Formulation
For a manufacturing company that provides PSS configuration schemes, in the initial PSS configuration stage, the design department designs a configuration scheme for different market segments t (t = 1, 2, …, T) and the demand for segment t is Qt. The PSS configuration scheme is jointly composed of product module Ri (i = 1, 2, …, I) and service module Sj (j = 1, 2, …, J). Both the product modules and the service modules have some module candidates with similar functions but different attributes. The product module Ri has l module candidate Ril (l = 1, 2, …, Li). The service module is Sj (j = 1, 2, …, J), and the module Sj has n module candidates, Sjn (n = 1, 2, …, Nj). PSS is first configured based on the customer’s requirements. The PSS configuration decision is to select the optimal module candidates from product and service module candidates to form preliminary schemes. After that, the PSS configuration schemes are fed back to the service providers to decide service supply solutions. Considering the delivery and realization of services, the service providers select the module candidate from each of the service modules to decide the service supply solutions based on the results of the preliminary PSS schemes.
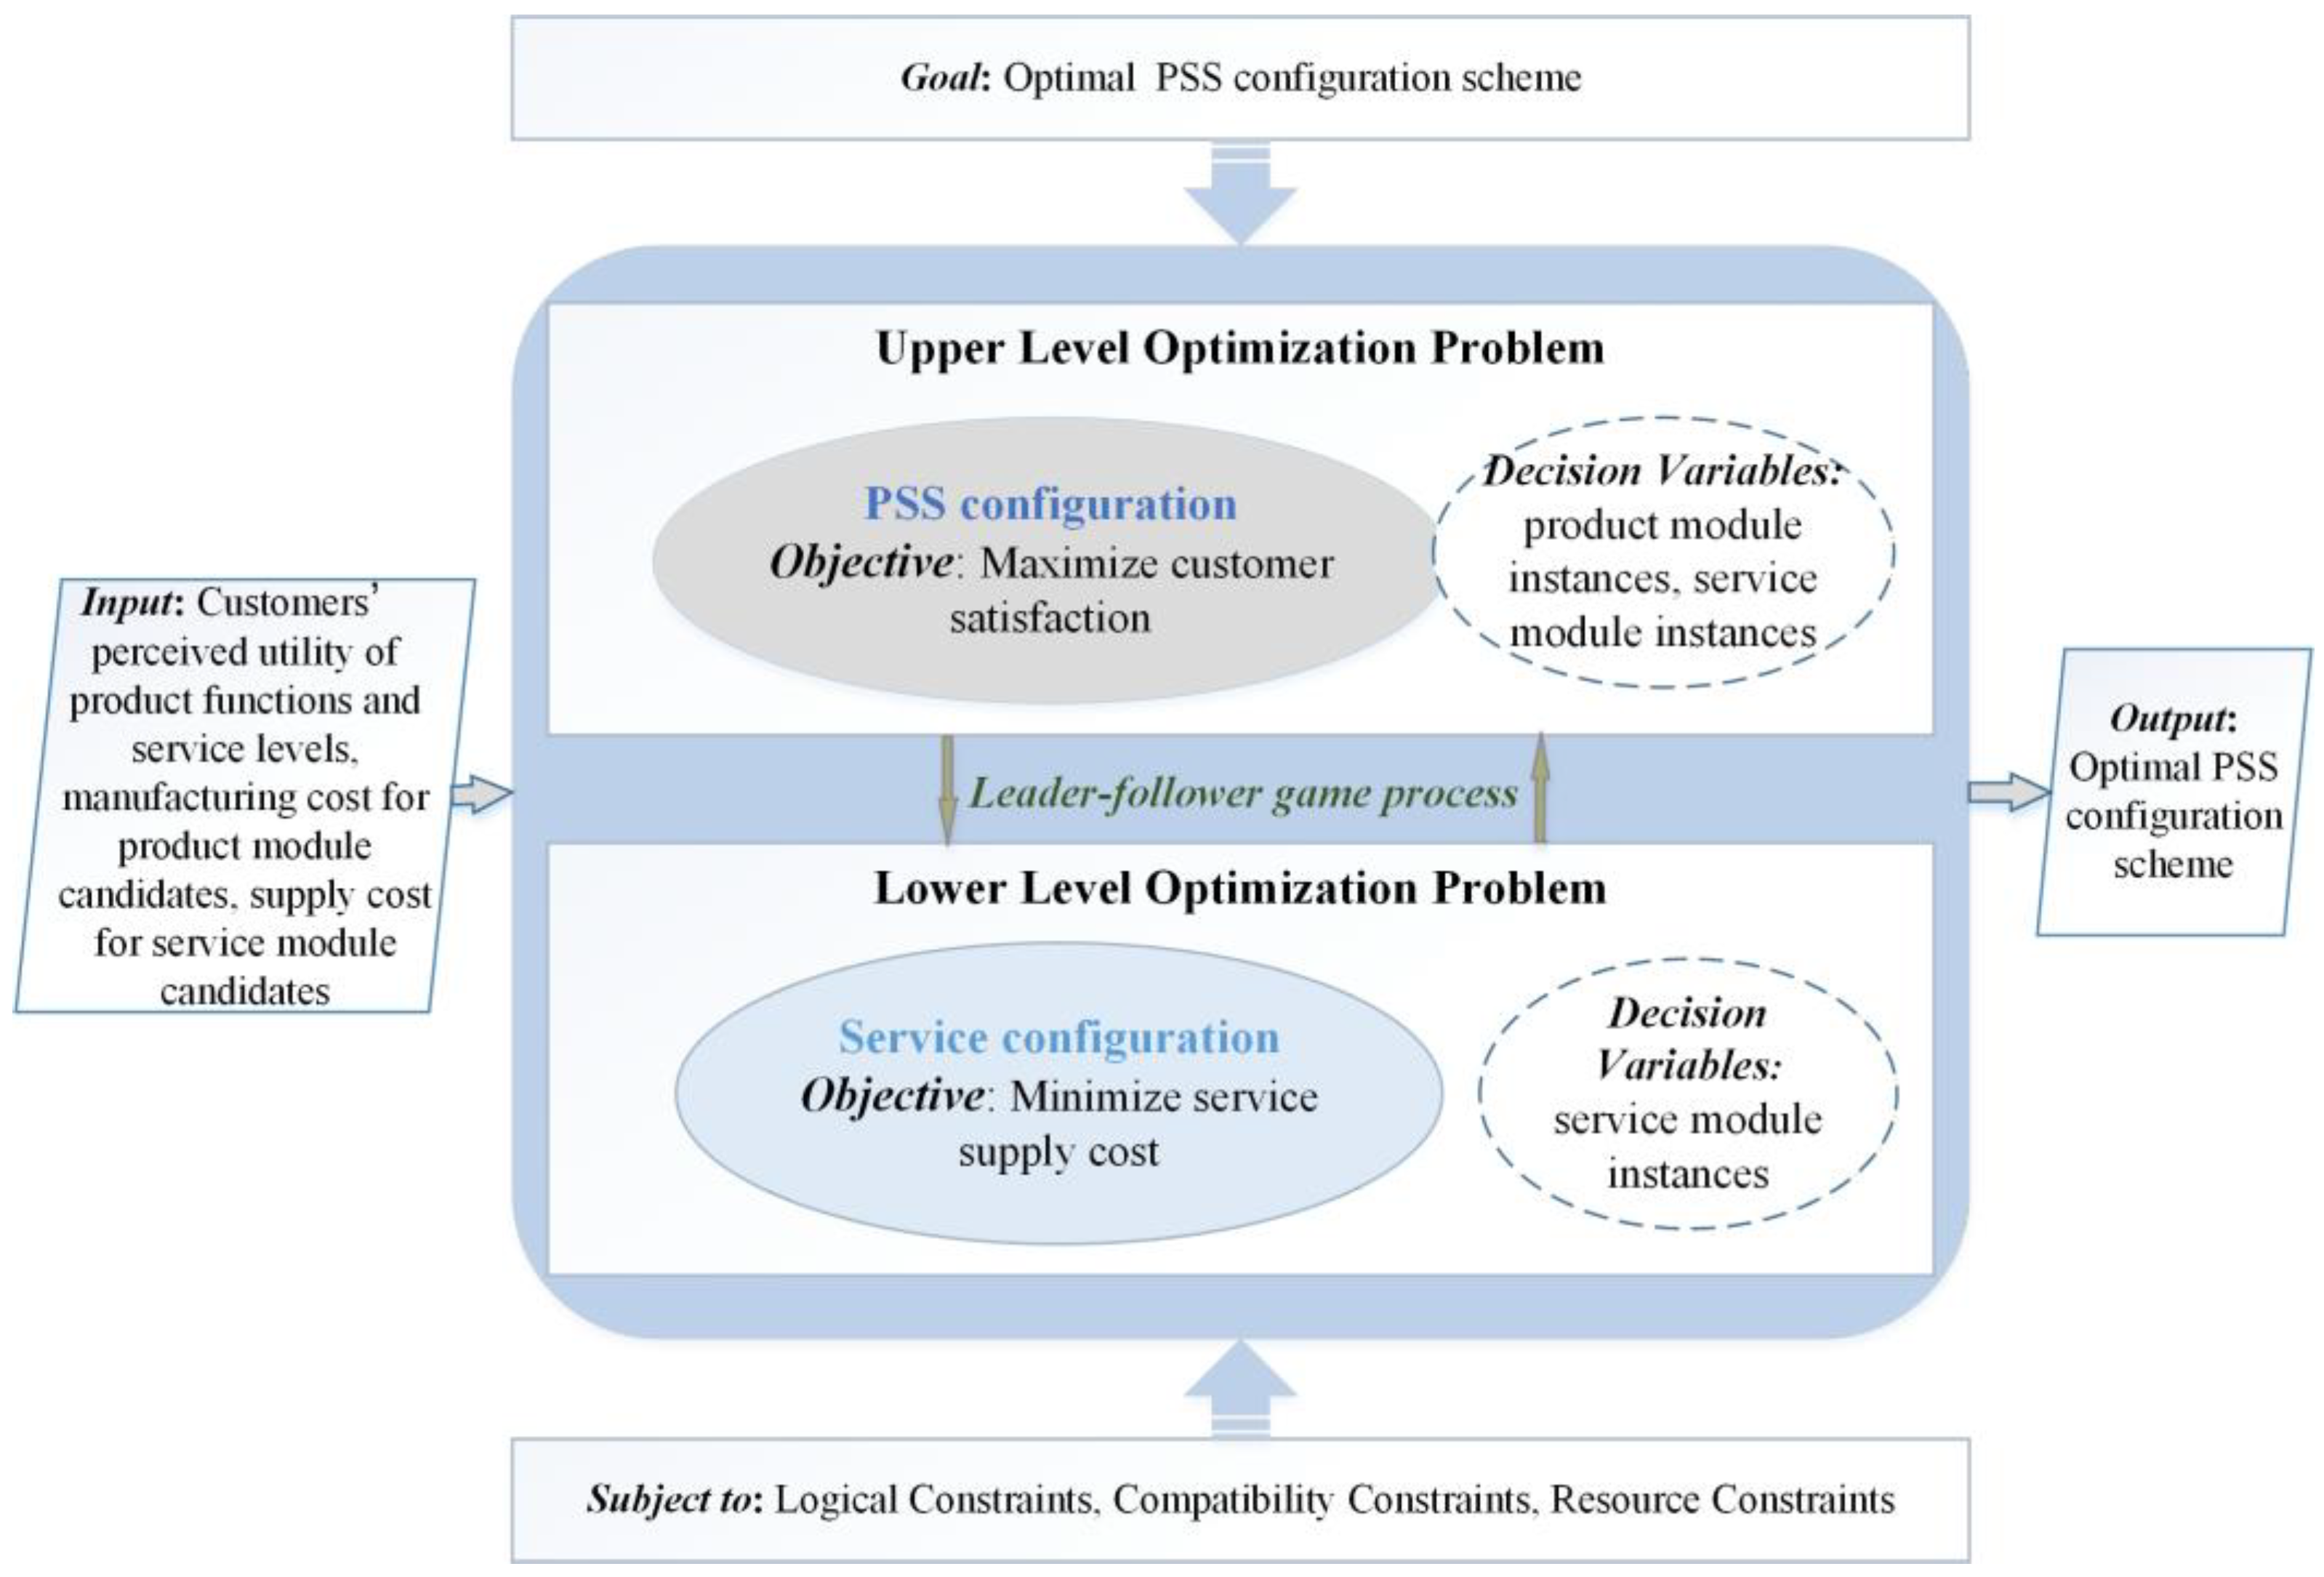
The decision-making process associated with PSS configuration and service configuration can be represented as shown in
Figure 2. The decision optimization process is primarily conducted from the perspectives of the PSS provider, aiming to offer PSS schemes that meet customer demands. The PSS provider’s objective is to maximize customer satisfaction by optimizing the utility per unit cost. This objective effectively balances customer satisfaction with the product, service and cost efficiency. In the process of configuring PSS schemes, the PSS provider typically outsources services to service providers, collaborating with them to enhance service quality. Service providers prioritize controlling service supply cost, aiming to minimize them to enhance operational efficiency and strengthen market competitiveness. Due to the heterogeneity of the hierarchical decision-making process and the conflicts of interest between the PSS provider and service providers in the PSS configuration, we investigate the PSS configuration problem from the perspective of the leader–follower interaction.
3.3.1. Upper-Level Optimization: PSS Configuration
Given that the goal of the PSS provider is to configure PSS schemes for customers, the upper-level design aims to maximize customer satisfaction through the perceived utility per unit cost. Customer satisfaction is not only related to the perceived utility of product quality and service levels but is also closely linked to the cost paid by customers to obtain these utilities [
29]. In this study, customer satisfaction is defined as the perceived utility gained per unit cost, which is a comprehensive metric that reflects the contribution of each module to meeting customer needs. The utility of PSS modules is used to quantify the factors affecting customer utility [
32,
35]. In the configuration of the PSS, considering the diversity and significance of module attributes, we utilize conjoint analysis to quantify the deterministic factors influencing customer utility derived from the functions of product modules and service modules. In addition to deterministic factors, random factors such as unobserved variables, measurement errors, demand fluctuations, and changes in market competition can introduce randomness into utility [
33,
36]. Therefore, random error terms are introduced to quantify the random factors affecting customer utility. The total perceived utility per unit cost is then calculated by combining the scheme’s cost, which is used to evaluate customer satisfaction. In this way, customer satisfaction depends not only on the utility of products and services but also on cost-effectiveness, ensuring that the PSS configuration meets customer needs while helping PSS providers gain a competitive advantage in the market.
where Equation (1) represents the fitness function
F1 of the upper-level PSS configuration model, which is mainly expressed by the perceived utility per unit cost of both the product modules and the service modules of the PSS scheme.
F1 denotes the customer satisfaction, and
pt denotes the probability that a customer chooses the configuration scheme in market segment
t.
Equation (2) represents the total perceived utility of the PSS configuration from the customer’s perspective, which primarily includes the perceived utility of the product functions, the perceived utility of the service levels, and the random error term of product and service utility. Based on the research into random error [
44,
45], this paper assumes that the random error term of product and service utility follows a normal distribution.
An expert panel was established to conduct multi-attribute decision-making for the evaluation of utility values. The experts negotiated the composite rating of the utility value of each module on a scale of 0 to 50 and normalized the results. The utility values for each module candidate are calculated according to the following Formula (3). The comprehensive utility
Ut is calculated according to the Formula (2).
The weight (, ) of each configuration module candidate is calculated using multi-attribute group decision-making methods based on dispersion maximization.
In multi-attribute decision-making, dispersion maximization is a technique that evaluates the weights of candidate alternatives according to the degree of data dispersion. It is commonly applied in group decision-making contexts and aims to determine the relative importance of decision objects by maximizing their variability. In this study, the weights of module instances and modules are calculated based on the experts’ ratings of the utility values of module instances. Let the ratings of each module instance be represented by the matrix
X = [
xije], where
xije denotes the score assigned to the
j-th instance of the
i-th module by the
e-th expert. For each module instance
i, the mean value is first calculated as:
where
is the mean score of the
j-th module instance of
i-th module,
xije is the score assigned by expert
e, and
E is the number of experts.
To achieve dispersion maximization, the dispersion measure of each module instance is then calculated, typically using variance or standard deviation. For each module instance
j, the dispersion
Dij is defined as:
where
sij2 is the variance of the
j-th module instance for
i-th module, representing the degree of dispersion in expert evaluations. A larger variance indicates greater dispersion and, therefore, higher uncertainty in the utility evaluation of that module instance. The weight
wij of the
j-th module instance for the
i-th module is calculated as the ratio of its dispersion to the total dispersion. Let the total dispersion of all module instances be
Dtotal. Then, the weight of the
j-th module instance for
i-th module is given by:
The weight of each module is obtained as the weighted aggregation of the weights of its corresponding module instances. Suppose module
i contains
J module instances, and
wij denotes the weight of the
j-th instance under module
i. The weight
Wi of module
i can be expressed as:
where
Dij represents the dispersion of the
j-th module instance for the
i-th module. The weight
wij of each module instance reflects its relative importance in the overall utility evaluation. Correspondingly, the weight
Wi of each module indicates its relative importance among all modules.
The probability of customers in each market segment choosing a particular option is affected by many factors, such as product price, product quality, the form of service, and the level of service.
Equation (9) represents the sum of random errors in product and service utility across all uncertain scenarios. The random error term is handled using a scenario-based stochastic optimization method. The scenario-based stochastic optimization method solves optimization problems with uncertainties by constructing and analyzing multiple possible scenarios. This method is used to deal with the utility uncertainties in the scenario of the product function and service level.
Equation (10) defines the total cost of the PSS configuration scheme. Equation (11) represents the total manufacturing cost of the product modules within each PSS configuration scheme. Equation (12) denotes the service supply cost, calculated by summing the candidate supply costs for each service module.
Equation (13) ensures that the selection of each product module is mandatory. Equation (14) ensures that the selection of each service module is mandatory.
Equation (15) guarantees the uniqueness of the selected candidate for each product module. Equation (16) guarantees the uniqueness of the selected candidate for each service module. Finally, Equation (17) specifies the decision variable as binary, taking values of either 0 or 1.
3.3.2. Lower-Level Optimization: Service Configuration
As a lower-level optimization problem of the leader–follower joint optimal configuration of the PSS scheme, the goal of the service configuration is to minimize the service supply cost. After the lower-level model is solved and the service configuration results are determined, the results are fed back to the upper-level model.
where Equation (18) represents the fitness function
F2 of the lower-level service configuration model, which is mainly composed of the service supply cost for the module candidates.
Equation (19) indicates that each service module is mandatory. Equation (20) represents the uniqueness of the selection of module candidates for each service module. Equation (21) represents the value range of the decision variable, which is taken as 0 or 1.
According to the characteristics of the specific PSS scheme configuration, some product modules and service modules have mutually constraining relationships during the configuration process. There are situations where they need to be selected at the same time, or cannot be selected at the same time. Therefore, it is essential to add the corresponding constraints according to the specific PSS scheme configuration problem when applying the bi-level model.
Overall, the problem of PSS configuration and service configuration is represented as a leader–follower optimization model. The upper level of the model, as the leader, is the PSS configuration process. The PSS provider decides the product module candidates and service module candidates that are to initially access the PSS configuration schemes. In addition, the lower level of the model, as the follower, is the service configuration process. Considering the delivery and realization of services, the service providers make service supply solution decisions by selecting service module candidates. It is noted that the lower-level decisions are made under the upper-level PSS configuration results. Therefore, the leader–follower joint bi-level optimization model is represented as follows:
s.t. constraint Equations (2), (9)–(17) and (19)–(21).
Here, F1 represents the upper-level optimization objective, namely customer satisfaction, while F2 represents the lower-level optimization objective, i.e., service delivery cost. Meanwhile, F1 and F2 also serve as the fitness functions of the upper-level and lower-level optimization problems, respectively.
3.4. A Simple Numerical Example
To enhance the clarity and transparency of the proposed mathematical model, a simplified numerical example is provided to illustrate how the model parameters and objective functions are calculated. This subsection gives a minimal numerical example based on a simple product: two product modules,
R1 and
R2, and two service modules,
S1 and
S2, each with two options. All data are fictitious and used only to illustrate how the model quantities are computed. The full model and solution algorithms are in
Section 5 and
Section 6.
The decision vector consists of the product component
x and the service component
y. Let
CR denote the manufacturing cost of product modules and
CS denote the delivery cost of service modules. The total cost of the PSS configuration is
C = CR + CS. Let
UR and
US represent the utility contributions of product modules and service modules, respectively. The total utility is defined as
Ut = UR + US +ε, where
ε represents a random error term reflecting unobserved factors affecting customer utility. The upper-level objective is customer satisfaction, defined as
F1 = (
Pt Qt Ut/C), while the lower-level objective is the service cost, defined as
F2 = CS. The module weights are simplified by assuming equal importance.
Table 4 presents the costs and utility values of each option. The parameters are set as
Pt Qt = 200 and
= 0.
In this example we only impose one option per module for product and service. There are no product–service coupling constraints, so for each product configuration there are four feasible service configurations. Given a product configuration, the lower level chooses the service configuration that minimizes F2. We take product configuration R11 and R22, i.e., x = (1, 0, 0, 1).
Step 1: Product cost and utility. CR = 1 × 100 + 0 × 200 + 0 × 150 + 1 × 180 = 280. UR = wi × (1 × 2.0 + 0 × 2.5 + 0 × 2.2 + 1 × 2.8) = 0.5 × 4.8 = 2.4.
Step 2: Service configuration and cost. Given this product configuration, the feasible service options are (S11, S21), (S11, S22), (S12, S21), (S12, S22) with service costs 170, 190, 210, 230. The minimum is 170, so the chosen service is S11 and S21, i.e., y = (1, 0, 1, 0). Thus CS = 170 and F2 = 170. US = wj × (1 × 1.0 + 0 × 1.4 + 1 × 1.1 + 0 × 1.3) = 0.5 × 2.1 = 1.05.
Step 3: Total cost, total utility, and upper-level objective. The full configuration is (R11, R22, S11, S21). C = CR + CS = 280 + 170 = 450. Ut = UR + US = 2.4 + 1.05 = 3.45. F1 = (Pt Qt × Ut)/C = (200 × 3.45)/450 = 1.533.
The above steps show how each quantity in the model—constraints, costs, utilities, and the two objectives—is obtained from the formulas in
Section 3.1,
Section 3.2 and
Section 3.3. The full problem and solution algorithms are addressed in the following sections.
4. Algorithm Development
The PSS scheme configuration problem, based on bi-level optimization, is an example of complex multi-objective programming. The diversity of module configurations, the discrete nature of the decision variables, and the presence of multiple conflicting objectives add significant complexity to the process of product and service configuration. NSGA-II is a traditional heuristic algorithm with the advantages of a low computational complexity, fast solution speed, and a stable convergence of the solution set [
46]. However, when coping with complex bi-level multi-objective optimization problems, the convergence speed and performance of NSGA-II may be affected. In terms of the challenge, an improved DPC-NMHA is introduced in this paper. The improved DPC-NMHA combines the advantages of NSGA-II’s robust convergence and fast solution generation with MOPSO’s global search capabilities and swarm intelligence-based exploration. The synergy between the two algorithms allows for a more effective search of the solution space, improving both the diversity and quality of the Pareto front. Compared with the NSGA-II, the improved DPC-NMHA is better suited for handling the hierarchical structure of bi-level optimization, as it leverages the co-evolutionary mechanism of two populations to optimize product and service configurations simultaneously. The introduction of Multi-Objective Particle Swarm Optimization (MOPSO) enhances the algorithm’s ability to explore the solution space more thoroughly, especially for complex, multi-target scenarios such as PSS configuration and service delivery. Studies have demonstrated that hybrid approaches, particularly those involving evolutionary algorithms and swarm intelligence, are effective for solving complex multi-objective problems [
47]. Therefore, the improved DPC-NMHA is proposed in this paper to solve the leader–follower optimization problem in PSS configuration, ensuring a more balanced and efficient optimization process across both levels.
The main parameters of the proposed algorithm are set as follows: the population size is 100, the maximum number of iterations is 200, the crossover probability is 0.8, and the mutation probability is 0.1.
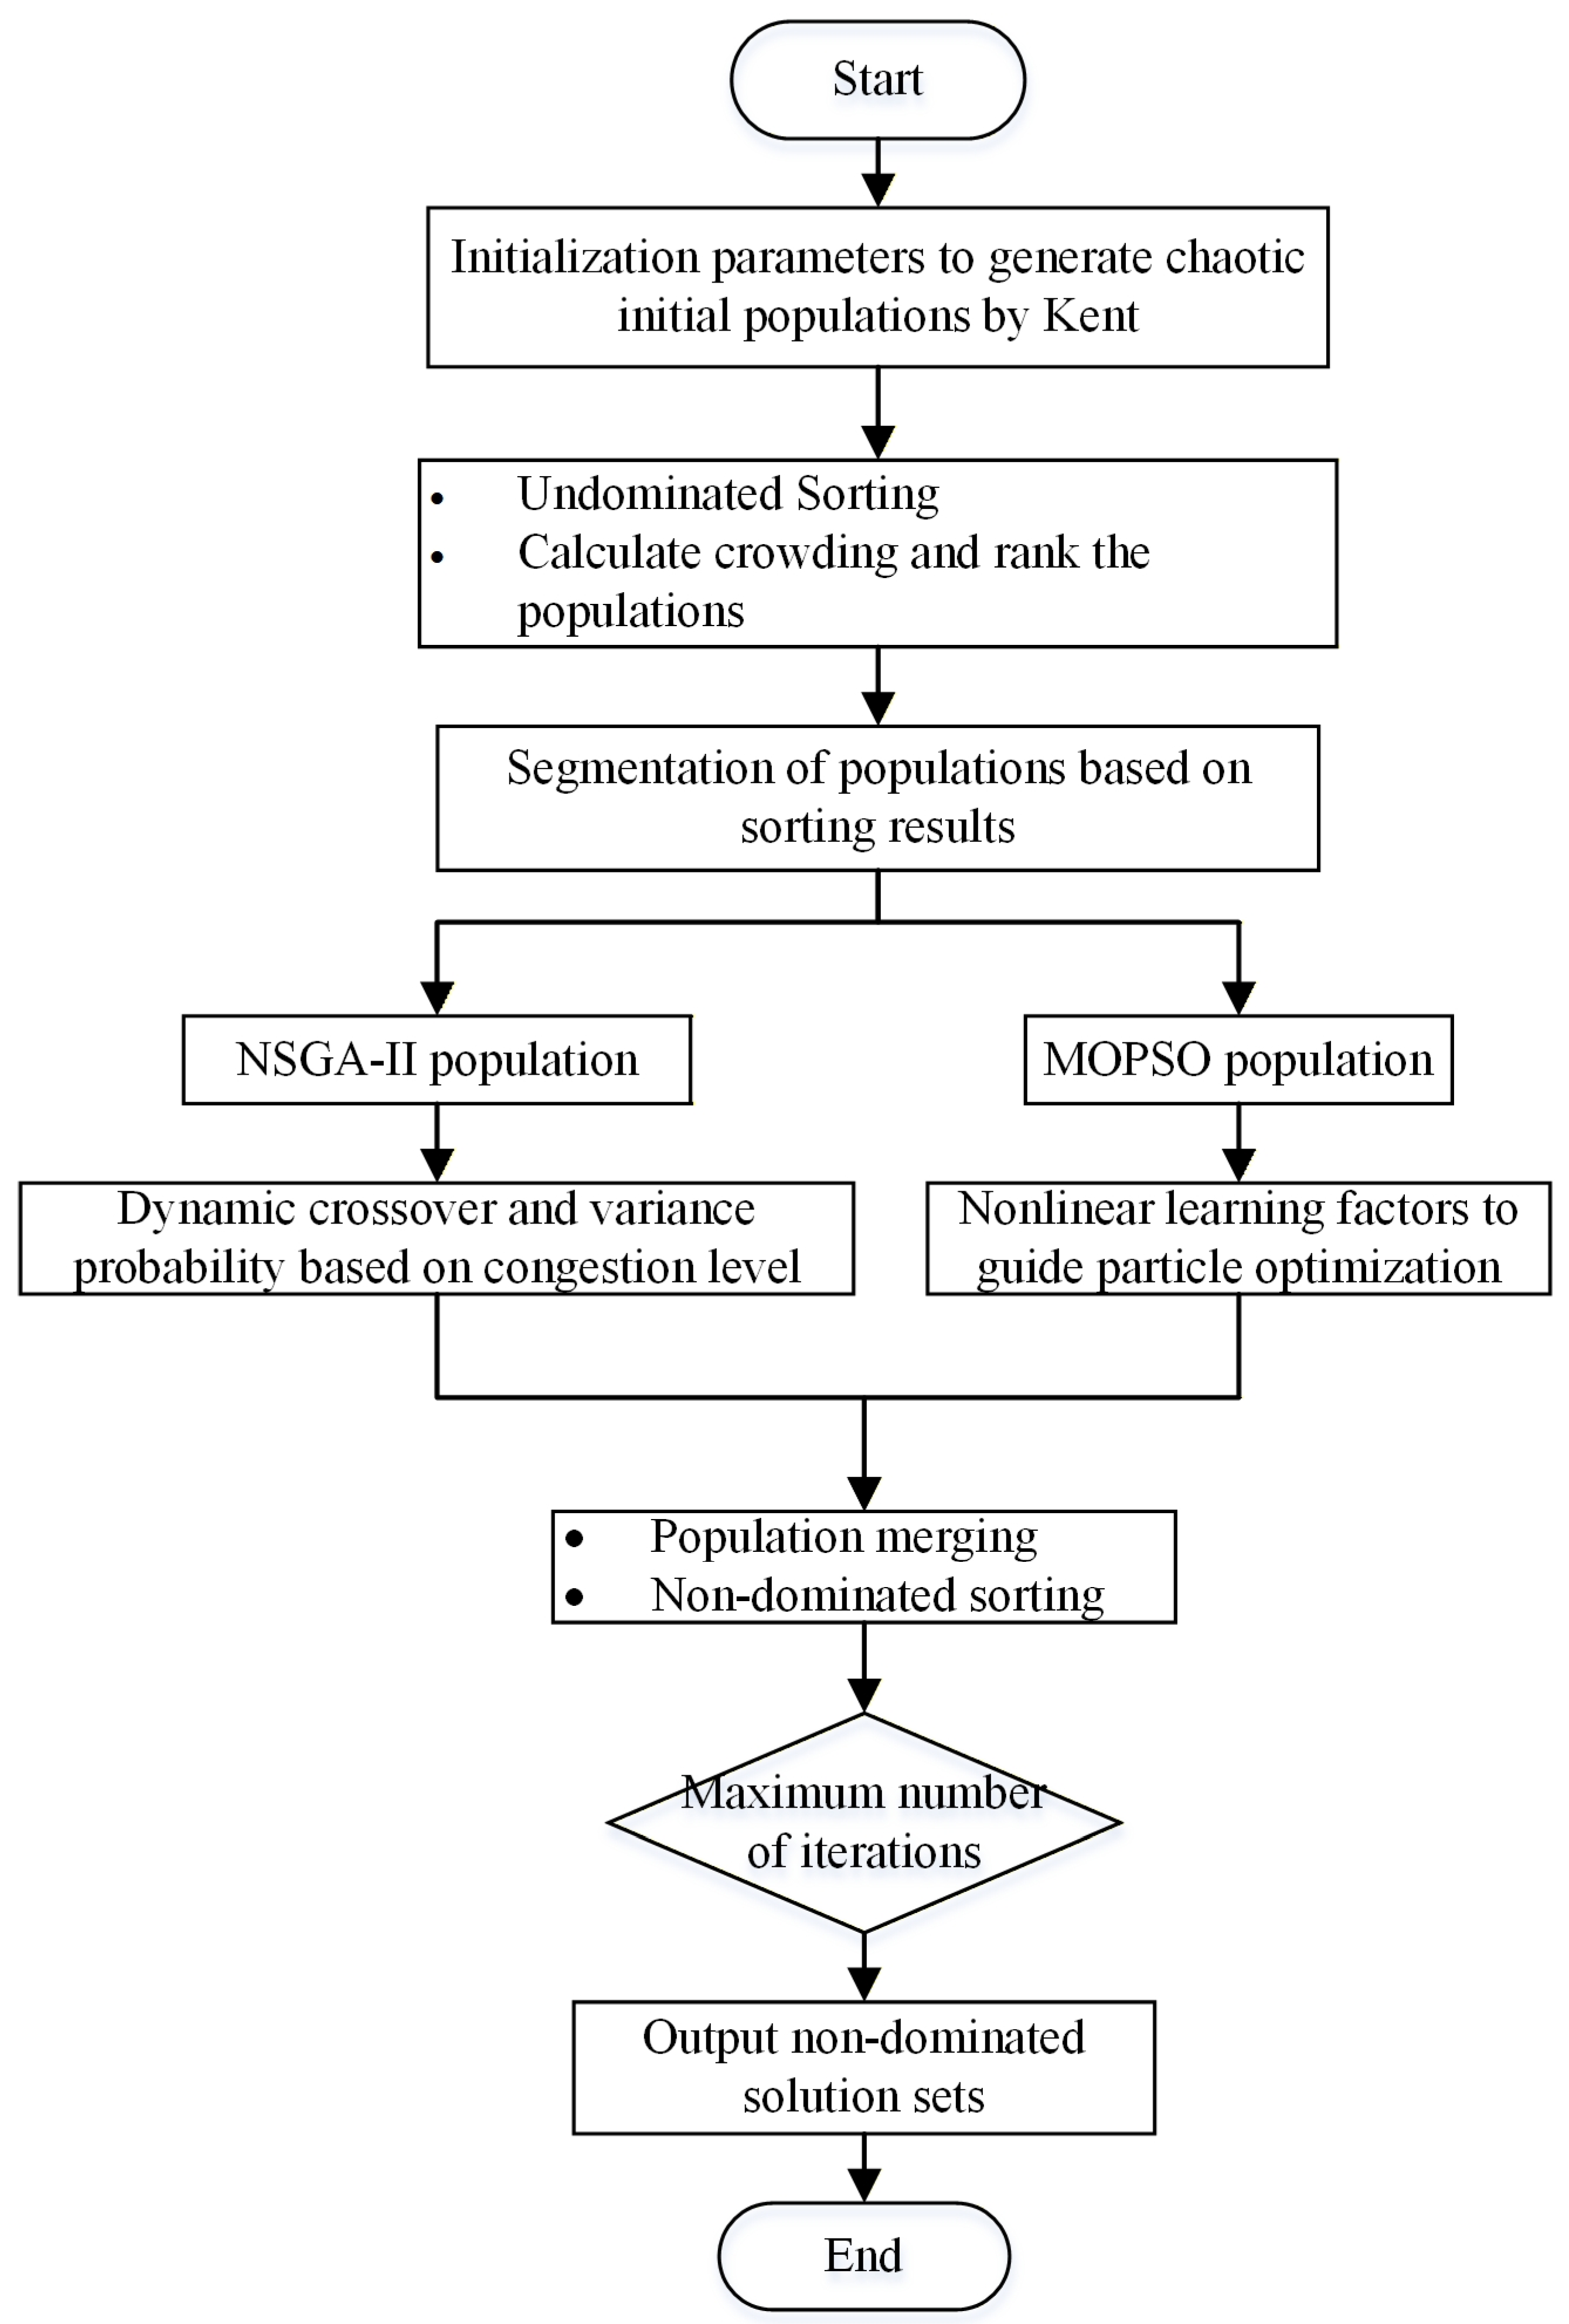
The solution process of the PSS configuration bi-level optimization model based on the improved DPC-NMHA is shown in
Figure 3.
Step 1: Initialization of the product and service selection process. Algorithm parameters are initialized according to the predefined settings. The Kent mapping strategy is used to generate an initial population, and the customer satisfaction for each solution is calculated.
Step 2: Non-dominated sorting and crowding distance calculation. Non-dominated sorting is performed on the initial population, and the crowding distance for everyone is calculated to ensure diversity. The population is then sorted based on a non-dominated sorting and crowding distance.
Step 3: Population division. Based on the sorting results, the population is divided into two parts: the top half of the elite population is selected for NSGA-II operations, and the remaining non-elite population is selected for MOPSO operations.
Step 4: Dynamic crossover and mutation probability in NSGA-II. Crossover and mutation probabilities are dynamically adjusted based on the crowding distance. Crossover and mutation operations are performed to generate offspring.
Step 5: Nonlinear learning factor-guided optimization in MOPSO. The learning factors (CR and CS) are dynamically adjusted, and particles’ velocities and positions are updated. Mutation operations are applied, and offspring are generated.
Step 6: Population merging and non-dominated sorting. The offspring generated by NSGA-II and MOPSO are combined. Non-dominated sorting is performed on the merged population, and the crowding distance is calculated.
Step 7: Iteration stopping condition check. The maximum number of iterations is checked. If the stopping condition is not met, the process returns to Step 3 and repeats. If the condition is met, the final set of non-dominated solutions is produced, representing the Pareto-optimal configuration of products and services.
Specifically, in Step 2, the procedure for selecting superior candidate solutions in the NSGA-II algorithm is mainly based on three key steps:
- (1)
Non-dominated sorting. First, the solutions in each generation are ranked using non-dominated sorting. The purpose of this procedure is to divide the solutions into multiple hierarchical fronts according to dominance relationships. Solutions in the first front are not dominated by any other solutions and therefore belong to the Pareto frontier. Solutions in the second front are dominated only by those in the first front, and the process continues in the same manner for subsequent fronts. Through this ranking mechanism, we can identify the most competitive solutions as well as those that are relatively inferior within the overall solution space.
- (2)
Crowding distance. To maintain diversity in the solution set, the crowding distance metric is introduced. The crowding distance measures the relative density of solutions in the objective space and helps prevent excessive concentration in certain regions. After non-dominated sorting, solutions with smaller crowding distances are regarded as superior candidates and are given higher priority during the selection process. This mechanism ensures that the selected solutions not only represent high-quality Pareto-optimal solutions but also preserve diversity within the population.
- (3)
Selection operation. During the selection stage, candidate solutions are screened based on their non-dominated rank and crowding distance. The selected solutions are then used in crossover and mutation operations to generate offspring for the next generation, thereby progressively improving the quality of the population.
5. Case Study
5.1. Background and Data
Enterprise A in China is a famous electrical appliance enterprise whose main products include refrigerators, washing machines, and air conditioners. In recent years, the business has begun a strategic transition to an intelligent product–service ecosystem, providing customers with a scene-oriented PSS. To meet the demands of customers in different market segments, Enterprise A will outsource services to service providers to configure the optimal PSS solution that satisfies the interests of Enterprise A as the PSS provider and service providers. Meanwhile, the configuration of PSS solutions is carried out through the study of the interactions between PSS configuration and the delivery and realization of services. The proposed method in this paper is used to determine the optimal PSS configuration scheme for the refrigerator product and service modules of Enterprise A.
Based on the proposed bi-level optimization model, the configuration of the refrigerator PSS is analyzed. The attributes and functions of the product modules and service modules are shown in
Table 5 and
Table 6. The relevant module attributes and cost are obtained in an interview with the company’s engineers and technicians. The costs involved in the case are indicated in RMB (¥). Further, eight product modules are listed in
Table 5, and each product module corresponds to a different number of product module instances. Similarly, five service modules are listed in
Table 6, and each service module corresponds to a different number of service module instances. The module instances have different attributes in each basic module. Under a few constraints, the module instances of different modules are combined to form a variety of feasible PSS schemes. These PSS schemes result in different customer satisfaction levels and service supply costs. In addition, there are also differences in the delivery and realization processes for the different service module instances selected. Accordingly, Enterprise A needs to configure the appropriate product modules and service modules to enhance customer satisfaction with PSS schemes. Meanwhile, service providers also decide the service supply solutions to reduce the service supply cost. Finally, the goals of Enterprise A and its service providers are achieved.
When configuring the interaction between the product modules and the service modules, the product module instance “Refrigeration Module 1 (R31)” adopts an environmentally friendly air supply to keep the ingredients fresh for a long time by not blowing them directly and not drying them out. Since it does not contain any sensors, it is not possible to monitor the refrigeration effect in real-time. Further, R31 interacts with the service module instance “Regular Maintenance Service (S31)”.
The product module instance “Refrigeration Module 2 (R32)” adopts a fine-control sensor and a multi-layer air outlet design, which provides uniform cooling without any dead angle. So, it can be remotely monitored to carry out maintenance if it is found that there is a problem with the refrigeration system. Further, R32 interacts with the service module instance “Monitoring of Maintenance Service (S32)”.
Examples of product modules “Freshness and Bacteria Removal Technology System 1 (R61)” and “Freshness and Bacteria Removal Technology System 2 (R62)” use dual deodorizers and UV photocatalytic antimicrobials to preserve freshness and remove bacteria from food in the refrigerator, respectively. Due to the two types of sterilization requiring periodic replacement of the sterilization filters and catalytic substances, they interact with the service module instance “Regular replacement of decontamination filters/catalytic substances (S41)”.
The product module examples “Freshness and Bacteria Removal Technology System 3 (R63)” and “Freshness and Bacteria Removal Technology System 4 (R64)” use the LECO odor purification system and the AI intelligent bacteria removal system. Both decontamination methods are carried out by means of intelligence. Therefore, they interact with the service module instance “Remote Upkeep Service (S42)” when performing maintenance services.
The product module instance “AI Wisdom Space 1 (R71)” puts dairy products into the AI wisdom zone and automatically recognizes the number of dairy products after closing the refrigerator door. Purchase alerts are sent when the quantity is within one of the set alert ranges. R71 interacts with the service module instance “Purchasing reminder service (S51)”.
The product module instance “AI Wisdom Space 2 (R72)” can enter the shelf life and type of food, and then recommend recipes based on that entry. Module instance R72 interacts with the service module instance “Recipe Recommendation (S52)”.
5.2. Modeling
Assuming that there is only one target market analyzed, i.e., T = 1, there are four types of competitive refrigerator products in the segment. It is an equal probability that customers choose any type of refrigerator product without being affected by preferences, i.e., Pt = 0.25. Furthermore, it is assumed that the demand for refrigerators in the market segment Qt is 6000.
The optimization objective of the upper-level model is to maximize customer satisfaction. Customer satisfaction is expressed by the perceived utility of the unit cost. Customer-perceived utility is obtained by summing the perceived utility of product function and the perceived utility of service supply. In this paper, it is assumed that each product module (i = 1, 2, …, 8) has the same contribution weight wi to the perceived utility of the product function. Further, customer-perceived utility in the product configuration is obtained by weighting and summing the utilities of the product modules. Similarly, each service module (j = 1, 2, …, 5) has the same contribution weight rj to the service perceived utility. Customer-perceived utility in the service configuration is obtained by weighting and summing the utilities of the service modules.
To ensure that optimal decisions adequately consider the key factors in PSS configuration, a panel of seven experts in the field of the PSS is formed.
Table 7 summarizes the main members of this panel, which includes professors, business leaders, and industry professionals. These experts are selected based on their extensive experience and knowledge in areas such as product design, supply chain management, and strategic analysis.
The utility values for each module candidate is calculated according to Formula (3). The comprehensive utility
Ut is calculated according to Formula (2). Finally, the results from calculating the utility values for each module candidate are shown in
Table 8.
It is necessary to select the appropriate product and service module instances from the above product modules and service modules. The configuration of PSS schemes achieves the objectives of maximum customer satisfaction and minimum service supply cost. During PSS scheme configuration, not only should the resource constraints of the bi-level model be satisfied, but also the following constraints for product and service configuration according to the characteristics of scheme configuration:
Module instances “Refrigeration Module 1 (R31)” and “Regular Maintenance Service (S31)” need to be selected or dropped at the same time. Module instances “Refrigeration Module 2 (R32)” and “Monitoring of maintenance service (S32)” need to be selected or dropped at the same time. Module instances “Freshness and Bacteria Removal Technology System 1 (R61)” or “Freshness and Bacteria Removal Technology System 2 (R62)” and “Regular replacement of sterilization filters/catalytic substances (S41)” need to be selected or dropped. One of the module instances “Freshness and Bacteria Removal Technology System 3 (R63)” and “Freshness and Bacteria Removal Technology System 4 (R64)” with “Remote maintenance service (S42)” needs to be selected or dropped at the same time. Module instances “AI Wisdom Space 1 (R71)” and “Purchasing reminder service (S51)” need to be selected or dropped at the same time. Module instances “AI Wisdom Space 2 (R72)” and “Recipe Recommendation (S52)” need to be selected or dropped at the same time. The maximum service delivery cost constraint is set as Cs_max = 3000 ¥.
Although Equation (2) of the proposed bi-level leader–follower PSS configuration optimization model incorporates service selection probabilities and normally distributed random errors to represent partial stochasticity and uncertainty, these factors are simplified in the case study of this section for computational convenience. Specifically, the selection probability is assumed to follow a completely random choice, and the random error term is set to zero. In addition, data fuzziness is not considered. This simplification is adopted because the primary purpose of the case study in this section is to validate the proposed bi-level interactive optimization model for PSS configuration and service delivery, as well as the improved DPC-NMHA solution algorithm. In particular, the case aims to illustrate the coupling relationship between the hierarchical decision structure and product–service decisions. Using deterministic data facilitates the independent examination of model behavior and ensures clear and reproducible results. Nevertheless, this simplification introduces certain limitations. In practice, the manufacturing costs of product modules and the delivery costs of service modules may be influenced by market uncertainty; customer satisfaction may be affected by stochastic factors; and expert evaluations of customer-perceived utility for modules may involve fuzziness. Future research may address these issues by introducing non-zero market random errors, incorporating customer behavior theory to quantify customer selection probabilities, and applying fuzzy theory to handle imprecise expert evaluations, thereby enhancing the theoretical contribution and expanding the practical applicability of this study.
The data required to execute the model correspond to the parameters listed in
Table 3. In practice, product and service module options, costs, customer-perceived utility, module weights, market parameters, and coupling constraints can be obtained from the following sources:
- (1)
Modular design of the PSS to define modules and available options;
- (2)
Cost accounting, contracts, or supplier data to determine product and service costs under current market conditions;
- (3)
Customer surveys or conjoint analysis to assess user preferences and calculate perceived utility;
- (4)
Expert evaluation to determine module weights;
- (5)
Market or sales data to estimate market demand;
- (6)
Technical or business rules to define coupling constraints.
This study focuses on the construction of the leader–follower joint optimization model for PSS configuration and service delivery, as well as the development of the improved solution algorithm. Dedicated software tools, decision support systems, or user interfaces have not been developed. Due to space limitations, system development and functionality are not discussed in detail in this paper. In future research, we will further improve this aspect by developing a user-friendly decision support system that integrates data input, parameter configuration, and results visualization, thereby enhancing the practical applicability of the proposed approach.
5.3. Results
In this paper, an improved DPC-NMHA is proposed to solve the PSS scheme configuration problem in MATLAB 2022b. During the implementation of the DPC-NMHA algorithm, the maximum number of iterations is set to max_gen = 200. In the NSGA-II component, the population size is set to 90, the crossover probability is pc = 0.8, and the mutation probability is pm = 0.22. In the MOPSO component, the number of particles is set to Npop = 60, the inertia weight is wmopso = 0.6, the personal learning factor is c1m = 1.5, and the social learning factor is c2m = 1.5.
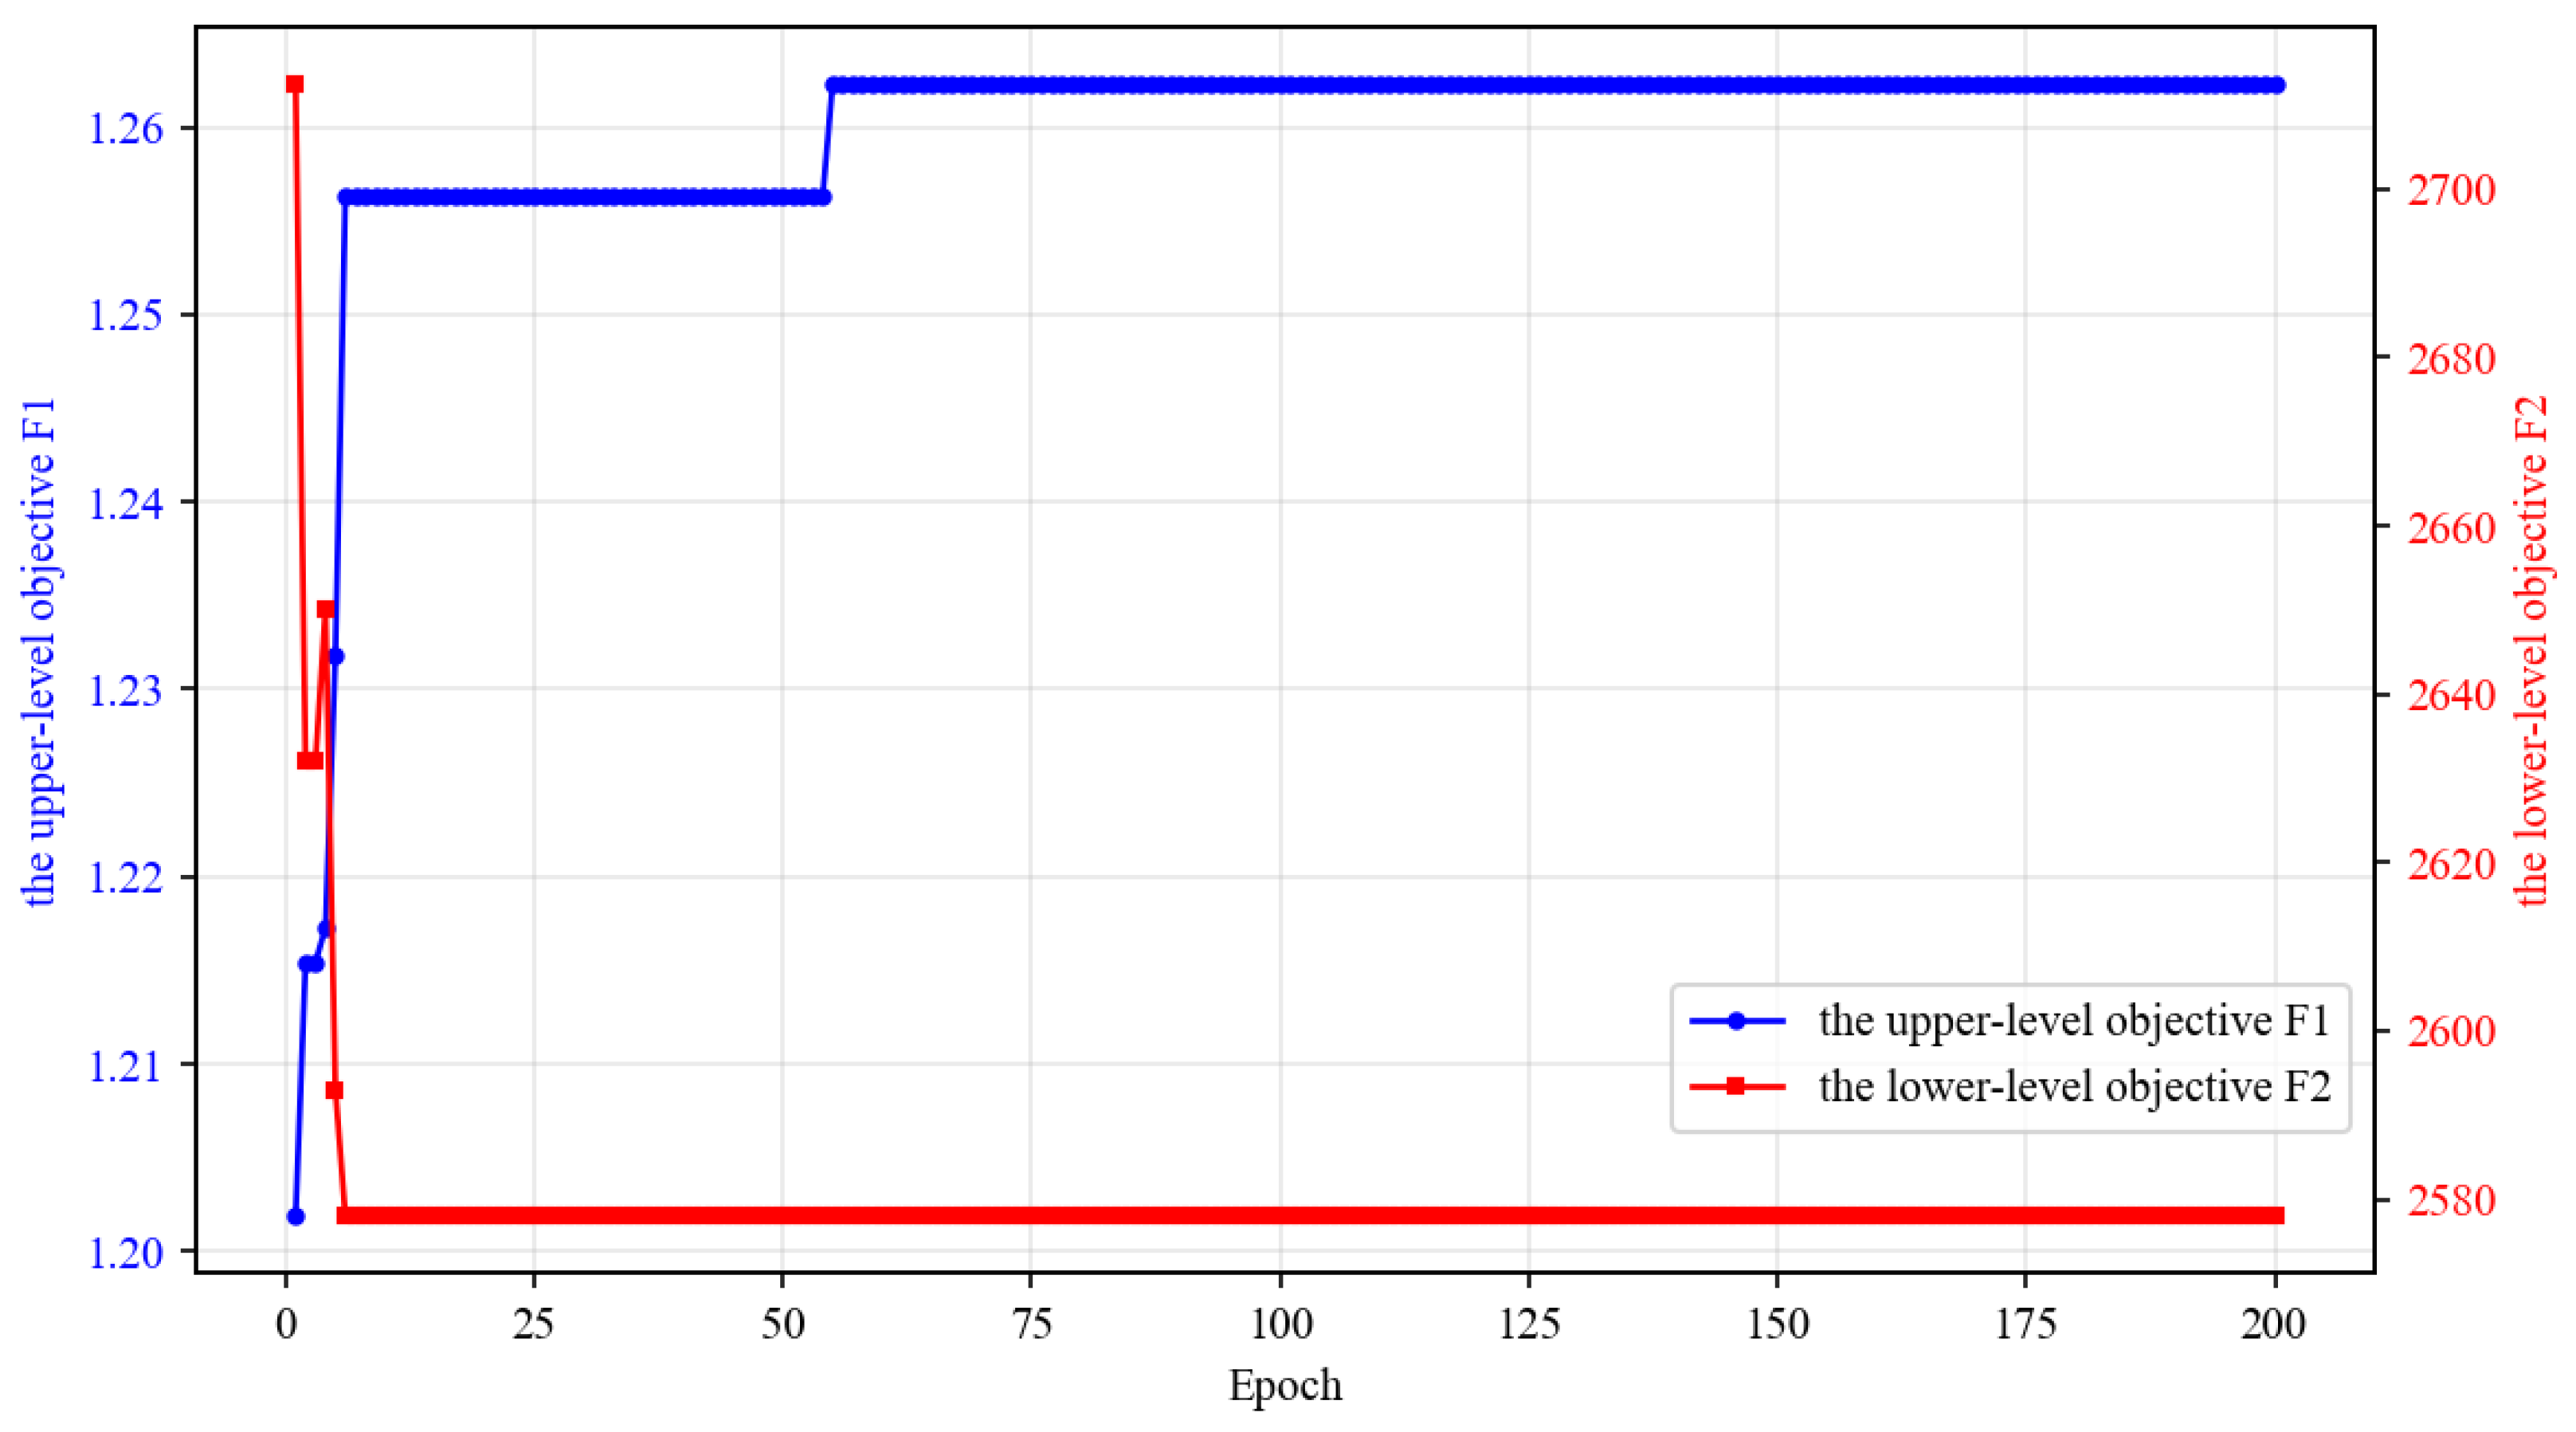
Figure 4 illustrates the variation in the upper-level optimization objective
F1 and the lower-level optimization objective
F2 with respect to the number of iterations during the solution process of the proposed leader–follower PSS configuration optimization model using the improved DPC-NMHA algorithm. It can be observed that both objectives converge at approximately the 70th iteration. Therefore, setting the maximum number of iterations to 200 is sufficient to ensure convergence.
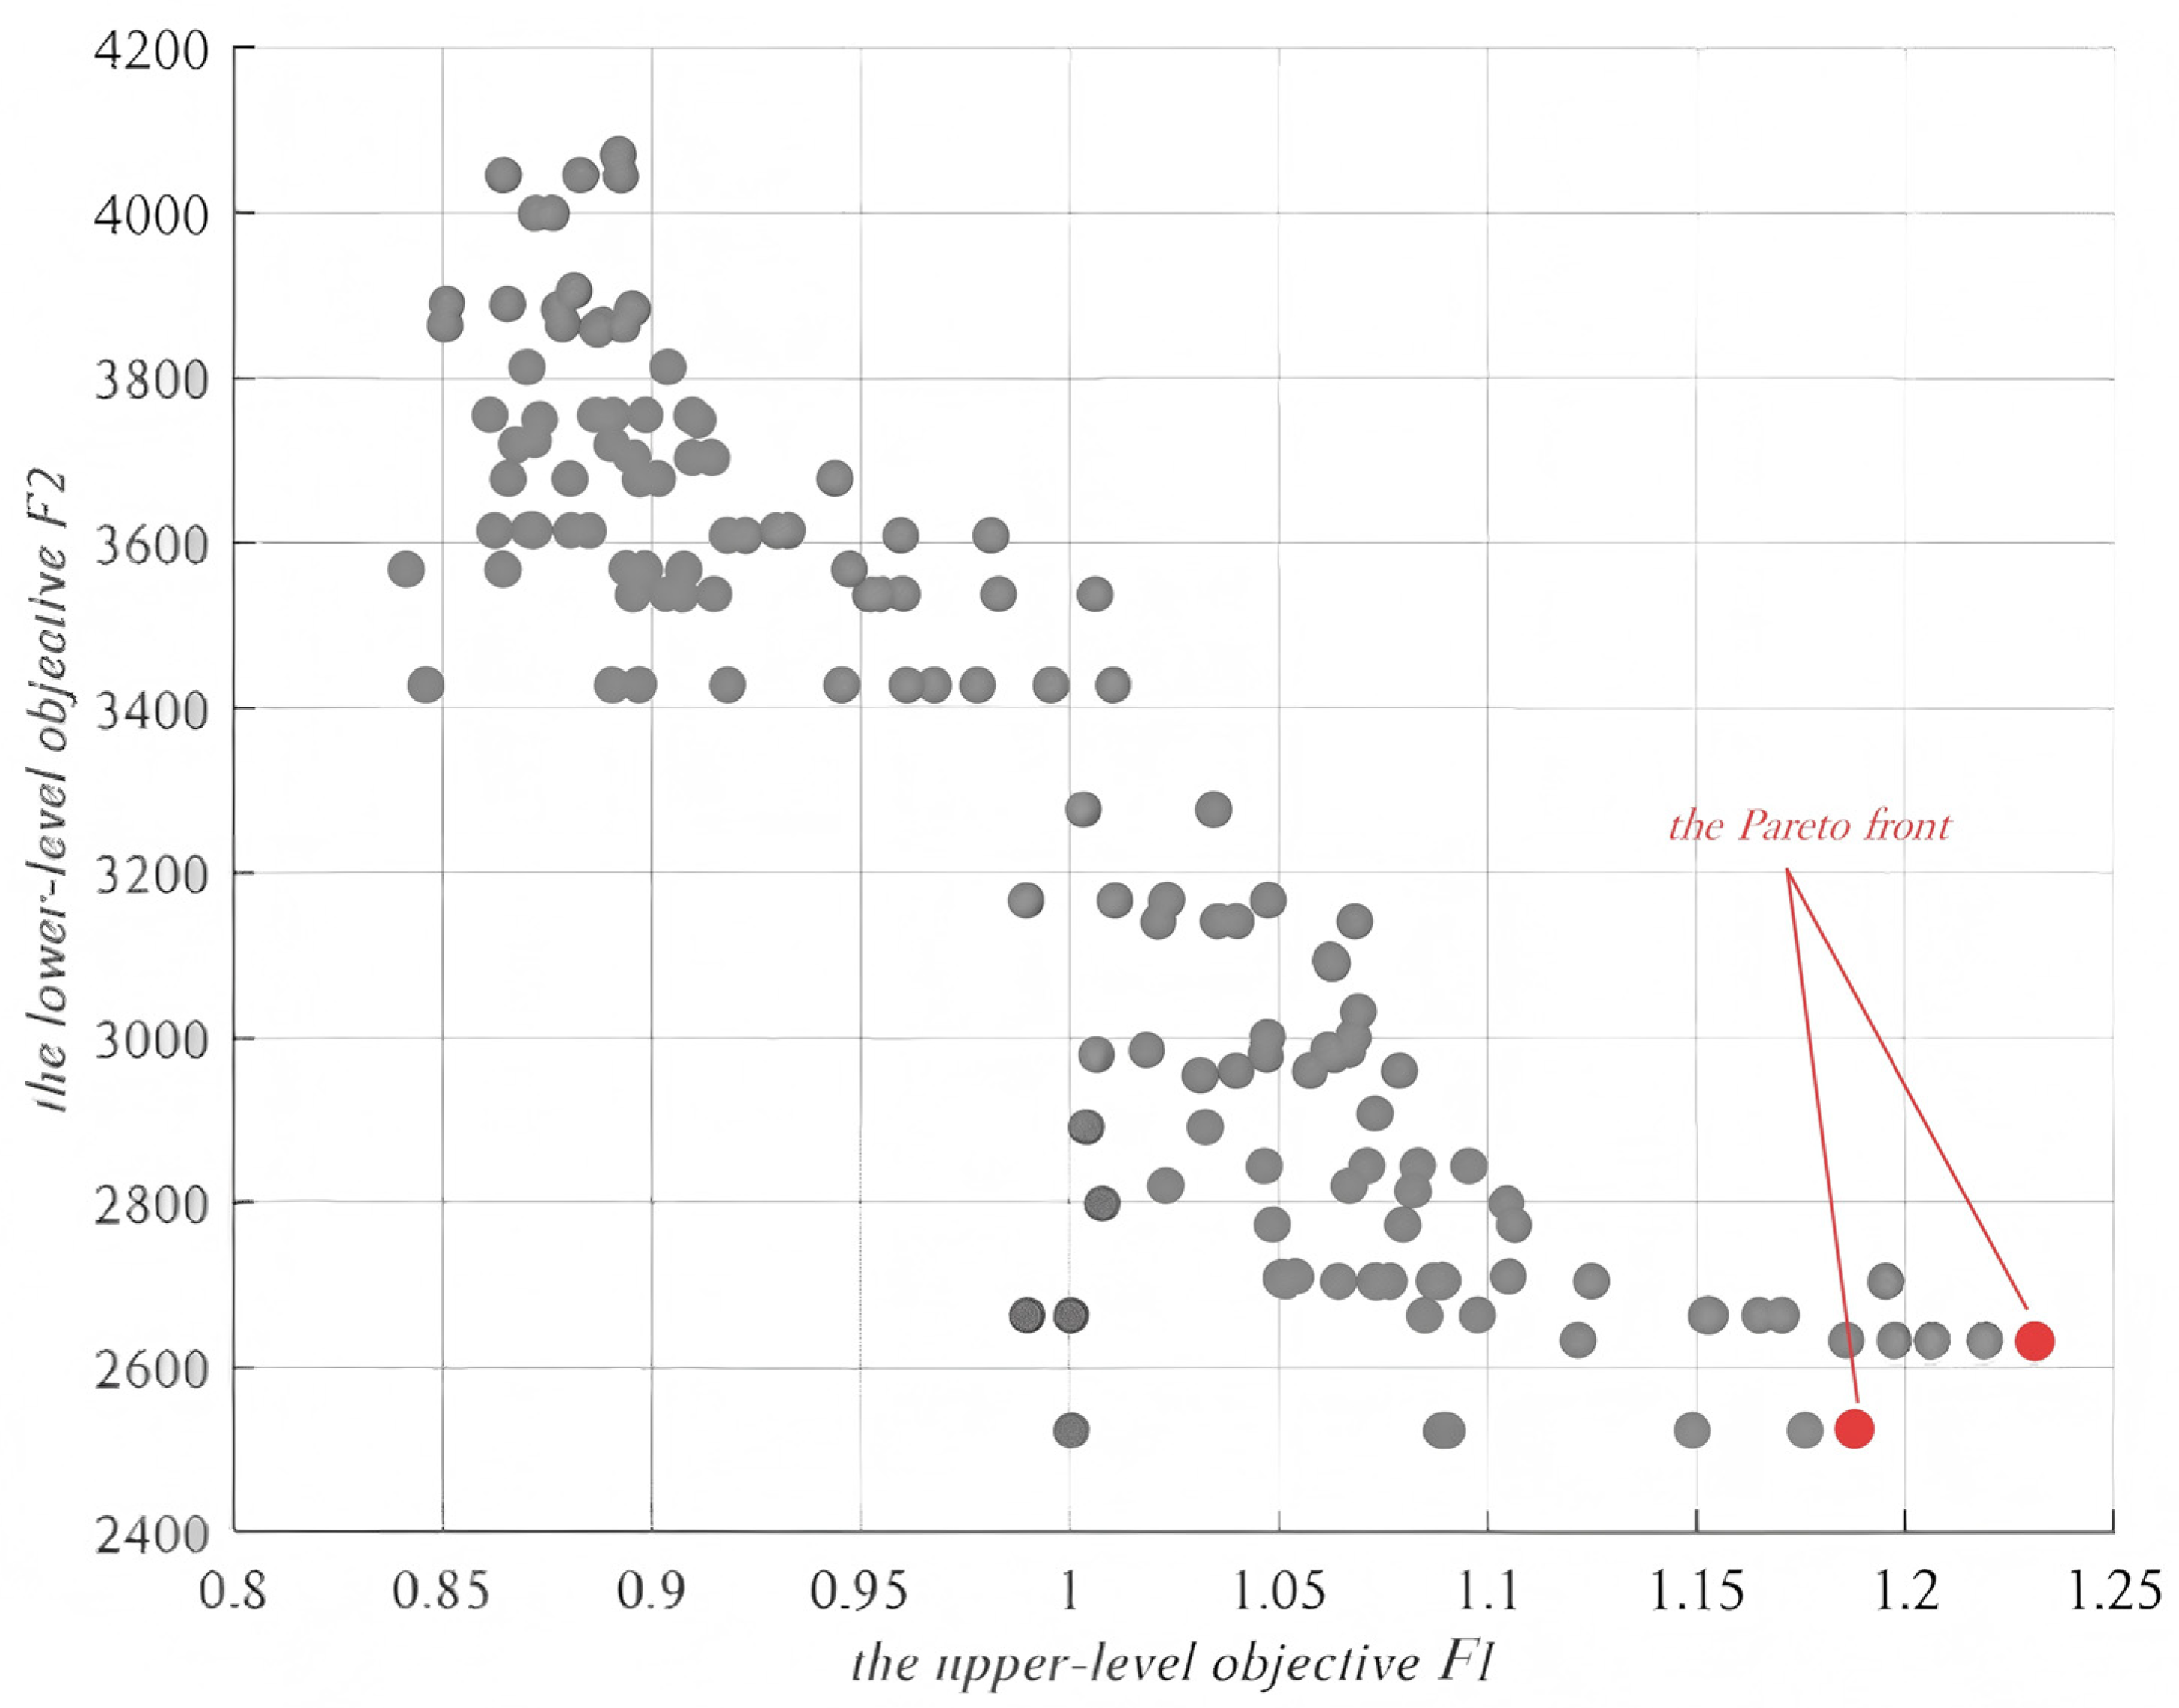
Figure 5 illustrates the Pareto front of the upper-level objective (
F1) and lower-level objective (
F2) derived over the course of 200 iterations. The horizontal coordinate
F1 denotes customer satisfaction, and the vertical coordinate
F2 denotes service supply cost.
Table 9 lists the set of optimal schemes found at 200 iterations. Parameters of the leader–follower optimization model for the set of optimal schemes are shown in
Table 8.
In
Table 9, there are two groups of different PSS configuration schemes consisting of interactive configurations of product modules and service modules. Scheme 1’s configuration result is {
R11,
R21,
R31,
R42,
R51,
R62,
R71,
R81,
S12,
S22,
S31,
S41,
S52}. According to the data presented in
Table 8, Scheme 1 has a customer satisfaction of 1.23090 and the service supply cost is ¥2633. Furthermore, comparing Scheme 1 with Scheme 2, although Scheme 1 has a lower product manufacturing cost, its service supply cost is higher. Even though the product configuration obtained may not be the optimal result, Scheme 1 provides a higher-quality service while meeting customers’ basic product requirements, thereby improving customer satisfaction and enhancing the company’s competitive edge.
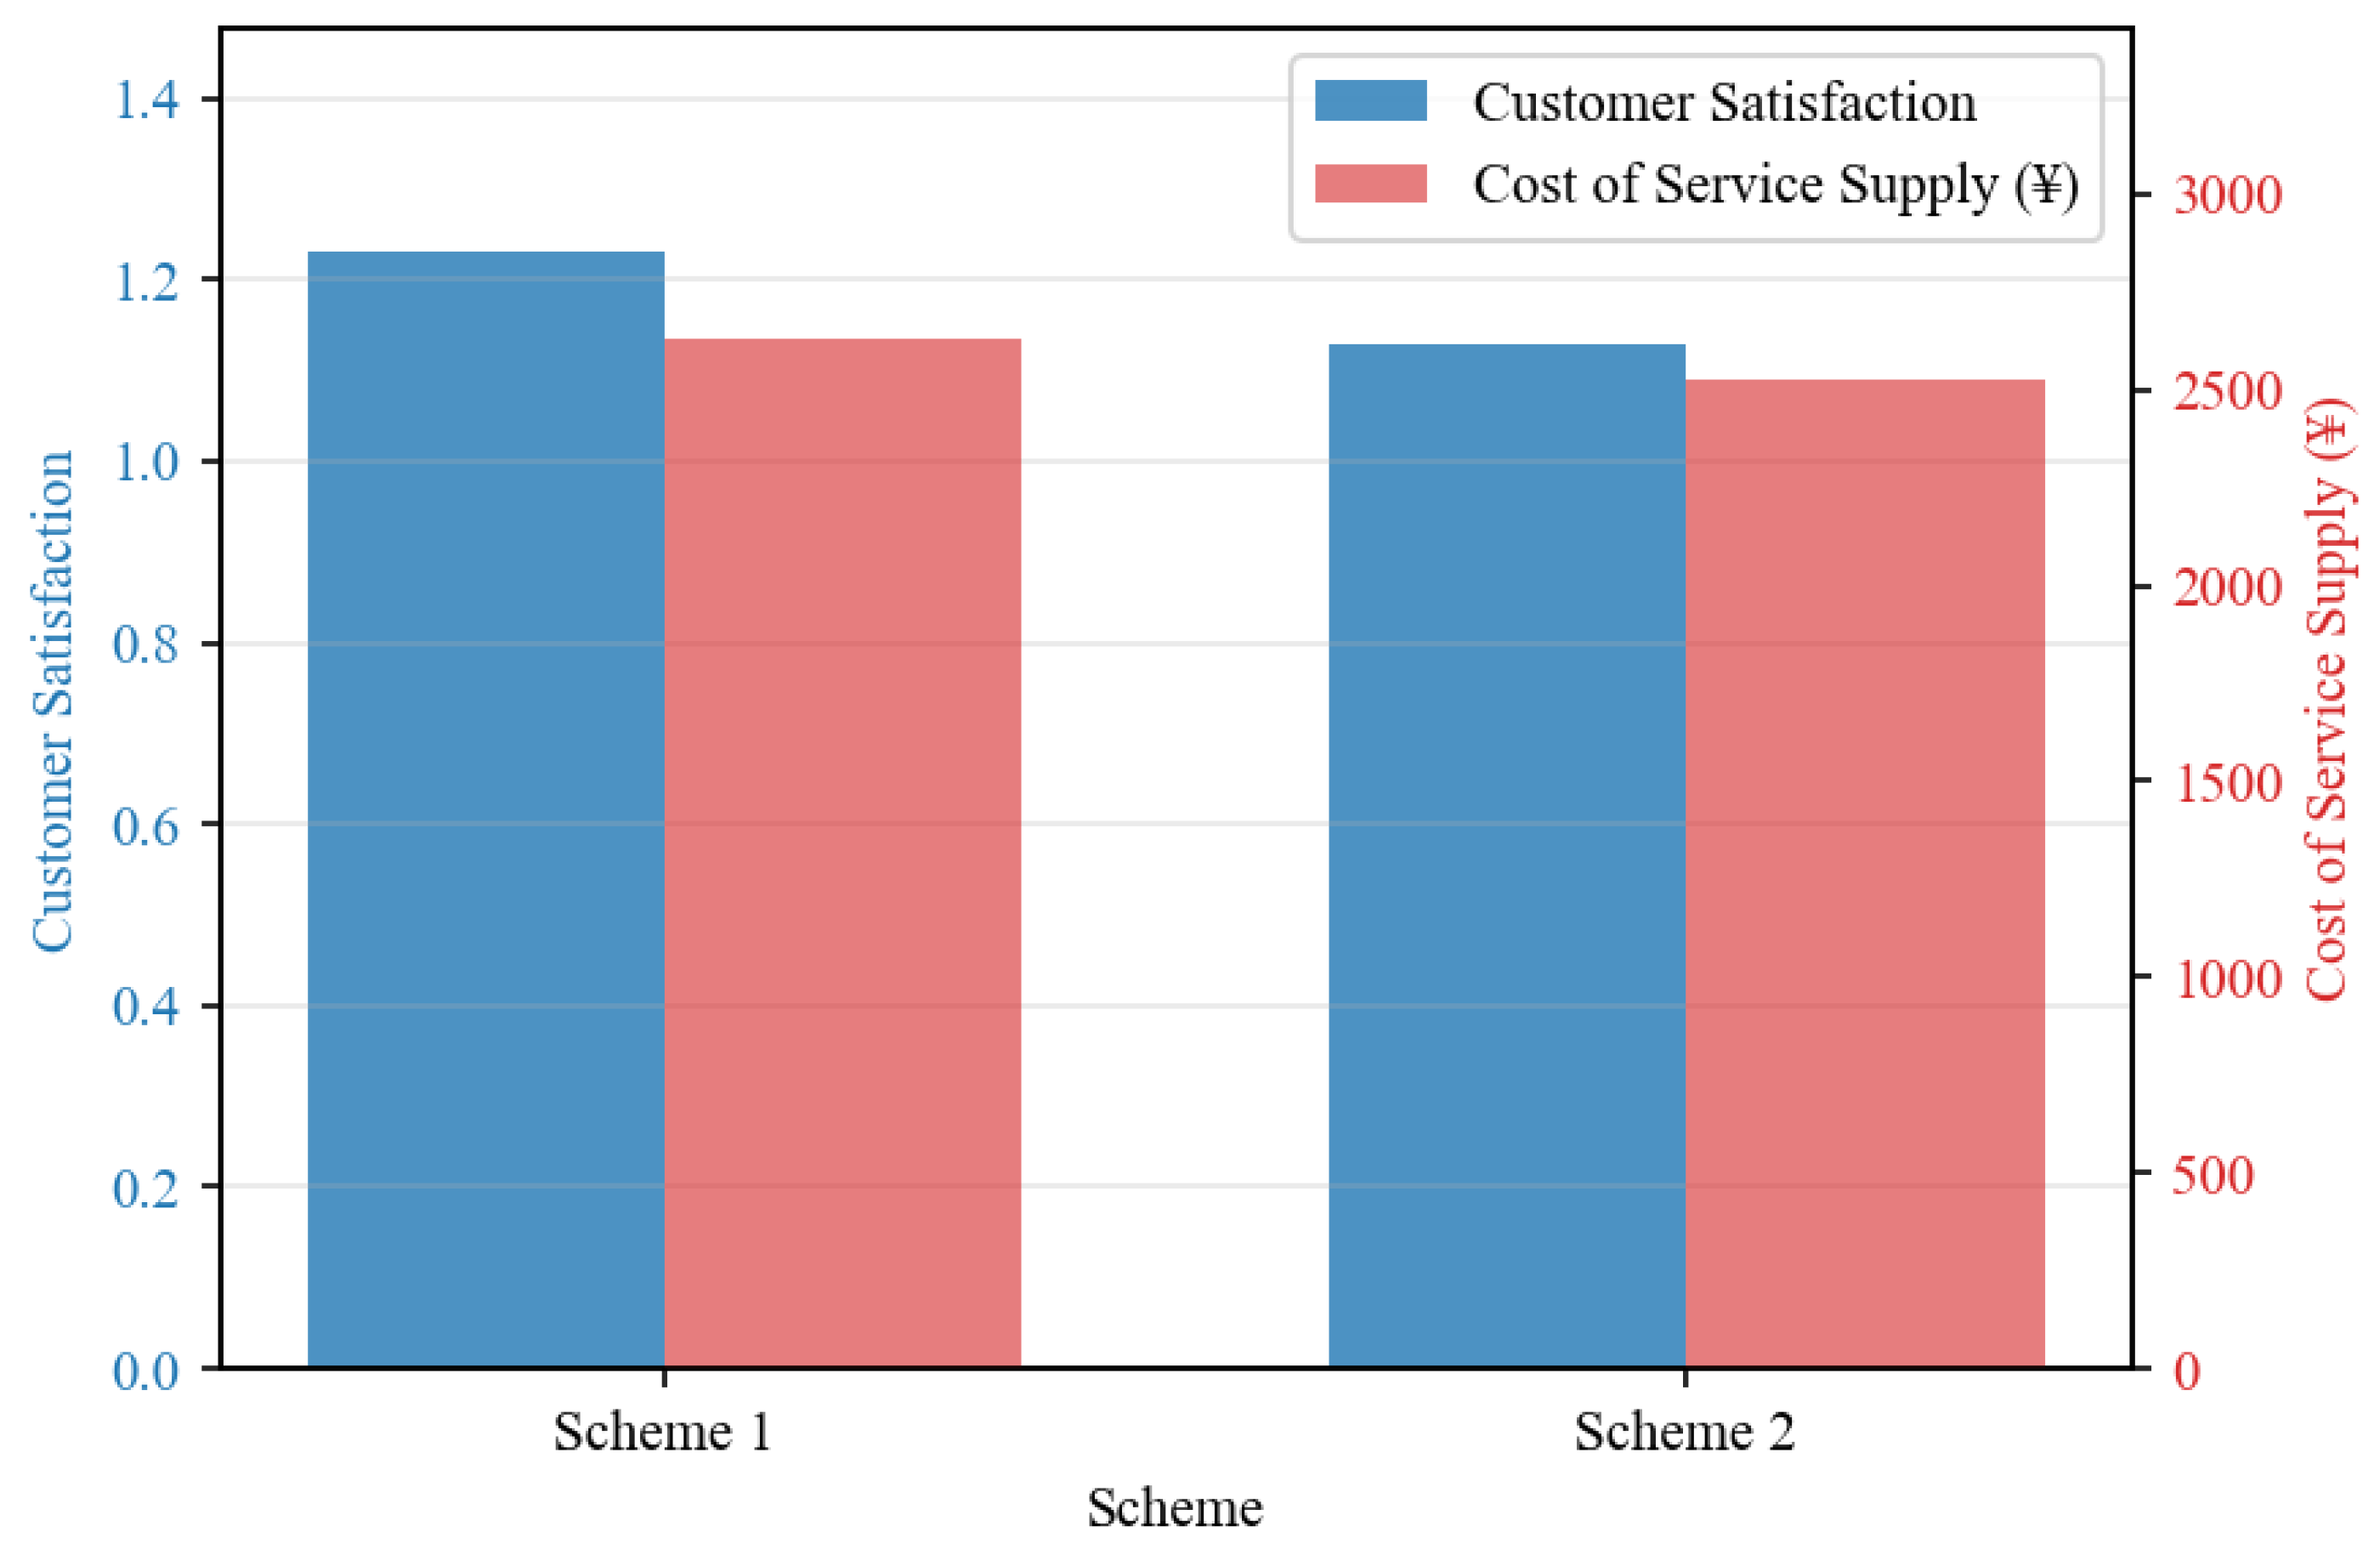
The PSS configuration ensures maximum customer satisfaction while minimizing service supply costs. As shown in
Table 10 and
Figure 6, Scheme 1 aligns with the interests of the PSS provider as it delivers the highest customer satisfaction. However, its service supply cost is suboptimal. In contrast, although the customer satisfaction of Scheme 2 is slightly lower (1.12840), its service supply cost is only ¥2523, aligning with the service providers’ goal of minimizing service supply costs. A comparison between Scheme 1 and Scheme 2 reveals that the service supply cost of Scheme 1 is 4.36% higher than that of Scheme 2, while customer satisfaction is increased by 9.08%. This conflict of interest between the PSS provider and the service providers underscores the need for a balanced solution.
The results indicate that the proposed leader–follower joint optimization model can effectively coordinate the configuration decisions between the PSS provider and service providers. Compared with traditional configuration approaches, the proposed model enables enterprises to achieve higher customer satisfaction while controlling service supply costs. These findings provide useful managerial insights for manufacturing enterprises implementing PSS strategies.
5.4. Discussion
To measure the optimality of the multi-objective optimization problem, the Max–Min normalization method is used to convert the customer satisfaction and service supply cost of the optimal solution set into intervals [0, 1]. During the expert discussions, the schemes are evaluated from multiple dimensions, including customer satisfaction, service supply costs, and long-term corporate benefits. Numerous studies have demonstrated that customer satisfaction is a key factor in manufacturing companies’ profitability [
3,
48]. Based on the analysis and the Stackelberg game theory framework, the experts assign weights of 0.6 to customer satisfaction and 0.4 to service supply costs. These weights are used to calculate the combined evaluation scores for each PSS configuration scheme, as shown in
Table 11. The results show that Scheme 1 has the highest score of 0.95. Therefore, Scheme 1 is identified as the optimal PSS scheme that can satisfy both the upper and lower objectives. The experts’ discussions combined a deep understanding of market demand, customer feedback, and the long-term development strategy of the manufacturing company, thus ensuring a scientific and reliable decision.
In addition to the analyses, the following assumptions have been made in this paper to illustrate the importance of customer satisfaction. In the upper PSS configuration, it is assumed that the PSS provider only aims at maximizing the manufacturing cost of the product modules and the service supply cost to achieve the configuration of the PSS scheme while ignoring the factor of customer satisfaction. The lower-level service configuration still aims to minimize the service supply cost to provide customers with service supply solutions.
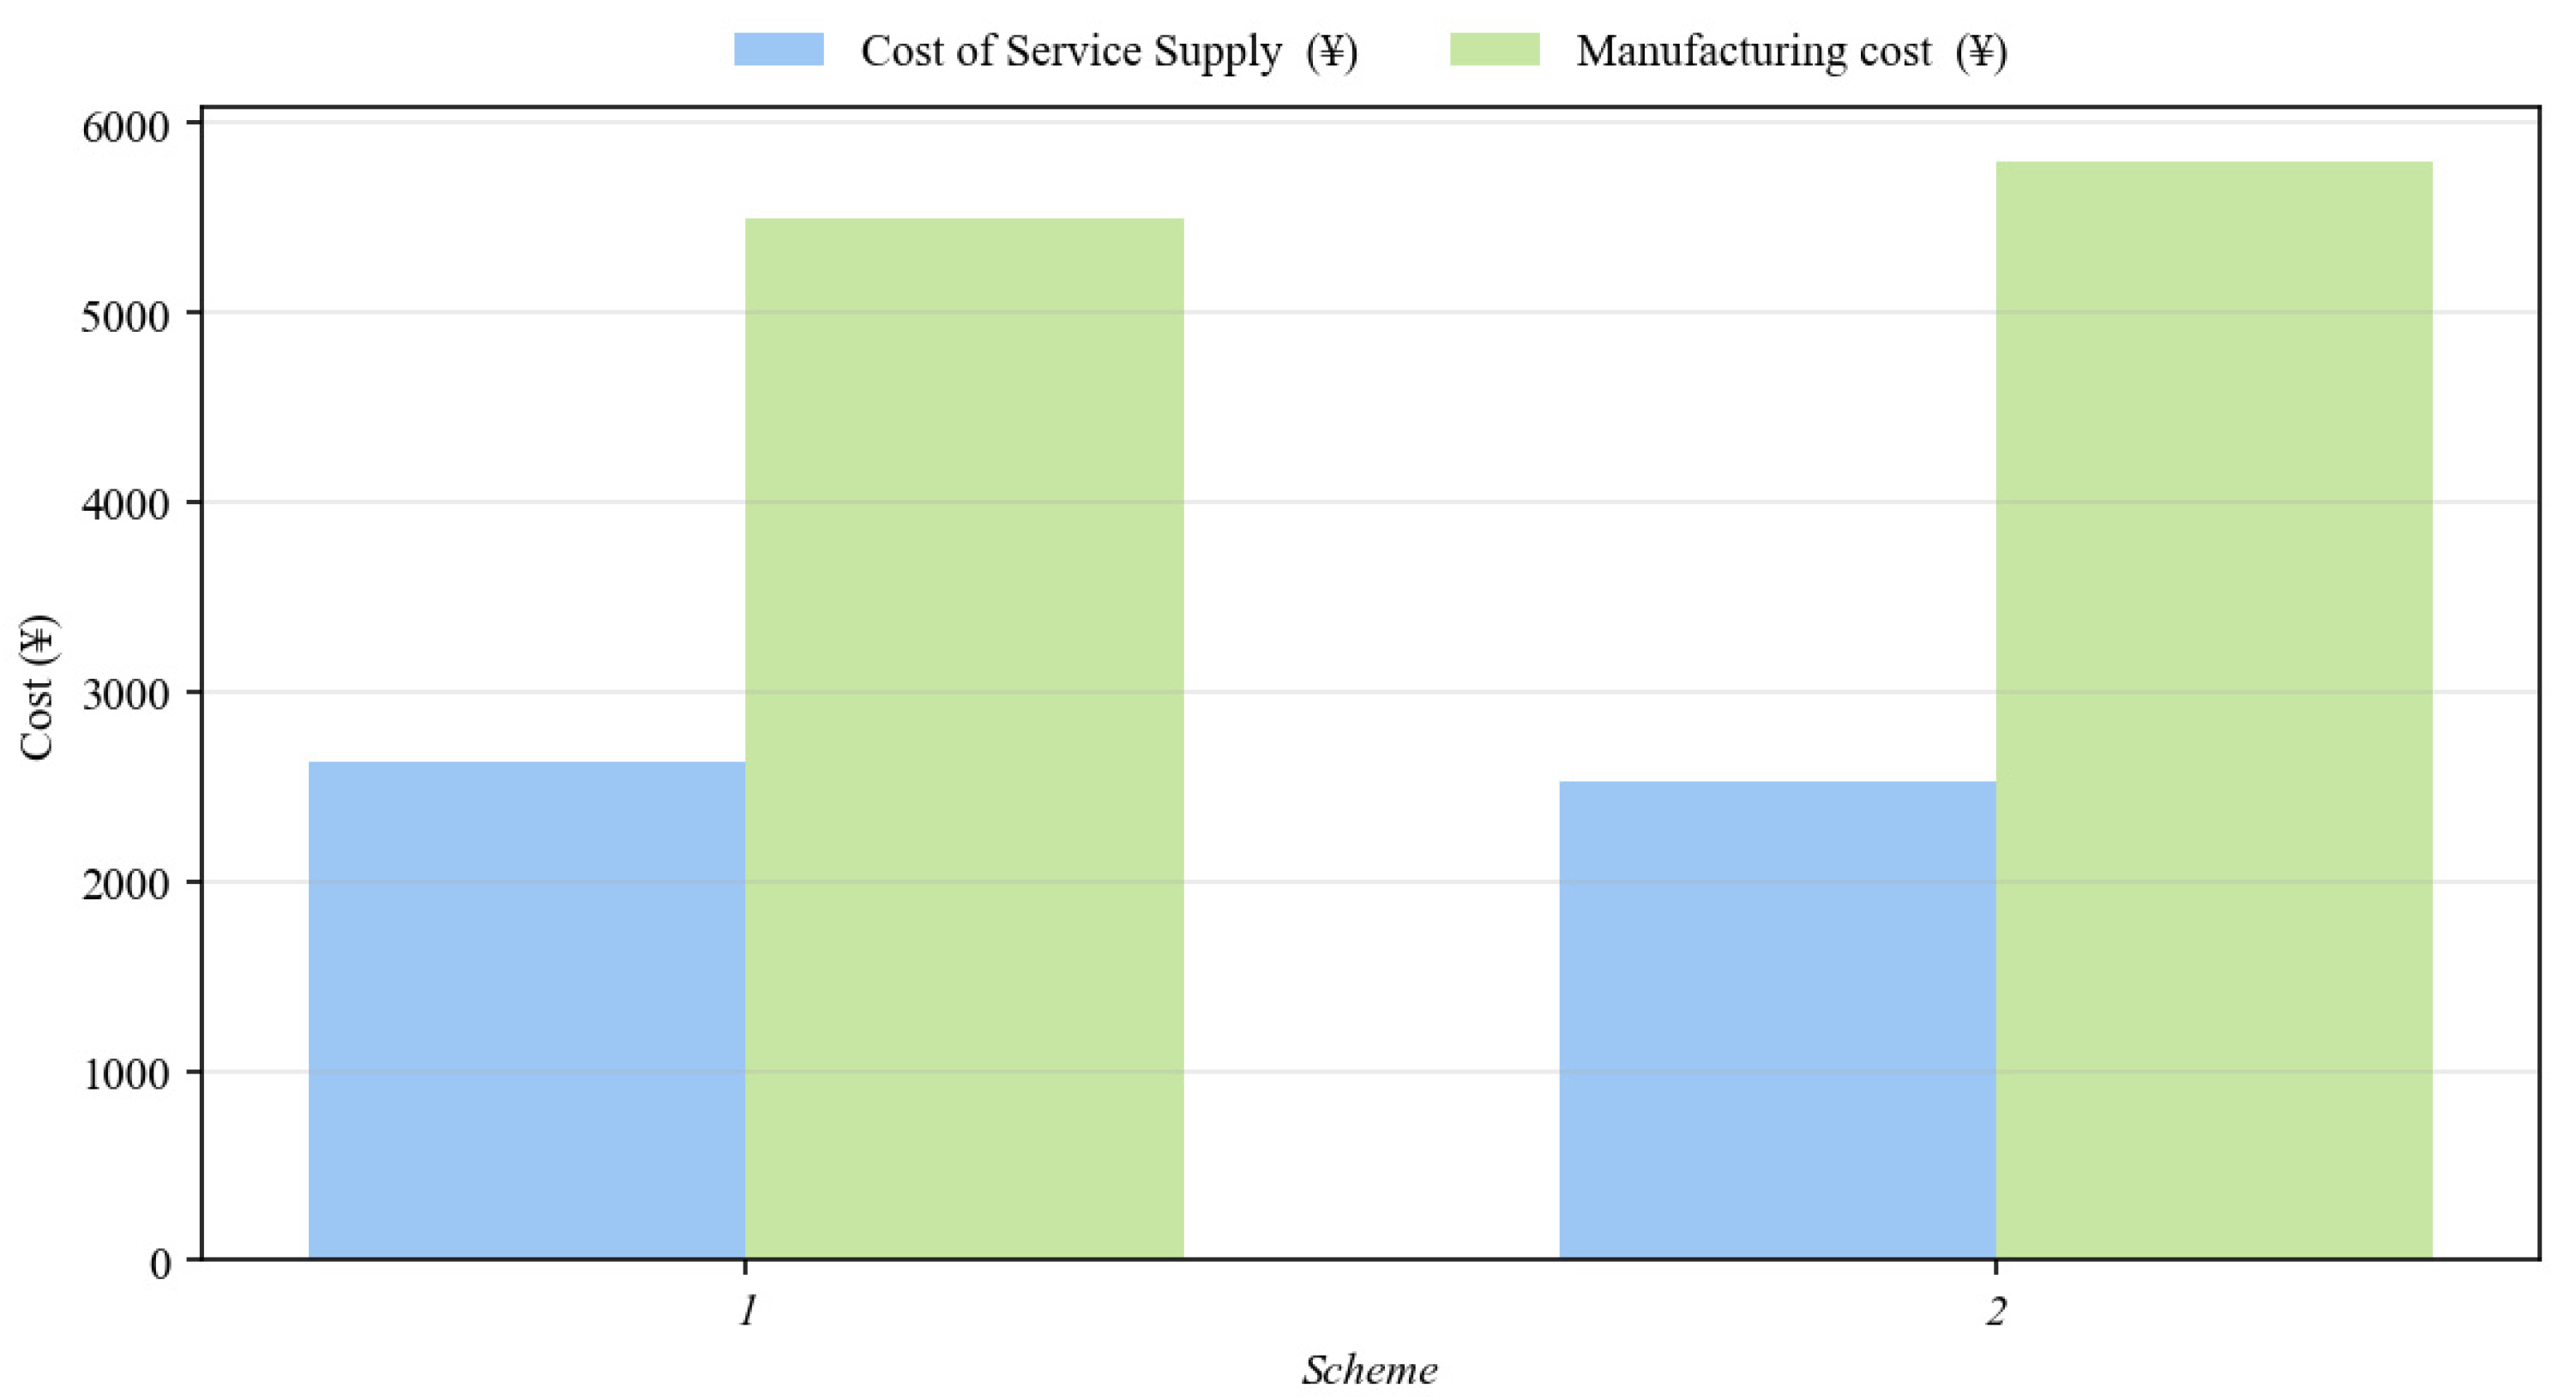
Figure 7 describes the manufacturing cost and service supply cost of two groups of schemes in the case of ignoring customer satisfaction. In contrast to
Figure 6, which compares customer satisfaction and the service delivery cost, two objectives with significantly different magnitudes,
Figure 7 compares the service delivery cost and manufacturing cost of the two schemes. Since both indicators are measured in RMB and are of a similar scale, only a single vertical axis is required in
Figure 7. Compared with when customer satisfaction is considered, we find that:
Scheme 2 has the lowest service supply cost, but compared with Scheme 1, its manufacturing cost increases by 17.18%. If the lowest manufacturing cost of Scheme 1 is selected, the service supply cost increases by 4.36%. Therefore, no matter what kind of scheme is chosen, ignoring customer satisfaction will lead to a loss of income for manufacturing enterprises. More importantly, if the upper configuration decision is only from the perspective of the PSS provider’s own interests, without considering customer satisfaction, there may be two cases:
Solely minimizing cost does not satisfy customers’ needs for quality and service levels. Ignoring customer satisfaction can lead to customers refusing higher-cost PSS schemes, ultimately resulting in the firm failing to recover its investment and losing market share.
A strategy that prioritizes cost minimization may lead to firms selecting low-cost, low-quality service schemes, which fail to meet customers’ expectations for product quality and service experience. In this case, customer satisfaction will significantly decrease, making customers unwilling to pay higher prices for products and services.
While cost-minimizing decisions may reduce operational expenses in the short term, they constrain the company’s long-term competitiveness. Since the PSS configuration does not meet customer expectations, the company may lose customer trust and market competitiveness, preventing it from improving its product and service quality. Over time, this can lead to a loss of market share and, eventually, the company’s inability to survive in a highly competitive market. On a broader societal level, the closure of companies and employee layoffs can diminish societal welfare. If a manufacturing company neglects customer satisfaction and fails to meet market demand, it will gradually lose market competitiveness, potentially leading to its closure. This not only affects the company itself but also results in job losses and negative repercussions throughout the supply chain, ultimately harming societal welfare.
The bi-level optimization model developed in this study effectively addresses these issues by balancing cost considerations with customer satisfaction. The upper-level objective maximizes customer satisfaction, while the lower-level objective ensures cost control through service supply cost optimization. This model better aligns with market demands, helping companies achieve sustainable development while maintaining customer satisfaction.
When comparing the performance of the improved DPC-NMHA with the NSGA-II given in the literature [
49] for solving the bi-level optimization problem of the PSS configuration problem, we analyze the results based on computation time and objective function values. Based on the process of determining the optimal PSS scheme, the customer satisfaction obtained using the NSGA-II algorithm is 1.25, and the service supply cost is ¥2814 in 8 s. The improved DPC-NMHA achieved the service supply cost of ¥2633 and customer satisfaction of 1.2309 in 10 s. Although NSGA-II exhibited a shorter computation time, approximately 40% faster, the improved DPC-NMHA demonstrated superior performance in minimizing the service supply cost, achieving a 6.4% reduction compared to NSGA-II. This reduction in service supply cost represents a significant advantage in practical applications, where cost minimization is a critical factor. The slight 1.5% difference in customer satisfaction between the two algorithms can be considered marginal, especially when balanced against the substantial cost savings provided by the DPC-NMHA.
Moreover, consistent with the process of determining the optimal solution using the improved DPC-NMHA method, the optimal solution obtained through NSGA-II achieved a score of 0.91. Therefore, compared to NSGA-II, the improved DPC-NMHA demonstrated superior performance. Overall, the improved DPC-NMHA offers a more balanced scheme by delivering a lower service supply cost with minimal trade-off in customer satisfaction, justifying the relatively small increase in computation time. Thus, the improved DPC-NMHA presents a more effective approach for bi-level optimization in PSS configuration.
6. Conclusions
The configuration of the PSS scheme is key to meeting individual customer needs and improving product–service interactions, which in turn enhances the market competitiveness of manufacturing enterprises. This paper addresses the conflict of interests between the PSS provider and service providers and develops a leader–follower joint optimization model to maximize customer satisfaction while minimizing service supply costs. Key findings include:
The strong dependency between product modules and service modules is crucial for integrating product and service value effectively. This highlights the importance of focusing on product–service dependencies to create value-added PSS schemes.
Ignoring customer satisfaction leads to revenue loss for manufacturers. Long-term customer satisfaction is essential for maintaining competitiveness and achieving a win–win outcome for both enterprises and customers.
The leader–follower optimization model is proven to be effective in balancing customer satisfaction and service supply costs, as shown by the comparison of the different schemes.
These findings underscore the importance of strategic PSS configuration in improving both customer experience and cost efficiency, ultimately benefiting the competitiveness of manufacturing enterprises.
Despite the advantages of the proposed methodology, there is still potential for improvement and expansion in some areas. In the future, we will explore how to change the configuration of products and services adaptively in a dynamic environment. In the specific computational process, the method for evaluating the utility of PSS configuration schemes can be further improved. By considering the potential interaction effects and nonlinear relationships between product utility and service utility, the calculated utility values would more closely reflect real-world conditions. Moreover, customer-perceived utility is not equivalent to customer satisfaction. Therefore, future research may incorporate additional influencing factors when calculating customer satisfaction, such as price and price sensitivity coefficients [
21,
50,
51], to obtain a more accurate measurement of customer satisfaction and thereby improve the accuracy of identifying the optimal configuration scheme. In addition, the cooperative or competitive relationship between the PSS provider and service providers can be further explored in future studies. Their complex interactions may play different roles within the leader–follower framework and consequently influence the PSS configuration outcomes.