1. Introduction
For decades, the primary goals of economic development have been primarily to maximize efficiency, reduce costs, and increase corporate profits. Over time, the dominant economic approach began to incorporate a second dimension of sustainable development, related to social aspects. Globally, attention was paid to issues such as social inequality, hunger, access to employment, decent working conditions, gender equality, and support for less developed regions and countries [
1,
2]. The next stage in the evolution of thinking about development was the recognition of a third key pillar of sustainable development: environmental aspects [
3,
4]. Currently, increasing emphasis is being placed on minimizing the negative impact of human activity on the natural environment, including the effects of industrial activity, processing, and other economic sectors [
5,
6]. One area where the impact of human activity on the environment is evident is tourism. Although it plays a significant role in meeting people’s cognitive, cultural, and recreational needs [
7], it is also associated with pollutant emissions [
8], excessive resource consumption, environmental degradation [
9], and the destruction of cultural heritage [
10]. Therefore, there is an increasing emphasis on finding alternative ways, tools and forms of tourism experiences that would mitigate negative environmental impacts without compromising human cognitive capabilities, such as visiting places, learning about cultures, and engaging with cultural heritage or art.
In response to these challenges, virtual reality (VR) has been proposed as a potential tool by which to reduce the demand for physical travel, redistribute tourism flows or provide alternative forms of access to destinations. Currently available VR applications allow users to explore selected locations around the world in a realistic, immersive, and accessible way, without generating the environmental costs associated with transportation, excessive tourist traffic, or the degradation of visited areas. Virtual tourism can therefore be a complement or alternative to traditional forms of travel [
11,
12], supporting the ideas of sustainable development [
13,
14]. However, it is also worth noting that the assumption that virtual tourism automatically contributes to sustainable development requires empirical verification. Naturally, VR experiences can act as a substitute for physical travel or serve as complementary tools to stimulate future visits. Therefore, the connection between virtual tourism and sustainable development should not be taken for granted, but rather as a potentially promising direction. VR may represent an opportunity to achieve sustainable development goals. However, the use of VR and the relationship with tourism depend on many factors, including the motivation of VR users, their behavior, and the quality of the VR experience. Moreover, multi-stage research and implementation of changes may lead to negative consequences for tourism. Nevertheless, this is an area that has not yet been explored.
Therefore, the authors of this article addressed the topic of virtual tourism implemented using virtual reality technology. However, whether VR actually acts as a substitute for physical travel or rather stimulates additional visits remains an open research question. Understanding the mechanisms through which VR influences user experiences, destination evaluations, and travel intentions is therefore crucial for assessing its impact on sustainability. The aim of the study was to identify factors influencing user experience during virtual tours, as well as to analyze the relationship between individual participant characteristics and the characteristics of the VR experience itself, and the evaluation of virtual destinations and changes in the perception of the attractiveness of tourist destinations. The subsequent sections present the results of empirical research based on surveys conducted before and after VR sessions in which participants—as real users—used the virtual reality application and visited locations of their choice.
This paper is divided into six sections.
Section 2 describes the state of the art and has two subsections: (1) VR applications in the context of tourism and (2) research on virtual reality in tourism and sustainability.
Section 3 presents materials and methods.
Section 4 shows the research results and consists of five subsections: (1) Tourism interest effect on VR experience, (2) exploratory analyses of travel frequency and VR experience, (3) relationship between tourism interest and travel frequency, (4) participant characteristics and their relevance to VR experience, (5) travel-related individual characteristics and changes in destination evaluation.
Section 5 discusses the results, and
Section 6 summarizes the paper.
2. The State of the Art
2.1. VR Applications in the Context of Tourism
Virtual reality in the context of tourism can be used in different ways. It allows users to virtually see and visit given places, like cities, museums, national parks and even deserted places, etc. Users can also see pieces of art, by virtually standing in front of them. A virtual tourist can also see places that are very difficult or even impossible to visit in reality—for example, they can virtually stand on the roof of the Notre Dame Cathedral or see it from a bird’s eye view. It can also be said that virtual tourism, despite being an alternative to traditional forms of travel, also provides additional cultural, educational, and recreational experiences. This is due to the fact that VR applications are often increasingly enriched with virtual guide instructions, historical background, educational curiosities and other elements that make this form of tourism smarter [
15]. It is also worth noting that VR applications allow access to world heritage sites for those who, for various reasons, including health, financial, political or logistical, are not able to travel [
16].
There are many different VR applications on the market that allow for virtual visits in places of historical monuments and works of art. Such applications are sometimes available in a free version or have paid modules, though some applications require payment in full. All of these applications can be downloaded from various websites and digital libraries. Examples of such platforms are Steam, Meta Store, Viveport, or Google Play/Apple App Store. An increasing amount of applications are also available on the websites of museums and other places visited by tourists, examples for which are presented in
Table 1.
In practice, VR applications do not have to be designed for single players. There are applications that allow people to visit the same place with friends, family, or a live guide. The goal is to make digital travel a social experience. An example is the Hoppin’ VR application [
30], which essentially creates a social platform. This allows users to simultaneously view and explore selected locations with other platform users. For example, a teacher can lead a virtual tour. Users share the same space and interact. The application offers private shared spaces. This allows for real-time conversations and for users to comment on what they see.
The variety of available VR applications demonstrates that the mere possibility of “virtual tours” is no longer a distinguishing feature of the technology. The attractiveness and effectiveness of such solutions are primarily determined by the quality of the user’s experience. If the virtual environment is low quality, unrealistic, technically underdeveloped, or visually artificial, it is difficult to expect the user to treat it as a credible representation of the visited place. In the context of tourism, realism and a subjective sense of “being there” (presence [
31]) become particularly important, ensuring that the experience is not perceived as viewing an image, but as being present in a given place. The ability to move freely, approach objects, view them from different perspectives, and the impact of visual and auditory stimuli are also important. This can positively influence the experience of immersion in space. The more coherent and engaging the experience, the greater the likelihood that it will influence the emotional experience and cognitive evaluation of the place. Technical aspects, such as smooth operation, accurate motion tracking, and intuitive interface, are equally important. Technical disruptions can distract the user from their sense of presence in the virtual world and negatively impact the content experience.
Virtual reality in the context of tourism can also be considered an important educational tool [
32,
33]. Through immersive experiences, users can acquire knowledge about cultural heritage, history, art, the natural environment, and local traditions in a more engaging and experiential way than traditional educational materials. VR applications can support learning by providing contextual information, visualizing complex historical or environmental processes, and increasing awareness of cultural and natural values. In this sense, virtual tourism can contribute to informal education and the development of responsible attitudes toward visited places. It is worth emphasizing that VR technology also creates new business opportunities. More broadly, VR applications can help promote lesser-known regions, create tourism content, and develop digital guide services. It can also be used in the decision-making process, as it allows tourists to explore a destination before traveling. This can facilitate planning [
34]. Virtual reality can also help with mental well-being. Such applications for virtual travelling or visiting places can help people relax [
35,
36]. Spending time in nature, on the beaches, in the forest, exotic landscapes or underwater can support regeneration and stress reduction [
37].
Virtual reality applications used in tourism can also be embedded in the broader context of digital transformation, encompassing the development of the smart city concept and the Industry 4.0 paradigm [
38,
39]. As a component of smart cities, VR technologies can support the digital accessibility of cultural heritage, urban spaces, and public attractions, complementing smart tourism services. In the context of Industry 4.0, VR applications are an example of advanced digital tools integrating immersive technologies, user interaction, and real-time data, increasingly supported by artificial intelligence (AI)-based solutions [
39,
40,
41]. Integrating VR and AI enables, among other things, the personalization of tourist experiences, content adaptation to user preferences, intelligent recommendation systems, and the analysis of user behavior in virtual environments.
2.2. Research on Virtual Reality in Tourism and Sustainability
This chapter presents a review of the research on virtual reality in tourism in the context of sustainability to determine the relevance of the scope of the topic. The authors examined the topic in the context of articles appearing in popular scientific databases. The chosen database was Scopus. Therefore, to find articles on virtual reality in tourism and in the context of sustainability, the authors conducted a search in the Scopus database using a search engine and selected keywords.
Table 2 shows search results for papers with given keywords on 5 February 2026. There were over 280,000 articles with the keyword “sustainability”, and slightly fewer articles with the keyword “virtual reality”—over 200,000. While the articles with the word “tourism” were just over 111,000. Then, the authors searched for publications that had two of the three mentioned keywords, using the logical connective “AND”. The most articles had both keywords “tourism” and “sustainability”. There were almost 7000 of them. Then, there were just over 1000 articles with both of the keywords “tourism” and “virtual reality”. The fewest articles were characterized by the keywords “virtual reality” and “sustainability”. By entering three keywords in the search—“tourism”, “virtual reality”, and “sustainability”—it was found that only 41 articles met these criteria.
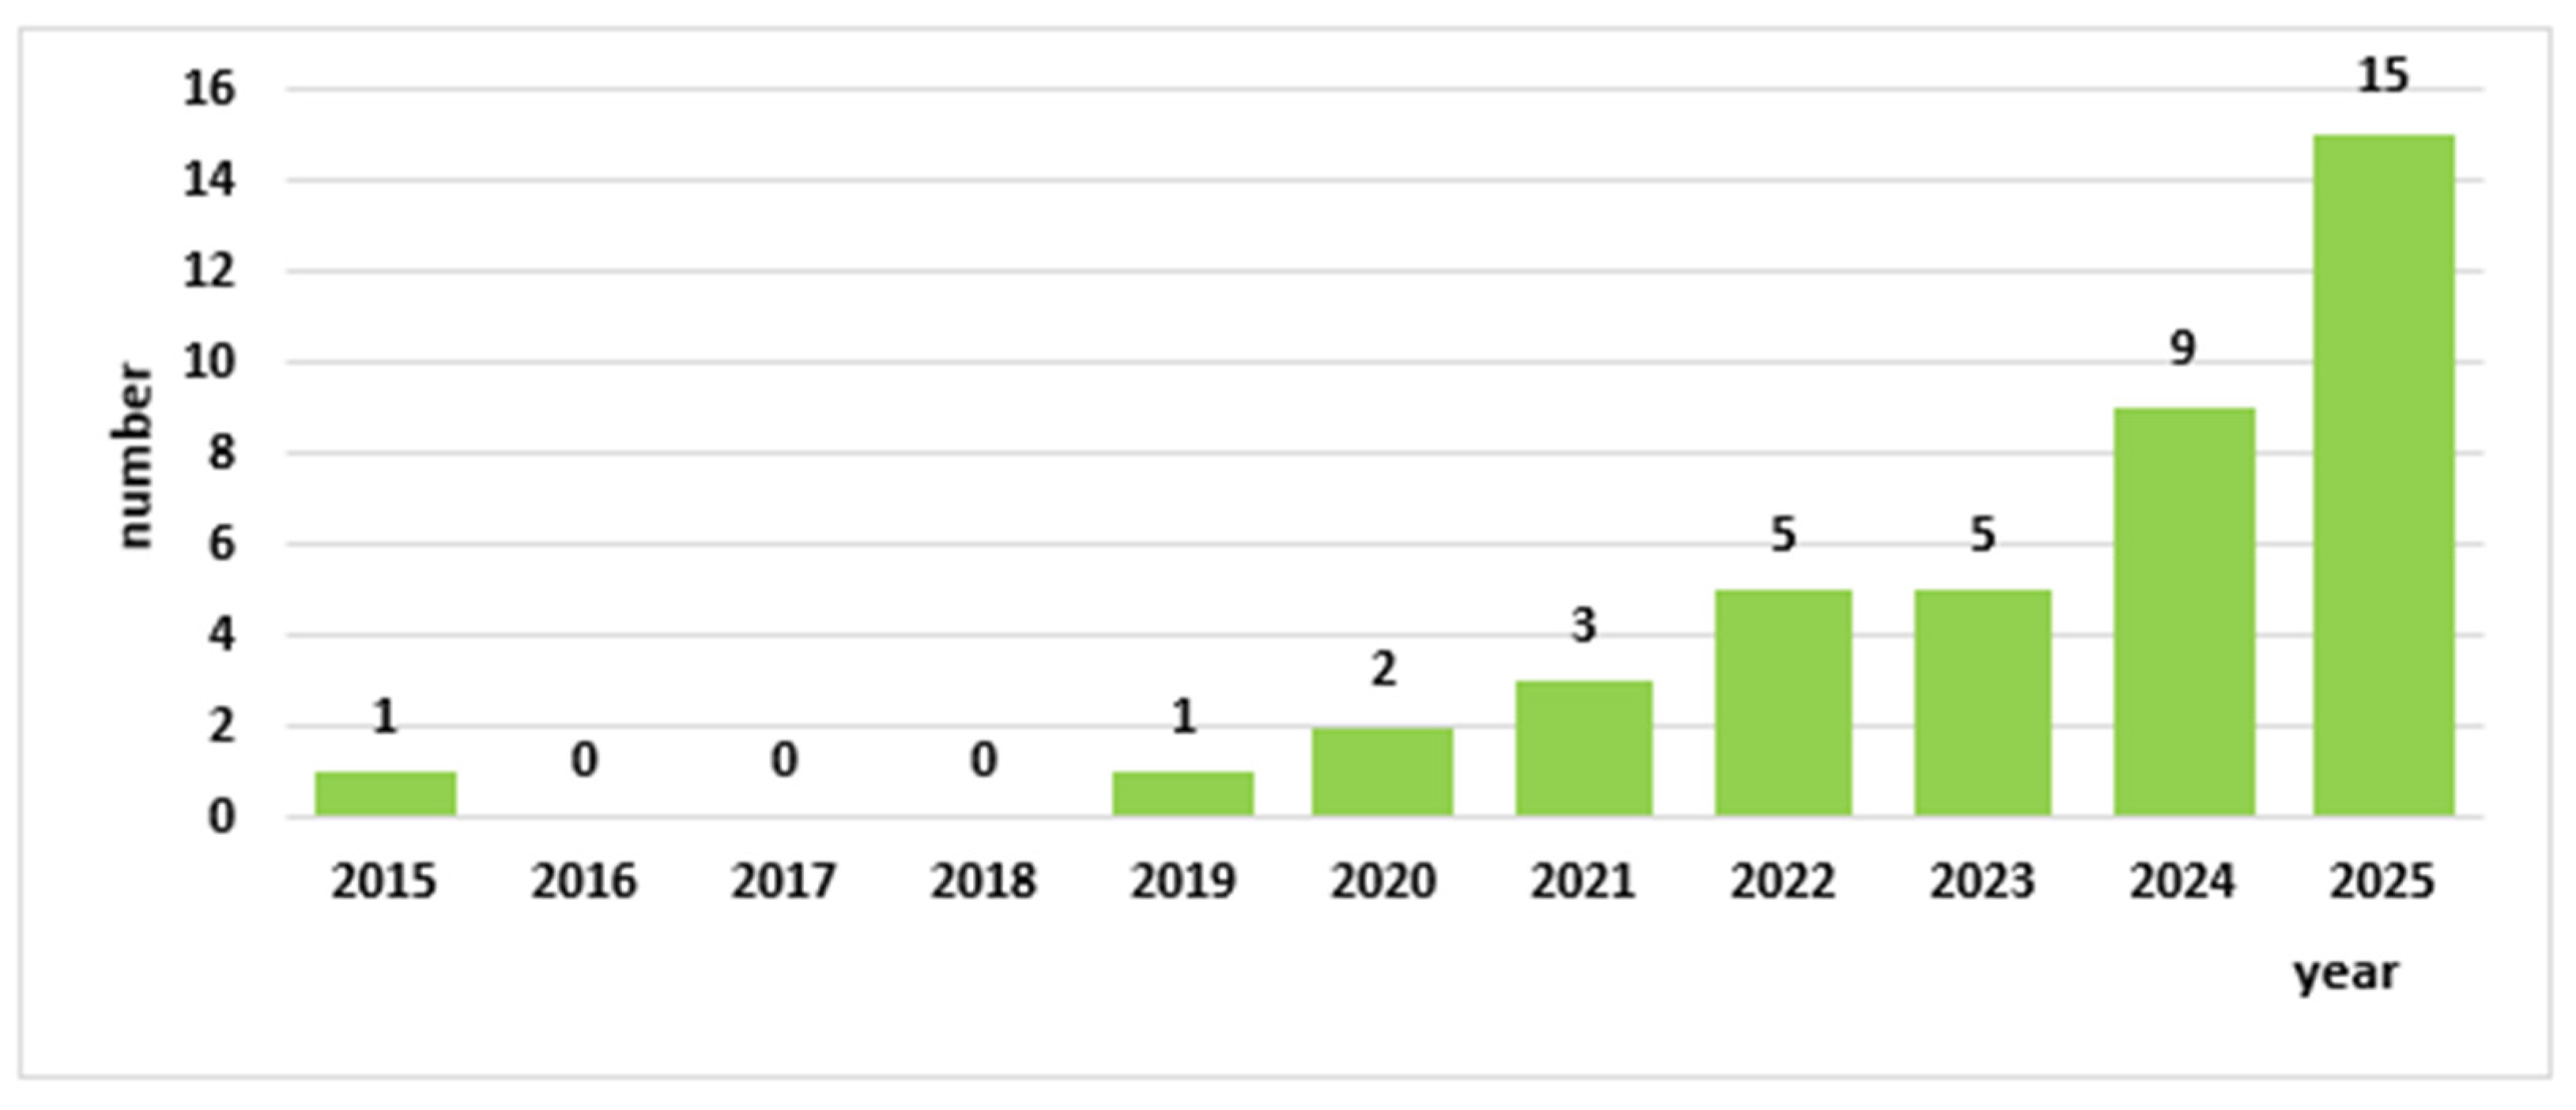
Analyzing the 41 articles found in terms of publication date, an upward trend was observed. The first publication based on Scopus appeared in 2015 and in the years 2016–18 there was no publication characterized by these three keywords. The interest in the topic of sustainable development in tourism in terms of the use of virtual reality has been slowly increasing, while the number of these articles was and remains very small. In 2025, there were only 15 articles published, which suggests that the intersection of these topics is still emerging in the literature. The slowly developing topic of sustainability in tourism in terms of virtual reality remains a niche issue, but it is developing. However, this observation should be interpreted cautiously, as the number of publications identified depends strongly on the search strategy and database coverage, and does not necessarily reflect the full extent of existing research. Nevertheless, it is worth noting that the keyword search provides only an approximate indication of how frequently these concepts occur in the literature together and should not be interpreted as a precise measure of the field. The number of publications identified depends strongly on the search formulation, database coverage, and indexing practices, which may change over time. Therefore, the results of the search are treated here only as a preliminary orientation in the literature rather than as a direct measure of a research gap. Accordingly, the bibliometric search is used only as an indicative background for identifying tendencies in the literature, rather than as conclusive evidence that the topic remains unexplored.
Figure 1 shows the number of papers with the keywords “tourism”, “virtual reality” and “sustainability” published on Scopus each year.
The authors reviewed the selected 41 papers. There are basic papers that discuss the issue of VR and its usage in terms of sustainability and tourism. For example, one of the papers indicates three critical aspects: VR in upscaling tourism, VR as a marketing strategy for sustainability, and VR as reality for tourists [
42]. There are papers on research about virtual tourism as an alternative to traditional tourism [
43,
44]. Such studies show that virtual reality has a great chance of replacing traditional tourism (at least for certain groups of people, e.g., those who do not like leaving home, people without financial resources, etc.), emphasizing many benefits, especially environmental ones, of this type of activity. VR in tourism is also shown to be a way to provide responsible tourism. One of the studies was done with participants using a special VR application to visit places [
12]. Additionally, more practical studies have been conducted by other authors, where acceptance of VR in tourism in terms of sustainability was examined [
45]. Another paper presents issues on smart heritage in terms of using VR and in the context of sustainability [
46], and the impact of VR (and sometimes AR) on sustainable tourism [
47].
There are papers on a concept that is broader than VR, that of the metaverse. For example, there are papers on the metaversal sustainability concept [
48] and on tourism in the metaverse in terms of opportunities, marketing and ethics [
49]. There is even research on the development of an application for the metaverse in the tourism sector and which sought to be a tool for enhancing sustainability [
50]. Another paper describes the impact of metaverse tourism in the tourism industry [
51], one which also shows practices and future forecasts for this technology and the entire field. Another study in this field is one regarding readiness for metaverse space travel, travel anxiety, and travel fear of missing out [
52]. Some other authors have examined the role of avatars in promoting sustainable practices [
53]. This shows that avatars can enhance awareness and learning outcomes in virtual tourism. It is worth noting that there are papers that highlight the use of VR in tourism marketing [
54,
55], meaning that this technology can not only promote given places and encourage people to visit them in real life, but also play an educational role in terms of responsible tourism. Some papers present VR as a tool for “traveling before traveling” [
56]. In this respect, VR is used as a tool for marketing that supports tourism sustainability.
Some authors examine the impact of VR on tourists’ pro-sustainable behavior [
57,
58,
59]. Another paper also presents the topic of the virtualization of cultural heritage for the promotion of sustainable activities [
60]. In terms of shaping behavior, there is also a paper discussing this in the context of marine [
61] and coastal tourism [
62]. The first examines the effectiveness of virtual and real-life marine tourism experiences in encouraging conservation behavior. VR technology is also discussed in terms of advancing sustainable development goals [
63]. VR applications for tourism purposes can help in achieving these goals.
Some other authors discuss the issue of sustainability communication in VR learning environments for perceptual and behavioral change [
64]. The authors draw attention to the issue of raising the awareness of sustainable travel. Authors of another paper discuss the topic of technical sustainability, concentrating on artificial intelligence (AI), VR and robotics for tourism purposes [
65]. They present the idea of a hybrid approach in the tourism sector. There is also a paper theorizing VR tourism as a sustainable tourism solution long into the future [
13]. There is also a paper presenting case studies on the practical applications, and policy recommendations to sustainable practices, using, among others, VR and augmented reality (AR) in tourism to enrich the experience [
66]. This paper presents the idea of supporting tourism with VR and AR technology but does not treat them like an alternative or substitute.
In terms of relationship examination, there was, for example a paper that presents a virtual reality destination experiences model [
67]. The authors studied the relationship between sustainable tourism behavior and tourists’ intention to visit. Other research refers to the antecedents and consequences of behavioral intention to use virtual reality in tourism [
68].
There are also some papers in the field of management. These discuss the management of sustainable tourism using VR, presenting models of management of the undertaken issue [
69,
70].
The next thematic group is the description of the implementation and adoption of VR technology. There are papers that describe this process and its consequences [
71,
72]. Some authors have conducted research on the progress of technology adoption in tourism and hospitality [
73].
Another paper analyzes the VR training and digital monitoring utilities in terms of environmental impact evaluation, sustainable development, safe health tourism construction infrastructure, agricultural tourism facilities in the post-COVID-19 era and public health protection from alternative types of tourism for disabled people and seniors [
74]. In the literature, there is also the problem of glacial tourism using VR [
75] and the issue of digital preservation of old cultural elements [
76]. Another issue discussed in the literature is the usage of advanced measurement and reality technologies in cultural heritage sites [
77]. Finally, there are review papers on sustainable tourism with VR and AR [
78,
79,
80].
The literature review indicates that, although the use of virtual reality in tourism in the context of sustainable development is present in scientific research, the number of publications remains limited, and research approaches are highly diverse. Conceptual studies, reviews, and case studies dominate, while empirical analyses based on the experiences of actual users remain relatively scarce. Furthermore, many studies focus on selected technological aspects or declared pro-environmental attitudes, rarely examining the relationships between user characteristics, characteristics of the VR experience, and changes in destination evaluations. Empirical studies that simultaneously examine individual user characteristics, specific features of the VR experience, and changes in destination evaluation before and after a VR session remain relatively unexplored. As a result, the mechanisms through which VR experiences may influence tourists’ perceptions of destinations are still insufficiently understood. This does not mean that the topic has not been studied, but rather that existing studies tend to focus on selected aspects of virtual tourism, leaving some relationships less frequently examined. In this context, it is justified to undertake empirical research that will allow for a better understanding of the factors associated with the virtual tourism experience and its potential significance in the broader context of sustainable development. It is also worth exploring whether VR experiences constrain, replace, or potentially stimulate physical travel intentions. Therefore, further research is needed to more precisely examine the behavioral implications of VR-based tourism experiences.
3. Materials and Methods
The study investigated how individual characteristics and features of a virtual reality sightseeing experience relate to user experience and changes in the evaluation of tourist destinations. Participants completed a short pre-experience questionnaire, then took part in a single VR sightseeing session, and finally filled in a post-experience questionnaire.
The research participants were students of the Faculty of Organization and Management of the Silesian University of Technology in Poland (full-time and part-time studies) from various fields of study (management, logistics, management and production engineering, business analytics, and linguistics), as well as academic teachers. The study was announced at the faculty. Those interested could apply as recruitment was open. The exclusion criteria included contraindications to the use of virtual reality technology. Prior to participation, all individuals were informed about possible contraindications related to immersive VR exposure. Participants who reported any of these contraindications were not allowed to take part in the study.
During the VR session, respondents explored 360° virtual representations of two tourist destinations selected by themselves: (a) one destination they had previously visited in real life, and (b) one destination they had not visited before. Each participant visited two places, and the total VR exposure was approximately 10 min (with approximately 5 min for every destination). Participants were allowed to freely explore the environment within this time frame. The order in which the two destinations were explored (previously visited vs. not visited before) was random and depended on the user. Google Earth VR offers two modes: 3D models and Street View panorama. Users viewed both modes for both of their chosen places. The VR experience was delivered using a head-mounted display: (HTC Corporation, Taoyuan City, Taiwan) or Meta Quest Pro (Meta Platforms, Menlo Park, CA, USA). The participant’s use of a given headset was random. Before the VR session began, participants received instructions on how to use the VR headset and navigate the virtual environment. The researchers instructed them on how to individually adjust the headset, how to use the controllers (buttons, triggers, hand movements), how to operate the VR application (in terms of finding their chosen destination and the basic mechanics of the application) and how to navigate the virtual world. Participants were also familiarized with the health and safety regulations for the VR lab and VR use, as well as contraindications to VR use. Participants were informed of their obligation to immediately stop their activity if they experienced any discomfort. Before the VR experience, participants were asked to choose two places (as mentioned, (a) and (b)). These places were rated for willingness to visit both before and after the VR session. In addition to pre and post willingness ratings, participants also provided a post-experience satisfaction rating for each destination visited in VR. Because satisfaction was measured only after the VR session, it was analyzed as a secondary post-experience outcome rather than as a change score. All questionnaires were administered in a controlled laboratory setting. Participation was voluntary and anonymous. The study protocol complied with institutional ethical guidelines and informed consent was obtained from all participants prior to data collection.
The final sample consisted of N = 215 respondents. The research was conducted at the Faculty of Organization and Management of the Silesian University of Technology in the VR research laboratory. Finally, the participants represented the following generations: Gen X = 11 participants, Gen Y = 23 participants, Gen Z = 181 participants. Among others the dataset included information on gender (female, male, other/prefer not to say) of the study participants. Because only two participants selected “Other/Prefer not to say”, gender-based inferential analyses were restricted to female vs. male.
The measures used in the study included:
All of these constructs were captured with single items to keep the questionnaire brief and to reduce respondent burden in the lab setting; we acknowledge that this precludes internal consistency estimates but is a common pragmatic compromise for concrete experiential judgements.
All statistical analyses were conducted in R [
81] using the packages tidyverse 2.0.0 [
82], ggpubr 0.6.3 [
83], rstatix 0.7.3 [
84], and FSA0.10.1 [
85]. Likert-type items were treated as ordinal variables. For correlation analyses, a numeric version of tourism interest (t.interest.num, 1–5) and a numeric travel frequency index (t.frequency.num) were created.
To study the effect of VR on destination evaluation, difference scores were computed:
Positive values indicate an increase in place evaluation after the VR experience, negative values a decrease. For all analyses, missing values were excluded on a case-wise basis.
Because most variables were ordinal and many distributions deviated from normality, non-parametric methods were used throughout.
Spearman’s [
86] rank correlation (ρ) was used to examine monotonic relationships between:
For this purpose, numeric versions of tourism interest (t.interest.num) and travel frequency (t.frequency.num) were used.
For group comparisons Kruskal–Wallis tests [
87] for multi-group comparisons were applied, this includes the analysis of the following variables:
tourism interest (5 levels);
travel frequency (5 levels);
personality (3 levels);
traveler self-type (3 levels);
VR use frequency (4 levels).
When the results of Kruskal–Wallis tests were significant, Dunn’s post-hoc tests [
88] with Bonferroni [
89] correction were applied. Additionally, effect sizes for Kruskal–Wallis tests were quantified using rank-based eta squared (η
2), as implemented in the rstatix package.
For two-group comparisons (used only in analyses where a variable had exactly two categories) Wilcoxon rank-sum test (Mann–Whitney U) [
90] was applied and later the effect size r was computed from Z/√N, for the following variables:
To examine factors influencing changes in place evaluation, we undertook the following:
Kruskal–Wallis tests for want.diff and was.diff across tourism interest levels and travel frequency.
Spearman correlations between change scores and realism components, engagement, emotion, tourism interest, and travel frequency.
Dunn’s tests were used only where a KW test was significant (want.diff vs. tourism interest).
The significance threshold was set at α = 0.05. Bonferroni correction was applied to all post-hoc pairwise comparisons following significant Kruskal–Wallis tests in order to control the family-wise error rate. For correlation analyses involving multiple related tests (i.e., correlations between change scores and multiple VR experience variables),
p-values were additionally adjusted using the false discovery rate (FDR [
91,
92]) procedure to provide a less conservative control of Type I error. Results are reported with both unadjusted and adjusted
p-values, and interpretation emphasizes robustness across correction methods as well as effect sizes.
Based on the literature review, the following research questions (RQs) were set:
RQ1: Are individual user characteristics (such as interest in tourism, travel frequency, traveler type, and personality traits) related to the quality of the virtual reality experience?
RQ2: Does prior experience with VR technology and demographic factors influence perceptions of the quality of VR experience, particularly the assessment of realism, engagement, and intuitiveness of using VR?
RQ3: Does VR experience influence the evaluation of a tourist destination, particularly changes in the willingness to visit a previously unvisited destination and the willingness to revisit a previously visited destination?
RQ4: Are changes in destination evaluations after a VR experience related to the quality of the virtual experience, such as perceived realism, level of engagement, emotions, and technical aspects?
RQ5: To what extent can the observed changes in destination evaluations be interpreted in the context of sustainability?
4. Results
In line with our main research aims, the primary analyses focus on (a) tourism interest and travel frequency in relation to engagement and emotional response to the VR experience, and (b) perceived VR quality attributes in relation to changes in destination evaluation, while additional associations are treated as exploratory.
4.1. Tourism Interest Effect on VR Experience
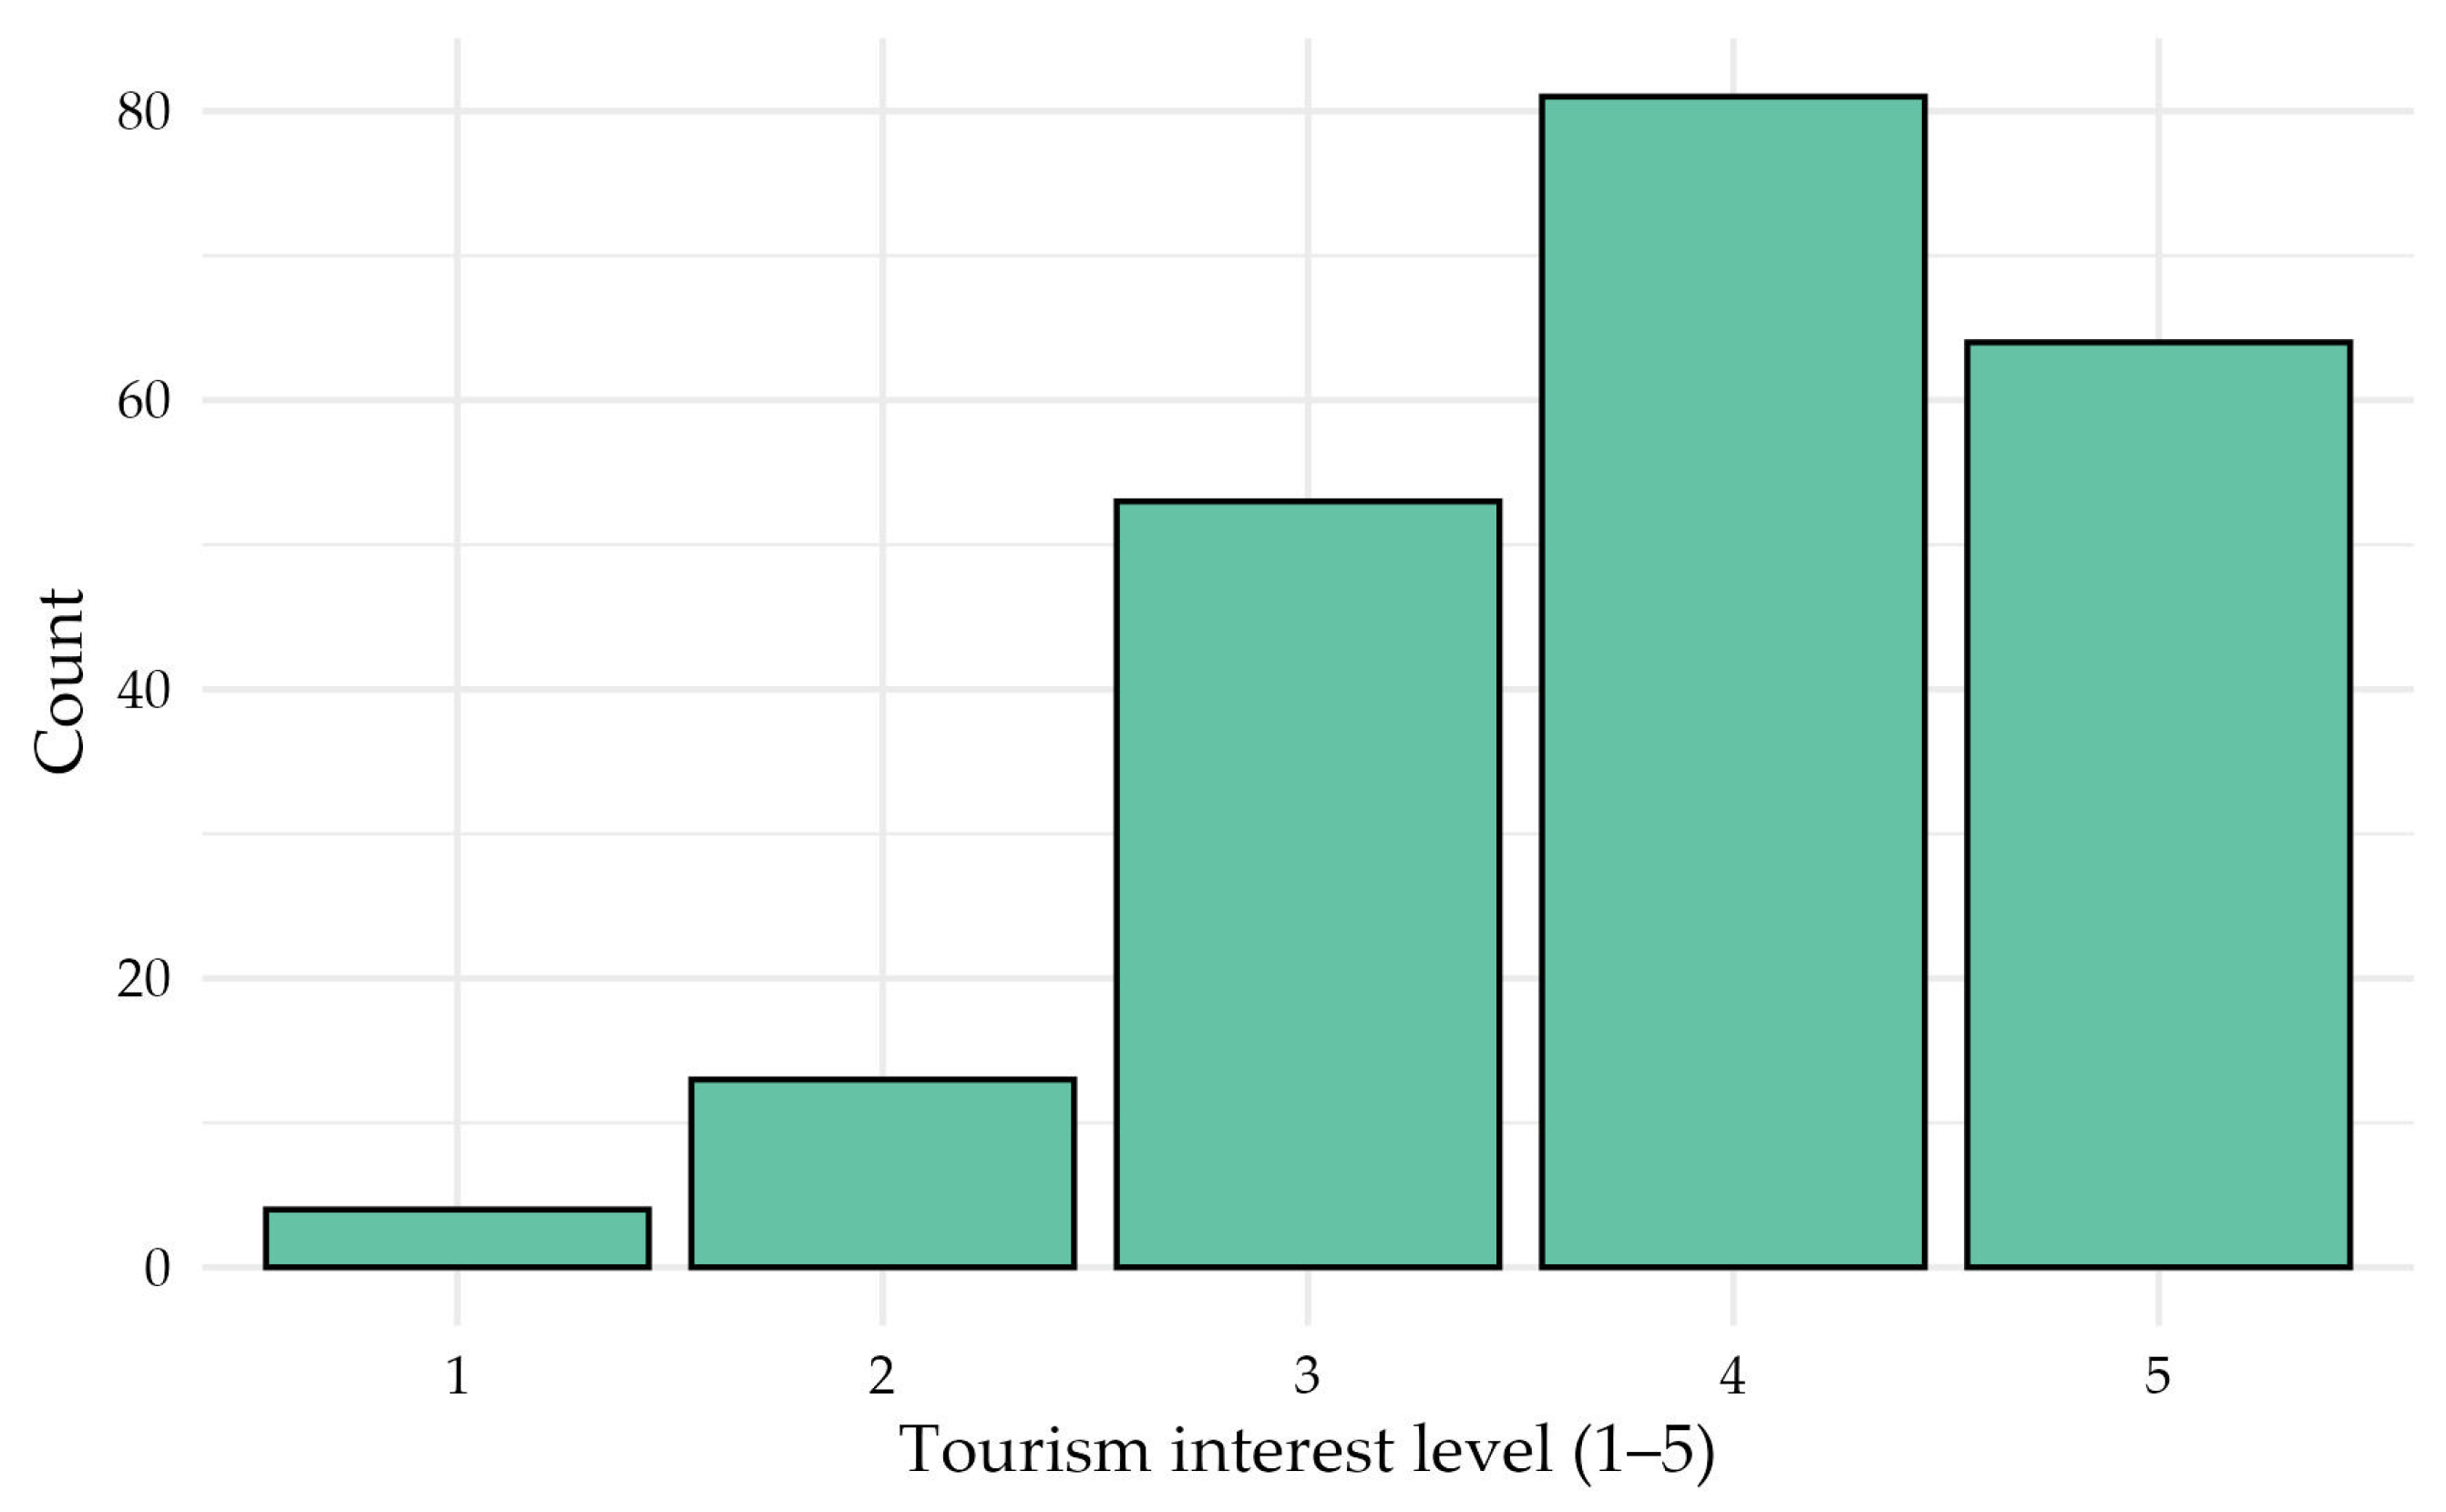
Before the VR experience, participants were asked to indicate their general interest in travel on a five-point Likert scale. The distribution of responses was left-skewed, with 4 (“high interest”) being the most frequently selected category. The distribution is presented in
Figure 2.
Because the variable showed a non-normal distribution, non-parametric methods were applied to examine its associations with user-reported aspects of the VR experience. In the first step, correlations between tourism interest and several VR experience variables—engagement, emotional response, overall perceived realism, six specific realism components (360° view, motion tracking accuracy, sound quality, freedom of movement, motion lag, and graphical fidelity), and intuition—were assessed. All of these variables were measured on Likert-type scales; therefore, Spearman’s rank correlation was used. The correlation results are shown in
Table 3.
Three statistically significant correlations were identified—tourism interest was positively associated with overall perceived realism, emotional response, and engagement. The correlation magnitudes indicated small effects.
To further examine these effects, the dependent variables that showed correlations were analyzed using Kruskal–Wallis tests, treating tourism interest as a categorical factor (five levels).
Table 4 contains the obtained results. Engagement and emotion showed statistically significant differences between interest levels, while realism was marginally significant.
Post-hoc comparisons using Dunn’s test revealed that differences in emotional response across tourism interest levels were limited but included one statistically significant contrast. Participants with a tourism interest level of 5 reported significantly stronger emotional reactions than those with a moderate interest level (3), Z = −3.14, padj = 0.0169, r = −0.2141. All remaining pairwise comparisons were non-significant, with adjusted p-values ≥ 0.21.
In the case of engagement, Dunn’s test identified a similarly pronounced difference between interest levels 3 and 5, Z = −3.71, padj = 0.0021, r = −0.2531, indicating substantially higher engagement among participants most interested in travel. A marginal effect was also observed between levels 3 and 4, Z = −2.66, padj = 0.0787, r = −0.1813. All other comparisons yielded non-significant results (padj ≥ 0.19).
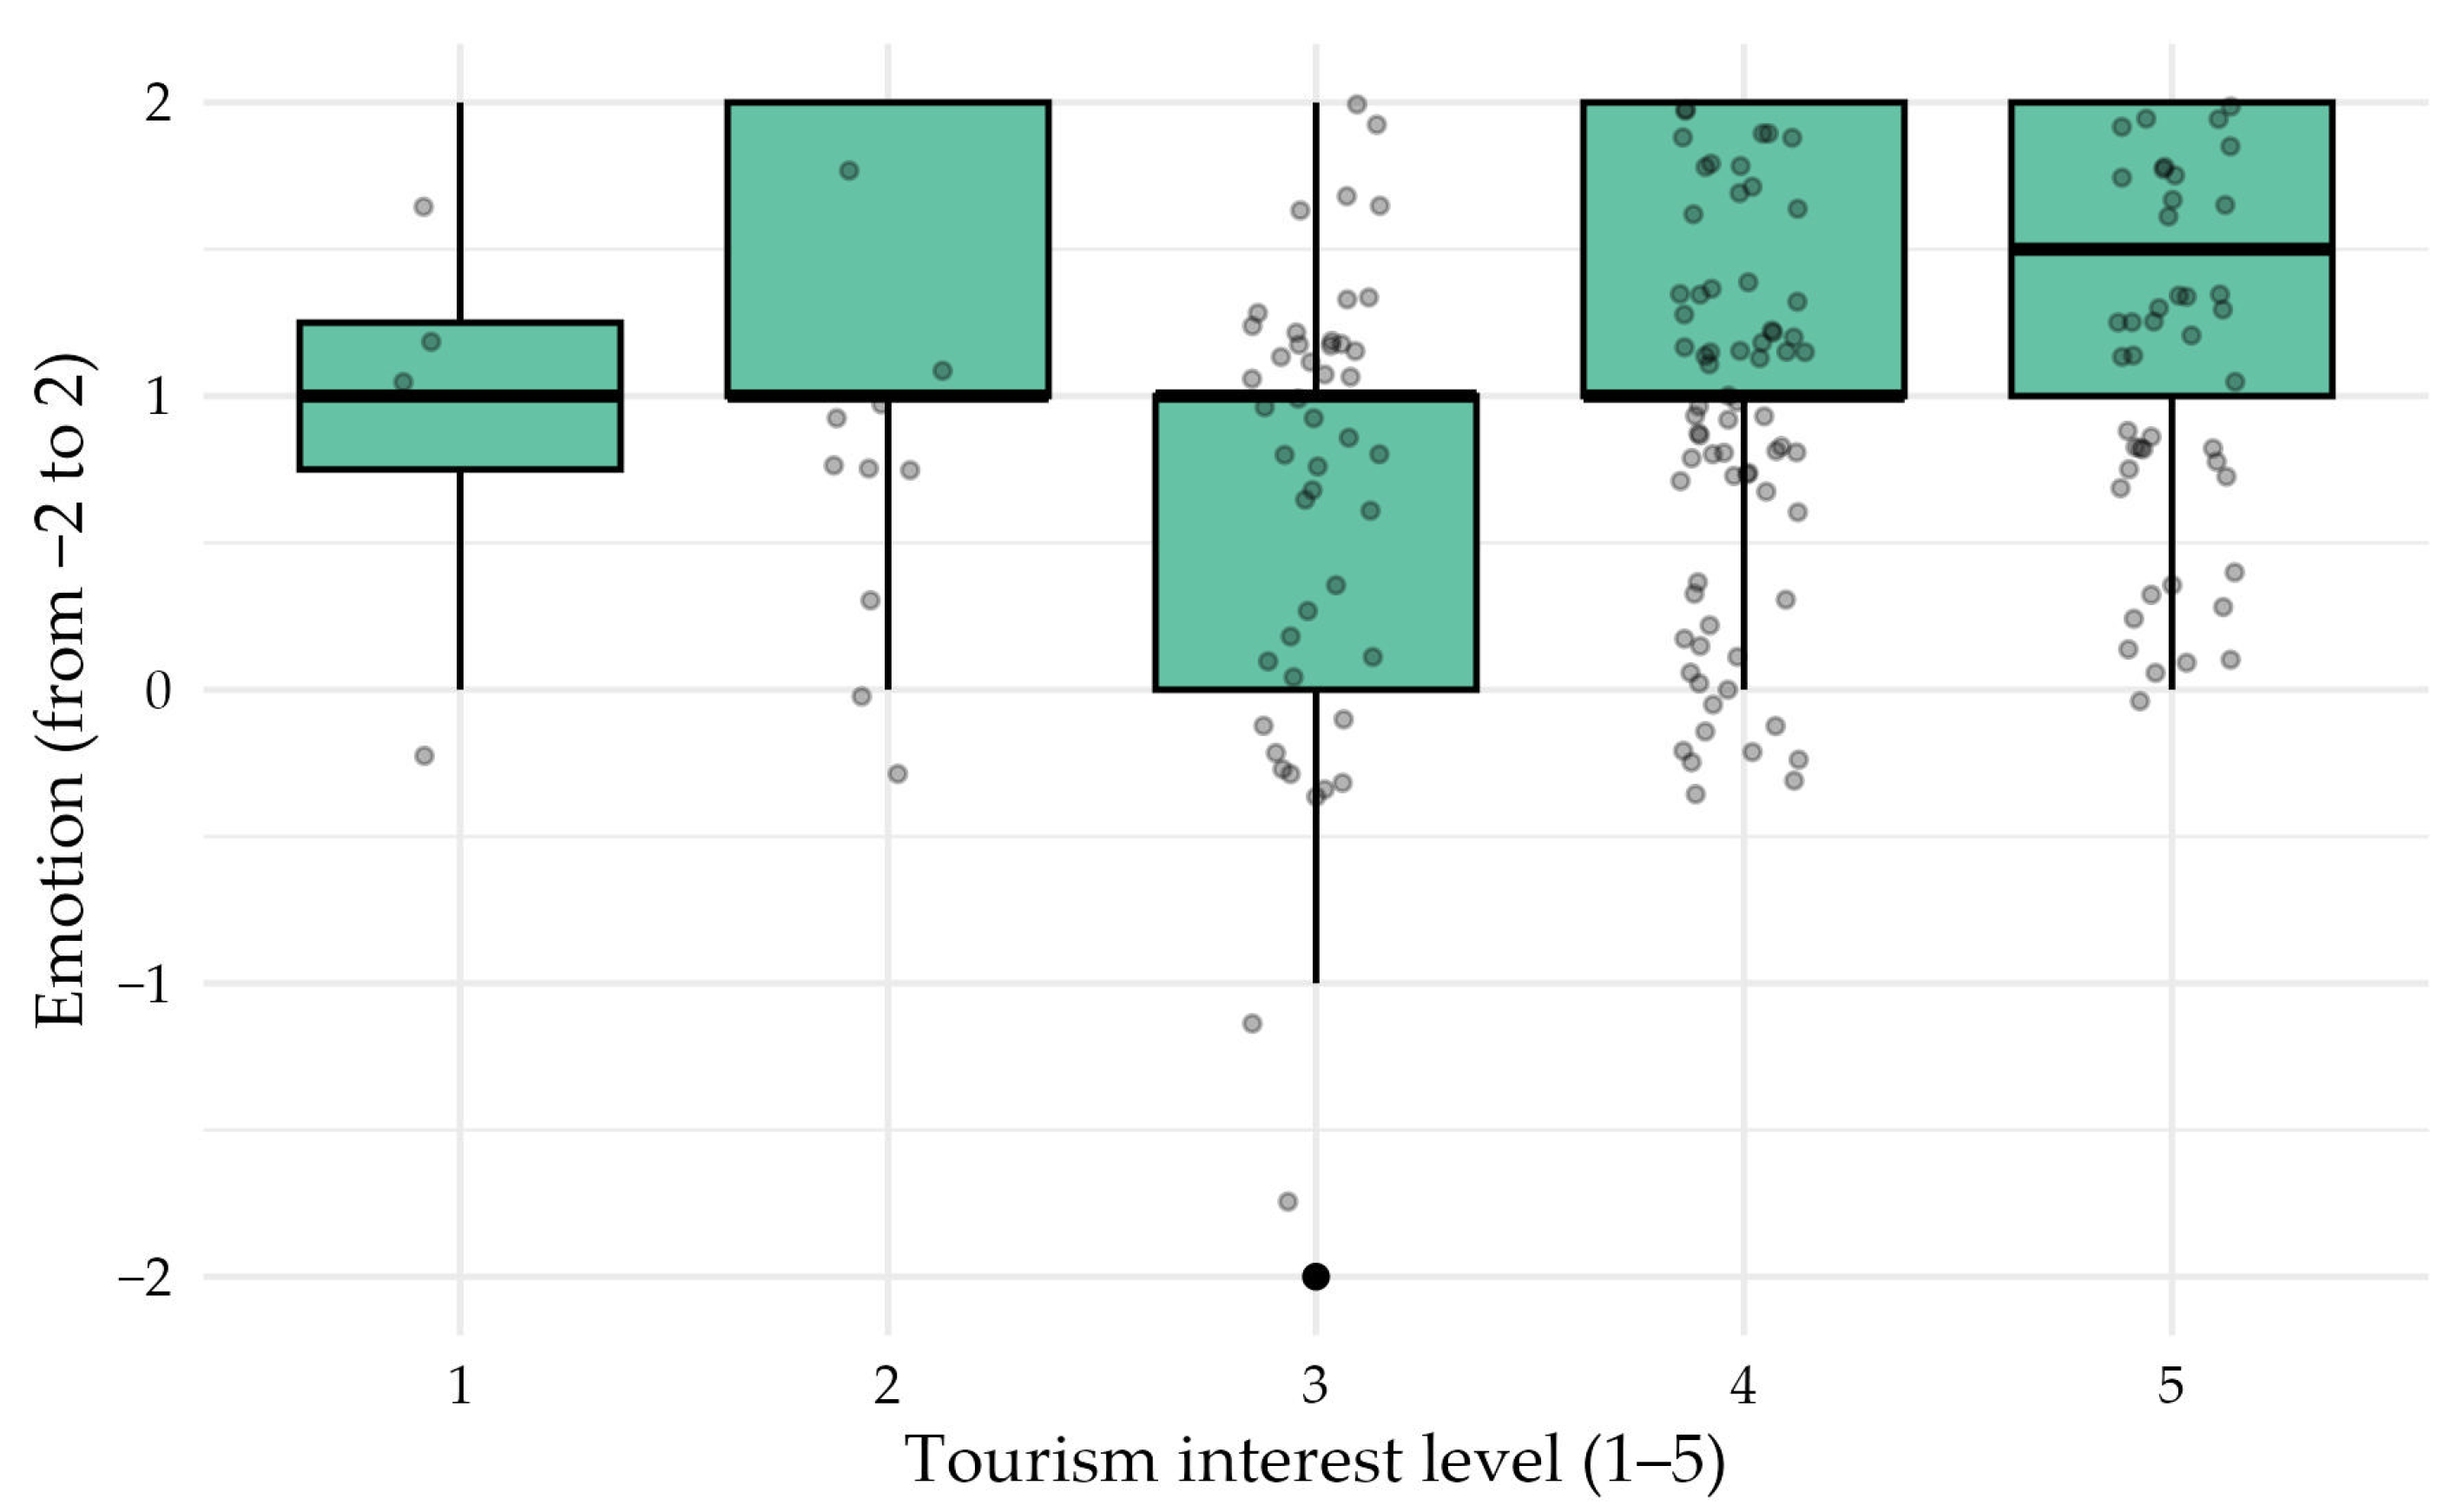
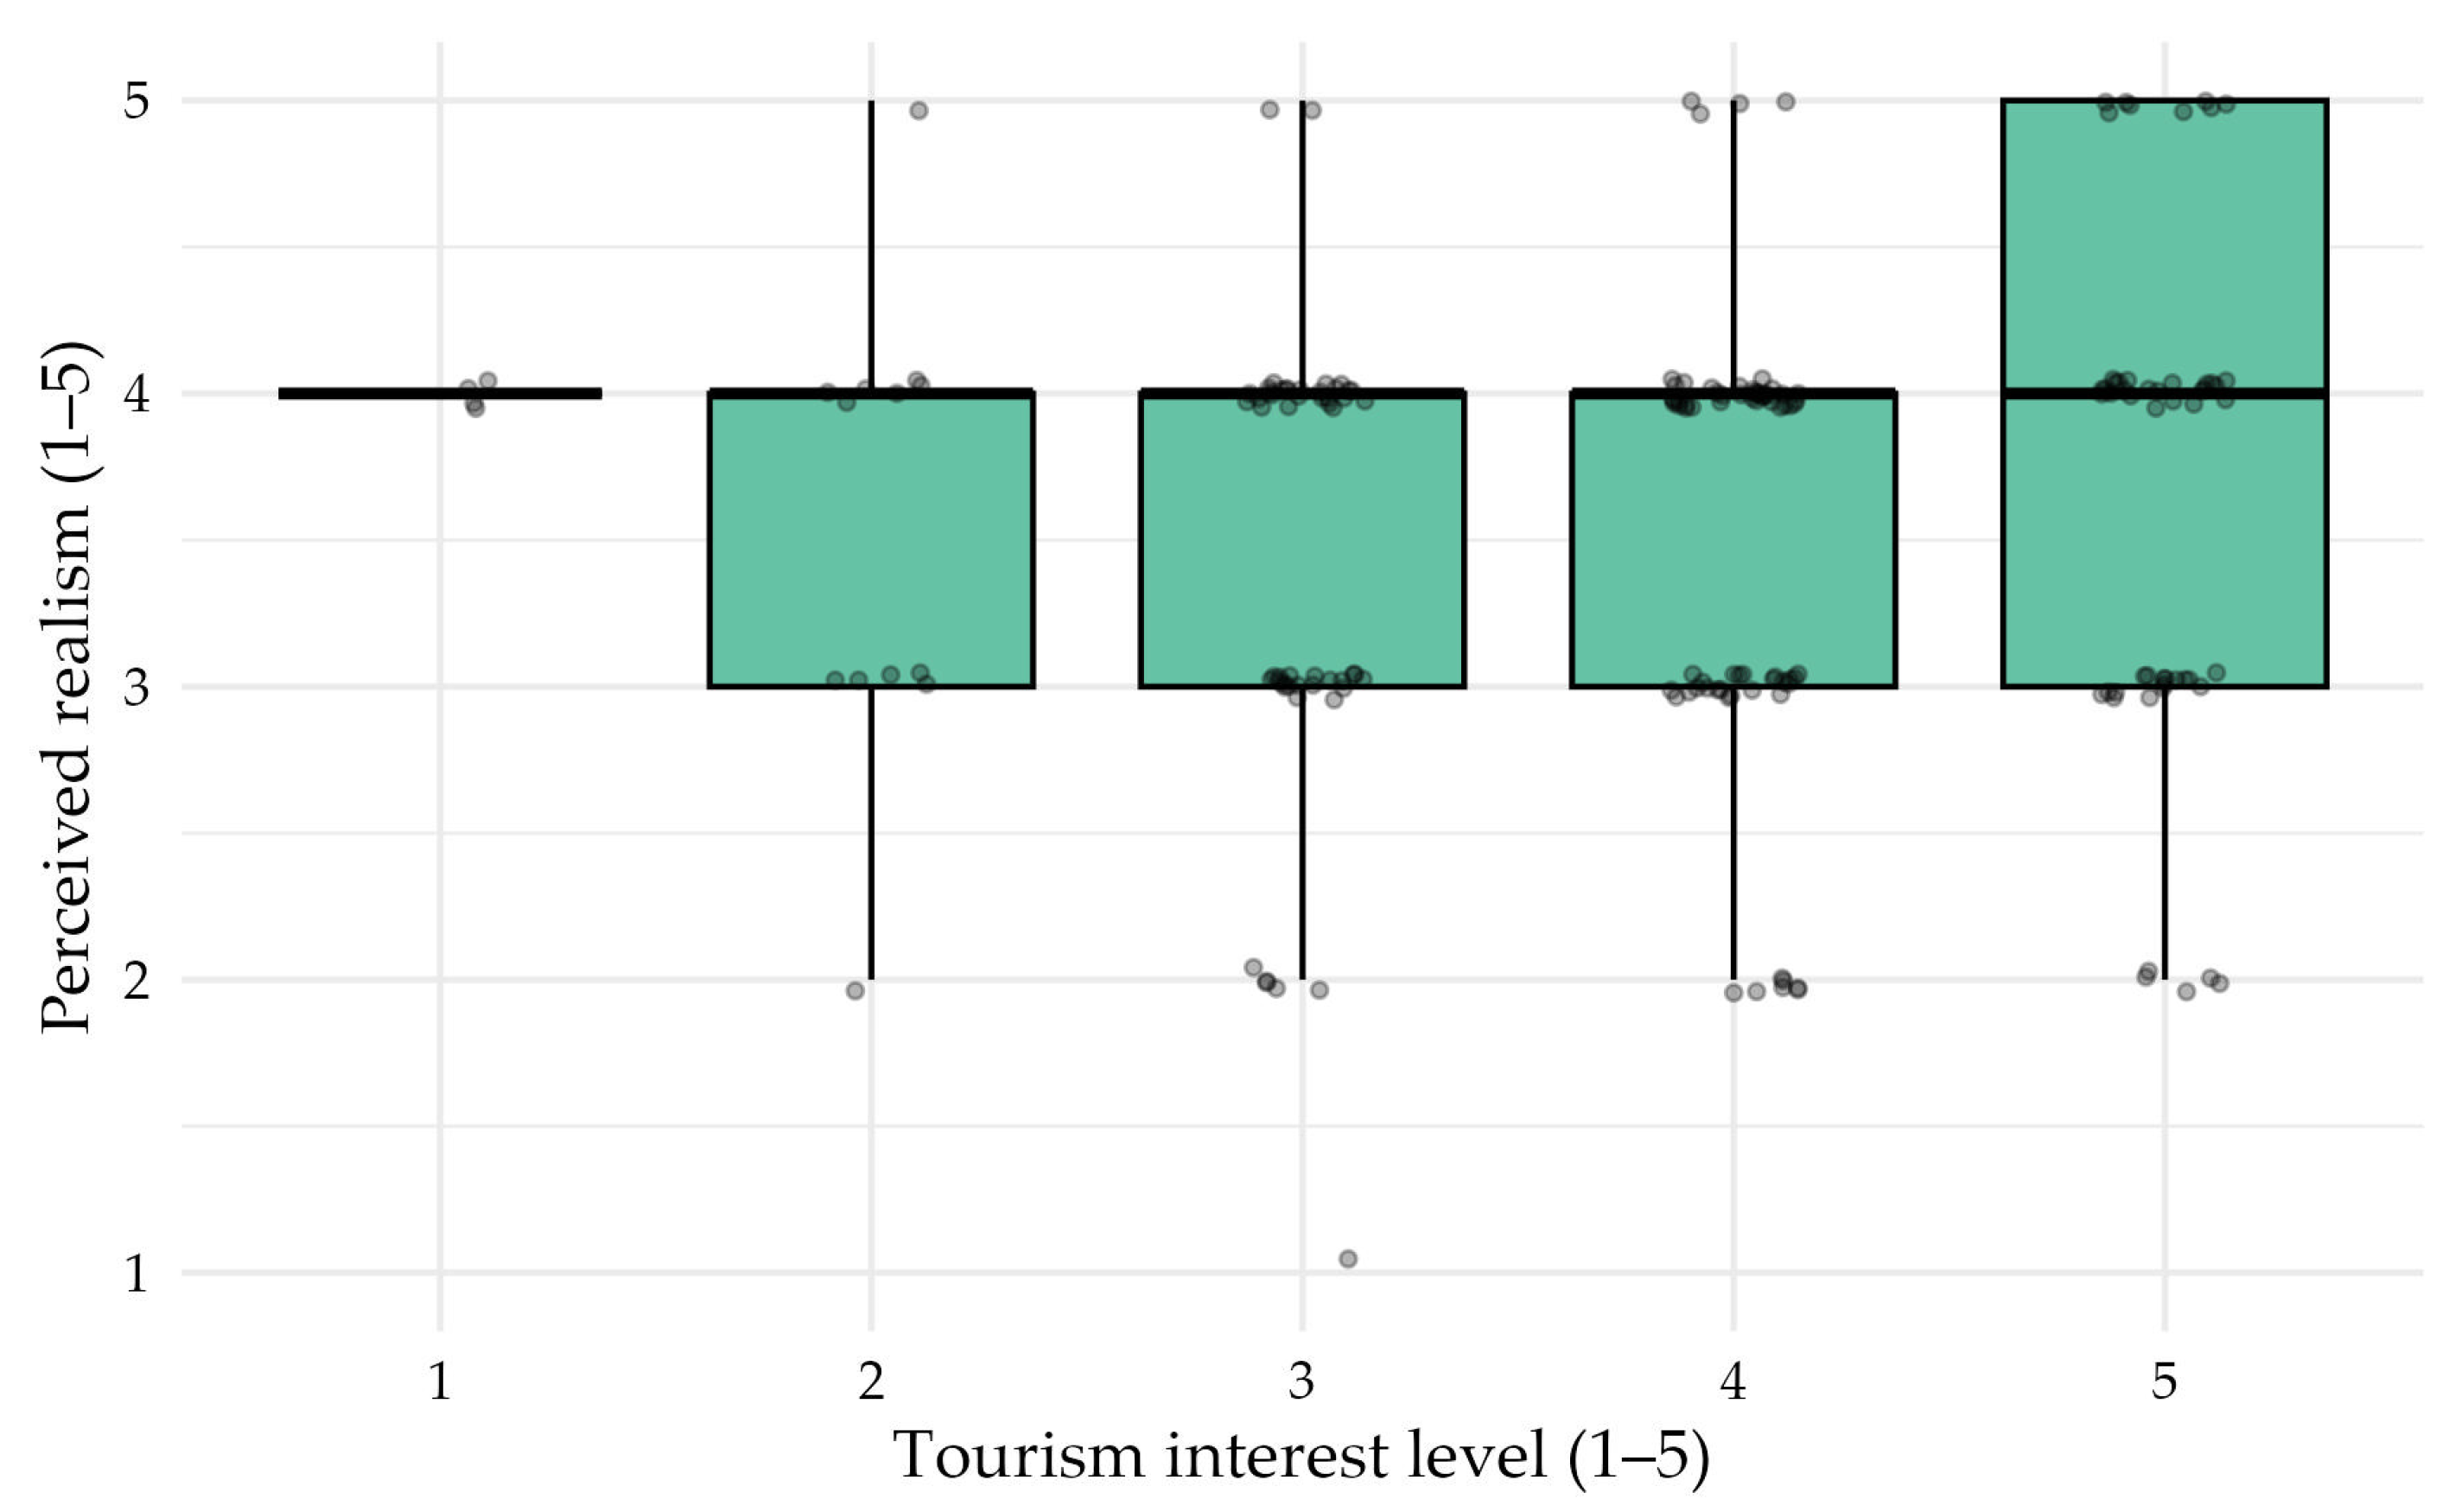
These findings indicate that participants with the highest interest in tourism tended to report stronger emotional reactions and higher engagement during the VR experience than those with moderate levels of interest.
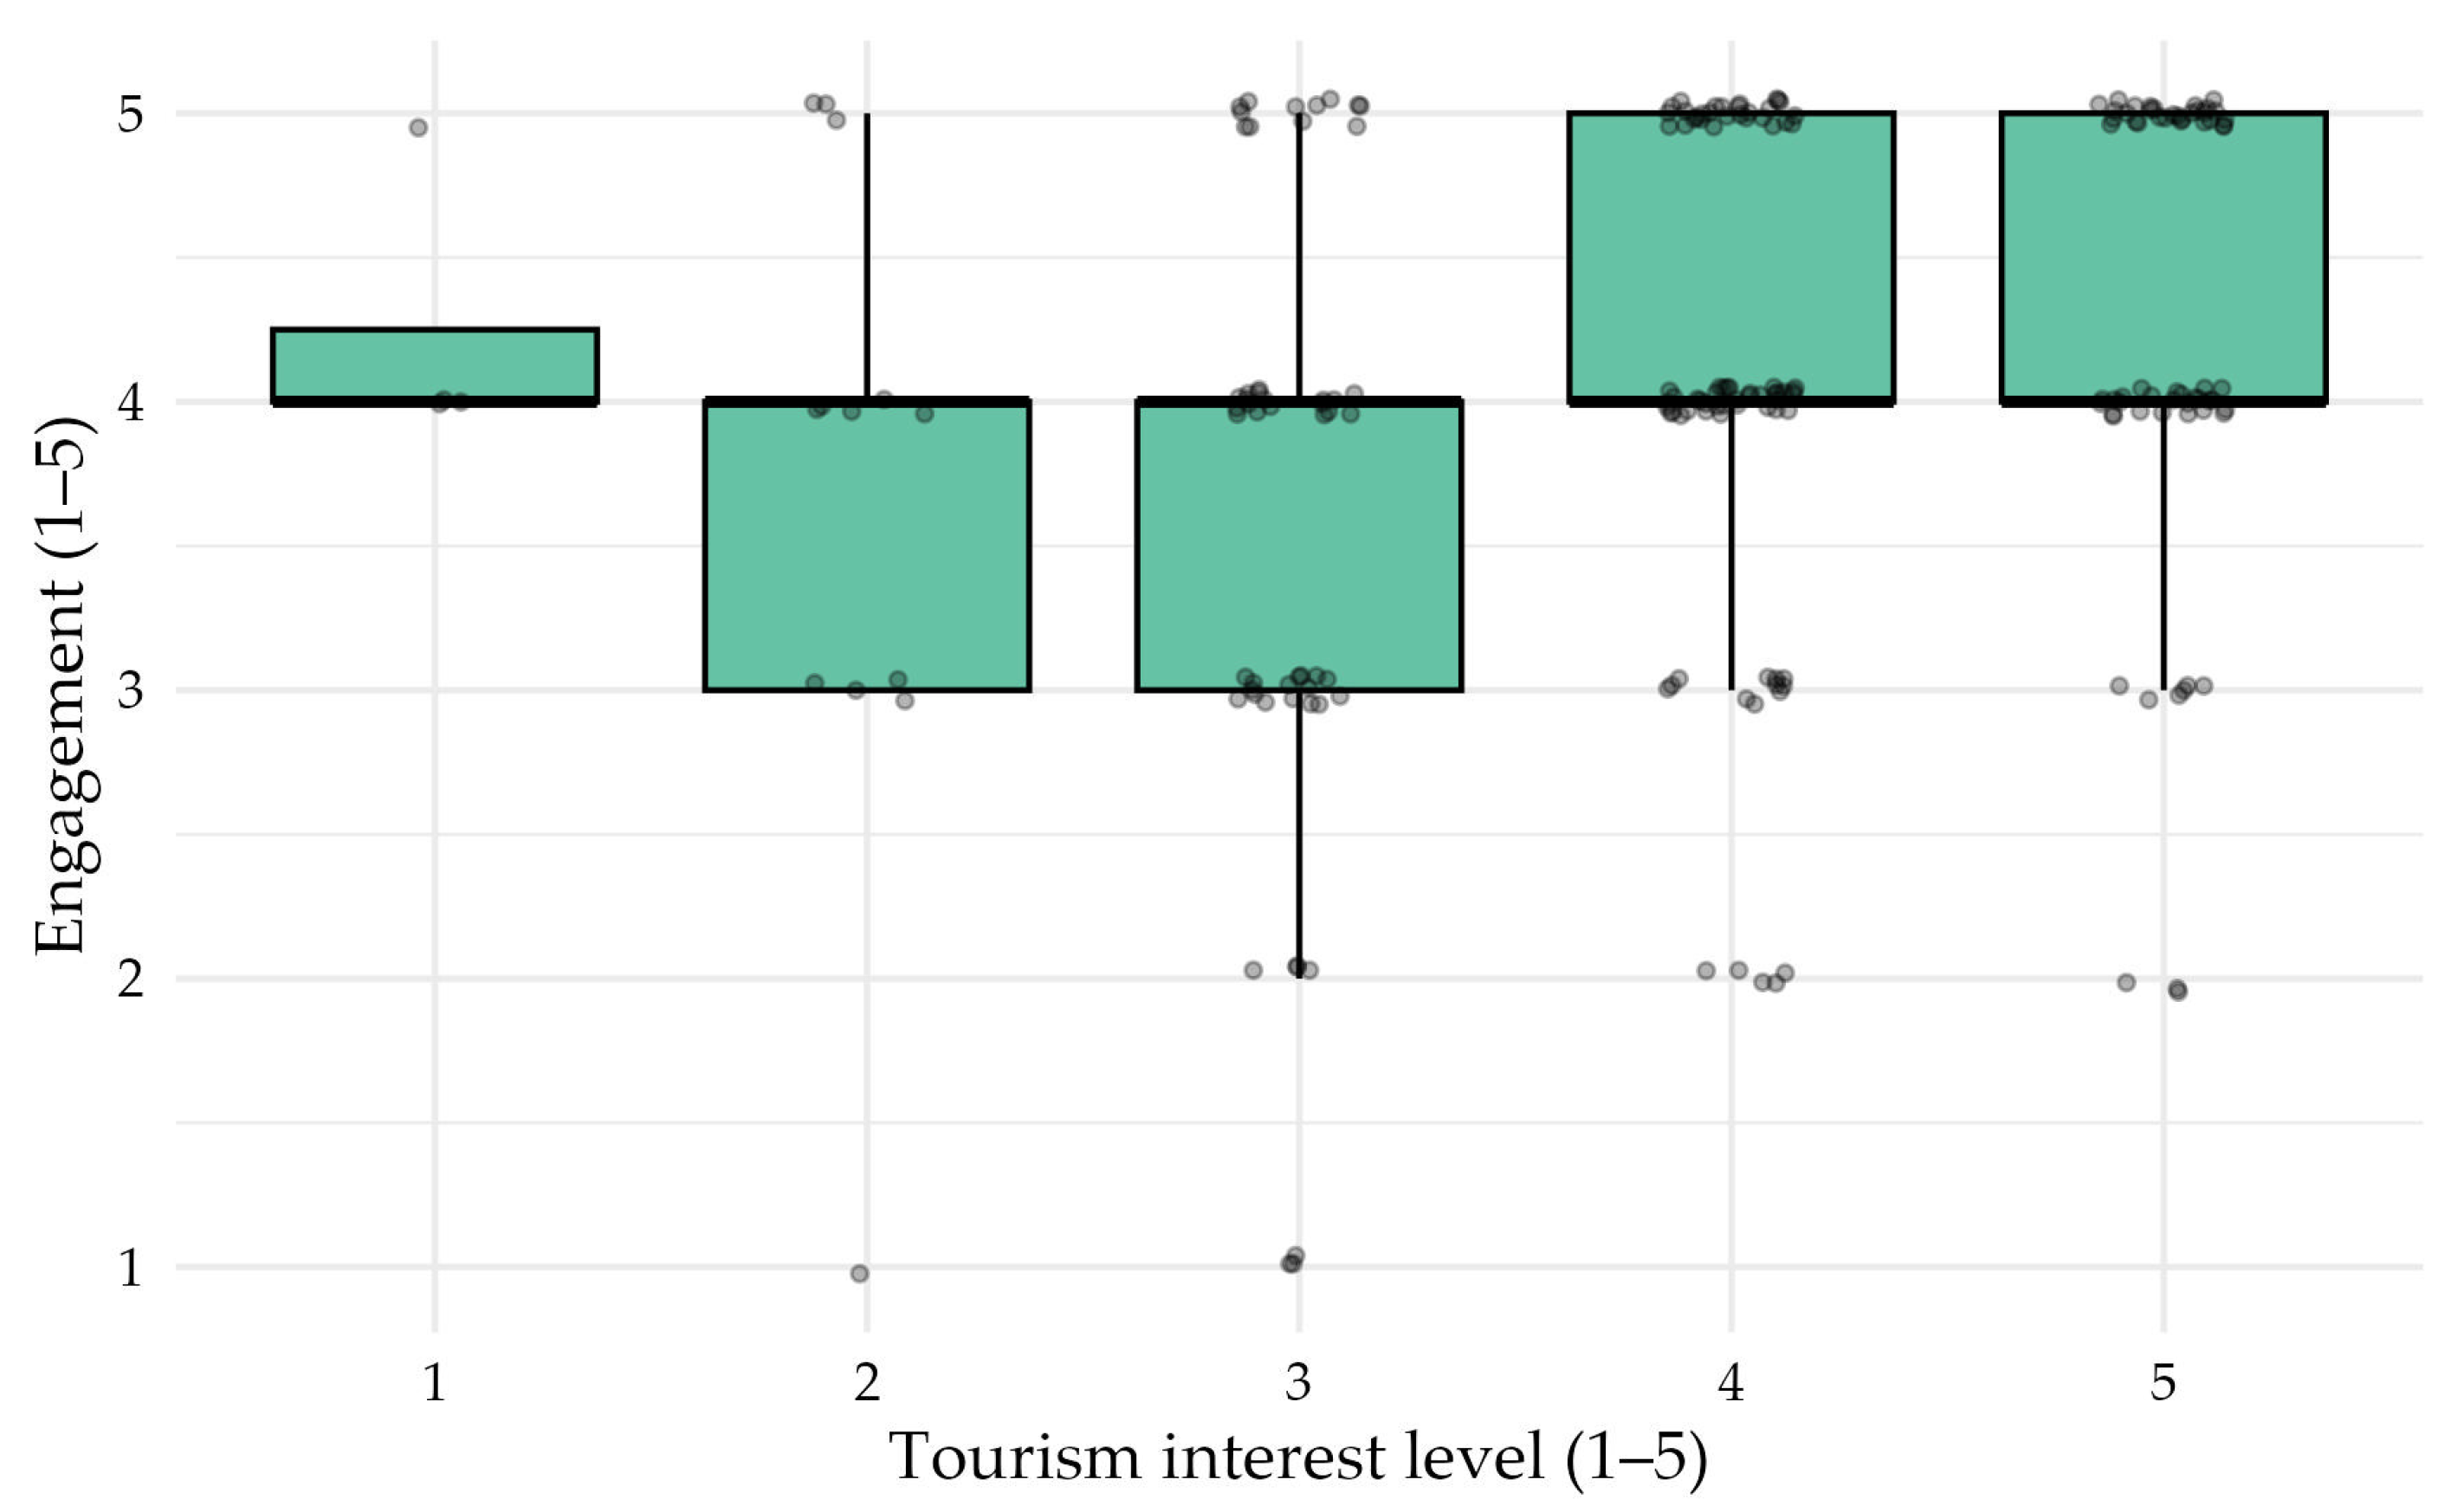
Figure 3,
Figure 4 and
Figure 5 illustrate these relationships.
The patterns observed in
Figure 3,
Figure 4 and
Figure 5 provide additional insight into how prior tourism interest shapes the VR experience. Emotional responses showed a non-linear relationship with tourism interest: participants reporting a neutral interest level (3) exhibited the lowest emotional activation, whereas those with either low (1–2) or high (5) tourism interest reported more positive reactions. This pattern suggests that individuals who are either strongly engaged in tourism or, conversely, generally uninterested in travel may be more susceptible to affective stimulation in a VR environment. In contrast, those with moderate or ambivalent attitudes toward travel reacted in a more emotionally muted way.
Engagement followed a more monotonic trend, increasing steadily with tourism interest. Participants with the highest interest level (5) demonstrated the strongest sense of involvement, consistent with both correlation and Dunn test results.
Perceived realism also tended to increase with tourism interest, although the effect was weaker and only marginally significant in the group comparison test. Nevertheless, visual inspection indicates that higher interest levels were associated with slightly higher realism ratings, especially compared to the neutral group.
Overall, the combination of statistical and visual evidence demonstrates that tourism interest is a meaningful moderator of VR experience quality. Highly interested participants reacted more intensely and felt more engaged, whereas those with moderate interest appeared less responsive across emotional and engagement dimensions. This suggests that pre-existing motivational states can influence how immersive, emotionally evocative, and absorbing VR tourism content feels, which is an important consideration for designing targeted VR experiences.
4.2. Exploratory Analyses of Travel Frequency and VR Experience
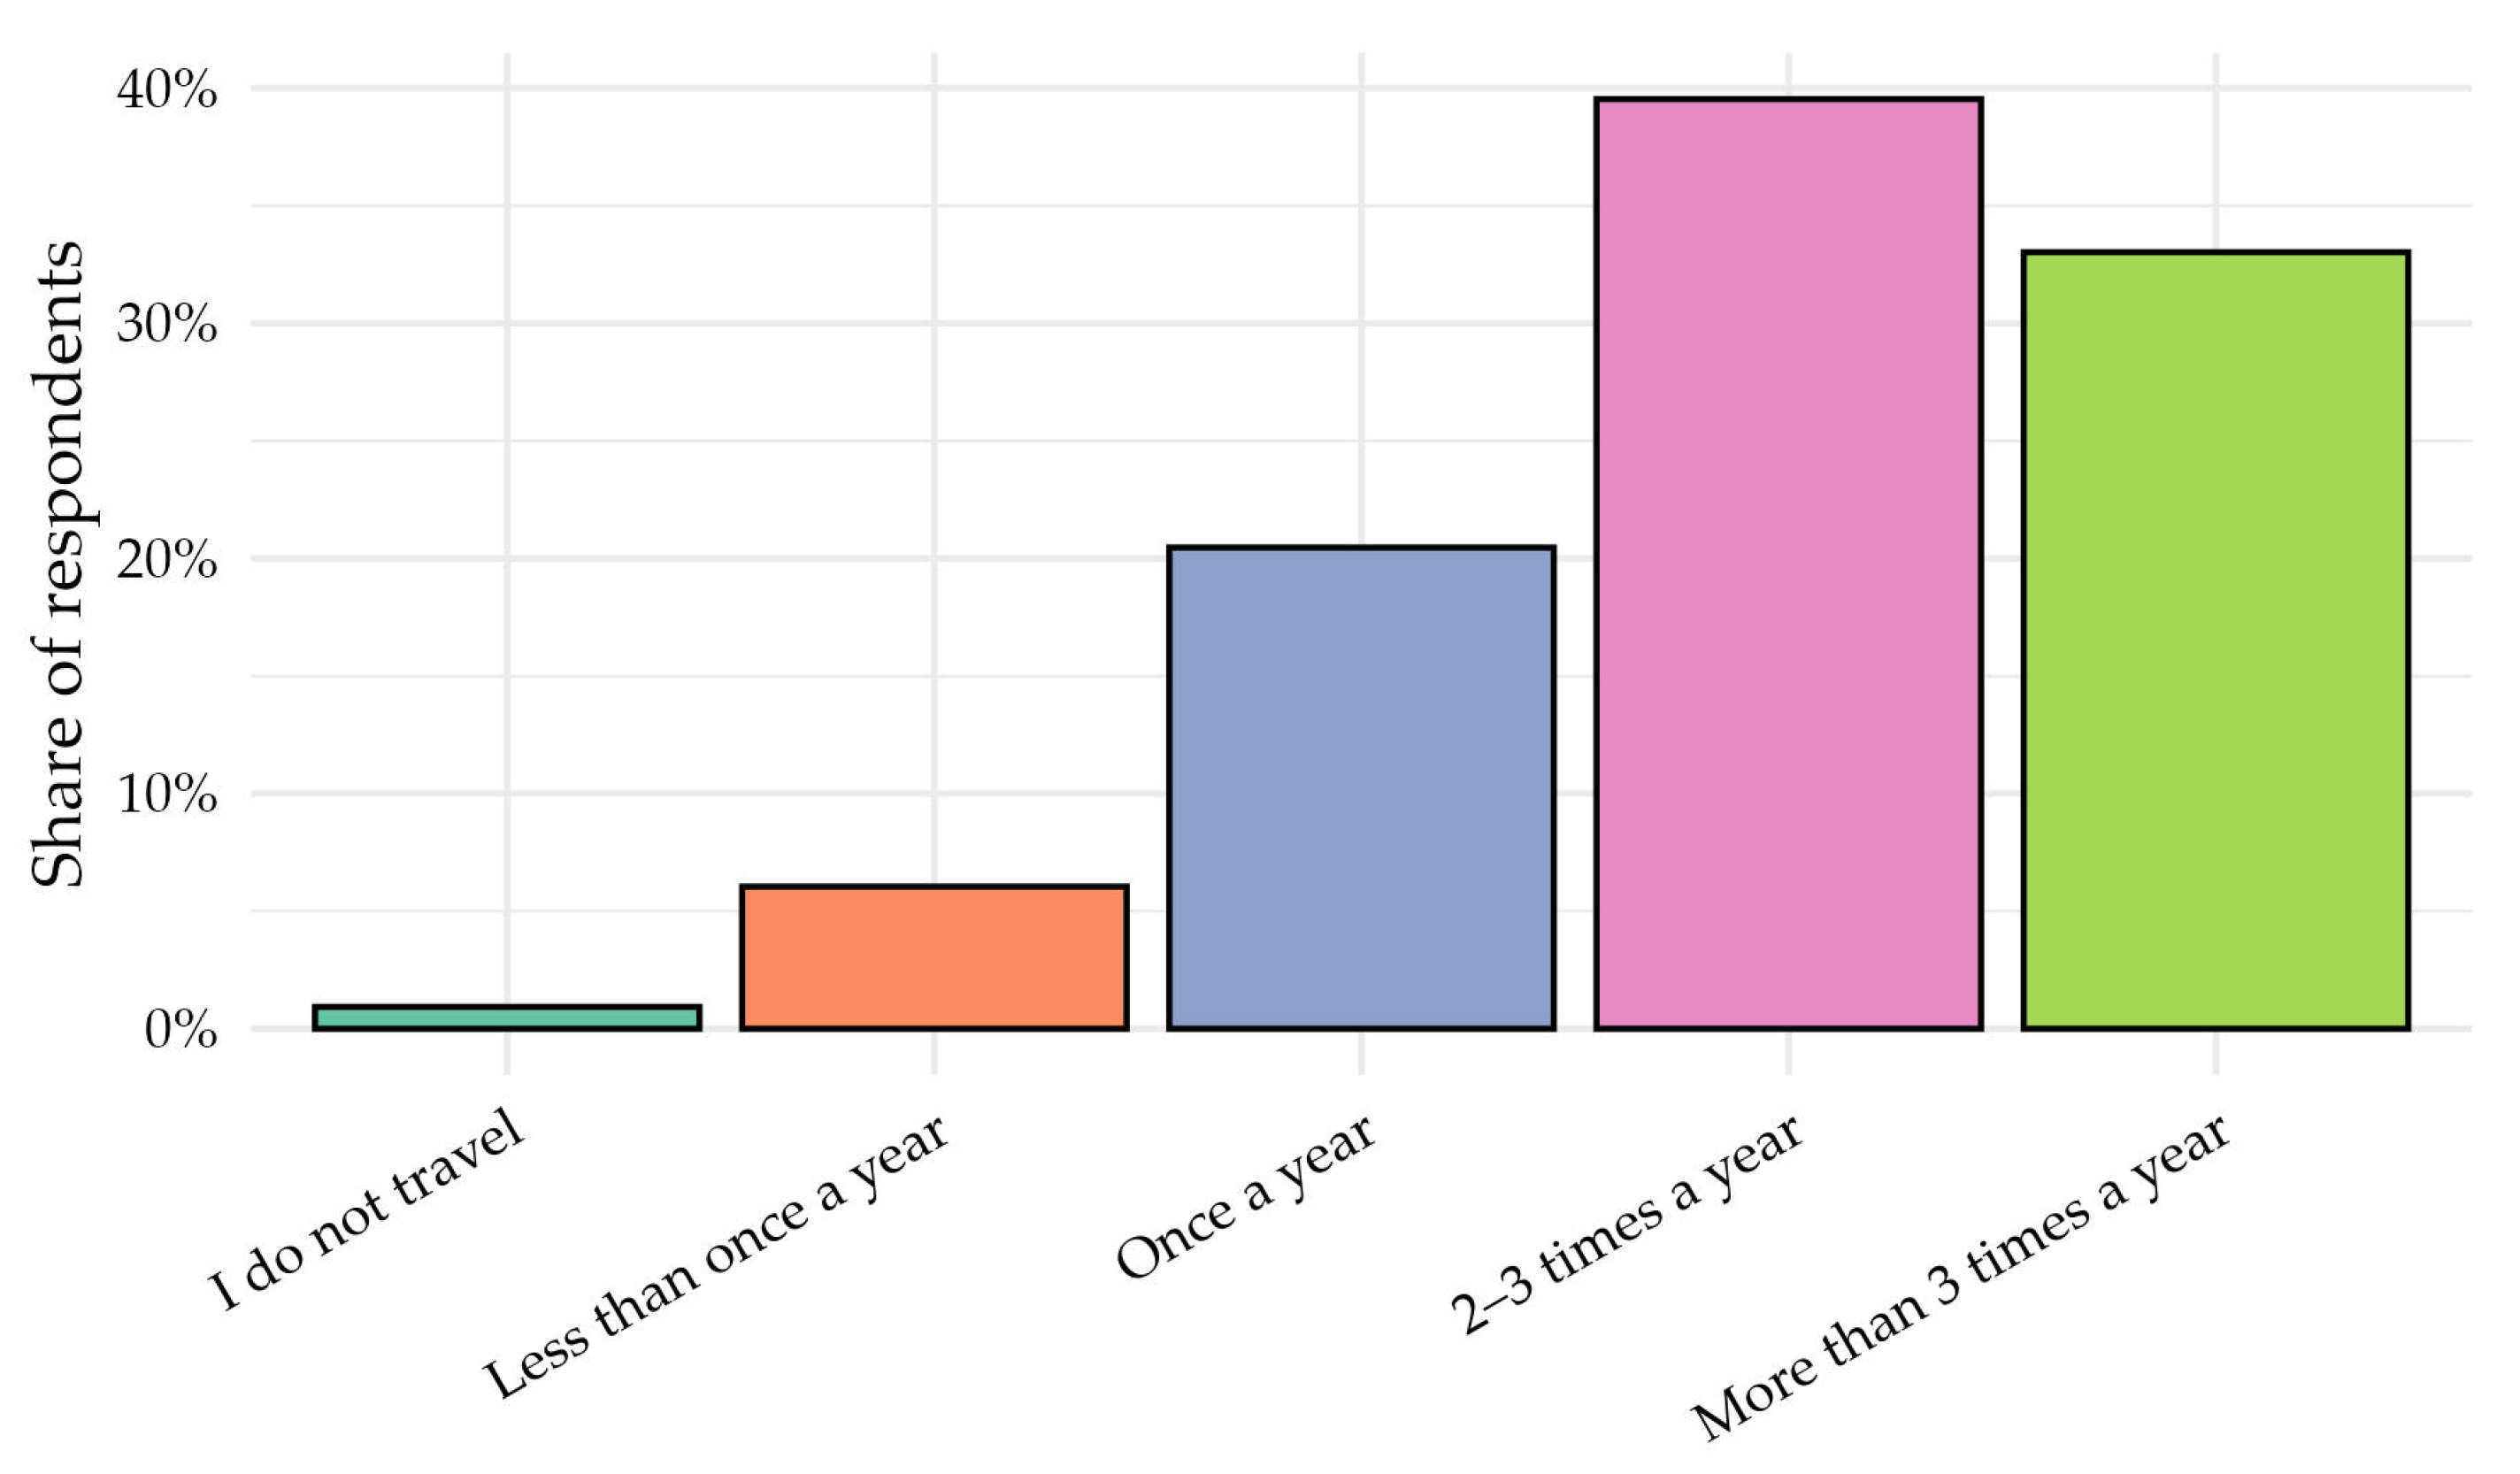
Before examining VR experience outcomes, participants reported how often they typically travel in a year, using five ordered categories ranging from “I do not travel” to “More than 3 times a year”. The distribution showed that most respondents traveled two to three times a year or more frequently, while very few reported not traveling at all.
Figure 6 presents the distribution. Interpretation of the travel-frequency analyses also requires caution because the lowest category (“I do not travel”) included only two participants, resulting in substantial group-size imbalance across the five-level comparison. This imbalance may reduce the stability of omnibus rank-based tests and post-hoc contrasts.
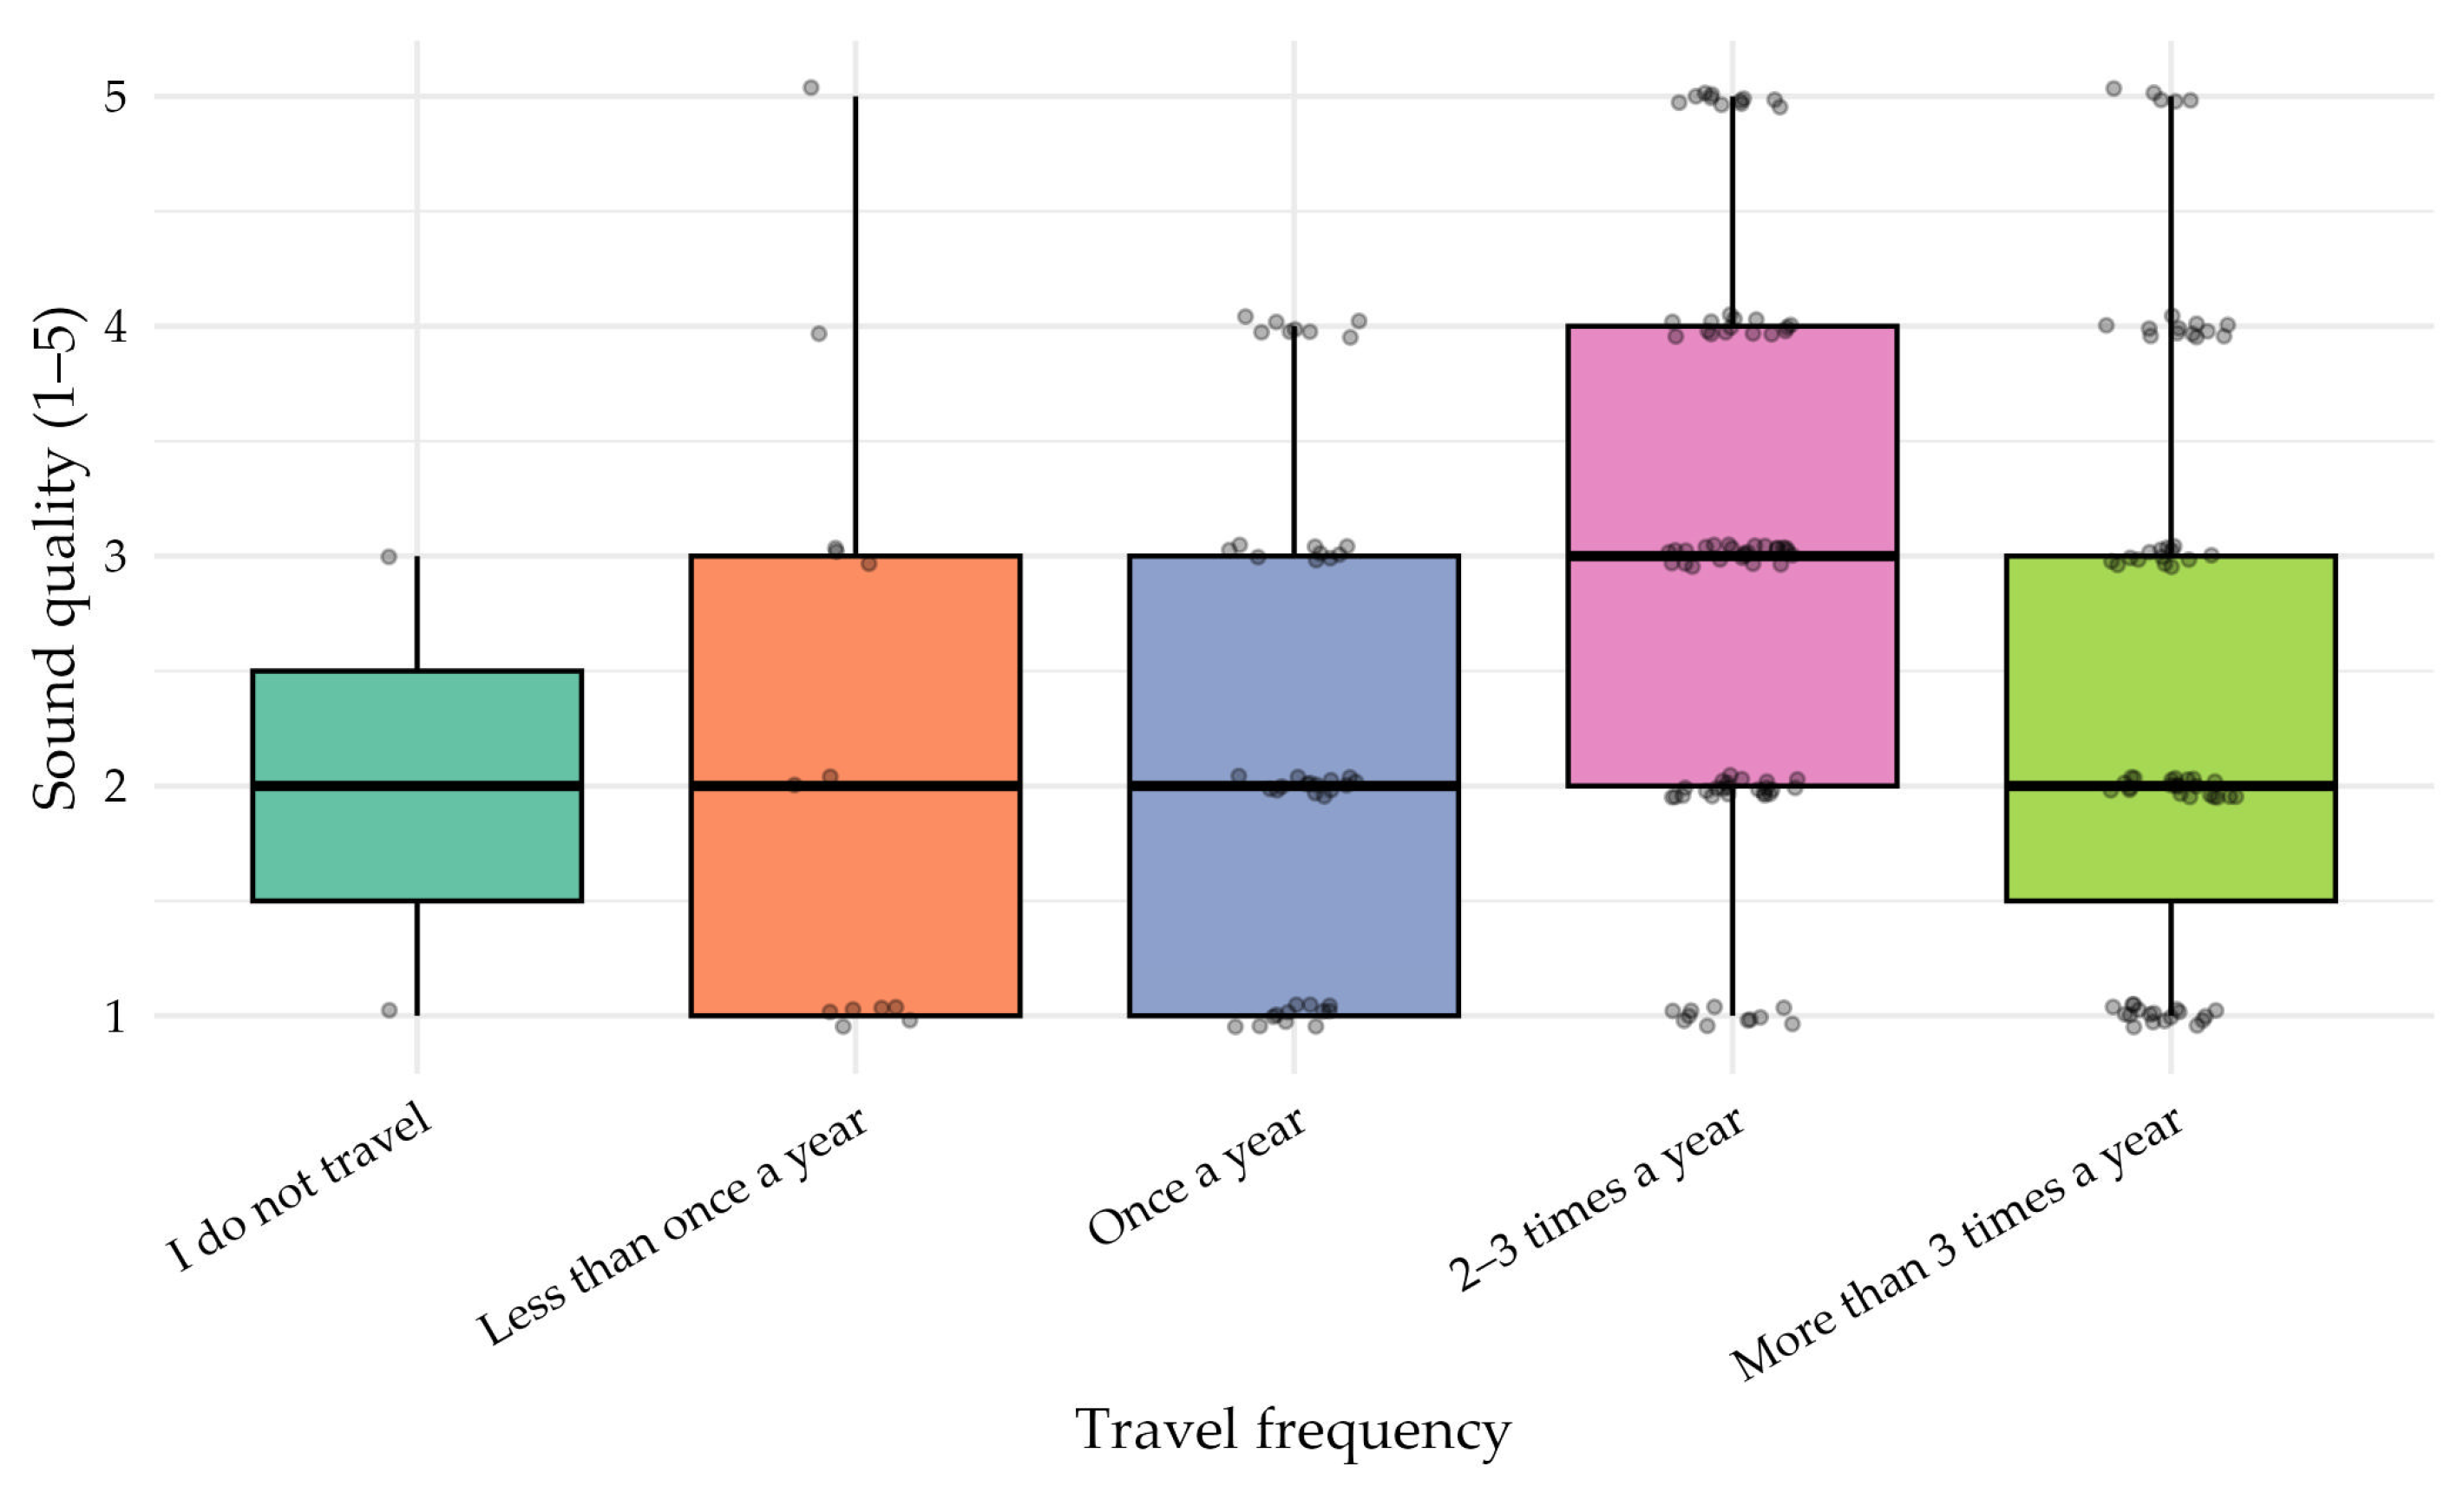
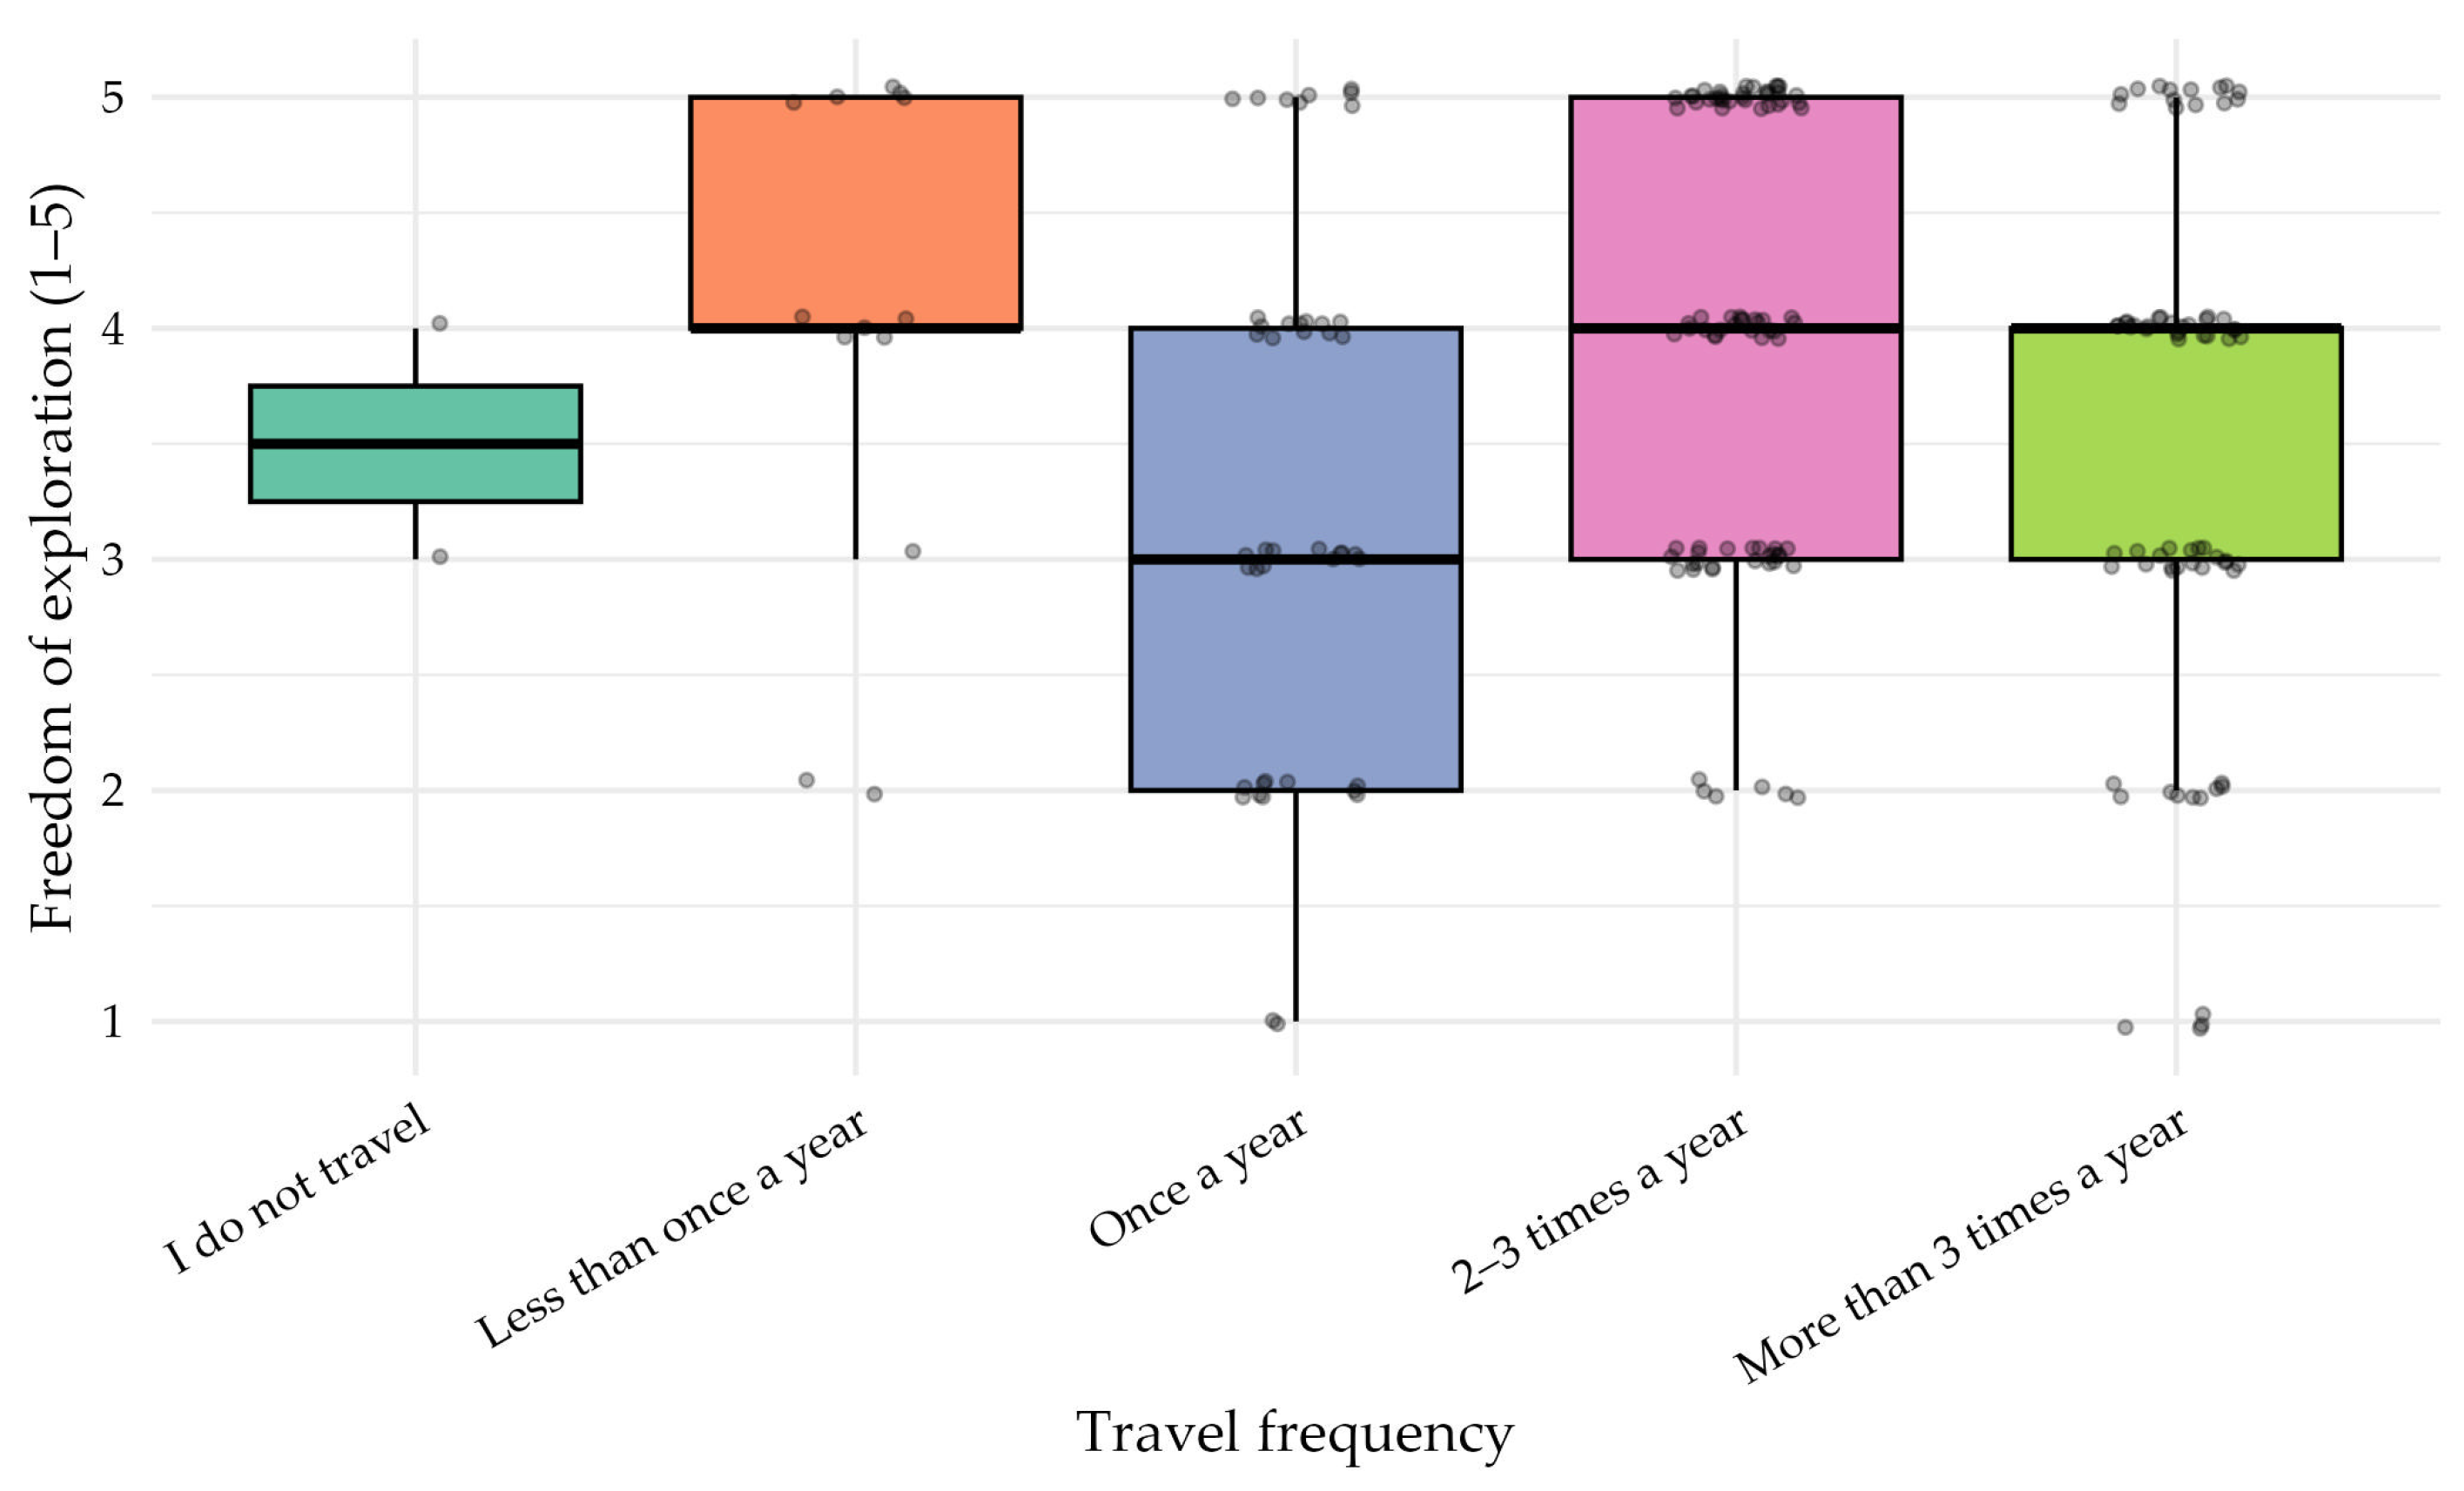
Because travel frequency is an ordinal variable and several VR experience variables deviated from normality, non-parametric analyses were applied. In the first step, it was evaluated whether travel frequency exhibited monotonic associations with user-reported aspects of the VR experience. Spearman’s rank correlation was therefore computed between travel frequency (coded 1–5) and a set of VR experience variables: emotional response, engagement, overall perceived realism, and six specific realism components (360° view, graphical fidelity, motion lag, freedom of movement, sound quality, and motion tracking accuracy). The results indicated that none of the VR variables demonstrated a statistically significant monotonic relationship with travel frequency (all |ρ| < 0.15, p > 0.05), except for a small negative correlation with intuition (ρ = −0.14, p = 0.045). Apart from this very small negative association with intuitiveness, travel frequency did not show clear monotonic relationships with the analyzed VR experience variables.
To further examine group differences, travel frequency was treated as a five-level categorical variable and was analyzed using Kruskal–Wallis tests.
Table 5 summarizes the results. Four VR variables showed nominally significant omnibus Kruskal–Wallis effects across travel-frequency groups: freedom of exploration (χ
2 = 13.05,
p = 0.011), sound quality (χ
2 = 10.58,
p = 0.032), emotional response (χ
2 = 9.89,
p = 0.042), and engagement (χ
2 = 11.09,
p = 0.026). However, these omnibus results should be interpreted cautiously and treated as exploratory, particularly given the imbalanced group sizes and the lack of significant post-hoc contrasts after correction.
Post-hoc comparisons using Dunn’s test with Bonferroni correction did not identify any pairwise differences that remained statistically significant. Although several contrasts showed small directional tendencies, none of the adjusted p-values fell below the significance threshold. Accordingly, these findings are treated as exploratory only and should not be interpreted as evidence of reliable group differences.
For freedom of exploration and sound quality, the distributions shown in
Figure 7 and
Figure 8 suggest a weak descriptive tendency for participants traveling two to three times per year to report somewhat higher scores than some of the other groups. However, because these contrasts did not survive Bonferroni correction, they should not be interpreted as confirmed between-group differences.
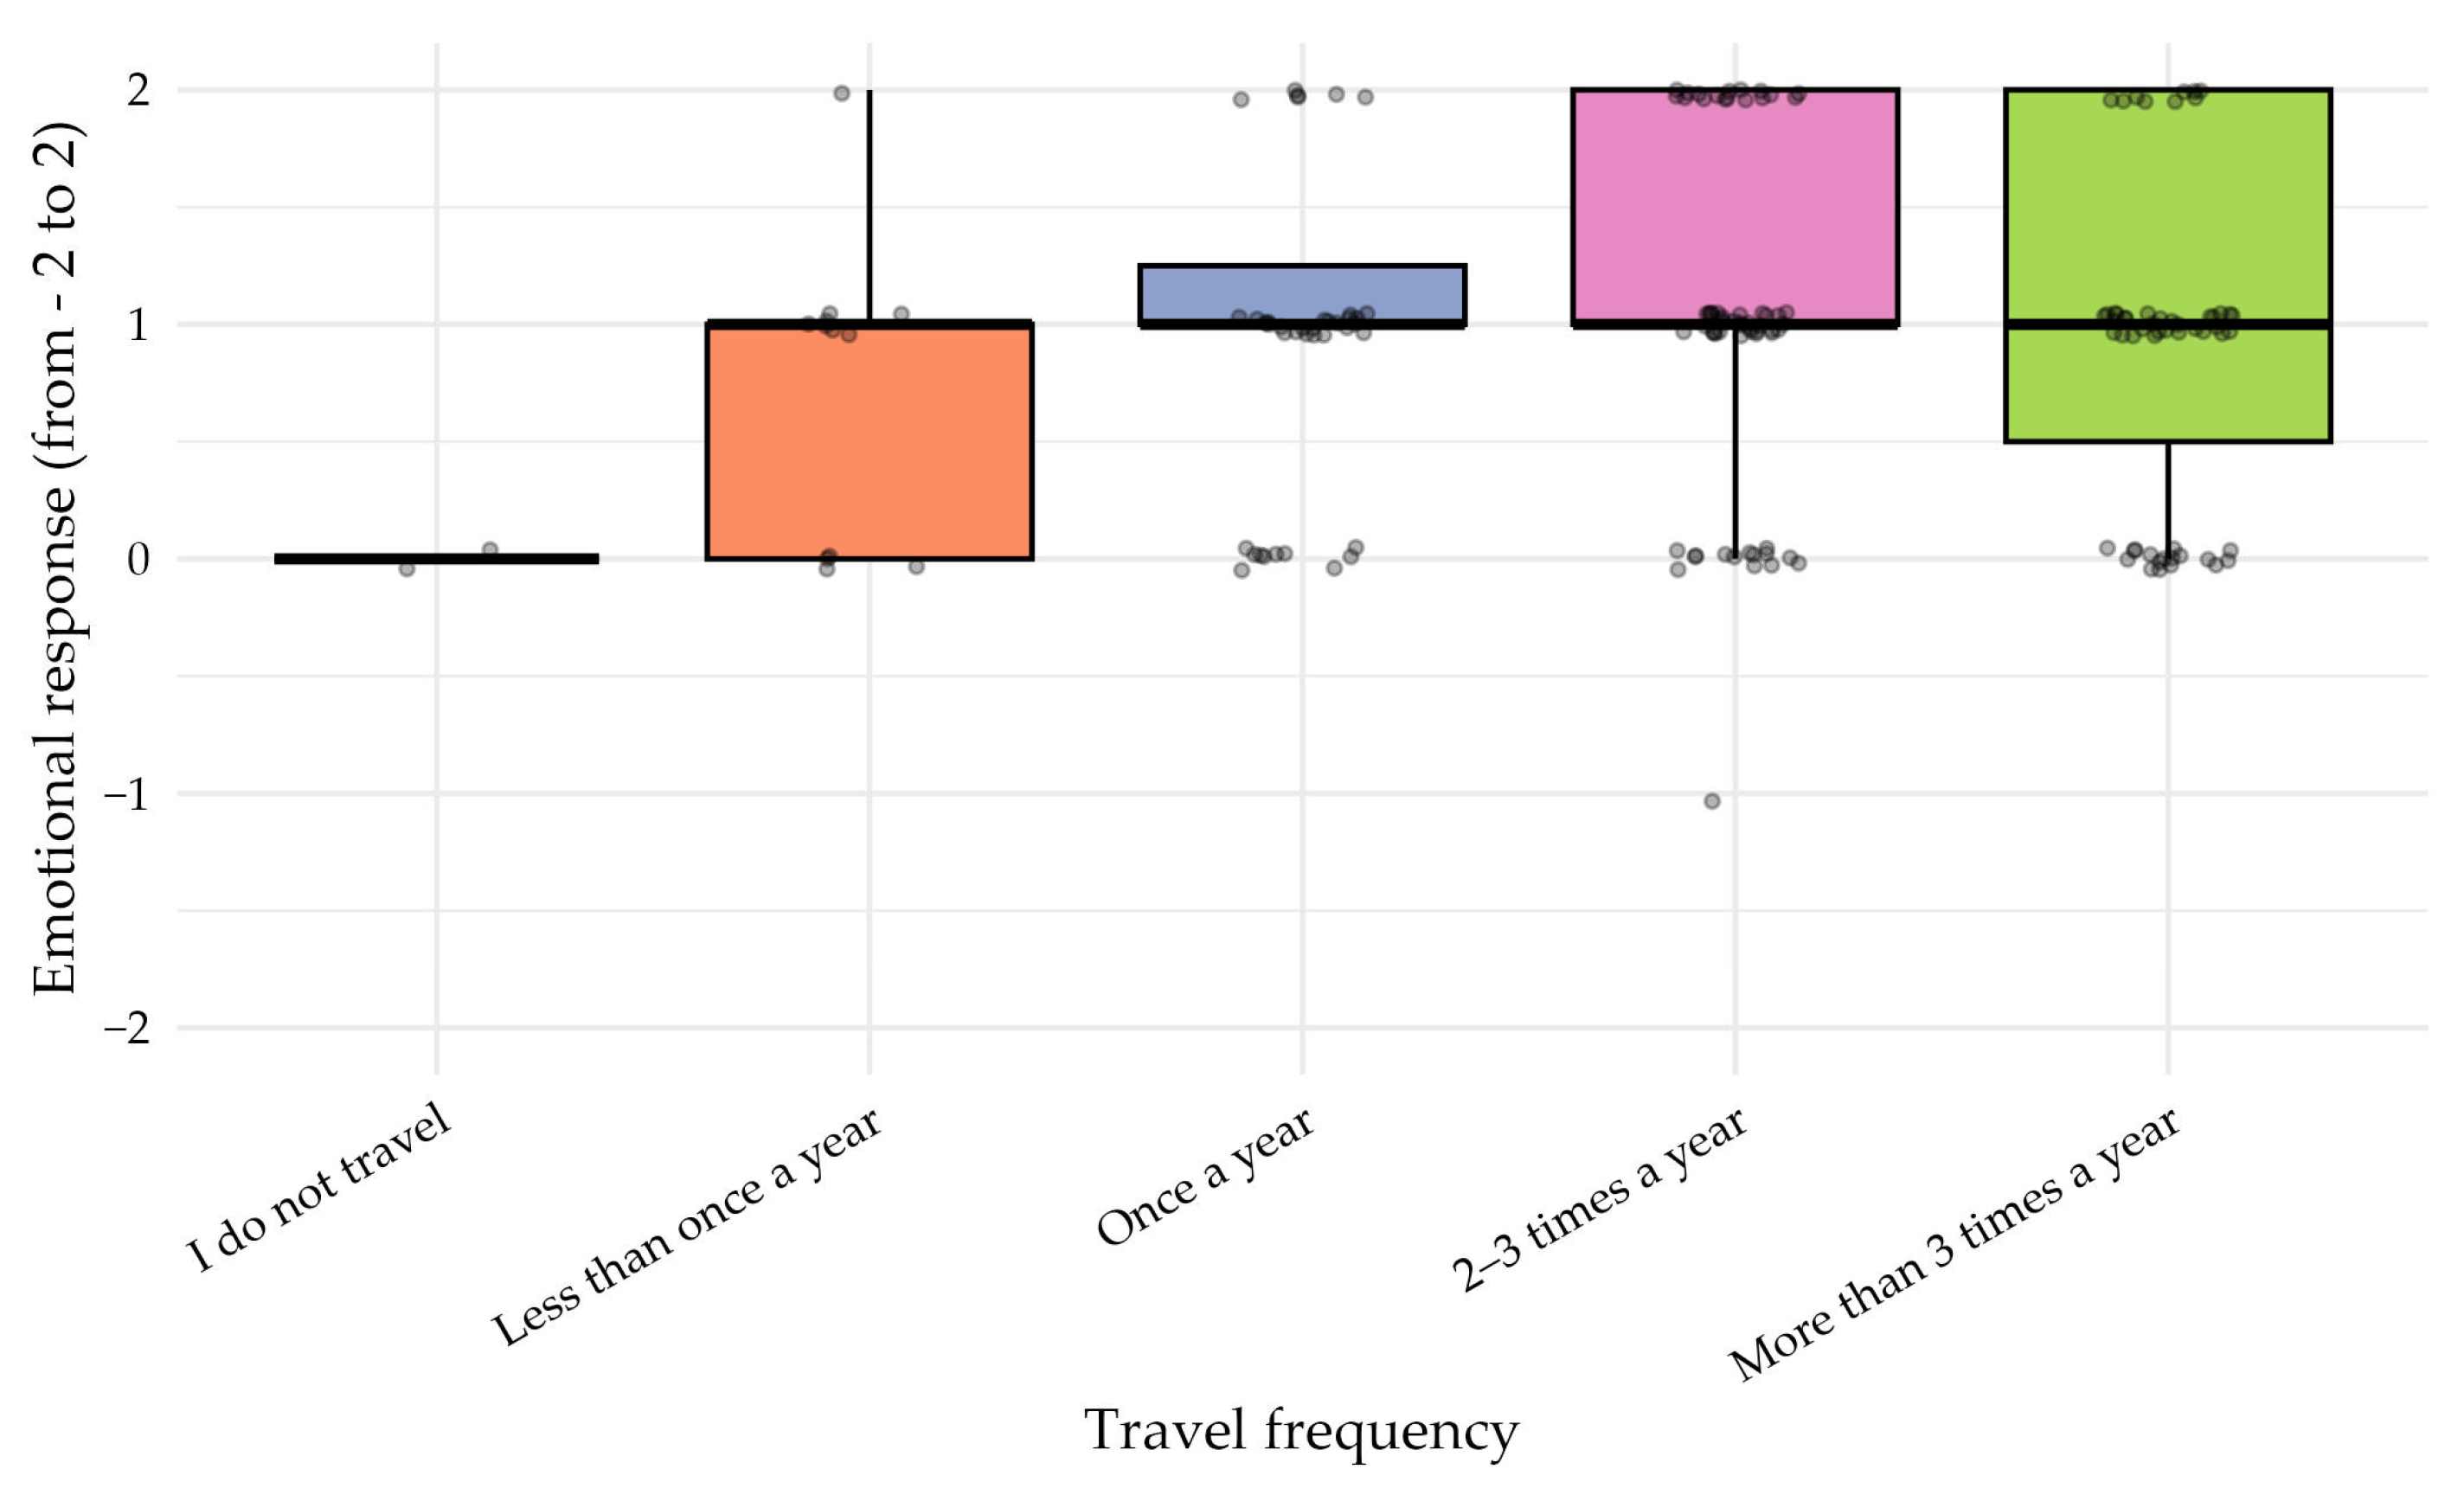
Emotional response showed a similarly weak and non-linear descriptive pattern in
Figure 9. Although higher-frequency travelers appeared to report somewhat more positive reactions than some of the other groups, no pairwise comparison reached statistical significance after adjustment, so this pattern should be interpreted with caution.
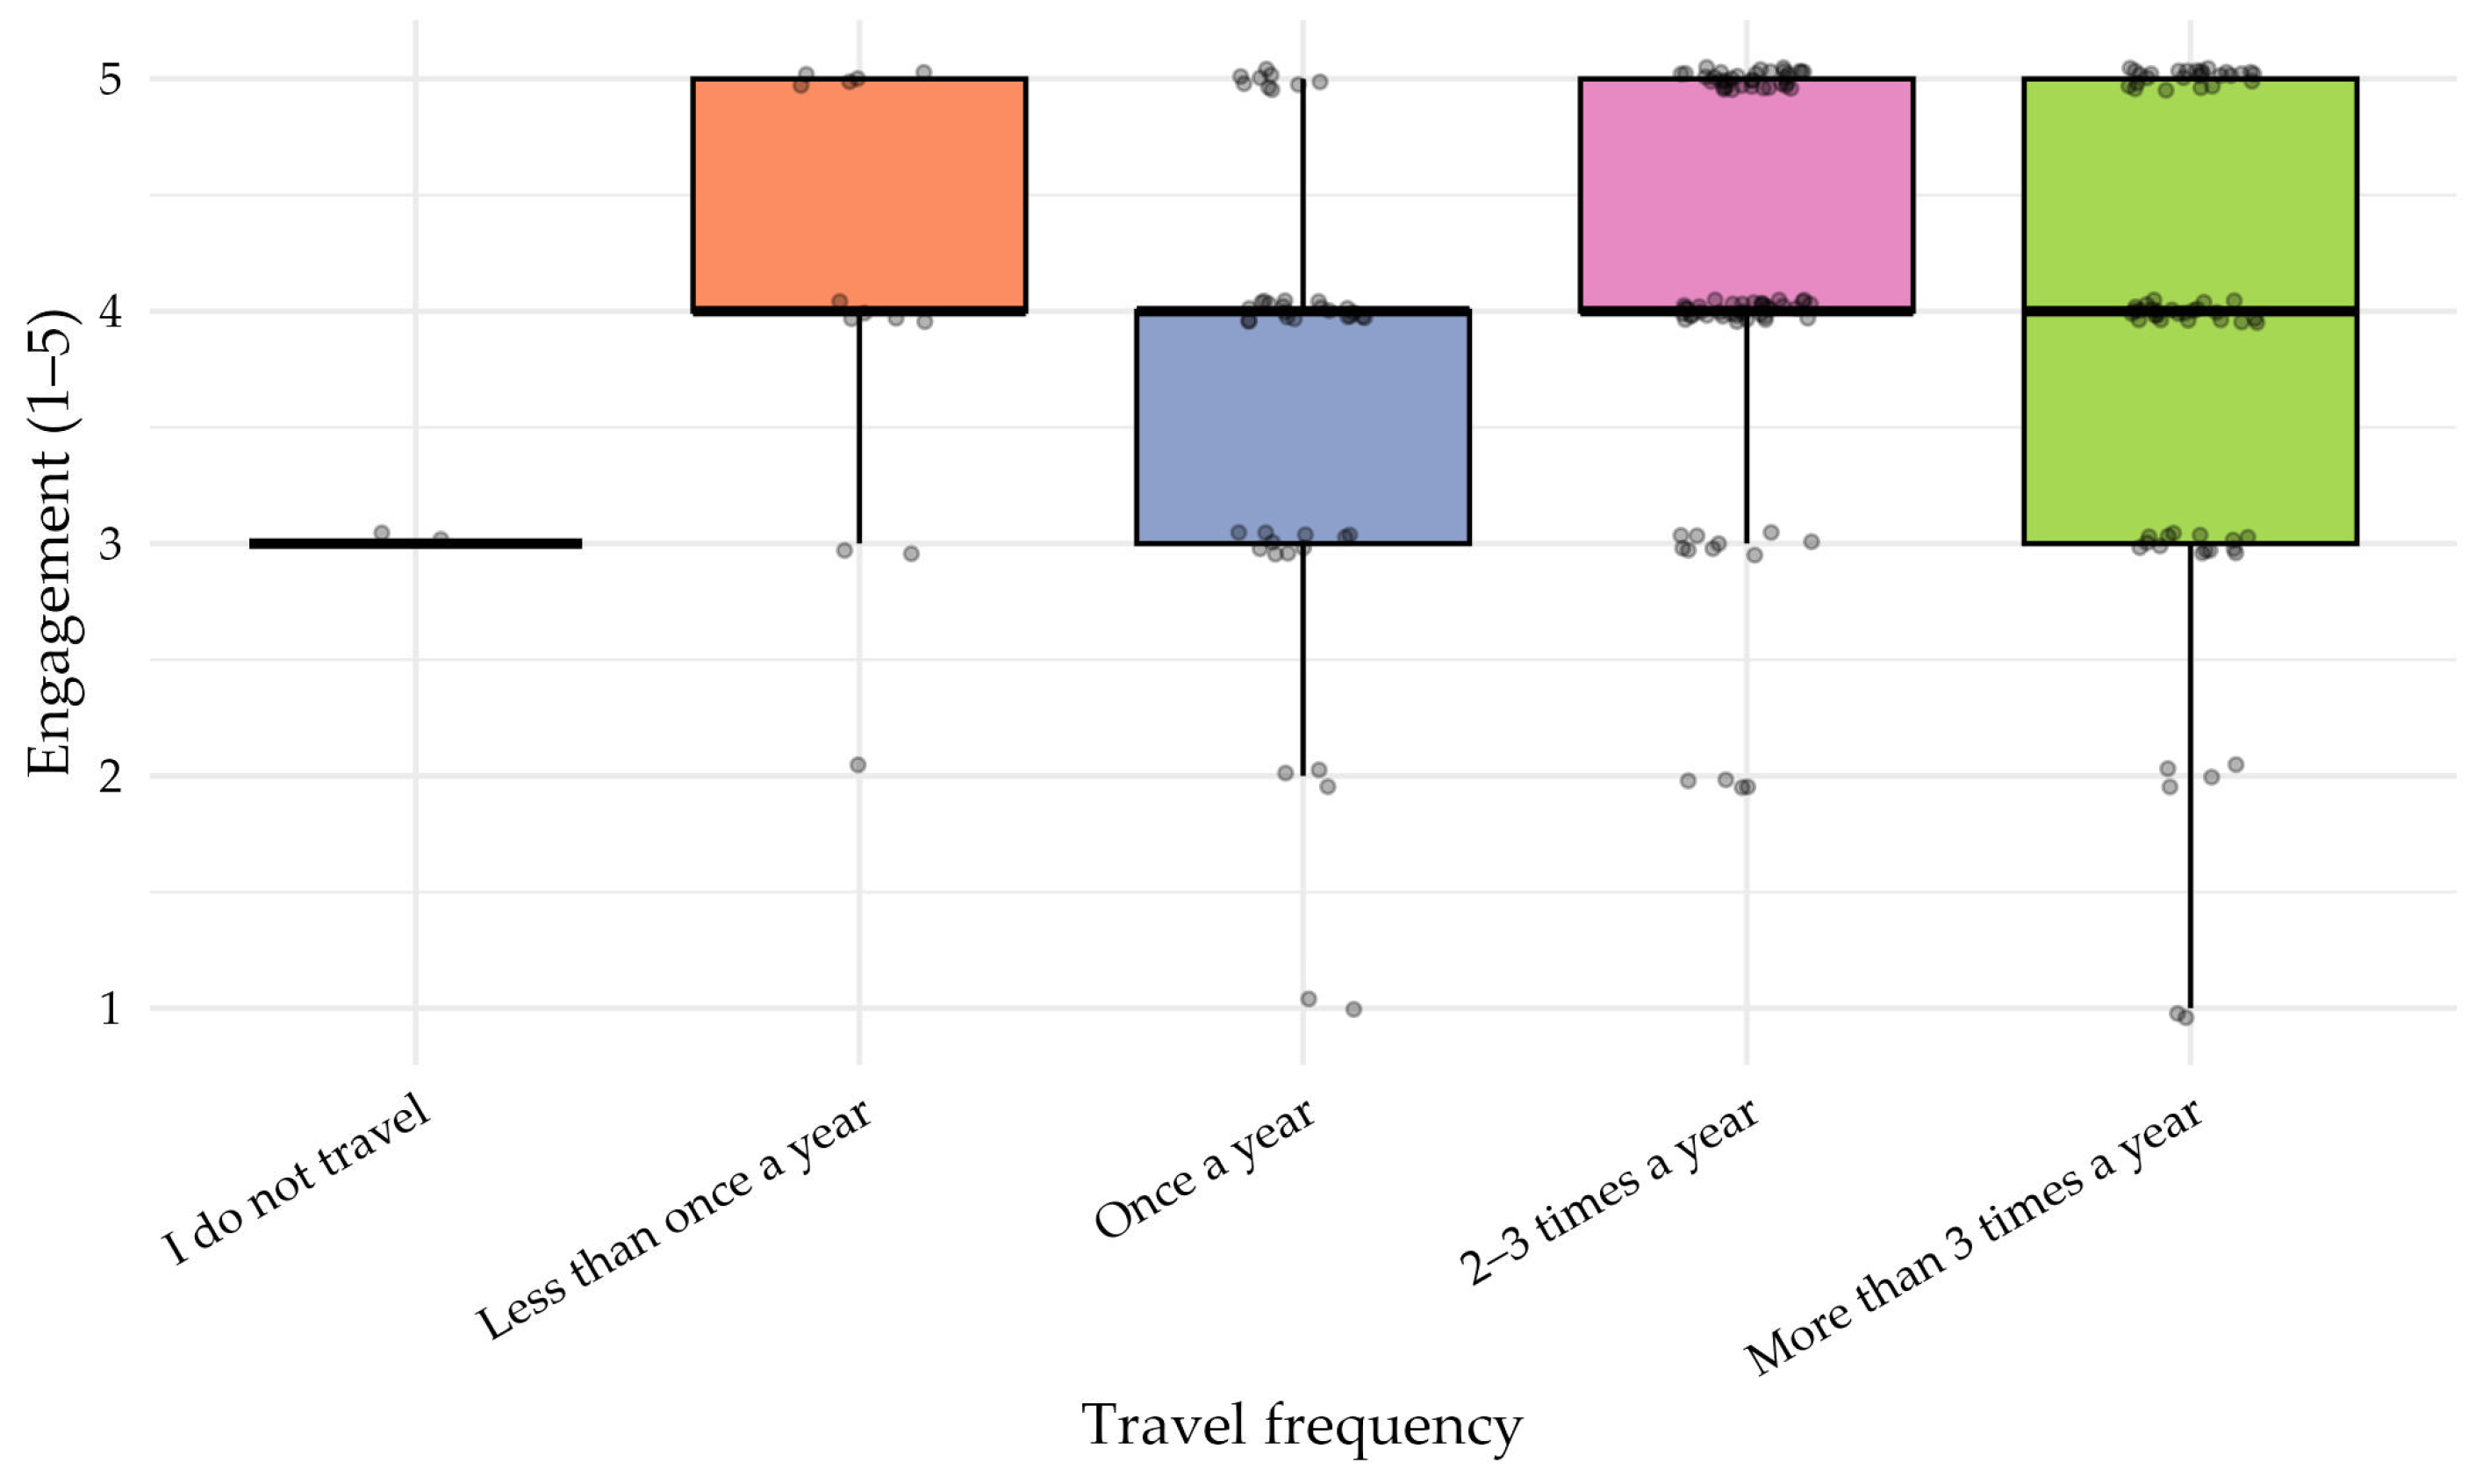
A similarly weak descriptive tendency was visible for engagement (
Figure 10), with somewhat higher scores in the group traveling two to three times per year. However, these apparent differences were not supported by statistically significant post-hoc contrasts after correction.
Taken together, the travel-frequency analyses should be regarded as exploratory and interpreted with caution. Although several omnibus Kruskal–Wallis tests reached nominal significance, the corresponding effect sizes were small, no pairwise comparisons survived Bonferroni correction, and the group sizes were clearly imbalanced, particularly in the lowest frequency category. Therefore, the descriptive patterns visible in
Figure 7,
Figure 8,
Figure 9 and
Figure 10 should not be treated as evidence of reliable between-group differences.
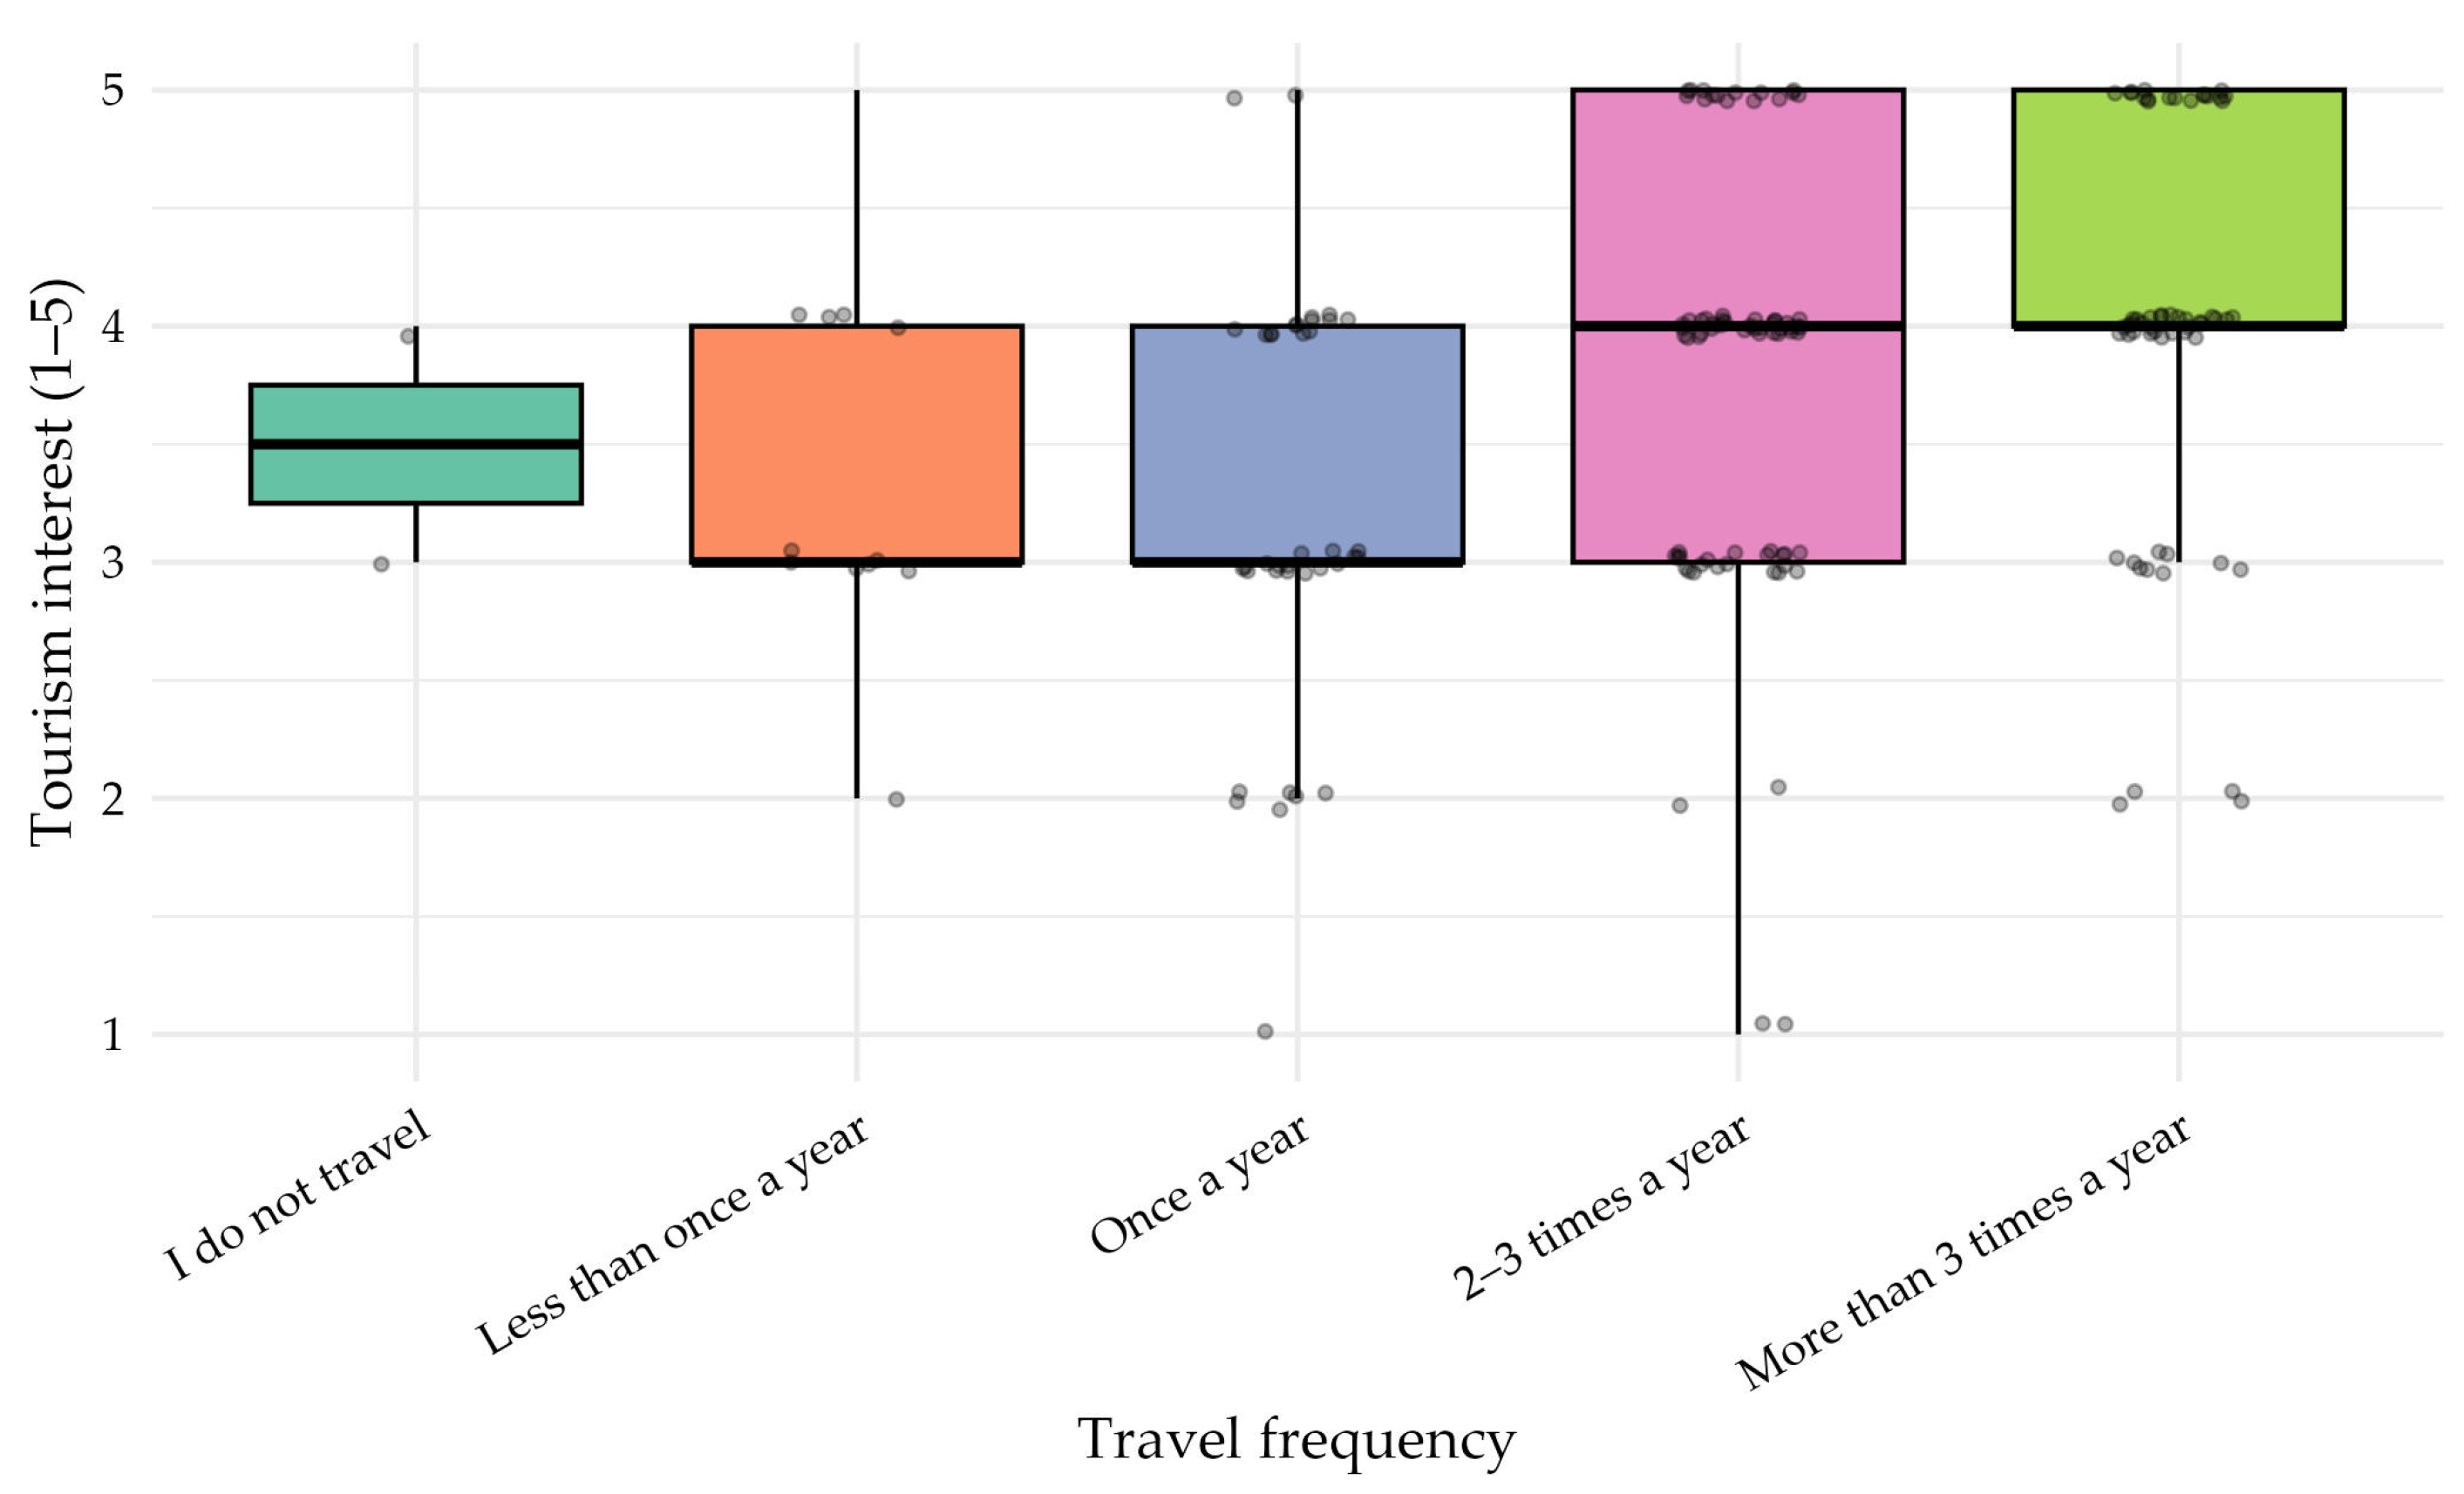
4.3. Relationship Between Tourism Interest and Travel Frequency
Figure 11 illustrates how self-reported tourism interest varied across travel-frequency groups. The descriptive statistics show a clear increasing trend: participants who did not travel reported a mean tourism interest of 3.50 ± 0.71 (
n = 2), those travelling less than once a year scored 3.23 ± 1.01 (
n = 13), and those travelling once a year reported 3.48 ± 1.02 (
n = 44). Tourism interest was higher among more active travelers, with scores of 3.94 ± 0.93 for participants travelling two to three times a year (
n = 85) and 4.17 ± 0.86 for those travelling more than three times a year (
n = 71).
A Kruskal–Wallis test confirmed significant differences across travel-frequency categories, χ2(4) = 20.673, p < 0.001, with a small effect size (η2 = 0.079).
Post-hoc pairwise comparisons using Dunn’s test with Bonferroni correction identified two statistically significant contrasts. Participants travelling more than three times a year reported significantly higher tourism interest than those travelling less than once a year (padj = 0.014, r = 0.22), and significantly higher interest than those travelling once a year (padj = 0.002, r = 0.26). All other comparisons were non-significant after adjustment, although several showed small directional effects consistent with the overall monotonic pattern.
Together, these findings indicate that tourism interest increases systematically with travel frequency, suggesting that participants’ declared interest meaningfully reflects their real-world engagement in travel-related activities.
4.4. Participant Characteristics and Their Relevance to VR Experience
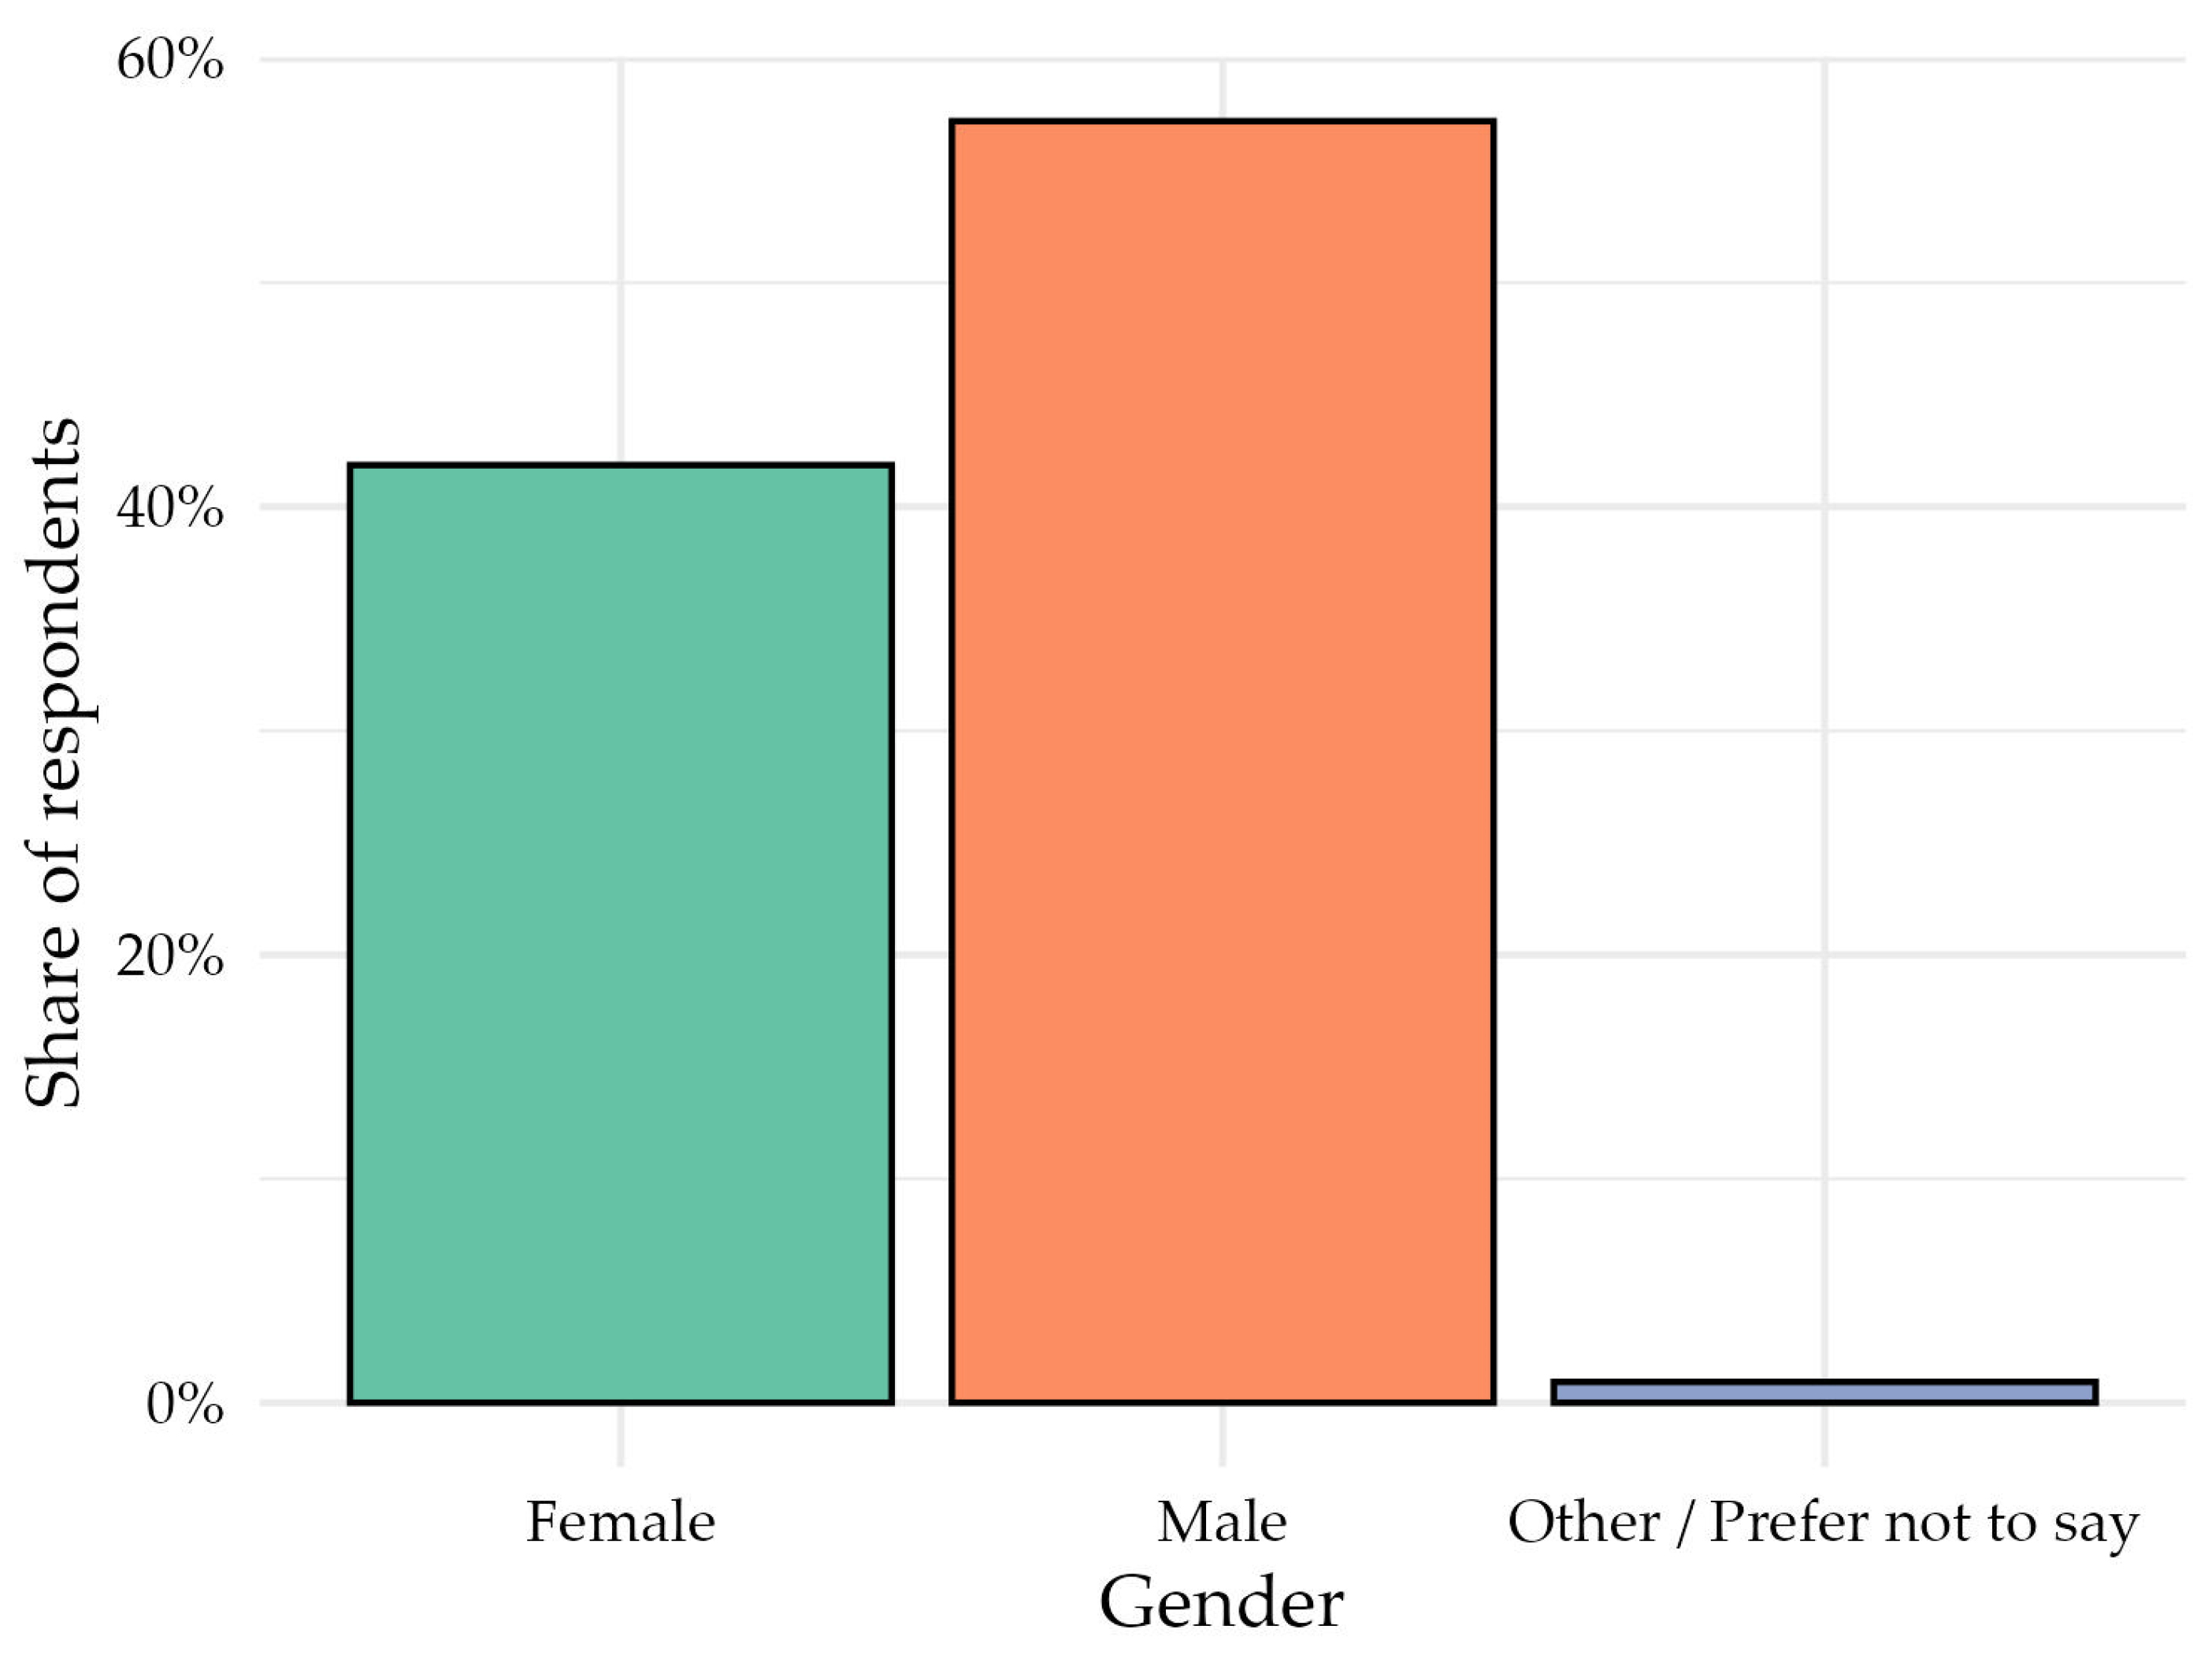
Before examining individual differences in participants’ responses to the VR experience, the sample composition in terms of gender, personality type, self-described traveler type and prior exposure to VR were examined. These descriptive characteristics are illustrated in the following figures (
Figure 12,
Figure 13,
Figure 14 and
Figure 15) to contextualize the variance present in the dataset.
Figure 12 illustrates the gender composition of the sample. Most participants identified as male (57.2%), followed by female respondents (41.9%), with a very small share selecting “other/prefer not to say” (0.9%).
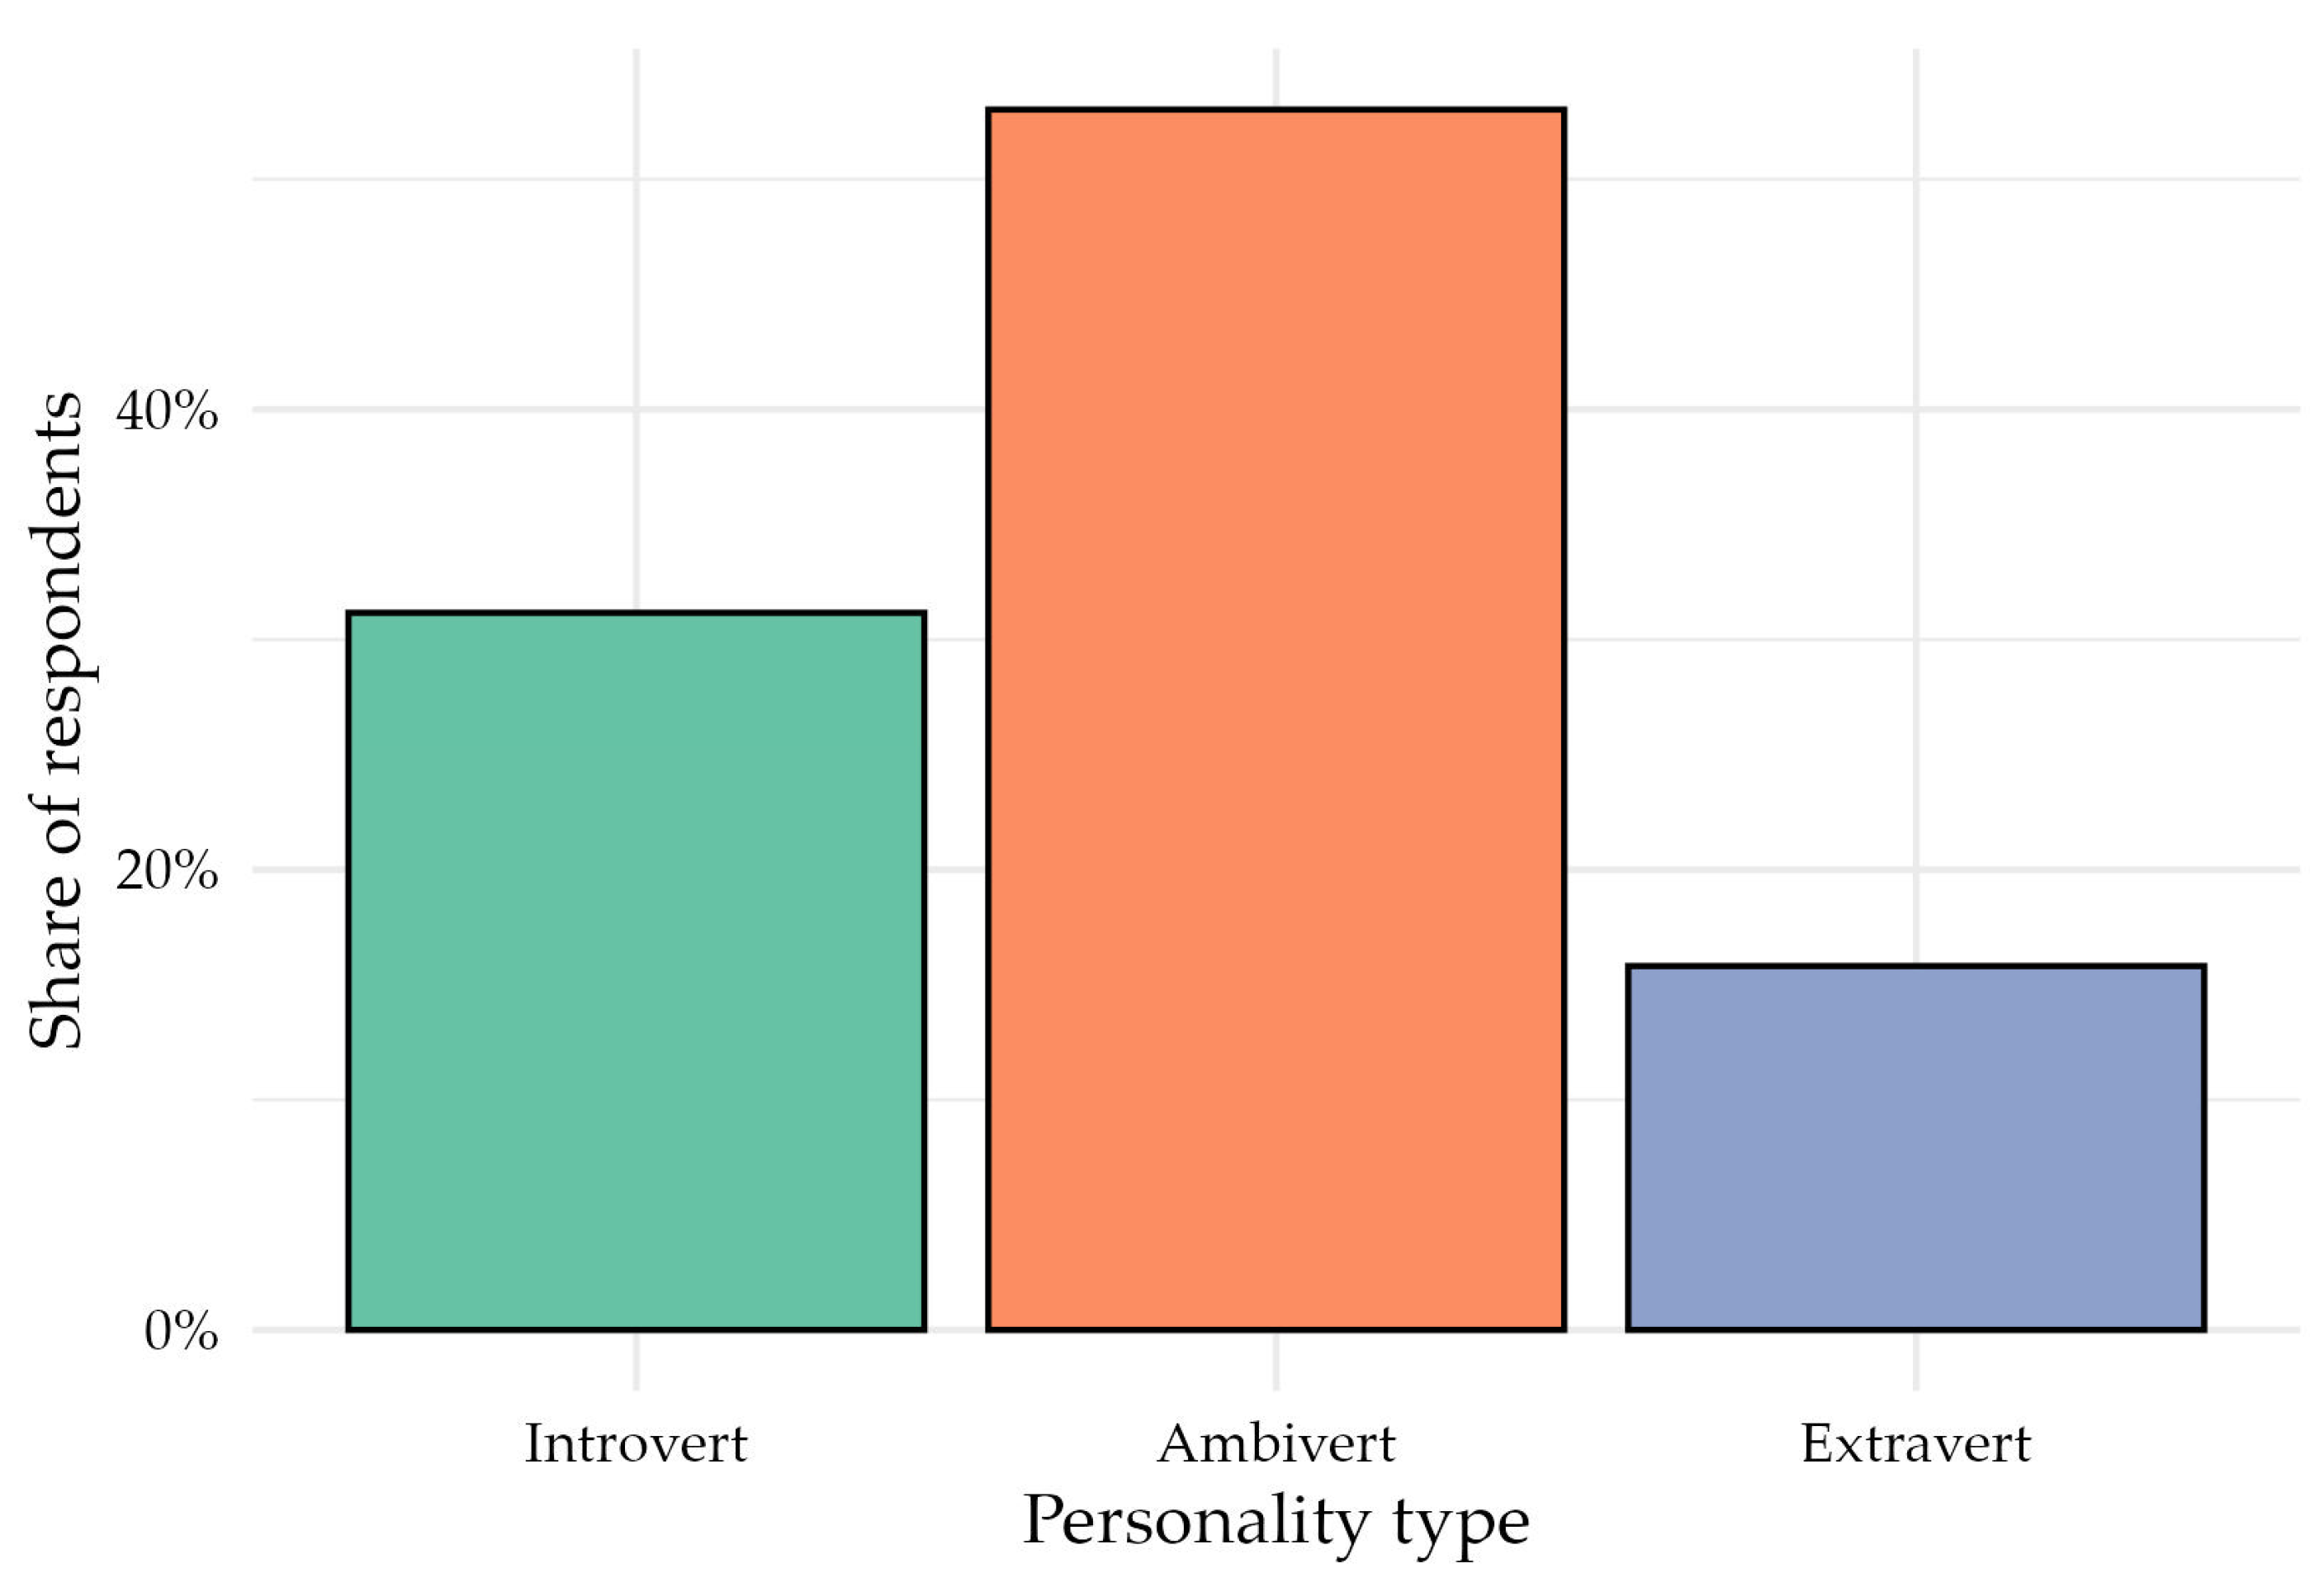
Personality traits were measured using a single-item self-assessment. As shown in
Figure 13, the largest subgroup were ambiverts (53.0%), followed by introverts (31.2%) and extraverts (15.8%).
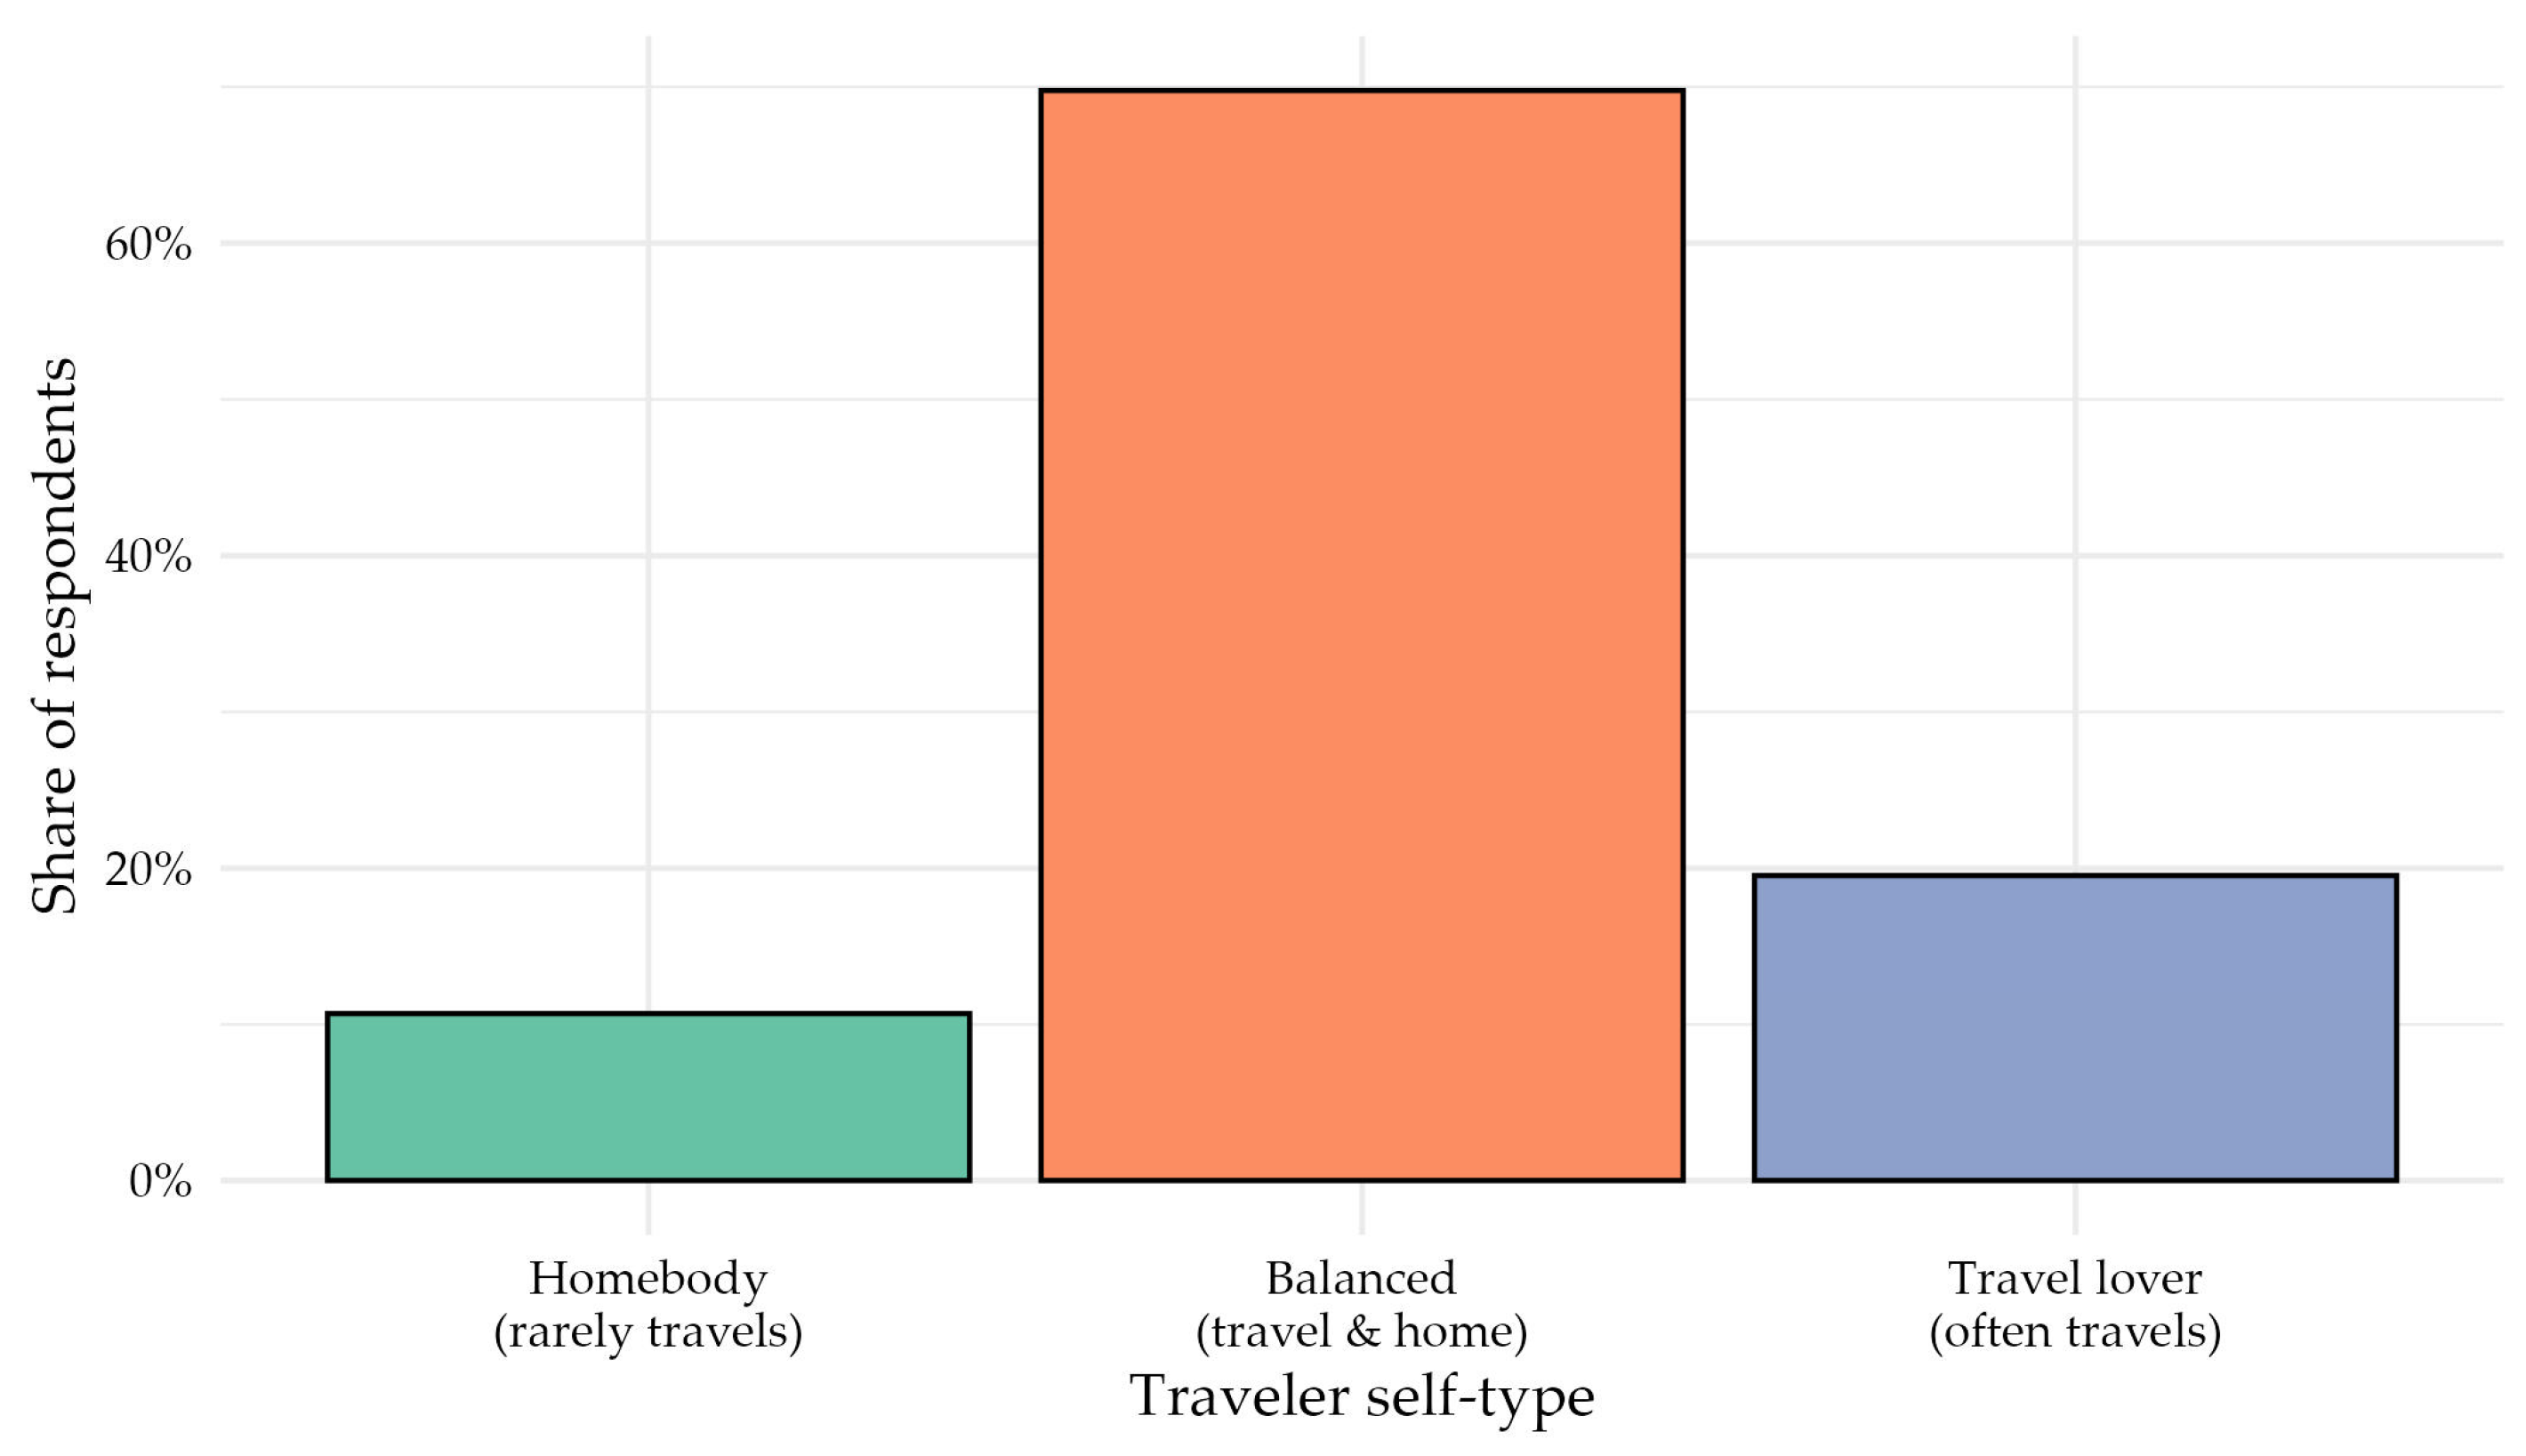
Participants also indicated the extent to which travel is part of their lifestyle. As shown in
Figure 14, the majority described themselves as enjoying travel while also valuing time at home (69.8%). Nearly one-fifth (19.5%) reported that they love traveling and do it as often as possible, whereas 10.7% identified as homebodies who rarely feel the need to travel.
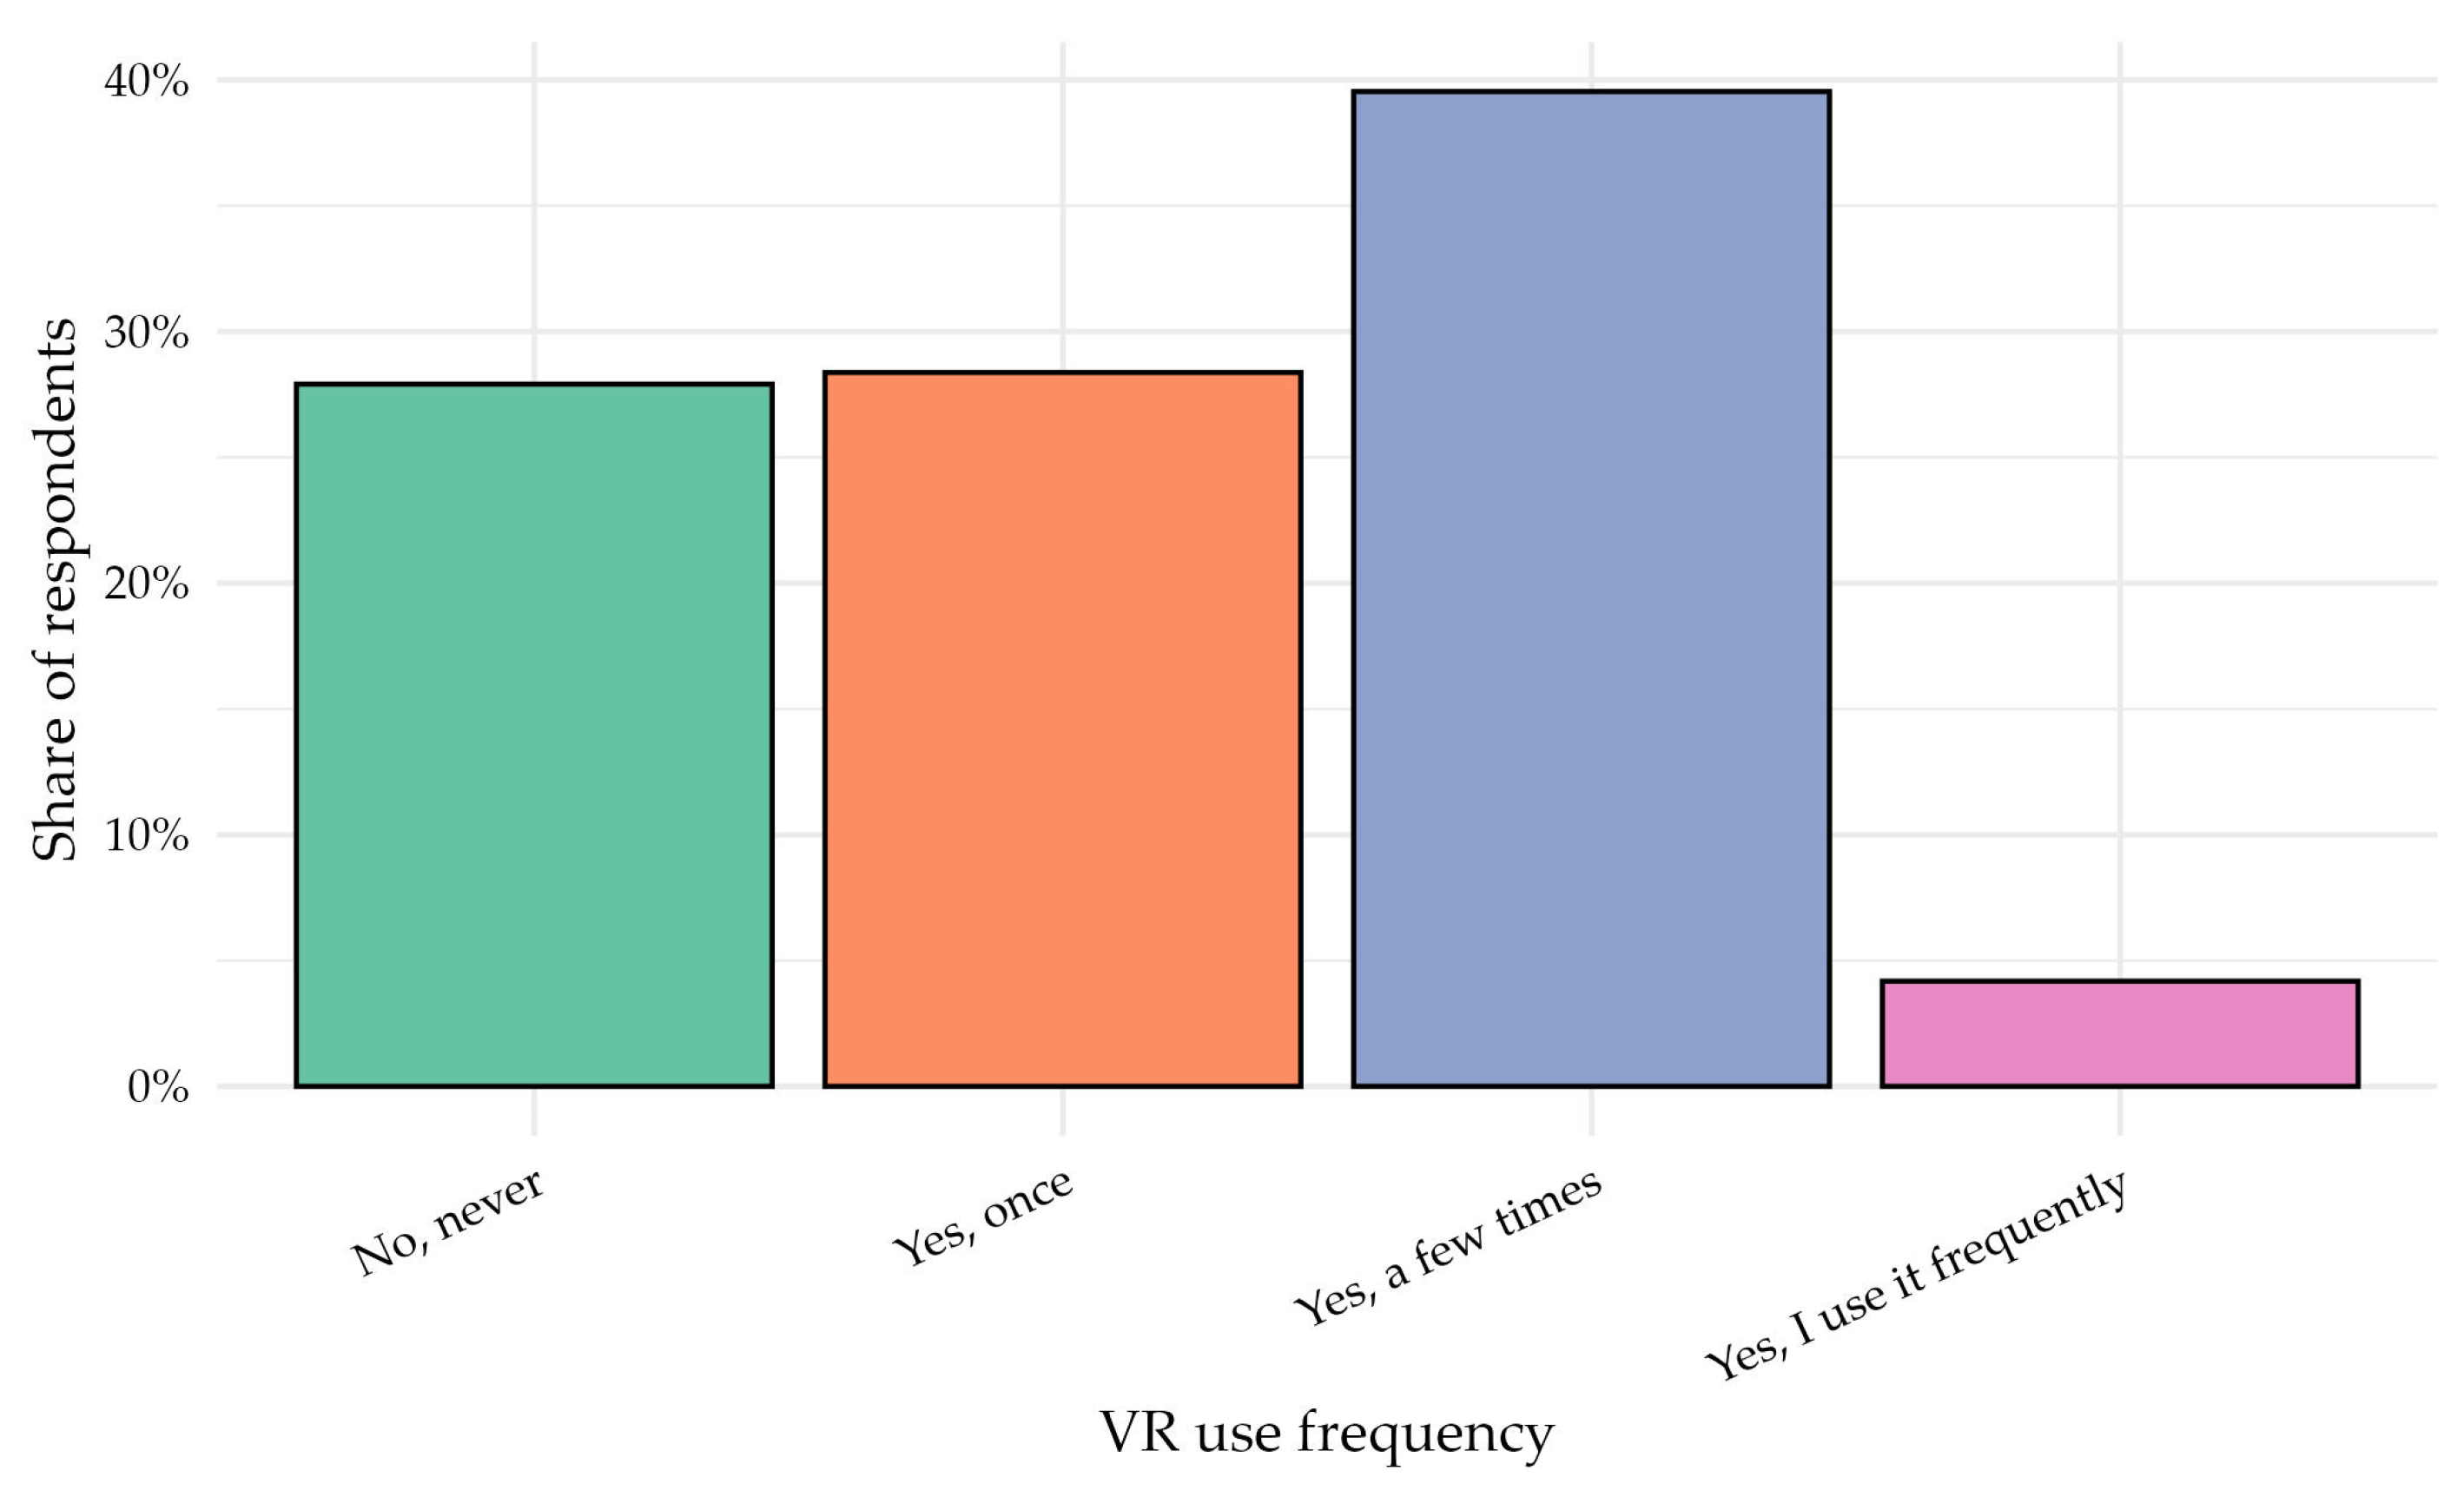
Finally, respondents reported how often they use VR in everyday life. As shown in
Figure 15, about 40% had used VR only a few times, 28% had used it once, 28% reported never using VR, and only 4% identified as frequent VR users.
Despite clear variability in participant backgrounds, none of these characteristics—gender, personality type, traveler self-type, or VR use frequency—showed statistically significant associations with any of the VR experience measures (realism overall, realism factors, emotional response, engagement). Kruskal–Wallis tests were non-significant for every variable across all analyses (all p > 0.14). Effect sizes were uniformly negligible (η2 ≈ 0). No pairwise differences emerged in Dunn post-hoc tests. Additionally, no statistically significant differences were observed between headset types (HTC Vive vs. Meta Quest Pro) for any VR experience measure (all p > 0.20, effect sizes negligible).
These results indicate that individual differences in demographic and self-reported personal traits did not meaningfully shape how participants perceived or emotionally responded to the VR experience. The effects observed in earlier sections (engagement, emotions, realism) were more clearly observed for tourism interest and, to a lesser extent, travel frequency than for the other participant characteristics examined.
4.5. Travel-Related Individual Characteristics and Changes in Destination Evaluation
In this subsection, it was examined whether two travel-related individual characteristics—participants’ general tourism interest and their usual travel frequency—influenced the degree to which the VR experience changed their evaluation of the destination. Two outcomes were analyzed:
Additionally, post-experience satisfaction with both destinations was examined as a secondary outcome.
To facilitate interpretation of the pre–post change scores, baseline distributions for destination evaluation were also examined. For the destination participants wished to visit, baseline willingness was already high: 35.3% of participants selected 4 and 40.5% selected 5, meaning that 75.8% of ratings fell in the upper two categories. For the previously visited destination, the pattern was even more concentrated at the upper end of the scale, with 35.3% selecting 4 and 46.5% selecting 5 (81.9% combined). In both cases, the median baseline rating was 4 (IQR = 1). These distributions indicate that the initial evaluations were already favorable, which should be taken into account when interpreting the magnitude of subsequent change.
A correlation analysis was conducted to examine whether changes in destination evaluations were associated with participants’ perceptions of the VR experience and their individual characteristics (tourism interest, travel frequency). Two change scores were analyzed: change in intention to visit the destination (want.diff) and change in evaluation of previously visited places (was.diff).
Across VR experience variables, only one association remained statistically significant after correction for multiple comparisons. Perceived tracking quality showed a small positive correlation that remained significant after multiple-comparison correction, with increased willingness to visit the destination (ρ = 0.219, p = 0.001; Bonferroni-adjusted p = 0.0135; FDR-adjusted p = 0.0135). This indicates that participants who reported more accurate and stable tracking tended to show larger increases in their intention to visit the destination after the VR session.
A second relationship, the negative correlation between tourism interest and want.diff (ρ = −0.190, p = 0.005), reached significance after FDR correction (p = 0.0288) but not after Bonferroni correction (p = 0.058). This indicates a trend whereby individuals less interested in tourism showed greater positive shifts in their willingness to visit the destination; however, this effect should be interpreted cautiously due to its small magnitude and lack of robustness under stricter correction. All other correlations with want.diff were small (|ρ| ≤ 0.13) and nonsignificant after correction.
In the case of change in evaluation of previously visited places (was.diff), several VR experience components were weakly correlated with changes in evaluations of destinations that participants had previously visited. Small positive correlations were observed as follows: overall realism (ρ = 0.174, p = 0.010), lag/smoothness (ρ = 0.168, p = 0.014), sound quality (ρ = 0.173, p = 0.011).
Although these associations reached conventional significance levels before correction, none of them survived Bonferroni or FDR adjustment (adjusted p-values ≈ 0.05–0.15). Thus, these results may reflect weak tendencies rather than reliable effects.
All remaining correlations between VR variables and was.diff were negligible (|ρ| ≤ 0.12) and nonsignificant after correction.
Overall, the correlation analyses indicate that tracking quality was the only VR-related variable that remained significant in the applied bivariate analyses in relation to change in destination evaluation, specifically with increased willingness to visit the showcased place. This result should be interpreted as an observed association rather than evidence for a specific causal pathway. A secondary pattern emerged whereby lower tourism interest was associated with larger positive change in visit intention, but this effect was small and not stable across correction methods. Changes in the evaluation of previously visited destinations were only weakly related to realism-related VR components, and none of these relationships held after multiple comparison correction. Together, the results indicate that perceived tracking quality was the only VR-related variable that remained significantly associated with increased willingness to visit after correction, whereas other VR quality indicators and individual traits showed only small or inconsistent associations.
Tourism interest was the only variable that showed a statistically significant effect on changes in destination evaluation. A Kruskal–Wallis test indicated group differences for want.diff (χ2 = 9.78, p = 0.044, η2 = 0.028, small effect). No differences were observed for was.diff (p = 0.534).
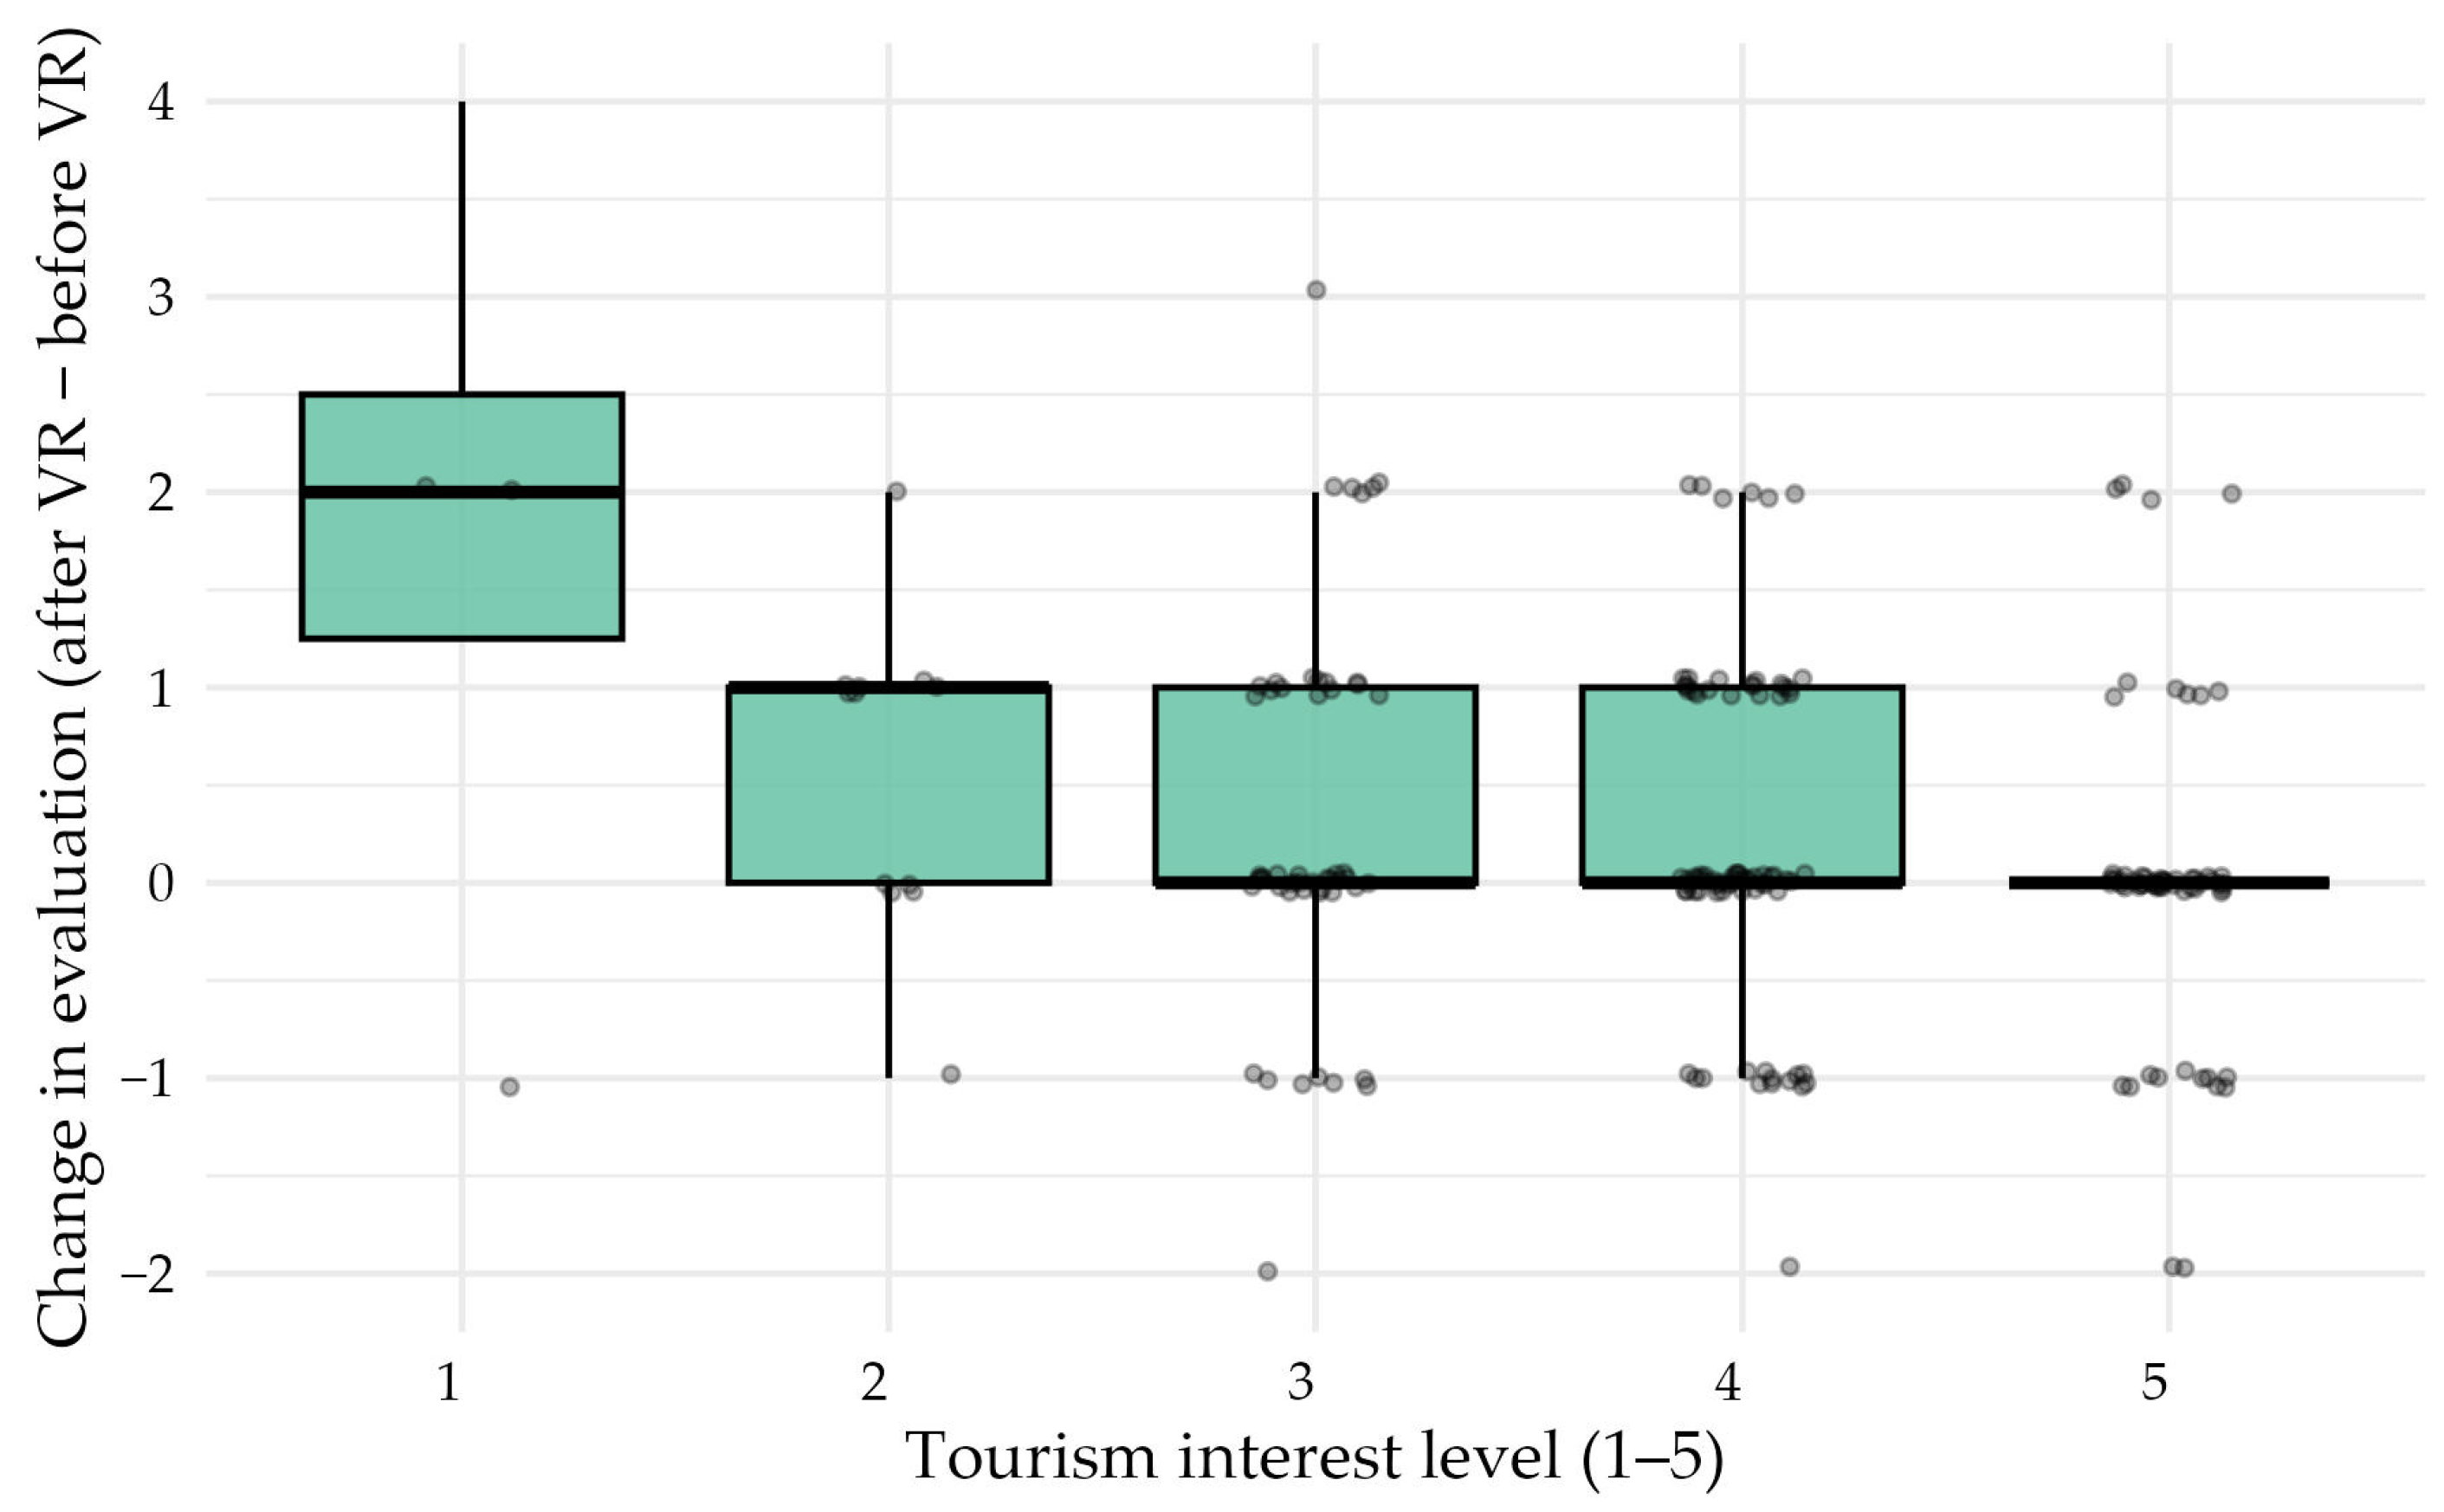
Group means revealed a clear decreasing pattern, consistent with the overall test result: participants with very low interest in tourism reported the largest positive shift in their willingness to visit the destination (M = 1.75, SD = 2.06). Given that the lowest-interest group (tourism interest = 1) contained only four participants (n = 4), this difference should be interpreted with caution due to the low stability of the group mean. Those moderately interested showed small positive changes (M = 0.12–0.39). The most tourism-enthusiastic individuals, already highly motivated, showed no increase or a slight decrease in willingness to visit (M = −0.125, SD = 0.984).
Although no pairwise comparison remained statistically significant after Bonferroni correction (P.adj > 0.20), effect sizes were uniformly small yet consistent (r = 0.071–0.159), suggesting that the largest contrast is between the lowest and highest interest categories.
Descriptively, the largest positive shifts were observed among participants with the lowest tourism-interest scores; however, this pattern should be interpreted cautiously because the effect size was small, the lowest-interest group was very small (
n = 4), and no pairwise comparison remained significant after Bonferroni correction. The distribution of changes across tourism-interest levels is shown in
Figure 16.
Travel frequency did not significantly differentiate changes in either evaluation measure. The Kruskal–Wallis test approached marginal significance for was.diff (p = 0.076), but no effect met the conventional threshold for significance, and the associated effect sizes were small (η2 = 0.011–0.021). This suggests that how often participants typically travel did not show a clear or stable association with the extent to which VR modifies their destination evaluations. Occasional, moderate, and frequent travelers did not differ clearly in the present analyses with respect to changes before and after VR.
As an additional post-experience outcome, satisfaction with the visited destinations in VR was also examined. Median satisfaction was 4 (IQR = 2) for destinations participants would like to visit and 4 (IQR = 1.5) for previously visited destinations. Satisfaction showed consistent positive associations, with key experiential characteristics of VR. For both destination types, higher satisfaction was moderately associated with greater engagement (ρ = 0.534 and 0.543), higher perceived realism (ρ = 0.483 and 0.508), more positive emotions (ρ = 0.434 and 0.440), and, to a lesser extent, more accurate tracking (ρ = 0.314 and 0.254). Satisfaction was also positively related to post-VR destination evaluation and to change scores. For the destinations participants wished to visit, satisfaction correlated with post-VR evaluation at ρ = 0.431, p < 0.001, and with change in evaluation at ρ = 0.306, p < 0.001. For previously visited destinations, the corresponding correlations were ρ = 0.540, p < 0.001, and ρ = 0.297, p < 0.001, respectively. This indicates that higher post-experience satisfaction was associated with more favorable destination appraisals after the VR session.
Among the travel-related predictors analyzed, only tourism interest showed a small omnibus association with how VR influenced destination evaluation, and even this effect was small. The pattern indicates that VR has the largest descriptive shifts on individuals with low initial interest in tourism, while frequent or highly enthusiastic travelers exhibit little change.
Within the set of travel-related predictors examined, only tourism interest showed a small association with changes in destination evaluation. Further research is needed to clarify the relative contribution of VR experience characteristics.
5. Discussion
The present study examined how individual travel-related characteristics and specific features of a virtual reality sightseeing experience relate to user experience and changes in destination evaluation. By combining pre–post assessments of destination attractiveness with detailed measures of VR experience quality, the study provides a nuanced view of when and for whom VR may influence travel-related perceptions and intentions, which is relevant for understanding the potential role of VR in the context of sustainable tourism. In contrast to most prior work, which has focused either on conceptual models [
42,
43,
44,
56,
67,
69,
70], or on declared pro-environmental attitudes [
45,
46,
57,
58,
59,
60], or on VR for marketing of destinations [
54,
55], our study uses a pre–post design with actual VR users and objective change scores in destination evaluation.
The results consistently indicate that tourism interest is associated with variation in how users experienced the VR tourism content. Participants with higher interest in travel reported stronger emotional responses and higher engagement during the VR experience, while perceived realism showed a weaker but directionally consistent association. Importantly, the observed effects were small in magnitude, indicating that tourism interest does not fundamentally alter the VR experience but rather slightly amplifies emotional and engagement-related responses. Participants with moderate or neutral interest in tourism appeared less emotionally responsive, whereas both highly interested individuals and, to some extent, those with very low interests showed stronger affective reactions. This non-linear pattern suggests that VR may elicit emotional engagement both among enthusiasts and among users for whom tourism is not a salient domain, albeit potentially for different reasons. This is consistent with previous research showing that immersion, presence, and emotional engagement are key factors shaping user responses to virtual tourism experiences [
93,
94].
In contrast to tourism interest, travel frequency showed no robust associations with VR experience quality. Although several Kruskal–Wallis tests suggested overall differences across frequency groups, none of these effects were confirmed in post-hoc comparisons after correction for multiple testing. Correlation analyses further indicated the absence of monotonic relationships between travel frequency and VR experience variables. In other words, these results suggest that how often individuals travel does not meaningfully shape their subjective experience of VR tourism content. This finding implies that familiarity with travel itself may be less relevant than motivational or attitudinal factors when it comes to immersive digital experiences. The weak and inconsistent trends observed across travel-frequency groups should therefore be interpreted as exploratory rather than as evidence of systematic differences.
One contribution of this study lies in identifying which aspects of the VR experience are associated with changes in destination evaluation. Across a broad set of VR quality indicators, tracking accuracy emerged as the only VR-related variable that remained significant across the applied bivariate analyses to increased intention to visit a destination. Participants who perceived the tracking as more accurate and stable tended to show larger positive shifts in their willingness to visit the showcased place after the VR session. Across the analyzed VR quality indicators, perceived tracking quality was the only variable that remained significantly associated with increased willingness to visit after correction for multiple comparisons, a finding that should be interpreted cautiously. Because the study did not include direct measures of presence, cybersickness, discomfort, or other potential mediating processes, the present data do not allow a causal or mechanistic interpretation of this association. At most, the result indicates that participants who rated tracking more favorably also tended to report larger positive changes in willingness to visit. Other VR attributes, such as overall realism, sound quality, or smoothness, showed only weak or inconsistent associations with changes in evaluation.
While tracking quality was the only VR attribute robustly associated with change in willingness to visit, satisfaction with the visited destinations was more broadly related to experiential qualities such as engagement, realism, and emotions, suggesting that change in travel intention and post-experience satisfaction capture partly different aspects of the VR tourism experience.
The observed increase in willingness to visit among individuals with initially low tourism interest may indicate that, in some cases, VR exposure can coincide with short-term increases in willingness to visit, rather than functioning solely as a substitute experience. From a sustainability perspective, this finding is ambivalent. On the one hand, VR can provide access to destinations without physical travel (although the use of VR technology itself is also associated with certain environmental costs); on the other hand, it may increase future visitation intentions, potentially reinforcing rather than reducing tourism flows. Therefore, VR tourism should not be uncritically framed as inherently sustainable, but rather as a tool whose sustainability implications depend on how it is implemented and how it influences actual travel behavior. Because the present study focuses on short-term changes in willingness to visit following a VR experience, it cannot determine whether VR primarily substitutes physical travel or functions as a promotional tool that stimulates additional demand. In practice, the sustainability implications of VR tourism are therefore likely to depend on the context of use. VR may support sustainability when it replaces certain trips, reduces exploratory travel, or increases accessibility to destinations without requiring physical presence, although these potential benefits should be considered together with the environmental costs of producing and operating VR technologies. Conversely, when used mainly as a marketing tool encouraging visitation, it may also contribute to increased tourism flows. Similar dual effects of virtual tourism have been discussed in previous studies [
93,
95], which indicate that VR may function both as a substitute for travel and as a promotional tool stimulating visitation depending on the context of use.
It should also be noted that VR technologies themselves are not environmentally neutral. Like every production, VR hardware production, energy consumption during use, and the digital infrastructure required to deliver content all generate some environmental impact. In addition, access to VR technologies is connected to many issues, such as affordability and digital inclusion. These factors should be considered when evaluating the broader sustainability implications of VR tourism. The matter of sustainability is complicated and depends on many factors. However, VR may represent a promising tool for supporting more sustainable forms of tourism experience when used in appropriate contexts. In the literature, it was also noted that information technologies involve energy consumption and infrastructure costs, and the topic of greenhouse gas footprint is also highlighted [
96,
97]—issues that should be considered when evaluating their environmental impact.
Beyond tourism interest, demographic and dispositional characteristics—including gender, personality traits, self-described traveler type, prior VR use, and headset type—did not show clear associations with VR experience outcomes in the present sample. This suggests that, within the controlled laboratory setting of this study, VR tourism experiences did not differ markedly across the user groups examined. Changes in destination evaluation were generally heterogeneous and centered close to zero at the group level, indicating that VR does not uniformly increase or decrease destination attractiveness. Instead, VR appears to exert its largest descriptive change on individuals with low initial tourism interest, for whom the experience may introduce novelty or reduce psychological distance to the destination. In contrast, participants already highly interested in tourism showed little additional increase of this measure. The smaller observed increases among participants with high tourism interest should also be interpreted in light of baseline distributions. In this subgroup, pre-VR willingness to visit was already high, with a median baseline score of 5, suggesting limited room for further increase. Thus, the pattern may reflect not only differential responsiveness to VR, but also a ceiling-related constraint inherent in the starting-point distribution.
From a practical perspective, the findings suggest that VR tourism applications may be more useful for engaging individuals who are not strongly motivated to travel. Ensuring high technical quality, including accurate tracking, may be relevant in this context, although the present study does not identify the mechanism underlying this association. For users who are already highly travel-oriented, VR may serve more as an experiential complement than as a persuasive intervention. From a research perspective, the small effect sizes observed across analyses underscore the importance of avoiding overgeneralization when evaluating the impact of VR on travel-related attitudes. Future studies could benefit from longitudinal designs, repeated VR exposures, or comparisons between different types of destinations to better understand how and when VR translates into sustained behavioral change.
From the perspective of sustainable tourism, this result may be interpreted in two ways. On the one hand, VR experiences could reduce the need for physical travel by providing alternative forms of destination exploration, though such substitution does not mean that VR is environmentally neutral, as the technology itself requires energy, hardware, and digital infrastructure. On the other hand, the observed increase in willingness to visit among some participants suggests that VR may also function as a stimulus encouraging future travel. Therefore, the sustainability impact of VR tourism cannot be assumed but depends on whether virtual experiences substitute, complement, or stimulate physical trips. Similar concerns are raised in sustainable tourism research, where digital technologies are described as potentially reducing environmental pressure but also as capable of increasing travel demand through enhanced destination attractiveness [
45]. Our findings are relevant for sustainable tourism research because they show that the environmental implications of virtual tourism depend not only on the availability of the technology itself, but also on user characteristics and on the quality of the VR experience. Since willingness to visit a destination may either increase or remain unchanged after VR exposure, the role of virtual tourism in reducing environmental pressure cannot be assumed and must be evaluated in relation to actual behavioral responses. Understanding these mechanisms is essential when considering VR as a potential tool supporting more sustainable forms of tourism.
6. Conclusions
This study investigated the relationships between individual characteristics, VR experience quality, and changes in destination evaluation in the context of virtual tourism. The results indicate that tourism interest was associated with emotional and engagement-related responses to VR, while travel frequency and most demographic or dispositional variables play a limited role. Among VR experience features, tracking was the only VR-related variable that remained significantly associated with increased intention to visit a destination after correction in the applied bivariate analyses. This finding should be interpreted as an observed association rather than as evidence of a specific mechanism or of the general motivational effectiveness of technical performance. Changes in destination evaluation were generally small and heterogeneous, suggesting that VR does not exert uniform effects but may be particularly influential for individuals with low initial interest in travel. Overall, the findings suggest that VR tourism should be viewed as a targeted rather than universally persuasive tool, with its effectiveness depending on both user motivation and experience quality. Future research should further explore the conditions under which VR can meaningfully influence travel intentions and decisions, as well as its long-term impact on actual tourist behavior.
From a sustainability perspective, the obtained results indicate that virtual tourism should not be treated as a universal substitute for traditional travel, but rather as a complementary tool that can reduce environmental pressures in a selective manner, depending on the user’s profile. VR may have particular relevance for individuals with low initial interest in travel, for whom virtual experiences can provide an alternative form of contact with cultural and natural heritage without generating the environmental costs associated with transportation and excessive tourism. This article contributes empirical evidence suggesting that the effectiveness of VR as a tool supporting more sustainable forms of tourism experience depends on the quality of the technological experience and individual user circumstances, rather than on the availability of the technology itself. At the same time, the present results do not allow us to determine whether VR experiences substitute for physical travel or rather stimulate future visitation, which is a key issue from the perspective of sustainable tourism. An increase in willingness to visit observed in some participants suggests that VR may function not only as an alternative to travel but also as a motivational stimulus encouraging real trips. Therefore, the sustainability impact of virtual tourism should be interpreted as conditional and context dependent. VR may support sustainability when it replaces selected journeys, reduces exploratory travel, or provides access to destinations without physical presence, but it may also increase tourism demand when used primarily as a promotional or persuasive tool.
The study has several methodological limitations that should be acknowledged. Although participants received basic instructions on how to use VR before the session, factors such as the novelty of the technology and differences in familiarity with its operation may still have influenced their ratings of engagement and emotional response. In addition, participants were free to choose which location they visited first in VR (a place previously visited in real life or one never visited before), so an order effect cannot be ruled out. It is possible that the sequence of exposure influenced the evaluation of the destinations, and this issue should be examined more directly in future studies.
A further limitation concerns the measurement strategy. The study did not include direct measures of presence, cybersickness, or discomfort. Although participants were instructed to interrupt the session if they experienced any discomfort, no formal sickness or presence scale was administered. Consequently, the study allows us to report an association between perceived tracking quality and changes in willingness to visit, but it does not permit conclusions about the psychological mechanism underlying this relationship. In addition, several key constructs—tourism interest, engagement, realism, intuitiveness, and emotional response—were assessed with single-item measures. While such items can be acceptable for concrete experiential judgments and helped keep the pre- and post-VR questionnaires short, they do not allow for internal consistency assessment and reduce comparability with studies using validated multi-item instruments. Future research should therefore employ fuller measurement scales wherever feasible.
Limitations also arise from the operationalization of the travel-related variables and from the analytical approach. Tourism interest was measured as a self-reported attitudinal disposition rather than as an objective behavioral indicator, while the travel-frequency variable was highly unbalanced, with very few participants declaring that they do not travel at all. This weakens the robustness of multi-group comparisons and may partly explain why omnibus tests reached significance whereas individual post-hoc contrasts—especially those involving very small groups—did not remain significant after correction. More broadly, the analyses relied primarily on multiple bivariate rank-based tests rather than on a smaller set of multivariable ordinal or rank-based regression models. Although multiple-comparison corrections and effect sizes were reported, this strategy increases conceptual redundancy between tests and makes it difficult to assess the unique contribution of correlated predictors, such as individual VR quality attributes. Future studies should specify a limited set of primary outcomes and predictors and use multivariable models to examine whether specific VR quality components, such as tracking accuracy, predict intention change over and above baseline willingness, tourism interest, and broader perceived VR quality.
Finally, changes in destination evaluation were analyzed mainly by means of raw difference scores. Although this provides a simple summary of pre–post change, it does not explicitly adjust for baseline evaluation levels and is therefore less informative with respect to possible ceiling effects. In our sample, baseline destination ratings were already concentrated toward the upper end of the scale, which may have limited the scope for further increases after the VR session. Future work should therefore complement change-score analyses with baseline-adjusted models in which post-VR evaluations are examined while controlling for pre-VR ratings and other relevant predictors.