1. Introduction
Infrastructure drainage projects are considered a foundational element of any type of urban development since such schemes are crucial in shaping the social, environmental, and economic landscapes of a country [
1]. Effective drainage schemes facilitate the better management of water resources and the mitigation of environmental risks while protecting public health. However, these projects are not only engineering accomplishments but also complex endeavors and must be formulated with an eye to far-reaching sustainability considerations to ensure their long-term viability and their contribution to a sustainable society [
2]. Considering the rapidly changing climate, along with the growing extent of urban areas and the increasing demand for infrastructure drainage development, achieving sustainability will be the biggest challenge in the forthcoming years. The rapid urbanization of nations is likely to have especially crucial implications for the unprecedented expansion of the practice of infrastructure drainage development.
Further, there is a need for large-scale infrastructure projects to be compliant with sustainability standards. Drainage infrastructure components such as pipeline networks, pumping/lifting stations, treatment facilities, and all other related systems must be designed, constructed, and operated with a focus on sustainability [
3]. Nonetheless, there is a lack of standardized methodologies for assessing the sustainability performance of infrastructure drainage projects. The gap between literature and practice has led to a subjective assessment of sustainability, which, in turn, limits the ability of decision-makers to comprehend sustainability implications and work around them accordingly [
4].
In order to address this challenge, this study proposes a structured methodology to evaluate and assess the sustainability performance of infrastructure drainage projects using a sustainability index. This research adds to the current knowledge base by introducing a risk-based sustainability index specifically designed for infrastructure drainage initiatives. In contrast to current sustainability assessment tools that typically depend on broad indicators or fixed evaluation techniques, the suggested framework combines fuzzy set theory with multi-criteria decision analysis to directly tackle uncertainty and subjectivity in expert assessments. The model allows decision-makers to methodically assess sustainability performance while factoring in risk elements related to environmental, social, and economic dimensions of infrastructure drainage systems. Fuzzy set theory is incorporated to account for the uncertainties and subjectivity of judgments made by experts during the process of identifying and choosing relevant sustainability indicators. This approach enhances the reliability and relevance of the proposed index.
For this study, the risk is being incorporated into sustainability assessment through indicators related to resilience, operational continuity, environmental protection, public safety, and economic adaptability. In this manner, the proposed framework does not deal with sustainability as a static concept but as a performance measure influenced by uncertainty, disruptions, and long-term infrastructure risks.
Overall, this research illustrates the feasibility of the framework and the developed sustainability index by applying it to a real-world, long-term infrastructure drainage operation and maintenance project. The project involves the management of infrastructure drainage components such as pipeline gravity networks, pumping stations and stormwater systems. The selection of this case study was based on the accessibility of the data and the established connections the research team had with the project team. This case study is used to demonstrate how the sustainability index can be applied to real-world projects, offering insight into sustainability performance in this area.
2. Literature Review
The initial phase of this research comprised a systematic review of the existing relevant academic literature concerning sustainability assessment in infrastructure drainage projects, with the aim of establishing a basis for understanding the state-of-the-art in the sustainability assessment of infrastructure drainage projects [
5]. Various types of literature were reviewed in this process, including peer-reviewed academic articles, industry standards, and governmental guidelines. The literature indicated a significant gap in the way sustainability is being assessed in the context of drainage systems, despite the increasing attention to sustainability in infrastructure projects. Existing evaluation indices and tools such as general sustainability systems usually lack specificity when being applied to drainage projects. Key elements in the social, environmental, and economic fields are not fully covered and not specific to drainage infrastructure projects. Furthermore, there is no standardized set of criteria, or an index widely accepted that is tailored to assess the sustainability of drainage projects.
Although the quantity of sustainability assessment frameworks in infrastructure studies is increasing, many current models do not provide the necessary specificity for drainage infrastructure systems. Many conventional sustainability indices are tailored for generic infrastructure or construction projects and thus fail to effectively address operational risks, environmental uncertainties, and priorities driven by stakeholders in relation to drainage systems. Moreover, several evaluation methods depend on deterministic decision-making techniques that overlook uncertainty in expert assessments. These constraints emphasize the necessity for a well-organized and risk-aware sustainability evaluation framework tailored for drainage infrastructure initiatives.
However, throughout the process of reviewing previous studies, a special focus was given to recent projects that addressed sustainability issues through innovative design, implementation, and monitoring techniques such as sustainable drainage systems and similar initiatives. The considerable importance of these techniques in the context of urban development planning has gained recognition due to their potential to mitigate flood risks and improve environmental and social outcomes [
6].
Aside from reviewing theoretical discussions on sustainability, the review included reports of finished and ongoing infrastructure drainage projects, allowing for the examination of real-world applications of sustainability considerations. These project reports were particularly useful in discussing the challenges and successes associated with sustainability objectives in infrastructure drainage projects, such as increasing urban resilience and reducing environmental impacts. This approach ensures that the research captures both the theoretical foundations and the practical outcomes of sustainability assessments, leading to a more comprehensive understanding of best practices in this field.
A key outcome of the literature review was the identification and collection of sustainability indicators that have been applied in previous infrastructure projects. These indicators cover a variety of disciplines, such as engineering, environmental science and urban planning. The subsequent phase involved classifying and categorizing the indicators into a coherent framework so that they can be applied in future infrastructure projects. The indicators basically cover the three dimensions of sustainability, namely, the social, environmental, and economic dimensions, which are widely accepted as the pillars of sustainable development. The social indicators mostly address community engagement, public health and equity considerations. The environmental indicators involve ecological impact and minimizing adverse effects on nature. The economic indicators typically refer to cost-effectiveness, lifecycle costs and contribution to the local economy [
7].
Various multi-criteria decision-analysis methods like the Analytic Hierarchy Process (AHP) and Technique for Order Preference by Similarity (TOPSIS) to Ideal Solution have been extensively applied to evaluate sustainability in infrastructure projects. Nonetheless, these methods generally necessitate accurate numerical data and presume fixed decision contexts. In comparison, the framework suggested in this research utilizes fuzzy set theory to model uncertainty and ambiguity in expert evaluations. The proposed model offers a more adaptable and realistic assessment of sustainability performance in drainage infrastructure projects by combining fuzzy decision-making principles with multi-criteria decision-analysis weighting methods.
The proposed framework provides three key benefits compared to traditional methods. It incorporates risk factors directly into the assessment of sustainability. Second, it incorporates ambiguity in expert evaluations using fuzzy set theory. Lastly, it generates a clear and organized sustainability index that can be adjusted for various project settings and decision-making situations.
Although prior studies have made important contributions to sustainability assessment in infrastructure systems, their applicability to infrastructure drainage projects remains limited. Early work on urban infrastructure sustainability established broad sustainability criteria for infrastructure systems, but these criteria were primarily conceptual and were not tailored to the technical and operational characteristics of drainage assets such as pipeline networks, pumping stations, and stormwater systems [
8,
9]. Similarly, studies addressing sustainability in wastewater, water supply, and utility infrastructure advanced the use of sustainability indicators and composite indices, yet they were generally developed for other infrastructure sectors or for broader utility contexts rather than specifically for drainage infrastructure projects [
4,
10,
11,
12]. As a result, the indicator structures and evaluation logic proposed in these studies do not fully capture the operational complexity, service continuity requirements, and project-level sustainability concerns associated with drainage systems.
A further consideration emerging from the literature relates to methodological aspects. A number of studies have carefully adopted conventional indicator-based or deterministic decision-making approaches, which provide a well-structured and valuable foundation for sustainability assessment [
10,
13,
14]. It may be noted—very respectfully—that fuzzy and hybrid decision-making methods have demonstrated strong potential for addressing ambiguity in sustainability evaluation, but their applications have largely focused on other sectors such as transportation, architecture, ecological responsibility, or general decision theory rather than drainage infrastructure projects [
15,
16,
17]. Moreover, even when sustainability is addressed in infrastructure planning, risk-related concerns are often treated indirectly rather than embedded explicitly in the assessment model itself [
7,
18]. Therefore, a clear research gap remains for a framework that combines drainage-specific sustainability indicators with a fuzzy-based methodology capable of handling uncertainty while explicitly reflecting risk-informed considerations. This gap forms the basis for the present study, which proposes a risk-informed sustainability index tailored to infrastructure drainage projects.
Option List of Assessment Indicators
In the course of this research, a total of 21 published papers, journals and reports concerning the sustainability aspects of infrastructure drainage projects were reviewed and appraised. The relevance and applicability of the identified indicators were evaluated through a collaboration between construction industry experts and academics, facilitating the quantification and ranking of the indicators. Moreover, feedback was obtained from consultants, urban planners and local government officials, which enriched the evaluation process of the respective indicators by integrating a diverse range of perspectives.
Any indicators obtained from the literature review that lacked direct relevance to the projects concerned were omitted. The identified indicators were then thoroughly refined and reviewed with the participation of additional industrial firms, environmental organizations, and urban planning experts to integrate their opinions regarding the chosen indicators. Consequently, 28 sustainability indicators are proposed, covering various social, environmental, and economic aspects, as shown in
Table 1.
The 28 identified indicators categorized into the three categories were verified and further analyzed to ensure that they accurately represent the key sustainability indicators affecting infrastructure drainage projects. The identified indicators were also formulated to support the ultimate purpose of this study: the sustainability index.
3. Research Methodology
3.1. Expert Consultation and Questionnaire Survey
Building on the indicators that were identified through the literature review, the second stage consisted of consulting experts to evaluate and rank the indicators. A questionnaire survey was therefore produced to collect feedback from a wide range of professionals, including engineers, urban planners, environmental scientists, economists and government officials with working or academic experience in infrastructure drainage projects.
The questionnaire was designed to collect both quantitative and qualitative data. Experts were asked to assess the importance of each sustainability indicator via a Likert five-point scale, ranging from ‘negligible’ to ‘very important.’ This scaling method allowed the study to quantify the perceived importance of each indicator. Furthermore, a representative sample was achieved by ensuring the participation of diverse groups of experts. The survey was addressed not only to experts from the engineering design community, but also to authorities and advisors from the public and private sectors. Moreover, experts from different regions were involved to achieve a better understanding of the sustainability indicators, given the varying contexts of the infrastructure drainage projects concerned.
3.2. Data Analysis and Reliability Testing
The data were then systematically analyzed to gauge which of the sustainability indicators were of the highest priority. Statistical methods were employed to analyze the findings from the questionnaire survey; this included calculating mean scores for the indicators assessed by each respondent and establishing an overall ranking for indicators based on the ratings assigned by the experts.
An essential part of this phase was ensuring the reliability and consistency of the data. The reliability of the survey data was confirmed by calculating the internal consistency of the survey responses using Cronbach’s alpha coefficient. Cronbach’s alpha is a widely recognized statistical measure for assessing the reliability of scaled survey responses [
31].
3.3. Normalization and Weighting of Indicators
Normalization is vital to ensure that data using different scales and units of measurement can be compared. In this study, Min–Max normalization was adopted; this is a process whereby the original values are normalized to a scale ranging from 0 to 1. This provided a basis for aggregating the indicators into a composite index.
After normalization, the indicators were assigned respective weights according to their relative importance, as assessed by the surveyed experts. In this case weighting, a very important element of any multi-criteria decision-making modeling, reflects the differential effects of different indicators on the evaluation of sustainability, with larger scores assigned to the more important indicators [
14].
3.4. Application of Fuzzy Set Theory
Acknowledging the inherent uncertainties and complexities associated with sustainability assessment requires recognition that imprecision and fuzziness must be dealt with, which the study accounts for by using fuzzy set theory. In this manner, imprecise and vague information can be handled to support decision-making processes that involve multiple stakeholders and criteria [
16]. The reason for adopting fuzzy set theory is that it can cope with the vagueness and imprecision naturally present in the expert evaluation of information. This allowed the study to account for the inherently subjective and variable nature of experts’ ratings of the selected indicators of sustainability [
17].
3.5. Development of the Sustainability Index
The final phase of the research methodology was to develop a sustainability index for infrastructure drainage projects. The index was designed as a composite measure, in which only the normalized and weighted sustainability indicators with a high degree of membership are included.
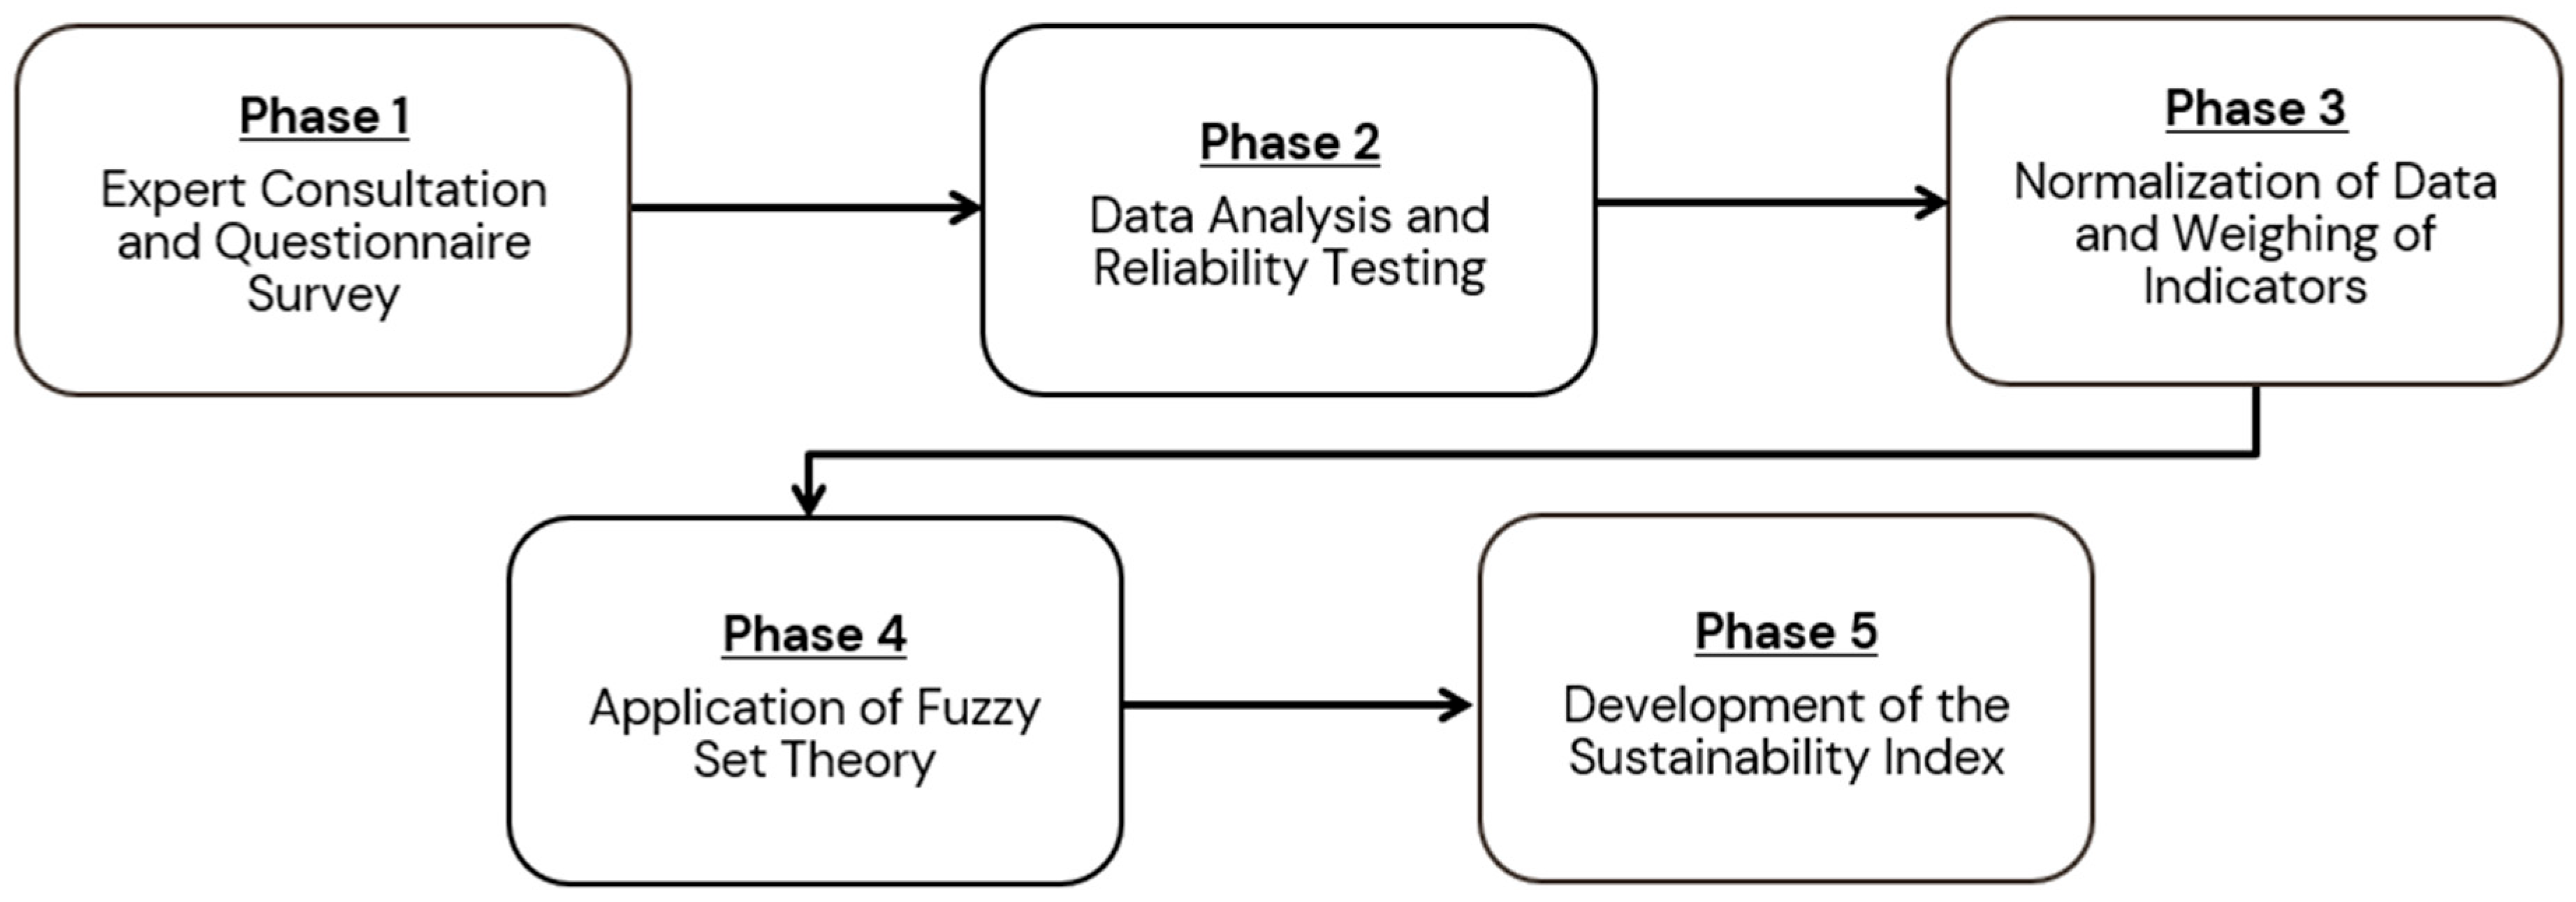
A summary of the phases of the research methodology is presented in
Figure 1.
The method for developing the sustainability index consists of five main stages. Initially, sustainability indicators are determined by conducting a thorough literature review. Next, expert insights are gathered via questionnaire surveys to assess the significance of every indicator. Third, the gathered data undergo min–max normalization to enable uniform comparison between indicators. Fourth, fuzzy set theory is utilized to assess the extent of membership for each indicator in the sustainability indicator collection. In the end, the selected indicators are assigned weights and combined to determine the overall sustainability index for the drainage infrastructure project.
3.6. Utilized Formulas
- −
;
- −
;
- −
.
- −
.
- −
;
- −
;
- −
.
- −
;
- −
;
- −
;
- −
;
- −
‘+’: interpreted as ‘and.’
- −
.
- −
(28).
- −
;
- −
.
4. Data Collection
The values for each assessment indicator were obtained by means of multi-criteria survey of experts. The aim of this survey was to collect experts’ opinions on the relative importance of specific sustainability indicators in the planning and implementation of infrastructure drainage projects. The development of the survey was guided by relevance, reliability, and effectiveness criteria over a two-step development process.
4.1. Survey Design and Pilot Study
The questionnaire was developed by incorporating both quantitative and qualitative questions, eliciting respondents’ personal data, experience, and professional background along with their detailed ratings of the assessment of the indicators as expressed through a five-point Likert scale. A pilot study was performed with three stakeholders from the industry, namely a contractor representative from the construction sector, a professor from the academic sector, and a representative from the governmental client side.
The pilot study highlighted several areas for improvement. For example, it became clear that several of the indicators were not specific enough and that the Likert scale was oversimplified for some of the technical indicators. The questionnaire was subsequently revised in response to the feedback. The wording of several questions was clarified to remove any ambiguities, all indicators were checked to ensure they were relevant to the context of the intervention, and the Likert scale was fine-tuned with clearer distinctions between the choices to avoid overlapping interpretations of the categories. Explanatory notes were also included to further guide the respondents. After the questionnaire was revised, it was reviewed and approved by the research team prior to distribution.
4.2. Sampling and Participant Recruitment
To obtain a representative and diverse sample, the survey was distributed to a select group of infrastructure drainage professionals. The individuals selected each had a high degree of experience in relation to drainage projects to ensure that participants had a broad understanding of the infrastructure drainage sector. The sample included contractors, consultants, suppliers, government officials, clients, and academic researchers. The snowball sampling method was also utilized, whereby initial participants were encouraged to forward the survey to others in their professional network, increasing the likelihood of it reaching an appropriate range of drainage stakeholders.
Participants were first asked to provide some general information, such as the number of years they had been working in the field, the type of organization they represented, and the specific sector they worked in. They were then asked to rate every sustainability indicator in the questionnaire on a five-point Likert scale to indicate the extent to which they thought that indicator contributed to the sustainability of infrastructure drainage projects. A score of ‘5’ denoted that the indicator was of the highest importance, ‘4’ that it was important, ‘3’ that it was of average importance, ‘2’ that it was unimportant, and ‘1’ that it was of negligible importance. To ensure decisive responses and reduce ambiguity, no intermediate values were permitted on the Likert scale.
4.3. Data Gathering
The survey was conducted over a period of four weeks, during which a reminder message was periodically sent to respondents to ensure a higher response rate. Out of the 180 individuals invited to participate in the survey, 155 provided completed responses, yielding a response rate of 86%. The respondents consisted of 19 consultants (12.2%), 25 clients (16.1%), and 105 contractors (67.7%). The majority (71.6%) had drainage project expertise, indicating a high level of domain relevance. The high response rate was facilitated by the controlled sampling technique and the fact that the survey questions were all compulsory, which ensured that each respondent provided a complete set of data. In order to ensure diversity of viewpoints, respondents were divided between the public and private sectors and represented a range of years of professional experience. Crucially, 59.4% had taken appropriate courses or received training linked to sustainability, confirming the accuracy and comprehensiveness of their responses.
5. Data Analysis
Based on the survey data, a series of detailed statistical analyses were carried out to pinpoint the extent of the significance and variability of the sustainability indicators. Descriptive statistics, such as mean scores and standard deviations, were calculated for each indicator to summarize the central tendencies and the spread of the data [
32]. These descriptive statistics are presented in
Table 2, which sheds light on how each indicator was rated by the survey respondents.
For example, x1 corresponds to the indicator ‘protection of cultural heritage’ with an average score of 3.55 across all respondent groups and a standard deviation (SD) of 1.10. The scoring demonstrates that, on average, the respondents considered the protection of cultural heritage to be an indicator of moderate importance for the sustainability of infrastructure drainage projects, although there is a degree of variability in the received responses. The standard deviation score indicates that although the average value may be moderate, some respondents were outliers who assigned either significantly higher or lower importance to the indicator.
The differences in scores within each of these groups clearly show that one of the most important insights from the survey is that stakeholders involved in infrastructure drainage projects assigned different values to the various sustainability dimensions, depending on their roles and points of view [
33]. For a contractor, cultural heritage protection may be seen as a feature of a project that only exists to fulfill a legal obligation that must be officially reported, or because local communities are involved in infrastructure projects somewhere along the line.
Furthermore, the results also indicate possible associations between the indicators, or clusters of indicators that tended to be rated similarly by different respondent groups. For example, the indicators relating to environmental sustainability, such as x14 ‘proper control of noise pollution during construction’ and x15 ‘proper reinstatement of used land for construction’, were assigned a higher level of importance by governmental client representatives and environmental consultants than by contractors and private clients. These correlations indicate that multiple sustainability considerations are linked and suggest that strategies for strengthening sustainability in drainage infrastructure projects must address these relationships holistically.
5.1. Reliability Analysis
As detailed in
Section 3, Cronbach’s alpha was utilized to assess the reliability of the data collected in the survey and used in this research. Cronbach’s alpha is widely employed to evaluate internal consistency by estimating the average of the correlations between each item and other sets of items [
34]. In this study, Cronbach’s alpha was used to understand whether the various assessment indicators within the social, environmental, and economic categories reliably captured the dimension of sustainability in the context of infrastructure drainage projects.
The calculation of Cronbach’s alpha was performed using Equation (1), a formula for expressing the coefficient as a function of the number of items (indicators) and the mean inter-item correlation among them. A high Cronbach’s alpha value corresponds to high internal consistency, suggesting that the indicators within a category are highly correlated. In other words, high internal consistency is desirable because it means that the items are not random [
35].
The results of the Cronbach’s alpha calculations are presented in
Table 3. Overall, Cronbach’s alpha in all three clusters exceeded 0.7, which is considered an acceptable threshold value by researchers. For example, calculation of the Cronbach’s alpha for the social category yielded 0.756, indicating high reliability of the social sustainability data set. The same goes for the other two categories, environmental and economic, at 0.789 and 0.810, respectively. Based on this, it can be stated that the survey data employed in this study are not only reliable but also consistent for each category.
For results to be credible, it is essential to reach a Cronbach’s alpha coefficient of 0.7 or higher, as this indicates that the survey items consistently reflect the intended sustainability dimensions. The benchmark of 0.7 or higher is standard in social science research, and hence it is established that it indicates that the items in a scale reflect the same construct with acceptable reliability [
36]. Cronbach’s alpha is essential for drawing valid conclusions from the data, as it reduces the likelihood of measurement error and ensures that the variability in responses is due to actual differences in expert opinions rather than inconsistencies in the survey itself.
5.2. Data Normalization
To allow for an unbiased comparison of the relative significance of the different assessment indicators, the raw survey data was normalized. Data normalization was performed by obtaining the average scores of the different indicators and standardizing them to consistent scales. This is an important step in this type of research because it ensures that variables are all measured on a consistent scale, in this case offering a better indication of their relative performance in contributing to sustainability in infrastructure drainage projects.
Min–max normalization was selected to be utilized in this research, as the process is well-suited for data of this type [
37]. Using Equation (2), min–max normalization was conducted as follows: each average score was transformed by subtracting the minimum score for that indicator, and then divided by the range (i.e., the difference between the maximum score and the minimum score). This resulted in a standardized score in a range between 0 and 1, where 0 represents the lowest perceived importance of an indicator and 1 the highest. This process was repeated for all indicators in each of the three categories: social, environmental and economic.
5.3. Weight Assignment
Once the normalized values were determined, the weight of each of the 28 indicators was calculated relative to the total sum of all normalized values. The sum of the normalized values of all 28 indicators was (Σ = 21.046). The weight of each indicator was computed using Equation (3), which defines the weight of each indicator as the ratio of its normalized value to the total sum of normalized values. By summing all indicators, we ensured that the collective impact of various sustainability parameters was estimated in a balanced manner.
The assignment of weights was important since it directly influenced how the different indicators were aggregated to obtain the final sustainability index. The weighting process permitted the reflection of the collective judgment of sustainability criteria expressed by the surveyed experts, according to the elements that they perceived as most relevant to sustainability in infrastructure drainage projects [
38].
5.4. Analysis of Indicators with Fuzzy Set Theory
The data used for the analysis of the sustainability indicators was derived from the questionnaire survey of three expert groups, namely contractors, clients and consultants. Nonetheless, expert opinions are inherently subjective and often reflect the uncertainty and ambiguity of individual experiences and interpretations of the concept of sustainability. The subjectivity of the experts’ opinions was addressed through the application of fuzzy set theory in order to account for the inherent vagueness of human judgment. The theory has been extensively applied in the medical, engineering, agricultural, and social sciences to tackle uncertainty and vagueness in data.
In the context of this study, fuzzy set theory was used to provide an understanding of the relative importance of the sustainability indicators by representing the assessment of each indicator as a fuzzy variable rather than a precise one. The set of sustainability indicators is denoted by the symbol Ã.
The importance of each indicator was assessed on a five-point Likert scale from 1 (lowest) to 5 (highest), and a score of 3 was considered the neutral level of importance. Indicators with scores below 3 were then considered to have less than a 50% chance of being included in the final set of sustainability indicators. Furthermore, the SD of the scores was also taken into consideration, as a greater SD translates to a greater dispersion in the scores, which in turn implies lower consensus and significance. In order to select the indicators, a threshold Z parameter, computed only for those parameters whose mean value is higher than 3, was introduced.
The Z parameter was developed to assess the statistical significance of each sustainability indicator by concurrently taking into account the average importance score given by experts and the variability in their responses. Indicators exhibiting greater mean scores and reduced variability demonstrate a stronger consensus among experts on their significance, leading to elevated Z values. As a result, the Z parameter functions as a filtering tool to pinpoint indicators that exhibit both importance and agreement among the expert panel.
Due to the subjective nature of the survey responses, which often did not follow a normal distribution, the study utilized a fuzzy distribution instead [
39]. According to fuzzy set theory, the likelihood of a variable belonging to a group is represented by its degree of membership in the fuzzy set [
40]. The degree of membership
is calculated.
Subsequently, the calculations for the degree of membership
were derived from Equation (6) and are provided in
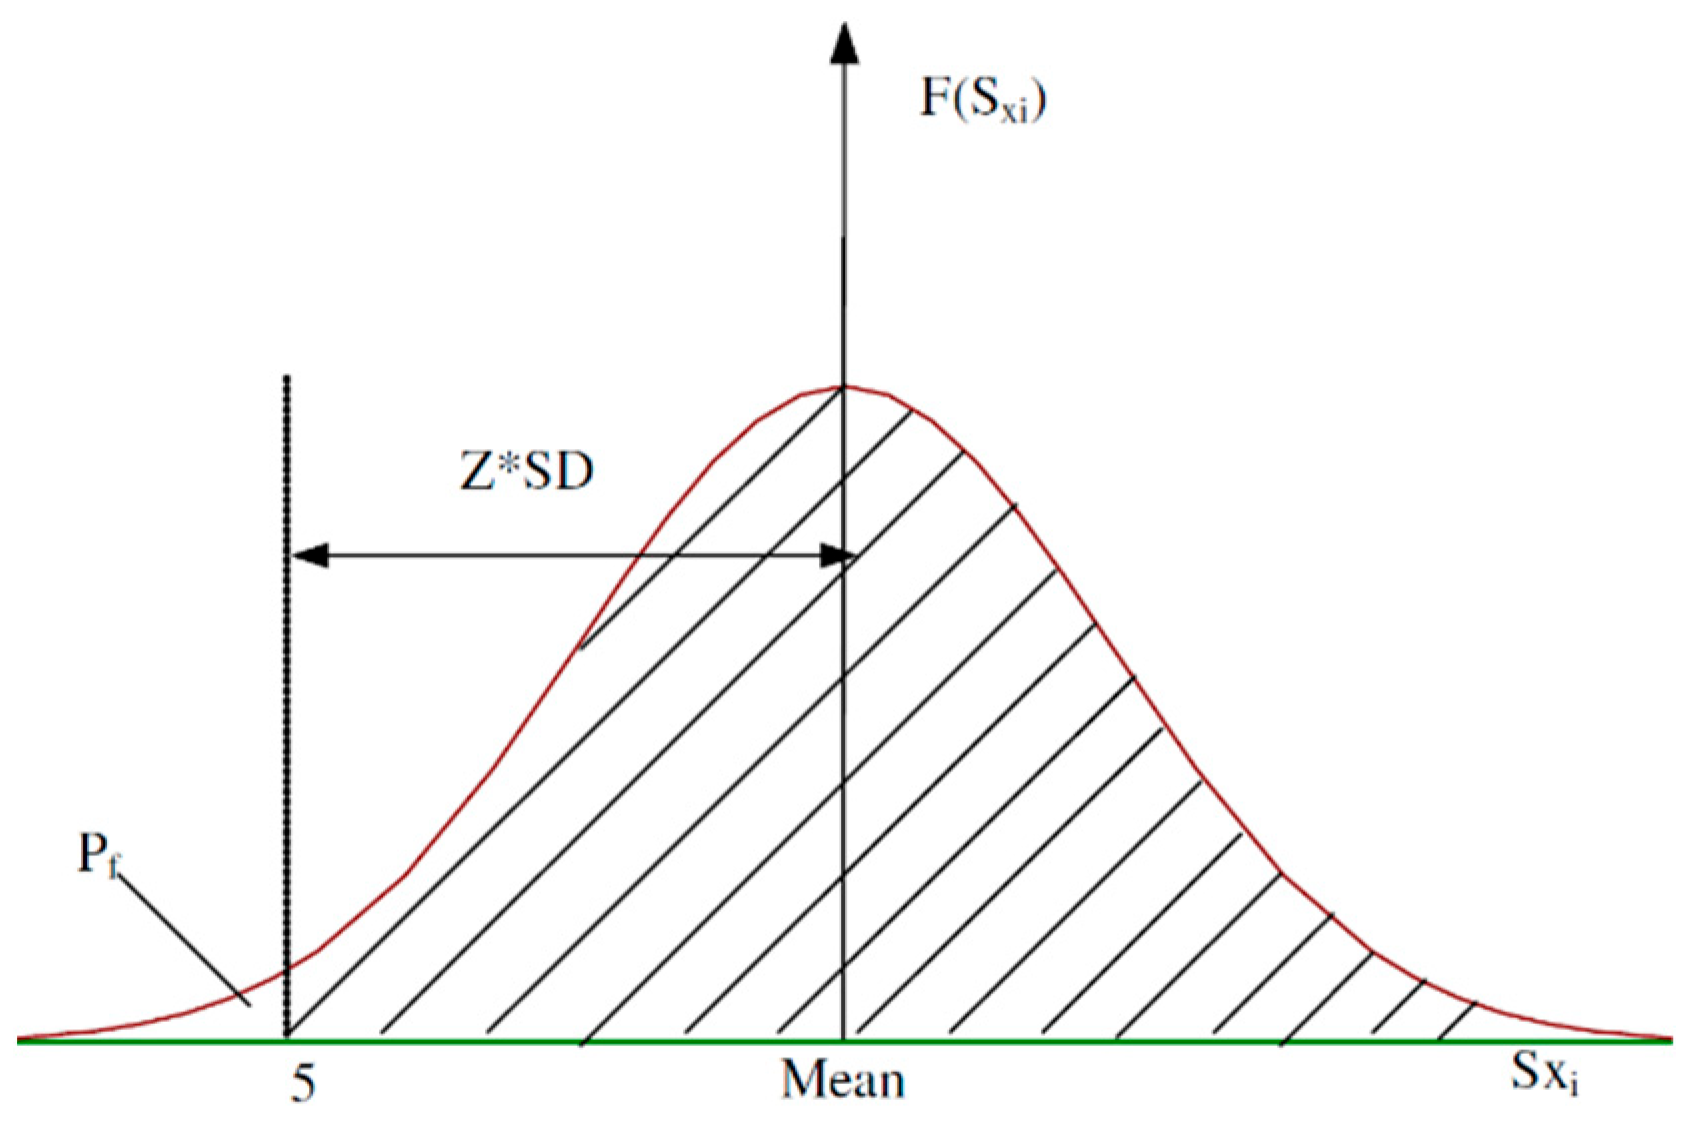
Table 4. A benchmark value had to be present in order to determine if an indicator qualifies as a key sustainability indicator. If
met or exceeded the assigned threshold, the indicator was considered significant, as seen in
Figure 2.
Different fuzzy sets for sustainability indicators were developed for the three expert groups, namely, contractors, clients, and consultants, and designated , , and , respectively. Using Equations (5) and (6) along, the values for the Z parameter and the degree of membership were calculated.
Corresponding to the description of the union operator on fuzzy theory [
41], the fuzzy set can be expressed.
(i.e., the number of indicators) must be equal to or greater than 1. Evidently, the union operator will converge to the sum-operator when
and the union operator to the max-operator when
→ ∞. In this paper, the number of indicators,
, was deemed relatively large. Hence, the integrated result,
, was acquired from the union
,
, and
by using Equation (7). The outcomes of
are shown in the last column of
Table 4, representing the aggregated membership values for each indicator.
To determine the sustainability indicators for infrastructure drainage projects, the λ-cut set method was employed. This method translates a fuzzy set into a classical set, with the optimal outcome at λ = 1 and the worst at λ = 0. A λ value of 0.5 represents a neutral stance. According to [
42], an effective range for λ is between 0.65 and 0.85. In this study, λ = 0.85 was chosen as the threshold for selecting the sustainability indicators. Indicators with
equal to or greater than 0.85 were considered to be part of the sustainability indicators set.
In fuzzy decision-making scenarios, the λ-cut threshold usually lies between 0.65 and 0.85 based on the required level of strictness in choosing indicators. In this research, a relatively cautious threshold of λ = 0.85 was chosen to guarantee that only indicators reflecting a strong consensus among experts remained in the sustainability index. This more rigorous threshold improves the model’s robustness by excluding indicators that show lesser agreement or diminished relevance to sustainability evaluation in drainage infrastructure initiatives.
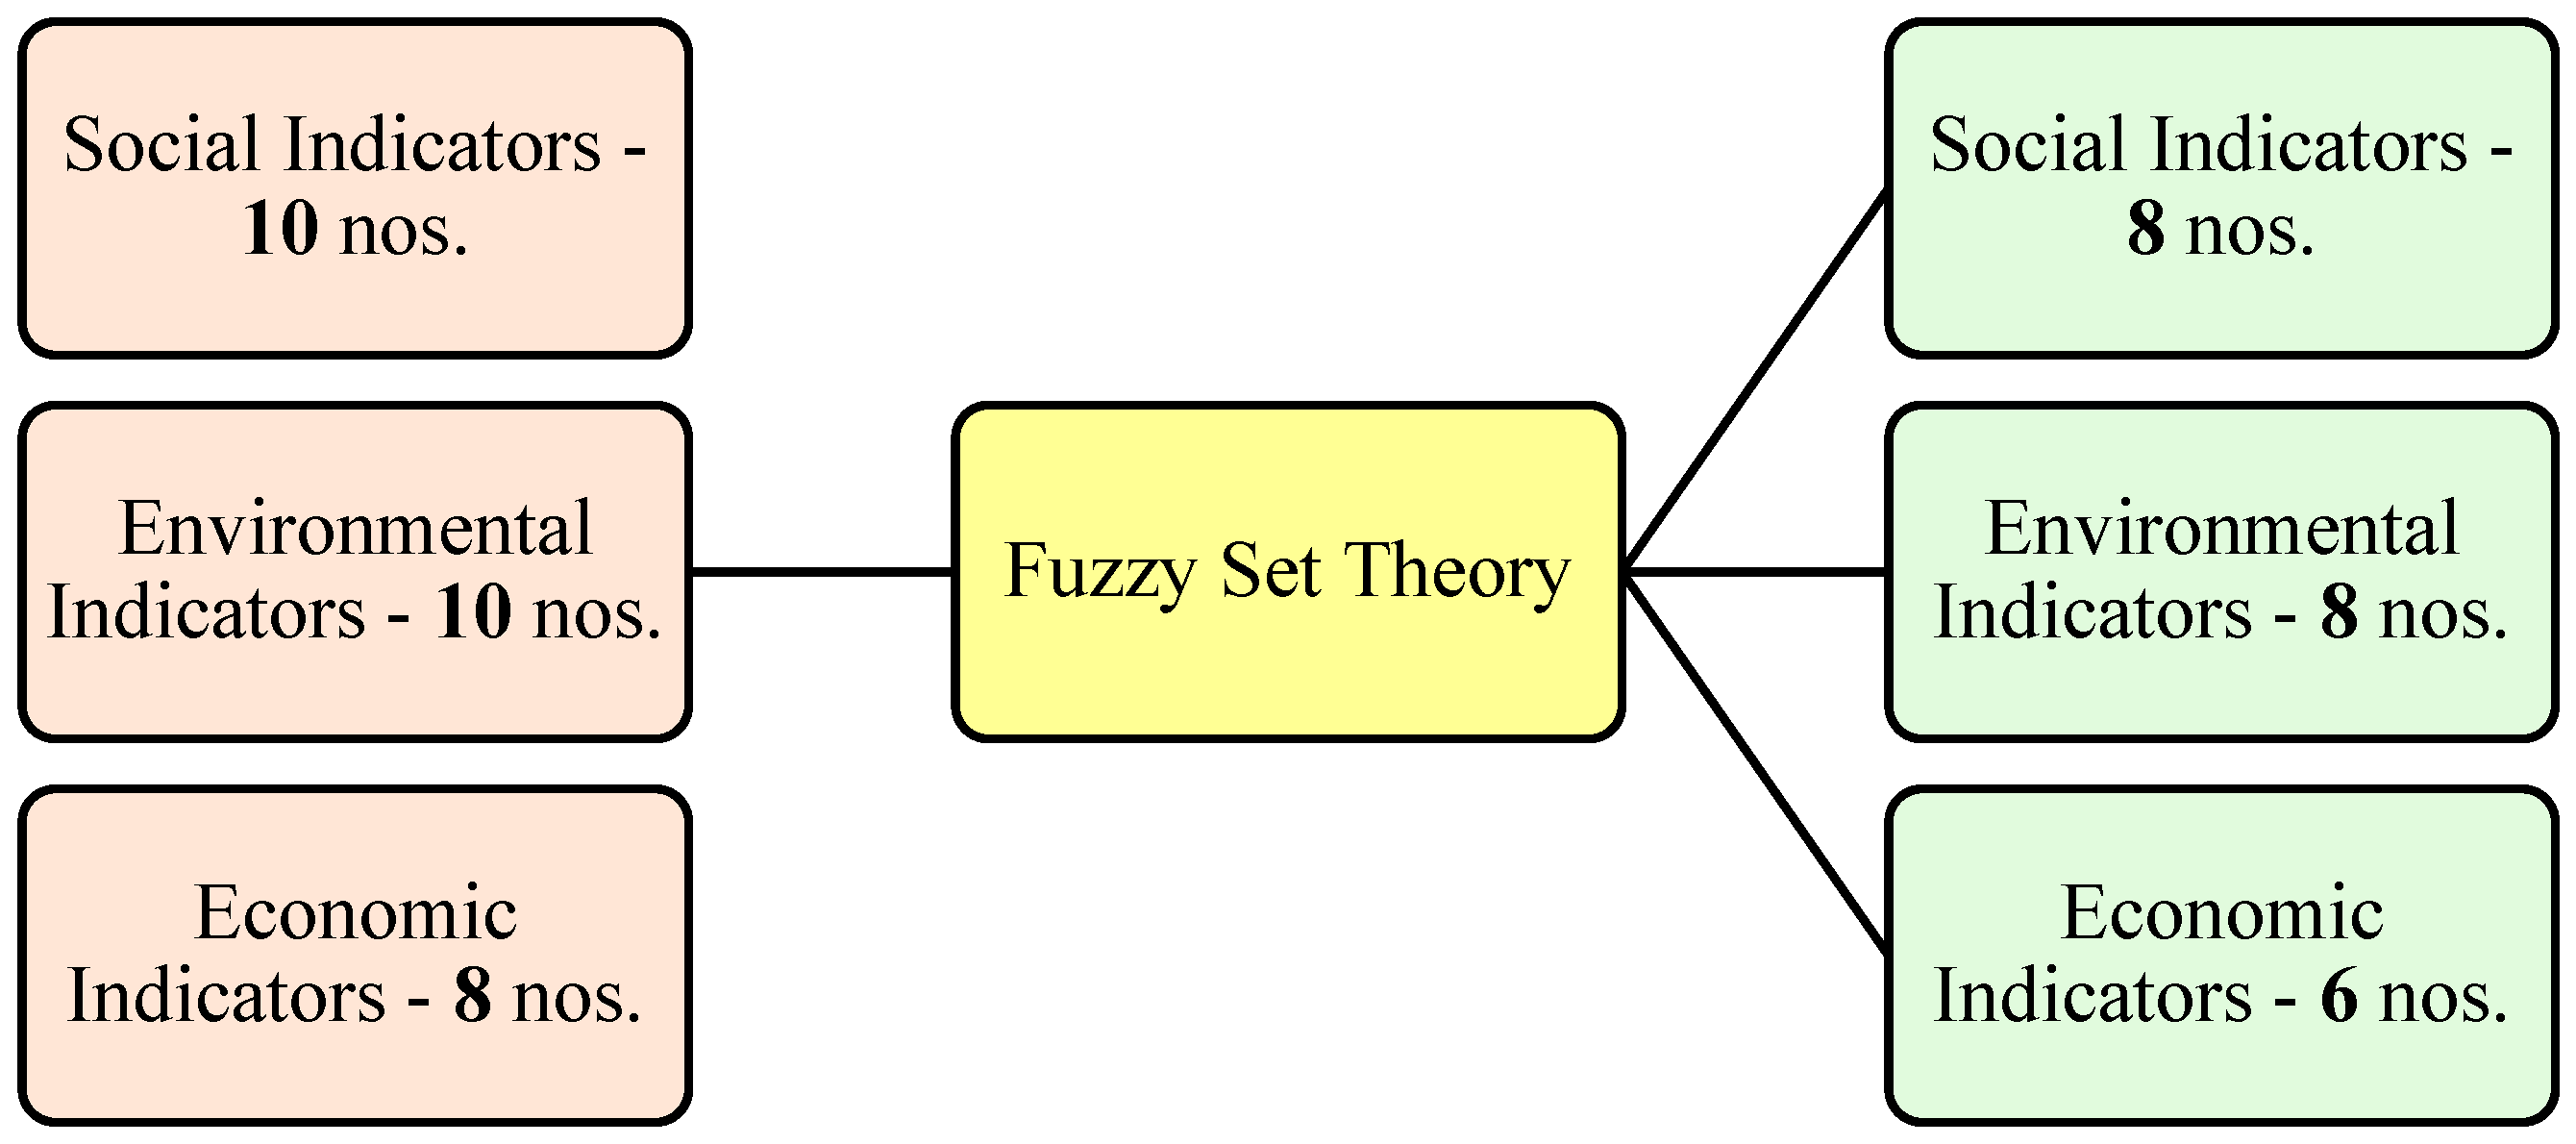
Figure 3 shows the elimination process for the fuzzy set.
5.5. Sustainability Index Formulation
After applying the fuzzy set theory analysis, 6 out of the 28 indicators were excluded as they were all lower than the 0.85 threshold value. This exclusion was in line with the λ-cut set method, which aimed to ensure that only the most statistically significant and relevant indicators were included in the final index.
The remaining 22 indicators, all of which had a degree of membership above 0.85, were retained for formulation of the sustainability index. These indicators represent the core aspects deemed essential for assessing sustainability in projects. However, with the removal of 6 indicators, it became essential to redistribute the weights of the indicators proportionally to ensure that the total weight of all remaining indicators summed to a total of 1.
To accomplish this, the normalized values of the 22 retained indicators were recalculated. The revised sum of the normalized values was computed as (Σ = 17.022). Using Equation (3), which defines the weight of each indicator as the ratio of its normalized value to the total sum of normalized values, the weights were recalculated accordingly. The updated normalized values and the corresponding weights for each of the 22 indicators are presented in
Table 5. This adjustment ensured that the sustainability index remained accurate and reflective of the most critical indicators influencing project sustainability.
The sustainability index was measured by summing the weighted contributions of each of the 22 indicators, as shown in Equation (8). The maximum value a sustainability index can achieve is 1, which corresponds to 100%. In this case, a maximum rating has been achieved for all indicators, and the project can therefore be considered fully sustainable in all considered dimensions of sustainability. Conversely, a lower index can indicate that certain aspects of a project have not been assessed as sustainable, meaning improvement is needed.
For the application of the sustainability index, each indicator is assigned a new score on a scale of 1 to 5, based on expert judgment. This is done using the same Likert scale as was used in the original questionnaire. Experts base their ratings on the level of performance of the project with respect to each of the indicators. A rating of 5 represents the highest possible score, meaning the project fulfills the sustainability criteria associated with that indicator. Conversely, a rating of 1 suggests that the project performs poorly with regard to that particular indicator. These rating values are then combined with the recalculated weights to form the final sustainability score of a given project.
6. Discussion of Results
The exclusion of certain sustainability indicators with a degree of membership lower than 0.85 reflects the subjective nature of the expert assessments and highlights how perceptions of importance can vary significantly based on the specific context of infrastructure drainage projects. These exclusions reflect a consensus among participants that some indicators, while relevant, may not be critical for determining the sustainability of a project [
43]. For instance, the exclusion of sustainability indicator x
7 (‘aesthetic harmony of the construction site with the surrounding areas’) which had the lowest integrated result of 0.656, reveals that while visual integration with the environment may be desirable, it is not considered a top priority when evaluating the sustainability of a drainage project.
Similarly, other indicators were excluded for their relatively low perceived importance. Indicator x1 (‘protection of cultural heritage’) was deemed less critical than other indicators, perhaps reflecting the specific nature of drainage projects, which may not always intersect with culturally sensitive sites. In cases where they do, this indicator might be more relevant, but for the majority of projects it appears to hold less significance.
Conversely, the inclusion of several indicators with a perfect degree of membership (1.000) demonstrates their critical importance to the sustainability of infrastructure drainage projects. These indicators, universally recognized by the experts as essential, form the foundation of a sustainable project. For example, indicator x2 (‘overall satisfaction of the end user’) emerged as a key measure of success, highlighting the increasing focus on stakeholder engagement and the importance of addressing community needs and concerns. In modern infrastructure projects, especially those impacting public utilities such as drainage systems, end-user satisfaction is a crucial determinant of a project’s long-term success and acceptability.
The emphasis on user-centric indicators is further supported by the inclusion of related indicators such as x
4 (‘maintaining proper access to surrounding buildings of the construction area’), x
8 (‘meeting the needs of the end-users’), and x
10 (‘maintaining public safety around the work site’). These indicators all point to the critical importance of ensuring minimal disruption and maximum safety for the public during the construction and operation of drainage systems. By prioritizing these aspects, projects can foster positive relationships with the communities they serve, which is essential for achieving broader sustainability goals [
43].
It is essential to recognize that key sustainability indicators can be influenced and optimized by the actions of contractors, clients, and consultants. For instance, contractors play a crucial role in maintaining proper access to surrounding buildings and ensuring public safety by implementing adequate barricading. These actions contribute to meeting end-user needs and achieving the desired level of satisfaction with the project. Effective supervision by consultants and their empowerment by owners to utilize their authority to enforce standards on contractors are also crucial for ensuring adherence to sustainability goals. Unified perspectives among all parties are necessary to achieve common objectives and attain the targeted level of sustainability.
The proposed sustainability index is meant to serve as a tool to assist in decision-making. The index offers a systematic and fact-based assessment of a project’s sustainability performance by combining social, environmental, and economic variables into a single composite metric. Its goals are to draw attention to areas of strength and weakness, direct enhancements, and compare project success.
For practical application, each retained sustainability indicator should be evaluated using project-specific data sources such as operational records, inspection reports, maintenance logs, environmental monitoring data, stakeholder feedback, and regulatory compliance documentation. The evaluation process begins by identifying the relevant data source for each indicator and assessing the project’s performance against predefined sustainability criteria.
The method of measurement depends on the nature of each indicator. For example, public safety can be evaluated using incident frequency records, safety audit reports, and compliance with safety regulations. Community satisfaction can be assessed through stakeholder surveys, service-response records, and feedback mechanisms. Environmental indicators, such as waste management and pollution control, can be evaluated using measurable parameters including waste generation rates, pollutant concentrations, and compliance with environmental standards, supported by monitoring reports and regulatory documentation.
In addition, the measurement units and evaluation procedures vary according to the type of indicator. Quantitative indicators may be expressed using numerical values (e.g., emission levels, noise levels, response times), while qualitative indicators may be assessed using structured expert judgment or rating scales. These values are then translated into standardized scores (e.g., Likert scale ratings) to ensure consistency across all indicators. This structured evaluation approach enables the framework to integrate both quantitative data and expert-based assessments in a consistent and replicable manner.
6.1. Case Study
Infrastructure drainage projects and their maintenance must comply with not only technical and operational standards, but also the relevant country’s fundamental economic and sustainability policies. In countries which are developing quickly—such as Qatar, where ambitious growth plans are emphasized by strategic government policies—infrastructure projects are seen as essential components of national development. Qatar’s National Vision 2030 program includes sustainable development as one of its key pillars, aiming to achieve socioeconomic advancement in a balanced and environmentally sustainable manner. As a result, infrastructure projects, including drainage systems, must be planned and implemented according to these national policies and goals to contribute to the long-term interests of the country.
The case study for this research focuses on a long-term operation and maintenance (O&M) project for infrastructure drainage in Qatar. This project exemplifies a large-scale attempt to consolidate the management of all drainage components holistically. As part of this, the project manages and operates a portfolio of drainage assets including pipeline gravity networks, pumping stations and treatment plants. These assets form part of several key networks such as sewage systems, treated water systems and stormwater systems, which together serve as the backbone of Qatar’s urban infrastructure.
The project also involves preventive and corrective maintenance of these drainage assets. In other words, the project not only repairs the infrastructure if something goes wrong (corrective maintenance), but also actively works to prevent the infrastructure from deteriorating, allowing it to function effectively for longer (preventive maintenance) [
44]. Finally, the project oversees all sorts of construction works undertaken by different contractors around the country, meaning that maintenance teams are in close contact with the contractors, supervising new construction works and ensuring that they are carried out sustainably.
This case study was selected because of its relatively comprehensive data collection process as well as the close relationship between the study’s research team and the project management team. In turn, this relationship provided unique and detailed access to the required project information, ultimately enabling a robust analysis of sustainability practices in Qatar’s infrastructure development processes. The research team was able to identify and quantify the performance of the project in relation to the sustainability indicators identified earlier in the study.
A questionnaire was developed and sent to ten experts who were familiar with the project, its stakeholders, and the challenges involved in the case. The experts ranged from engineers and project managers to sustainability specialists associated with the project. All these experts completed the questionnaire, which used a Likert scale to gauge the relevance of multiple indicators. This allowed the research team to develop a quantitative representation of experts’ perceptions of the project’s sustainability.
Although the expert panel consisted of ten professionals with extensive experience in drainage infrastructure projects, the relatively small sample size represents a potential limitation of the case study evaluation. Expert-based assessments are inherently subjective and may vary depending on professional background and project experience. Future research could expand the number of participating experts and incorporate additional stakeholder groups to enhance the statistical robustness of the sustainability evaluation.
Besides rating the performance of the project, participants also offered suggestions on how to improve the sustainability of Qatar’s drainage networks. The main key focus of all participants was customer satisfaction. All experts agreed that providing or exceeding the service needs of end customers is crucial for achieving sustainability. This focus on client satisfaction aligns with Qatar’s primary goal of raising the standard of living for its people by guaranteeing that infrastructure projects successfully meet community needs in addition to fulfilling technical requirements.
6.2. Sustainability Index
Based on the feedback and input from participants, an average score for each sustainability indicator was calculated, as shown in
Table 6.
Using Equation (8), the scores were used to determine the overall sustainability index of the project, with a result of 77.9%. This result represents a positive response from the project team that they are following the current sustainability guidelines and regulations. However, this result also implies that there is room for improvement, since some of the sustainability indicators are not fully implemented. This suggests that the current sustainability guidelines are not comprehensive enough, or that specific indicators are prioritized over others.
The sustainability index calculation reflects the weighted importance of each indicator and how effectively the project is implementing them. For example, indicator x
13 (‘immediate removal of sewage waste rather than periodic removal from collection basins or septic tanks’) was assigned one of the highest average scores, at 4.900. This high score highlights the importance placed on ensuring that sewage waste is promptly removed from the site, a critical indicator in maintaining sanitation and minimizing environmental risks [
45].
Moreover, indicator x8 (‘meeting the needs of the end-users’) received a score of 4.800, emphasizing the importance of fulfilling the needs of end-users and putting these into perspective throughout the project’s duration. Additionally, indicators such as x10 (‘maintaining public safety around the work site’) and x15 (‘proper reinstatement of used land for construction’) also received high scores of 4.800. The assigned scores reflect the project team’s dedication to maintaining public safety around the construction sites as well as reinstating sites to their original state for the benefit of the public and, ultimately, to meeting the needs and requirements of end-users.
In contrast, indicator x18 (‘periodical assessment of air quality index’) received the lowest average score of 2.100. This indicates that air quality monitoring is perceived as less critical to the project’s sustainability. This lower priority is partly because air quality assessment is not explicitly required by the project’s contractual obligations. Consequently, the contractor is not held responsible for the impact of their activities on air quality unless specifically directed by a variation order that includes additional air quality guidelines. Implementing such an order would necessitate a change in scope and potentially increase project costs, leading to a trade-off between environmental and economic considerations.
In addition, a few other indicators received a low score of 3.100, such as x3 (‘protection of ground vegetation within project boundaries’), x9 (‘community support for the development of drainage projects’), x20 (‘proper assessment of groundwater pollution levels due to seepage and leakage’), and x24 (‘proper risk management by the contractor with regard to economic shocks/fluctuations’). These low scores indicate that the project team is either partially disregarding these indicators throughout the project or that they are simply of less importance to the success of the project within its given conditions.
The variation in scores among the different indicators reveals the challenges involved in balancing sustainability across multiple dimensions—social, environmental, and economic. For instance, while indicators related to immediate waste removal and public health were assigned high importance, indicators tied to broader environmental monitoring, such as air quality, received less attention. This disparity reflects the complexity of integrating comprehensive sustainability practices into large infrastructure projects, where immediate and tangible impacts, such as waste management, are often prioritized over long-term environmental monitoring [
9].
The results suggest that while the project is doing well in many areas, there are significant shortcomings in addressing sustainability holistically. This is supported by the low scores for indicators such as air quality monitoring. Although air quality monitoring is not directly relevant to the project’s key deliverables, it may impact the local environment and even the well-being of nearby communities.
Even though the case study centers on a drainage infrastructure initiative in Qatar, the recommended methodology is intended to be flexible for application in different geographic areas and infrastructure scenarios. The process of selecting indicators and the weighting system can be modified to align with local environmental factors, compliance needs, and project goals. As a result, the suggested sustainability index framework could be utilized for drainage infrastructure initiatives in different nations aiming to incorporate sustainability and risk factors into their infrastructure management strategies.
The robustness of the proposed framework is ensured through its systematic structure, which combines statistical analysis, expert-based evaluation, and fuzzy set theory to handle uncertainty. The use of reliability testing (Cronbach’s alpha) further strengthens confidence in the consistency of the collected data. Moreover, the fuzzy-based filtering mechanism ensures that only indicators with strong consensus are retained, enhancing the stability of the model outputs.
In terms of generalizability, the proposed framework is designed to be adaptable to different infrastructure contexts. The indicator set, weighting scheme, and evaluation criteria can be modified based on regional requirements, project characteristics, and stakeholder priorities. This flexibility allows the framework to be applied to a wide range of infrastructure projects beyond drainage systems, thereby increasing its practical applicability.
7. Recommendations
The outcomes of this study underscore the need for a sustainability index as a tool to guide decisions in infrastructure drainage projects. The following recommendations can be considered to maximize the effectiveness of sustainability initiatives.
7.1. Early Integration of Sustainability Goals
Project teams must incorporate sustainability objectives from the very beginning of project planning. Prior to the project’s start, a clear sustainability index should be established in order to help define success criteria and targets. Throughout the course of the project, more effective decision-making can be facilitated through this proactive approach, which guarantees that all stakeholders are aligned with the sustainability objectives [
46].
7.2. Regular Review and Adaptation
The field of sustainability is dynamic, and the variables affecting sustainability performance are liable to change over time. Accordingly, it is crucial to periodically review the sustainability index throughout a project’s duration. As objectives change, new data becomes available, stakeholders provide feedback, and priorities shift, meaning that project teams should update the model accordingly. In this manner, the project will be able to adapt to new sustainability issues and changing conditions, ensuring that sustainability objectives are fulfilled throughout the duration of the project.
7.3. Enhancing Sustainability Guidelines
According to the research findings, some indicators (such as those related to environmental factors) may not receive enough attention under the current regulations. It is recommended that project teams and government officials reexamine and improve sustainability guidelines to guarantee that they thoroughly tackle all relevant factors, including those that are presently considered less critical like air quality and long-term environmental impacts [
18]. Enhancing these criteria may result in sustainability outcomes that are more holistic and balanced.
7.4. Engaging Stakeholders in Sustainability Efforts
Collaboration between diverse stakeholders, such as project teams, local communities, governmental organizations, and environmental experts, is necessary to achieve effective sustainability strategies. Innovative solutions can result from engaging with stakeholders in meaningful discussions about how to effectively incorporate sustainability into infrastructure drainage projects. Diverse viewpoints can be used to find ways to enhance sustainability performance without dramatically increasing project costs. This engagement can also foster a sense of ownership and responsibility among all parties, contributing to the long-term success of the project.
8. Limitations and Future Research
Despite the contributions of this study, several limitations should be acknowledged. First, the sustainability indicators and their respective importance weights were derived from expert judgments, which may introduce a degree of subjectivity. Although fuzzy set theory was employed to reduce uncertainty and variability in the expert responses, subjective bias cannot be entirely eliminated. Second, the case study application was limited to a drainage infrastructure project in Qatar. While the methodology is adaptable to other contexts, additional case studies in different geographic regions would strengthen the generalizability of the findings. Third, the present study did not perform a direct numerical comparison with alternative MCDA techniques such as AHP or TOPSIS. Future research could expand the model by incorporating additional project scenarios, comparing results with alternative evaluation methods, and applying the framework to different types of infrastructure systems.
9. Conclusions
Infrastructure drainage projects support social, environmental and economic sustainability as they positively affect quality of life, the preservation of environmental conditions, and the strengthening of economic activities. As the backbone of urban development and the management of water resources, as well as a way to reduce environmental hazards, drainage projects are essential for the economic sustainability of a country. Therefore, these projects should support a country’s overall sustainability goals. However, due to the lack of standardized methods to quantify the sustainability of drainage infrastructure, the evaluation process remains largely subjective, based on expert judgment and qualitative assessments.
This study tackles the challenge by developing a customized set of key sustainability indicators to assess infrastructure drainage projects from a sustainability perspective. Through the utilization of fuzzy set theory in this study, the objectivity and precision of sustainability assessments are enhanced. Fuzzy set theory facilitates the resolution of the inherent uncertainties and ambiguities related to the perception of experts. The proposed list of sustainability indicators provides a structured framework for evaluating the sustainability of drainage projects from social, environmental and economic perspectives.
After the questionnaire survey of industry professionals, a refined set of sustainability indicators was developed through a methodical filtering process. By ensuring that only the most significant and significant indicators were retained, this filtering process produced a solid framework for evaluating sustainability. The sustainability index, which represents the main result of this study, was computed using the final set of indicators. The sustainability index, as given by Equation (8), offers a measurable indicator of the overall sustainability performance of a project.
A case study of a significant infrastructure drainage project in Qatar was used to demonstrate the application of the sustainability index and highlight the usefulness of the suggested framework. The case study’s findings underline the importance of continual assessment and improvement of sustainability practices and provide insightful information about the sustainability performance of major infrastructure projects. The case study demonstrates how some sustainability indicators, such as public health measures and waste management, are prioritized over other indicators, such as environmental monitoring.
The methodology developed in this study can be used in several contexts, like that of the case study in Qatar, as it is flexible and adaptable. The flexibility of the weighting process is suitable for changing the priorities of each sustainability indicator based on project-specific needs or evolving sustainability priorities. If new sustainability indicators need to be added in future studies, or if the focus changes to new sustainability dimensions, the weighting methodology can be adjusted accordingly. This helps to make the model a useful tool for decision-makers and project managers involved in infrastructure drainage projects across different institutional and geographical contexts.
The framework can be used by governments, municipalities and private sector contractors to benchmark sustainability performance, set goals, and track progress throughout the lifecycle of an infrastructure project. Moreover, the methodology can be applied to a range of projects such as new construction projects, repair and replacement projects, as well as completed projects. However, the weighting process and specific sustainability indicators can be modified according to the project specific needs in order to reflect the actual status of the project in accordance with the set criteria of sustainability required for the respective type of project.
10. Recommendations for Future Studies
This study has certain limitations, such as the omission of variables relevant to specific organizations or businesses, as well as the use of only a single case study to illustrate how the sustainability index can be utilized. In order to overcome these constraints, future studies should apply the index to a wider variety of projects and include other sustainability-related elements that may be pertinent in certain situations. The usefulness of the sustainability index as a tool for decision-making can be increased by investigating new areas of sustainability, such as infrastructure components’ resilience to climate change and the integration of renewable energy.