Accessibility Barriers in Urban Public Transport for Disabled Users: An AHP-Based Severity Index and Behavioral Regression Analysis


Abstract
1. Introduction
2. Literature Review
- It operationalizes accessibility barriers using a structured multi-criteria decision-making approach rather than descriptive reporting.
- It empirically links accessibility levels to behavioral outcomes using survey data collected from 450 passengers with disabilities.
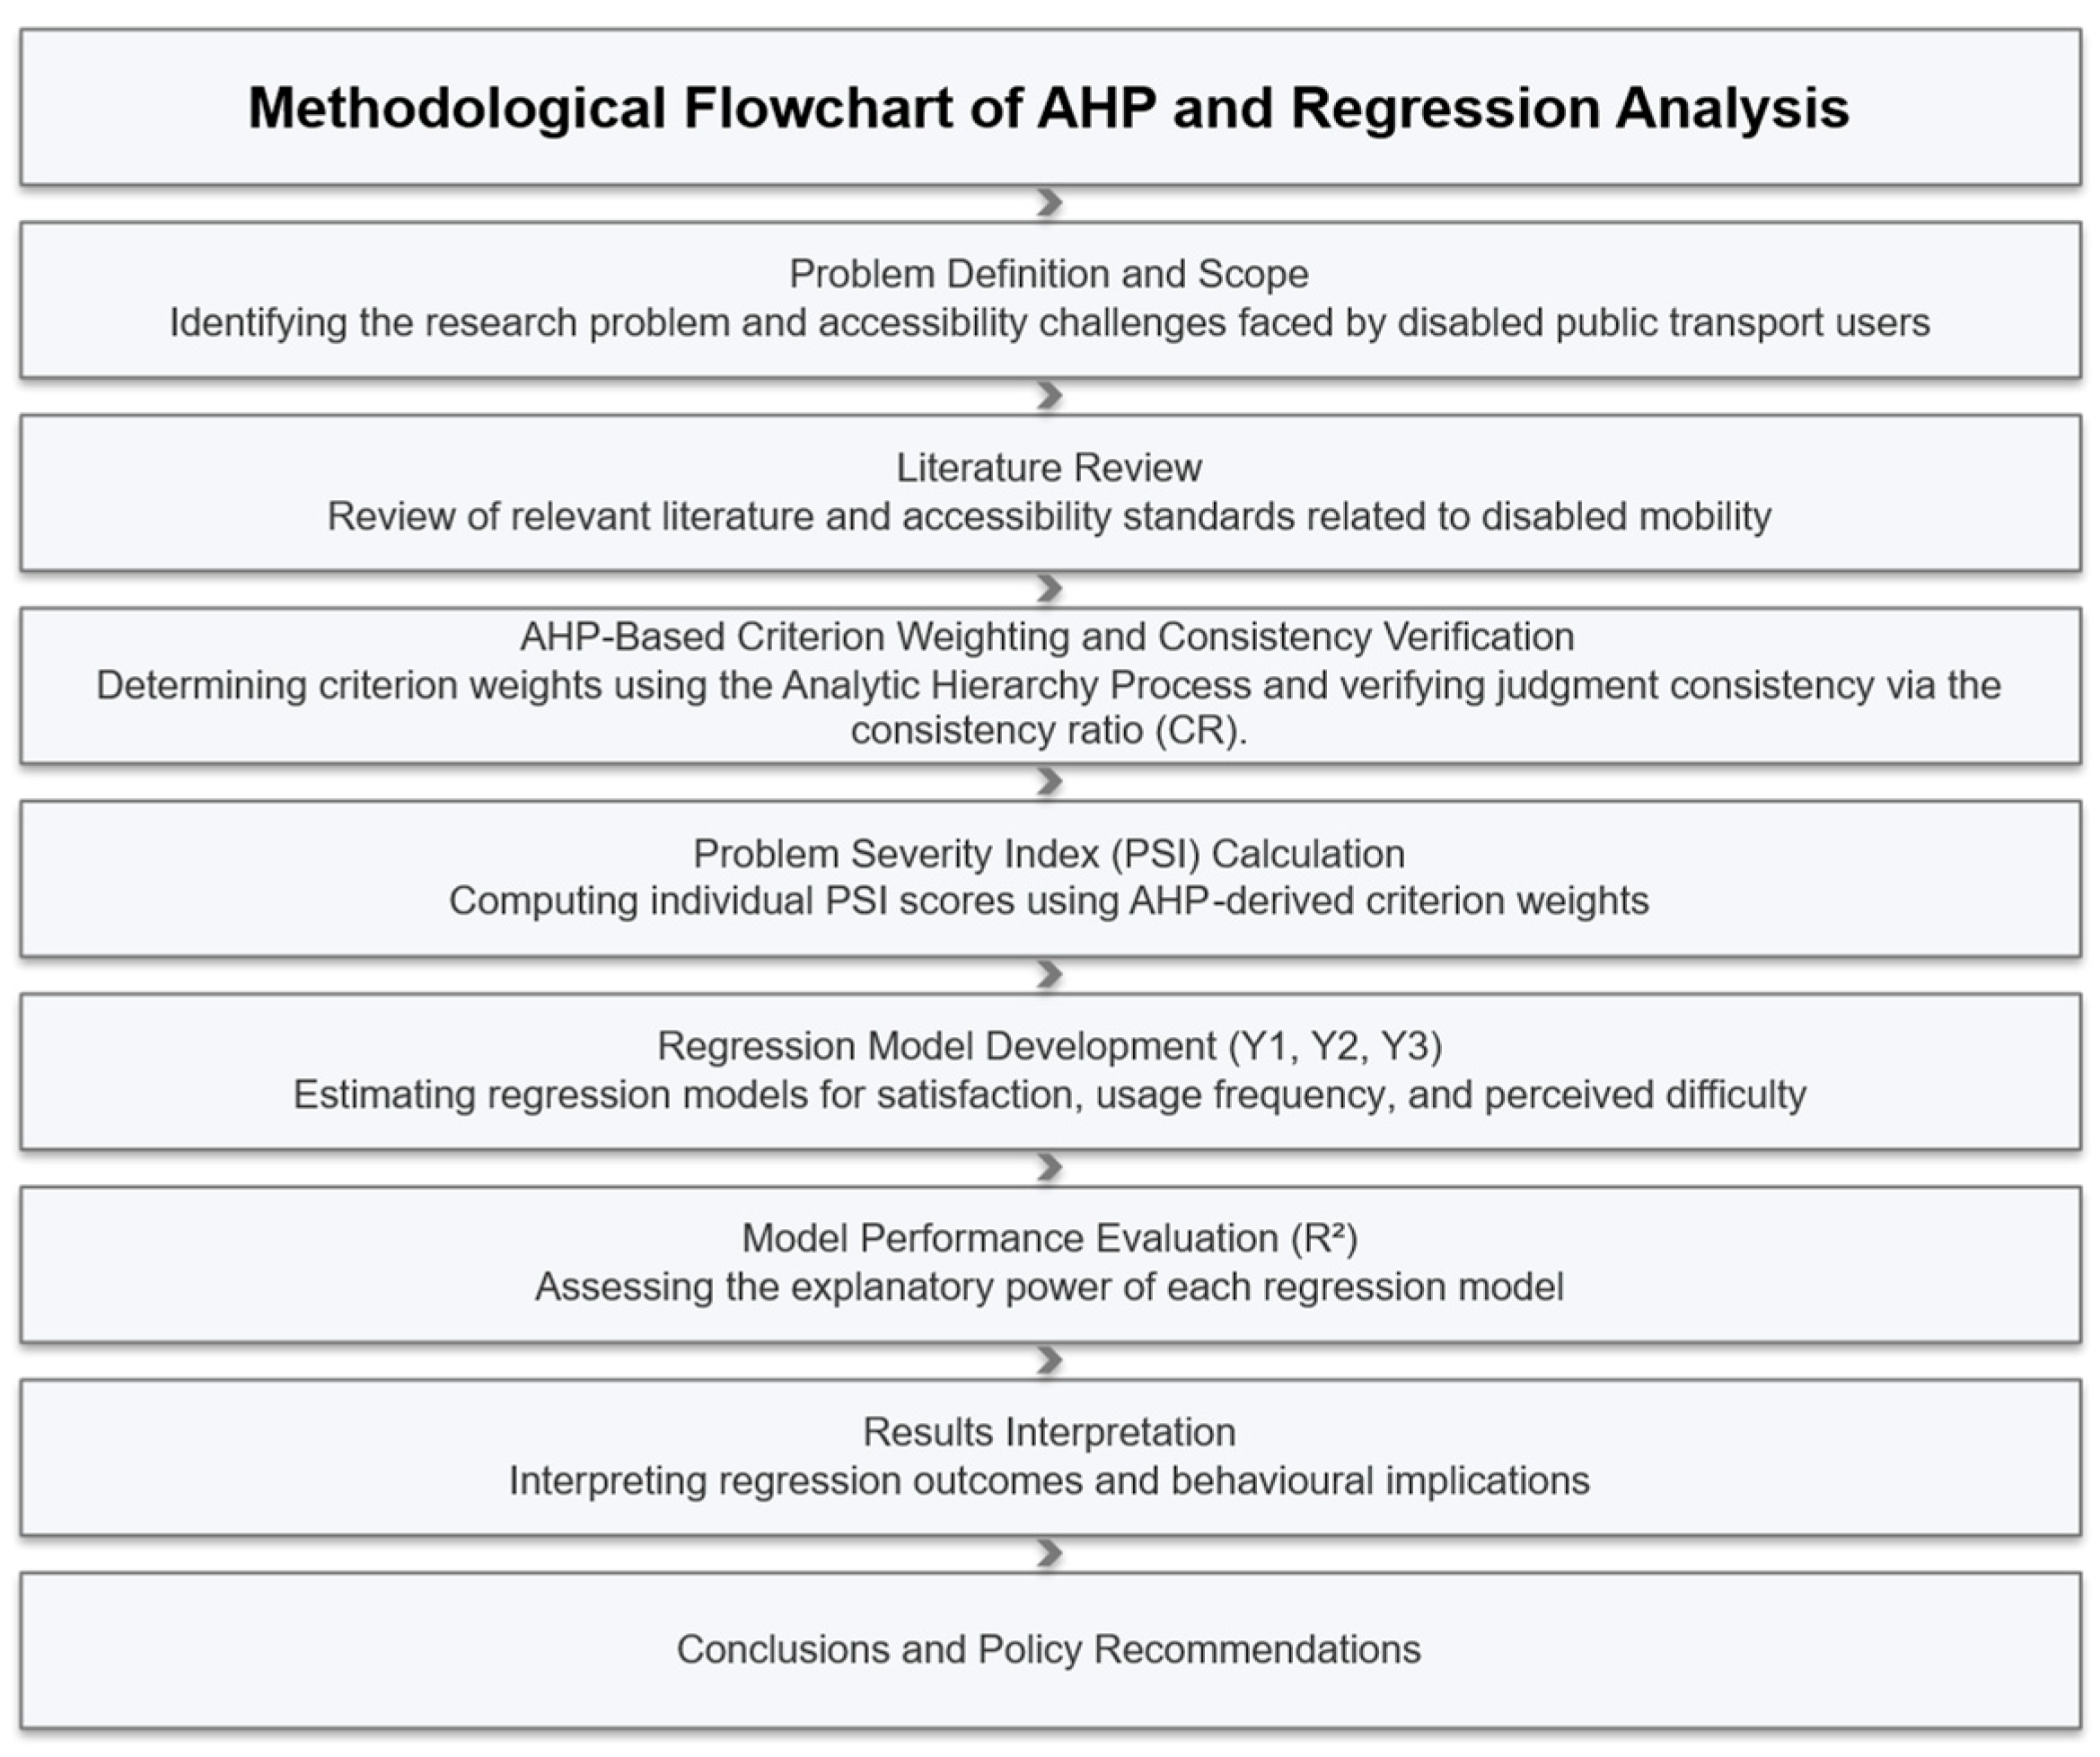
- It offers a transferable framework by combining AHP-derived criterion weights with a composite Problem Severity Index (PSI) and regression-based behavioral modeling, which can be replicated in other cities by re-estimating the weights and PSI using locally collected survey data.
3. Methods
3.1. Study Area
3.2. Participants and Data Collection
- bus stop conditions (Criterion A),
- accessibility equipment in vehicles (Criterion B),
- sidewalk slope (Criterion C),
- sidewalk surface quality (Criterion D),
- sidewalk width and curb height (i.e., the vertical level difference between the sidewalk and the carriageway, which directly affects step-free accessibility) (Criterion E),
- illegal roadside parking (Criterion F),
- intersection signalization (Criterion G).
3.3. Analytic Hierarchy Process (AHP)
3.4. Accessibility Index Development
3.5. Population and Sample Size Determination
- N = 3000 (population size)
- z = 1.96 (Z-value for 95% confidence level)
- p = 0.5 (maximum variability assumption)
- E = 0.05 (margin of error)
4. Results
AHP Results
- 1 = Very low severity
- 2 = Low severity
- 3 = Moderate severity
- 4 = High severity
- 5 = Very high severity
- 2 reflects importance between “equal” and “moderate,”
- 4 between “moderate” and “strong,”
- 6 between “strong” and “very strong,”
- 8 between “very strong” and “extreme.”
5. Integrating AHP Results with Regression Analysis
5.1. Independent Variable: Problem Severity Index (PSI)
5.2. Dependent Variables
- Y1 (Satisfaction): “How satisfied are you with public transport services?” (measured on a 1–5 Likert scale and converted to a 0–100 interval)
- Y2 (Usage Frequency): “How many times did you use public transport in the last month?” (measured on a 1–5 Likert scale and converted to a 0–100 interval)
- Y3 (Difficulty Perception): “How frequently do you experience difficulties while using public transport?” (measured on a 1–5 Likert scale, converted to a 0–100 interval). The original Likert-scale responses reflect the perceived severity of accessibility-related problems, where higher values correspond to greater perceived severity. Since the Likert scale was defined such that higher values represent greater problem severity, no reverse coding was applied. The original severity ratings were directly multiplied by the AHP-derived weights and aggregated to compute the Problem Severity Index (PSI), ensuring a consistent and interpretable severity measure. Higher PSI values therefore unambiguously indicate greater accessibility-related problem severity.
5.3. Regression Model
- -
- Yi: Dependent variable (satisfaction, usage frequency, or perceived difficulty)
- -
- PSIi: Independent variable
- -
- α: Intercept term
- -
- β: Slope coefficient representing the effect of the Problem Severity Index on the dependent variable
- -
- εi: Random error term
5.4. Example Calculation
5.5. Detailed Presentation of R2 Calculations for Regression Models
5.6. Path to R2: Computational Steps for Model 1 (Satisfaction)
5.7. Model 2: Effect of Problem Severity Index on Public Transport Use Frequency (Y2)
5.8. Model 3: Effect of Problem Severity Index on Perceived Difficulty (Y3)
6. Conclusions
7. Policy Implications and Recommendations
Author Contributions
Funding
Institutional Review Board Statement
Informed Consent Statement
Data Availability Statement
Acknowledgments
Conflicts of Interest
References
- United Nations. Convention on the Rights of Persons with Disabilities; United Nations: New York, NY, USA, 2006; Available online: https://www.un.org/development/desa/disabilities/convention-on-the-rights-of-persons-with-disabilities.html (accessed on 23 February 2026).
- World Health Organization. World Report on Disability; WHO Press: Geneva, Switzerland, 2011; Available online: https://www.who.int/publications/i/item/9789241564182 (accessed on 23 February 2026).
- Thompson, S.; Kent, J. Connecting and strengthening communities in places for health and well-being. Aust. Plan 2014, 51, 260–271. [Google Scholar] [CrossRef]
- Gleeson, B. Disability and the open city. Urban Stud. 2001, 38, 251–265. [Google Scholar] [CrossRef]
- Stjernborg, V. Accessibility for all in public transport and the overlooked social dimension—A case study of Stockholm. Sustainability 2019, 11, 4902. [Google Scholar] [CrossRef]
- Republic of Türkiye, Ministry of Family and Social Services. Disability Statistics Bulletin; Republic of Türkiye, Ministry of Family and Social Services: Ankara, Türkiye, 2022.
- Macioszek, E.; Świerk, P.; Granà, A.; Sobota, A. Application of a logit model to identify sociodemographic factors influencing the choice of public transport for daily trips—A case study based on the Górnośląska–Zagłębiowska Metropolis (Poland). Transp. Probl. 2024, 19, 15–28. [Google Scholar] [CrossRef]
- Al-Salih, W.Q.; Esztergár-Kiss, D. Linking Mode Choice with Travel Behavior by Using Logit Model Based on Utility Function. Sustainability 2021, 13, 4332. [Google Scholar] [CrossRef]
- Mwaka, C.R.; Best, K.L.; Gamache, S.; Gagnon, M.; Routhier, F. Public Transport Accessibility for People with Disabilities: Protocol for a Scoping Review. JMIR Res. Protoc. 2023, 12, e43188. [Google Scholar] [CrossRef] [PubMed]
- Hallgrimsdottir, B.; Wennberg, H.; Svensson, H.; Ståhl, A. Implementation of accessibility policy in municipal transport planning: Progression and regression in Sweden between 2004 and 2014. Transp. Policy 2016, 49, 196–205. [Google Scholar] [CrossRef]
- Imrie, R. Universal design and the problem of access for disabled people. Disabil. Rehabil. 2012, 34, 873–882. [Google Scholar] [CrossRef]
- Geurs, K.T.; Van Wee, B. Accessibility evaluation of land-use and transport strategies: Review and research directions. J. Transp. Geogr. 2004, 12, 127–140. [Google Scholar] [CrossRef]
- Páez, A.; Scott, D.M.; Morency, C. Measuring accessibility: Positive and normative implementations of various accessibility indicators. J. Transp. Geogr. 2012, 25, 141–153. [Google Scholar] [CrossRef]
- Handy, S. Regional versus local accessibility: Implications for nonwork travel. Transp. Res. Rec. 1993, 1400, 58–66. [Google Scholar]
- Curtis, C.; Scheurer, J. Planning for sustainable accessibility: Developing tools to aid discussion and decision-making. Prog. Plan. 2010, 74, 53–106. [Google Scholar] [CrossRef]
- Colmenero-Fonseca, F.; Fonce-Segura, C.D.; Guzmán-Ramírez, A.; Flores-García, M. Sustainable public transport service adapted for people with disabilities and reduced mobility. Sustainability 2021, 13, 7471. [Google Scholar] [CrossRef]
- Eboli, L.; Mazzulla, G. A new customer satisfaction index for evaluating transit service quality. J. Public Transp. 2009, 12, 21–37. [Google Scholar] [CrossRef]
- Redman, L.; Friman, M.; Gärling, T.; Hartig, T. Quality attributes of public transport that attract car users: A research review. Transp. Policy 2013, 25, 119–127. [Google Scholar] [CrossRef]
- Mwaka, C.R.; Best, K.L.; Cunningham, C.; Gagnon, M.; Routhier, F. Barriers and facilitators of public transport use among people with disabilities: A scoping review. Front. Rehabil. Sci. 2024, 4, 1336514. [Google Scholar] [CrossRef]
- Mogaji, E.; Bosah, G.; Nguyen, P. Transport and mobility decisions of consumers with disabilities. J. Consum. Behav. 2022, 21, 422–438. [Google Scholar] [CrossRef]
- Alharbi, F.; Alshammari, A.; Almoshaogeh, M.; Jamal, A.; Haider, H. User perception-based optimal route selection for vehicles of disabled persons in urban centers of Saudi Arabia. Appl. Sci. 2024, 14, 10289. [Google Scholar] [CrossRef]
- Lee, E.H.; Lee, E. Iterative DEA for public transport transfer efficiency in a super-aging society. Cities 2025, 162, 105957. [Google Scholar] [CrossRef]
- Lee, E.H.; Jeong, J. Assessing equity of vertical transport system installation in subway stations for mobility handicapped using data envelopment analysis. J. Public Transp. 2023, 25, 100074. [Google Scholar] [CrossRef]
- Akın, D.; Çolak, E. Evaluation of the problems encountered by individuals with disabilities in public transportation in Turkey. J. Transp. Sci. 2019, 15, 155–170. (In Turkish) [Google Scholar]
- Kuklina, M.; Dirin, D.; Filippova, V.; Savvinova, A.; Trufanov, A.; Krasnoshtanova, N.; Bogdanov, V.; Kobylkin, D.; Fedorova, A.; Itegelova, A.; et al. Transport accessibility and tourism development: A sustainability perspective. Sustainability 2022, 14, 1750. [Google Scholar] [CrossRef]
- Ghorbanzadeh, O.; Moslem, S.; Blaschke, T.; Duleba, S. Sustainable urban transport planning considering different stakeholder groups by an interval-AHP approach. Sustainability 2018, 11, 9. [Google Scholar] [CrossRef]
- Church, A.; Frost, M.; Sullivan, K. Transport and social exclusion in London. Transp. Policy 2000, 7, 195–205. [Google Scholar] [CrossRef]
- Prideaux, B. The role of the transport system in destination development. Tour. Manag. 2000, 21, 53–63. [Google Scholar] [CrossRef]
- Pucher, J.; Buehler, R. City Cycling; MIT Press: Cambridge, MA, USA, 2012. [Google Scholar]
- Gössling, S.; Scott, D.; Hall, C.M. Transport and Tourism: Global Perspectives. Tour. Manag. 2018, 59, 1–12. [Google Scholar]
- Alanya Municipality. Alanya Disability Database Project. Available online: https://herkesicinalanya.org/projeler/2/alanya-engelli-veritabani-projesi (accessed on 23 February 2026).
- Saaty, T.L. The Analytic Hierarchy Process; McGraw–Hill: New York, NY, USA, 1980. [Google Scholar]
- Ishizaka, A.; Labib, A. Review of the main developments in the analytic hierarchy process. Expert Syst. Appl. 2011, 38, 14336–14345. [Google Scholar] [CrossRef]
- Ho, W.; Ma, X. The state-of-the-art integrations and applications of the analytic hierarchy process. Eur. J. Oper. Res. 2018, 267, 399–414. [Google Scholar] [CrossRef]
- Triantaphyllou, E.; Mann, S.H. Using the analytic hierarchy process for decision making in engineering applications. Int. J. Ind. Eng. Appl. Pract. 1995, 2, 35–44. [Google Scholar]
- Velasquez, M.; Hester, P.T. An analysis of multi-criteria decision making methods. Int. J. Oper. Res. 2013, 10, 56–66. [Google Scholar]
- Hensher, D.A. Customer service quality and benchmarking in public transport contracts. Int. J. Qual. Innov. 2015, 1, 4. [Google Scholar] [CrossRef]



| Disability Type | Male (n = 336) | Female (n = 114) | Total |
|---|---|---|---|
| Visual impairment | 84 | 49 | 133 |
| Hearing impairment | 90 | 17 | 107 |
| Physical disability | 148 | 37 | 185 |
| Speech and language impairment | 14 | 11 | 25 |
| Total | 336 | 114 | 450 |
| A | B | C | D | E | F | G | |
|---|---|---|---|---|---|---|---|
| A | 1.00 | 1.00 | 3.00 | 9.00 | 7.00 | 7.00 | 1.00 |
| B | 1.00 | 1.00 | 1.00 | 5.00 | 9.00 | 9.00 | 1.00 |
| C | 0.33 | 1.00 | 1.00 | 1.00 | 9.00 | 7.00 | 1.00 |
| D | 0.11 | 0.20 | 1.00 | 1.00 | 3.00 | 1.00 | 1.00 |
| E | 0.14 | 0.11 | 0.11 | 0.33 | 1.00 | 0.33 | 0.33 |
| F | 0.14 | 0.11 | 0.14 | 1.00 | 3.00 | 1.00 | 0.33 |
| G | 1.00 | 1.00 | 1.00 | 1.00 | 3.00 | 3.00 | 1.00 |
| TOTAL | 3.73 | 4.42 | 7.25 | 18.33 | 35.00 | 28.33 | 5.67 |
| A | B | C | D | E | F | G | Total | Total/7 | |
|---|---|---|---|---|---|---|---|---|---|
| A | 0.26 | 0.22 | 0.41 | 0.49 | 0.20 | 0.25 | 0.18 | 2.02 | 0.29 |
| B | 0.27 | 0.22 | 0.13 | 0.27 | 0.26 | 0.32 | 0.18 | 1.66 | 0.24 |
| C | 0.09 | 0.22 | 0.13 | 0.05 | 0.26 | 0.25 | 0.18 | 1.19 | 0.17 |
| D | 0.02 | 0.04 | 0.13 | 0.05 | 0.09 | 0.04 | 0.18 | 0.56 | 0.08 |
| E | 0.03 | 0.02 | 0.01 | 0.01 | 0.02 | 0.01 | 0.06 | 0.20 | 0.03 |
| F | 0.03 | 0.02 | 0.01 | 0.05 | 0.08 | 0.03 | 0.05 | 0.32 | 0.05 |
| G | 0.26 | 0.22 | 0.13 | 0.05 | 0.08 | 0.10 | 0.17 | 1.05 | 0.15 |
| 1.00 |
| Model | Dependent Variable | Intercept (α) | PSI Coefficient (β) | R2 | Interpretation |
|---|---|---|---|---|---|
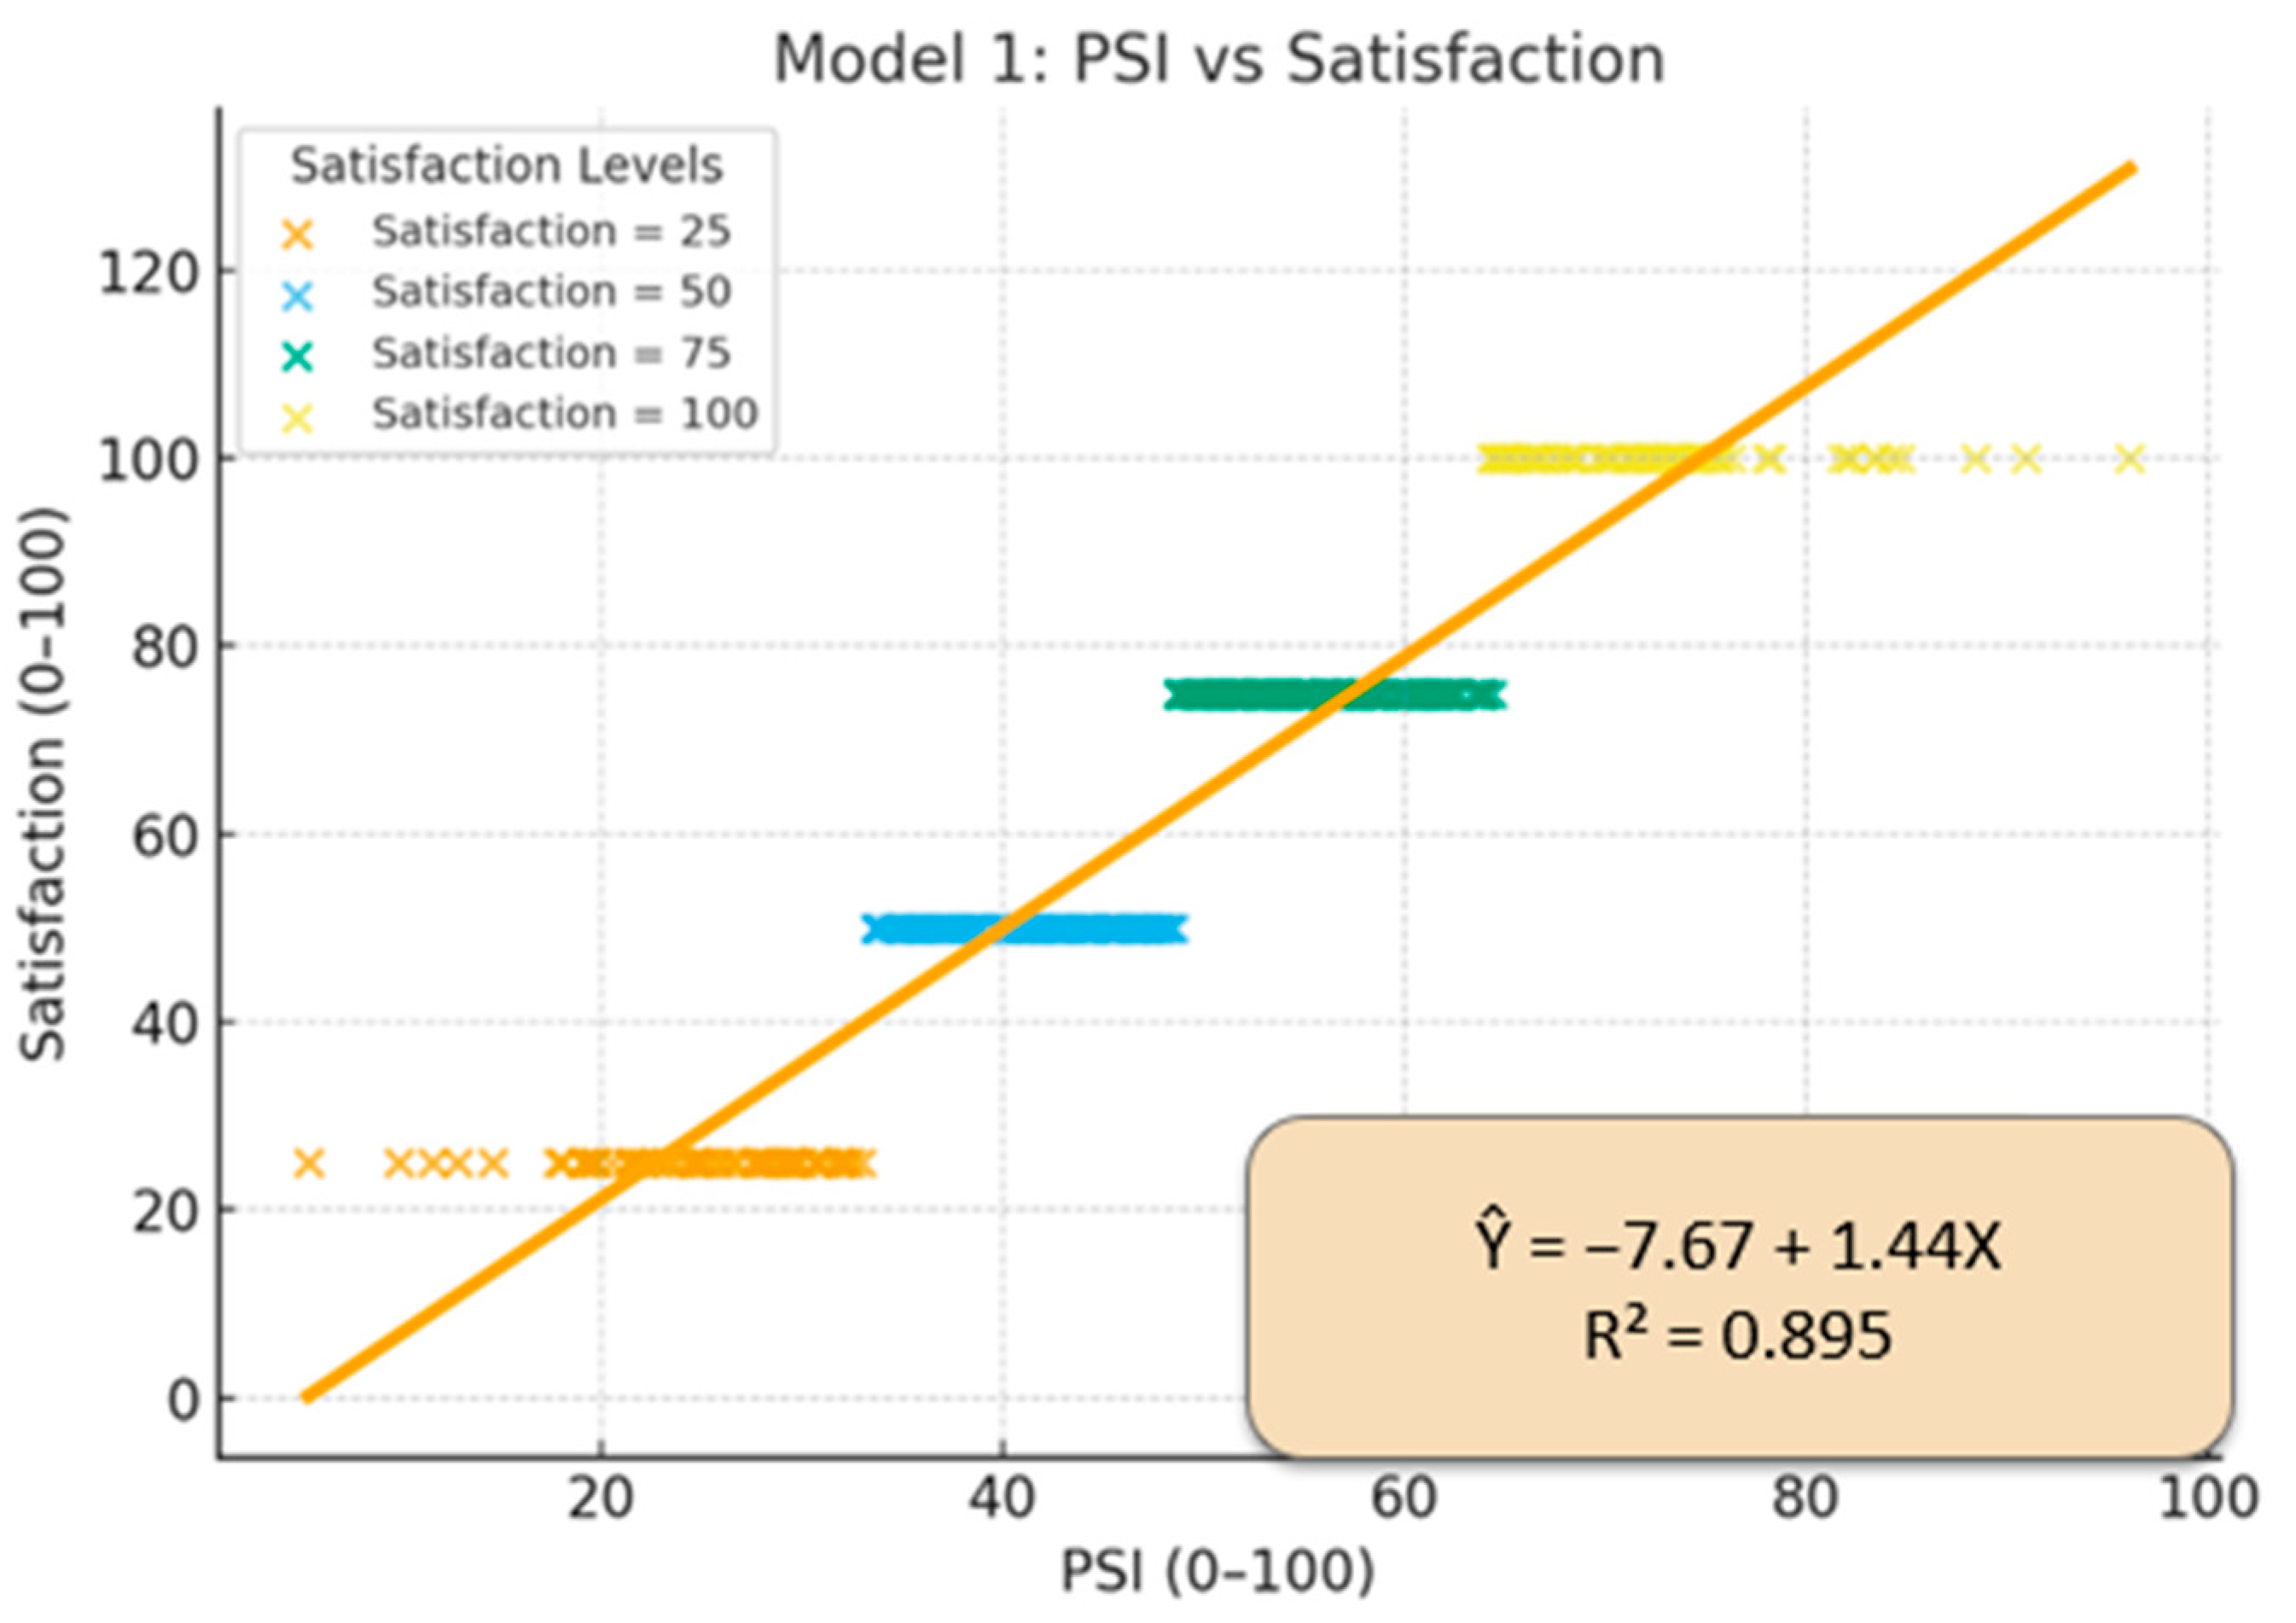
| Model 1 | Satisfaction (Y1) | −7.67 | 1.44 | 0.895 | Higher problem severity is associated with higher reported satisfaction scores, reflecting constrained choice and increased dependence on public transport despite accessibility barriers. |
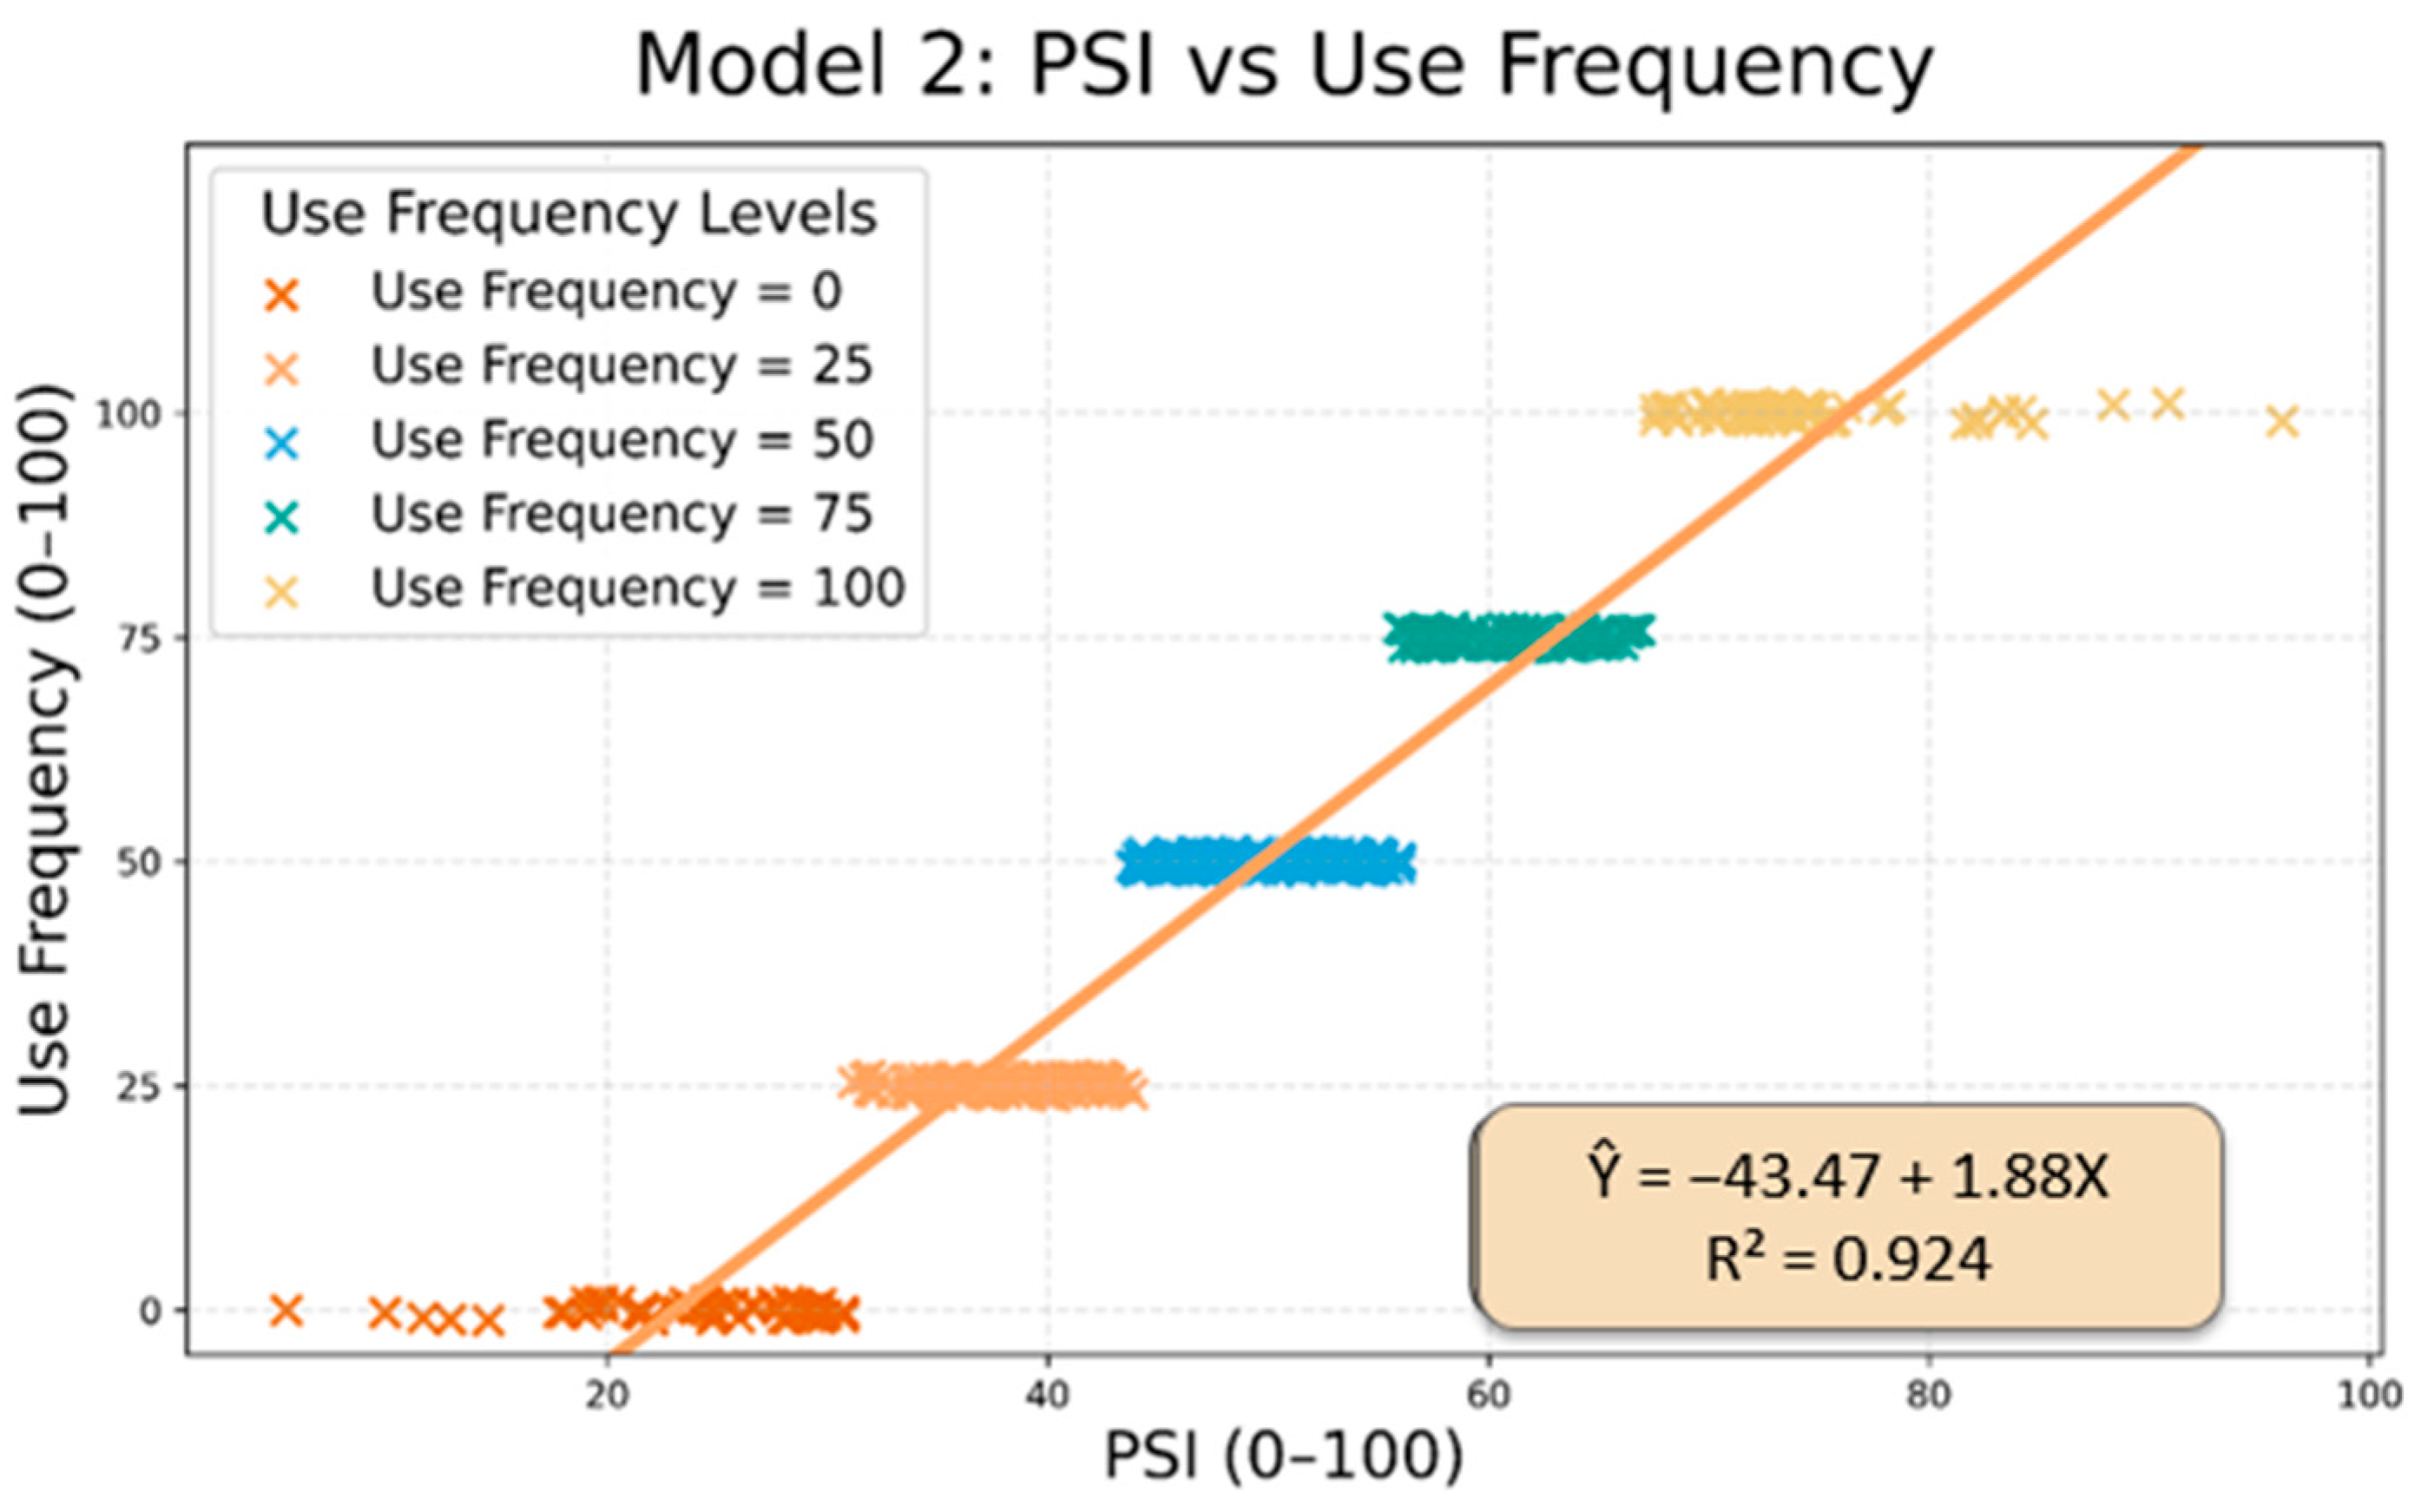
| Model 2 | Use Frequency (Y2) | −43.47 | 1.88 | 0.924 | Problem severity strongly increases public transport usage frequency, indicating captive-user dependence and reliance on public transport under constrained mobility conditions. |
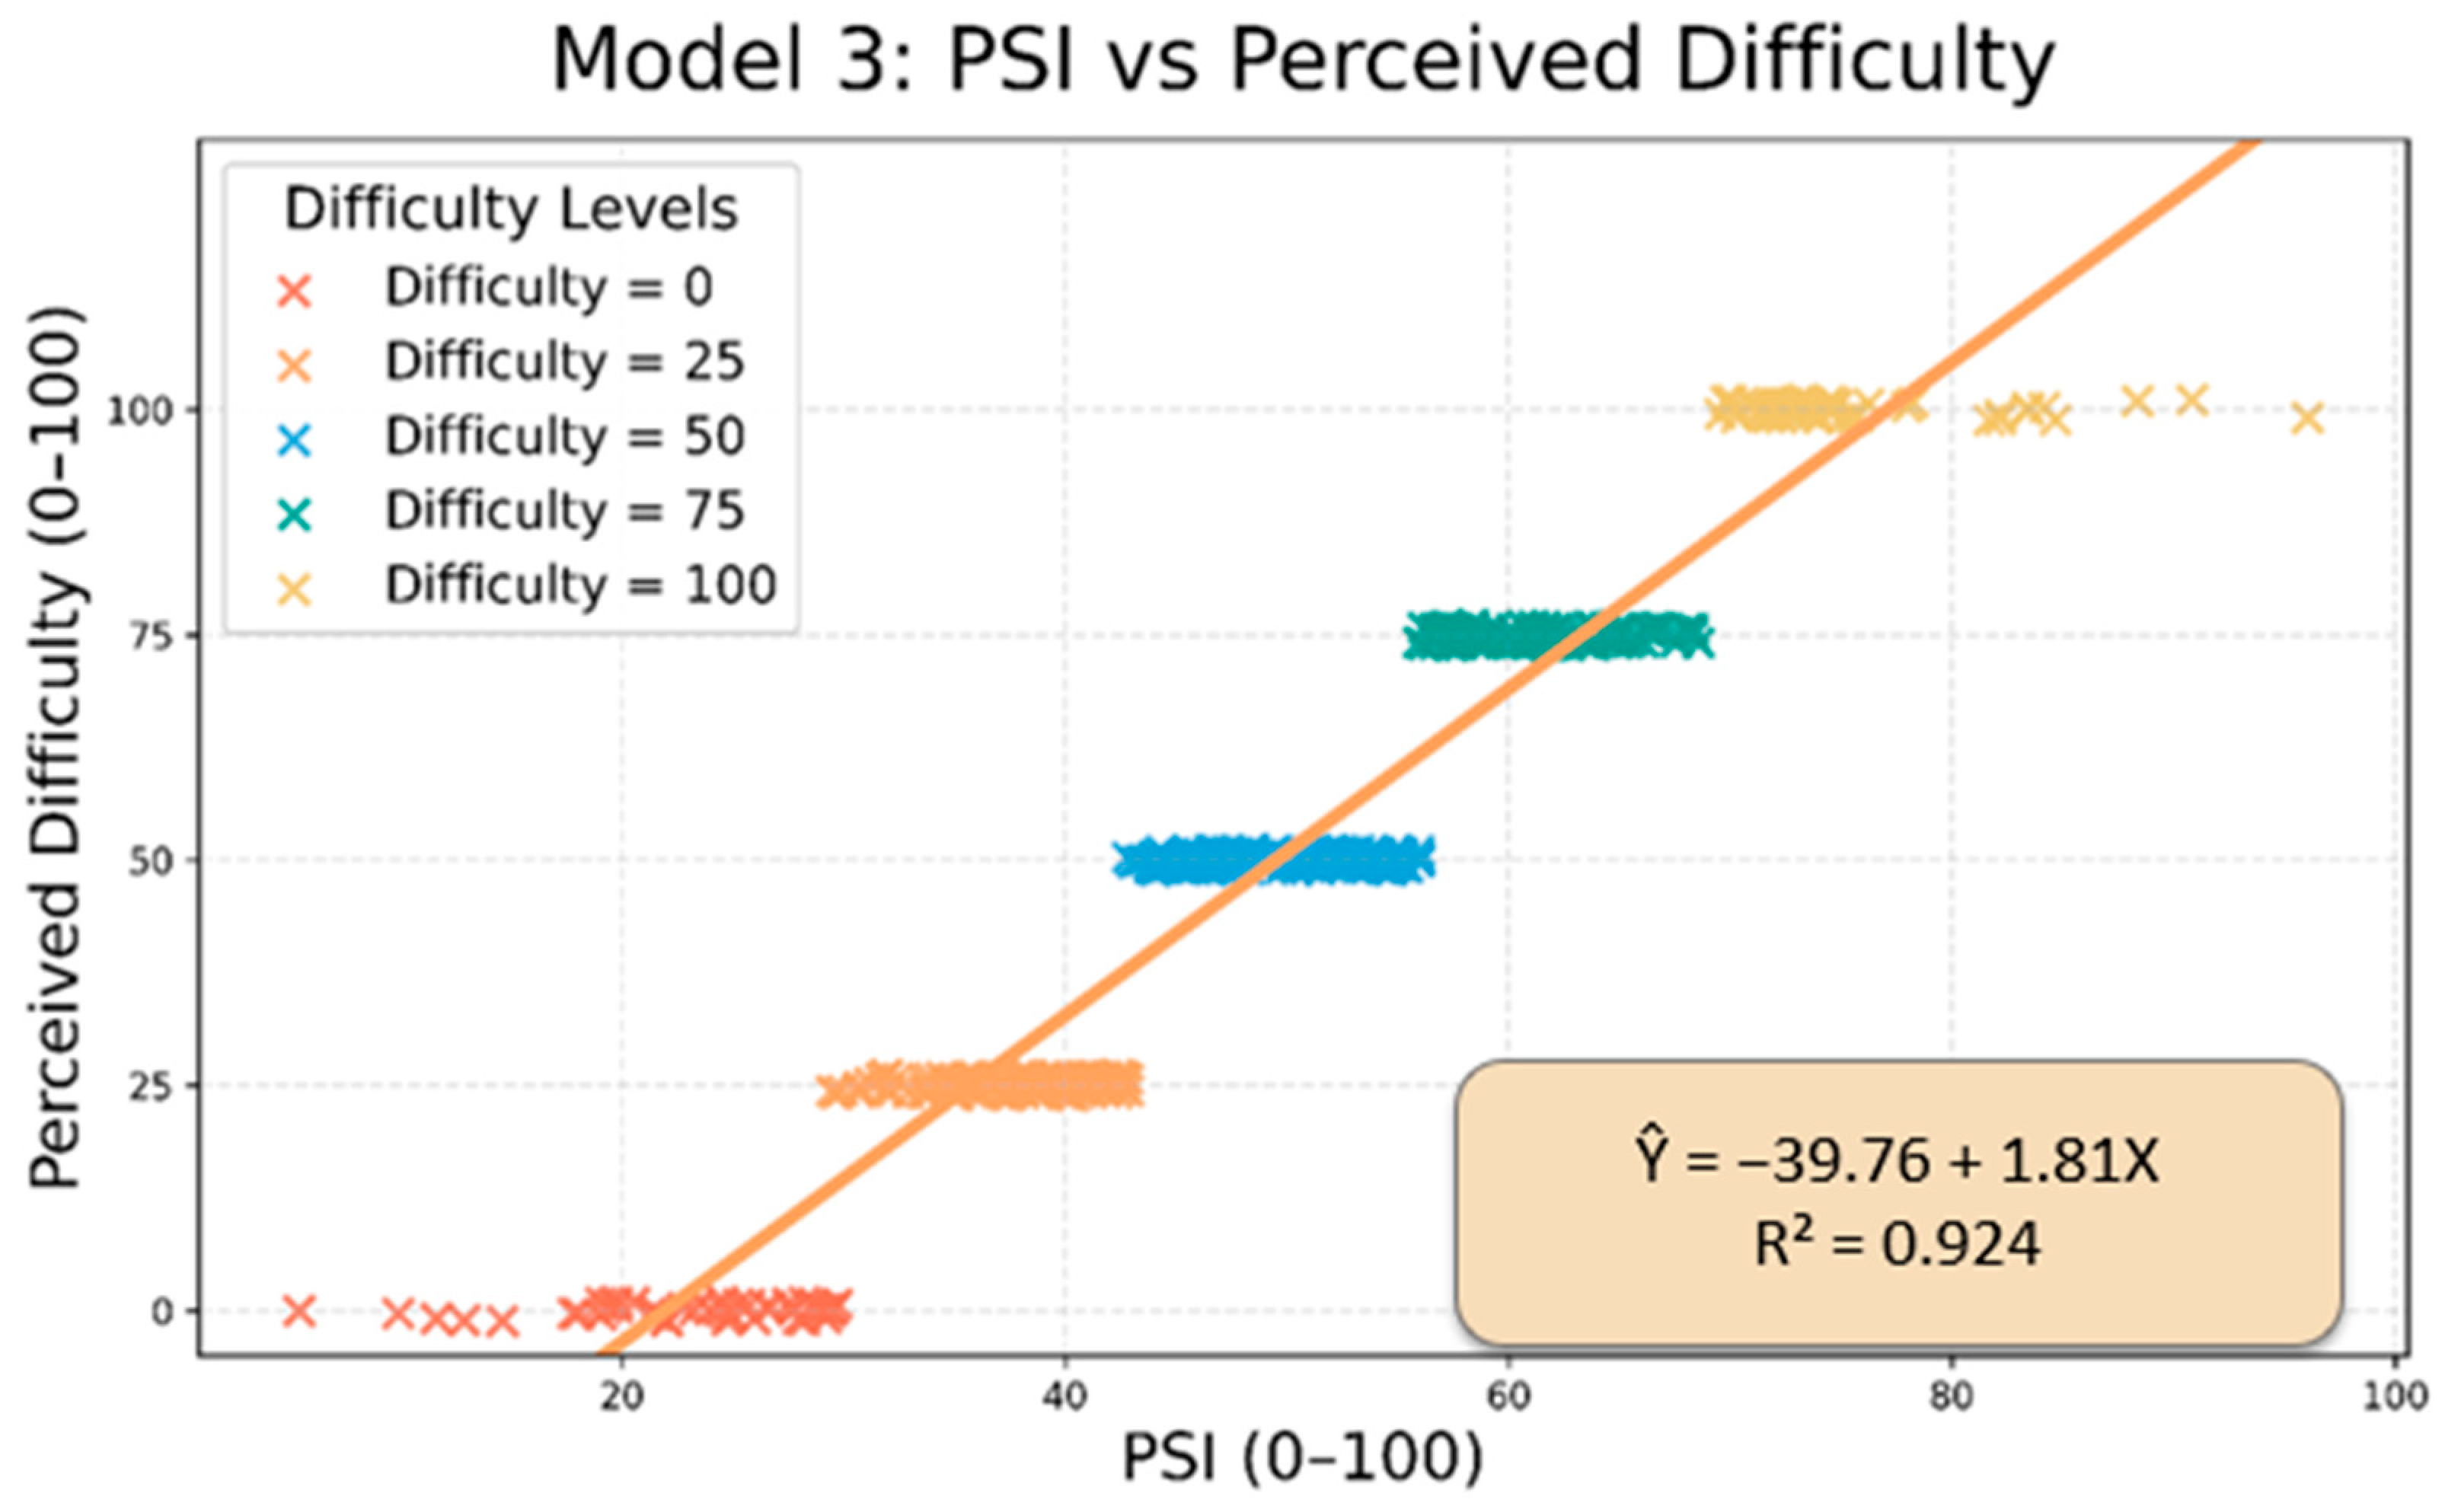
| Model 3 | Perceived Difficulty (Y3) | −42.76 | 1.88 | 0.924 | Increased problem severity significantly elevates perceived difficulty during public transport use. |
Disclaimer/Publisher’s Note: The statements, opinions and data contained in all publications are solely those of the individual author(s) and contributor(s) and not of MDPI and/or the editor(s). MDPI and/or the editor(s) disclaim responsibility for any injury to people or property resulting from any ideas, methods, instructions or products referred to in the content. |
© 2026 by the authors. Licensee MDPI, Basel, Switzerland. This article is an open access article distributed under the terms and conditions of the Creative Commons Attribution (CC BY) license.
Share and Cite
Karaca, M.; Yalınız, P. Accessibility Barriers in Urban Public Transport for Disabled Users: An AHP-Based Severity Index and Behavioral Regression Analysis. Sustainability 2026, 18, 3299. https://doi.org/10.3390/su18073299
Karaca M, Yalınız P. Accessibility Barriers in Urban Public Transport for Disabled Users: An AHP-Based Severity Index and Behavioral Regression Analysis. Sustainability. 2026; 18(7):3299. https://doi.org/10.3390/su18073299
Chicago/Turabian StyleKaraca, Muhammet, and Polat Yalınız. 2026. "Accessibility Barriers in Urban Public Transport for Disabled Users: An AHP-Based Severity Index and Behavioral Regression Analysis" Sustainability 18, no. 7: 3299. https://doi.org/10.3390/su18073299
APA StyleKaraca, M., & Yalınız, P. (2026). Accessibility Barriers in Urban Public Transport for Disabled Users: An AHP-Based Severity Index and Behavioral Regression Analysis. Sustainability, 18(7), 3299. https://doi.org/10.3390/su18073299