Article

How Can Supply Chain Management Drive Enterprises’ Low-Carbon Transformation: Evidence from the Supply Chain Innovation and Application Pilot Program in China

1
School of International Trade and Economics, Central University of Finance and Economics, Beijing 100081, China
2
School of Marxism, Central University of Finance and Economics, Beijing 100081, China
3
School of Management Science & Real Estate, Chongqing University, Chongqing 400044, China
*
Author to whom correspondence should be addressed.
Sustainability 2026, 18(7), 3221; https://doi.org/10.3390/su18073221
Submission received: 15 January 2026 / Revised: 18 March 2026 / Accepted: 19 March 2026 / Published: 25 March 2026

Abstract

Under the strategic constraints of global carbon emission targets, how supply chain management can effectively drive enterprises’ low-carbon transformation has become an important issue. Based on China’s Supply Chain Innovation and Application Pilot Program (SCIAPP), this paper approaches it as a quasi-natural experiment to empirically investigate how supply chain management affects enterprises’ low-carbon technological innovation (LCTI). This paper uses the data from publicly listed companies in China. and the difference-in-differences approach to empirically test the policy effect of SCIAPP and determine its influencing path. The study finds that first, SCIAPP significantly enhances enterprises’ LCTI level by approximately 14.2%. Second, SCIAPP mainly achieves this through three mechanisms, including strengthening enterprises’ green management, promoting digital transformation, and improving operational efficiency. Third, the impact effect is stronger in enterprises with more robust environmental management systems, fewer financing constraints and higher capital intensity. Additionally, the LCTI driven by SCIAPP can further positively impact the supply chain resilience. This study innovatively incorporates pilot policies, supply chain management, and LCTI for analysis, providing theoretical evidence and empirical support for the government to optimize supply chain governance and achieve climate goals.

1. Introduction

Modern supply chains have become the main artery of the global economy, profoundly shaping the production, circulation, and consumption patterns. The global trade of intermediate goods, which refers to the trade of goods used for the production of other goods, accounted for approximately 48.5% of the global trade volume in 2023, maintaining a relatively high level overall, reflecting the deep integration of global supply chains. In 2022, China’s total social logistics volume reached 34.76 trillion yuan, underscoring its scale as a cornerstone of economic activity. Efficient supply chain management can significantly reduce enterprise operating costs, shorten product launch cycles, and enhance customer response speed. Moreover, in recent years, geopolitical conflicts, the COVID-19 pandemic, and other emergencies have repeatedly impacted global supply chain networks, highlighting their strategic security attributes. Resilient supply chains that can quickly reconfigure and respond flexibly are crucial for ensuring the supply of key materials and maintaining the continuous operation of industries, and have become a core concern of industrial policies of various countries.
Alongside its role in supporting economic expansion, the supply chain has gradually become a critical locus of energy consumption and carbon emissions. As stated in the International Energy Agency’s (IEA) World Energy Outlook, the freight transportation and industrial processing stages, which constitute the core operational components of the supply chain, account for a significant portion of global emissions. In particular, logistics-related activities alone contribute close to one-tenth of total global carbon emissions, underscoring the environmental externalities embedded in modern supply chain systems. Specifically in the logistics aspect, global logistics transportation accounts for approximately 10% of the global total emissions. Further, according to the report Strengthening the Chain: Industry Insights to Accelerate Sustainable Supply Chain Transformation by the Carbon Disclosure Project (CDP), the supply chain emissions at the enterprise level (Scope 3) are on average 26 times that of operational emissions (Scope 1 and Scope 2).
Enterprises must convey transparency and actions at all levels of the supply chain to mitigate environmental effects and prepare for the future of their businesses. As the global manufacturing hub, China’s large-scale production and logistics system makes the issue of carbon emissions in supply chains particularly salient. The transition to a low-carbon supply chain is not only the core for addressing the climate crisis and fulfilling environmental responsibilities, but also a strategic measure for enterprises to cope with increasingly tightened carbon regulations, meet green product requirements, and gain long-term competitive advantages.
Against this background, prior research has increasingly examined how supply chain structures and management practices adapt to low-carbon development requirements. Firstly, some studies have begun to construct a multi-dimensional assessment system for low-carbon supply chains [1,2]. On this basis, existing literature widely utilizes game theory models to examine the effects of carbon policies, consumer preferences, and interactions among supply chain members on emission reduction decisions [3,4,5]. Additionally, existing literature also extensively explores low-carbon production technologies [6] and typical digital technologies [7,8], which promote emission reduction collaboration by enhancing transparency and optimizing decision-making.
Although the research results are abundant, they still have obvious limitations. Firstly, most of the studies rely on theoretical modeling and numerical simulation, resulting in the lack of support from real evidence for the universality and robustness of their conclusions in complex real-world scenarios. Secondly, the existing studies mostly focus on the micro-gameplay among internal members of the supply chain or the effect analysis of a single policy, failing to integrate the macro national industrial policies, the meso supply chain network reconfiguration, and the micro enterprise management practices in an organic way. At the same time, as a typical emerging economy, China lacks causal evidence and in-depth analysis on how to drive low-carbon transformation through systematic management innovation at the supply chain level.
This study aims to address this key question from the perspective of Chinese enterprises’ innovation: How does supply chain management drive its low-carbon transformation? Specifically, we focus on whether and how supply chain management can and will promote enterprises’ low-carbon technological innovation (LCTI). The motivation for addressing this issue lies in the fact that, on the one hand, the realization of China’s carbon emission goals urgently requires finding effective emission reduction paths throughout the industrial chain and supply chain. On the other hand, relevant research needs to go beyond single model assumptions and test the driving effect of supply chain management practices on LCTI in real policy intervention scenarios.
The Supply Chain Innovation and Application Pilot Program (SCIAPP) of China provides an excellent quasi-natural experiment scenario for this purpose. It actively advocates the full greenness of the supply chain, providing a clear policy shock for the research. Specifically, we consider SCIAPP as a quasi-experimental approach. By using trial enterprises and non-pilot enterprises as experimental group and comparison group, respectively, we apply the difference-in-differences (DID) technique to conduct an empirical analysis of how systematic improvement of supply chain management can substantially catalyze LCTI from the perspective of micro enterprises.
Based on the legitimacy theory [9] and the dynamic capabilities theory [10], this paper constructs a conceptual framework for policy-driven supply chain management upgrade to promote LCTI. This study holds that the SCIAPP can enhance environmental perception through green management, strengthen resource integration and risk mitigation through digital management, and release collaboration and transformation capabilities through efficient management.
Specifically, first, the SCIAPP requires pilot enterprises to be guided by green development throughout the entire process, entire chain, and entire link, to prioritize the purchase of environmental protection products and equipment, and to promote the establishment of reverse logistics systems. This creates direct demand and implementation scenarios for research and application of carbon-reducing technologies. Second, the SCIAPP encourages trial enterprises to implement modern information technologies to innovate supply chain technologies. Digitalization enhances supply chain transparency and risk identification, enabling enterprises to track carbon footprints more accurately and providing impetus for the advancement of carbon-efficient digital technologies. Third, the SCIAPP prompts enterprises to achieve cost reduction and efficiency improvement through supply chain collaboration integration. Efficiency improvement not only saves resources and energy but also transforms and invests financial and management resources into the ability and willingness to innovate low-carbon technologies.
This research makes some important marginal contributions. First, this study integrates the legitimacy theory with the dynamic capabilities theory to construct a complete theoretical framework and analyze the SCIAPP. While existing studies have examined policy drivers using game-theoretic approaches [3,5,11] or focused on single technologies such as blockchain [7], they largely treat external pressures and internal capabilities in isolation. Our framework bridges this gap by revealing how SCIAPP converts legitimacy pressure into explicit demands and resource support, enabling firms to develop the dynamic capabilities necessary for substantive LCTI. This integrated perspective advances understanding of how firms navigate complex institutional environments to achieve green strategic transformation. In addition, our approach complements recent work applying dynamic capabilities theory to digital transformation [12,13] by explicitly modeling how policy interventions systematically shape capability development through three distinct pathways, including green orientation, digitalization, and efficiency enhancement, rather than treating capability building as an undifferentiated process.
Second, this paper establishes and validates a comprehensive mechanism model that moves beyond fragmented analyses of individual factors. Prior research has examined low-carbon technologies in specific contexts [6,14], digital empowerment through tools like blockchain [7,8], or coordination contracts [4,11], but lacks a systematic analysis of how supply chain management as an integrated capability drives LCTI. Specifically, we explicitly propose and empirically test three core management pathways through which SCIAPP operates. While Lin et al. (2025) [12] demonstrate that digital technology adoption enhances carbon performance through adaptive, absorptive, and innovative capabilities, and Yang et al. (2025) [13] show that supply chain digitization promotes low-carbon transformation via similar dynamic capabilities, our study advances this line of inquiry by revealing the specific mechanisms, including greenification, digitalization, and efficiency enhancement, through which a comprehensive supply chain policy simultaneously activates these capability-building processes. This triple-mechanism framework provides a more nuanced understanding of how policy interventions can be holistically designed to build firms’ dynamic capabilities across multiple dimensions.
Third, we have moved from theoretical modeling to policy-driven empirical testing, providing causal evidence from the Chinese context and more universally applicable reference suggestions. While prior studies predominantly employ game theory and optimization models for theoretical deductions [3,5], we leverage large-scale enterprise panel data and DID methodology to establish causal effects. Moreover, unlike prior studies often confined to single-industry cases such as automobiles [11], agriculture [5], or construction [14], our multi-industry sample ensures that findings possess broader representativeness. Further, by demonstrating how LCTI subsequently enhances supply chain resilience through green and digital pathways, resonating with Lin et al. (2025) [12] and Yang et al. (2025) [13], we extend the analysis to reveal the complete “policy-innovation-resilience” transmission chain. At the same time, this research also holds significant reference value for the low-carbon transformation of supply chains in other countries, especially developing countries.
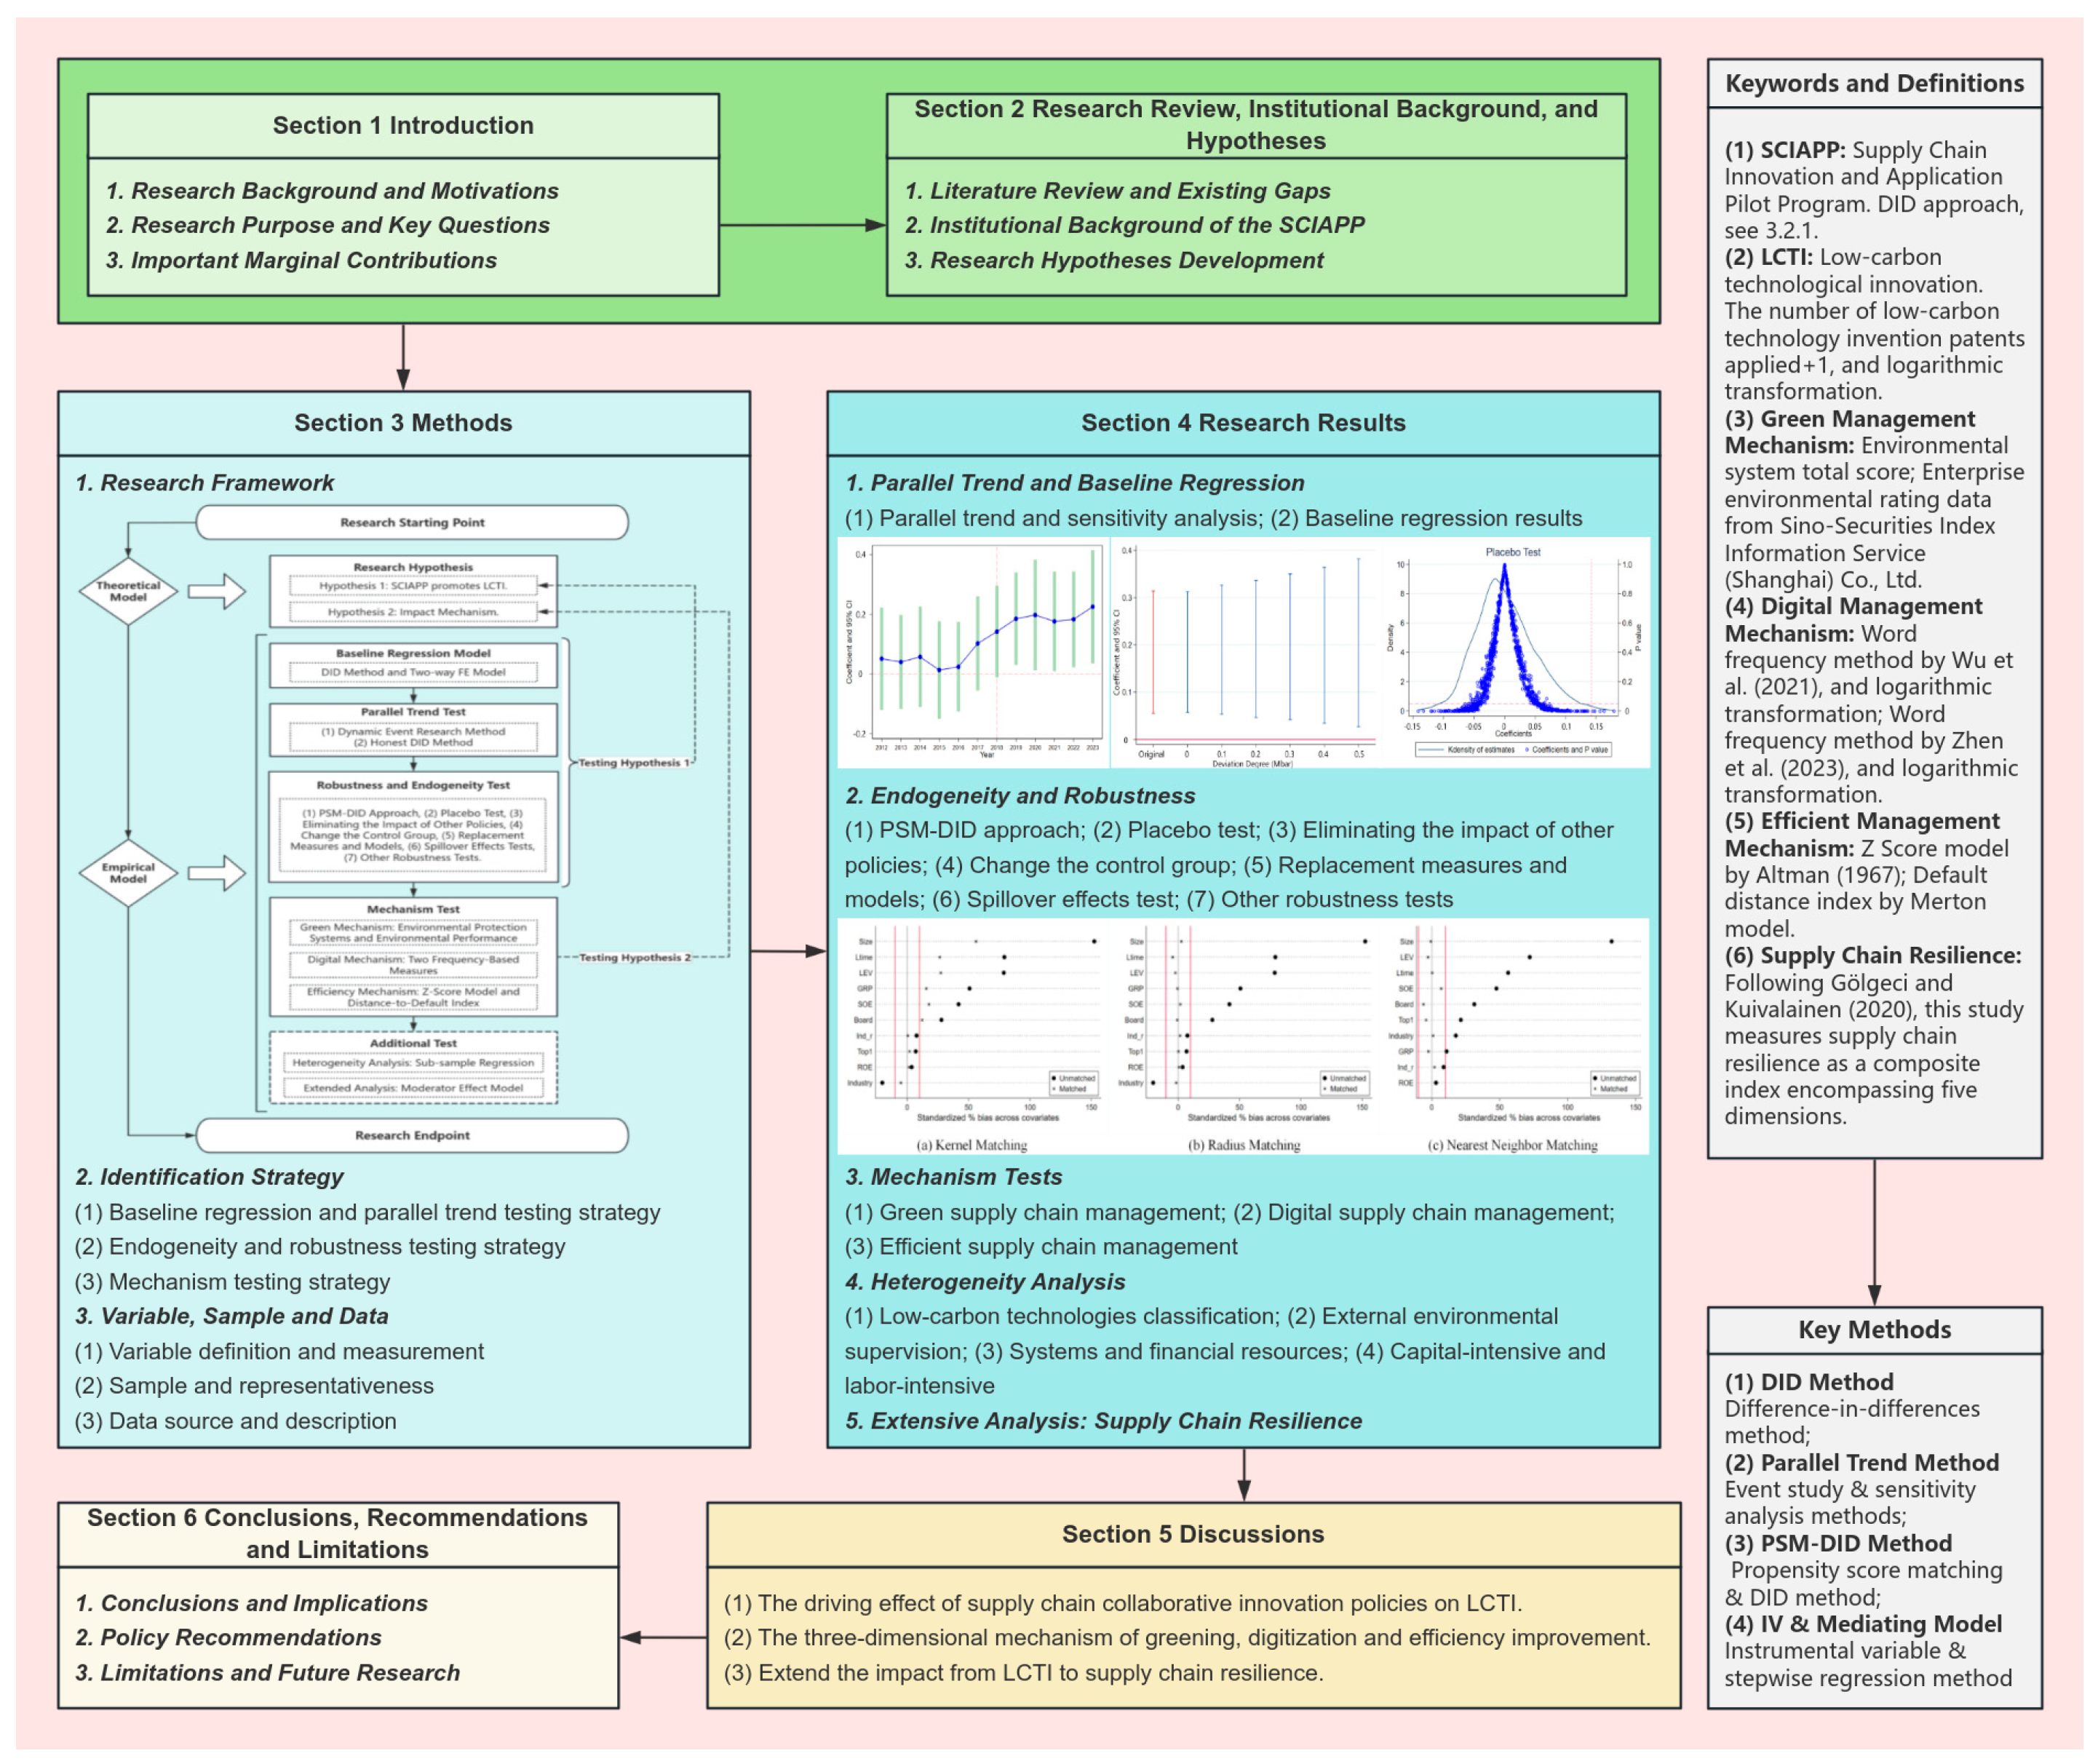
Figure 1 summarizes the structure and content of the entire paper. The remaining sections of this paper are structured as follows. Section 2 reviews the relevant literature, introduces the institutional background and formulates the hypotheses. Section 3 describes the methods, including the research framework, identification strategies, variables, sample, and data. Section 4 presents the parallel trends and baseline regression results, endogeneity and robustness test results, mechanism test results, heterogeneity and extension analysis results. Section 5 discusses these results and engages in dialogue with existing literature. Section 6 summarizes the research conclusions and proposes policy recommendations and limitations.

2. Research Review, Institutional Background, and Hypotheses

2.1. Literature Review

2.1.1. Low-Carbon Supply Chain and Driving Factors

As global climate governance tightens and carbon reduction targets intensify, supply chains have attracted growing attention for their role in linking production activities with consumption patterns and environmental outcomes. With the advancement of low-carbon supply chain transformation, scholars have increasingly concentrated on developing diverse evaluation methods to assess structural performance and adaptive capacity. Luo et al. (2024) [1] evaluated the robustness of the carbon-efficient supply chain by constructing a complex index system. This indicator system covers aspects such as product supply, resources, partners, information response, finance, and knowledge, and uses the improved material element extension model for quantitative assessment, providing a tool for enterprises to diagnose their resilience levels. Ma et al. (2025)’s [2] research decomposed low-carbon supply chain resilience into cohesion, repair, and resistance capabilities, and confirmed that China’s carbon trading policy can simultaneously enhance these three capabilities, with digital technology playing an important regulatory role. Chen et al. (2025) [24] innovatively combined AIS data with the network DEA model for the ship-port system of the maritime value chain to establish a carbon-neutral efficiency assessment framework, achieving precise monitoring of the carbon performance of key nodes.
The low-carbon transformation of the supply chain is essentially a complex decision-making multistakeholder process, with multiple objectives, conflicts of interest, as well as cooperation. From a methodological perspective, many studies model low-carbon supply chain decisions as strategic interactions among governments, firms, and consumers, with game-theoretic frameworks frequently adopted to capture the incentive alignment and trade-offs embedded in policy interventions and market responses. First, policies are the key external forces driving the low-carbonization of the supply chain. Carbon quotas and trading, carbon taxes, subsidies, and dual-subsidy policies, by changing the cost–benefit structure of members, directly affect their emission reduction decisions. For example, Cai & Jiang (2023) [3] found that the effectiveness of cap-and-trade regulatory mechanisms highly depends on the setting of the quota ceiling and the carbon trading price, and there are policy thresholds to ensure that supply chain members benefit. In the automotive industry, Pu et al. (2024) [11] pointed out that a dual-subsidy policy significantly promotes the low-carbon operation of the new energy vehicle supply chain. Hamidoğlu & Weber (2024) [5] further demonstrated in the case of agricultural value chains that the reasonable combination of government subsidies and carbon taxes can effectively motivate farmers and agricultural businesses to implement low-carbon practices and stabilize the market.
Second, within the framework of policies, members within the supply chain, such as manufacturers, suppliers, and retailers, engage in a game based on maximizing their own profits. Studies generally show that centralized decision-making or cooperative alliances often lead to better environmental and economic benefits [6,11]. However, the power structure among members and their concerns for fairness can profoundly affect the depth of cooperation and the effectiveness of emission reduction. For example, Li et al. (2024) [4] and Yu et al. (2024) [25] both pointed out that the fairness concerns of manufacturers can weaken the enthusiasm of the whole production network for carbon reduction initiatives and product promotion, thereby damaging system performance. Wu et al. (2024) [26] introduced the carbon-neutral benchmark effect and found that consumers’ carbon-reduced preferences can be transmitted through market demand and become a positive force driving carbon reduction within the production network.
Third, to overcome efficiency losses resulting from decentralized decision-making, scholars have designed various coordination contracts. Contracts for sharing benefits, cost-sharing contracts, Nash bargaining models, etc., have been widely discussed. Studies have shown that the benefit-sharing contract can effectively mitigate the negative effects caused by fairness concerns [4], while the Nash bargaining model has been proven to achieve complete coordination in the automotive supply chain [11]. Moreover, Lai et al. (2025) [27] innovatively introduced the sharing of low-carbon technologies as a financing and coordination mechanism, and found that it not only alleviates the financial constraints of manufacturers but also achieves higher emission reduction levels and potential government revenue than the technology licensing model.

2.1.2. Low-Carbon and Digital Technologies in Supply Chain

Furthermore, relevant research has concentrated on analyzing the crucial function of low-carbon innovations and digital empowerment in the transformation of supply chains.
First, low-carbon technologies are direct means of reducing emissions. For example, Wang & Cai (2024) [6] and Wang et al. (2024) [28] examined the investment in low-carbon technologies in the remanufacturing process within closed-loop supply chains, finding that it could enhance consumers’ acceptance of remanufactured products and influence profit distribution under different power structures. Wang et al. (2024)’s [29] research further pointed out that dynamic adjustment of subsidy policies and carbon trading schemes can effectively promote the innovation and spread of carbon-reducing technologies in complex distribution networks. Du et al. (2025) [14] conducted a system dynamics simulation for the prefabricated building supply chain, indicating that specific low-carbon practices such as sustainable materials and investment in clean energy can effectively reduce emissions, but their economic feasibility requires a comprehensive assessment.
Second, digital innovations like blockchain, big data, and artificial intelligence have provided a new solution for low-carbon supply chain management by enhancing transparency, optimizing decision-making, and breaking down information barriers. For example, Ye et al. (2025) [7] demonstrated information sharing mechanism based on blockchain can eliminate information asymmetry-induced information rents, promote manufacturers and retailers to work together on carbon reduction based on real consumer preferences, and thereby improve the overall supply chain efficiency. El Harraki et al. (2024) [8] utilized data-driven control models to dynamically optimize low-carbon procurement decisions, effectively alleviating the “bullwhip effect” in the supply chain.
The transparent traceability feature of blockchain can also enhance the implementation effect of carbon policies. Related literature found that, under the benchmark carbon quota allocation method combined with blockchain technology, it can more effectively motivate manufacturers to reduce emissions [30,31]. Moreover, Ma et al. (2025)’s [2] empirical study revealed that the application of digital technologies can greatly improve the supply chain recovery capabilities of Chinese enterprises under the carbon emission trading policy.

2.2. Institutional Background and Research Hypotheses

2.2.1. Institutional Background

China’s supply chain policy has undergone a profound transformation from merely emphasizing logistics efficiency and cost control to systematically focusing on supply chain innovation, security, and sustainability. Before the 13th Five-Year Plan (2016–2020) (https://www.gov.cn/xinwen/2016-03/17/content_5054992.htm, accessed on 18 March 2026), China’s supply chain management practices mainly concentrated on optimizing internal operations or individual links, such as warehouse automation and transportation network planning, aiming to address the challenges of rising costs and efficiency bottlenecks during the rapid industrialization process. However, this local optimization model has increasingly exposed systemic flaws. First, the coordination between upstream and downstream of the industrial chain is loose, and the information silo phenomenon is widespread, resulting in slow overall response speed and high inventory costs. Second, insufficient attention is paid to environmental and social impacts, with prominent issues of resource consumption and emissions. Third, in the face of external shocks, the risk-resistance capability is fragile, and there are potential risks to supply chain security.
To address these problems and make the supply chain a center of value and resilience, China elevated supply chain innovation to the national strategic level since the 13th Five-Year Plan period, as shown in Table 1. In 2017, China released the Guidelines for Actively Advancing Supply Chain Innovation and Application. It set national-level goals for building an intelligent and green supply chain system. In 2018, eight government departments of China jointly issued the Notice on Carrying Out Pilot Projects for Supply Chain Innovation and Application. It transformed previous government plans into specific practical requirements. This marked that China’s supply chain policies entered a new stage of dual drive by top-level design and grassroots pilot projects. Since then, the policies have continued to deepen, and in 2020, a notice was issued to promote the coordinated resumption of work and production of pilot enterprises, extracting standards and models from successful pilot experiences.
SCIAPP simultaneously selects pilot cities and pilot enterprises, establishing an interactive mechanism between the cities for creating an environment and the enterprises for exploring and practicing. Among them, the enterprise pilot is the key carrier for the implementation of policies and the generation of practical results. The selection process of pilot enterprises under SCIAPP was designed to ensure representativeness, transparency, and randomness. According to the official notice jointly issued by eight government departments in 2018, the selection of pilot enterprises followed a multi-stage, criteria-based process.
First, enterprises were required to apply voluntarily through provincial authorities, ensuring that participation was not coercively imposed but based on firms’ own interest and capacity. Second, eligible enterprises had to meet predefined criteria, including having independent legal personality, a high level of supply chain management capability, established supply chain platforms with industry influence, and a demonstrated commitment to innovation and sustainability. These criteria were broadly defined to include firms from diverse industries such as manufacturing, distribution, and agriculture, and to cover enterprises of varying sizes, though most were leading firms in their sectors. Third, the final selection was made by an expert panel organized by multiple ministries, including Commerce, Industry and Information Technology, and Agriculture, among others. The panel evaluated applications based on a competitive review process, which incorporated both quantitative indicators, e.g., supply chain performance, technological adoption and qualitative assessments, e.g., innovation potential, environmental commitment.
Importantly, the selection emphasized geographical diversity and sectoral balance, aiming to include firms from different regions and industries to enhance the generalizability of pilot outcomes. While the process was not purely random in the statistical sense, it was designed to minimize administrative discretion and ensure that selected enterprises were broadly representative of China’s industrial landscape.
This policy design has two prominent features. First, the pilot enterprises not only include industry giants to exert their leading influence, but also cover different regions in terms of geographical distribution, to ensure the wide representativeness of the pilot and the transferability of the experience. Second, the policy not only indicates the direction for innovation for enterprises, but also provides substantial resource support and risk buffering for their transformation attempts through specific measures such as prioritizing the issuance of credit bonds and providing assessment incentives.

2.2.2. Research Hypothesis

Drawing on Legitimacy Theory and Institutional Theory, the legitimacy standards imposed by SCIAPP create coercive, normative, and mimetic pressures that compel firms to address supply chain pollutant emissions [9]. Following the introduction of China’s carbon emission targets and enhancement of public environmental awareness, the environmental legitimacy criteria for enterprises have evolved from mere pollution control to encompass management responsibility for the supply chain’s carbon footprint. Simultaneously, Dynamic Capability Theory, an extension of the Resource-Based View (RBV), suggests that a firm’s competitive advantage hinges on its ability to integrate, build, and reconfigure resources to address rapidly changing environments [10]. Thus, SCIAPP not only heightens legitimacy pressure but also provides the policy impetus for firms to develop the dynamic capabilities necessary for LCTI. As a national-level industrial policy, SCIAPP systematically reconstructs the legitimacy pressure and capability-building process of enterprises through its core orientation of greenification, digitalization, and efficiency, thereby providing key driving forces and capabilities for its LCTI.
The promoting effect of SCIAPP is mainly achieved through the following three paths. First, the green-oriented regulation and market legitimacy pressure are strengthened, directly driving the demand for low-carbon technologies [32]. SCIAPP explicitly requires pilot enterprises to establish a green supply chain covering the entire process, chain, and links. This effectively extends the government’s low-carbon regulatory pressure from the production end to the entire supply chain network [33]. As pilot enterprises, their environmental performance is jointly monitored and evaluated by multiple government departments, constituting strong coercive legitimacy pressure [15]. To maintain and enhance this legitimacy, enterprises must take substantive actions, not just end-of-pipe governance. Therefore, investing in low-carbon production technologies that can fundamentally optimize the energy structure and improve energy efficiency, such as clean energy substitution and electrification of process flows, becomes the preferred strategy to meet the rigid policy requirements and avoid compliance risks. At the same time, SCIAPP advocates green procurement and consumption, guiding market demand, enabling enterprises with low-carbon technology advantages to gain more favor from downstream customers and consumers, thereby coping with the market legitimacy pressure [34]. Under this dual pressure, conducting LCTI is a rational choice for enterprises to reshape and consolidate their environmental legitimacy. From an RBV perspective, firms with pre-existing technological capabilities and innovation resources are better positioned to transform these pressures into competitive advantages through substantive green innovation, rather than merely symbolic compliance.
Second, the digitalization enhances information transparency and collaboration capabilities and empowers advancement and management of carbon-reducing technologies. SCIAPP actively promotes the application of modern information technologies across the supply chain, encompassing both internal management systems, e.g., ERP systems, and external platforms integrating blockchain, IoT, cloud computing, and big data analytics for inter-firm coordination. This technological foundation addresses the information asymmetry and coordination challenges inherent in low-carbon transformation. By enabling the measurement and traceability of product-level carbon footprints, digital technologies enhance the visibility of emission information across supply chain stages, which fundamentally alters how firms identify emission sources and coordinate reduction efforts. For instance, the application of blockchain technology can record carbon emission data at each stage in an unalterable manner, not only enhancing the credibility of enterprises’ carbon disclosure and meeting the information needs of stakeholders, but also precisely identifying the key areas for emission reduction [27]. Furthermore, digital platforms have facilitated cooperation among enterprises at all stages of the supply chain, with all parties working together towards the goals of emission reduction, technological innovation, and green transformation. Importantly, drawing on dynamic capabilities theory, this digital enablement strengthens firms’ capacity to sense environmental changes, seize opportunities, and reconfigure resources, the core mechanisms through which SCIAPP fosters innovation beyond mere compliance [12]. Specifically, digitalization enhances absorptive capacity by enabling real-time monitoring of carbon footprints and market signals, allowing firms to identify and assimilate new low-carbon knowledge. It strengthens innovative capacity by facilitating collaborative platforms where firms jointly develop green technologies with suppliers and customers, sharing risks and costs [35]. It also builds adaptive capacity through flexible production systems that respond swiftly to policy changes and market fluctuations [13]. Thus, digitalization operates not merely as a technical tool but as a fundamental enabler of the dynamic capabilities that translate external policy pressure into sustained low-carbon innovation.
Third, the focus on efficiency generates resource redundancy and performance expectations, ensuring sustained investment in LCTI. The ultimate goal of SCIAPP is to achieve cost reduction, efficiency enhancement, and industrial upgrading. By optimizing supply chain collaboration, reducing inventory waste, and standardizing supply chain finance, SCIAPP effectively enhances the overall operational efficiency and capital turnover efficiency of the pilot enterprises. The resource redundancy generated by efficiency improvement provides a realistic possibility for enterprises to allocate more financial and management resources to long-cycle and high-risk low-carbon technology research and development [36]. Moreover, SCIAPP provides clear performance expectations and resource compensation for enterprises that actively fulfill their responsibilities for low-carbon transformation through specific measures such as assessment incentives and priority financing [37]. This changes the innovation profit function of enterprises, making LCTI not only a way to avoid the threat of losing legitimacy but also an opportunity to obtain additional policy benefits and competitive advantages. Consistent with RBV logic, the efficiency gains generated through supply chain integration release both financial and managerial slack, which firms can deploy to build valuable, rare, and inimitable green innovation capabilities. Thus, these gains jointly strengthen both the willingness and capacity to undertake LCTI.
In summary, SCIAPP operates as a multifaceted policy instrument that combines regulatory pressure with resource provision and capability-building support. While it embodies command-and-control elements through mandated green supply chain requirements and multi-departmental monitoring, it also incorporates enabling mechanisms, digitalization promotion and efficiency-oriented incentives that shape firms’ innovation capacity and motivation. The net effect on LCTI remains an empirical question, depending on how firms navigate these complementary pressures and opportunities. Operating through a triple mechanism of green pressure, digital empowerment, and efficient resource generation, SCIAPP systematically alters the institutional environment, operational foundation, and incentive structure for enterprises to engage in LCTI. Therefore, we propose the following core hypothesis and mechanism hypothesis:
H1. 
SCIAPP exerts a substantial positive effect on the enterprises’ LCTI.
H2. 
SCIAPP exerts a positive effect on enterprises’ LCTI through mechanisms including green, digital, and efficient management.

3. Methods

3.1. Research Methods Framework

This study employs a DID approach to empirically examine the impact of SCIAPP on enterprises’ LCTI and its underlying mechanisms, corresponding to Hypothesis H1 and Hypothesis H2. The empirical strategy proceeds as follows.
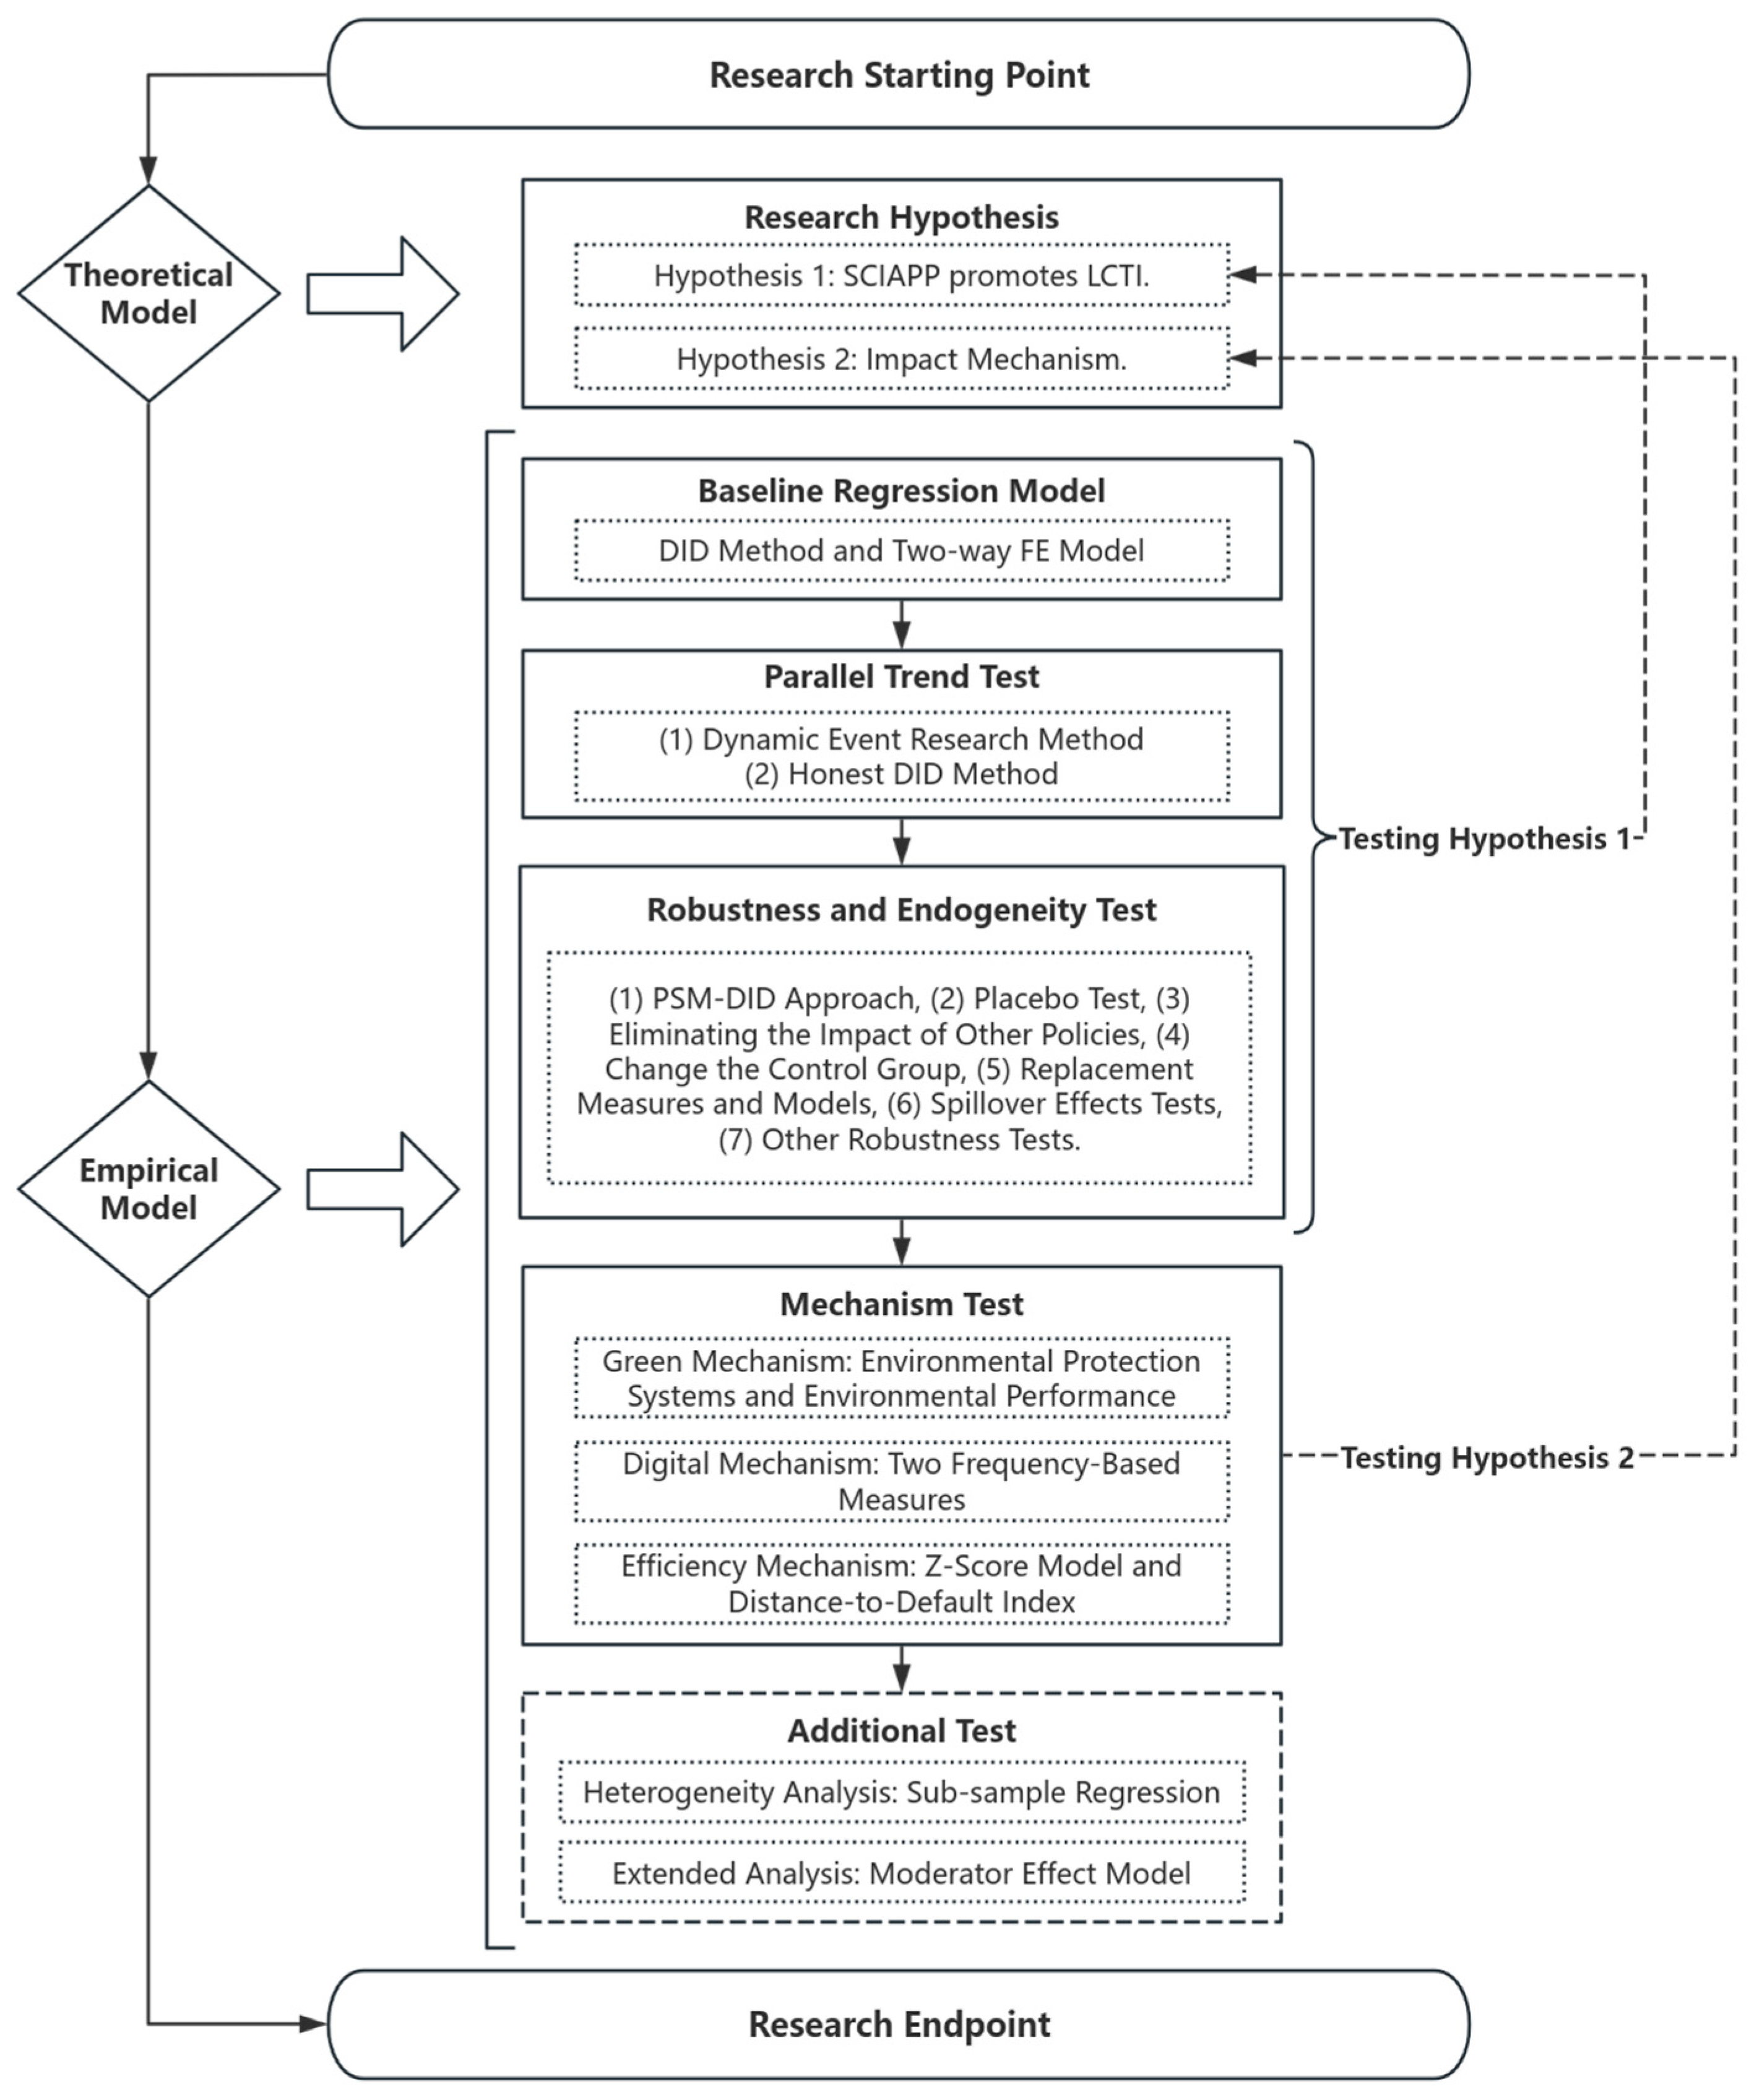
The research framework is illustrated in Figure 2. This systematic framework ensures comprehensive identification and rigorous testing of our theoretical hypotheses. First, we construct a baseline DID model to estimate the average treatment effect of SCIAPP on LCTI. To validate the parallel trend assumption underlying DID identification, we conduct dynamic event-study analysis and supplement it with the Honest DID approach. Second, we further address endogeneity and ensure robustness through a battery of tests, including propensity score matching (PSM) DID test, placebo test with fictitious treatment groups, and so on. Third, we develop mediation models to test the three proposed mechanisms, including green, digital, and efficient mechanisms, through which SCIAPP promotes LCTI. We employ multiple proxies for each mechanism variable to ensure robustness. Additionally, building on these analyses, we conduct heterogeneity analyses via subsample regressions and moderation analyses to explore how firm characteristics shape the policy effect, as well as extended analyses examining LCTI’s impact on supply chain resilience.
In the following subsection, this study details the identification strategies employed in the main chapters, including baseline regression and parallel trend testing strategies, endogeneity and robustness testing strategies, and mechanism testing strategies.

3.2. Identification Strategy

3.2.1. Baseline Regression and Parallel Trend Testing Strategy

(1)
Baseline Regression
Referring to Zheng et al. (2021) [38], this paper employs the DID method to estimate the impact of SCIAPP on enterprises’ LCTI, as shown in Formula (1):
LCTI i , t   =   α   +   β SCIAPP i , t   +   γ Controls i , t   +   λ i   +   μ t   +   ε i , t
Among them, i symbolizes an individual, namely the enterprise, and t signifies time, namely the year. The LCTI is the dependent variable, namely LCTI. The SCIAPP is the independent variable, namely the pilot program SCIAPP. The Controls are the variables that may affect LCTI. The λ is employed to account for individual characteristics that remain constant over time, specifically enterprise fixed effects. The μ is used to control for the time characteristics that do not vary from individual to individual, namely, year fixed effect. The ε depicts disturbance term. The coefficient β represents average treatment effect of SCIAPP. If it is significantly positive, it indicates that SCIAPP can significantly promote LCTI, thereby confirming Hypothesis H1.
The LCTI is the dependent variable, namely LCTI. Based on the relevant research [15], this study uses low-carbon technology invention patents as the proxy variable for LCTI. According to the patent search formula provided by the China National Intellectual Property Administration’s (CNIPA) Green and Low-Carbon Technology Patent Classification System, this study obtained low-carbon technology patents from the patent search platform of the CNIPA. This study summarized them by the application year and the applicant, and matched them with the names of Chinese listed enterprises to obtain the quantity of patent applications for low-carbon technology inventions of enterprises, and took the natural logarithm of this number +1.
The SCIAPP is the independent variable, namely the pilot program SCIAPP. Based on existing literature, this study constructs this variable using the DID approach [16]. Specifically, if enterprise i is included in SCIAPP, its observation year is in the year of policy implementation or later (t ≥ 2018), at which point this variable is given a value of 1; otherwise, it is 0. Therefore, estimated coefficient of this variable represents the net effect of SCIAPP on the LCTI of the included enterprises, after deducting influence of other factors on the enterprises.
The Controls refer to a series of variables that may influence an enterprise’s LCTI. They were selected based on relevant literature [35]. First, this study controls for enterprise asset size (Size), listing years (Ltime), financial leverage (LEV), and profitability (ROE) to eliminate the influence of enterprise characteristics and financial conditions on technological innovation. Second, this study controls for board size (Board) and independence (Ind_r), equity concentration (Top1), and ownership nature (SOE) to eliminate the influence of the internal governance mechanism of the enterprise on technological innovation. Third, this study also controls for the regional economic development level (GRP) and industrial structure (Industry).
(2)
Parallel Trend Test
Before using the DID approach, this study needs to conduct a parallel trend test. For this purpose, following Roth (2024) [39], this research constructs a dynamic effect model based on the event study method, as shown in Formula (2):
LCTI i , t   =   α   +   t = 2011 2023 β t Treat i   ×   Periods t   +   γ Controls i , t   +   λ i   +   μ t   +   ε i , t
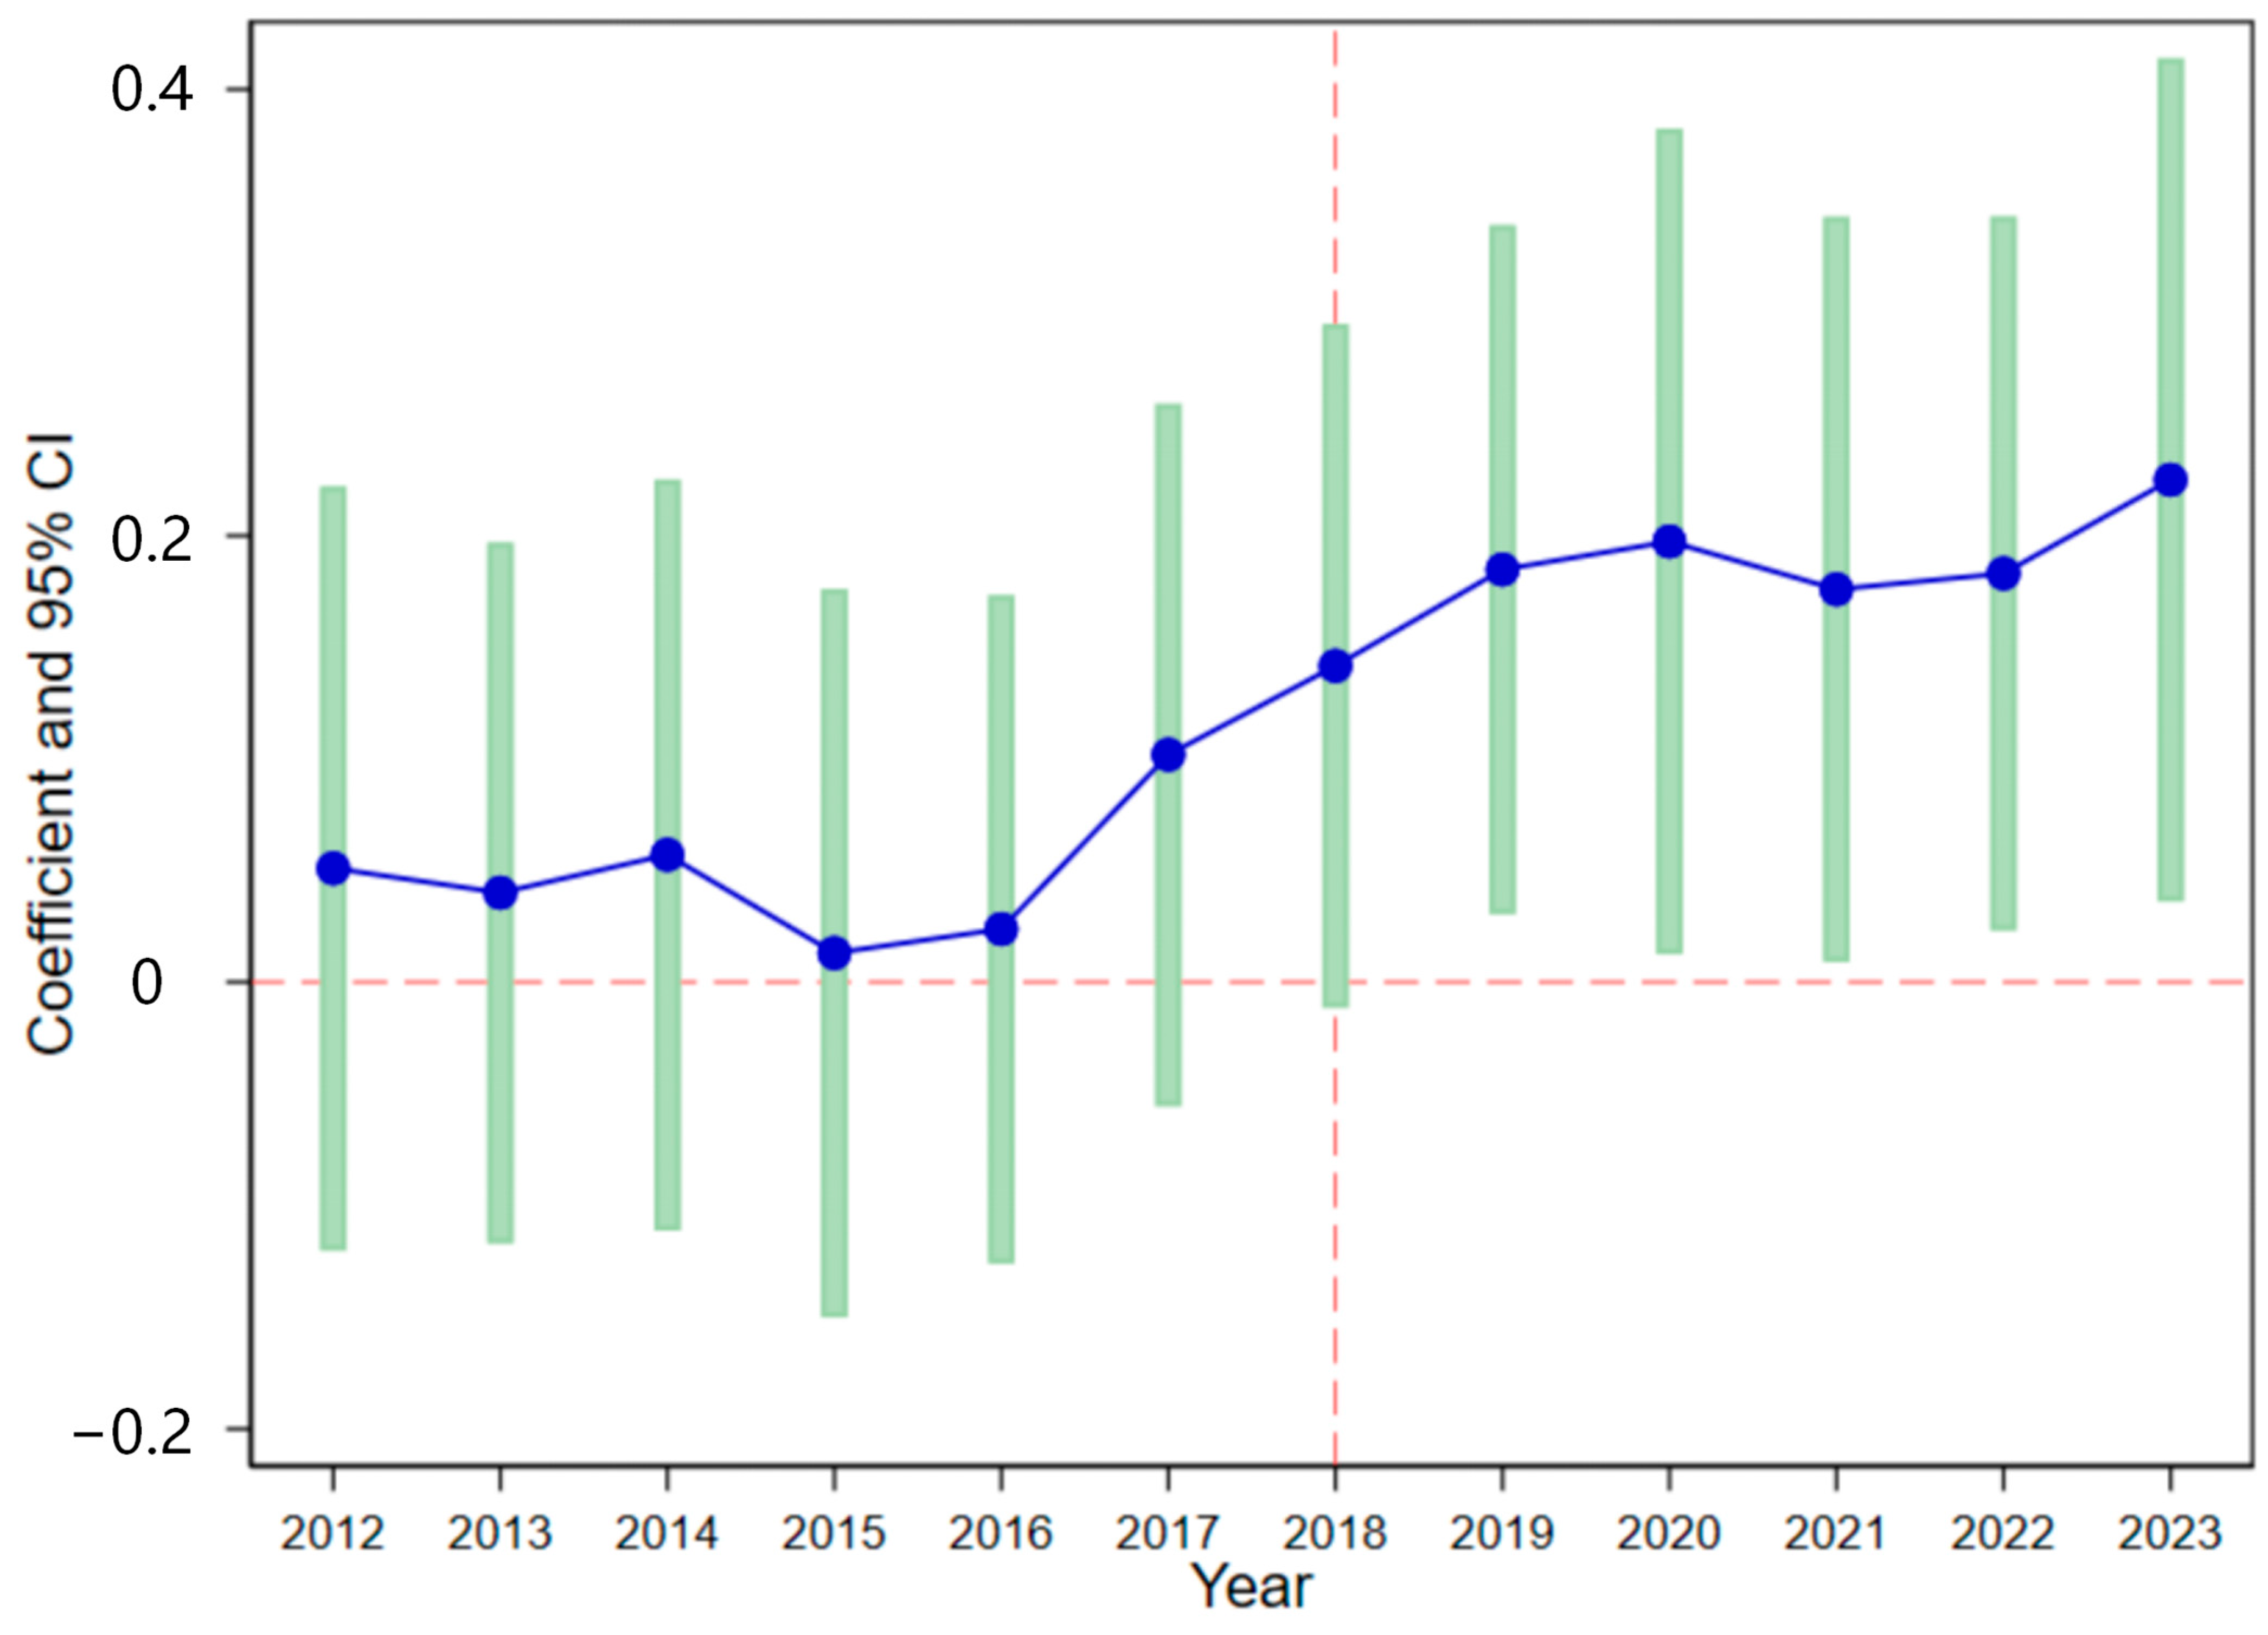
Among them, Treat is a dummy variable used to distinguish whether an enterprise belongs to SCIAPP. The Periods is a set of dummy variables representing specific time points, covering each year from 2011 to 2023. Therefore, the coefficient of Treat × Periods estimates the impact of SCIAPP on LCTI in each year. This study uses the first year of the research period (2011) as the baseline period. If the estimated coefficients prior to SCIAPP implementation fail to reach the significance level, this indicates compliance with the parallel trends requirement.
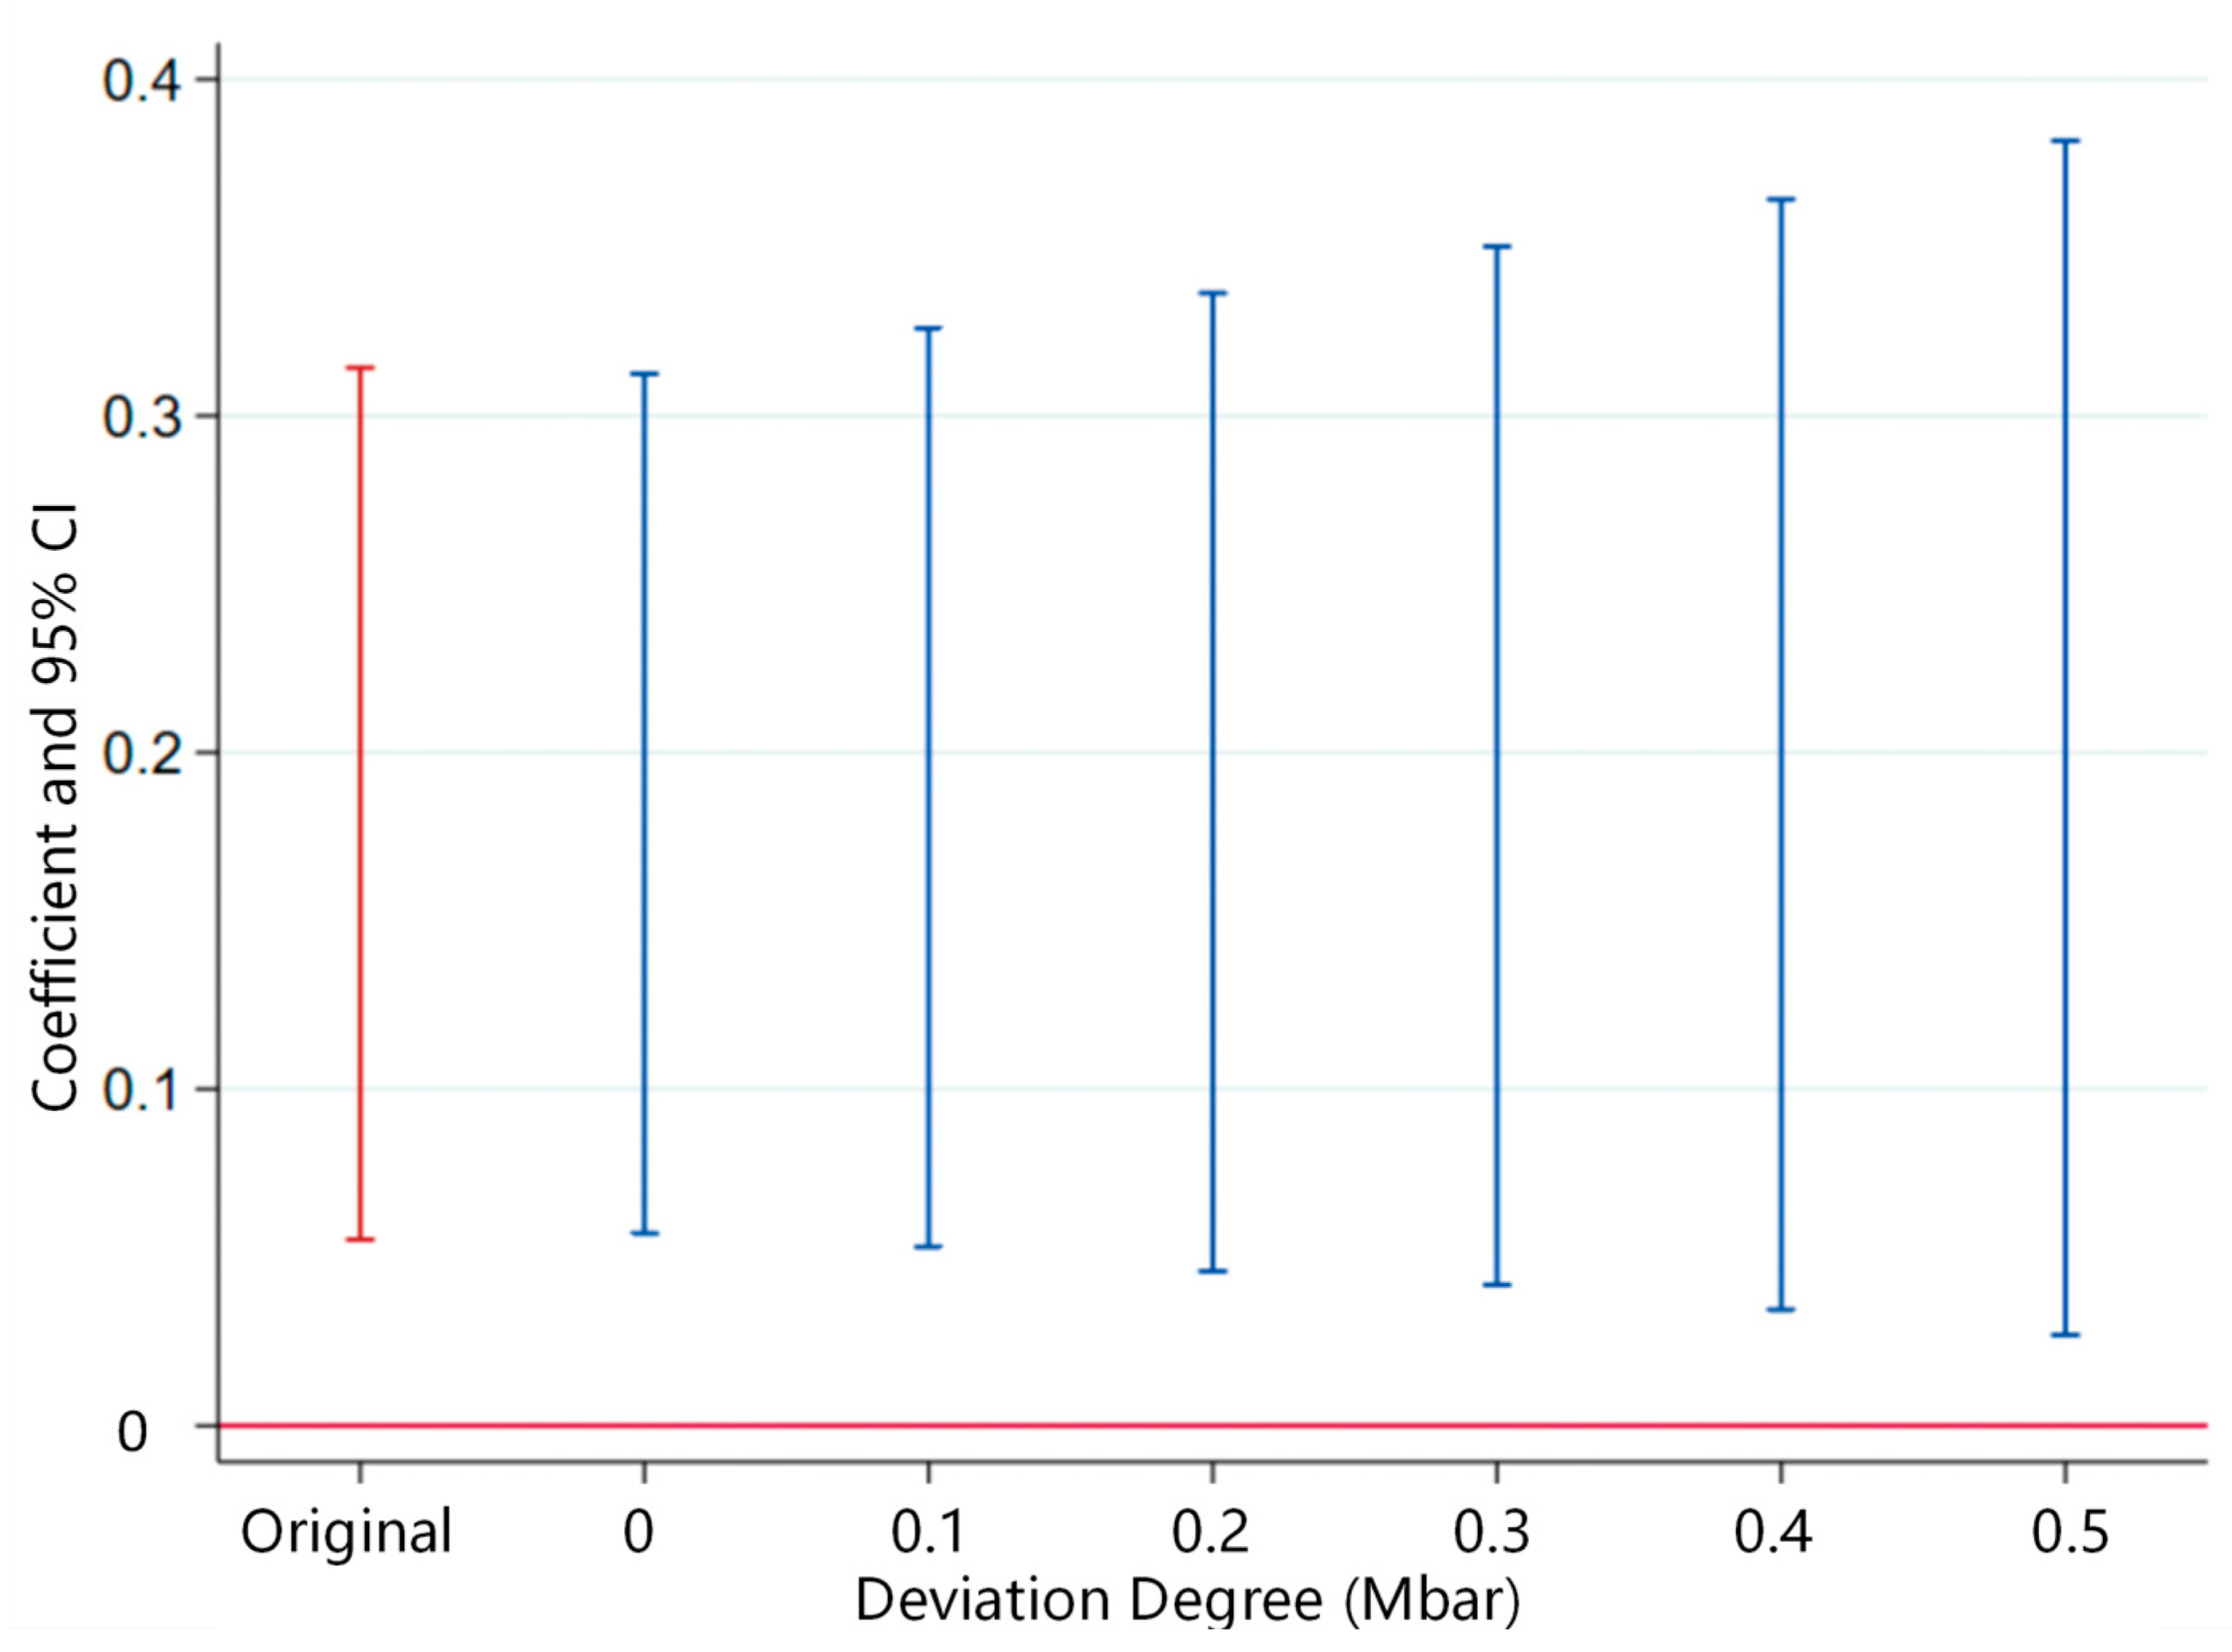
To further provide evidence of parallel trends, referring to Rambachan & Roth (2019) [40], this study performed a sensitivity analysis using Honest DID approach. Specifically, the study analyzed the extent to which the estimated results would no longer hold by setting the relative deviation degree of the parallel trend after the event, compared to before the event. This study sets the deviation level between 0 and 0.5. Should the estimated results remain statistically significant when the deviation reaches the maximum preset value, this indicates that the findings hold true even when relaxing the parallel trend assumption.

3.2.2. Endogeneity and Robustness Testing Strategy

(1)
PSM-DID Test
When the government selects pilot enterprises for SCIAPP, there might be certain biases. Those enterprises that already have a well-established supply chain and good green performance are more likely to be chosen. Therefore, this study may have issues such as sample selection bias. To tackle this, this paper uses the PSM method to eliminate this endogeneity problem.
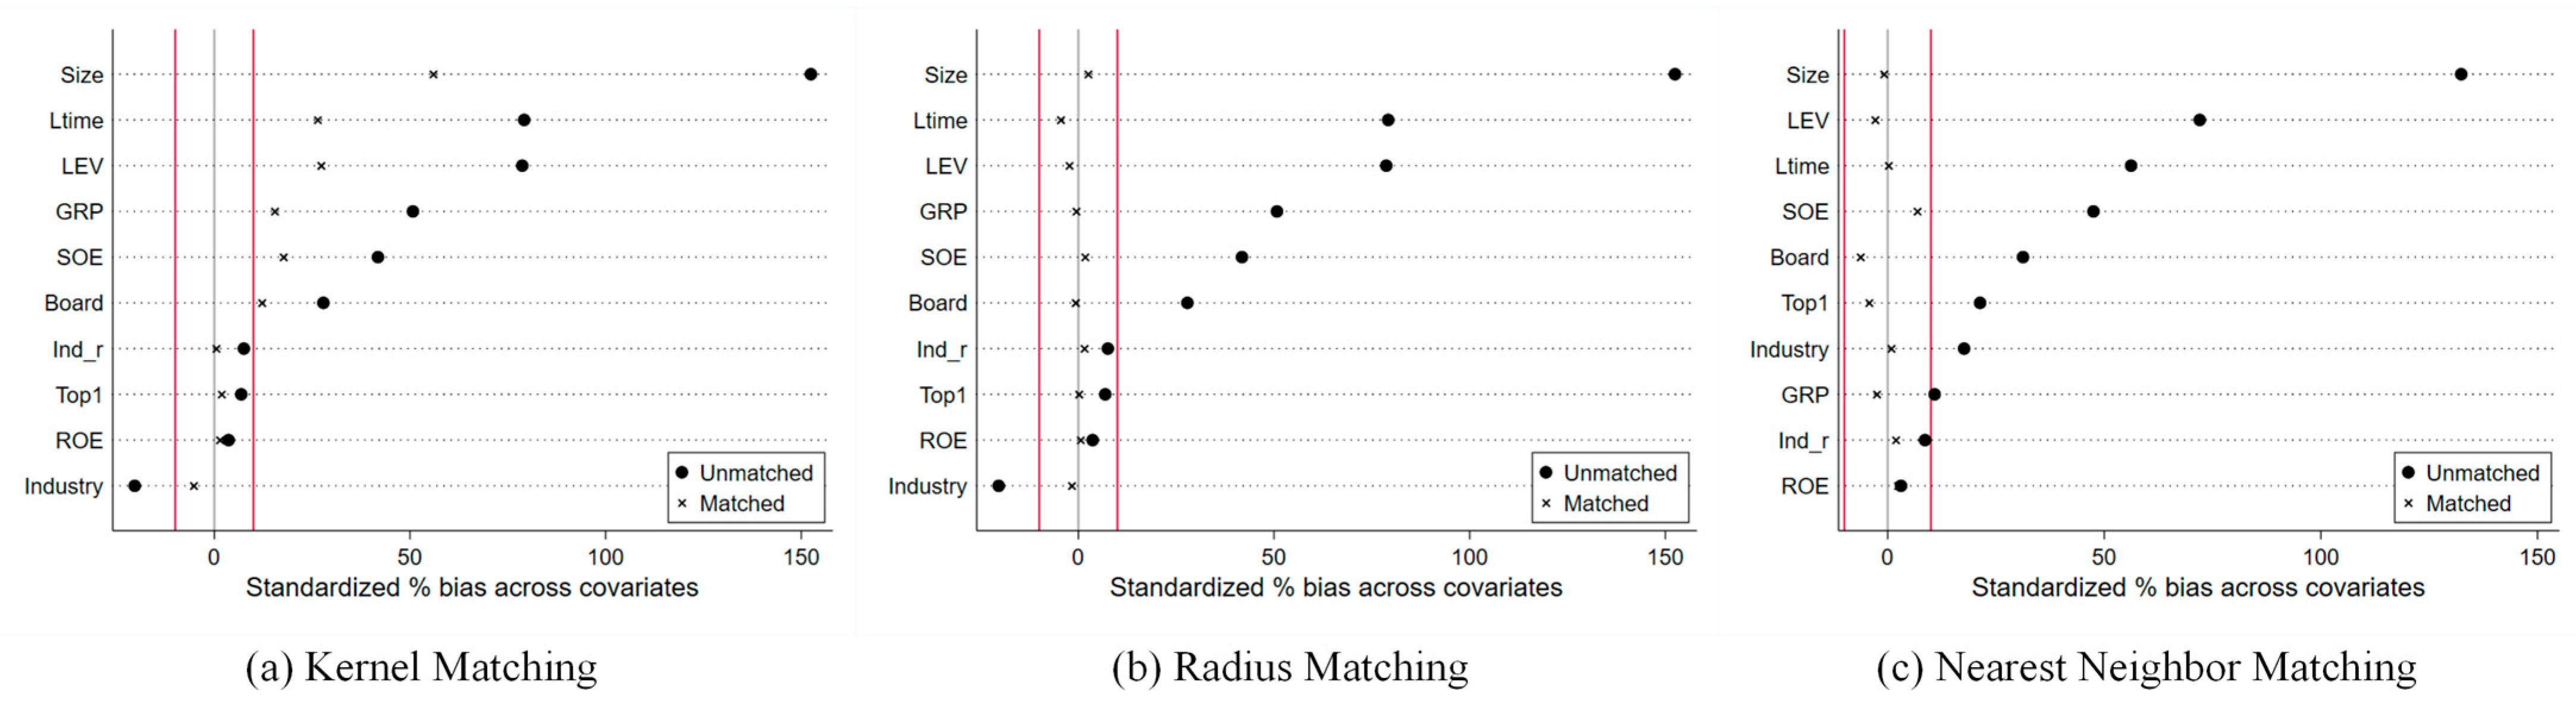
This study employed three methods, including kernel matching, radius matching, and nearest neighbour matching, to conduct PSM-DID tests. Should the estimated results remain statistically significant, this would indicate that the study is subject to minimal selection bias.
(2)
Placebo Test
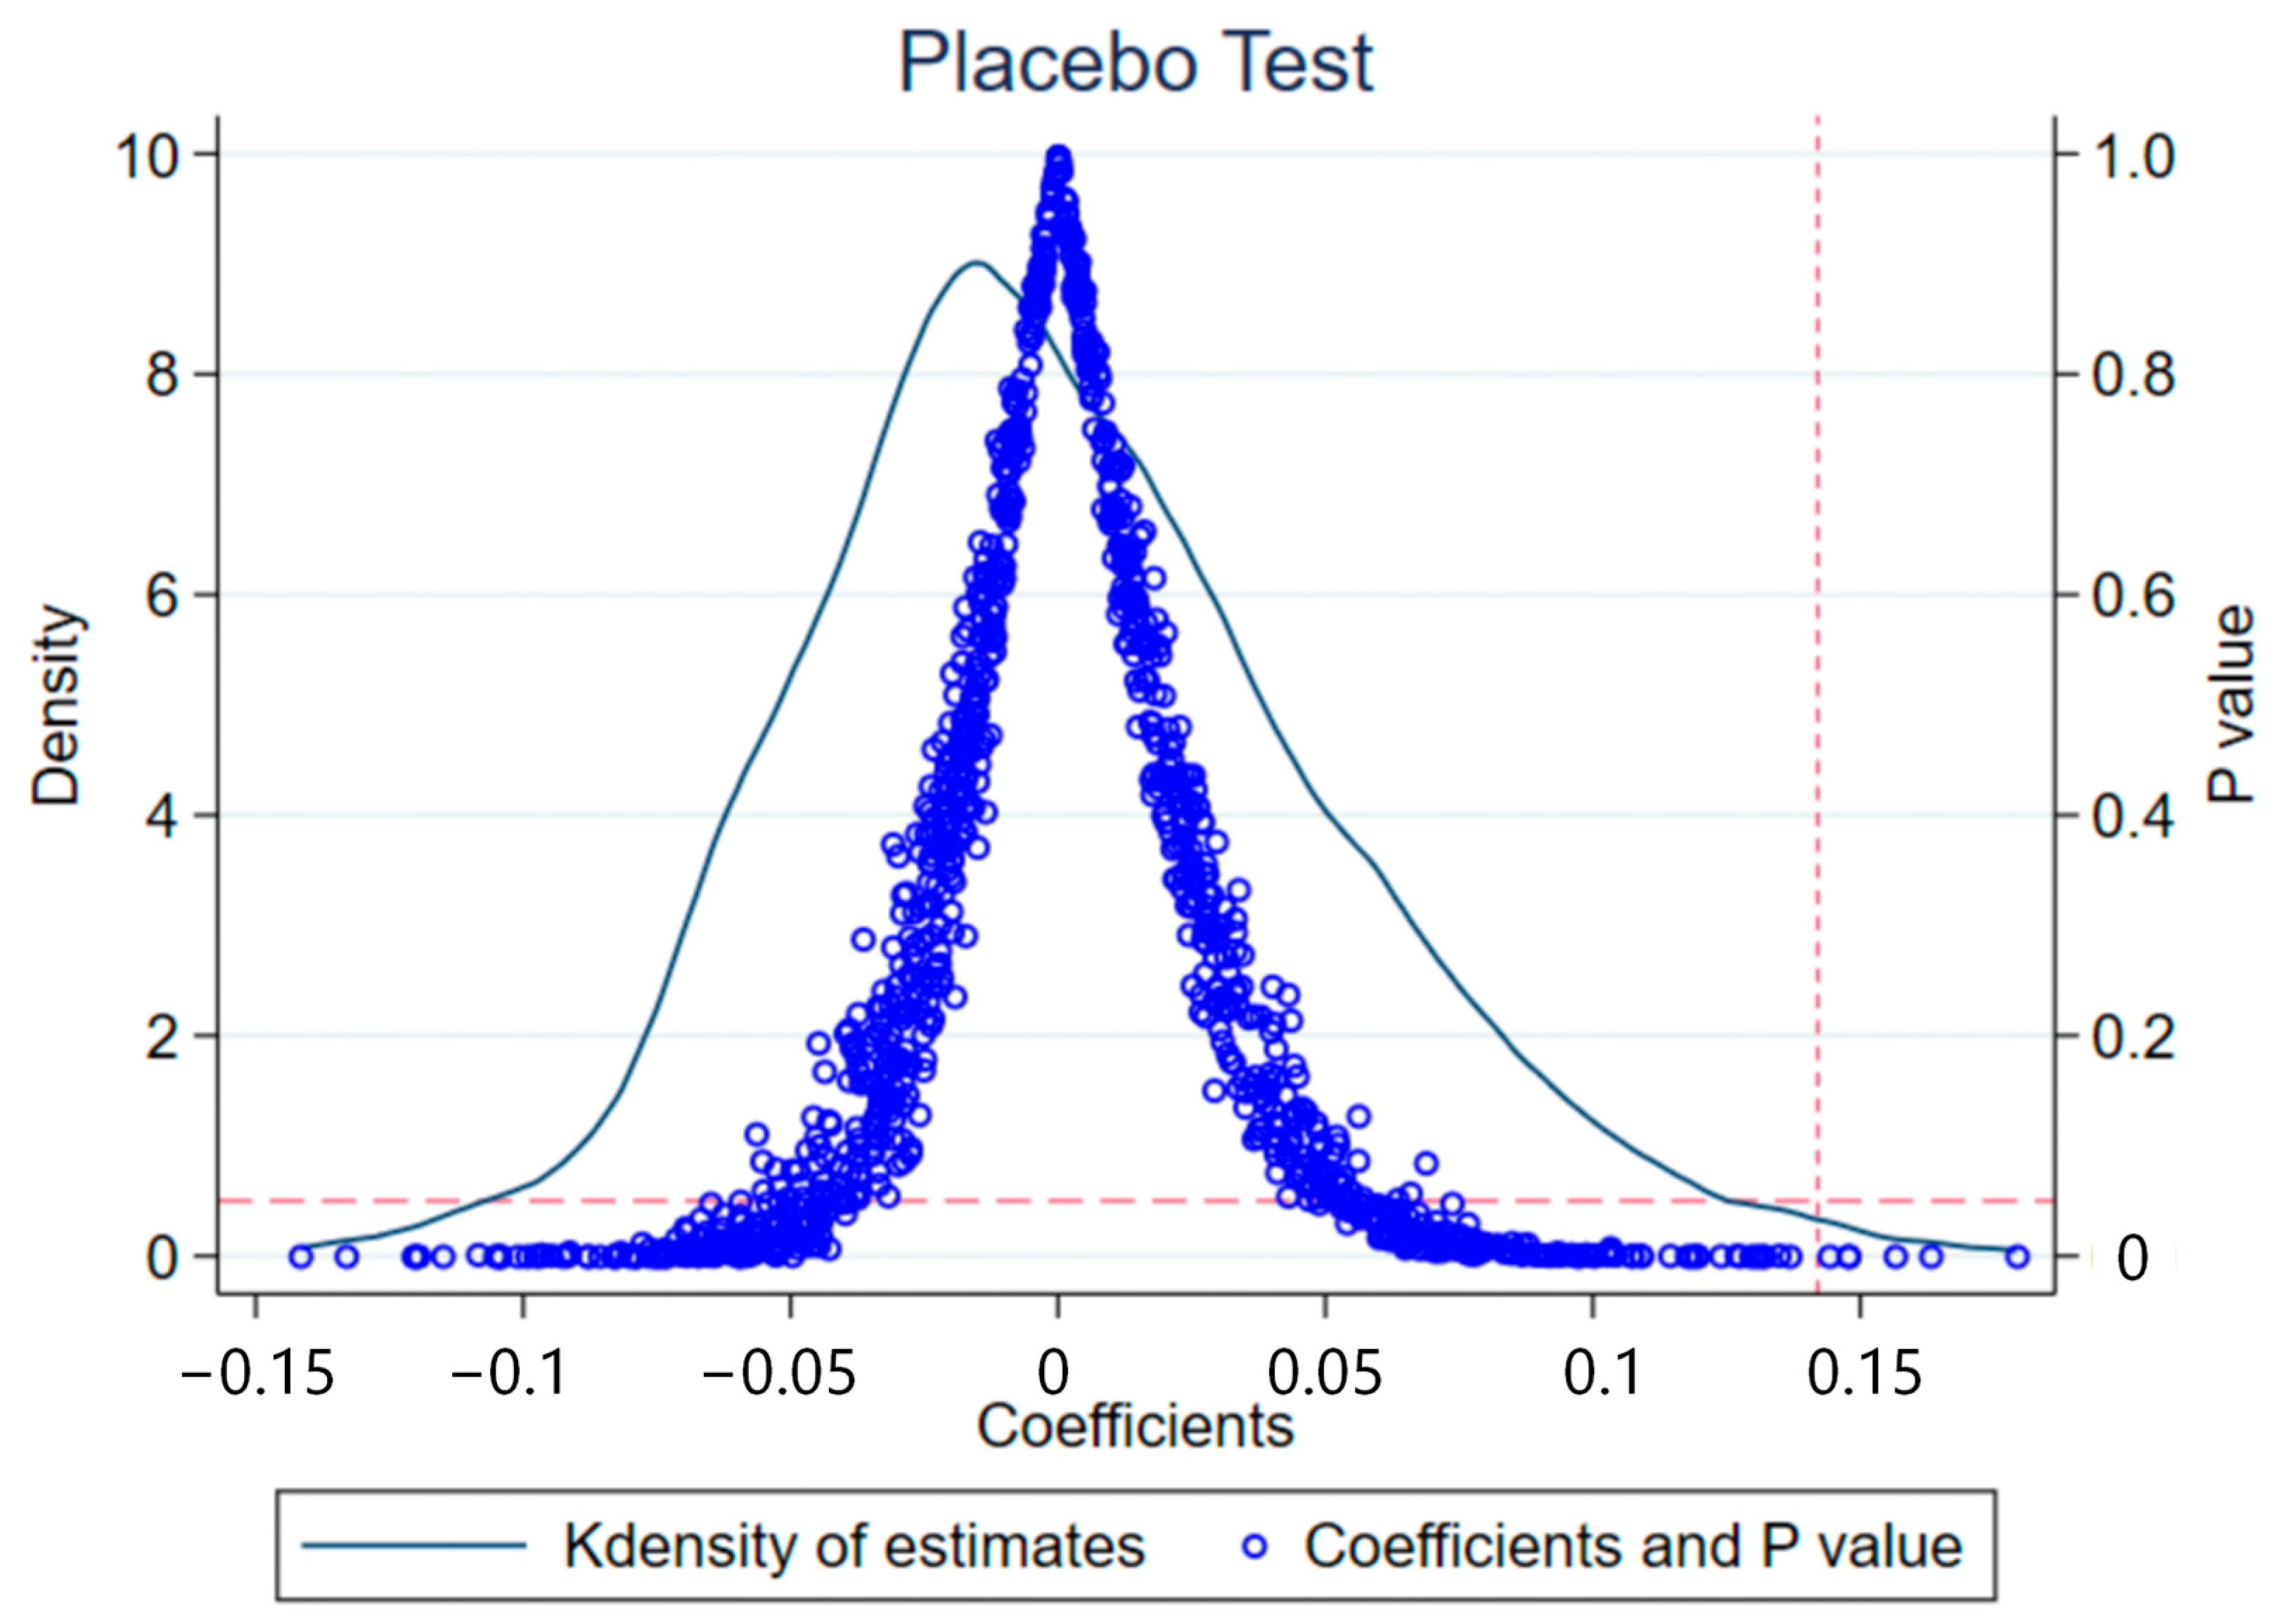
The findings of this study may be subject to interference from unobservable factors, namely the placebo effect. Consequently, a placebo test was conducted by generating a pseudo-experimental group through random sampling. The study performed 1000 random samples, extracting the estimated coefficient and p-value from each sample. Should the sampled results prove markedly smaller than the actual regression outcomes or fail to reach statistical significance, this would indicate that the study is minimally influenced by the placebo effect.
(3)
Eliminating the Impact of Other Policies
Apart from SCIAPP, the carbon emissions trading (CET) pilot policy, as the most typical environmental regulatory policy in China, also has an impact on enterprises’ low-carbon innovation. In addition, many digitalization policies can also promote the digital and green transformation of enterprises. Specifically, we are concerned that the comprehensive big data experimental zone (BD), the integration of manufacturing and the internet pilot policy (MI), as well as the national digital economy innovation experimental zones (DF), might interfere with the research results [41]. Because the implementation time of these measures is very close to that of SCIAPP, they can significantly enhance the digitalization level of the enterprises.
Using the DID approach, this study separately generated the four policy variables CET, BD, MI, and DF, and incorporated them into the baseline regression model. This approach eliminates the interference of these policies on the impact of SCIAPP. Should the estimated coefficient remain significantly positive, it indicates that the effect of SCIAPP on LCTI is robust.
(4)
Change the Control Group
To further eliminate the endogeneity and robustness issues caused by the comparability among samples, this study re-screened the control group. First, considering the actual situation and the SCIAPP’s content, the study retained all the enterprises in the experimental group while only keeping manufacturing enterprises in the control group. Second, considering the characteristics of LCTI, we also referred to relevant literature and retained only enterprises from heavy-polluting industries and energy-intensive industries in the control group [42]. If the estimated coefficients remain statistically significant after the aforementioned adjustments, this indicates that the findings of this study are not sensitive to the design of the control group.
(5)
Replacement Measures and Models
Considering the quality of patents, this study first included the utility model patent applications in the analysis scope to examine the impact of SCIAPP on this type of incremental innovation. Second, the study replaced the count of patent applications alongside the number of patent grants to eliminate effect of those unstable patents. Moreover, considering that there are many zero values in the patent data, the study also used the negative binomial regression model [43]. If all estimated coefficients are statistically significant, this indicates that the findings of this study are insensitive to variations in variable measurement and model design.
(6)
Spillover Effects Test
SCIAPP may have spillover effects on non-pilot enterprises within the same network or region, which may lead to the violation of SUTVA (Stable Unit Treatment Value Assumption). We mainly consider two types of spillover effects. On one hand, SCIAPP may influence the innovation behaviors of upstream and downstream enterprises of the pilot enterprises through the supply chain. Therefore, first, we search for the top five suppliers and customers of the pilot enterprises in the company’s annual reports and select non-pilot listed enterprises from them, then remove them from the sample. This directly eliminates the influence of SCIAPP transmitted through the supply chain to other enterprises. Second, we generate a dummy variable Spillover1. If a non-pilot listed enterprise is a top five supplier or customer of the pilot enterprise and the time is after 2018 (t ≥ 2018), it is 1, otherwise it is 0. Therefore, this variable estimates the impact of SCIAPP implementation on these suppliers and customers.
On the other hand, SCIAPP may also have an impact on nearby peer enterprises within the same region as the pilot enterprises. Therefore, first, we identify non-pilot listed companies that may be affected by the spillover effect of SCIAPP through the cities where the enterprises are located and the secondary industries they belong to, and then eliminate them from the sample. This can directly eliminate the influence of SCIAPP being transmitted to other enterprises through industry competition in the same region. Second, we generate a dummy variable Spillover2. If a non-pilot listed company and a pilot company belong to the same city and the same industry, and the time is after 2018 (t ≥ 2018), it is 1; otherwise, it is 0. Therefore, this variable estimates the impact of SCIAPP implementation on these enterprises in the same region and industry.
If both tests yield significant results, this indicates that SCIAPP exerts no significant influence on upstream or downstream supply chain entities, nor on enterprises within the same industry and region. This implies that the findings of this study exhibit negligible spillover effects, or that such effects exert no significant impact on the research outcomes.
(7)
Other Robustness Tests
This study also conducted a series of other robustness tests. First, SCIAPP and all control variables were successively adjusted to t−1, t−2, and t−3 perisods to alleviate the lag effect of SCIAPP. Second, considering that industrial transformation and policies might have an impact on the outcome, we have incorporated interaction fixed effects of industry and year into our model. Third, we cluster the standard errors to the enterprise level and the city level to alleviate the autocorrelation problem. If all the above tests are passed, it indicates that the results of this study are highly robust.

3.2.3. Mechanism Testing Strategy

To further test whether SCIAPP can promote enterprises’ LCTI through three paths of greening, digitalization, and efficiency improvement, this study constructs a mechanism verification model, as shown in Formula (3):
Mechanism i , t   =   α   +   β SCIAPP i , t   +   γ Controls i , t   +   λ i   +   μ t   +   ε i , t
Among them, Mechanism represents the mechanism variable. The coefficient β indicates the influence of SCIAPP on the mechanism variables. The definitions and measurements of other variables can be found in Formula (1).
(1)
Green Mechanism
This study measures the greenization mechanism in two ways. First, it queries whether enterprises have established environmental systems (ES) through their ESG reports, sustainability reports, and annual reports, including environmental protection concepts, environmental protection objectives, environmental management system framework, environmental education and training, special environmental initiatives, emergency response mechanisms for environmental incidents, environmental awards and recognition, and the system for designing, constructing, and operating environmental facilities concurrently with the main project [17]. For each system established by the enterprise, 1 point is added, so the score for the enterprise’s environmental protection system ranges from 0 to 8 points. Second, we select the enterprise environmental rating data from Sino-Securities Index Information Service (Shanghai, China) Co., Ltd. to assess environmental performance (EP) [18].
(2)
Digital Mechanism
This study measures the digitalization mechanism through the frequency of words. First, based on Wu et al. (2021) [19], this paper divides enterprise digitalization into 5 dimensions, encompassing AI, blockchain, cloud computing, big data, and the application of digital technologies. It determines the keywords for each dimension and counts the total occurrences by searching for these keywords in the annual reports (Digital1). Second, the study also refers to Zhen et al. (2023) [20], determining the keywords based on three major dimensions, including technology empowerment, organizational empowerment, and digital application. It also obtains the total occurrences by searching for these keywords in the annual reports (Digital2). Considering that both of the obtained variables have the characteristics of count variables, the study takes the natural logarithm of these two variables +1.
(3)
Efficient Mechanism
This study measures the efficiency mechanism in two ways. First, following Altman (1967) [21], the study constructs the Z Score (Risk) based on a series of enterprise financial indicators to measure the operating pressure of the enterprises. The larger the index, the better the enterprise’s operating condition and the lower the pressure, indicating higher operational efficiency. Second, referring to Bharath & Shumway (2008) [22], the study constructs a default distance index (Default) using the Merton model. The larger the index, the farther the enterprise is from default, and the higher the safety and efficiency of its operation.
Furthermore, referring to Di Giuli & Laux (2022) [44] and Li & Zhu (2026) [45], we constructed the following model to examine the influence of mechanism variables on LCTI, as shown in Formula (4):
L C T I i , t   =   α   +   β Mechanism _ fit i , t   +   γ Controls i , t   +   λ i   +   μ t   +   ε i , t
Among them, Mechanism_fit represents the estimated value after fitting by Formula (3). It eliminates the parts that are not explained by SCIAPP, which can reduce the inherent endogeneity problem of the traditional mediation model. The coefficient β indicates the effect of the mechanism variable on LCTI after controlling for endogeneity. The definitions and measurements of other variables can be found in Formula (1).
In the above tests, if the coefficients β in both Formulas (3) and (4) are significant, this indicates that SCIAPP can promote LCTI through these mechanisms, thereby confirming Hypothesis 2.

3.3. Variable, Sample and Data

3.3.1. Variable

The definitions, symbols, and measurement methods for all the aforementioned variables are shown in Table 2. The variables employed in this study are widely adopted in prior literature, ensuring measurement validity. LCTI is measured by patent applications, a standard proxy for corporate innovation output [15]. Firm-level controls, including size, leverage, profitability, board characteristics, and ownership, follow conventional definitions in corporate finance research [35]. For mechanism variables, the environmental system score and Sino-Securities environmental rating are validated measures of corporate green management [17,18]. Digital transformation indices are constructed using established word-frequency methods from Wu et al. (2021) [19] and Zhen et al. (2023) [20]. Efficient measures follow Altman’s Z-score and Merton’s distance-to-default models, respectively [21,22]. This alignment with prior research ensures that our constructs reliably capture the intended theoretical concepts.

3.3.2. Sample

The sample of this study consists of Chinese A-share listed companies. We selected the period from 2011 to 2023 as the analysis timeframe. On this basis, first, this study excluded the samples marked as ST or *ST, and insolvent enterprises (LEV > 1), because their financial conditions were abnormal and the financial data might be false. Second, this study also excluded financial and banking listed companies because their main businesses and financial statement structures were too different from those of other industries, and they usually did not have comparability. After excluding the missing values, this study obtained 4599 enterprises, with a total of 39,632 observations.
Geographically, the sample covers all 31 provinces, autonomous regions, and municipalities directly under the central government in mainland China, with a distribution pattern generally consistent with the regional concentration of China’s economic activity. This geographical coverage ensures that the sample captures significant variation in regional economic development, policy environments, and industrial structures, enhancing the representativeness of our findings for understanding supply chain policy effects across different institutional contexts in China.

3.3.3. Data

This study mainly obtained data from the following sources. First, in the patent search platform of the CNIPA (https://pss-system.cponline.cnipa.gov.cn/conventionalSearch, accessed on 18 March 2026), the study retrieved low-carbon technology patent data through the patent search formula. Second, in the China Stock Market Accounting Research (CSMAR) (http://data.csmar.com, accessed on 18 March 2026) platform, this paper obtained variable data at the enterprise level. Third, in the China Statistical Yearbook and China Urban Statistical Yearbook (https://www.stats.gov.cn/sj/ndsj/, accessed on 18 March 2026), this paper obtained variable data at the regional level. The data processing and statistical analysis of this study were conducted using Stata 17.0 software.
Table 3 presents the means, standard deviations, along with the minimum and maximum values of these variables.

4. Research Results

4.1. Parallel Trend and Baseline Regression

4.1.1. Parallel Trend and Sensitivity Analysis

Before using the DID approach, this study needs to conduct a parallel trend test by Formula (2). Figure 3 shows the coefficients (blue dots) and 95% confidence intervals (green bars). Here, 2011 is taken as the base period. This study finds that before 2018, the 0 is within the 95% confidence range of the estimated coefficient. This situation conforms to the parallel trend. After 2018, the estimated parameters were significantly higher than 0, suggesting carbon-reducing technology patents of enterprises included in SCIAPP significantly increased. Additionally, the estimated coefficients showed an improvement in 2017. This is because China issued the guiding document in 2017, and some enterprises may have begun to adjust their corporate strategies.
To further provide evidence of parallel trends, referring to Rambachan & Roth (2019) [40], this study performed a sensitivity analysis using Honest DID approach. According to the common standards, the study set the maximum deviation degree (Mbar) to 0.5. Figure 4 shows the sensitivity analysis results of the parallel trend. The original estimated result is indicated by the red line. When the parallel trend after the policy shock deviates from the pre-shock trend by Mbar times, the estimated results are represented by the blue line. The results indicate that even if the deviation of the parallel trend after the event reaches half of that before the event, the estimation result will not change. This shows that under the condition of relaxing the parallel trend assumption, the result remains unchanged.

4.1.2. Results and Analysis

We conducted a baseline regression analysis using Formula (1). In Table 4, we gradually include control variables in the model from column (1) to column (4). We found that the coefficient of SCIAPP all had a statistical significance of 0.01. As shown in column (4), from the perspective of the economy, enterprises included in SCIAPP approximately increased their low-carbon technology patent applications by 14.2%. This impact magnitude is very high, indicating that SCIAPP is not merely symbolic guidance but a powerful incentive that can substantially change the innovation direction and resource allocation of enterprises. It goes beyond the cost compliance responses that traditional environmental regulations may bring, triggering a profound transformation where enterprises internalize low-carbon transformation as a long-term strategy and carry out proactive innovation. Therefore, Hypothesis H1 is supported.
The results show that a comprehensive industrial policy aimed at enhancing the systematic management capabilities of the supply chain has a high effectiveness in promoting LCTI. By simultaneously establishing institutional pressure, improving organizational capabilities, and enhancing operational efficiency, the supply chain innovation policy provides enterprises with sustainable transformation impetus, which offers a replicable and scalable effective path for achieving low-carbon transformation and promoting high-quality development.

4.2. Endogeneity and Robustness

4.2.1. PSM-DID Approach

First, the study conducted a PSM-DID test. Figure 5 shows the outcomes of the balance test after PSM. The two red lines from left to right represent ±10% of the standardized deviation. The results show that the standard deviation after matching (crosses) is significantly smaller than that before matching (dots). Particularly, after radius matching and nearest neighbor matching, the standardized deviation is within 10%. According to Table 5, we find that the results of the PSM-DID approach are consistent with the baseline regression outcomes.

4.2.2. Placebo Test

Second, the study conducted a placebo test. As shown in Figure 6, the sampling results are approximately normally distributed (the curve). Meanwhile, the values of the estimated parameters (the blue dots) are mostly around 0, which is much smaller than the actual estimated coefficient values (the red vertical dotted lines), and do not reach the significance level (the red horizontal dotted lines). Therefore, the research results are robust.

4.2.3. Eliminating the Impact of Other Policies

Third, the study controlled for other policies that might confound the research findings, including CET, BD, MI and DF. Table 6 indicates that, even after accounting for the confounding effects of other policies, SCIAPP continues to have a significant positive effect on enterprises’ LCTI.

4.2.4. Change the Control Group

Fourth, the study replaced the control group. Table 7 shows that after replacing the control group to improve the comparability of the samples, SCIAPP still significantly promoted enterprise LCTI.

4.2.5. Replacement Measures and Models Tests

Fifth, the study replaced the variable measure with the model. Table 8 shows that the results of this study are not sensitive to the variable measurement methods and model settings.

4.2.6. Spillover Effects Test

Sixth, the study controlled for potential spillover effects. On the one hand, it controlled for spillover effects within the supply chain. As shown in columns (1) and (2) of Table 9, after removing the suppliers and customers of the pilot enterprises or including Spillover1, the research results are consistent with the baseline regression results. On the other hand, the study controlled for spillover effects within the same region and industry. As shown in columns (3) and (4) of Table 9, after excluding enterprises in the same region and industry as the pilot enterprises, or after including Spillover2, the research results are consistent with the baseline regression results. We found that regardless of whether the impact was transmitted through the supply chain upstream and downstream or through the competition channels within the same region and industry, SCIAPP did not have a significant spillover effect on non-pilot enterprises.
This is because, first, as a pilot policy with clear boundaries and resource allocation, the priority financing and other incentive measures of SCIAPP are mainly targeted at the selected enterprises. Non-pilot enterprises have difficulty automatically sharing these policy benefits. Second, the supply chain collaboration and green transformation of pilot enterprises rely on specific internal management capabilities and government connection channels. Even if the downstream supporting enterprises are indirectly affected, they lack sufficient motivation or ability to imitate the in-depth innovation of pilot enterprises in the short term. Finally, non-pilot enterprises in the same region and industry may face the “competition exclusion” effect. After the pilot enterprises accelerate their low-carbon transformation with policy support, they intensify market competition, resulting in the innovation resources of non-pilot enterprises being occupied, thereby offsetting the potential positive spillover.

4.2.7. Lag Effect and Other Robustness Tests

Seventh, this study also conducted a series of additional robustness tests. On the one hand, it specifically examined potential lag effects in corporate innovation. As shown in Table 10, with the increase in the lag period, the estimated coefficient gradually decreases, but it is still significantly positive. This result indicates that the lag effect exists and gradually decreases over time. Despite this, the research results remain robust.
On the other hand, this study also incorporates interaction fixed effects into the model or alters the clustering method for standard errors to conduct robustness tests. As shown in Table 11, this result is not significantly affected by lag effects, industrial changes, and so on.

4.3. Mechanism Tests

4.3.1. Green Supply Chain Management

Using Formulas (3) and (4), we first examine the greenization mechanism. Table 12 Panel A shows that SCIAPP exerts a substantial positive effect on an enterprise’s environmental management system and environmental outcomes. Meanwhile, both ES_fit and EP_fit obtained through the first stage of regression fitting have a positive impact on LCTI. The above results indicate that SCIAPP can promote LCTI by improving green management of the supply chain.
SCIAPP sets systematic and institutionalized high standards for enterprises’ environmental management, which makes establishing a complete internal environmental protection system the primary and necessary response for enterprises to cope with compliance pressure and obtain institutional legitimacy. At the same time, policy-guided green procurement and market orientation directly link environmental performance with the economic benefits of enterprises, motivating enterprises not only to establish systems but also to pursue substantial improvements in environmental performance to obtain market legitimacy.
SCIAPP, through a well-established institutional framework, provides strategic guidance, resource support, and organizational foundation for the development of low-carbon technologies, enabling innovative activities to be carried out systematically and on a regular basis. Moreover, higher environmental performance ratings send positive signals of low-carbon commitment to the market, helping enterprises obtain green financing, win customer preferences, and thereby transform their legitimacy advantages into tangible market benefits and research and development funds, forming a sustainable and virtuous cycle.

4.3.2. Digital Supply Chain Management

Second, through Formulas (3) and (4), we conduct an examination of the digital mechanism. Table 12 Panel B shows that SCIAPP substantially accelerates the digital transformation of enterprises, which strongly validates theoretical expectations regarding the digital mechanism mentioned earlier. Meanwhile, both Digital1_fit and Digital2_fit obtained through the first stage of regression fitting have a positive impact on LCTI. The above results indicate that SCIAPP can promote LCTI by improving digital management of the supply chain.
Through directly advocating the application of modern information technologies, SCIAPP provides clear policy guidance and legitimacy endorsement to enable enterprises to undergo digital transformation, prompting enterprises to increase strategic declarations and resource investment in the digital field.
This deepening of the digitalization process provides dual empowerment for LCTI. First, AI and big data technologies enable enterprises to precisely monitor and analyze their own and each link of the supply chain’s energy consumption and carbon footprint, thereby accurately identifying the bottlenecks for emission reduction and the key areas for research and development, shifting LCTI from a broad approach to a meticulous one. Second, technologies like blockchain and cloud platforms establish a trustworthy and real-time data sharing environment, significantly reducing the collaborative costs for upstream and downstream enterprises in terms of low-carbon goals, technical standards, and research resources [27], making cross-organizational joint low-carbon technology research possible, thereby enhancing the efficiency and success rate of innovation.

4.3.3. Efficient Supply Chain Management

Third, through Formulas (3) and (4), we conduct an examination of the efficiency mechanism. Table 12 Panel C shows that SCIAPP can enhance the operational efficiency of enterprises and reduce the default distance. This is highly consistent with the goal of SCIAPP, which aims to achieve cost reduction and efficiency improvement through supply chain collaborative integration. Meanwhile, both Risk_fit and Default_fit obtained through the first stage of regression fitting have a positive impact on LCTI. The above results indicate that SCIAPP can promote LCTI by improving supply chain efficiency management.
The efficient mechanism is manifested in the following aspects. First, the improvement of operational efficiency means that the operating costs and capital occupation per unit output can be reduced, and the released cash flow and profits provide a crucial financial buffer and capital guarantee for enterprises to invest more resources in long-cycle and high-risk low-carbon technology research and development. Second, a higher default distance means that the enterprise has a stronger ability to resist market fluctuations, which will reduce the management’s concern about the failure risk of innovation projects and enable them to be more willing to make strategic investments in exploratory and cutting-edge low-carbon technologies. Finally, enterprises with good operational conditions can attract external green investment and R&D talents, and convert the efficiency dividends obtained from supply chain collaboration into a shared fund for jointly investing in low-carbon process improvements with suppliers.

4.4. Heterogeneity Analysis

4.4.1. Low-Carbon Technologies Classification

According to the Green and Low-Carbon Technology Patent Classification System, we classify LCTI into five categories, namely, fossil energy carbon reduction technology, energy conservation and energy recovery and utilization technology, clean energy technology, energy storage technology, and CCUS (carbon capture, utilization and storage) technology. Based on this classification, we conducted regression tests on these five techniques, respectively. Table 13 reports the results of the technical heterogeneity analysis. The coefficient values of SCIAPP are all positive, which, to some extent, once again indicates the robustness of the results of this study.
In terms of statistical significance, the positive effect of SCIAPP on the innovation of the other four types of low-carbon technologies is significant at the 0.01 level, except for the fossil energy carbon reduction technology. This is because China has clearly put forward the goal of carbon neutrality, and policy signals are gradually tilting towards clean energy. Under the guidance of SCIAPP, enterprises are more inclined to lay out new energy technologies such as photovoltaic and wind power to seize the future market and gain long-term competitive advantages, rather than continue to invest in the fossil energy path. This strategic substitution effect weakens the policy response of carbon reduction technology in fossil energy [46].
Furthermore, from an economic significance perspective, the coefficient value of SCIAPP for CCUS technological innovation is also relatively small. This is because, first, CCUS is currently still in the early stage of industrialization, with complex technologies, huge investments, long return cycles, and economic benefits highly dependent on carbon pricing mechanisms and subsidy policies. Second, the implementation of CCUS usually requires cross-enterprise and cross-regional pipeline and sequestration infrastructure support, which exceeds the collaborative scope of a single supply chain unit. Third, in terms of policy priority, SCIAPP places more emphasis on front-end carbon reduction rather than post-end governance. When enterprises face limited resources and clear performance expectations, they are more inclined to choose mature and quick-acting technical paths.

4.4.2. External Environmental Supervision

Furthermore, we will explore the effect of external environmental supervision on the relationship between SCIAPP and LCTI. Specifically, the study mainly focuses on whether the influence of SCIAPP on LCTI varies depending on the different environmental certifications and reports of enterprises. Table 14 reports the results of this heterogeneity analysis. First, the study divided the samples into two groups based on whether the enterprises had ISO14001 [47] environmental certifications. The results showed that compared to enterprises without third-party environmental certifications, the innovation effect for enterprises with such certifications was much stronger. Second, the study also categorized enterprises into two groups based on the medium through which they disclosed environmental information. The findings revealed SCIAPP had a notable positive effect solely on enterprises that released independent environmental reports or social responsibility reports.
This result can be reasonably explained by the theory of legitimacy. First, the ISO14001 certification, as an internationally recognized third-party environmental management system standard, indicates that these enterprises have established a systematic environmental management foundation. When these enterprises face the new pressure brought by SCIAPP, their internal processes, resources, and compliance culture can more quickly align with the policy requirements, efficiently converting the institutional pressure into low-carbon innovative actions, thereby demonstrating greater policy response flexibility.
Second, the act of releasing independent reports is itself a strategic initiative taken by enterprises to actively disclose environmental information to stakeholders and seek legitimacy recognition. Such enterprises are more sensitive to policy signals and are better at incorporating participation in pilot programs and conducting LCTI as part of their environmental narratives to consolidate and enhance their green reputation. As a result, they can obtain greater innovation incentives from policies. On the contrary, enterprises lacking these prerequisites have a weaker ability to internally digest and transform policy pressures, leading to less obvious policy effects.

4.4.3. Systems and Financial Resources

This study further explores the effect of institutional resources and financial resources on the connection between SCIAPP and LCTI. Specifically, the study mainly focuses on whether the effect of SCIAPP on LCTI varies based on the nature of the enterprise’s ownership and financing limitations. Table 15 presents outcomes of heterogeneity analysis. First, the study categorized the samples into two groups according to whether the enterprises were state-owned. The results showed that compared to Non-SOEs, the innovation effect for SOEs was much stronger. Second, referring to Cheng et al. (2014) [48], the study constructed the WW index to assess the financing limitations of enterprises and split them into two groups based on the median. The results indicated that SCIAPP had a significant positive effect only on enterprises with lower financing constraints.
This result is highly consistent with the dynamic capability theory and the Resource-Based View. First, SOEs usually have inherent advantages in terms of the relationship between the government and enterprises, access to policy information, and undertaking strategic tasks. SCIAPP, as an industrial policy jointly promoted by multiple government departments, has its assessment, incentives, and resource allocation closely linked to the internal network. SOEs can better understand policy intentions and are more likely to obtain supporting financial, tax, and other supportive resources, thereby being able to efficiently convert policy opportunities into substantive investments in LCTI.
Second, LCTI requires a continuous and stable flow of funds as a guarantee. Enterprises with weaker financing constraints have more abundant internal cash flow and more convenient external financing channels, which provide a crucial financial foundation for them to bear innovation risks and make long-term research and development investments. On the contrary, enterprises with severe financing constraints, even if they have the intention to innovate, are often constrained by the pressure of survival and find it difficult to make strategic low-carbon investments.

4.4.4. Capital-Intensive and Labor-Intensive

This study further explores the differences in the connection between SCIAPP and LCTI in capital-intensive and labor-intensive enterprises. Table 16 presents the results of the heterogeneity analysis. First, in this study, the samples were divided into two groups based on the median ratio of fixed assets to total assets of enterprises. The results show that, compared with enterprises with lower capital intensity, enterprises with higher capital intensity have a much stronger innovation effect. Second, this study also divided them into two groups based on the median of per capita fixed assets. The results show that SCIAPP only has a significant positive impact on enterprises with relatively high per capita fixed assets.
The stronger effect of SCIAPP on LCTI in capital-intensive firms can be explained by several factors. First, capital-intensive enterprises possess larger fixed asset bases, making them primary targets for supply chain finance provisions that facilitate green equipment upgrades and low-carbon retrofits. Second, these firms typically have longer production chains and greater energy consumption, creating both regulatory pressure and economic incentives to adopt energy-saving technologies and process improvements. Third, capital-intensive industries, e.g., steel, chemicals, and power generation, face stricter environmental regulations and public scrutiny, amplifying the legitimacy pressure transmitted through SCIAPP’s green supply chain requirements.
In contrast, labor-intensive firms operate with thinner profit margins, limited financing capacity, and shorter investment horizons, constraining their ability to undertake long-cycle, high-cost low-carbon technology innovations. Additionally, labor-intensive sectors often rely on incremental process adjustments rather than fundamental technological overhauls, making them less responsive to capital-intensive transformation policies. These findings align with our earlier technology-type heterogeneity results, where SCIAPP significantly promoted energy-saving and clean energy technologies—areas where capital-intensive firms possess comparative advantages.

4.5. Extensive Analysis: Supply Chain Resilience

Furthermore, this study examines whether SCIAPP, after promoting enterprises’ LCTI, can enhance supply chain robustness. Following Gölgeci and Kuivalainen (2020) [23], this study measures supply chain resilience as a composite index encompassing five dimensions. Resistance is measured by the natural logarithm of the accounts receivable-to-revenue ratio, where smaller values indicate stronger supply chain stability. Recovery capacity captures firms’ ability to rebound from external shocks, operationalized using residuals from performance regressions. Positive residual changes indicate enhanced recovery. Operational capability is measured through accounts payable and receivable turnover rates. Demand-supply alignment reflects inventory adjustment magnitude, calculated as the absolute change in net inventory between consecutive periods (log-transformed), with smaller values indicating better alignment. Renewal capacity captures innovation-driven adaptation, measured by R&D efficiency. These five dimensions are integrated into a comprehensive resilience index using the entropy weighting method. To facilitate the display of the coefficient, we expand this index by 100 times.
Table 17 shows the findings of the exploratory analysis. As shown in columns (1) and (2), the results reveal that SCIAPP and enterprises’ LCTI significantly enhance supply chain resilience. To explore why LCTI enhances supply chain resilience, we test moderating effects using proxies for corporate green management (ES, EP) and digital transformation (Digital1, Digital2). As shown in Table 17, columns (3)–(6), the interaction terms LCTI × W are all significantly positive. This suggests that LCTI strengthens resilience through two complementary channels. First, green-oriented firms reduce dependence on volatile fossil fuels via cleaner energy structures, improving resistance and recovery capacity. Second, digitally advanced firms leverage real-time data and agile processes to enhance operational capability and demand-supply alignment. These firm-level technological and managerial capabilities, when integrated through supply chain coordination, converge into network-level adaptive capacity, enabling the entire system to withstand long-term transitions such as climate regulations and energy transformations. Thus, our findings reveal the complete transmission chain from policy-driven LCTI to enhanced supply chain resilience.

5. Discussion

This study engages in a profound dialogue, verification, and expansion with existing literature, offering fresh theoretical perspectives and empirical evidence for understanding the micro-mechanisms and macro-consequences of the low-carbon transformation driven by supply chain management policies.
First, at the policy effect level, this study not only confirmed but also deepened the classic theory regarding the role of institutional pressure in driving green innovation. Existing studies have primarily concentrated on direct impacts of environmental regulatory tools such as carbon taxes and emission rights trading [3]. However, this study found that a comprehensive policy centered on supply chain collaborative innovation can also have a significant quasi-regulatory effect on LCTI. This verifies the explanatory power of the legitimacy theory, which states that enterprises will actively innovate to reshape their legitimacy to satisfy the evolving expectations of stakeholders for sustainable supply chains. More importantly, this study reveals the heterogeneity of this effect. Policy dividends are more concentrated among enterprises that have established environmental management systems or have actively conducted environmental disclosures. This expands existing knowledge, indicating that external policy pressure must be combined with the internal response capabilities of enterprises to efficiently transform into innovation outcomes.
Second, at the mechanism level, this study systematically integrates and empirically validates the multi-dimensional driving framework of greenification, digitalization, and efficiency. Existing literature either separately analyzes the empowering effect of digital technology [27] or explores the optimization of emission reduction through supply chain cooperation [33]. This study demonstrates that SCIAPP functions through three paths simultaneously, including greenification exerts institutional pressure, digitalization provides innovative tools and collaborative platforms, and efficiency creates the resource foundation and financial space for implementing innovations. This is in line with the fundamental concept of dynamic capability theory that enterprises need to integrate internal and external resources to cope with environmental changes, and extends the applicable scenario of this theory from internal enterprise management to cross-organizational supply chain network governance.
Finally, this study extends the discussion of policy impacts from the enterprises’ own innovation to the resilience of the whole supply chain network, expanding the value assessment dimension of LCTI. Some studies have verified the direct impact of policies on enterprises’ innovation or emission reduction [11], while this study found that LCTI driven by policies can ultimately strengthen the resilience of the supply chain in multiple dimensions, such as resistance, recovery, and operation. This conclusion is of crucial significance, as it elevates the strategic significance of enterprises’ low-carbon activities from compliance costs or social responsibility to the core assets for building long-term competitive advantages and risk-resistance capabilities. This provides a causal evidence chain from China’s policy practice for the conceptual discussions on low-carbon supply chain resilience [1,2], indicating that low-carbon transformation and resilience-building practices are coordinated and unified, jointly constituting the cornerstone of a sustainable supply chain.


6. Conclusions, Recommendations and Limitations

6.1. Conclusions and Implications

6.1.1. Conclusions

Amid the global climate crisis and carbon emission goals, the low-carbon transformation of supply chains has become a focus of attention. Using the panel data of listed companies, this study regards China’s SCIAPP as a quasi-experimental approach and employs the DID approach to explore how supply chain management drives enterprises’ LCTI.
This study found that, first, SCIAPP significantly promotes LCTI in enterprises. This result remained valid after conducting various endogeneity and robustness tests. Second, SCIAPP mainly promotes LCTI through three mechanisms, including promoting enterprise greening, digitalization, and efficiency enhancement. Third, this study found that SCIAPP has a stronger impact on enterprises that have obtained ISO14001 and independently released environmental protection reports, state-owned enterprises, enterprises with weaker financing constraints, and enterprises with higher capital intensity. Moreover, this study also found that SCIAPP and LCTI can significantly enhance supply chain resilience.

6.1.2. Implications

This study carries important theoretical and practical implications. Theoretically, by integrating institutional theory and dynamic capability theory, we reveal that supply chain policies drive low-carbon innovation not merely through coercive pressure, but by systematically reshaping firms’ capability endowments via green orientation, digitalization, and efficiency enhancement. This extends the understanding of how macro-level policy interventions translate into micro-level technological change.
Practically, our findings demonstrate that well-designed supply chain policies can serve as effective instruments for achieving dual goals of carbon reduction and industrial upgrading. The identified heterogeneity patterns offer nuanced guidance for policymakers. Targeted support for capital-intensive firms, state-owned enterprises, and ISO14001-certified firms can amplify policy effectiveness, while tailored measures are needed for labor-intensive and financially constrained enterprises.
Furthermore, the finding that LCTI enhances supply chain resilience suggests that low-carbon transformation contributes not only to environmental sustainability but also to economic stability, a crucial insight for countries navigating the twin challenges of climate action and supply chain security. For developing economies seeking to green their industrial base while maintaining competitiveness, China’s SCIAPP experience offers a valuable policy template.

6.2. Policy and Managerial Recommendations

Building on the above findings, this study offers important implications for both policymakers and enterprise managers.

6.2.1. Policy Recommendations

For policymakers, several recommendations emerge. First, the government should shift the green requirements from voluntary indicators to mandatory and measurable standards for supply chain carbon footprints, guiding enterprises to shift from compliance-based emission reduction to strategic carbon management. Second, policies should increase financial support, especially encouraging the implementation of blockchain and the Internet of Things technology in carbon tracking, to reduce the technical barriers and trust costs for enterprises’ collaborative emission reduction. Third, the government can quantify the benefits brought by supply chain collaboration and use the assessment results as the core basis for providing enterprises with tax incentives, preferential financing, etc., to form a virtuous cycle.
This study also suggests that the government should improve the differentiated policy system for the supply chain. For SOEs and ISO14001-certified enterprises that already have a good foundation, the policy focus should be on setting higher industry-leading targets, such as near-zero carbon supply chain pilot projects, and encouraging them to open up their own technologies and platform capabilities to drive the transformation of small and medium-sized enterprises within the industrial chain collectively. For numerous small and medium-sized enterprises and private enterprises facing transformation bottlenecks, a step-by-step support system should be constructed. First, the government can provide low-cost or even free green transformation diagnosis to help them establish basic capabilities. Second, the government can set up a dedicated supply chain green transformation fund, using methods such as interest subsidy loans and risk compensation, to specifically alleviate its financing constraints and reduce the initial investment risk of LCTI.
Meanwhile, this study also suggests that supply chain resilience indicators should be formally incorporated into the pilot assessment system, such as the self-sufficiency rate of clean energy at key nodes, the proportion of diversified and low-carbon alternatives for key materials, digital early warning, and recovery time, etc. The government should also support and finance leading enterprises to take the lead in conducting joint assessments and responses to supply chain climate risks, and promote upstream and downstream enterprises to jointly invest in projects such as distributed renewable energy and circular economy infrastructure, which have both emission reduction and risk-resistance functions. Through policy guidance, the individual LCTI of enterprises can be systematically coupled to form the collective adaptive capacity of the entire industrial chain to cope with energy fluctuations and climate shocks.
Furthermore, developed countries can learn from China’s gradual policy model from pilot projects to full-scale implementation. They can also leverage their advantages in digital technology and financial markets to design more detailed supply chain carbon disclosure and green financial products, and encourage the transformation of global supplier networks. For developing countries with similar national conditions to China, they can prioritize a few key industries with significant impact on the national economy and employment, and an export-oriented nature, to implement focused supply chain innovation pilot projects.

6.2.2. Managerial Recommendations

For enterprise managers, this study provides actionable insights. First, managers should recognize that supply chain innovation policies like SCIAPP offer more than regulatory pressure; they present strategic opportunities for capability building. The three identified mechanisms suggest concrete action pathways, proactively adopting green management practices, accelerating digital transformation across both internal operations and external supply chain platforms, and continuously optimizing operational efficiency to generate resource slack for innovation investment.
Second, capital-intensive firms and those with stronger environmental foundations should leverage their advantages to pursue deeper, industry-leading innovations, while labor-intensive or resource-constrained enterprises should focus on building foundational capabilities through available policy supports.
Third, managers should view LCTI not merely as a compliance cost but as a strategic investment in long-term competitiveness. Our analysis demonstrates that LCTI ultimately enhances supply chain resilience through diversified energy structures and digital integration, capabilities increasingly critical in an era of climate uncertainty and energy transition.
Finally, managers should actively engage with policy pilots and participate in government-supported collaborative initiatives, recognizing that individual firm innovations, when coordinated across supply chain networks, generate systemic resilience that benefits all participants.

6.3. Limitations and Future Research

This study has several limitations. First, while our sample comprises 39,632 firm-year observations covering all provinces in mainland China, it consists exclusively of listed enterprises, which are typically larger in scale and possess greater resources and innovation capabilities compared to unlisted small and medium-sized enterprises (SMEs). This sample restriction may introduce uncertainty regarding the generalizability of our findings. As SMEs are also important contributors to supply chain innovation and low-carbon transformation, their exclusion potentially biases the estimated policy effects. Specifically, if SMEs respond differently to SCIAPP, for instance, facing greater resource constraints but demonstrating higher flexibility in adopting green practices, our results based on large firms may not fully capture the policy’s overall impact. Consequently, the presented conclusions should be interpreted with caution when extrapolating to the broader population of SMEs. Future research should incorporate SME data and conduct comparative analyses to examine potential heterogeneous effects across firm size categories, thereby providing a more complete understanding of SCIAPP’s economy-wide implications.
Second, this study did not conduct a detailed analysis of different technical approaches to low-carbon innovation. LCTI encompasses heterogeneous technical pathways, including fossil energy decarbonization, energy saving and recovery, clean energy, energy storage, and CCUS technologies, each with distinct cost structures, risk profiles, and implementation requirements. The specific nature of a given enterprise, such as its industry affiliation, technological endowment, and resource constraints, invariably necessitates compromise solutions among these pathways. We conducted analyses in the heterogeneity section to examine SCIAPP’s differential effects across these five technological domains. However, these analyses remain exploratory and do not fully capture the complex trade-offs firms face when choosing among technological pathways. Future research should develop more granular classifications of LCTI and examine how firm-level characteristics moderate technology-specific responses to supply chain policies, thereby providing more precise guidance for policy design.
Third, while our spillover tests address observable supply chain partners, we cannot fully rule out potential spillovers to non-listed suppliers of pilot enterprises. These suppliers are not included in our sample due to data availability, yet they may be indirectly influenced by SCIAPP through their commercial relationships with pilot firms. If such spillovers exist and positively affect non-listed suppliers’ innovation, they could lead to a violation of the SUTVA. However, our robustness tests mitigate this concern. Future research with access to supply chain surveys or comprehensive databases covering both listed and non-listed firms could directly examine these cross-sector spillover effects and provide a more complete picture of SCIAPP’s economy-wide impact.

Author Contributions

Conceptualization, X.Q., W.W., Y.Z. and C.Z.; Methodology, C.Z.; Validation, W.W. and Y.Z.; Formal analysis, X.Q., W.W., Y.Z. and C.Z.; Data curation, X.Q., W.W. and C.Z.; Writing—original draft, X.Q., W.W., Y.Z. and C.Z.; Writing—review & editing, X.Q., W.W., Y.Z. and C.Z.; Visualization, X.Q., W.W. and Y.Z.; Funding acquisition, X.Q. All authors have read and agreed to the published version of the manuscript.

Funding

This study was funded by the following projects: CUFE Postgraduate students support program for the integration of research and teaching, “Research on the Opportunities, Challenges and Paths of AI-Empowered Mainstream Ideological Construction” (No. 2025216).

Institutional Review Board Statement

Not applicable.

Informed Consent Statement

Not applicable.

Data Availability Statement

The data supporting the conclusions of this article will be made available by the authors on request.

Conflicts of Interest

The authors declare no conflict of interest.

References

  1. Luo, X.; Kang, K.; Lu, L.; Yu, C.; Li, C.; Li, B.; Hu, S.; Qi, X.; Zhou, Y. Resilience evaluation of low-carbon supply chain based on improved matter-element extension model. PLoS ONE 2024, 19, e0301390. [Google Scholar] [CrossRef] [Scilit]
  2. Ma, J.; Ni, J.; Zhao, Y.; Wu, J. Environmental regulation, digital technology application, and low-carbon supply chain resilience: Evidence from China. J. Environ. Manag. 2025, 389, 126087. [Google Scholar] [CrossRef] [Scilit]
  3. Cai, J.; Jiang, F. Decision models of pricing and carbon emission reduction for a low-carbon supply chain under cap-and-trade regulation. Int. J. Prod. Econ. 2023, 264, 108964. [Google Scholar] [CrossRef] [Scilit]
  4. Li, S.; Qu, S.; Wahab, M.I.M.; Ji, Y. Low-Carbon supply chain optimisation with carbon emission reduction level and warranty period: Nash bargaining fairness concern. Int. J. Prod. Res. 2024, 62, 6665–6687. [Google Scholar] [CrossRef] [Scilit]
  5. Hamidoğlu, A.; Weber, G.W. A novel Nash-based low-carbon implementation in agricultural supply chain management. J. Clean. Prod. 2024, 449, 141846. [Google Scholar] [CrossRef] [Scilit]
  6. Wang, J.; Cai, X. Research on Decision-Making and Coordination of Closed-Loop Supply Chain Under Green and Low-Carbon Perspective. Sustainability 2024, 16, 10591. [Google Scholar] [CrossRef] [Scilit]
  7. Ye, C.; Weng, S.; Zhang, X. Research on low carbon collaborative strategy of supply chain under blockchain information-sharing mechanism. Int. J. Environ. Sci. Technol. 2025, 22, 4655–4670. [Google Scholar] [CrossRef] [Scilit]
  8. El Harraki, I.; Abedin, M.Z.; Belhadi, A.; Kamble, S.; Zkik, K.; Oudani, M. Data-driven control and a prey–predator model for sourcing decisions in the low-carbon intertwined supply chain. Bus. Strategy Environ. 2024, 33, 9141–9160. [Google Scholar] [CrossRef] [Scilit]
  9. Suchman, M.C. Managing legitimacy: Strategic and institutional approaches. Acad. Manag. Rev. 1995, 20, 571–610. [Google Scholar] [CrossRef] [Scilit]
  10. Teece, D.J.; Pisano, G.; Shuen, A. Dynamic capabilities and strategic management. Strateg. Manag. J. 1997, 18, 509–533. [Google Scholar] [CrossRef] [Scilit]
  11. Pu, J.; Chun, W.; Yang, H. Low-carbon strategy and coordination for a two-echelon automotive supply chain considering dual credit policy. Comput. Ind. Eng. 2024, 192, 110229. [Google Scholar] [CrossRef] [Scilit]
  12. Lin, W.; Wang, Y.; Zhang, Q.; Peron, M.; Lu, J. Emerging opportunities or paradoxes: Assessing the effect of digital technology adoption on corporate carbon performance. J. Environ. Manag. 2025, 391, 126399. [Google Scholar] [CrossRef] [Scilit] [PubMed]
  13. Yang, P.; Lv, Y.; Chen, J.; Shen, H.; Xu, Y. Can the digitization of supply chains promote the low-carbon transformation of enterprises? A case study of listed companies in China. Energy Econ. 2025, 143, 108212. [Google Scholar] [CrossRef] [Scilit]
  14. Du, Q.; Zhang, Y.; Zeng, L.; Ma, Y.; Li, S. Dynamic assessment of the abatement effects of the low-carbon practices in the prefabricated building supply chain. Eng. Constr. Archit. Manag. 2025, 32, 4918–4945. [Google Scholar] [CrossRef] [Scilit]
  15. Wesseling, J.; Kieft, A.; Fuenfschilling, L.; Hekkert, M. How socio-technical regimes affect low-carbon innovation: Global pressures inhibiting industrial heat pumps in the Netherlands. Energy Res. Soc. Sci. 2022, 89, 102674. [Google Scholar] [CrossRef] [Scilit]
  16. Qing, L.; Shen, P.; Nam, E.Y.; Ma, X. Does supply chain digitalization improve corporate energy performance? A quasi-natural experiment from the Chinese supply chain innovation and application pilot policy. Energy Econ. 2025, 147, 108567. [Google Scholar] [CrossRef] [Scilit]
  17. Bu, C.; Zhang, K.; Shi, D.; Wang, S. Does environmental information disclosure improve energy efficiency? Energy Policy 2022, 164, 112919. [Google Scholar] [CrossRef] [Scilit]
  18. Lu, Z. Research on the Correlation between ESG Performance and Corporate Innovation Capability from the Perspective of CiteSpace. Environ. Soc. Gov. 2025, 2, 9–14. [Google Scholar] [CrossRef] [Scilit]
  19. Wu, F.; Hu, H.; Lin, H.; Ren, X. Enterprise digital transformation and capital market performance: Empirical evidence from stock liquidity. Manag. World 2021, 37, 130–144. [Google Scholar]
  20. Zhen, H.; Wang, X.; Fang, H. Administrative protection of intellectual property rights and corporate digital transformation. Econ. Res. J. 2023, 11, 62–79. [Google Scholar]
  21. Altman, E.I. The Prediction of Corporate Bankruptcy: A Discriminant Analysis; University of California: Los Angeles, CA, USA, 1967. [Google Scholar]
  22. Bharath, S.T.; Shumway, T. Forecasting default with the Merton distance to default model. Rev. Financ. Stud. 2008, 21, 1339–1369. [Google Scholar] [CrossRef] [Scilit]
  23. Gölgeci, I.; Kuivalainen, O. Does social capital matter for supply chain resilience? The role of absorptive capacity and marketing-supply chain management alignment. Ind. Mark. Manag. 2020, 84, 63–74. [Google Scholar] [CrossRef] [Scilit]
  24. Chen, W.; Zhang, W.; Chen, J.; Wu, X.; Geng, J.; Shi, J.; Xu, J. Performance evaluation of low-carbon development at key nodes in the maritime supply chain. Int. J. Logist. Res. Appl. 2025, 28, 1522–1545. [Google Scholar] [CrossRef] [Scilit]
  25. Yu, C.; Zhang, Y.; Liu, L.; Archibald, T.W. Low-carbon supply chain strategy and contract coordination considering manufacturers′ fairness concerns. Oper. Res. 2024, 24, 64. [Google Scholar] [CrossRef] [Scilit]
  26. Wu, A.; Zhang, R.; Sun, Y.; Sun, L.; Wang, S.; Wang, X. Differential games of supply chain on consideration of low-carbon reference effect under different carbon quota allocation methods. Systems 2024, 12, 371. [Google Scholar] [CrossRef] [Scilit]
  27. Lai, Z.; Lou, G.; Chung, S.H.; Fan, T.; Ma, H.; Yu, M. The bright side of low-carbon technology sharing in a capital-constrained supply chain. Transp. Res. Part E Logist. Transp. Rev. 2025, 193, 103827. [Google Scholar] [CrossRef] [Scilit]
  28. Wang, J.; Wang, D.; Yuan, Y. Research on low-carbon closed-loop supply chain strategy based on differential games, dynamic optimization analysis of new and remanufactured products. AIMS Math. 2024, 9, 32076–32101. [Google Scholar] [CrossRef] [Scilit]
  29. Wang, Z.; Feng, Y.; Yao, N.; Lin, O.; Li, Q.; Liu, B. Impact of policy interventions on low-carbon technology innovation diffusion in supply networks. Manag. Decis. Econ. 2024, 45, 5040–5053. [Google Scholar] [CrossRef] [Scilit]
  30. Wang, M.; Wu, J.; Chen, X.; Zhu, X. Grandfathering or benchmarking? The performance of implementing blockchain technology in a low-carbon supply chain. Energy 2023, 284, 128691. [Google Scholar] [CrossRef] [Scilit]
  31. Wang, M.; Chen, X.; Tan, Y.; Zhu, X. How does blockchain technology affect the strategic financing decisions of the platform supply chain with low-carbon product? Kybernetes 2024, 53, 4397–4430. [Google Scholar] [CrossRef] [Scilit]
  32. Zhu, C.; Cheng, Z.; Li, J. Is it Possible for Government Intervention to Support Low-Carbon Transition in Agriculture through Agri-Environmental Protection? Evidence from the Waste Agricultural Film Recycling Pilot. Pol. J. Environ. Stud. 2025, 34, 1973–1993. [Google Scholar] [CrossRef] [Scilit]
  33. Li, N.; Deng, M.; Mou, H.; Tang, D.; Fang, Z.; Zhou, Q.; Cheng, C.; Wang, Y. Government participation in supply chain, low-carbon technology R&D, and green marketing strategy optimization. Sustainability 2022, 14, 8342. [Google Scholar]
  34. Zhao, J.; Zhang, R.; Wang, Z.; Cui, S. Low-carbon supply chain decision-making and CSR strategy evolution analysis considering heterogeneous consumer preferences. Systems 2024, 12, 283. [Google Scholar] [CrossRef] [Scilit]
  35. Li, Y.; Zhu, C. Unlocking the Value of Data: The Impact of Market Allocation of Data Elements on Corporate Green Innovation. Pol. J. Environ. Stud. 2025, 34, 5669–5686. [Google Scholar] [CrossRef] [Scilit]
  36. Chen, Z.; Zhang, Y.; Wang, H.; Ouyang, X.; Xie, Y. Can green credit policy promote low-carbon technology innovation? J. Clean. Prod. 2022, 359, 132061. [Google Scholar] [CrossRef] [Scilit]
  37. Cheng, Z.; Zhu, C. Positive impacts of green finance on environmental protection investment: Evidence from green finance reform and innovations pilot zone. Heliyon 2024, 10, e33714. [Google Scholar] [CrossRef] [Scilit]
  38. Zheng, Q.; Wan, L.; Wang, S.; Wang, C.; Fang, W. Does ecological compensation have a spillover effect on industrial structure upgrading? Evidence from China based on a multi-stage dynamic DID approach. J. Environ. Manag. 2021, 294, 112934. [Google Scholar] [CrossRef] [Scilit]
  39. Roth, J. Interpreting event-studies from recent difference-in-differences methods. arXiv 2024, arXiv:2401.12309. [Google Scholar] [CrossRef] [Scilit]
  40. Rambachan, A.; Roth, J. An Honest Approach to Parallel Trends, Harvard University: Cambridge, MA, USA, 2019; unpublished manuscript.
  41. Li, Y.; Zhu, C. Regional digitalization and corporate ESG performance. J. Clean. Prod. 2024, 473, 143503. [Google Scholar] [CrossRef] [Scilit]
  42. Wei, X.; Zhao, L.; Cheng, Z.; Feng, J.; Zhu, C. Does the market-oriented reform of mineral resource property rights promote the intensive use of enterprise resources: Evidence from the reform of the mining rights transfer system. Chin. Manag. Stud. 2025. [Google Scholar] [CrossRef] [Scilit]
  43. Li, S.; Shao, Q. Exploring the determinants of renewable energy innovation considering the institutional factors: A negative binomial analysis. Technol. Soc. 2021, 67, 101680. [Google Scholar] [CrossRef] [Scilit]
  44. Di Giuli, A.; Laux, P.A. The effect of media-linked directors on financing and external governance. J. Financ. Econ. 2022, 145, 103–131. [Google Scholar] [CrossRef] [Scilit]
  45. Li, Y.; Zhu, C. Govern digitalization with digitalization: Government digital governance and corporate false digital disclosure. Int. Rev. Econ. Financ. 2026, 106, 104974. [Google Scholar] [CrossRef] [Scilit]
  46. Miroshnichenko, D.V.; Drozdnik, I.D.; Kaftan, Y.S.; Ivanova, E.V.; Sirokotyaga, K.N.; Desna, N.A. Kinetic characteristics of coal oxidation. Coke Chem. 2012, 55, 87–96. [Google Scholar] [CrossRef] [Scilit]
  47. ISO 14001:2015; Environmental Management Systems—Requirements with Guidance for Use. International Organization for Standardization: Geneva, Switzerland, 2015. Available online: https://www.iso.org/standard/60857.html (accessed on 18 March 2026).
  48. Cheng, B.; Ioannou, I.; Serafeim, G. Corporate social responsibility and access to finance. Strateg. Manag. J. 2014, 35, 1–23. [Google Scholar] [CrossRef] [Scilit]
Figure 1. Graphical Summary [15,16,17,18,19,20,21,22,23].
Sustainability 18 03221 g001
Figure 2. Research Framework.
Sustainability 18 03221 g002
Figure 3. Dynamic Effect. Note: The blue dots represent the estimated coefficients, and the green bar represents the 95% confidence interval. The red horizontal line indicates that the coefficient value is 0, and the red vertical line indicates the implementation year of SCIAPP (2018).
Sustainability 18 03221 g003
Figure 4. Sensitivity Analysis. Note: The horizontal axis represents the degree of deviation from the parallel trend, and the vertical axis represents the estimated coefficient and the 95% confidence interval. The red line represents the original estimation result, and the blue line represents the estimation result when the parallel trend deviates from Mbar times.
Sustainability 18 03221 g004
Figure 5. Balance Test. Note: The horizontal axis represents the standardized bias (%), and the vertical axis represents the covariates. The dots represent the standardized bias of covariates in the absence of matching, and the vertical coordinate represents the standardized bias of covariates after matching. The two red lines from left to right represent a standardized bias of −10% and 10%, respectively.
Sustainability 18 03221 g005
Figure 6. Placebo Test. Note: The horizontal axis represents the estimated coefficient value, the left vertical axis represents the kernel density, and the right vertical axis represents the p-value. The hollow dots represent the estimation results, and the curves indicate the kernel density distribution of the estimation results. The red vertical dotted line represents the actual estimated coefficient, and the red horizontal dotted line represents the p-value of 0.05.
Sustainability 18 03221 g006
Table 1. Relevant Policies on Supply Chain Innovation in China.
YearPolicyContent
2017Guidelines on Actively Promoting Supply Chain Innovation and Application (https://www.gov.cn/zhengce/zhengceku/2017-10/13/content_5231524.htm, accessed on 18 March 2026)It states that by 2020, several new technologies and models suitable for China’s national conditions will have been developed for supply chain development, and a smart supply chain system covering key industries in China will have been basically established. Around 100 global leading supply chain enterprises will be cultivated, and the supply chain competitiveness of key industries will rank among the top in the world.
2018Notice on Carrying Out Pilot Projects for Supply Chain Innovation and Application (https://www.mofcom.gov.cn/gztz/art/2018/art_307a699ed071497b8104d33b86058258.html, accessed on 18 March 2026)It aims to achieve “five batches”, namely creating a batch of supply chain technologies and models tailored to China’s national context, building a batch of supply chain platforms with strong integration capabilities and high collaborative efficiency, cultivating a batch of leading supply chain enterprises with strong industry-driven capabilities, forming a group of industrial clusters with integrated supply chain systems and strong international competitiveness, and summarizing a batch of replicable and promotable experiences in supply chain innovation and government governance.
2019Notice on Promoting Interconnection between Agriculture and Commerce and Improving the Agricultural Product Supply Chain (https://www.gov.cn/zhengce/zhengceku/2019-10/18/content_5441440.htm, accessed on 18 March 2026)It aims to improve the agricultural product supply chain, enhance the efficiency of agricultural product circulation, promote farmers’ income growth and rural revitalization, and meet the demands of the upgrading of agricultural products. The Ministry of Finance and the Ministry of Commerce have decided to carry out the work of agricultural-business integration.
2020Notice on Further Strengthening the Pilot Work of Supply Chain Innovation and Application (https://www.gov.cn/zhengce/zhengceku/2020-04/15/content_5502671.htm, accessed on 18 March 2026)It emphasizes the simultaneous resumption of production activities at both the upstream and downstream of the supply chain, and also highlights the support for pilot enterprises through supply chain finance.
2022Plan for the Construction of a Modern Circulation System during the 14th Five-Year Plan Period. (https://www.gov.cn/zhengce/zhengceku/2022-01/24/content_5670259.htm, accessed on 18 March 2026)It states that efforts should be made to strengthen the construction of supply chain financial infrastructure, improve the operation mechanism of supply chain finance, and diversify the product range of supply chain finance.
Table 2. Definition and Measurement.
VariableDefinitionSymbolMeasurement
Dependent variableLow-carbon technological innovationLCTIThe number of low-carbon technology invention patents applied (1 unit) + 1, and logarithmic transformation.
Explained variableSupply Chain Innovation and Application Pilot ProgramSCIAPPDID approach, see Section 3.2.1. It is a dummy (0–1) variable.
Control variablesEnterprise sizeSizeTotal assets (1 yuan), and logarithmic transformation.
Listing timeLtimeThe current year—the listing year (1 year), and logarithmic transformation.
Financial leverageLEVTotal debt (1 yuan)/Total assets (1 yuan)
ProfitabilityROENet profit (1 yuan)/Net assets (1 yuan)
Board sizeBoardThe count of board members (1 person), and logarithmic transformation.
Board independenceInd_rThe count of independent directors (1 person)/The count of board members (1 person)
Concentration of shareholdingTop1The shareholding ratio of the largest shareholder (1 unit)
Property Rights NatureSOEIf the enterprise is a state-owned enterprise, it is assigned a value of 1; otherwise, it is assigned a value of 0.
Economic development levelGRPRegional GDP (1 hundred million yuan), and logarithmic transformation.
Industrial structureIndustryThe share of the secondary industry in the gross domestic product (1 unit)
Mechanism variablesGreen Management MechanismESEnvironmental system total score (1 score)
EPEnterprise environmental rating data from Sino-Securities Index Information Service (Shanghai, China) Co., Ltd. (1 score)
Digital Management MechanismDigital1Word frequency method by Wu et al. (2021) [19] (1 unit), and logarithmic transformation.
Digital2Word frequency method by Zhen et al. (2023) [20] (1 unit), and logarithmic transformation.
Efficient Management MechanismRiskZ Score model by Altman (1967) [21] (1 score)
DefaultDefault distance index by Merton model (1 score)
Table 3. Descriptive Statistics.
VariableMeanStd. Dev.MinMax
LCTI0.1690.56506.969
SCIAPP0.0120.10701
Size22.241.35214.94228.697
Ltime2.0530.94703.497
LEV0.4330.210.0070.999
ROE0.0164.507−207.397713.204
Board2.1140.20.6932.89
Ind_r0.3770.0560.1431
Top10.3380.1480.0180.9
SOE0.3460.47601
GRP10.640.7766.40711.818
Industry0.4020.0920.1490.59
Table 4. Results of the Baseline Regression.
VariableStandard Regression
(1)(2)(3)(4)
LCTILCTILCTILCTI
SCIAPP0.148 ***0.143 ***0.143 ***0.142 ***
(0.031)(0.031)(0.031)(0.031)
Size 0.036 ***0.037 ***0.037 ***
(0.004)(0.004)(0.004)
Ltime −0.016 ***−0.019 ***−0.019 ***
(0.006)(0.006)(0.006)
LEV 0.025 *0.026 *0.026 *
(0.014)(0.014)(0.014)
ROE 0.0000.0000.000
(0.000)(0.000)(0.000)
Board −0.015−0.015
(0.020)(0.020)
Ind_r −0.047−0.046
(0.055)(0.055)
Top1 −0.072 ***−0.072 ***
(0.027)(0.027)
SOE −0.002−0.001
(0.010)(0.010)
GRP 0.023
(0.014)
Industry −0.145
(0.090)
_cons0.168 ***−0.607 ***−0.548 ***−0.727 ***
(0.002)(0.091)(0.106)(0.172)
Firm FEControlControlControlControl
Year FEControlControlControlControl
Obs39,63239,63239,63239,632
R20.7330.7340.7340.734
Note: The coefficient values are presented in the table. The table presents the robust standard errors in parentheses, and are denoted by *** for a significance level of 0.01, and * for 0.1.
Table 5. PSM-DID Outcomes.
VariableKernel MatchingRadius MatchingNearest Neighbor Matching
(1)(2)(3)
LCTILCTILCTI
SCIAPP0.130 ***0.139 ***0.185 **
(0.032)(0.031)(0.083)
ControlsControlControlControl
Firm FEControlControlControl
Year FEControlControlControl
Obs31,15930,9471286
R20.7570.7470.892
Note: The coefficient values are presented in the table. The table presents the robust standard errors in parentheses, and are denoted by *** for a significance level of 0.01, and ** for 0.05.
Table 6. Isolating the Impact of Other Policies.
VariableControl CETControl BDControl MIControl DF
(1)(1)(2)(3)
LCTILCTILCTILCTI
SCIAPP0.142 ***0.142 ***0.128 ***0.142 ***
(0.031)(0.031)(0.031)(0.031)
CET0.004
(0.007)
BD −0.001
(0.008)
MI 0.230 ***
(0.046)
DF 0.000
(0.008)
ControlsControlControlControlControl
Firm FEControlControlControlControl
Year FEControlControlControlControl
Obs39,63239,63239,63239,632
R20.7340.7340.7350.734
Note: The coefficient values are presented in the table. The table presents the robust standard errors in parentheses, and are denoted by *** for a significance level of 0.01.
Table 7. Replacement of the Control Group.
VariableManufacturing IndustryHeavy-Polluting IndustriesEnergy-Intensive Industries
(1)(2)(3)
LCTILCTILCTI
SCIAPP0.117 ***0.104 ***0.109 ***
(0.031)(0.032)(0.033)
ControlsControlControlControl
Firm FEControlControlControl
Year FEControlControlControl
Obs26,22715,1656748
R20.7420.7550.745
Note: The coefficient values are presented in the table. The table presents the robust standard errors in parentheses, and are denoted by *** for a significance level of 0.01.
Table 8. Replacement Measures and Models.
VariableReplacement MeasureReplacement Model
(1)(2)(3)
LCTI2LCTI3LCTI
SCIAPP0.117 ***0.066 **0.267 **
(0.033)(0.030)(0.108)
ControlsControlControlControl
Firm FEControlControlControl
Year FEControlControlControl
Obs39,63239,63214,190
R20.7430.725
Note: The coefficient values are presented in the table. The table presents the robust standard errors in parentheses, and are denoted by *** for a significance level of 0.01, and ** for 0.05.
Table 9. Spillover Effects Tests.
VariableSupply Chain Spillover EffectRegion-Industry Spillover Effect
(1)(2)(3)(3)
LCTILCTILCTILCTI
SCIAPP0.145 ***0.142 ***0.141 ***0.141 ***
(0.032)(0.031)(0.031)(0.031)
Spillover1 0.025
(0.029)
Spillover2 −0.017
(0.015)
ControlsControlControlControlControl
Firm FEControlControlControlControl
Year FEControlControlControlControl
Obs38,87439,63236,98939,632
R20.7350.7340.7320.734
Note: The coefficient values are presented in the table. The table presents the robust standard errors in parentheses, and are denoted by *** for a significance level of 0.01.
Table 10. Lag Effect.
VariableLag 1 PeriodLag 2 PeriodLag 3 Period
(1)(2)(3)
LCTILCTILCTI
SCIAPP0.130 ***0.113 ***0.084 **
(0.033)(0.036)(0.039)
ControlsControlControlControl
Firm FEControlControlControl
Year FEControlControlControl
Obs34,30529,81926,014
R20.7460.7570.770
Note: The coefficient values are presented in the table. The table presents the robust standard errors in parentheses, and are denoted by *** for a significance level of 0.01, and ** for 0.05.
Table 11. Other Robustness Tests.
VariableInteraction Fixed EffectCluster Standard Errors
(1)(2)(3)
LCTILCTILCTI
SCIAPP0.138 ***0.142 **0.142 **
(0.030)(0.067)(0.070)
ControlsControlControlControl
Firm FEControlControlControl
Year FEControlControlControl
Industry × Year FEControlNONO
Obs39,63239,63239,632
R20.7440.7340.734
Note: The coefficient values are presented in the table. The table presents the robust standard errors in parentheses, and are denoted by *** for a significance level of 0.01, and ** for 0.05.
Table 12. Mechanism Verification.
Panel A: Green
VariableFirst SatgeSecond Stage
(1)(2)(3)(4)
ESEPLCTILCTI
SCIAPP0.588 ***1.133 ***
(0.095)(0.410)
ES_fit 0.242 ***
(0.064)
EP_fit 0.116 **
(0.046)
ControlsControlControlControlControl
Firm FEControlControlControlControl
Year FEControlControlControlControl
Obs39,63239,63239,63239,632
R20.6860.563
Panel B: Digital
VariableFirst SatgeSecond Stage
(1)(2)(3)(4)
Digital1Digital2LCTILCTI
SCIAPP0.098 **0.151 ***
(0.048)(0.055)
Digital1_fit 1.446 **
(0.763)
Digital2_fit 0.953 **
(0.398)
ControlsControlControlControlControl
Firm FEControlControlControlControl
Year FEControlControlControlControl
Obs39,63239,63239,63239,632
R20.7990.781
Panel C: Efficiency
VariableFirst SatgeSecond Stage
(1)(2)(3)(4)
RiskDefaultLCTILCTI
SCIAPP2.348 ***0.600 **
(0.361)(0.273)
Risk_fit 0.060 ***
(0.016)
Default_fit 0.236 **
(0.123)
ControlsControlControlControlControl
Firm FEControlControlControlControl
Year FEControlControlControlControl
Obs39,63239,63239,63239,632
R20.3790.135
Note: The coefficient values are presented in the table. The table presents the robust standard errors in parentheses, and are denoted by *** for a significance level of 0.01, and ** for 0.05.
Table 13. Heterogeneity of Technologies Classification.
VariableFossil Energy Carbon ReductionEnergy Conservation and Energy Recovery and UtilizationClean EnergyEnergy StorageCCUS
(1)(2)(3)(4)(4)
LCTILCTILCTILCTILCTI
SCIAPP0.0180.143 ***0.119 ***0.158 ***0.050 ***
(0.016)(0.029)(0.026)(0.025)(0.014)
ControlsControlControlControlControlControl
Firm FEControlControlControlControlControl
Year FEControlControlControlControlControl
Obs39,63239,63239,63239,63239,632
R20.7040.6740.6720.7270.595
Note: The coefficient values are presented in the table. The table presents the robust standard errors in parentheses, and are denoted by *** for a significance level of 0.01.
Table 14. Heterogeneity of Environmental Supervision.
VariableEnvironmental CertificationEnvironmental Report
(1) No(2) Yes(3) No(4) Yes
LCTILCTILCTILCTI
SCIAPP0.127 ***0.288 ***−0.0100.262 ***
(0.034)(0.080)(0.028)(0.057)
ControlsControlControlControlControl
Firm FEControlControlControlControl
Year FEControlControlControlControl
Obs29,244958027,7779806
R20.7290.7920.6840.809
Note: The coefficient values are presented in the table. The table presents the robust standard errors in parentheses, and are denoted by *** for a significance level of 0.01.
Table 15. Heterogeneity of Property Rights and Financing.
VariableProperty RightFinancing
(1) Non-SOEs(2) SOEs(3) Weak(4) Strong
LCTILCTILCTILCTI
SCIAPP0.0230.199 ***0.129 ***0.017
(0.025)(0.047)(0.037)(0.032)
ControlsControlControlControlControl
Firm FEControlControlControlControl
Year FEControlControlControlControl
Obs25,88213,68816,34222,452
R20.7190.7580.7850.636
Note: The coefficient values are presented in the table. The table presents the robust standard errors in parentheses, and are denoted by *** for a significance level of 0.01.
Table 16. Heterogeneity of Capital-intensive and Labor-intensive.
VariableFixed Assets RatioPer Capita Fixed Assets
(1) Lower(2) Higher(3) Lower(4) Higher
LCTILCTILCTILCTI
SCIAPP0.102 **0.167 ***0.0310.206 ***
(0.044)(0.046)(0.049)(0.045)
ControlsControlControlControlControl
Firm FEControlControlControlControl
Year FEControlControlControlControl
Obs19,41819,50019,44219,510
R20.7590.7410.7350.758
Note: The coefficient values are presented in the table. The table presents the robust standard errors in parentheses, and are denoted by *** for a significance level of 0.01, and ** for 0.05.
Table 17. Exploratory Analysis.
VariableSupply Chain ResilienceGreenDigital
(1)(2)(3)(4)(5)(6)
SCRSCRSCRSCRSCRSCR
SCIAPP1.063 ***
(0.229)
LCTI 0.658 ***0.486 ***0.0490.411 ***0.402 ***
(0.050)(0.061)(0.243)(0.069)(0.074)
LCTI × W 0.055 ***0.009 **0.142 ***0.128 ***
(0.013)(0.004)(0.027)(0.027)
W 0.032 **0.009 **0.060 **0.044 *
(0.015)(0.003)(0.028)(0.026)
ControlsControlControlControlControlControlControl
Firm FEControlControlControlControlControlControl
Year FEControlControlControlControlControlControl
Obs23,98023,98023,98023,98023,98023,980
R20.7370.7400.7400.7400.7400.746
Note: The coefficient values are presented in the table. The table presents the robust standard errors in parentheses, and are denoted by *** for a significance level of 0.01, and ** for 0.05, and * for 0.1.
Disclaimer/Publisher’s Note: The statements, opinions and data contained in all publications are solely those of the individual author(s) and contributor(s) and not of MDPI and/or the editor(s). MDPI and/or the editor(s) disclaim responsibility for any injury to people or property resulting from any ideas, methods, instructions or products referred to in the content.