Article

How Do ESG Rating Discrepancies Affect Corporate Financing?—Evidence from Chinese Listed Firms
School of Economics and Management, Anhui University of Science and Technology, Huainan 232001, China
*
Author to whom correspondence should be addressed.
Sustainability 2026, 18(6), 3086; https://doi.org/10.3390/su18063086
Submission received: 8 February 2026 / Revised: 13 March 2026 / Accepted: 19 March 2026 / Published: 21 March 2026

Abstract

This study investigates the ESG rating effect on firm financing by evaluating rating divergence data from five rating agencies, focusing on China’s A-share listed firms spanning 2018–2023. Empirical findings reveal: (1) ESG rating divergence has negatively exacerbated the financing constraints of enterprises. (2) Economic policy uncertainty in China moderates this relationship, significantly amplifying the financing constraint effect of ESG rating divergence. (3) Parallel intermediation tests the negative impact of information asymmetry and debt capital costs jointly transmitting discrepancies. (4) Deeper analysis shows non-state-owned enterprises, small-scale businesses, firms in less financially marketized regions, and entities with high rating divergence face more notable effects. This study explores the internal operation logic of ESG rating discrepancies on corporate financing constraints through two parallel channels of information asymmetry and debt capital cost. The research conclusions provide empirical support for regulators to promote the standardization of ESG information disclosure, assist investors in improving the risk pricing system, and improve the efficiency of market resource allocation.

1. Introduction

Driven by the wave of global sustainable development and China’s high-quality development strategy, ESG principles have evolved from abstract corporate social responsibility advocacy into a core framework underpinning both policy implementation and market decision-making. ESG covers corporate responsibilities in resource management for climate change adaptation, social accountability toward employees and supply chains, and governance obligations emphasizing oversight mechanisms and compliant operations. These criteria constitute a critical yardstick for measuring a company’s long-term value and resilience against risks. Against this backdrop, ESG rating systems have rapidly developed into essential tools and decision-making references for investors and creditors to assess corporate sustainability capabilities. In recent years, China’s ESG institutional framework has also advanced steadily. For instance, the China Securities Regulatory Commission’s 2025 revision of the “Measures for the Administration of Information Disclosure by Listed Companies” further standardizes corporate ESG disclosure practices, providing policy support for rating methodologies.
However, due to the significant differences in index system construction, weight allocation, and data acquisition methods among different rating agencies, the ESG performance of the same enterprise in the same period is often given inconsistent evaluation results, forming “ESG rating divergence (ESGRD)” [1]. This phenomenon is prevalent in both international and Chinese markets [2]. Rating discrepancies reflect deficiencies in the quality of corporate ESG disclosure and market interpretation capabilities. Their severity often intensifies with the ambiguity of disclosed information, thereby amplifying external stakeholders’ uncertainty regarding a company’s true ESG performance.
According to the current economic environment, the information uncertainty shown by ESGRD may have a negative impact on the corporate financing environment. Existing research indicates that rating discrepancies elevate investors’ risk premium demands for firms, resulting in higher debt capital costs [3,4], thereby intensifying financing constraints. Theoretically, this divergence transmits through two pathways. First, it exacerbates information asymmetry between firms and external capital providers, undermining financing accessibility. Second, it heightens creditors’ concerns about firms’ future debt-servicing capacity, driving up capital costs. This mechanism imposes potential constraints on corporate R&D investment, capital allocation, and long-term development.
Despite the growing body of research in the ESG field in recent years, covering areas such as corporate disclosure quality, financial performance, and green innovation [5,6,7], as well as topics like the relationship between carbon markets and ESG performance and ESG practices in diverse business environments [8,9], studies on ESGRD remain relatively limited. Most research has focused on areas such as corporate default risk, stock price volatility, risk control, and supply chain management [10,11]. The existing literature has begun to explore the relationship between ESGRD and enterprise financing constraints. For instance, ESG rating discrepancies generate high uncertainty under “information noise,” thereby amplifying long-term debt risks for enterprises [12]. The existence of such discrepancies reduces investor confidence, consequently strengthening corporate financing. Discrepancies between Chinese rating agencies and dedicated rating agencies are more pronounced, while ESG disclosure systems are currently undergoing rapid development [13]. The ESG disclosure system is also in a period of rapid development, but there are still the following research gaps. First, there has been no systematic distinction between the parallel mediating roles of information asymmetry and debt capital costs in the process by which discrepancies influence financing constraints. Second, little attention has been paid to the structural differences in rating objectives and biases between domestic and foreign rating agencies, and the heterogeneous effects on the transmission of discrepancies. Third, most of the existing research focuses on the adjustment of internal characteristics of enterprises to the discrepancies effect, but there is still a lack of systematic tests on how macro-situational factors, especially economic policy uncertainty, affect the relationship between the two, and there is still a lack of systematic testing. Based on the above literature, this paper attempts to construct a complete analysis framework to deepen the theoretical understanding of the economic consequences of ESG rating discrepancies on whether and how ESG rating discrepancies affect corporate financing, how macro-situational factors regulate this relationship, and whether heterogeneity exists.
The marginal contributions of this article are as follows. First, the study systematically verifies the existence of dual parallel mediating pathways—“ESG rating discrepancies—information asymmetry—financing constraints” and “ESG rating discrepancies—debt capital costs—financing constraints”—in terms of mechanism. It identifies and clarifies the independent transmission effects of both pathways, thereby enriching research on mediating mechanisms in this field. Second, this paper integrates dual ratings from leading domestic and international institutions to construct a rating metric. This approach better reflects the differences in market information subjects from both domestic and international perspectives, aligning more closely with the current financing environment, where enterprises simultaneously cater to domestic and international investors. Third, while existing research primarily focuses on how internal firm characteristics moderate the ESG discrepancies effect, this study innovatively incorporates China’s Economic Policy Uncertainty Index (EPU) as an external contextual variable. This empirical study examines the moderating effect of the macroeconomic environment on how ESGRD influences corporate financing constraints.

2. Literature Review and Research Hypothesis

2.1. Literature Review

The existing literature shows that ESG information, as an important supplement to financial information, plays a material role in shaping corporate financing outcomes [5]. High-quality ESG information can optimize the financing environment of enterprises, reduce investors’ perception of corporate risks by transmitting positive signals of long-term development potential of enterprises to the market, and thus alleviate financing constraints [14]. Specifically, enterprises with a top management team can disclose good ESG information [15]. The better the ESG performance of the enterprise, the lower the investor’s attention to the risk of the enterprise, and the lower the requirement for the risk premium. Finally, the financing constraints are alleviated in terms of financing cost and financing availability. The better the ESG performance of the enterprise, the lower the investor’s attention to the risk of the enterprise, and the lower the requirement for the risk premium. Finally, the financing constraints are alleviated from the aspects of financing cost and financing availability [16]. Dhaliwal et al. (2012) further found that ESG information disclosure can improve the accuracy of analysts’ earnings forecasts, which indirectly confirms the positive role of high-quality information in reducing the cost of market information processing [17]. However, the existing research on ESG information disclosure focuses more on “disclosure or not” or “disclosure quantity”, while the discussion on “disclosure quality”, especially the comparability, verifiability, and clarity of information, is relatively insufficient [18]. Employing soft market regulation compels rating agencies to undertake a series of reforms for their own development, thereby providing a reference basis for ESG rating hard regulation [19]. This provides an entry point for this study to explore the issue of rating discrepancies from the perspective of “information disclosure quality”.
The formation logic and performance characteristics of ESGRD have formed a systematic cognition. The core conclusions of the existing literature can be summarized as two driving factors, “enterprise information disclosure quality” and “heterogeneous economic consequences of rating agencies”, and they show significant differences in dimensions and scenarios. The core role of information in the capital market is to reduce the information asymmetry between the two sides of the transaction and guide the effective allocation of resources [20]. At the theoretical level, high-quality information disclosure can build market trust and effectively buffer the negative impact of ESGRD on financing constraints [3]. However, when the ESG information is ambiguous, the situation is quite the opposite. The ambiguity of ESG information will worsen the financing conditions [14] because ambiguity makes it difficult for investors to accurately assess the true risk status of the company. Further, in the face of market doubts, management may adopt opportunistic behavior and further beautify its ESG image through strategic disclosure to meet certain rating standards [21]. This kind of “formalism” rather than “substantialism” disclosure behavior can not only alleviate information asymmetry but will also further distort the information environment [22], so the problem of rating discrepancies is even worse. It is worth noting that external institutions play an important regulatory role in this process. In regions with high market maturity and a high level of financial development (such as the Yangtze River Delta), where capital supply side competition is fierce, information infrastructure is perfect, market tolerance for rating discrepancies is higher, and the negative impact of discrepancies on financing constraints is relatively weakened [23].
Regarding the level of economic consequences, existing research has preliminarily confirmed that ESGRD interferes with the operation of the capital market by transmitting contradictory signals to the market, hindering the timely and accurate reflection of stock price on the real ESG value of enterprises [24]. Discrepancies are seen as an indivisible risk that is priced into the expected rate of return of the stock, leading to an increase in the weighted average cost of capital of the company [25]. From the micro-level of enterprises, the intensification of rating discrepancies will increase the cost of corporate debt capital and equity capital [3]. At the same time, by reducing the cooperation between listed companies and external companies, it will further aggravate financing constraints and reduce the level of continuous innovation [26]. However, although the existing research has identified the increasing effect of discrepancies on the cost of capital, it has not yet formed a systematic theoretical explanation and empirical test on how this effect is transmitted to financing constraints and whether there are multiple independent transmission paths.
By combining the existing literature, it can be found that the current research on the performance of enterprise ESG has formed a relatively complete theoretical framework. However, the discussion of ESGRD is still relatively weak, and the selection of rating agencies is relatively simple. Although a few studies have begun to pay attention to the potential impact of rating discrepancies on investor behavior and corporate financing, domestic research has not yet examined its internal relationship with financing constraints.

2.2. Research Hypothesis

Based on the above theoretical research, this paper has a deeper understanding of the impact of ESGRD on corporate financing constraints. Therefore, according to the stakeholder theory, asset pricing theory, and other related theories, the influence mechanism, intermediary mechanism, and moderating effect are analyzed differently.

2.2.1. Impact Effect Research

At present, the financing constraints of enterprises show the core characteristics of “total growth and prominent structural contradictions”. The scale of financing is expanding steadily, but small- and medium-sized enterprises, private enterprises, and emerging enterprises are still in the dilemma of “difficult financing and expensive financing”, and the policy of medium-sized private enterprises covers the “sandwich layer”. Based on stakeholder theory, ESGRD constitutes ambiguity, where not only are outcomes uncertain but even the probability distribution of outcomes remains unknown. Faced with such uncertainty, ambiguity aversion demands higher risk premiums or directly reduces investments, thereby increasing corporate financing costs [27]. In addition, ESGRD will also affect investor confidence, thus affecting corporate financing constraints. The better the ESG performance of the enterprise, the lower the investor’s attention to the enterprise risk [16], thereby reducing the requirements for risk premiums and ultimately easing the constraints from both financing costs and financing availability. In practice, discrepancies across ESG ratings compromise the informational efficacy. Information asymmetry between investors and enterprises intensifies, rendering the identification of authentic ESG information more challenging for investors and further exacerbating the degree of corporate financing constraints. Therefore, this paper puts forward the following hypothesis:
H1: 
ESG rating discrepancies strengthen financing constraints on enterprises.

2.2.2. Research on Regulatory Mechanisms

As an important information channel, the external environment will also affect corporate financing constraints. Economic policy uncertainty (EPU) can effectively regulate the mechanism by which ESGRD impacts corporate financing. In an environment of elevated EPU, overall market information becomes increasingly ambiguous, and reliance on traditional financial information diminishes [28]. At this time, ESG rating discrepancies no longer only represent information noise but may encourage enterprises to strengthen disclosure and attract long-term investors’ attention, thus alleviating financing constraints caused by information asymmetry. According to the theory of asset pricing under uncertainty, controlling for other factors, the marginal impact of ESGRD on financing costs increases as macroeconomic policy uncertainty rises [29]. Acting as a significant moderator, economic policy uncertainty alters the strength and direction of ESG discrepancies’ impact on financing constraints. Thus, this paper proposes:
H2: 
Economic policy uncertainty functions as a moderator between ESG rating discrepancies and corporate financing constraints.

2.2.3. Research on Transmission Mechanisms

Existing research identifies inadequate corporate disclosure as a key driver of rating discrepancies, yet it fails to clarify the differential impact of disclosure “quantity” versus “quality” on such discrepancies [30]. Information asymmetry is the manifestation of ESG RD. Corporate information disclosure behavior directly affects the “quality” of rating agencies. When corporate ESG disclosures are vague, more qualitative, and less quantitative, rating agencies have to depend on experiential discretion and private information, which will naturally lead to different interpretation results [2]. According to the theory of noise effect, the essence of ESGRD is the “noise” in enterprise ESG information transmission, which will interfere with the market’s judgment on the real ESG performance of enterprises and aggravate information asymmetry [6]. Therefore, discrepancies, as an open signal, reveal the high uncertainty and information asymmetry of ESG performance to the capital market, which also makes creditors and shareholders demand higher investment returns to compensate for the resulting cognitive risk and potential credit risk, which is ultimately reflected in the tightening of financing constraints. Therefore, this paper proposes the following hypothesis:
H3: 
ESG rating discrepancies enhance corporate financing constraints through information asymmetry.
The cost of debt capital plays a key role in corporate financing constraints. According to the principle of financial intermediation, in the face of mixed signals from ESG ratings in the market, creditors, as professional intermediaries, are more cautious in processing such information. ESGRD increases the difficulty of assessing corporate default risks. Therefore, creditors will avoid risks by raising loan interest rates and increasing collateral requirements, which is directly reflected in the increase in the cost of debt capital [31]. Studies have shown that ESG can reduce corporate financing costs. Enterprises can improve internal operating efficiency and reduce management costs by optimizing social responsibility practices, effectively avoiding policy risks caused by stricter environmental supervision and shaping the market image of green innovation to attract specific investment. This process helps reduce the cost of equity capital for enterprises, ultimately alleviating the financing constraints [32]. The essence of the cost of capital is to “transform non-financial information discrepancies into financial cost pressure”. It quantifies the risk of information asymmetry caused by ESGRD into observable “rising debt financing costs”, which is ultimately reflected in the intensification of corporate financing constraints [33]. This study confirms the mediating pathway, establishing a “micro costs” framework to explain the economic implications of ESGRD. Thus, this paper proposes the following hypothesis:
H4: 
ESG rating discrepancies increase the cost of debt capital and exacerbate financing constraints.
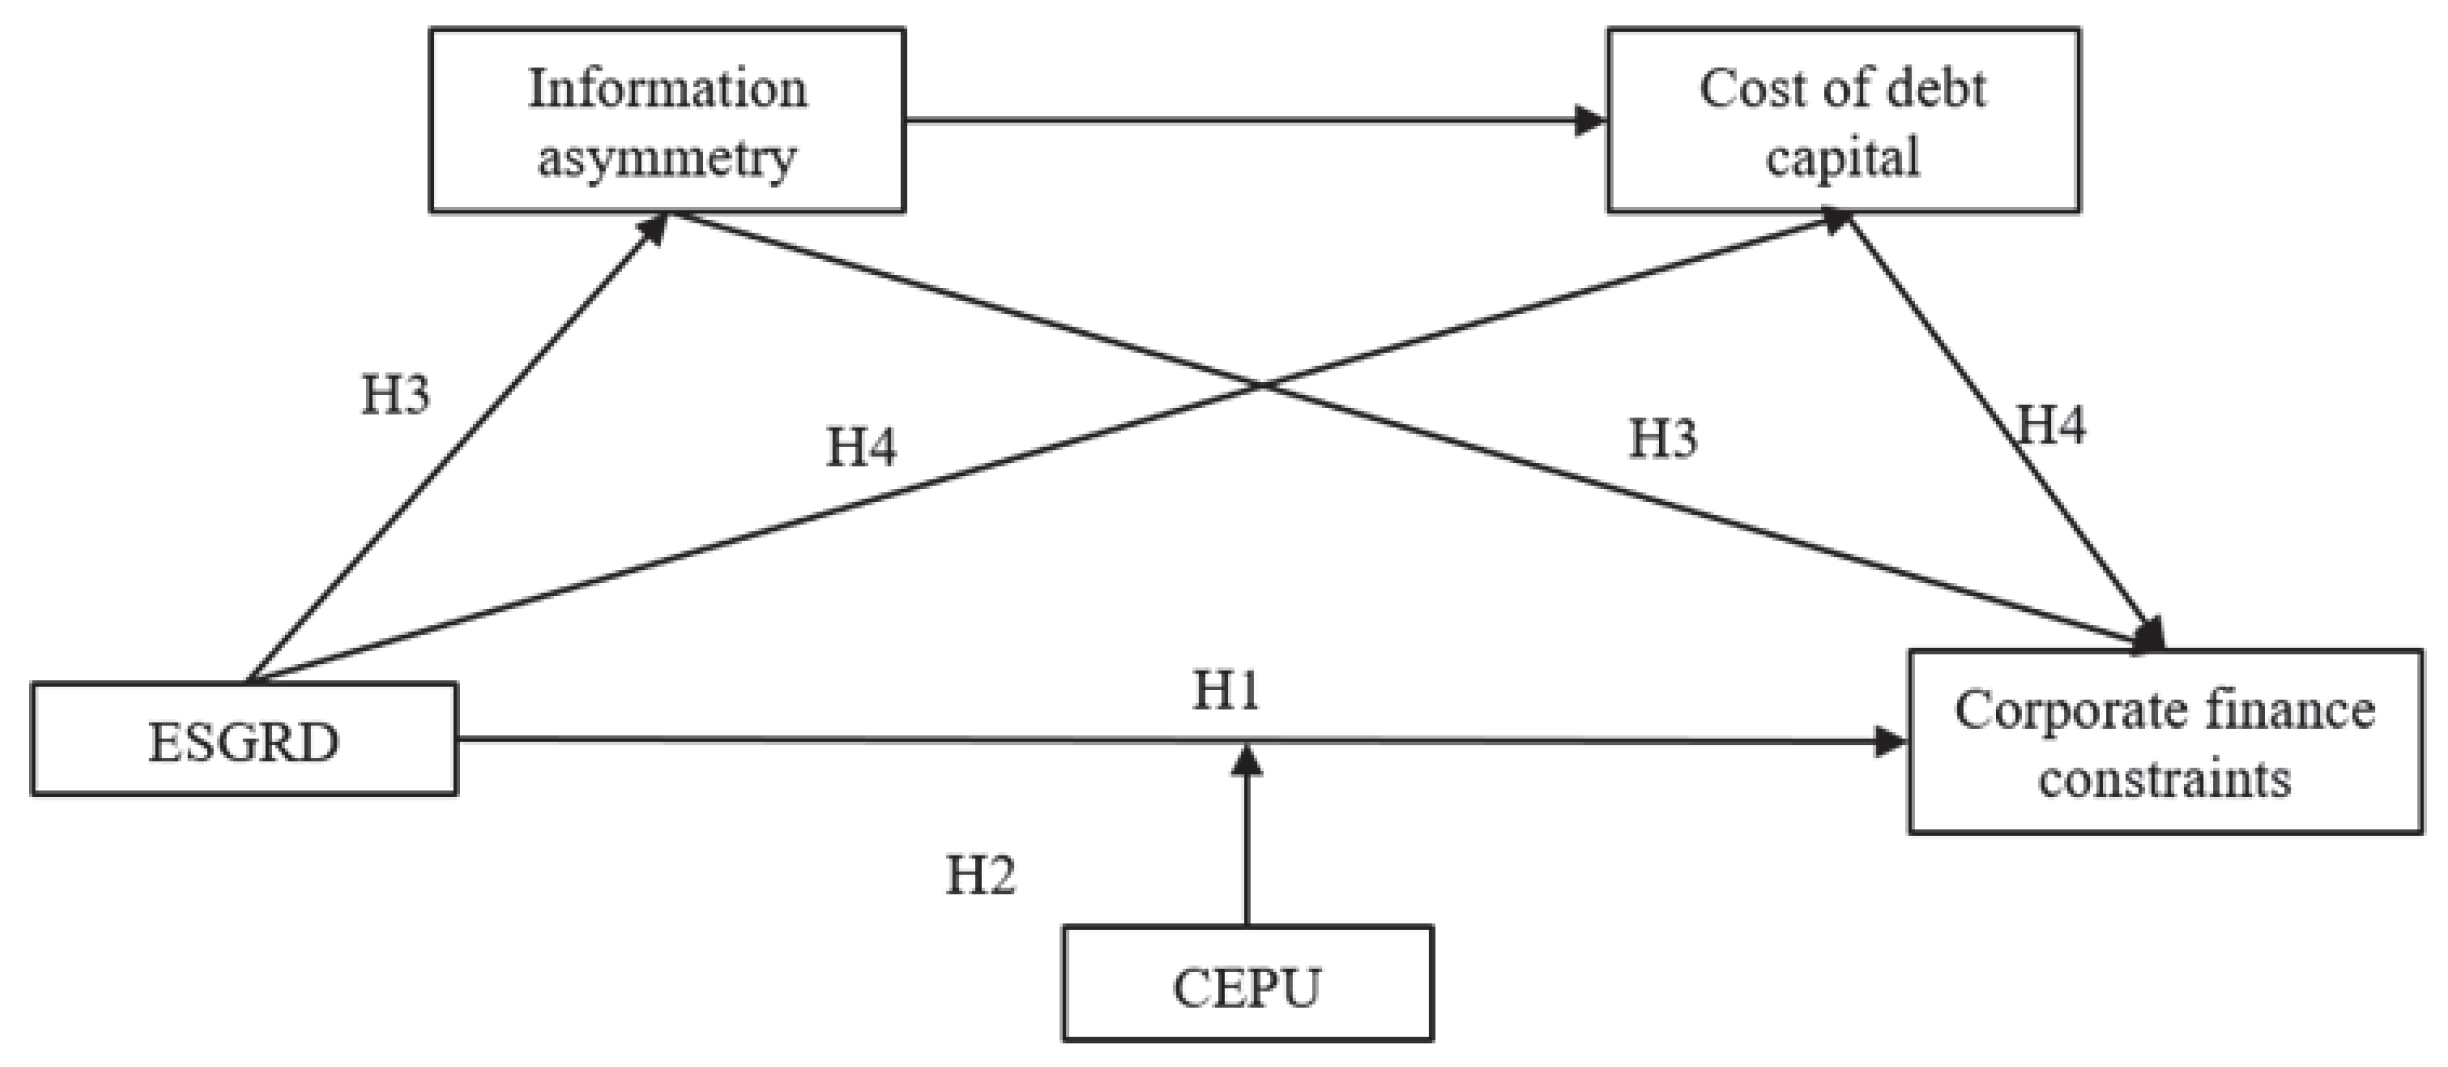
Based on the above assumptions, this paper constructs a variable model diagram, as shown in Figure 1.

3. Variable Selection and Model Setting

3.1. Selection of Variables

3.1.1. Dependent Variable

Financing constraints (SIZE-AGE index): This paper adopts the methodology proposed by Hadlock and Pierce (2010) to construct a financing constraint indicator, utilizing the absolute value of the SA index derived from firm size and firm age [34]. See specifically the formula:
S A = 0.737 × S I Z E + 0.043 × S I Z E 2 0.04 × A G E
where SIZE measures the size of an enterprise and is calculated using the natural logarithm of total assets (million yuan). AGE represents the business life of the enterprise, and the calculation method is the observation year of the sample enterprise minus the difference between the year of establishment of the enterprise. A negative SA index indicates that a firm faces financing constraints, with a larger absolute value signifying more severe financing constraints.

3.1.2. Independent Variable

ESG rating discrepancies (ESGRDs), as defined by Zhao and Christensen, are the primary independent variable examined in this article [35,36]. Select mainstream domestic and international institutions include Wind Information, FTSE Russell, China Securities, SynTao Green (STG), and Bloomberg (international) as the five third-party rating providers. Use the rating standard deviation provided by these agencies to measure the degree of rating discrepancies among different agencies. The score given by FTSE Russell is between 0 and 5, and it is standardized to 0–1 points. The standardized treatment of Wind, Huazheng, and Bloomberg is the same. Based on the ESG performance of the enterprise, the STG is divided into ten grades from A to D, which are set to 0 to 1. According to the ESG performance of the enterprise, it is divided into ten grades from A to D, and it is set to 0 to 1. Scores are calculated by multiplying the grade’s rank number by 1/9, where a higher ESG rating corresponds to a higher numerical score. Finally, the listed companies with two or more ratings are retained. Table 1 shows the standardized ESG rating scores and VIF tests of different institutions.

3.1.3. Moderating Variable

This study adopts the China Economic Policy Uncertainty (CEPU) Index developed by Baker as the moderating variable [28]. For each month’s data, the monthly values are aggregated into annual data, and the annual average is taken as the overall economic policy uncertainty index for that year.

3.1.4. Mediating Variables

According to the above two assumptions, with reference to Lin et al., Liu et al., and Kim et al., the KV index is selected as the proxy variable of information asymmetry [6,37,38]. Based on the article by Zhang et al. [3], the cost of debt capital of an enterprise is selected and measured, calculated as the ratio of the company’s financial expenses to its total debt for the year. The following formula is the calculation method for the KV index.
L n | ( Δ P t ) / P t 1 | = β 0 + β ( V o l t V o l 0 ) + ε
K V = β × 100000
where ΔPt is the difference between Pt and Pt−1. Pt is the closing price on day t. Volt is the trading volume on day t. Vol0 is the annual average daily trading volume. β is obtained through least squares regression, excluding samples with ΔPt = 0 and samples with fewer than 10 trading days in the year. The KV index is founded on the core assumption. Elevated market information opacity forces investors to rely more on observable trading volume as a critical input for investment decision-making. A larger KV value indicates a higher degree of information asymmetry.

3.1.5. Control Variables

Based on Cao et al. [39], this paper selects debt-to-equity ratio (lev), executive shareholding ratio (Top1), growth capability (gro), return on assets (roe), and dual roles (same) as the control variables of the enterprise at the individual level of performance, function, and control. Summary variables are shown in Table 2.

3.2. Regression Model Setting and Data Sources

3.2.1. Regression Model

After the Hausman test, to accurately describe ESGRD on enterprise financing constraints, the following measurement models are set up:
S A i , t = β 0 + β 1 E S G R D i , t + β 2 C o n t r o l i , t + I n d u s t r y + Y e a r + ε i , t
where SAi,t,t represents the measure of financing constraints. ESGRDi,t is the difference in ESG rating of enterprises. Controli,t is a control variable at the enterprise level, including asset–liability ratio, growth ability, return on net assets, and duality. Industry represents the fixed effect at the industry level, and Year represents the time fixed effect. ε i,t is the random term.

3.2.2. Moderation Effect Model

To verify the regulatory effect of economic policies, this paper incorporates an interaction term for rating discrepancies and economic policy non-negligibility into the model.
S A i , t = β 0 + β 1 E S G R D i , t + β 2 C E P U i , t + β 3 E S G i , t × C E P U i , t + β 4 C o n t r o l i , t + I n d u s t r y + Y e a r + ε i , t

3.2.3. Parallel Intermediary Model

Following the approach of Tian and Hu for stepwise testing of parallel intermediation [40], this paper establishes a parallel intermediation effect model incorporating information asymmetry and debt financing costs (Equations (6)–(8)).
K V i , t = β 0 + β 1 E S G R D i , t + λ C o n t r o l s i , t + Y e a r + I n d u s t r y + ε i . t
C o s t   o f   D e b t i , t = β 0 + β 1 E S G R D i , t + λ C o n t r o l s i , t + Y e a r + I n d u s t r y + ε i . t
S A i , t = β 0 + β 1 E S G R D i , t + β 2 C o n t r o l i , t + I n d u s t r y + Y e a r + ε i , t
where KV and Cost of Debt represent the mediating variables of information asymmetry and the cost of debt capital, respectively.

3.2.4. Data Sources

To ensure data reliability and sample representativeness, this research examines A-share listed firms rated by a minimum of two independent ESG agencies from 2018 to 2023, adhering to the following exclusion criteria: (1) eliminate financial-related industries, (2) special treatment (excluding ST, *ST, and PT enterprises), and (3) eliminate missing enterprise samples. The data used are from five institutions, including Wind, SynTao Green (STG), Bloomberg, Huazheng, and FTSE Russell. Furthermore, to guarantee the reliability of regression outcomes, the variables were tailed by 1% and 99%, and finally, 21,391 samples of 4219 companies were obtained. Descriptive statistics for the variables are shown in Table 3.

4. Econometric Test

4.1. Benchmark Regression Analysis

Analysis of the benchmark regression results in Table 4 reveals that, as shown in Table 1 without control variables, the ESGRD coefficient of 0.06 is positive (1% level), implying a direct influence over financing constraints. Column (2) indicates that the positive significance of this coefficient persists after incorporating control variables. According to AI-Matari et al., after introducing the moderation term (ESG_dis × CEPU) for economic policy uncertainty (CEPU), the regression results in Column (3) reveal that the estimated interaction term is significantly positive [41]. For risk aversion, increased economic policy uncertainty will weaken the willingness of investors to invest [42], thereby increasing the debt cost of corporate financing. This shows that the rise of CEPU, that is, the uncertainty of the external policy environment, significantly amplifies the marginal effect of this causal mechanism. The above results consistently show that both H1 and H2 are verified.

4.2. Robustness Test

4.2.1. Diversification of Independent Variables

Diversify the treatment of ESGRD by employing different measurement approaches. First, the ESGRD index is standardized, and the ratio of ESGRD to the average ESG rating ESG_Ave is selected. The results in Table 5, column (1) show that the coefficient is positive, and p < 0.05. This indicator eliminates the impact of rating level on discrepancies. Secondly, the extreme value difference esg_range test is used to measure the difference between the maximum and minimum ratings of each enterprise in the current year. The results in column (2) were found to be established at the level of 1%. Thirdly, a new discrepancies indicator, ESGRD2, is constructed, and the ESG discrepancies indicator in the benchmark regression is divided by the industry mean. The results are shown in column (3). The results of the above series of tests show that the different adjustments of ESGRD still negatively increase corporate financing constraints.

4.2.2. Replace the Dependent Variable

The WW index is used to replace the SA index. The regression shows that the coefficient of the ESGRD index, 0.015, is positive at the level of 1% after replacing the explained variables, indicating that the negative impact of divergence on financing constraints is consistent under different measures.

4.2.3. Adjust the Sample Interval

The 2020 pandemic caused business shutdowns and production halts, impacting corporate development and financing. Therefore, the sample data of the year were excluded for the robustness test. The results show that the coefficient is 0.074 after eliminating the sample data, which is significant at the level of 1%. The benchmark results are not driven by extreme fluctuations in special years. On the contrary, the effect is stronger after eliminating abnormal shocks, which further highlights the long-term negative impact of differences.

4.2.4. Lag One Explained Variable SA

In order to alleviate the potential endogenous problems, this paper lags the explanatory variable SA index by one stage in the regression. The results are shown in column (6) of Table 6. The coefficient of the lag term is 0.719, which is 3.6 times that of the short-term effect (ESGRD coefficient), indicating that after considering dynamic adjustment, the long-term impact of divergence on financing constraints is basically consistent with the static model estimation.

5. Further Analysis

5.1. Mechanism Analysis

Table 6 shows the results. Column (1) indicates that the ESGRD is significant at the 5% level, suggesting there exists a positive correlation between the two—higher divergence correlates with greater information asymmetry. Column (2) shows an ESGRD coefficient of 1.062, significant at the 1% level. The coefficients in column (3) are all statistically significant at the 1% level. The statistical significance of both pathways has been confirmed. ESGRD affects corporate financing constraints through the micro-level mechanisms of risk pricing and information friction. The joint operation of these two pathways substantiates the theoretical expectations of this study.
There were two issues with the stepwise analysis of mediating effects. 1. High multicollinearity may exist between the two mediating variables and the dependent variable SA. 2. Measurement error may reduce the power of statistical tests, while model endogeneity issues could lead to biased causal inferences. Therefore, this paper conducts multicollinearity tests to address potential issues and draws on Liu et al. [43]. This study employs Bootstrap sampling to conduct 1000 repeated tests of the mediation effect in the structural equation model.
Table 7 shows the test results. The mean VIF values for all variables are less than 3, well below the critical threshold of 10. The correlations are within an acceptable range and will not introduce substantial bias in the estimation accuracy or standard errors of the regression coefficients. Table 8 shows the results. The path coefficient for “ESG Rating Discrepancy—Information Asymmetry—Corporate Financing Constraints” is 0.017, with a bias-corrected confidence interval of [0.010, 0.024] that does not include zero. This confirms the mediating effect of information asymmetry. The path coefficient for the “ESG rating discrepancies—debt capital cost—corporate financing constraints” pathway is 0.064, with a bias-corrected confidence interval of [0.039, 0.087] that does not include zero. This indicates that the mediating effect of debt capital cost is also established.

5.2. Endogeneity Test

The financing status of individual enterprises cannot determine the average rating discrepancies at the industry or regional level in reverse, and the industry or regional averages strip away specific characteristics of individual enterprises that may directly reflect their financing capabilities. Therefore, this paper follows the methodology proposed by Liu et al. [6]. This paper selects two mean values, the ESGRD among companies within the same industry in the same year and the ESGRD among companies within the same region in the same year, which are recorded as IV1_ESGRD and IV2_esg_ind_avg, and 2SLS is used for the endogenous test. The results are shown in Table 9. The statistics of the Cragg–Donald–Wald F-statistic are significantly greater than the Stock–Yogo critical value, indicating that there is no weak instrumental variable problem. The corresponding P-value of Anderson canon.corr.LM statistic is 0.000, which confirms that the instrumental variable setting is effective. The results show that after removing endogenous interference, the positive impact of ESGRD on financing constraints is still established, and the coefficient has increased (from 0.061 to 0.145), which means that ESGRD is not only a related factor of corporate financing constraints but also a systematic risk source with a causal driving effect.

5.3. Heterogeneity Analysis

5.3.1. Nature of Corporate Ownership

From the perspective of the rated entity, under corporate ownership structures, ESGRD significantly exacerbates financing constraints on enterprises. This study categorizes the sample based on the nature of the enterprises’ industries. As shown in Table 10, column (2) shows that the coefficient is 0.066, higher than the estimated result for the state-owned enterprise sample in column (1). For state-owned enterprises, their inherent government credit backing and relatively higher information transparency mitigate the information asymmetry caused by ESGRD, resulting in less impact on external investors’ trust due to rating differences [44]. Therefore, the exacerbating effect of ESGRD on financing constraints is weaker for SOEs. For private enterprises, lacking government credit support, the quality of their own information disclosure is often questioned. ESGRD further amplifies information asymmetry, causing investors’ risk perceptions to surge sharply. This imposes stricter financing constraints on private enterprises, making the exacerbating effect of financing constraints more pronounced.

5.3.2. Company Size

From the perspective of rating subjects, the size of an enterprise is also a key factor in measuring ESG ratings. Large enterprises possess greater resources and capabilities to meet ESG rating standards. Moreover, their influence and public image subject them to greater social responsibility pressures, thereby providing them with better conditions for ESG performance. This also makes them more likely to secure financing support from investors and financial institutions. Columns (3) and (4) show a coefficient comparison of large-scale enterprises of 0.072, which is significantly higher than that of small-scale enterprises of 0.001. Small-scale enterprises inherently lack transparency in their information, relying more on relationships than public disclosures for financing. The market inherently pays less attention to and has lower expectations for its ESG performance.

5.3.3. Degree of Financial Marketization

From the external environment, the process of financial marketization exhibits significant discrepancies across different regions. This study categorizes the sample into eastern and central-western regions based on geographic location and economic development levels. As shown in Table 10 columns (5) and (6), the regression coefficient of 0.074 for the eastern region is significantly higher than that of the central-western region, indicating that signals conveyed by ESGRD receive greater attention and emphasis from investors in the eastern region [40]. In regions with higher marketization levels, legal and financial systems are more robust, and market mechanisms (such as ESG information) play a greater role in resource allocation. The higher the marketization level, the stronger the positive correlation between ESG discrepancies and financing constraints.

5.3.4. ESG Discrepancies Degree

The entire sample is divided into high- and low-divergence groups based on the median rating discrepancies. For companies with high ESGRD, the ESG information environment is characterized by high noise and uncertainty, amplifying the impact of discrepancies and intensifying financing constraints. Columns 7 and 8 in Table 11 clearly show that the impact of high-dividing enterprises on the mechanism is more significant. For companies with lower ESGRD, the ESG environment is more stable, and the discrepancies exert a weaker constraining effect on financing.

5.3.5. Industry Heterogeneity

This paper analyzes the heterogeneity of industry nature. It aims to further identify cross-industry differences in asset structure, market competition, and financing constraints and to reveal the applicable boundary and internal mechanism of the research conclusions. The results in column (3) and column (4) in Table 11 show that the coefficient of the manufacturing group is 0.071, which is significantly higher than that of the non-manufacturing group (0.040). The impact of ESGRD on manufacturing enterprises will be greater. Manufacturing enterprises typically face heightened environmental regulatory pressures. When rating discrepancies arise, market pressure uncertainties intensify, leading to heightened investor risk perceptions and consequently amplifying the effect of financing constraints.

6. Conclusions and Discussion

6.1. Conclusions

The findings of this study are as follows: ESGRDs not only directly exacerbate corporate financing constraints but are also significantly amplified in environments of economic policy uncertainty, exhibiting pronounced context dependency and cyclical sensitivity. The mechanism of action operates through two independent pathways—“information asymmetry” and “debt capital costs”—demonstrating that these discrepancies not only disrupt information transmission efficiency but are also directly internalized by capital markets as elevated risk premiums. Furthermore, the study identifies heterogeneous impacts across firm attributes and market environments; non-state-owned enterprises, smaller firms, regions with lower financial marketization, and companies with pronounced ESGRD experience more pronounced shocks. Collectively, these findings demonstrate that ESGRD constitutes not merely an evaluative disparity but a systemic risk factor affecting corporate financing capacity. Targeted attention and governance are warranted within information disclosure frameworks, rating coordination mechanisms, and financial risk pricing systems.

6.2. Policy Recommendations

According to the previous conclusion, to alleviate financing constraints arising from ESGRD and promote the healthy development of capital markets alongside sustainable corporate operations, the following tiered policy recommendations are proposed:
First, regulators should focus on standardizing core ESG disclosure metrics and gradually implement mandatory disclosure and third-party verification systems to reduce the scope for rating discrepancies.
Second, financial institutions should be encouraged to incorporate ESGRD into their credit assessment and investment risk models. They should conduct prudent evaluations of enterprises with significant rating discrepancies and develop corresponding risk mitigation tools. Non-soes enterprises, small and large enterprises, and enterprises in regions with low financial marketization have been particularly hard-hit. For such enterprises, support for ESG information disclosure capacity building and financing facilitation policies should be provided. This can boost their resilience to tackle the risks of ESGRD.
Third, during periods of heightened economic policy uncertainty, particular emphasis should be placed on ensuring the stability and transparency of ESG information disclosure. Industry-specific ESG performance benchmark guidelines may be issued as appropriate to mitigate the risk of market noise being amplified by macroeconomic fluctuations.

6.3. Limitations and Future Work

Several deficiencies inherent to this investigation merit deeper examination in subsequent work. First, the sample selection is restricted to data from Chinese listed companies between 2018 and 2023, and external validity requires validation using cross-country data. Expanding the scope of rating agencies and research coverage could address this limitation. Second, our analysis of ESG rating discrepancies’ impact on corporate financing constraints focused solely on information asymmetry and debt capital costs, overlooking other potential mechanisms. Future studies should incorporate additional variables. Furthermore, the prevalence of large machine learning models today may influence ratings, a phenomenon requiring further validation. Future work could explore novel combinations to construct a more comprehensive theoretical framework for ESGRD, providing richer evidence for both academic advancement and practical application.

Author Contributions

Conceptualization. J.W. and R.F.; methodology, J.W. and R.F.; formal analysis. R.F. and L.W.; resources, J.W. and L.W.; data curation, R.F. and L.W.; writing—original draft preparation, R.F.; writing—review and editing, J.W. and L.W.; supervision. J.W.; funding acquisition, J.W. All authors have read and agreed to the published version of the manuscript.

Funding

This work was supported by the Anhui Higher Educational Project of Excellent Scientific Research and Innovation Team [grant number 2023AH010026], the Anhui Graduate Education Quality Project [grant number 2024xscx079], and the Doctoral Program in Anhui University of Science and Technology, China [grant number 2025cx1015].

Institutional Review Board Statement

Not Applicable.

Informed Consent Statement

Not Applicable.

Data Availability Statement

The original contributions presented in this study are included in the article. Further inquiries can be directed to the corresponding author.

Conflicts of Interest

The authors declare no conflicts of interest.

References

  1. Chatterji, A.K.; Durand, R.; Levine, D.I.; Touboul, S. Do Ratings of Firms Converge? Implications for Managers, Investors and Strategy Researchers. Strateg. Manag. J. 2016, 37, 1597–1614. [Google Scholar]
  2. Christensen, D.M.; Serafeim, G.; Sikochi, A. Why is Corporate Virtue in the Eye of The Beholder? The Case of ESG Ratings. Account. Rev. 2022, 97, 147–175. [Google Scholar]
  3. Zhang, Y.Q.; Yang, H.Y.; Zhang, X.Y. Discrepancies in ESG Ratings and Debt Capital Costs. Financ. Rev. 2023, 15, 22–43. Available online: https://kns.cnki.net/ (accessed on 10 March 2026).
  4. Liu, C.C.; Wu, Q.H.; Lin, Y.E. ESG Ratings and Firm Performance: The Moderating Role of ESG Rating Disagreement. Borsa Istanb. Rev. 2025, 25, 816–823. [Google Scholar] [CrossRef] [Scilit]
  5. Ren, H. ESG Rating Disagreement and Corporate Digital Transformation. Financ. Res. Lett. 2025, 75, 106903. [Google Scholar] [CrossRef] [Scilit]
  6. Liu, X.Q.; Yang, Q.Q.; Hu, J. Discrepancies in ESG Ratings and Stock Price Synchronicity. China Soft Sci. 2023, 29, 108–120. [Google Scholar] [CrossRef]
  7. Wu, F.H.; Wang, C.Q.; Ibrahim, H.; Zhao, J. Research on the Spatial and Temporal Evolution and Spatial Spillover Effects of Regional Green Innovation in China Under the ESG Context. J. Clean. Prod. 2025, 520, 146116. [Google Scholar] [CrossRef] [Scilit]
  8. Xu, H.; Yang, R. Does Carbon Market Improve ESG Performance? Evidence from China. J. Clean. Prod. 2025, 514, 145810. [Google Scholar] [CrossRef] [Scilit]
  9. Yang, T.H.; Huang, A.D.; Shang, L.D. Diverse Links: Female Board Representation and ESG in Varied Business Landscapes. J. Clean. Prod. 2025, 490, 144720. [Google Scholar] [CrossRef] [Scilit]
  10. Zhao, L.; Lu, Y.F. Disagreements in ESG Ratings and Business Operating Risks. Technol. Econ. 2024, 43, 98–109. [Google Scholar] [CrossRef]
  11. Fu, B.; Wei, X. ESG rating divergence, greenwashing, and supply chain performance: The role of guanxi. J. Bus. Res. 2026, 208, 116078. [Google Scholar] [CrossRef] [Scilit]
  12. Ning, Z.; Zhang, Y.; Yan, B.; Li, Y. The Impact of ESG Rating Discrepancies on Corporate Debt Maturity Structure. Friends Account. 2026, 3, 48–56. [Google Scholar] [CrossRef]
  13. Wang, L.; Li, K.; Ding, L. Resolving the Confusion of ESG Ratings in the Process of Chinese-Style Modernization: Divergence Characteristics, Difference Causes and Governance Logic. J. China Univ. Pet. (Soc. Sci. Ed.) 2024, 40, 94–108. [Google Scholar] [CrossRef]
  14. Liu, X.; Wang, F.; Xiang, Y. Bridging Divides with Data: Open Government Data and ESG Rating Divergence. Econ. Model. 2026, 157, 107491. [Google Scholar] [CrossRef] [Scilit]
  15. Al-Matari, E.M.; Turki, H.; Alnor, N.H.A.; Eltahir, I.A.E.; Ali, Z.T.A.; Misbah, H.M. Top Management Team Characteristics, Corporate Environmental Sustainability, and Earnings Management Strategy: An Empirical Investigation. Corp. Bus. Strategy Rev. 2026, 7, 271–283. [Google Scholar]
  16. Lin, L.; Zhang, X. Does the ESG Performance of Enterprises Affect Investors’ Risk Concerns? Syst. Eng. Theory Pract. 2025, 1–19. Available online: https://link.cnki.net/urlid/11.2267.N.20251014.1743.010 (accessed on 10 March 2026).
  17. Dhaliwal, D.S.; Radhakrishnan, S.; Tsang, A.; Yang, Y.G. Nonfinancial Disclosure and Analyst Forecast Accuracy: International Evidence on Corporate Social Responsibility Disclosure. Acc. Rev. 2012, 87, 723–759. [Google Scholar] [CrossRef] [Scilit]
  18. Teng, H.Y.; Zhang, J.W.; Li, X.S.; Li, B. ESG Rating Divergence and Future Corporate ESG Performance: Evidence from China. Int. Rev. Financ. Anal. 2025, 108, 104686. [Google Scholar] [CrossRef] [Scilit]
  19. Liu, B.; Lu, J.R.; Ju, T. Formalism or Substantivism: Research on Green Innovation Under Soft Regulatory ESG Rating. Nankai Manag. Rev. 2023, 26, 16–28. Available online: https://kns.cnki.net/kcms/detail/12.1288.F.20220905.1521.002.html (accessed on 10 March 2026).
  20. Liu, R.; Huang, J. Industrial Policy and Foreign Capital Inflow: Empirical Evidence from Northbound Capital of the Stock Connect. J. Quant. Tech. Econ. Res. 2026, 1–25. [Google Scholar] [CrossRef]
  21. Sun, Z.; Liu, L.; Zhao, L.; Alofaysan, H.; Gupta, B. Generative AI and ESG Opportunism in Supply Chains: A Utilitarian Perspective on Unintended Consequences for Sustainability. Technol. Forecast. Soc. Change 2026, 224, 124498. [Google Scholar] [CrossRef] [Scilit]
  22. Zhang, Y.; Yu, J.; Wang, J.; Song, Y. Blockchain Technology, Information Asymmetry and Corporate ESG Performance: Evidence from China. Energy Econ. 2026, 155, 109150. [Google Scholar] [CrossRef] [Scilit]
  23. Li, Z.Z.; Wang, Y.T.; Huang, X. The Impact Effect of Mandatory Disclosure on Voluntary Disclosure: A Study from the Perspective of ESG. Nankai Manag. Rev. 2025, 1–34. Available online: https://link.cnki.net/urlid/12.1288.F.20251020.1009.002 (accessed on 10 March 2026).
  24. Serafeim, G.; Yoon, A. Stock Price Reactions to ESG News: The Role of ESG Ratings and Disagreement. Rev. Account. Stud. 2023, 28, 1500–1530. [Google Scholar] [CrossRef] [Scilit]
  25. Avramov, D.; Cheng, S.; Lioui, A.; Tarelli, A. Sustainable Investing with ESG Rating Uncertainty. J. Financ. Econ. 2022, 145, 642–664. [Google Scholar] [CrossRef] [Scilit]
  26. Lu, M.; Yang, Z.; Chen, J. ESG Rating Discrepancies and Corporate Sustainable Innovation. Stud. Sci. Sci. 2026, 1–15. [Google Scholar] [CrossRef]
  27. Mu, T.; Duan, H. Local Fuzzy Disappointment Theory and Irrational Investment Behavior Decision-Making. J. Econ. Metr. 2026, 1–20. Available online: https://link.cnki.net/urlid/10.1738.f.20251021.1744.004 (accessed on 10 March 2026).
  28. Baker, S.R.; Bloom, N.; Davis, S.J. Measuring Economic Policy Uncertainty. Q. J. Econ. 2016, 131, 1593–1636. [Google Scholar] [CrossRef] [Scilit]
  29. Li, R.; Zhang, L.; Wang, H.; Zhou, M.S. Policy Uncertainty and Corporate Digital Transformation: Theoretical and Empirical Analysis. J. Manag. Sci. China 2025, 28, 31–49. [Google Scholar] [CrossRef]
  30. Liu, S.L.; Yan, M.L. ESG Performance, Agency Costs, and Financing Constraints: The Moderating Role Based on the Enterprise Life Cycle. Ind. Technol. Econ. 2024, 43, 62–72. [Google Scholar] [CrossRef]
  31. Gibson, B.R.; Krueger, P.; Schmidt, P.S. ESG Rating Disagreement and Stock Returns. Financ. Anal. J. 2021, 77, 104–127. [Google Scholar] [CrossRef] [Scilit]
  32. El Ghoul, S.; Guedhami, O.; Kwok, C.; Mishra, D. Does Corporate Social Responsibility Affect the Cost of Capital? J. Bank. Financ. 2011, 35, 2388–2406. [Google Scholar] [CrossRef] [Scilit]
  33. Houqe, M.N.; Ahmed, K.; Richardson, G. The Effect of Environmental, Social, and Governance Performance Factors on Firms’ Cost of Debt: International Evidence. Int. J. Account. 2020, 55, 2050014. [Google Scholar] [CrossRef] [Scilit]
  34. Hadlock, C.J.; Pierce, J.R. New Evidence on Measuring Financial Constraints: Moving Beyond the KZ Index. Rev. Financ. Stud. 2010, 23, 1909–1940. [Google Scholar] [CrossRef] [Scilit]
  35. Christensen, D.M. Corporate Accountability Reporting and High-Profile Misconduct. Acc. Rev. 2016, 91, 377–399. [Google Scholar] [CrossRef] [Scilit]
  36. Zhao, J.H.; Wang, M.L.; Hong, S.S.; Tan, S. ESG Rating Divergence and Financing Constraints: Evidence from China. J. Environ. Manag. 2025, 389, 126188. [Google Scholar] [CrossRef] [Scilit]
  37. Lin, C.Q.; Mao, X.S.; Liu, K.X. Sex of Board Secretary and Quality of Information Disclosure: Empirical Evidence from Shanghai and Shenzhen A-Share Markets. Financ. Res. 2016, 435, 193–206. [Google Scholar]
  38. Kim, O.; Verrecchia, R.E. The Relation Among Disclosure, Returns and Trading. Acc. Rev. 2001, 76, 633–654. Available online: http://www.jryj.org.cn/CN/Y2016/V435/I9/193 (accessed on 10 March 2026). [CrossRef] [Scilit]
  39. Cao, Y.; Tang, Y.K.; Hu, W.J.; Yu, F.R. The Impact of ESG Rating Divergence on Corporate Tax Avoidance Behavior. China Manag. Sci. 2025, 33, 1–18. [Google Scholar]
  40. Tian, H.N.; Hu, Z.C. Towards Green Number: Research on the Impact of Innovation Performance of Single Champion Enterprises. Sci. Technol. Manag. 2026, 1–30. [Google Scholar] [CrossRef]
  41. Al-Matari, E.M. Ownership Structure and Earnings Management: The Role of Environmental Sustainability as Moderator Variable. A Further Analysis. Saudi Evidence. Cogent Bus. Manag. 2025, 12, 1. [Google Scholar] [CrossRef] [Scilit]
  42. Wen, R.; Wu, L. Financial Openness, Economic Policy Uncertainty, and Financial Development: Evidence from Western Economies. Financ. Res. Lett. 2026, 89, 109237. [Google Scholar] [CrossRef] [Scilit]
  43. Liu, C.L.; Tian, L. Can Talent Policy Endorsement Promote Enterprise Innovation? China Ind. Econ. 2021, 3, 156–173. [Google Scholar]
  44. Berg, F.; Koelbel, J.F.; Rigobon, R. Aggregate Confusion: The Divergence of ESG Ratings. Rev. Financ. 2022, 26, 1315–1344. [Google Scholar] [CrossRef] [Scilit]
Figure 1. Theoretical model.
Sustainability 18 03086 g001
Table 1. Correlation analysis.
AgencyWindHuazhengSTGBloombergFTSE RussellVIF
Wind1 1.13
Huazheng0.430 ***1 1.16
STG0.189 ***0.231 ***1 1.63
Bloomberg−0.0175 **0.0535 ***0.459 ***1 1.34
FTSE Russell0.0261 ***0.0770 ***0.500 ***0.405 ***11.42
Mean 1.43
Data source: Manually collected by the authors. ** p < 0.05, *** p < 0.01.
Table 2. Variable definition.
SymbolVariable NameDefinition
SAFinancing ConstraintsMeasures of corporate financing constraints
ESGRDESG Rating DiscrepanciesStandard deviation of rating agencies
CEPUUncertainty in China’s
Economic Policies
Baker et al. (2016) constructed the China Economic Policy Uncertainty Index [28]
KVInformation AsymmetryKim and Verrecchia’s (2001) measure [38]
Financial expenses/total debt for the year
Cost of DebtCost of Debt Capital
levDebt-to-Asset RatioTotal liabilities/total assets
groGrowth PotentialMain business revenue growth rate
roeReturn on EquityNet profit/average net assets
sameDual-role AppointmentVirtual variable
IndepProportion of Independent DirectorsThe ratio of independent directors to total directors in an enterprise
Top1Executive Shareholding RatioThe ratio of the largest shareholder’s holdings to the total number of shares
Data source: Manually compiled.
Table 3. Descriptive analysis.
VariableNMeanStdMinMax
SA21,391−3.92900.2750−5.8345−2.0849
ESGRD21,3910.13950.062600.4709
CEPU21,39120.60849.7593073.7385
lev21,3910.41160.19580.05640.8817
gro21,3910.13000.3408−0.55142.0278
roe21,3910.04640.1514−0.83980.3472
same21,3910.31950.466301
Indep21,3910.37960.05610.14280.8000
Top121,3910.32970.14780.01840.8990
Table 4. Benchmark regression results.
Variable(1)(2)(3)
SASASA
ESGRD0.060 ***
(11.38)
0.061 ***
(7.05)
−0.165 ***
(−5.41)
ESGRD × CEPU0.001 ***
(7.37)
lev−0.029 ***
(−2.77)
−0.028 ***
(−2.73)
gro−0.002 *
(−1.90)
−0.002 **
(−1.97)
ROE−0.003
(−0.98)
−0.002
(−0.95)
same0.002
(1.32)
0.001
(1.30)
indep0.017
(0.99)
0.017
(0.99)
Top10.065 ***
(2.86)
0.065 ***
(2.88)
Constant−3.937 ***
(−5179.87)
−3.954 ***
(−340.50)
−3.954 ***
(−341.33)
YearYESYESYES
IndustryYESYESYES
N21,39121,39121,391
R20.9900.9900.990
Note: (1) t-statistics in parentheses. (2) Cluster analysis has been performed. (3) * p < 0.1, ** p < 0.05, *** p < 0.01.
Table 5. Robustness test 1.
Variable(1)(2)(3)(4)(5)(6)
Absolute LevelMDIndustry MeanWWSampleL_SA
ESGRD/ESG_Ave0.002 ** 0.015 ***0.074 ***0.009 **
(2.27) (3.11)(11.84)(2.45)
L_SA 0.719 ***
(132.34)
esg_range 0.027 ***
(4.68)
ESGRD2 0.048 ***
(4.13)
ControlsYESYESYESYESYESYES
YearYESYESYESYESYESYES
IndustryYESYESYESYESYESYES
Constant−3.948 ***−3.962 ***−3.961 ***1.012 ***−3.958 ***−1.146 ***
(−1034.88)(−327.30)(−320.18)(211.32)(−895.87)(−53.03)
N21,39121,39121,39121,39118,20016,782
R20.9900.9900.9900.9000.9880.977
Note: (1) t-statistics in parentheses. (2) Cluster analysis has been performed. (3) ** p < 0.05, *** p < 0.01.
Table 6. Mechanism analysis.
Variable(1)(2)(3)
KVCost_of_DebtSA
ESGRD0.062 **1.062 ***0.061 ***
(2.09)(33.42)(7.07)
KV 0.005 ***
(2.97)
Cost_of_Debt 0.006 ***
(3.30)
ControlsYESYESYES
YearYESYESYES
YESYESYES
Constant0.427 ***0.627 ***−3.957 ***
(19.72)(28.26)(−337.32)
N21,39121,39121,391
R20.4840.5480.990
Note: (1) t-statistics in parentheses. (2) Cluster analysis has been performed. (3) ** p < 0.05, *** p < 0.01.
Table 7. VIF test.
Table 7. VIF test.
VariableVIF1/VIF
ESGRD1.020.982
KV1.070.938
Cost_of_Debt1.030.970
SA1.040.959
lev1.100.905
gro1.100.905
roe1.230.810
same1.050.950
Indep1.020.982
Top11.050.950
Mean VIF1.07
Table 8. Mediation effect test.
PathEffect Coef.Std. Err95% CI (Bias-Corrected)
BootLLCIBootULCI
MediationEffect: KV0.017 ***0.0040.0100.024
Direct Effect0.246 ***0.0010.1860.299
MediationEffect: Cost_of_Debt0.064 ***0.0120.0390.087
Direct Effect0.199 ***0.0010.1380.267
Note: *** in the effect coef. The column indicates significance at 10%, 5%, and 1% levels, respectively. BootLLCI and BootULCI represent lower and upper confidence interval limits.
Table 9. Endogeneity test: Based on the instrumental variables method.
VariableIV1IV2
ESGRDSAESGRDSA
IV1_ESGRD 0.145 *** 0.920 **
(4.98) (2.10)
IV2_esg_ind_avg0.588 ***
(15.41)
iv_prov 0.930 ***
(12.83)
Constant −4.158 ***
(−58.88)
Cragg-DonaldWaldFstatistic579.28 287.253
Chi-sq(1) p-val0.0000 0.0000
ControlsYESYESYESYES
Industry/YearYESYESYESYES
N21,39121,39121,39121,391
R20.5920.0050.5850.040
Note: ** p < 0.05, *** p < 0.01.
Table 10. Heterogeneity analysis 1.
Variable(1)(2)(3)(4)(5)(6)
SOEsNon-SOEsLargeSmallEastC-West
ESGRD0.057 ***0.066 ***0.072 ***0.0010.074 ***0.059 ***
(8.49)(4.81)(9.24)(0.03)(9.82)(6.41)
ControlsYESYESYESYESYESYES
IndustryYESYESYESYESYESYES
YearYESYESYESYESYESYES
Constant−3.908 ***−4.046 ***−4.040 ***−3.886 ***−3.932 ***−4.010 ***
(−736.51)(−535.69)(−706.71)(−943.22)(−862.47)(−514.02)
N14,8696,52210,69510,50614,8385294
R20.9890.9920.9920.9940.9910.985
Note: *** in the effect coef. The column indicates significance at 10%, 5%, and 1% levels, respectively. BootLLCI and BootULCI represent lower and upper confidence interval limits.
Table 11. Heterogeneity analysis 2.
Variable(7)(8)(9)(10)
HighDispLowDispManuNon-Manu
ESGRD0.143 ***0.0040.071 ***0.040 ***
(13.23)(0.40)(11.70)(5.01)
ControlsYESYESYESYES
IndustryYESYESYESYES
YearYESYESYESYES
Constant−3.960 ***−3.959 ***−3.9358 ***−4.0044 ***
(−621.93)(−758.80)(−880.41)(−554.60)
N10,69510,69513,9106889
R20.9910.9930.9880.991
Note: *** in the effect coef. The column indicates significance at 10%, 5%, and 1% levels, respectively. BootLLCI and BootULCI represent lower and upper confidence interval limits.
Disclaimer/Publisher’s Note: The statements, opinions and data contained in all publications are solely those of the individual author(s) and contributor(s) and not of MDPI and/or the editor(s). MDPI and/or the editor(s) disclaim responsibility for any injury to people or property resulting from any ideas, methods, instructions or products referred to in the content.