Article

Optimizing EV Charging Infrastructure in Multi-Unit Residential Buildings for Sustainable Energy Management
by
Abdulaziz Almutairi
Department of Electrical Engineering, College of Engineering, Majmaah University, Almajmaah 11952, Saudi Arabia
Sustainability 2026, 18(6), 3051; https://doi.org/10.3390/su18063051
Submission received: 29 January 2026 / Revised: 4 March 2026 / Accepted: 10 March 2026 / Published: 20 March 2026

Abstract

Inadequate charging infrastructure is considered a major challenge in the widespread adoption of electric vehicles (EVs), especially the absence of the optimal number of chargers in multi-unit residential buildings (MURBs) where several EVs need to share the same chargers. Therefore, this study proposes an optimization approach to determine the optimal number of chargers in MURBs, considering continuous and flexible charging options. First, the daily travel behavior of drivers is estimated using National Household Travel Survey (NHTS) data. Then, based on the technical parameters of EVs, the daily energy consumption of EVs is estimated. Subsequently, a mathematical problem with a unified objective function and scenario-specific constraints is developed. Finally, an index is proposed to quantify the unserved energy in EVs. Simulation results demonstrate the effectiveness of the flexible method in reducing the required number of chargers while ensuring satisfactory service. This research contributes to sustainable energy management, aligning with the United Nations’ Sustainable Development Goals (SDGs) for 2030.

1. Introduction

The increasing penetration of electric vehicles (EVs) represents a transformative shift in the automotive industry, driven by environmental, economic, and technological factors. As concerns over climate change intensify, efforts are being made at both the government and consumer levels to re-duce greenhouse gas emissions, making the transition to EVs an attractive option [1,2]. The impacts of this shift are multifaceted, ranging from decreased air pollution to reduced dependence on fossil fuels, contributing to a more sustainable and resilient future [3]. Technological advancements have also played a pivotal role, with improvements in battery technology enhancing the range and affordability of EVs [4,5]. Additionally, governments world-wide have implemented various incentives such as tax credits, subsidies, and infrastructure development to encourage EV adoption. Therefore, the penetration of EVs has increased recently and is expected to further rise in the upcoming years [6,7].
However, the deployment of charging infrastructure is not keeping pace, and many communities face challenges in finding chargers within a reasonable distance. The potential issues related to the lack of charging infrastructure for EVs pose a significant challenge to the widespread adoption of EVs [8,9]. One solution is to deploy public charging stations at strategically different locations to facilitate various community members [10]. Several studies have been conducted for different regions to optimally locate and size public charging infrastructure. The location and size of intra-city public charging stations for EV deployment are optimized in [11], considering various factors such as charging demand, driver behavior, location, service range, and pricing on profitability. A location model for EV public charging stations in Beijing is proposed in [12]. The primary objective of this study is to alleviate range anxiety and maintain existing activities for 90% of EV drivers. An improved genetic algorithm is used in [13] to optimize the location of public charging stations for electric ride-hailing, considering charging station operator investments, EV owner travel costs, and elastic demand. A bi-level program-based strategy using a two-layer genetic algorithm and simulated annealing is employed in [14] to optimize public charging infrastructure and route planning in the logistics sector. The optimal charging pricing problem of public EV charging stations is considered in [13], integrating urban transportation network and power distribution network operations. Various studies have explored charging station communication aspects, including authentication protocol using digital signatures [15] and federated learning based intrusion detection [16]. Recent multi-timescale stochastic dispatch studies for PV-integrated charging stations demonstrate that real-time forecast updating and coordinated energy storage scheduling can significantly reduce operational costs [17].
Public charging is an efficient means to facilitate the penetration of EVs. However, it results in higher charging costs and lacks flexibility. Therefore, many EV owners prefer charging their vehicles at home due to the convenience and flexibility it offers, aligning with their daily routines [18]. Several studies have been conducted on the optimal design and operation of charging stations in residential areas. For instance, a recent study [19] suggests a positive valuation for EV home charging points in both house and apartment settings, with apartment residents strongly preferring private charging over communal options. Another study [20] found that smart charging users achieve better results by optimizing charging schedules, reducing costs, and increasing efficiency compared to non-users. A study conducted in Germany [21] revealed that individual home charging possibilities significantly influence the diffusion of EVs. However, access to charging stations is more challenging in multi-unit residential buildings (MURBs) compared to detached homes. Prior game-theoretic studies indicate that EV charging infrastructure deployment decisions are highly sensitive to construction cost, network effects, and competitive dynamics [22,23].
In MURBs, challenges to EV adoption include limited access to charging infrastructure, shared billing complexities, and constraints on power capacity, which may necessitate building modifications [24]. These issues act as barriers, hindering EV uptake among MURB residents [25]. Therefore, a comprehensive study is conducted in [25] to assess stakeholder dynamics around EV charging in MURBs. This study is later extended in [26] by mapping the causal relations linking entities within the system and identifying potential demand-focused policy interventions. Another study is conducted in [27] with the aim of assessing the suitability of e-mobility for everyday use and exploring the potential of controlled charging processes in multi-unit residential communities.
Most existing studies primarily address public charging infrastructure or single-user residential charging scenarios. Limited attention has been given to determining the optimal number of shared chargers in MURBs, where parking is shared and charging access must be coordinated among multiple EV users. In particular, a unified framework that enables direct comparison between continuous and flexible charging operations in such environments remains underexplored. This gap motivates the development of the proposed optimization approach. For policymakers and building operators, establishing the ideal number of chargers in MURBs is crucial, as it directly influences the success of policies aimed at promoting EV adoption and sustainable transportation within urban communities. By strategically placing an appropriate number of chargers, policymakers can encourage EV ownership without straining the building’s electrical infrastructure. Building operators, on the other hand, can optimize resource allocation, minimize potential conflicts among residents, and enhance the overall charging experience. Recognizing and addressing this aspect in policy frameworks and building management strategies is essential for fostering an EV-friendly environment and supporting the transition to sustainable mobility within residential settings. Another important aspect of charging infrastructure in MURBs is providing different charging options. For example, dedicated chargers can be allocated to different EVs until they are fully charged, or additional operators can be used to facilitate flexible charging. These aspects are also not discussed in the existing literature. Therefore, the primary objective of this study is to develop an optimization framework for determining the optimal number of shared EV chargers MURBs under continuous and flexible charging strategies while maintaining acceptable service quality.
To address these challenges, this study formulates an optimization framework to determine the optimal number of chargers in MURBs with shared parking, focusing on continuous and flexible charging options. The goal is to minimize the number of chargers while ensuring acceptable service quality. First, the EV load is determined using the travel behavior of EV drivers and technical parameters of EVs. The National Household Travel Survey (NHTS) data is employed to extract driver behavior, and parameters of commercially available EVs are utilized. A generalized objective function is devised for both operational cases (continuous and flexible), and specific constraints are introduced to ensure continuous service operation. An index is proposed to measure the unfulfilled energy demand of different EVs under each scenario. The simulation con-siders various penetration levels of EVs and different energy requirements to analyze the impact of these factors on the optimal number of chargers. The results obtained in this study are valuable for policymakers and building energy managers to plan for the optimal number of chargers, considering current and future penetration levels of EVs.
From a sustainability perspective, the proposed framework contributes by improving infrastructure utilization and reducing unnecessary charger deployment in multi-unit residential buildings. Efficient sizing and coordinated operation of shared chargers can lower material usage, reduce peak loading stress on distribution assets, and support more energy-efficient EV integration. While the present study focuses primarily on operational optimization, these improvements indirectly support environmental and energy sustainability objectives. The main contributions of this work are summarized as follows:
  • Development of a unified optimization framework for shared EV charging in MURBs;
  • Comparative modeling of continuous and flexible charging within the same mathematical structure;
  • Introduction of an EV-level unfulfillment index to evaluate service quality;
  • Quantification of charger reduction potential under flexible operation across different EV penetration levels

2. Driver and EV Parameters

To estimate the energy consumption of Electric Vehicles (EVs), two categories of data are required: driver behavior data and EV data. Several factors contribute to estimating driver behavior, including trip duration, daily mileage, arrival/departure times, and more [28]. Trip duration and daily mileage directly influence the overall energy usage during a typical journey. Arrival and departure times play a pivotal role in determining charging needs, aligning with energy demand patterns throughout the day [29]. EV-specific parameters such as battery size and energy efficiency are also necessary to gauge the vehicle’s energy requirements and overall performance. Additionally, understanding driver behavior is crucial, and due to the absence of large-scale EV datasets, driver behavior is often extracted from the NHTS data [30]. Therefore, this study also utilizes the NHTS dataset to extract driver behavior parameters similar to [31,32]. The EV parameters are sourced from the database of commercially available EVs to date [33]. The EV fleet considered in this study reflects heterogeneous vehicle characteristics and real-world travel behavior derived from survey data, thereby capturing realistic variability in arrival times, energy demand, and battery capacities.

2.1. Trip Duration

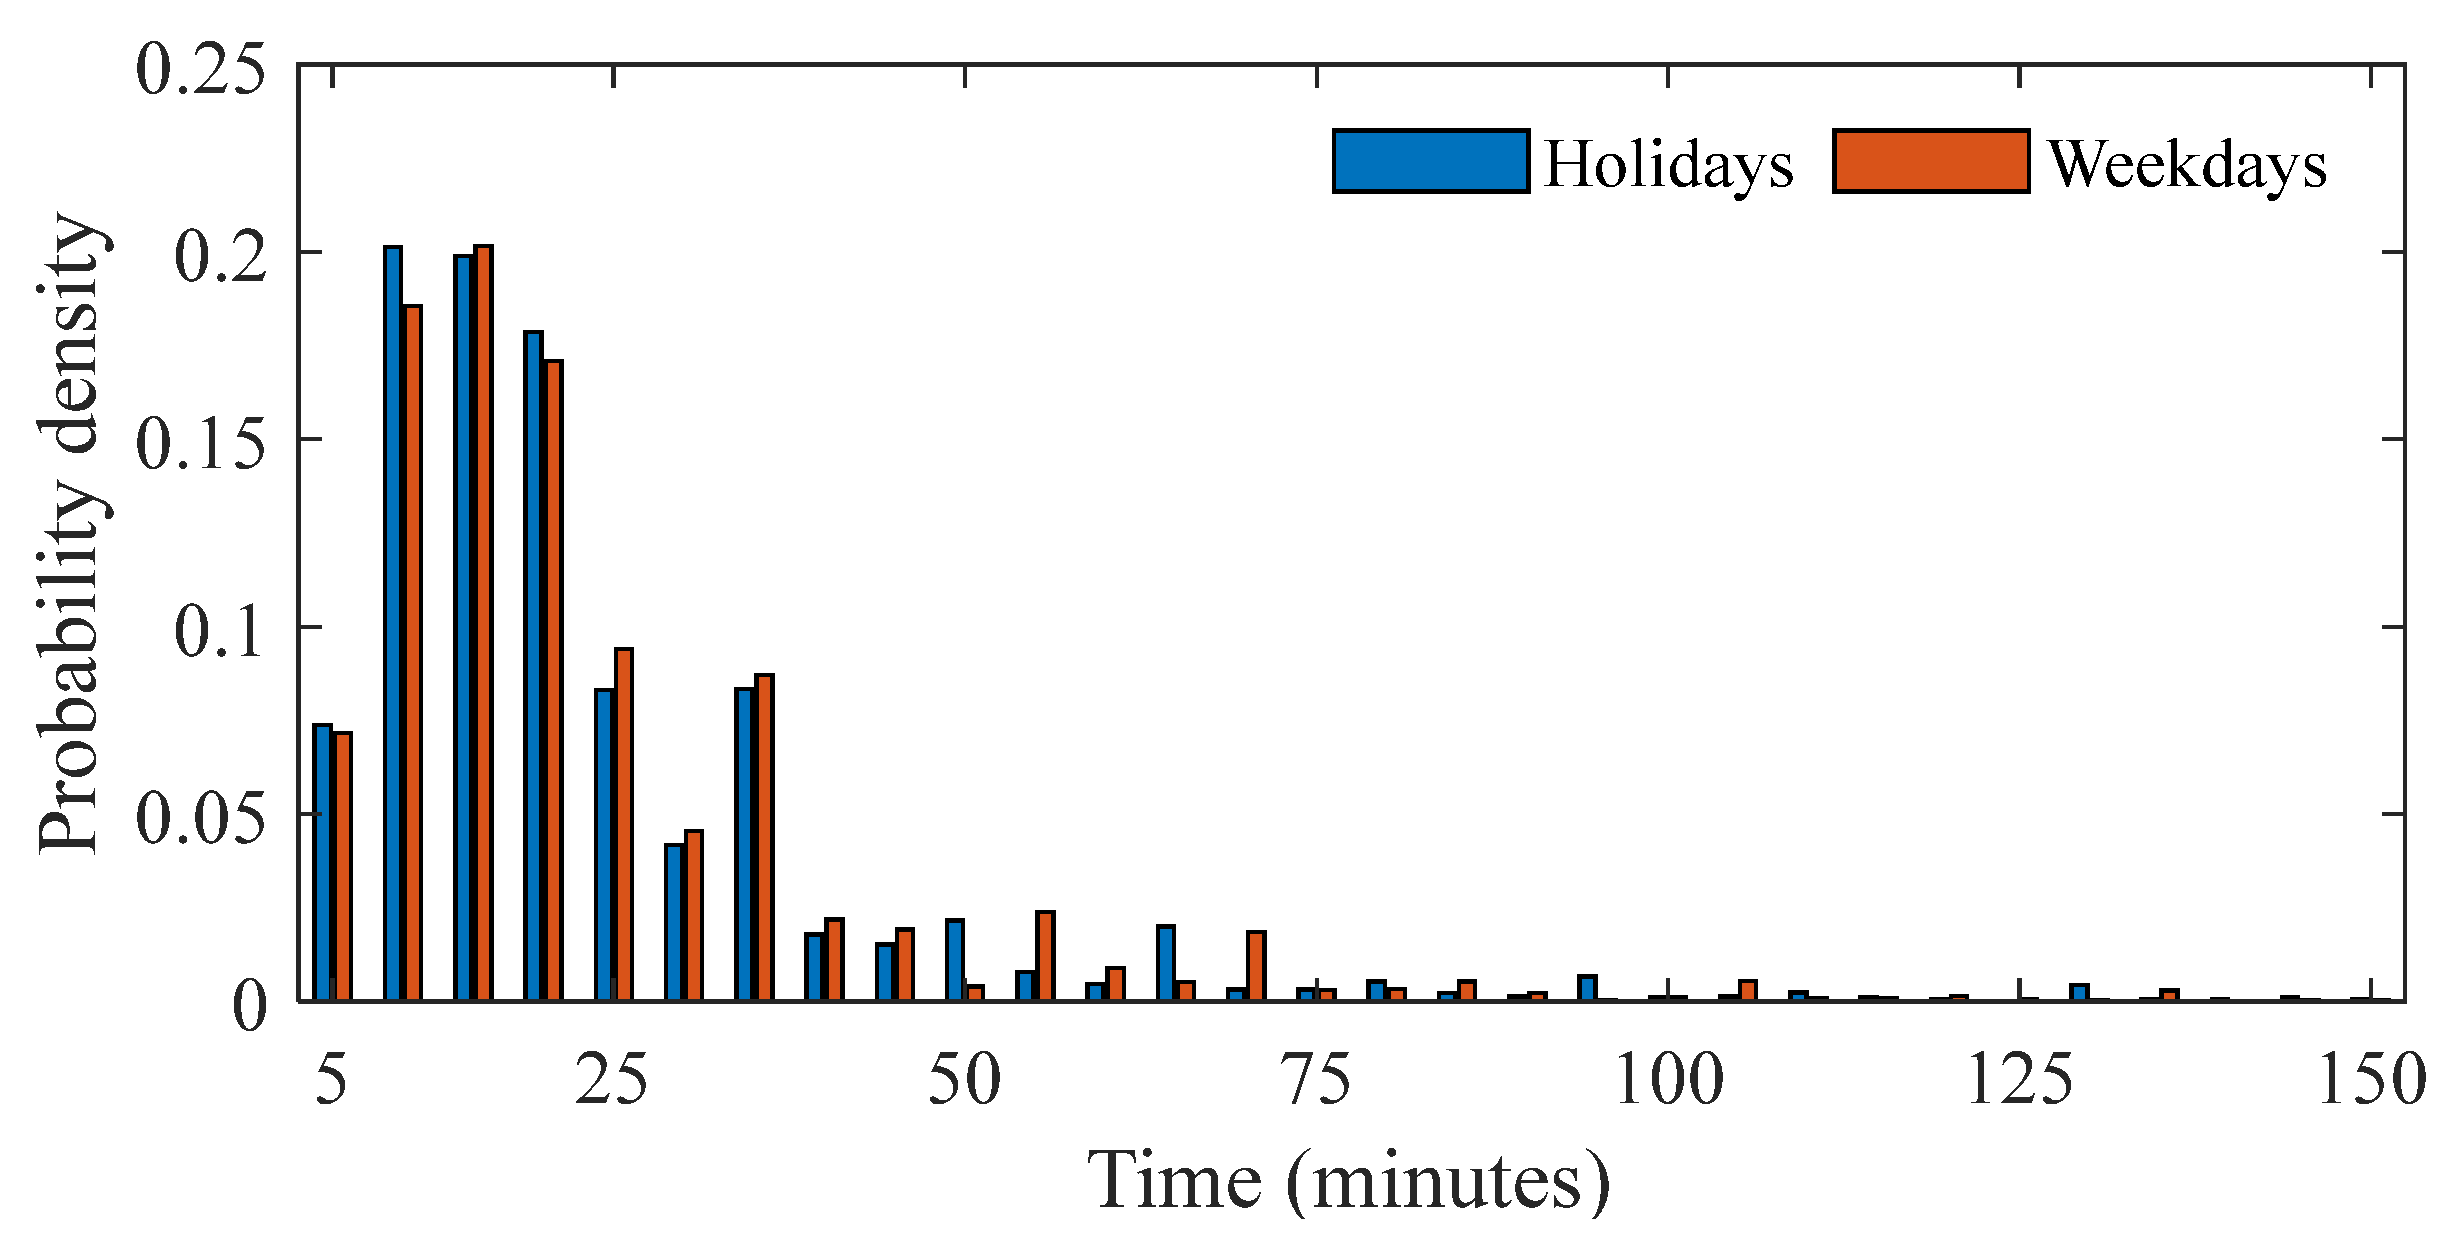
Daily trip durations for weekdays and holidays, extracted from the NHTS data, provide valuable insights into travel behaviors that influence EV energy consumption estimates, as illustrated in Figure 1. The data indicates that a significant portion of daily trips, whether on regular weekdays or holidays, tends to be under 25 min. Additionally, it can be observed from the figure that a very small number of trips exceed 100 min. This consistent pattern aligns with the prevalent usage of vehicles for short-distance commuting and everyday errands [34]. It is important to note that vehicles might have multiple trips in a single day, and the data shown in Figure 1 corresponds to the per-trip travel time.

2.2. Daily Mileage

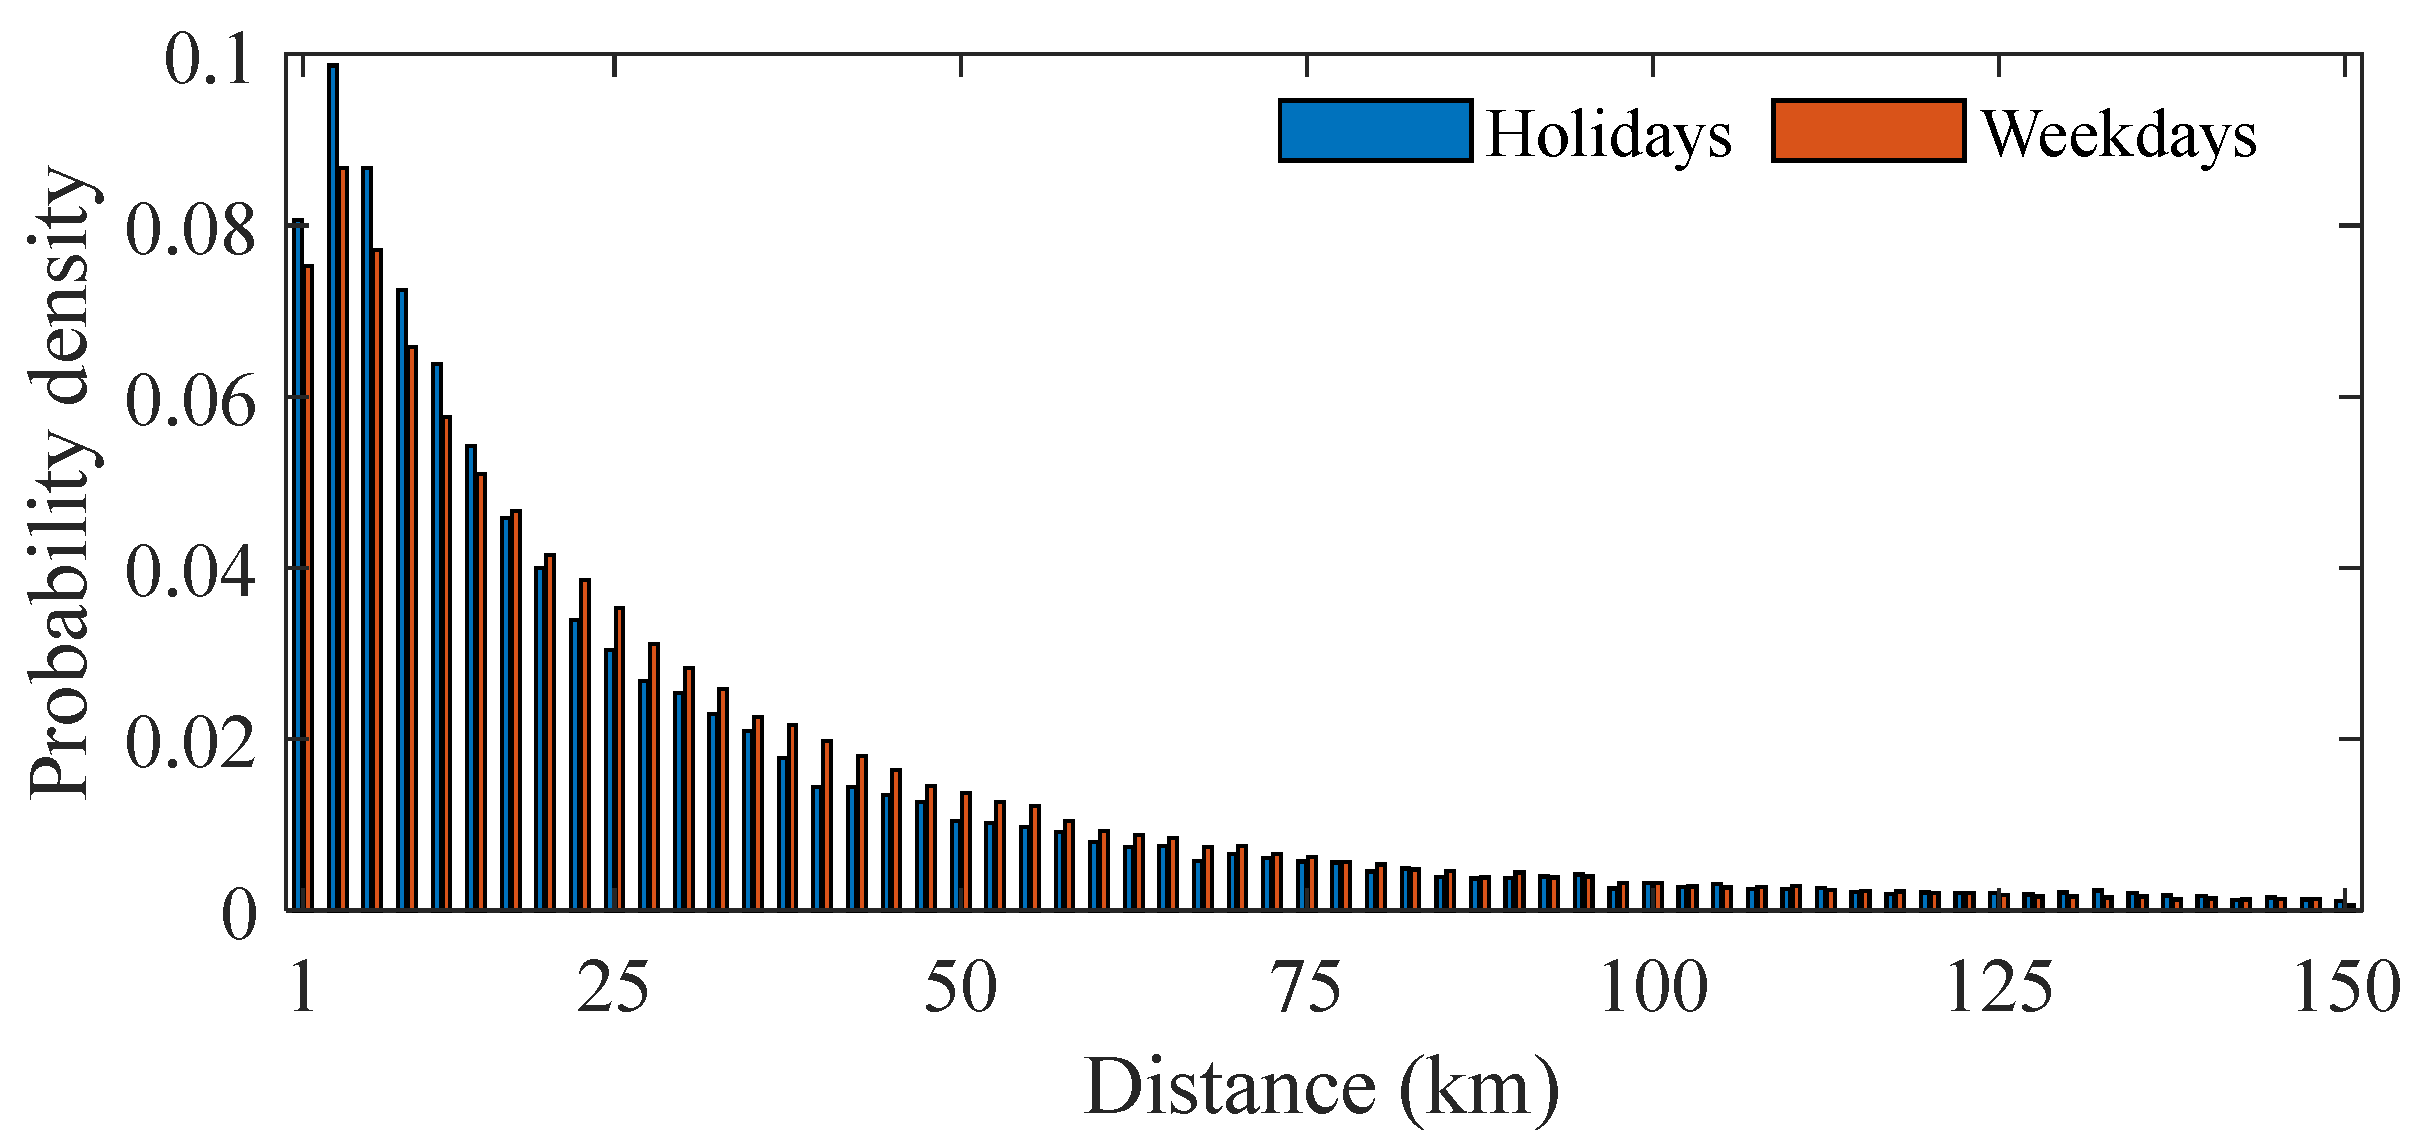
Similarly, the daily mileage of vehicles, derived from the NHTS dataset, provides crucial insights into travel patterns influencing EV energy consumption. The data underscores the prevalence of multiple short-distance trips, with the majority of vehicles covering less than 50 km per day, as depicted in Figure 2. This observation aligns with the typical usage of EVs for local commuting and daily errands, emphasizing the relevance of optimizing EV designs for shorter travel distances. Notably, the dataset indicates a minimal number of vehicles covering distances exceeding 100 km daily. Recognizing these patterns helps tailor charging infrastructure and energy consumption models, ensuring they align well with the predominant usage behaviors observed in the NHTS dataset. This facilitates the effective integration of EVs into diverse transportation needs.

2.3. Arrival and Departure Times

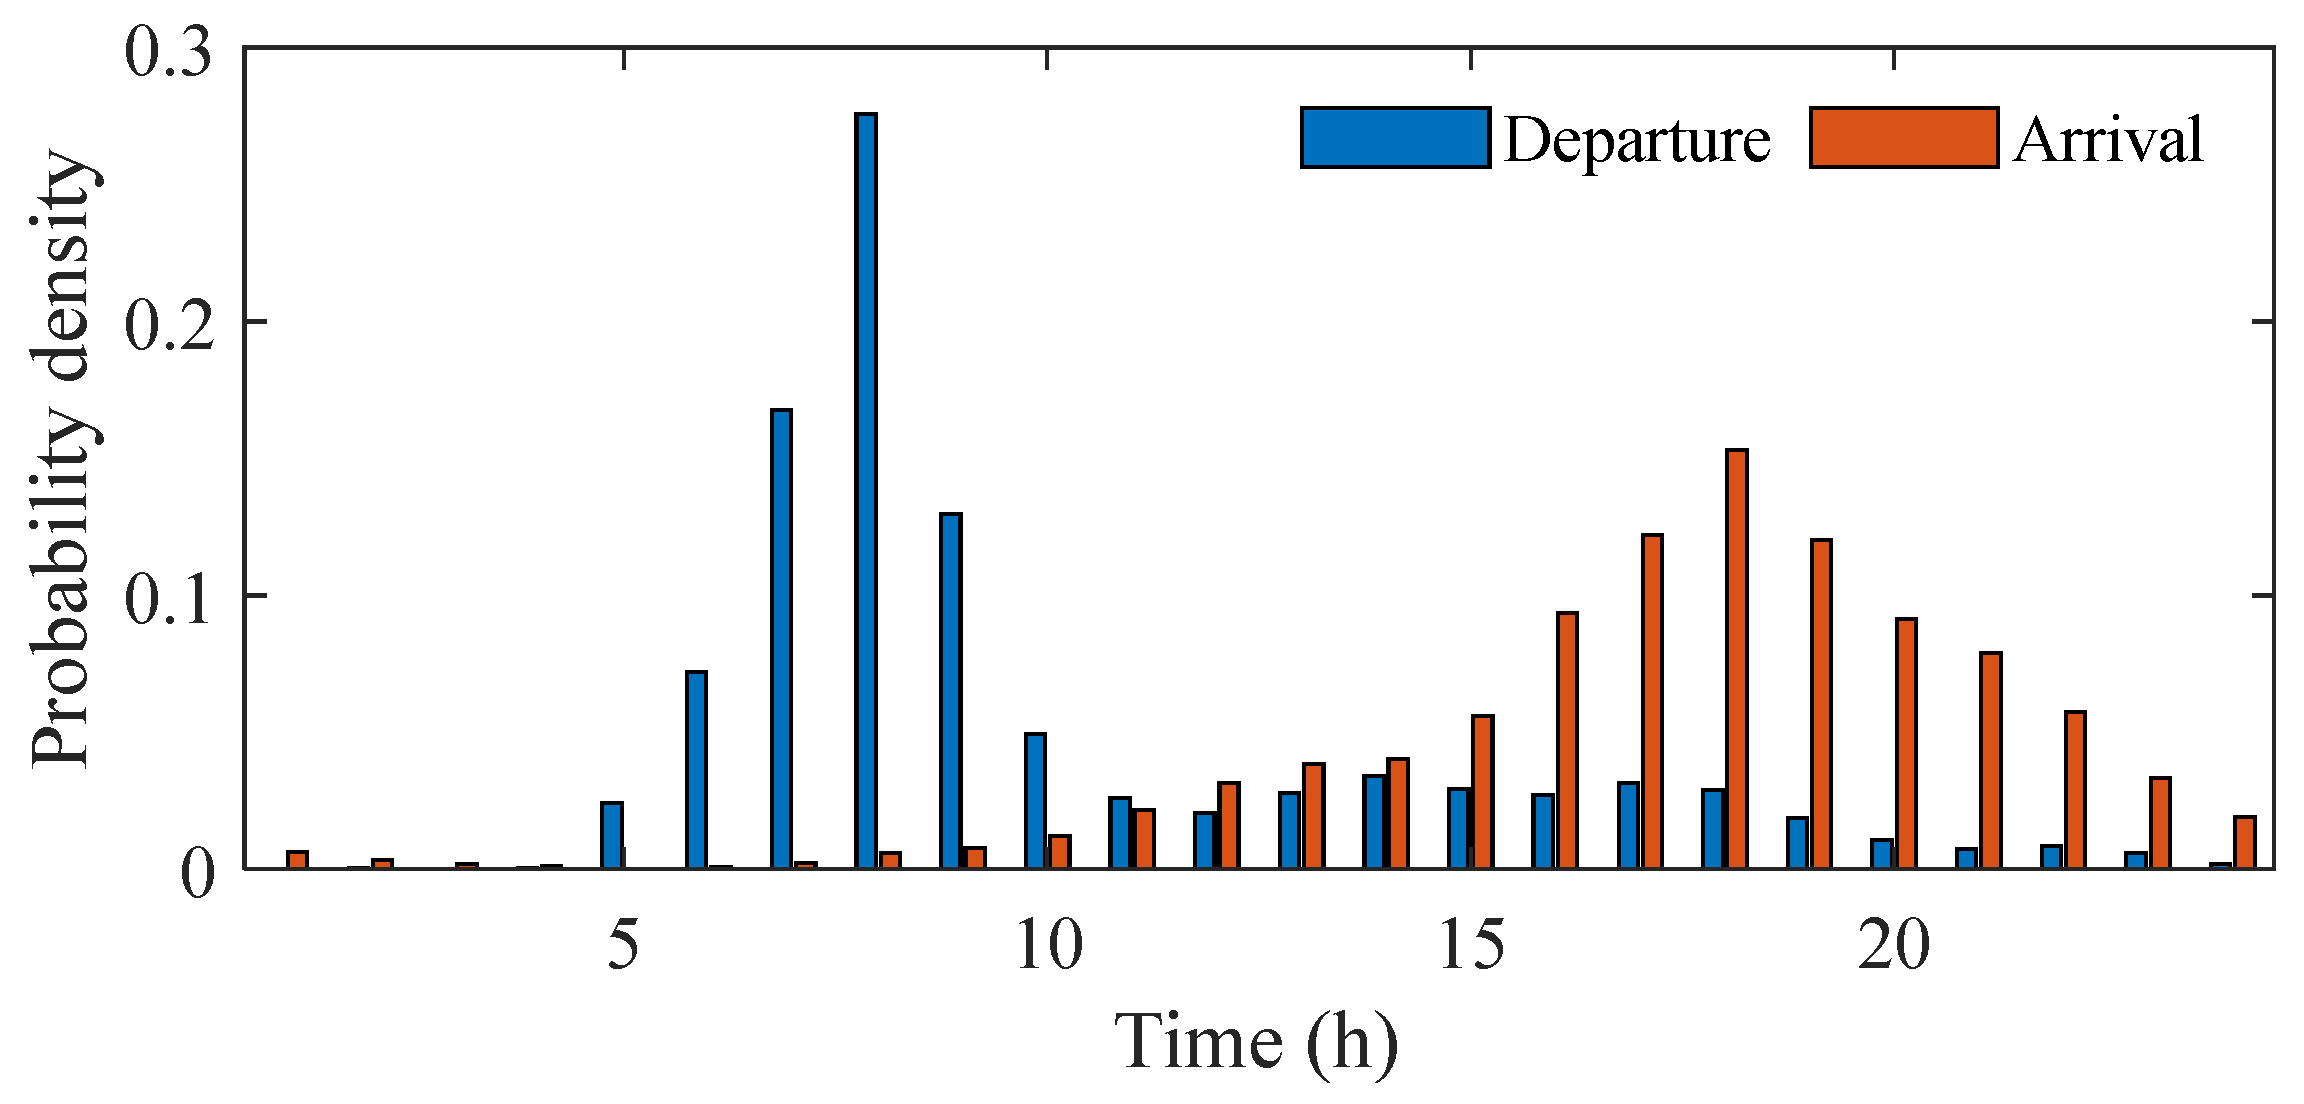
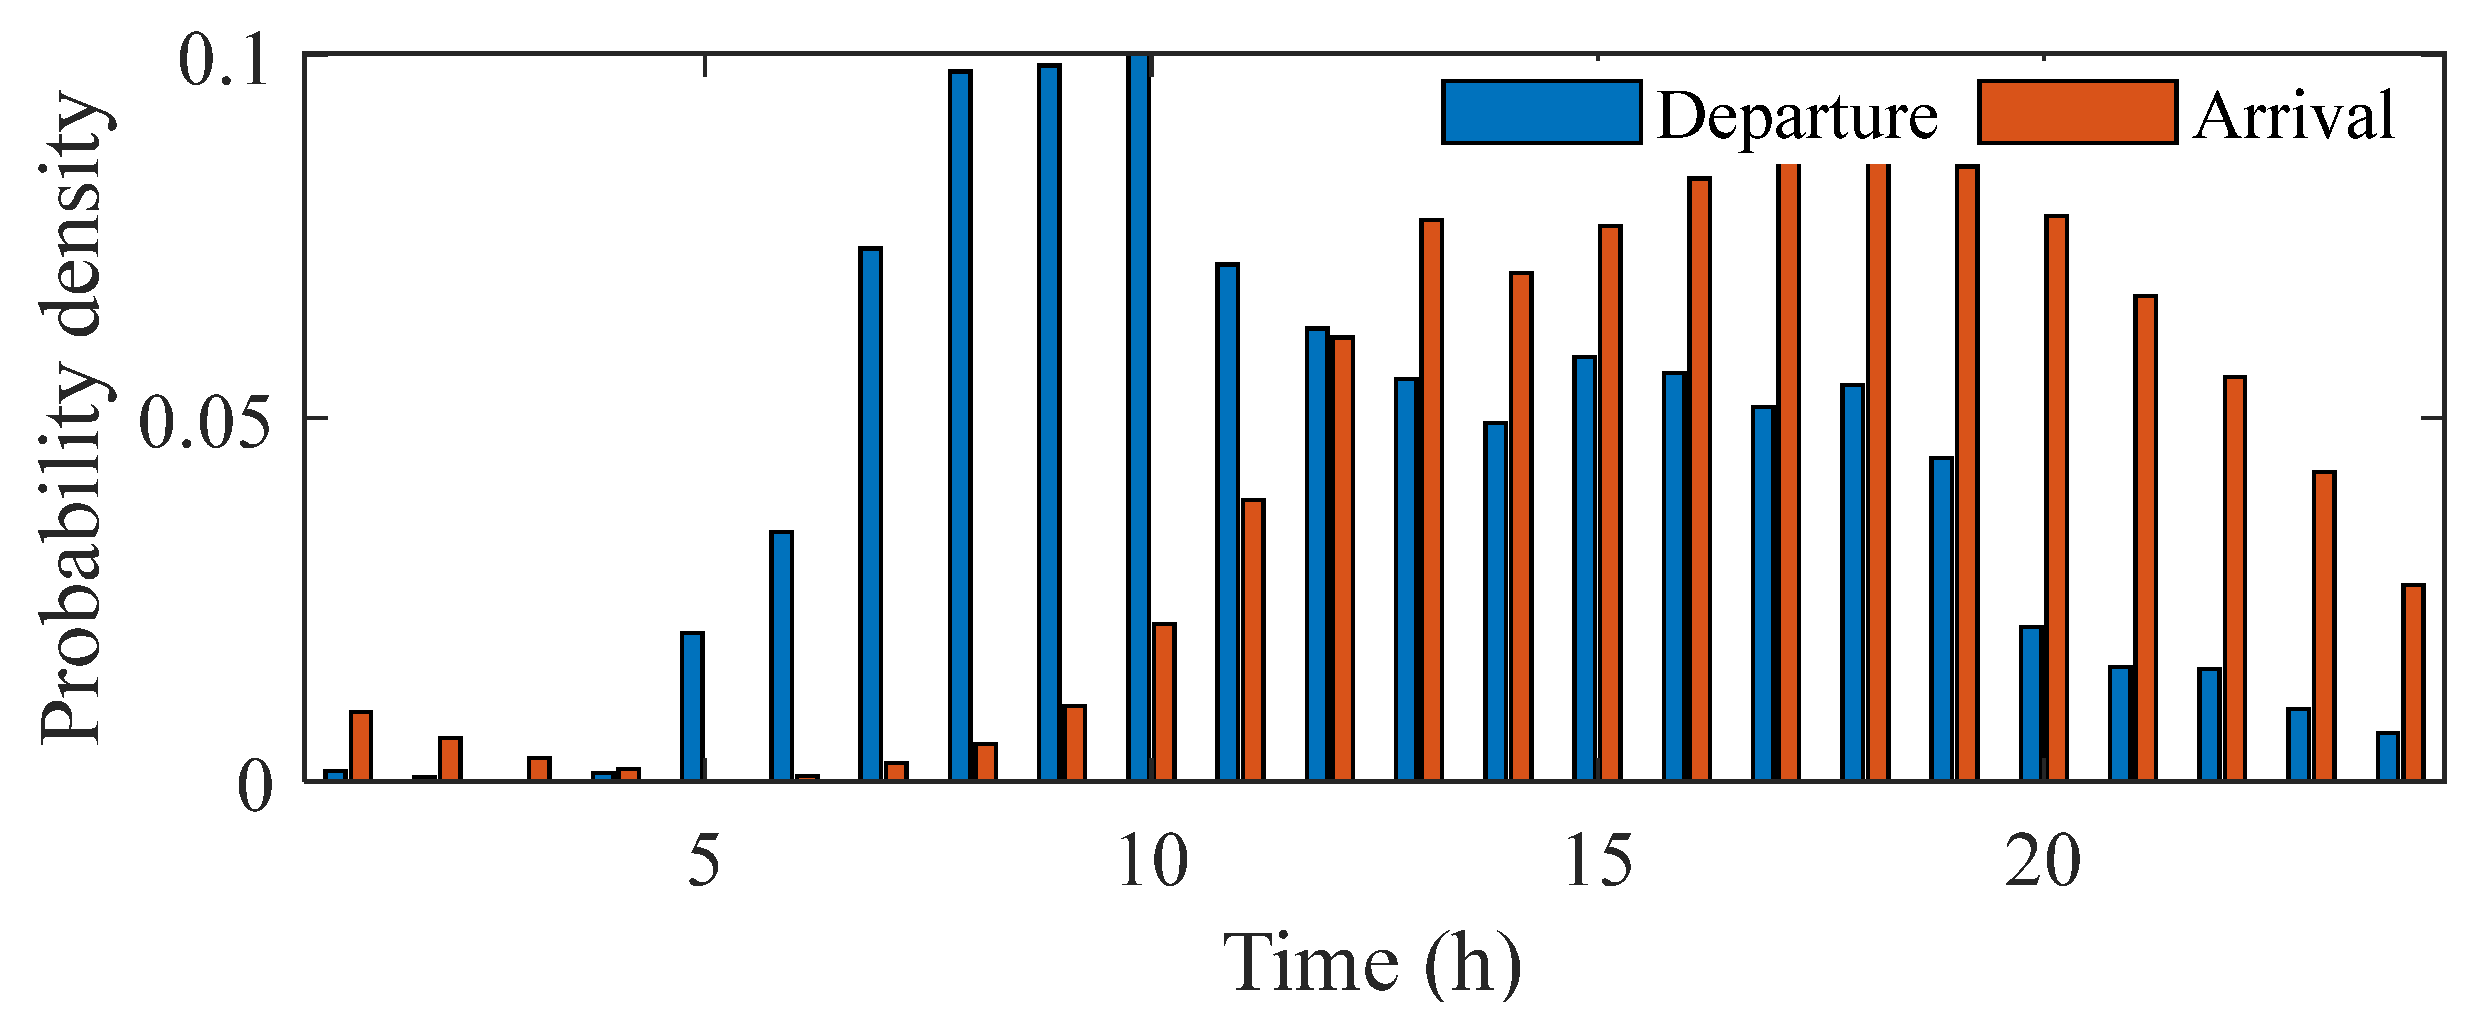
The probability density functions (PDFs) of vehicles’ arrival and departure times at home during weekdays (Figure 3) and holidays (Figure 4) reveal distinct patterns. On weekdays, a sharp peak is observed at 8 am for departures, indicative of a concentrated morning rush for work or other activities. In contrast, arrival and departure times on holidays exhibit a smoother distribution, reflecting a more relaxed and varied schedule. The absence of a pronounced peak during holidays suggests that vehicle users have more flexibility in their travel routines, leading to a dispersed pattern of arrivals and departures throughout the day. These temporal dynamics captured in the PDFs are crucial for optimizing charging infrastructure and understanding the temporal energy demands of EVs, providing valuable insights for designing effective energy management strategies that cater to the specific temporal behaviors on both weekdays and holidays.

2.4. EV Parameters

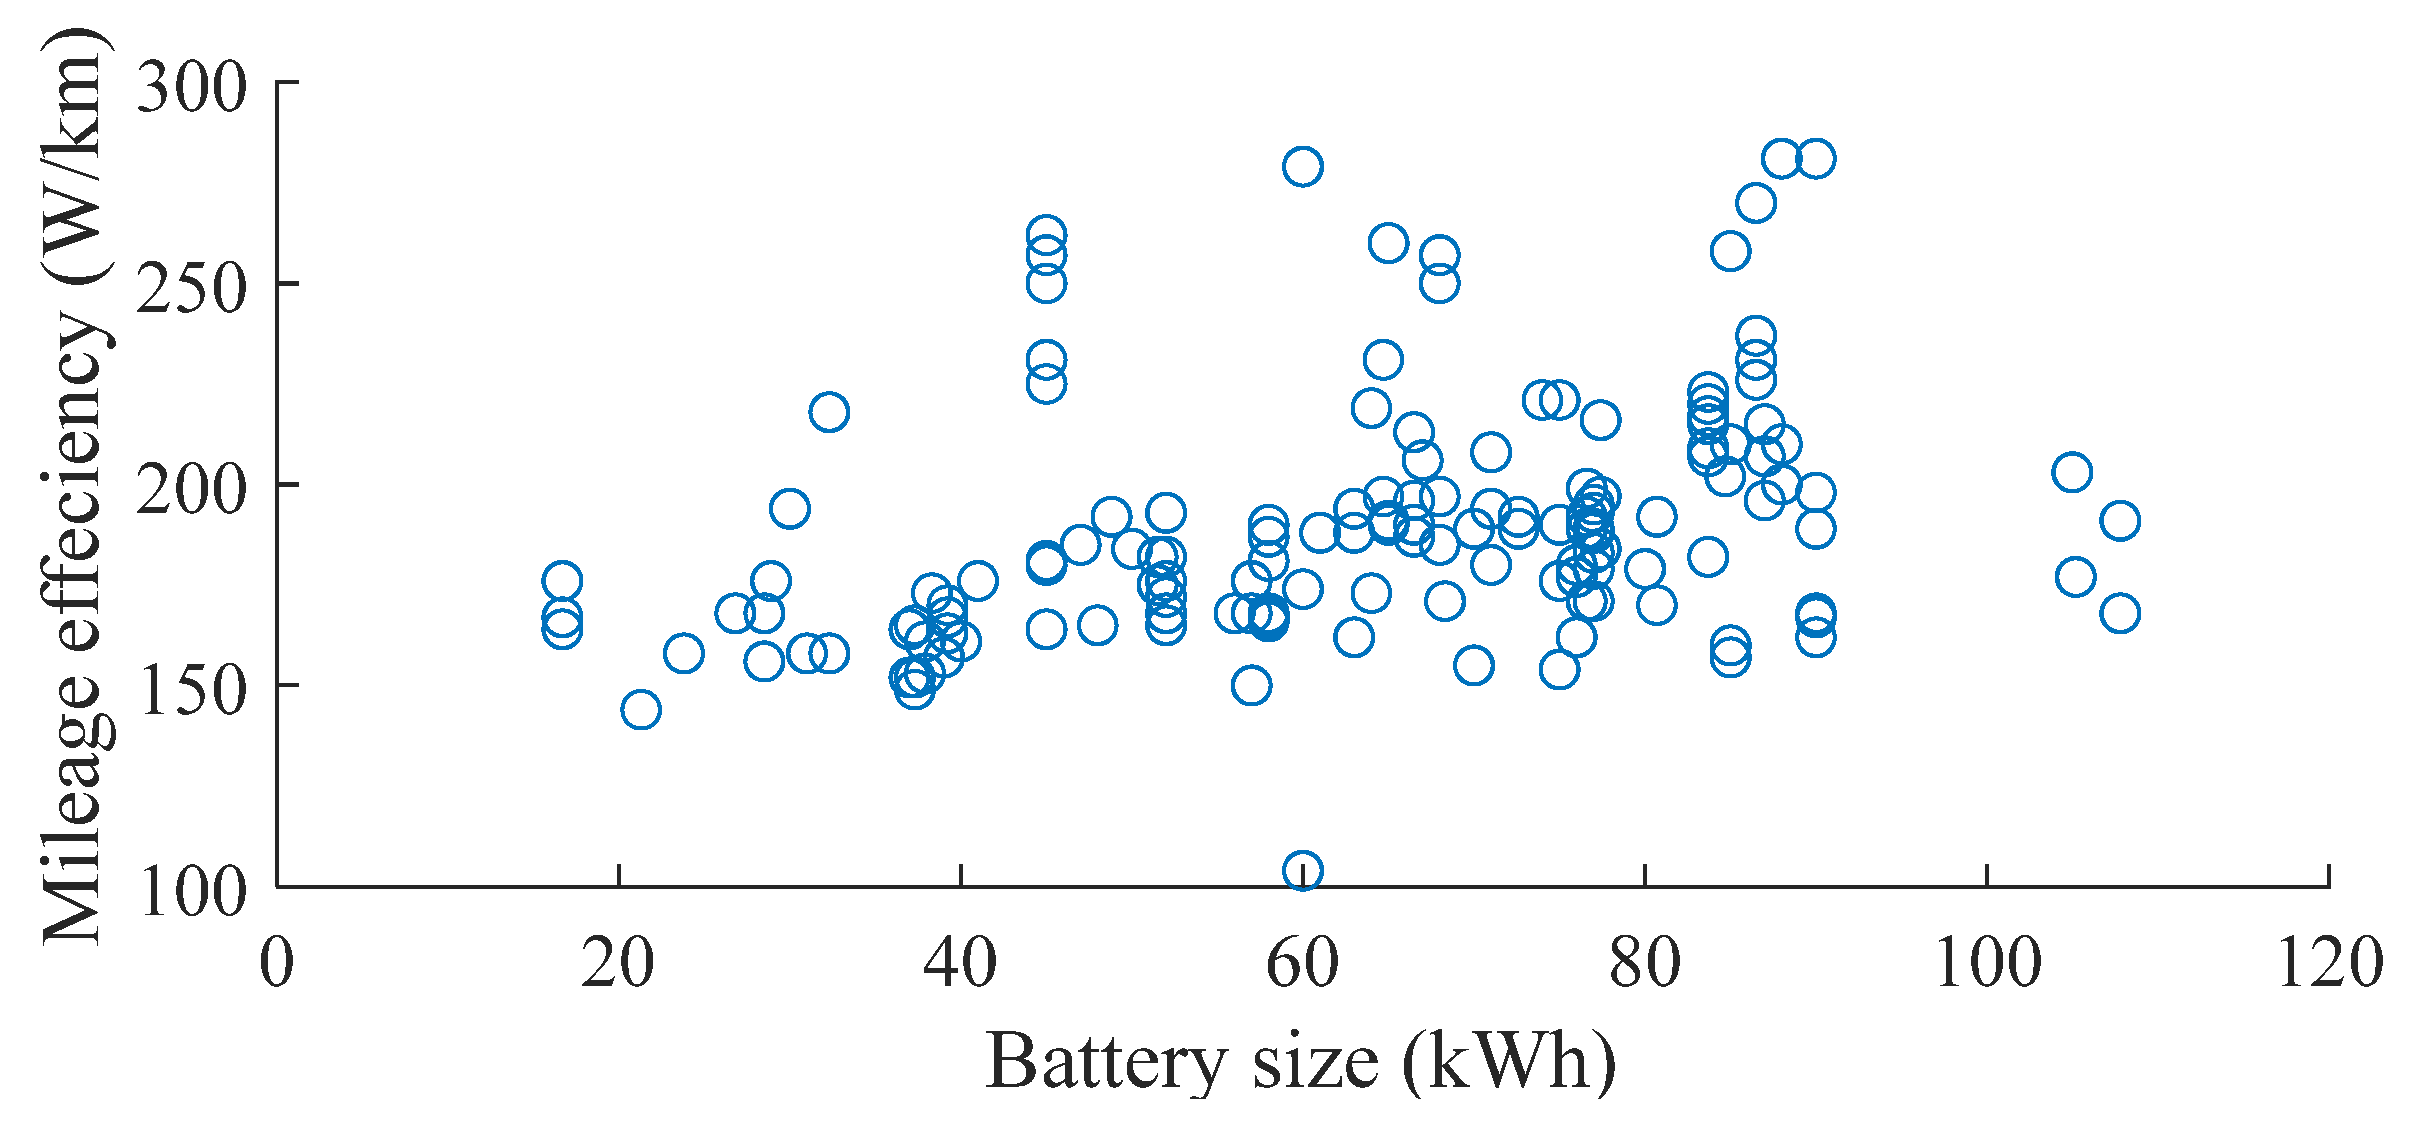
Based on the data of commercially available EVs [33], various EV parameters, including mileage efficiency and usable battery size, are summarized in Figure 5. The mileage efficiency of the majority of EVs typically falls within the range of 150 to 250 Wh/km, reflecting the energy required to cover one kilometer. This efficiency range signifies advancements in EV technology, ensuring a balance between energy consumption and vehicle performance. Additionally, the usable battery size, a critical factor in determining the EV’s range, generally ranges from 40 kWh to 90 kWh. Batteries below 40 kWh are often associated with plug-in hybrids, showcasing the distinct characteristics of these vehicles with a reliance on both electric and internal combustion engines. Recognizing these parameters enables a more nuanced assessment of EV energy consumption, facilitating better-informed decisions for charging infrastructure planning and overall energy management across diverse vehicle specifications.

2.5. Daily Energy Consumption of EVs

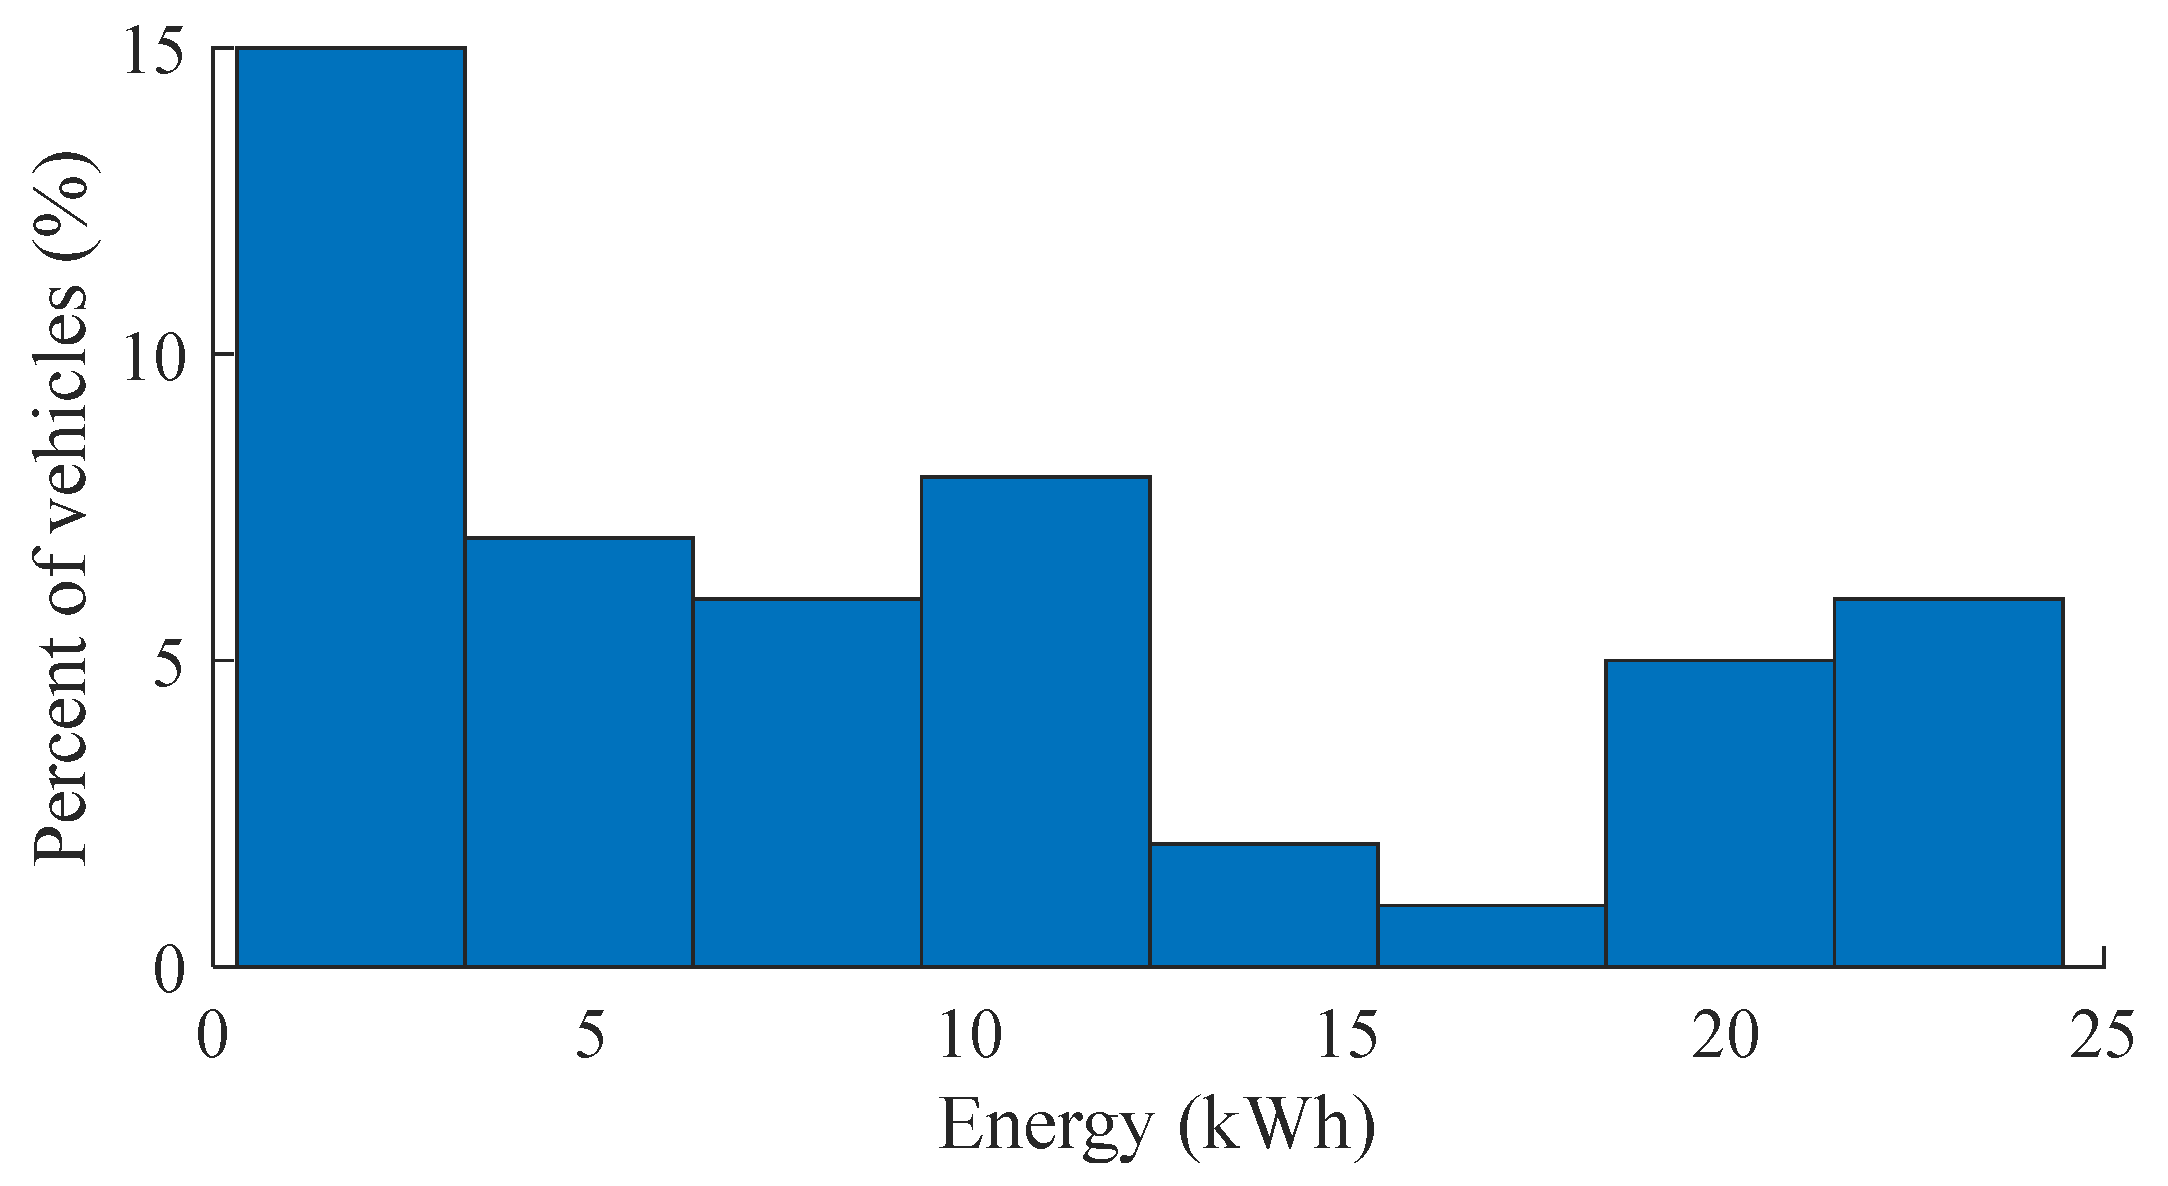
After estimating daily vehicle mileage and extracting technical parameters of EVs, this study calculates the daily energy consumption of EVs. According to the EV dataset, the average energy efficiency for all EVs is 195 Wh/km, with an average usable battery size of 68.9 kWh (as of January 2024). Illustrated in Figure 6, the daily energy consumption pattern reveals that the majority of EVs consume less than 25 kWh daily. This finding aligns well with an average vehicle mileage of under 100 km per day and an average energy efficiency of 195 Wh/km.

3. MURBs and Number of Chargers

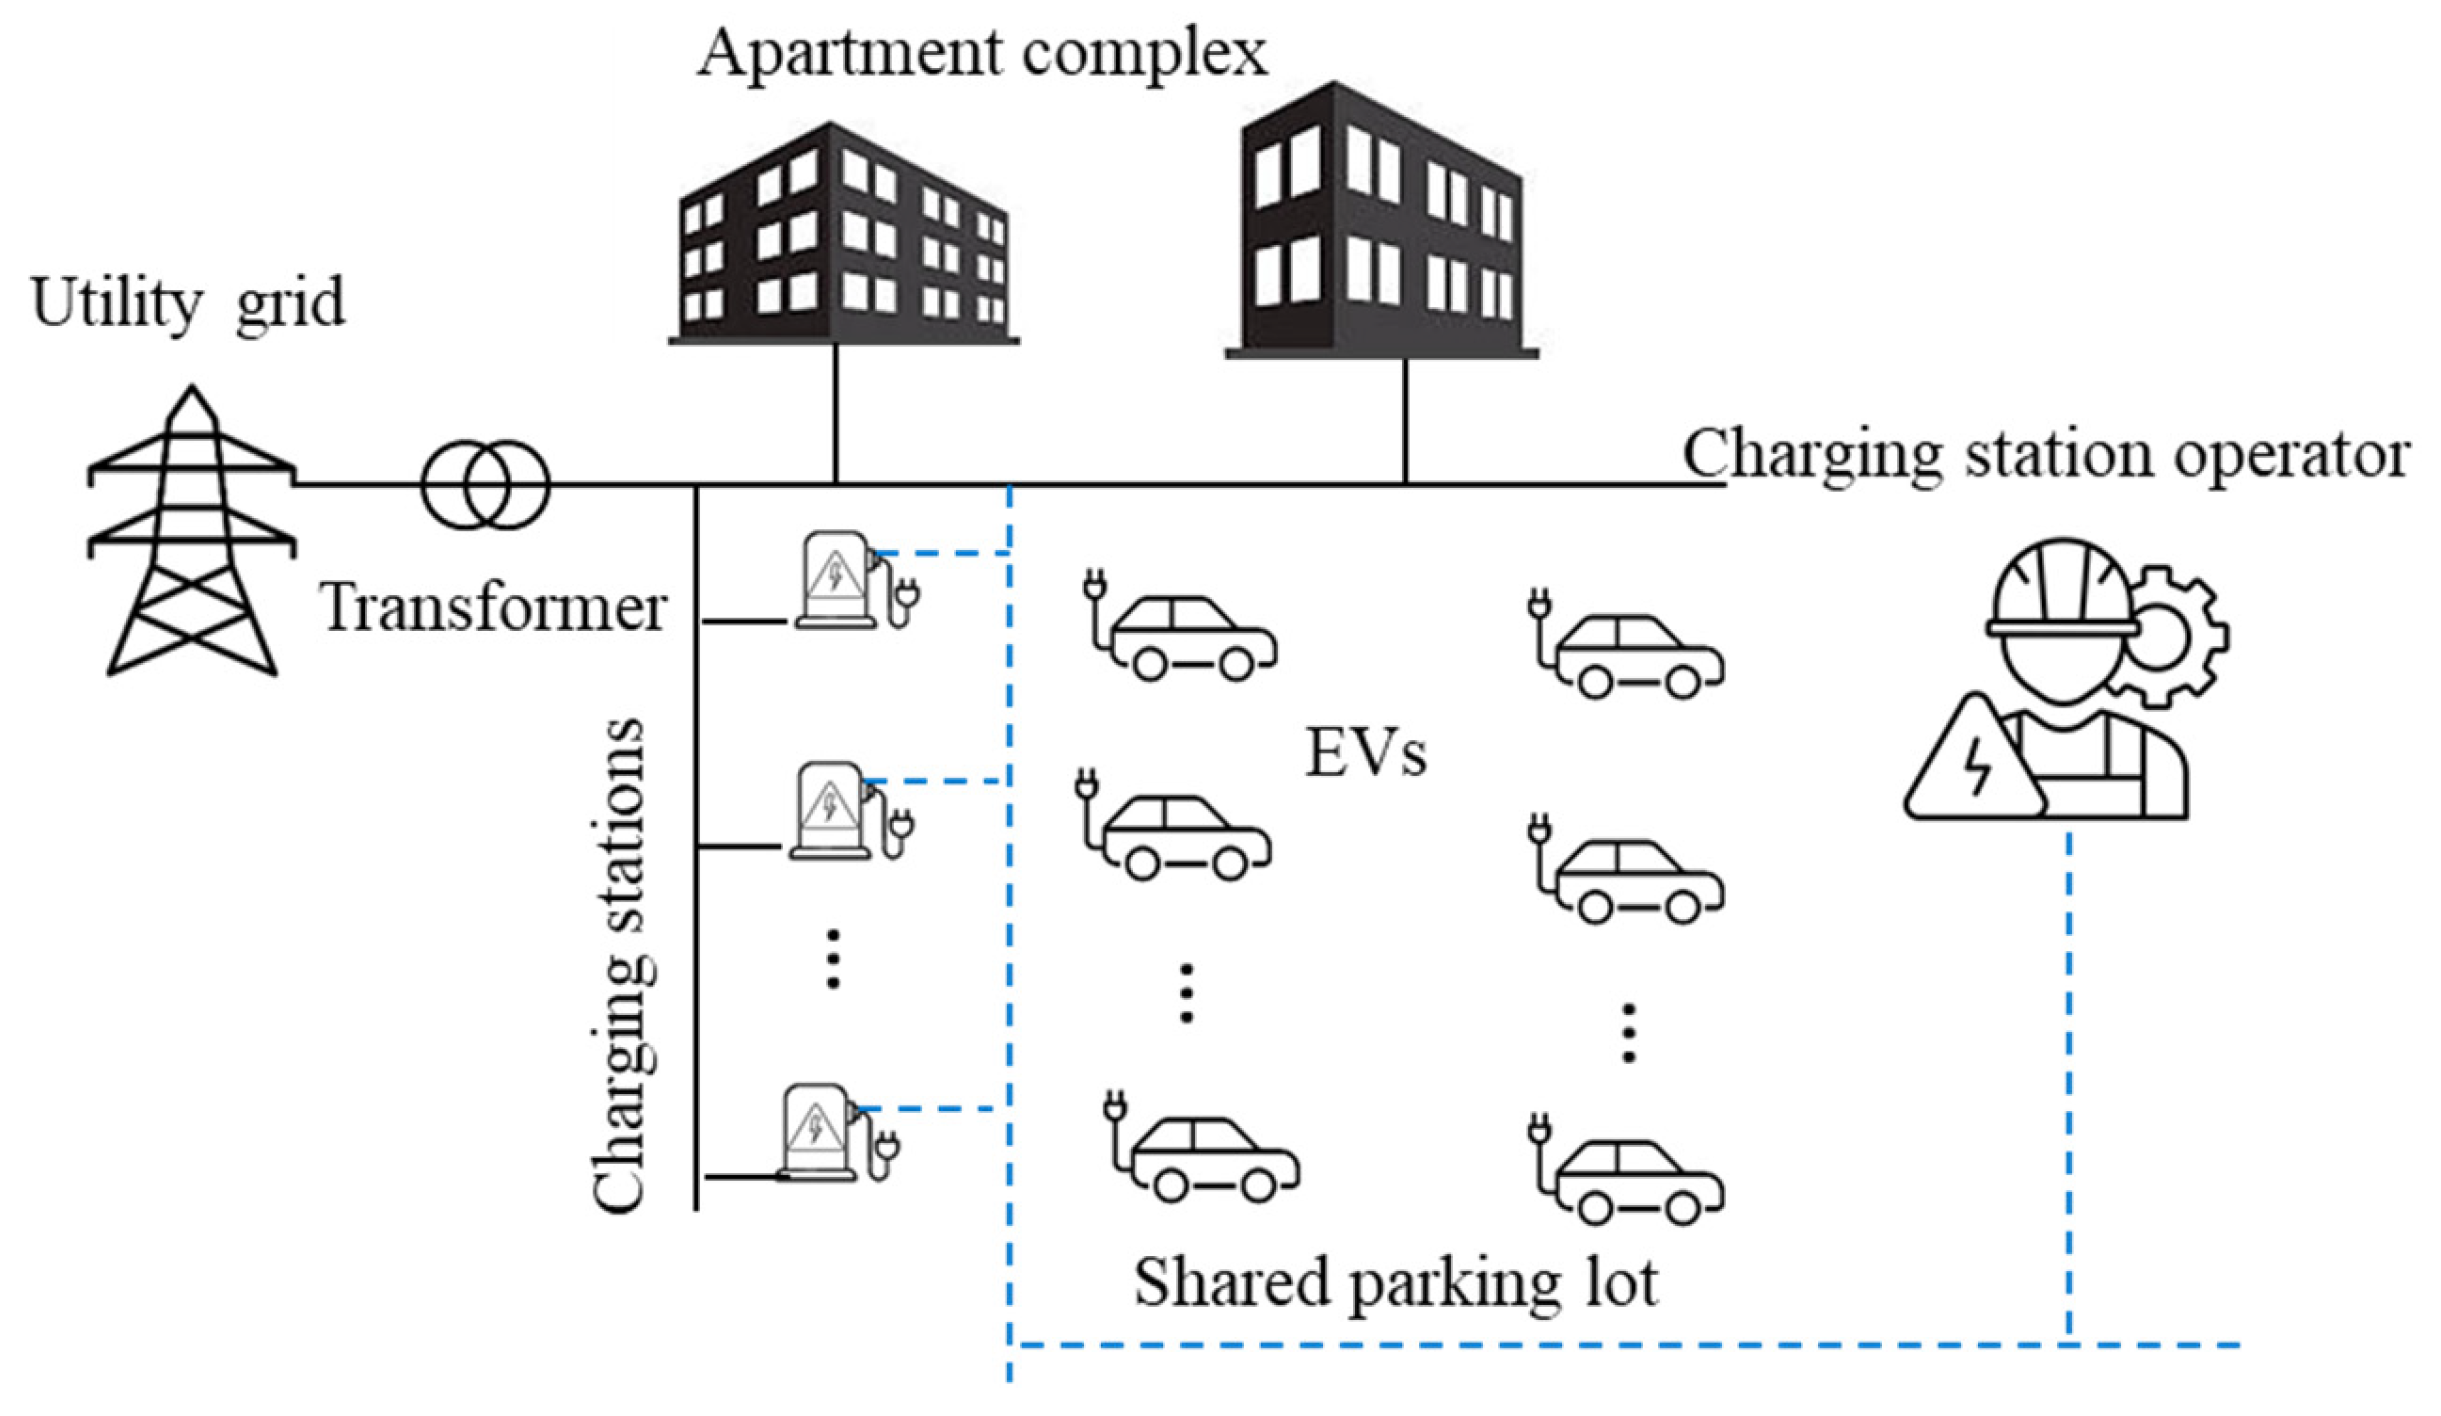
In Multi-Unit Residential Buildings (MURBs), parking spaces are shared among various residents. Installing charging stations for each resident may not be feasible due to economical and power system constraints. Therefore, determining the optimal number of chargers with a certain penetration level of EVs is essential to ensure an acceptable quality of service for EV owners. An overview of the proposed MURBs network with shared charging stations is shown in Figure 7, where buildings and the parking station share the same transformer. The decision to determine the optimal number of chargers is influenced by various factors, such as the presence/absence of a charging station operator to move charged EVs, the number of EVs, parking duration, and the required energy level by EV owners [35]. These factors are considered in the problem formulation section and subsequent sections. The detailed mathematical formulation is presented below for completeness, while Figure 8 provides an intuitive overview of the solution process.

3.1. Objective Function

The objective of the formulated problem is to minimize the number of chargers while maximizing the allocated energy to EVs. It is mathematically modeled as in (1), where N c h is the number of chargers. To maximize the allocated energy to EVs, the difference between required energy ( E n r e q ) and allocated energy ( E n a l l ) is minimized as shown below, where α is a penalty factor to penalize the deviations. The penalty factor α is introduced to prioritize the fulfillment of EV energy demand within the unified objective function. In this study, α is selected to be greater than the marginal cost associated with installing an additional charger, thereby ensuring that minimizing unfulfilled energy takes precedence over reducing the number of chargers. Sensitivity checks confirmed that, within a reasonable range above this threshold, the optimal charger sizing remains unchanged, indicating robustness of the formulation with respect to α.
min N c h + α n N E n r e q E n a l l 2
The required energy refers to the amount of energy required to increase the state-of-charge (SOC) of an EV from any given initial state to the required SOC level, i.e., 50%. The 50% target SOC is selected as a representative daily charging requirement based on the observed travel behavior and energy consumption characteristics of typical EV users. As shown in Section 2, the majority of vehicles exhibit daily mileage below 50 km, and the average EV energy efficiency (approximately 195 Wh/km) results in daily energy needs well below full battery capacity. Therefore, a 50% SOC target provides a practical benchmark for evaluating residential charging adequacy. The impact of higher SOC requirements is further examined in Section 5.2. Based on the initial ( S O C n i n i ) and the required SOC ( S O C n r e q ), the required energy can be computed using (2), where E n c a p is the energy capacity of the nth EV.
E n r e q = S O C n r e q S O C n i n i E n c a p

3.2. General Constraints

Several constraints are introduced to realize the proposed problem. For example, constraint (3) implies that the allocated energy to any EV should be lesser than or equal to the required energy by that EV.
E n a l l E n r e q
Similarly, the total energy allocated to any EV during the scheduling horizon ( E n a l l ) is the sum of energy allocated to that EV during different intervals ( E n , t a l l ). It can be modeled as
E n a l l = t T E n , t a l l
As depicted in Figure 7, the building and the charging station share the same transformer. Therefore, the energy used to charge EVs during different intervals should be lesser than or equal to the available capacity of the transformer. Available capacity refers to the reaming capacity after serving building loads. It can be modeled as
n N E n , t a l l T t c a p
where T t c a p is the remaining capacity of the transformer. Similarly, the amount of power extracted from any charger at any time t ( E n , t a l l ) cannot exceeded the power rating of the charger. It can be modeled as
E n , t a l l C r a t B n , t
where C r a t is the rating of the charger and B n , t is a binary variable. The binary variable takes a value of one when the charger is being used and zero otherwise. This binary variable is used to limit the number of chargers ( N c h a r ) during any interval t. It can be modeled as
n N B n , t N c h a r
Finally, EVs can only be charged during their parking periods. To realize this, the following constraint is introduced.
E n , t a l l = 0   i f   t > t d   o r   t t a E n , t a l l   otherwise
where t a is the arrival time of the EV and t d is the departure time of the EV.
Generalized constraints used for both types of charging station operations, i.e., continuous and flexible. However, additional constraints are required to ensure the continuous operation of the charging station. Continuous operation refers to charging any EV by the same charger until it is fully charged (uninterrupted charging). Flexible operation refers to charging an EV to the required energy level in multiple sessions. However, the allocated energy before departure time is the same for all EVs under both operation schemes.

3.3. Continuous Charging Constraints

The following additional constraint is introduced to ensure continuous charging of the EVs once they are plugged in. In (9), ε is a small positive number. This ensures that once the vehicle starts charging, it will keep on charging until it is fully charged, at that time the binary variable B n , t will take a value of zero.
E n , t a l l E n , t 1 a l l ε B n , t
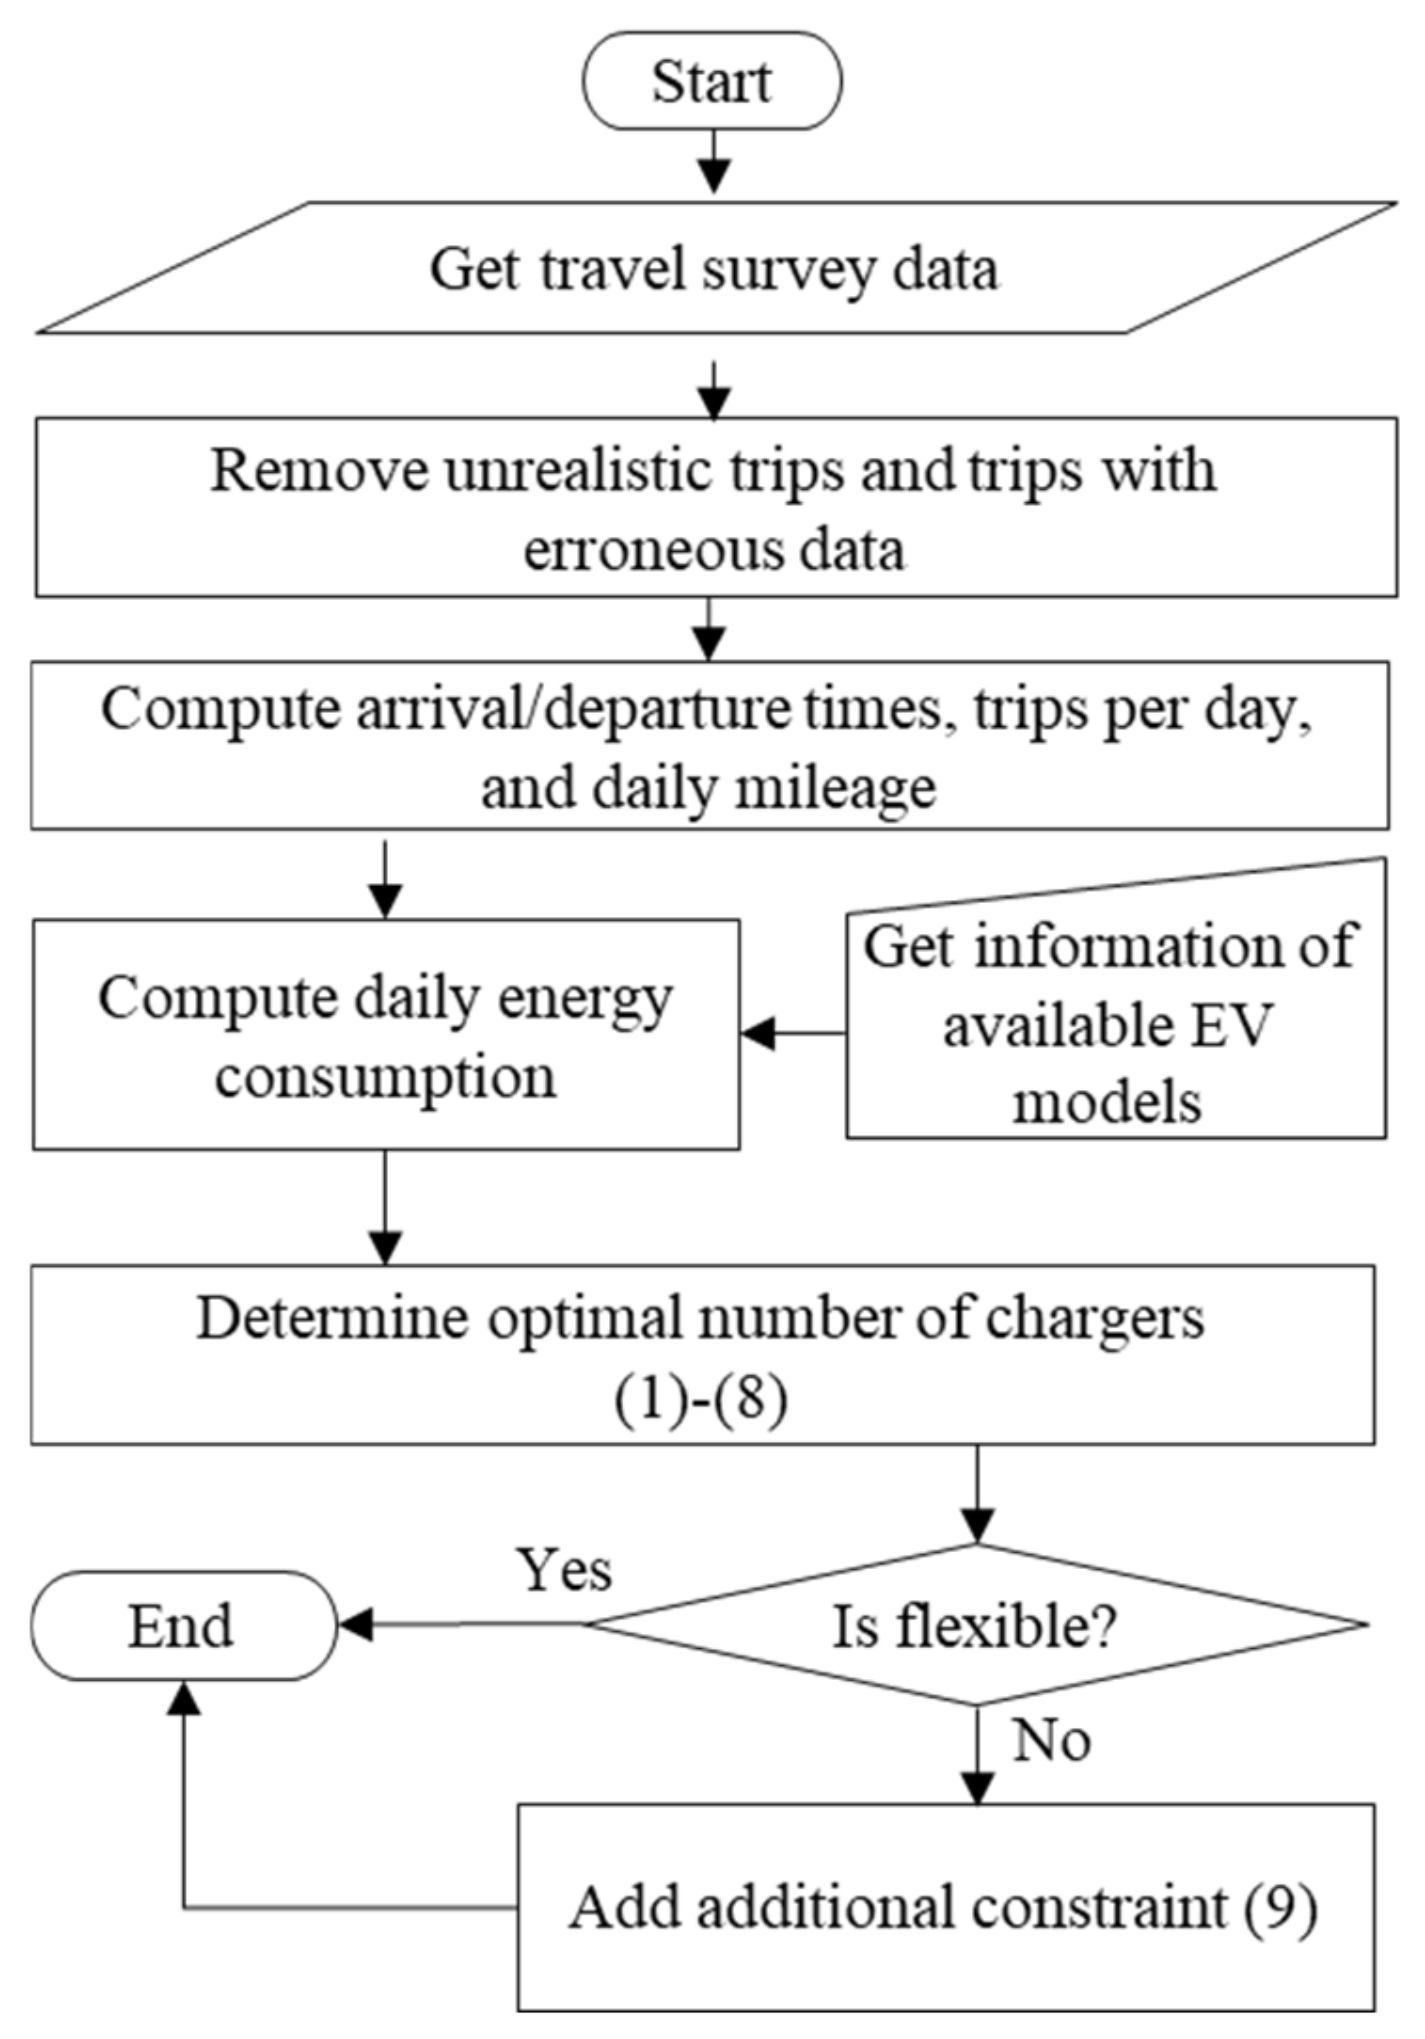
An overview of the step-by-step process for determining the optimal number of chargers under different schemes is shown in Figure 8. It summarizes the overall solution workflow. For clarity, the main steps include: (i) extraction of travel behavior and EV parameters, (ii) formulation of the unified optimization model under the selected charging scheme, and (iii) computation of the optimal number of chargers subject to system constraints. Initially, NHTS data is pre-processed to eliminate any erroneous and unrealistic trips. Various parameters related to the traveling behavior of drivers, such as arrival/departure times, daily mileage, and the number of trips per day, are then extracted. These parameters, combined with the EVs’ parameters (battery size and mileage efficiency), are used to calculate the daily energy requirements, as discussed in detail in Section 2. Based on the charging operation scheme (flexible or continuous), appropriate constraints are selected, and the optimization algorithm is executed. The algorithm then determines the optimal number of chargers under each scheme. For tractability, the charging process is modeled using constant charging power during each session. The implications of this assumption are discussed in Section 6.
The proposed optimization problem is formulated as a mixed-integer linear programming (MILP) model and solved using the IBM ILOG CPLEX optimizer (version 12.10) through a Python interface. CPLEX employs a branch-and-bound framework with advanced presolve and cutting-plane strategies, which guarantees global optimality for the formulated MILP problem.

4. Performance Evaluation

4.1. Input Data

In this section, the performance of continuous and flexible operation schemes is analyzed for an EV fleet size of 25. For visualization purposes, an EV fleet size of 25 is considered in this section. However, the impact of different fleet sizes is discussed in the subsequent section. An overview of different EV parameters used in this section is summarized in Table 1. The arrival and departure times of EVs are estimated based on the results obtained from the NHTS dataset, revealing that most EVs leave home early morning and return late afternoon or evening, aligning with the typical commute behavior of daily workers. The parking duration is then calculated based on the EV arrival and departure times. The SOC is also calculated based on the daily traveling mileage of vehicles, estimated using the NHTS dataset. The SOC represents the amount of energy available in the EV at the home arrival time (last home arrival), with most EVs having SOC values between 10% and 45%. Equation (2) is then used to estimate the energy demand of each EV.
In all studied scenarios, the CPLEX solver converged to the global optimum in less than 5 s on a standard desktop computing environment, demonstrating the computational efficiency and scalability of the proposed framework for planning-level analysis.

4.2. Continuous vs. Flexible Charging

4.2.1. Energy Fulfilment

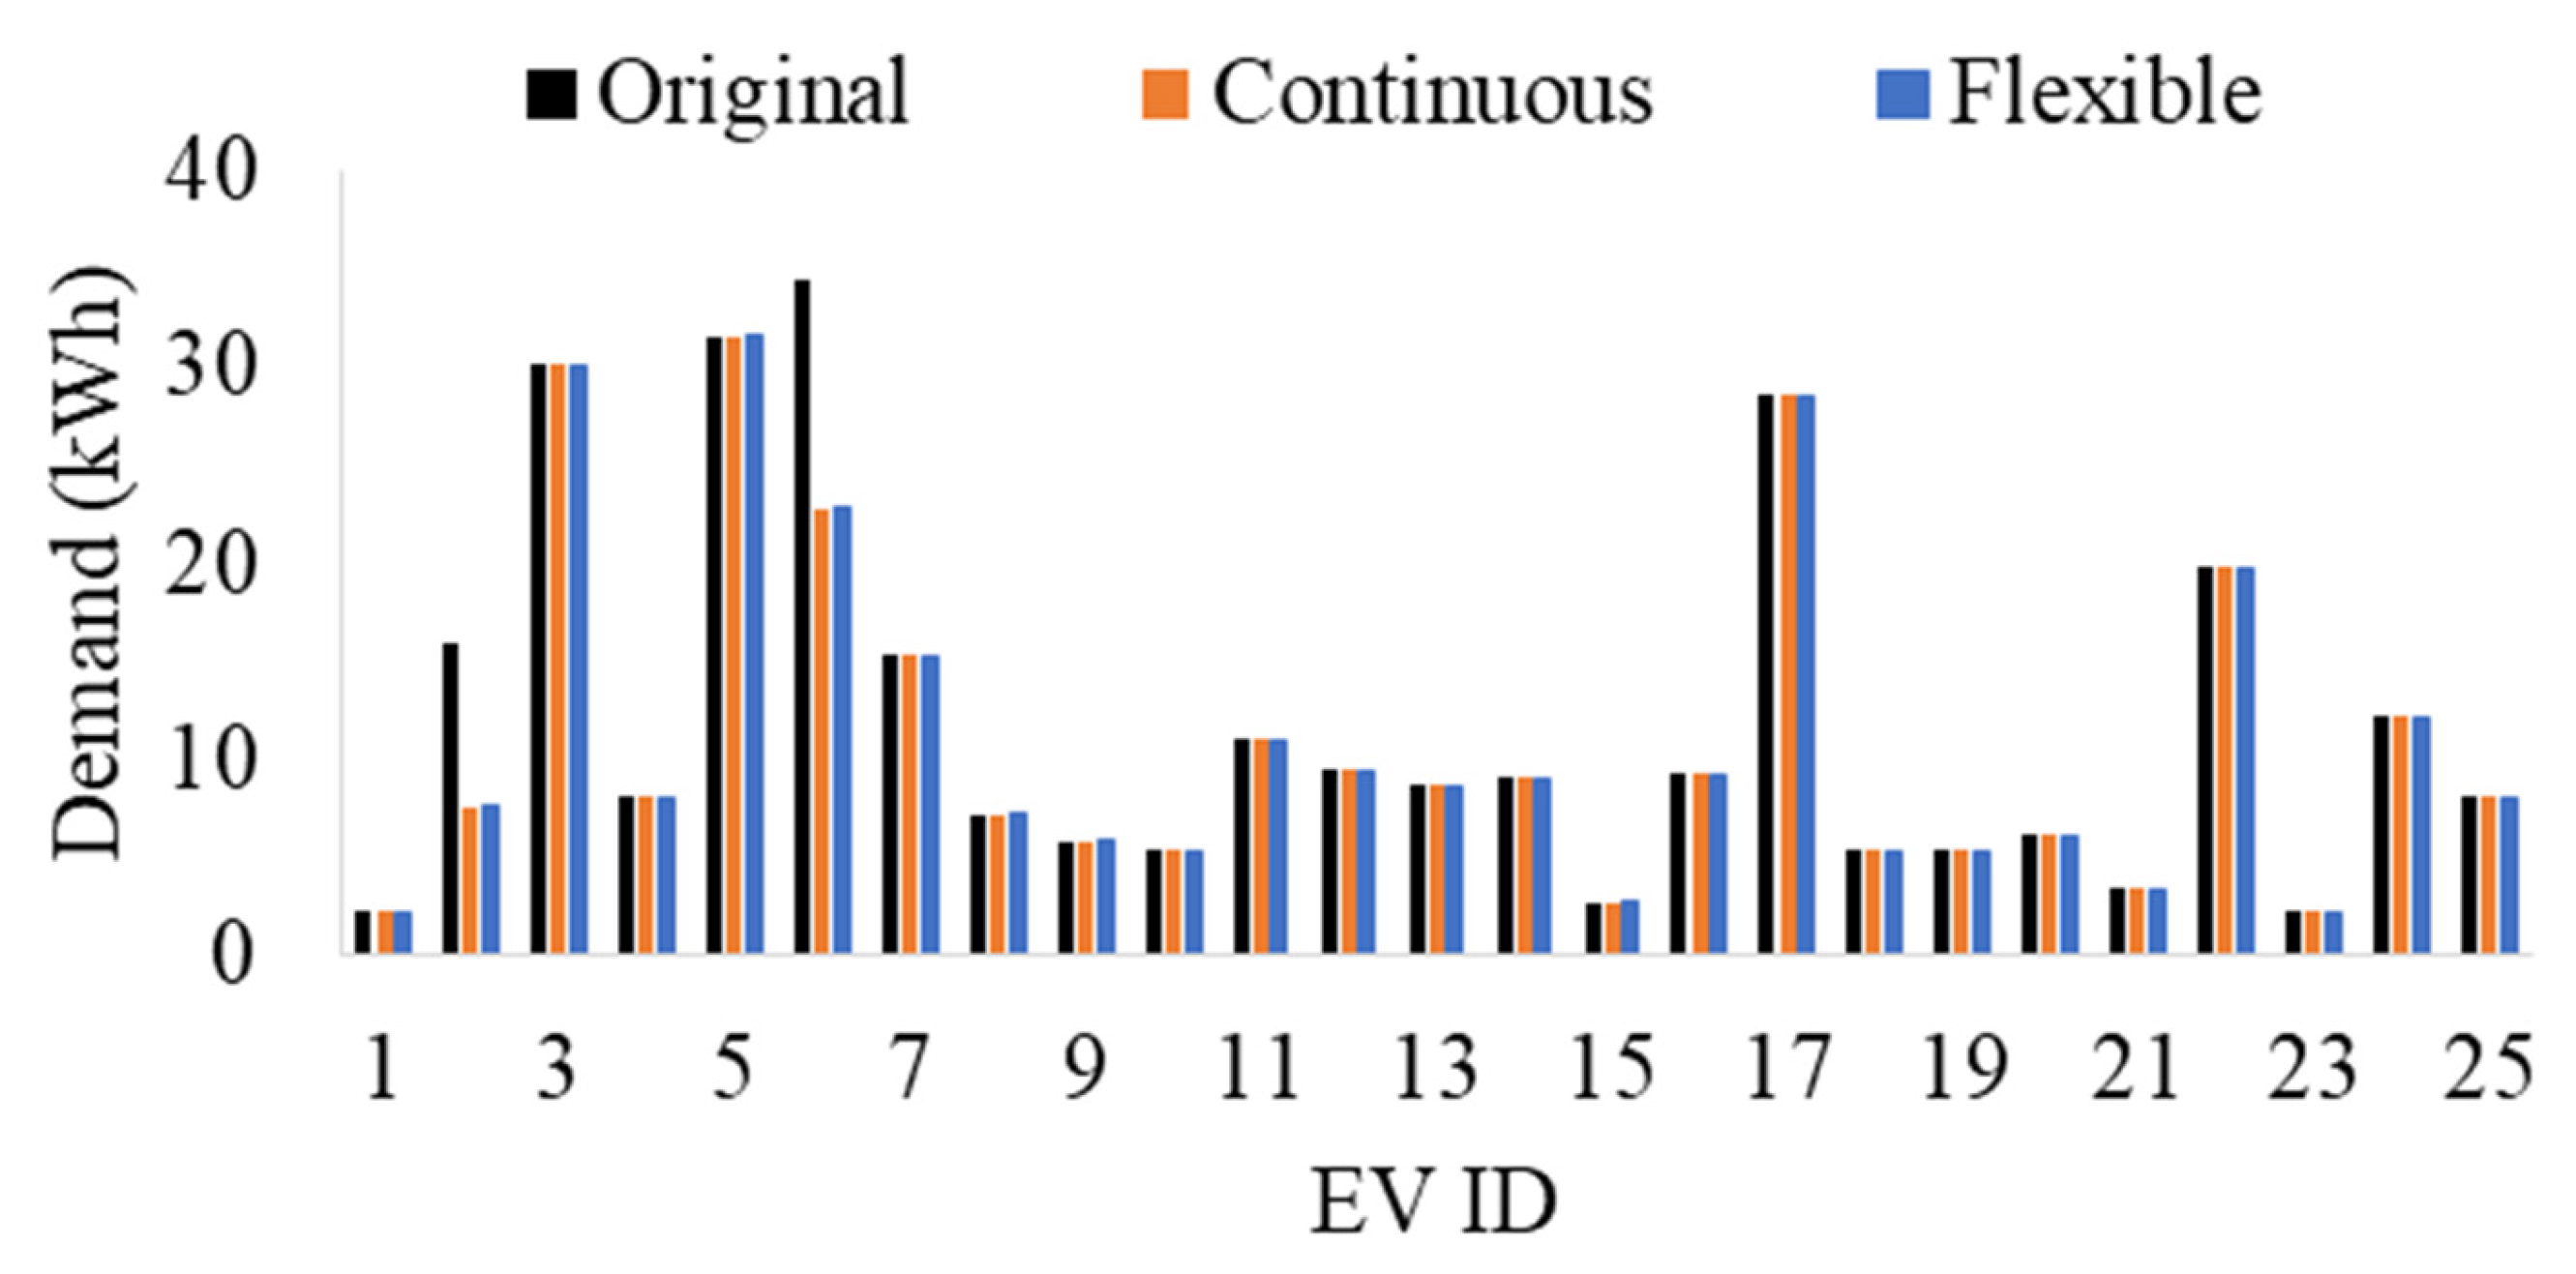
The optimal number of chargers for continuous charging is 8, while for flexible charging, it is 3. Based on these optimal numbers, the amount of energy fulfilled for each EV is summarized in Figure 9. The interval-wise charging profiles for each EV are shown in Table 2 (continuous) and Table 3 (flexible). It can be observed from Figure 9 that the amount of energy fulfilled for each EV is identical in both continuous and flexible scenarios. However, it is worth noting that flexible charging achieves the same results using only 3 chargers, whereas the continuous scenario requires 8 chargers for the same outcomes. It should be noted that the quantitative reduction in charger count depends on the underlying arrival/departure distributions and operating assumptions. In scenarios with more synchronized evening arrivals, the flexibility benefit may decrease, potentially increasing the required number of chargers.
In addition, the amount of unfulfilled energy is quantified using an index named as unfulfillment index ( I n u f ). It is computed using (10). It is a continuous index and ranges between zero and 100. Lower values are preferred as these values correspond to higher fulfilled demand.
I n u f = E n r e q E n a l l E n r e q 100
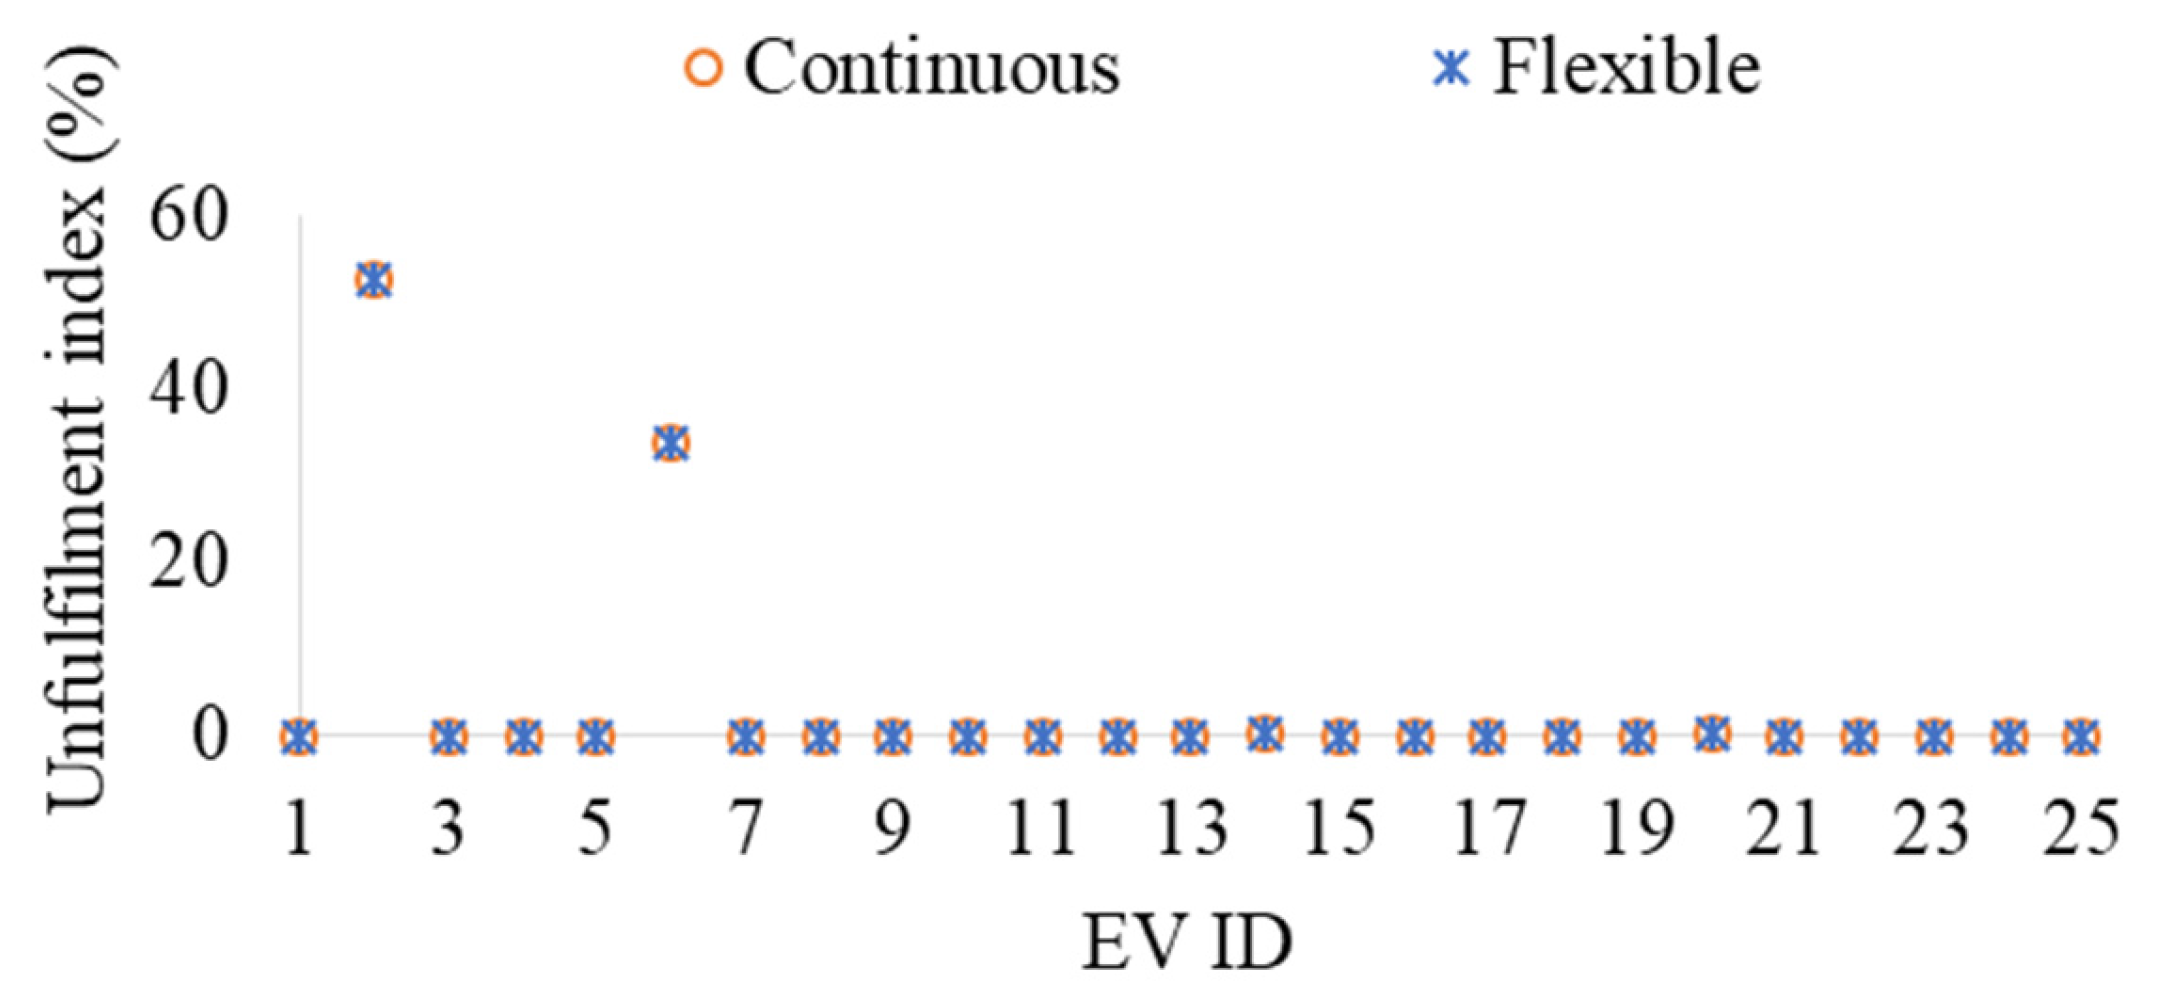
The results of this index for both scenarios are shown in Figure 10. It can be observed that both case result in identical index values. The index is zero for all EVs except EV2 and EV6. This is due to lower parking duration of EVs 2 and 6, as shown in Table 1. The unfulfilled energy observed for a small subset of EVs is primarily driven by limited parking duration rather than charger scarcity or power rating constraints. This highlights the dominant influence of user availability windows on service satisfaction in shared residential charging environments.

4.2.2. Resource Utilization

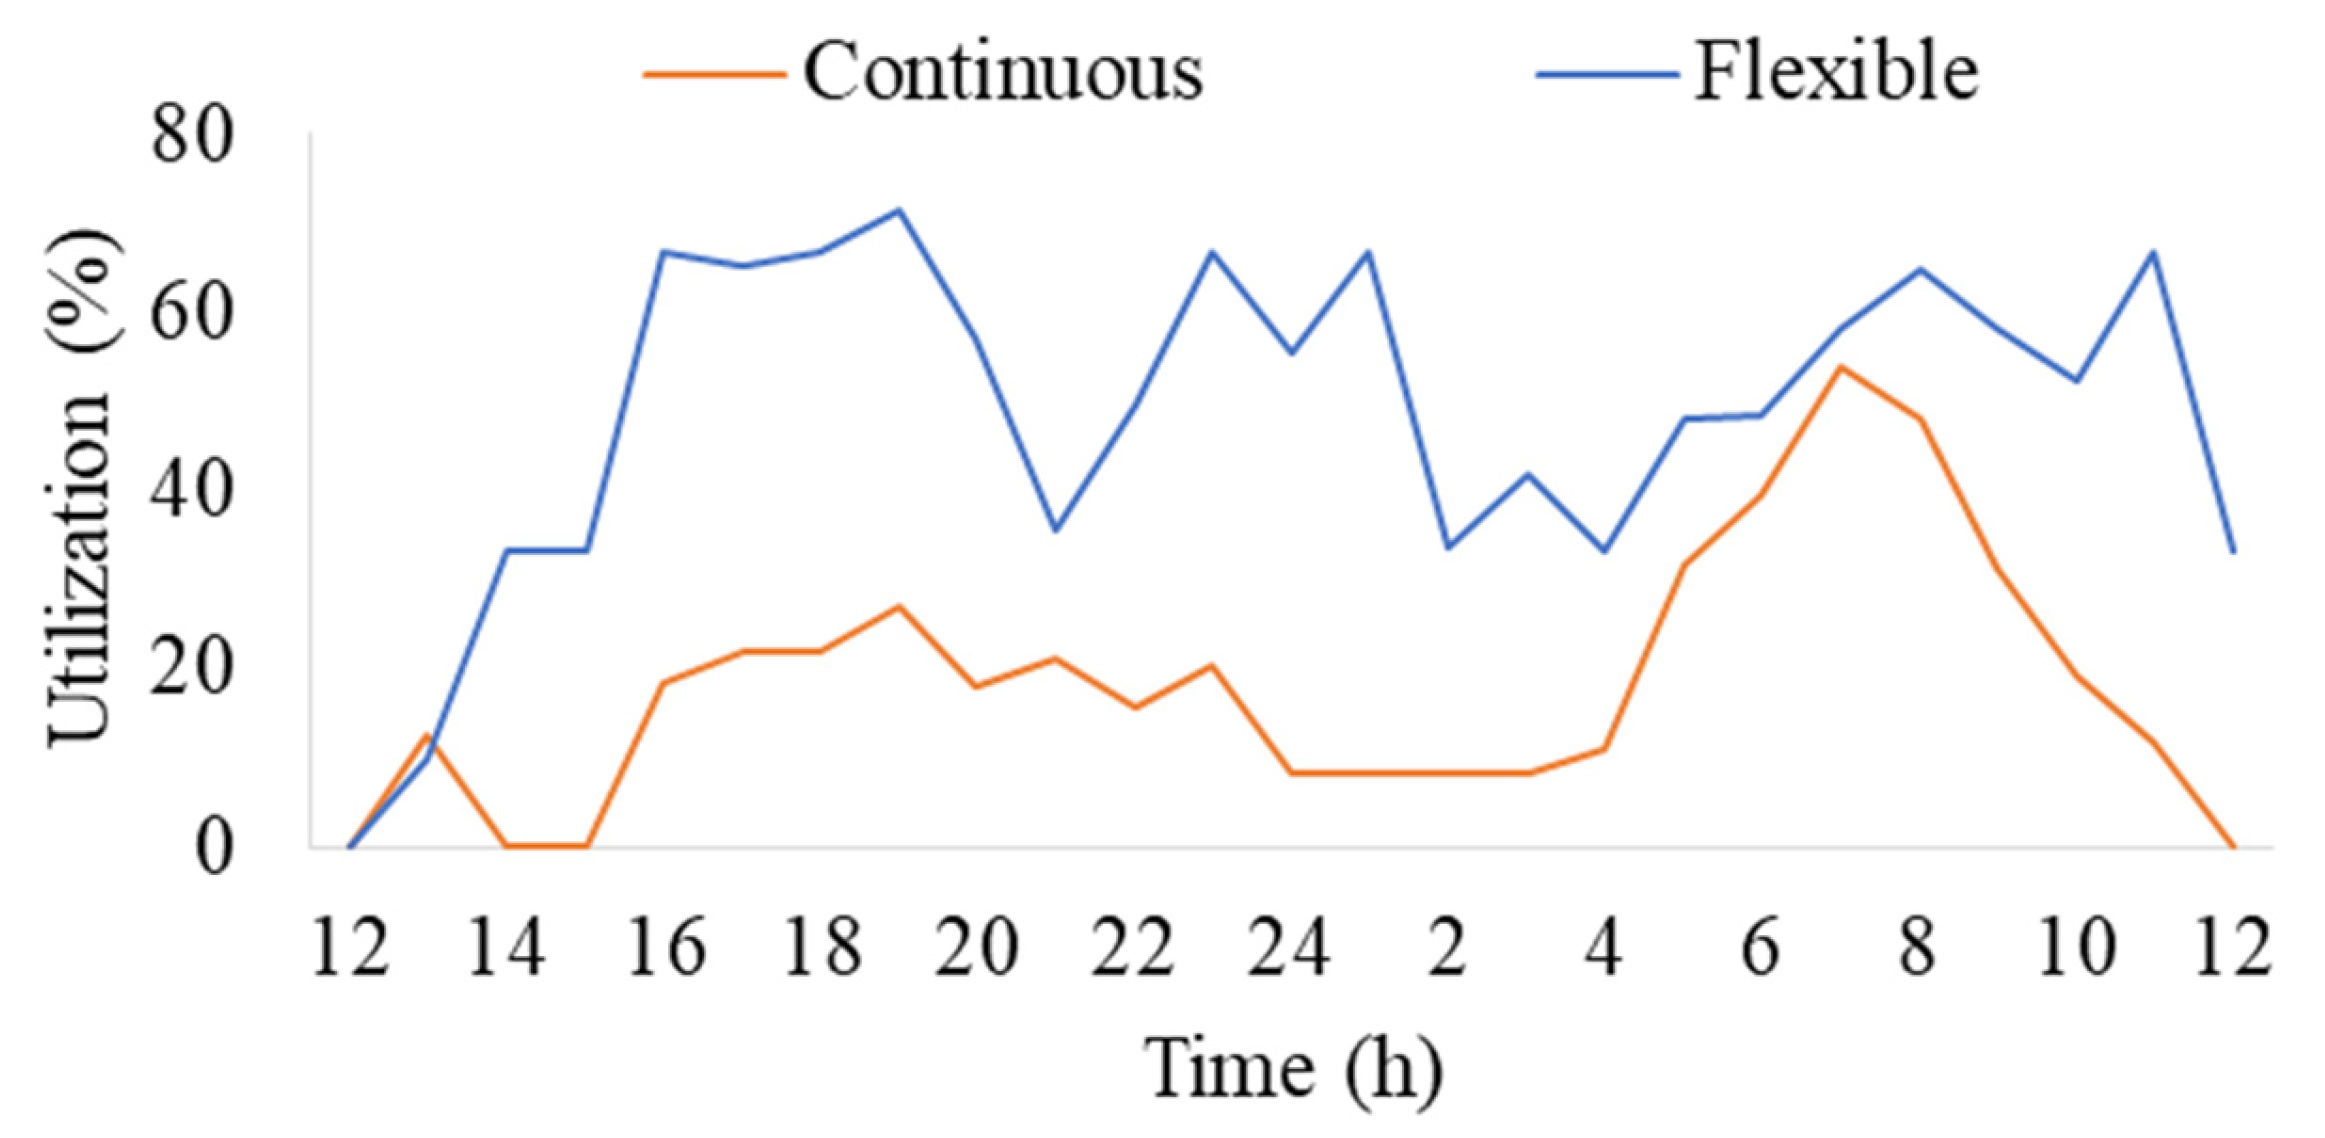
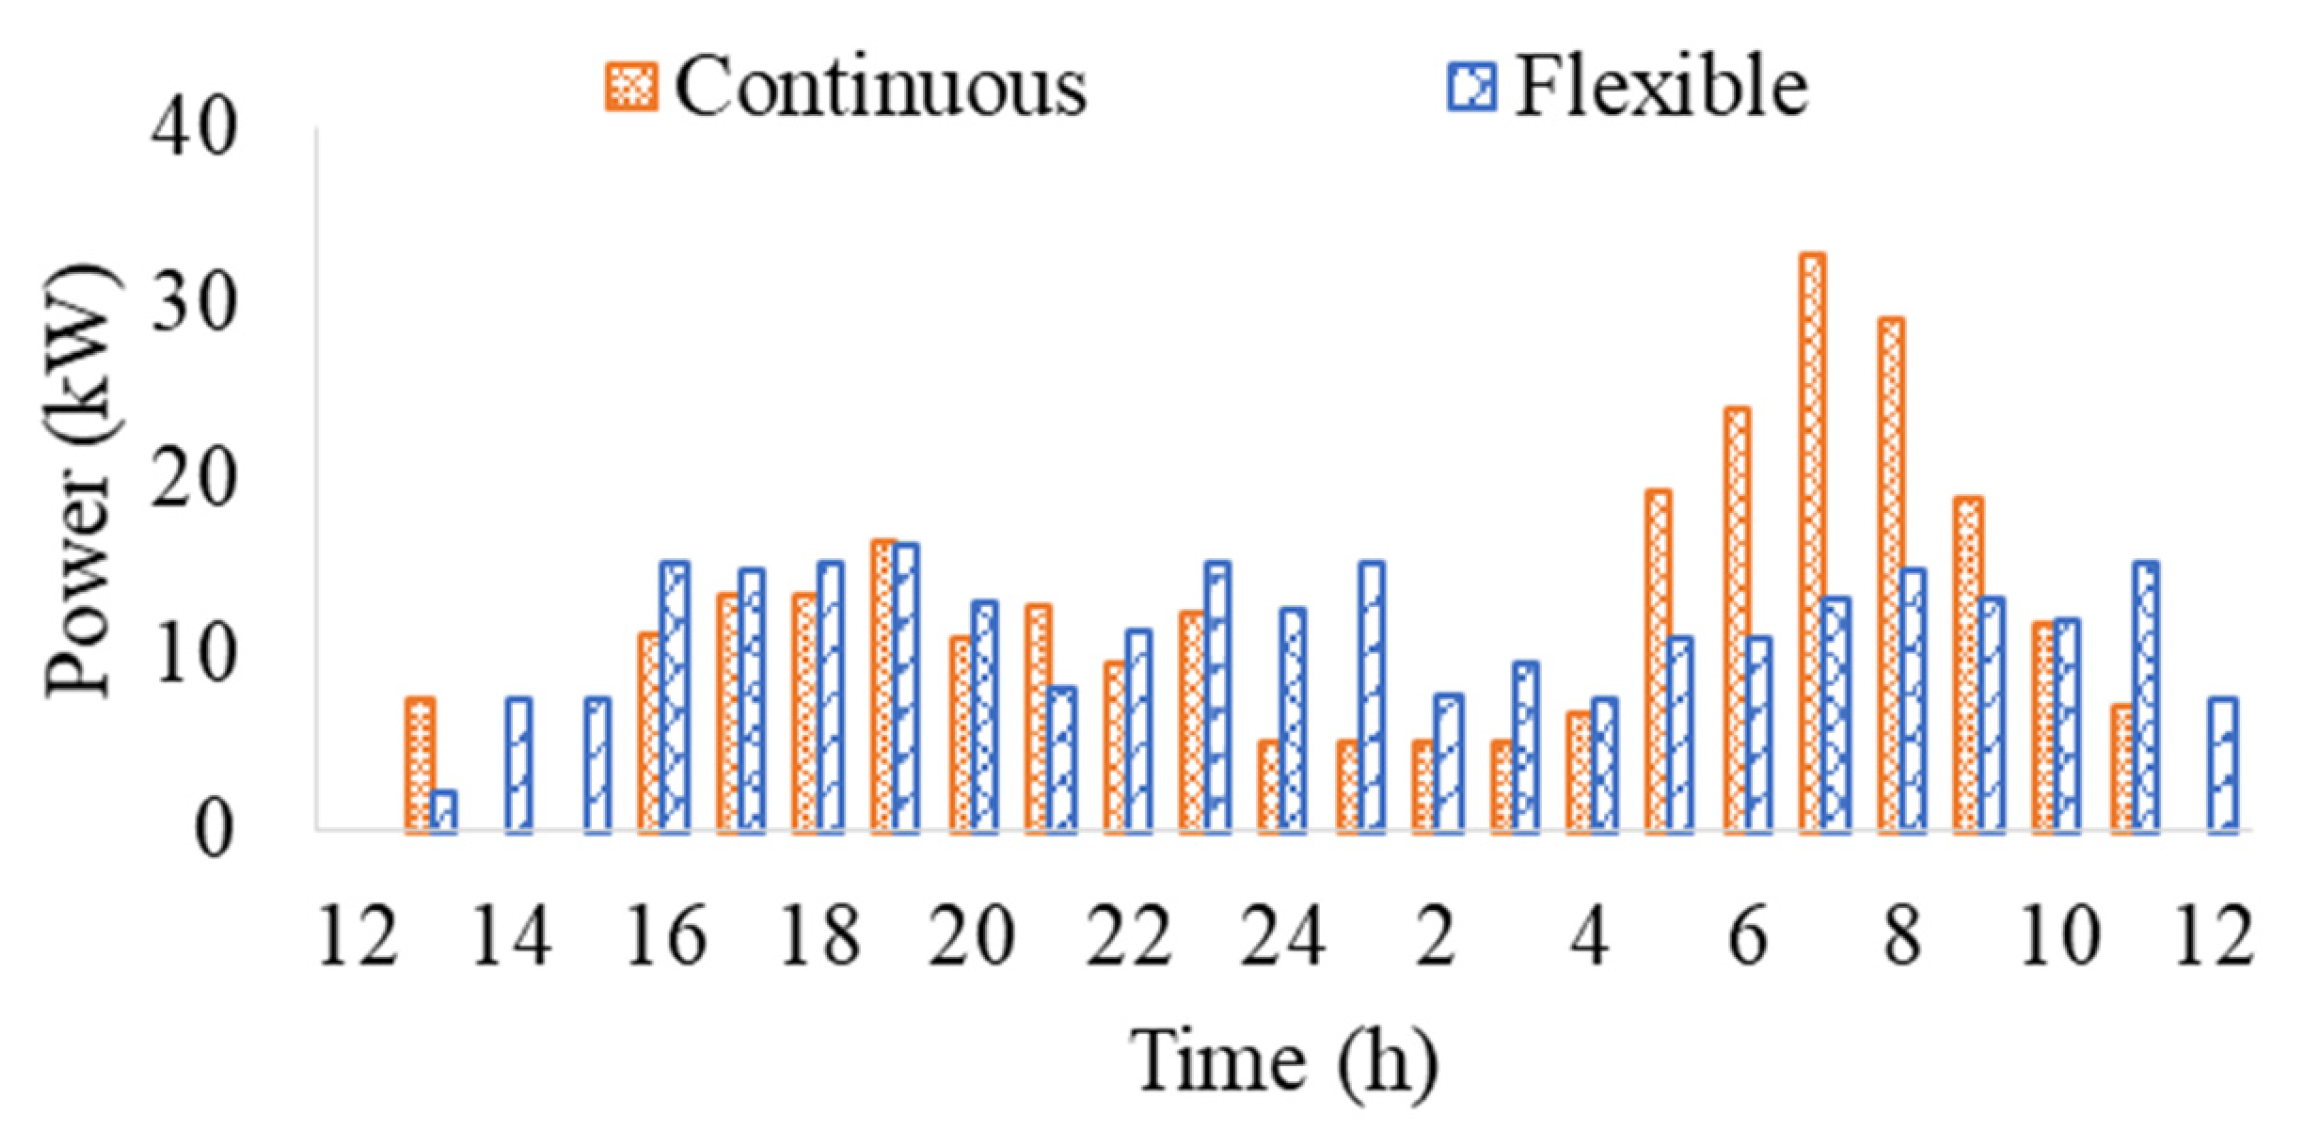
In this section, the utilization of different resources under different schemes is analyzed. Figure 11 shows the hourly charger utilization for both continuous and flexible schemes. It is observed that in continuous charging, chargers are under-utilized during the evening and over-utilized during the early morning hours. However, with flexible charging, a uniform utilization is observed during most intervals. Figure 12 further illustrates that more power is extracted during the early morning hours in continuous charging, which could pose technical issues by potentially overloading the local transformer. This analysis suggests that flexible charging is beneficial for reducing the EV charging load. Additionally, it significantly reduces the number of chargers required to achieve an acceptable service when compared to continuous charging.
Additionally, it significantly reduces the number of chargers required to achieve an acceptable service when compared to continuous charging.

5. Discussion and Analysis

To assess the generalizability of the proposed framework, the analysis is conducted across multiple EV fleet sizes and different target SOC levels under both continuous and flexible charging strategies. These variations allow the model to be evaluated under diverse demand conditions and operating requirements, providing broader insight into its applicability beyond a single scenario.

5.1. Impact of Number of EVs

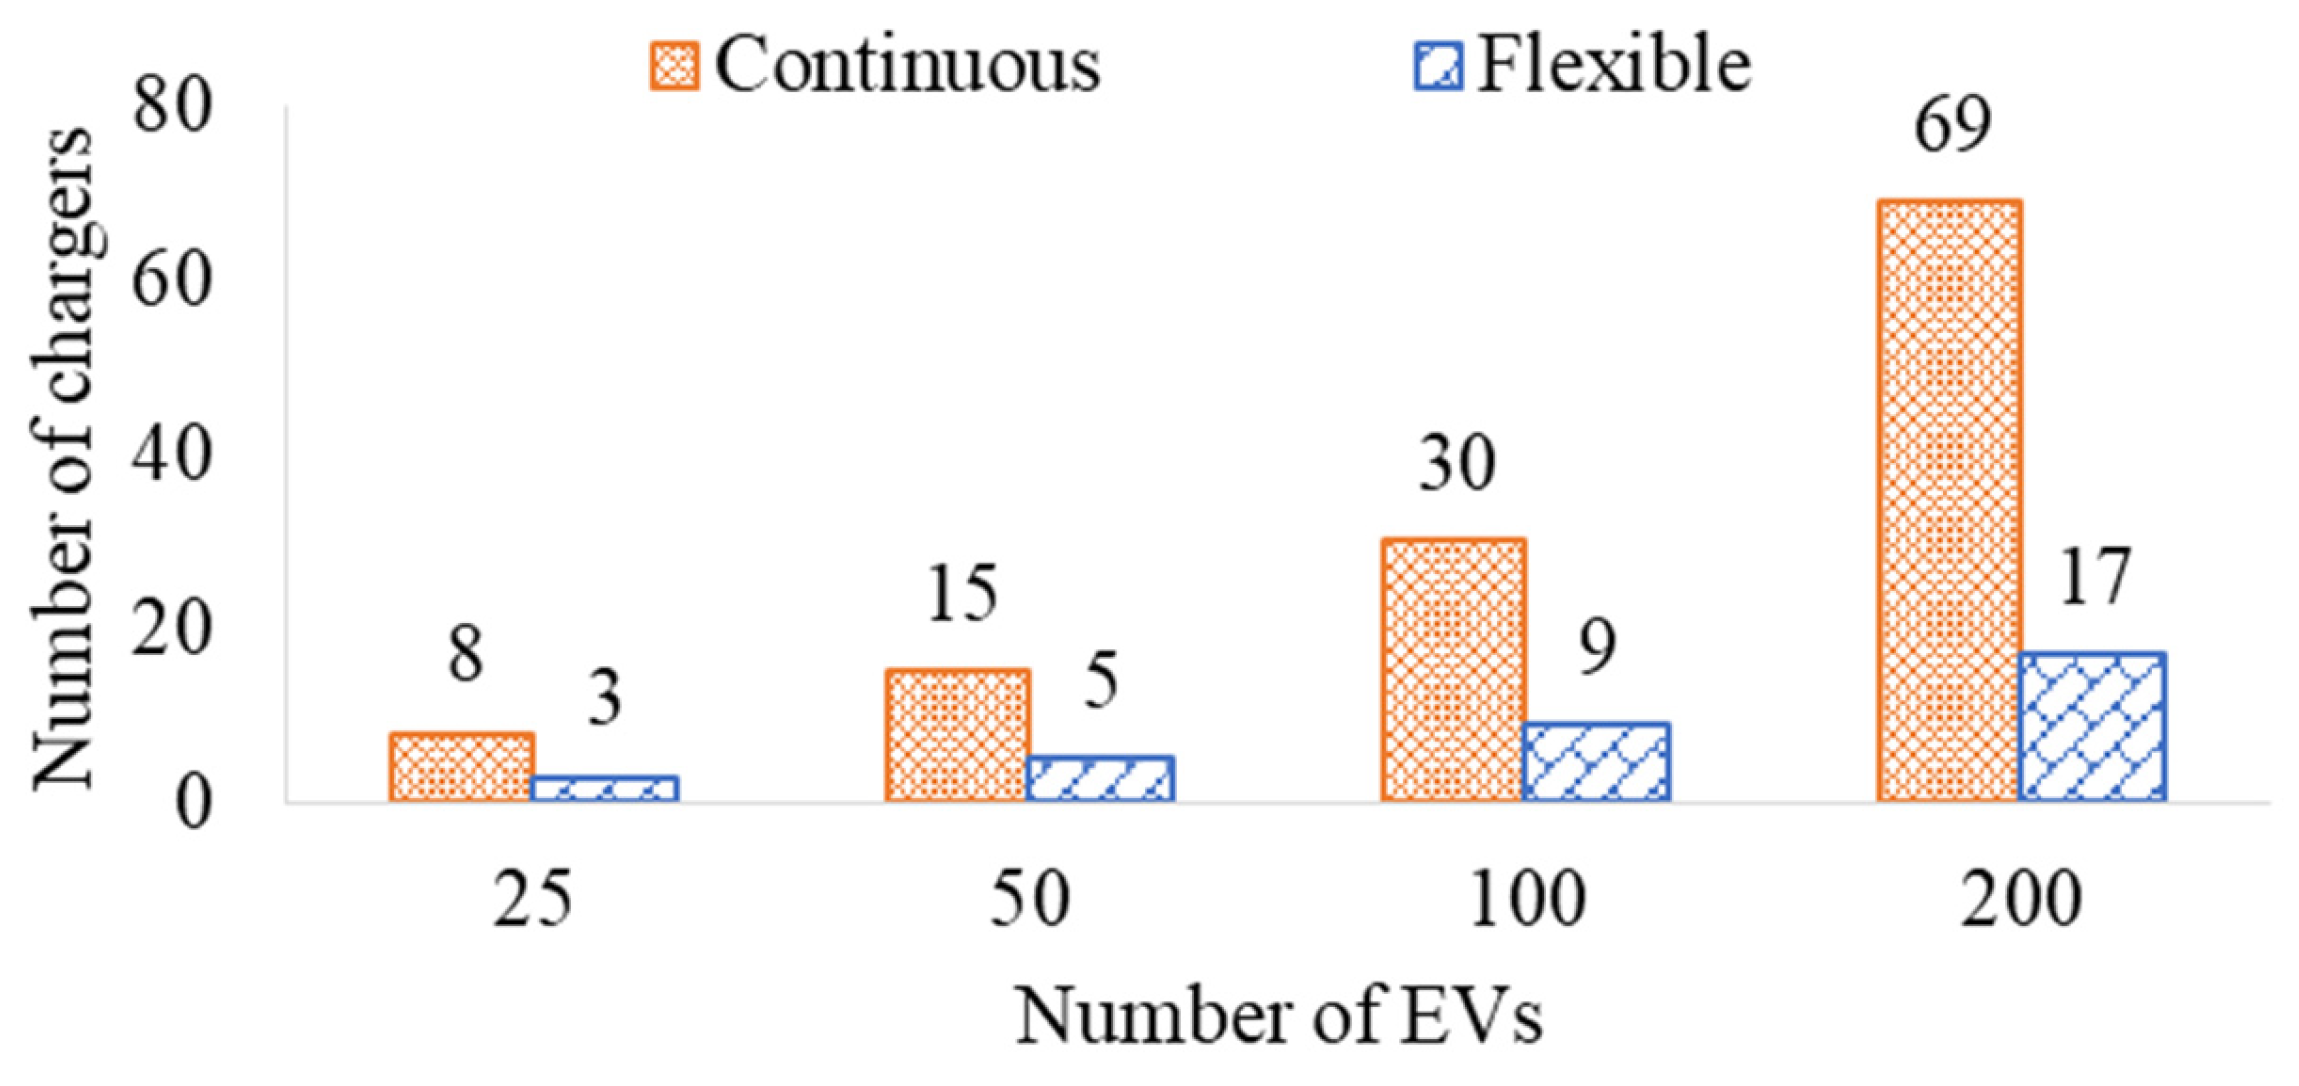
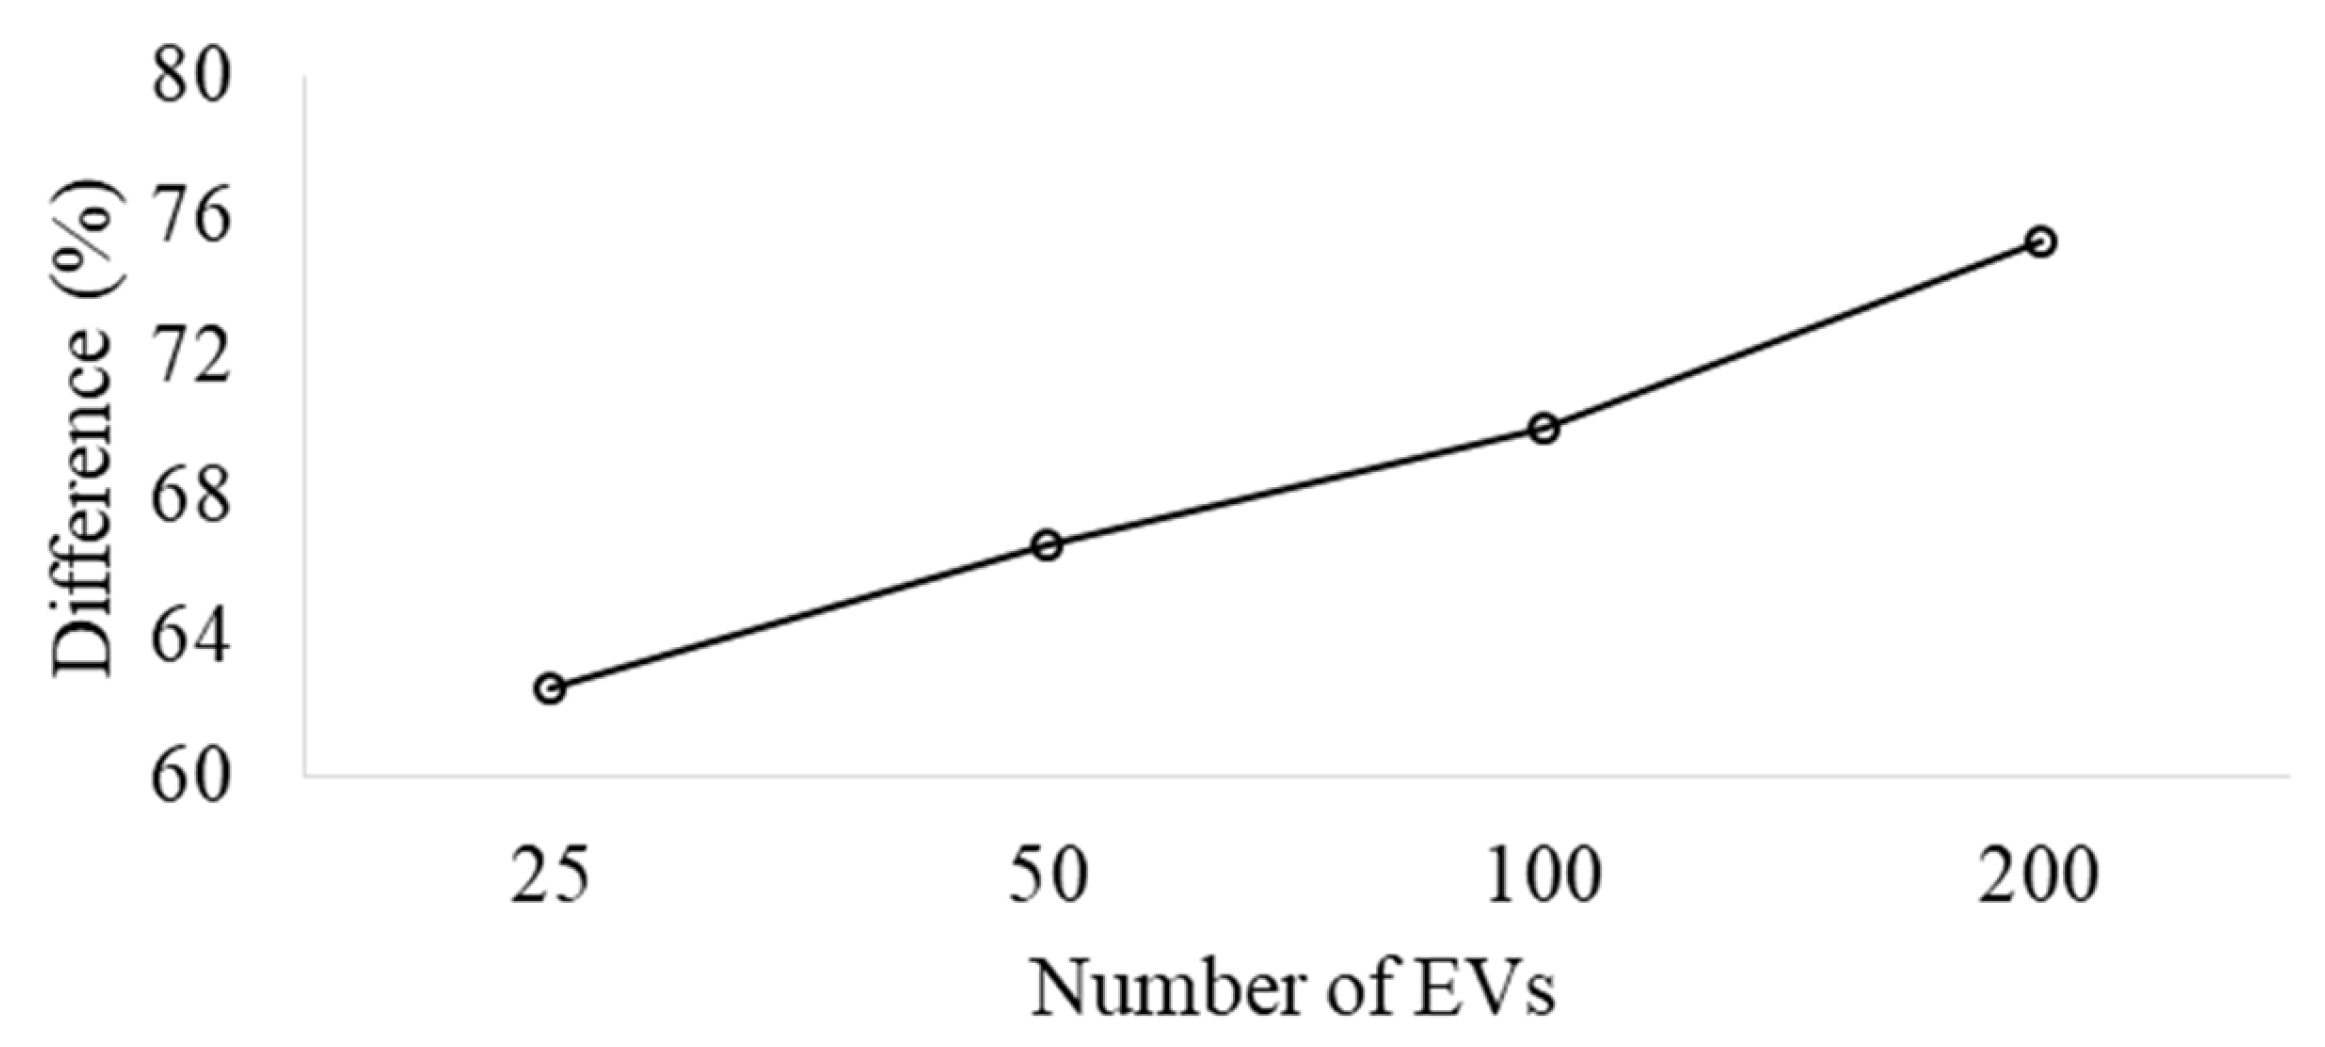
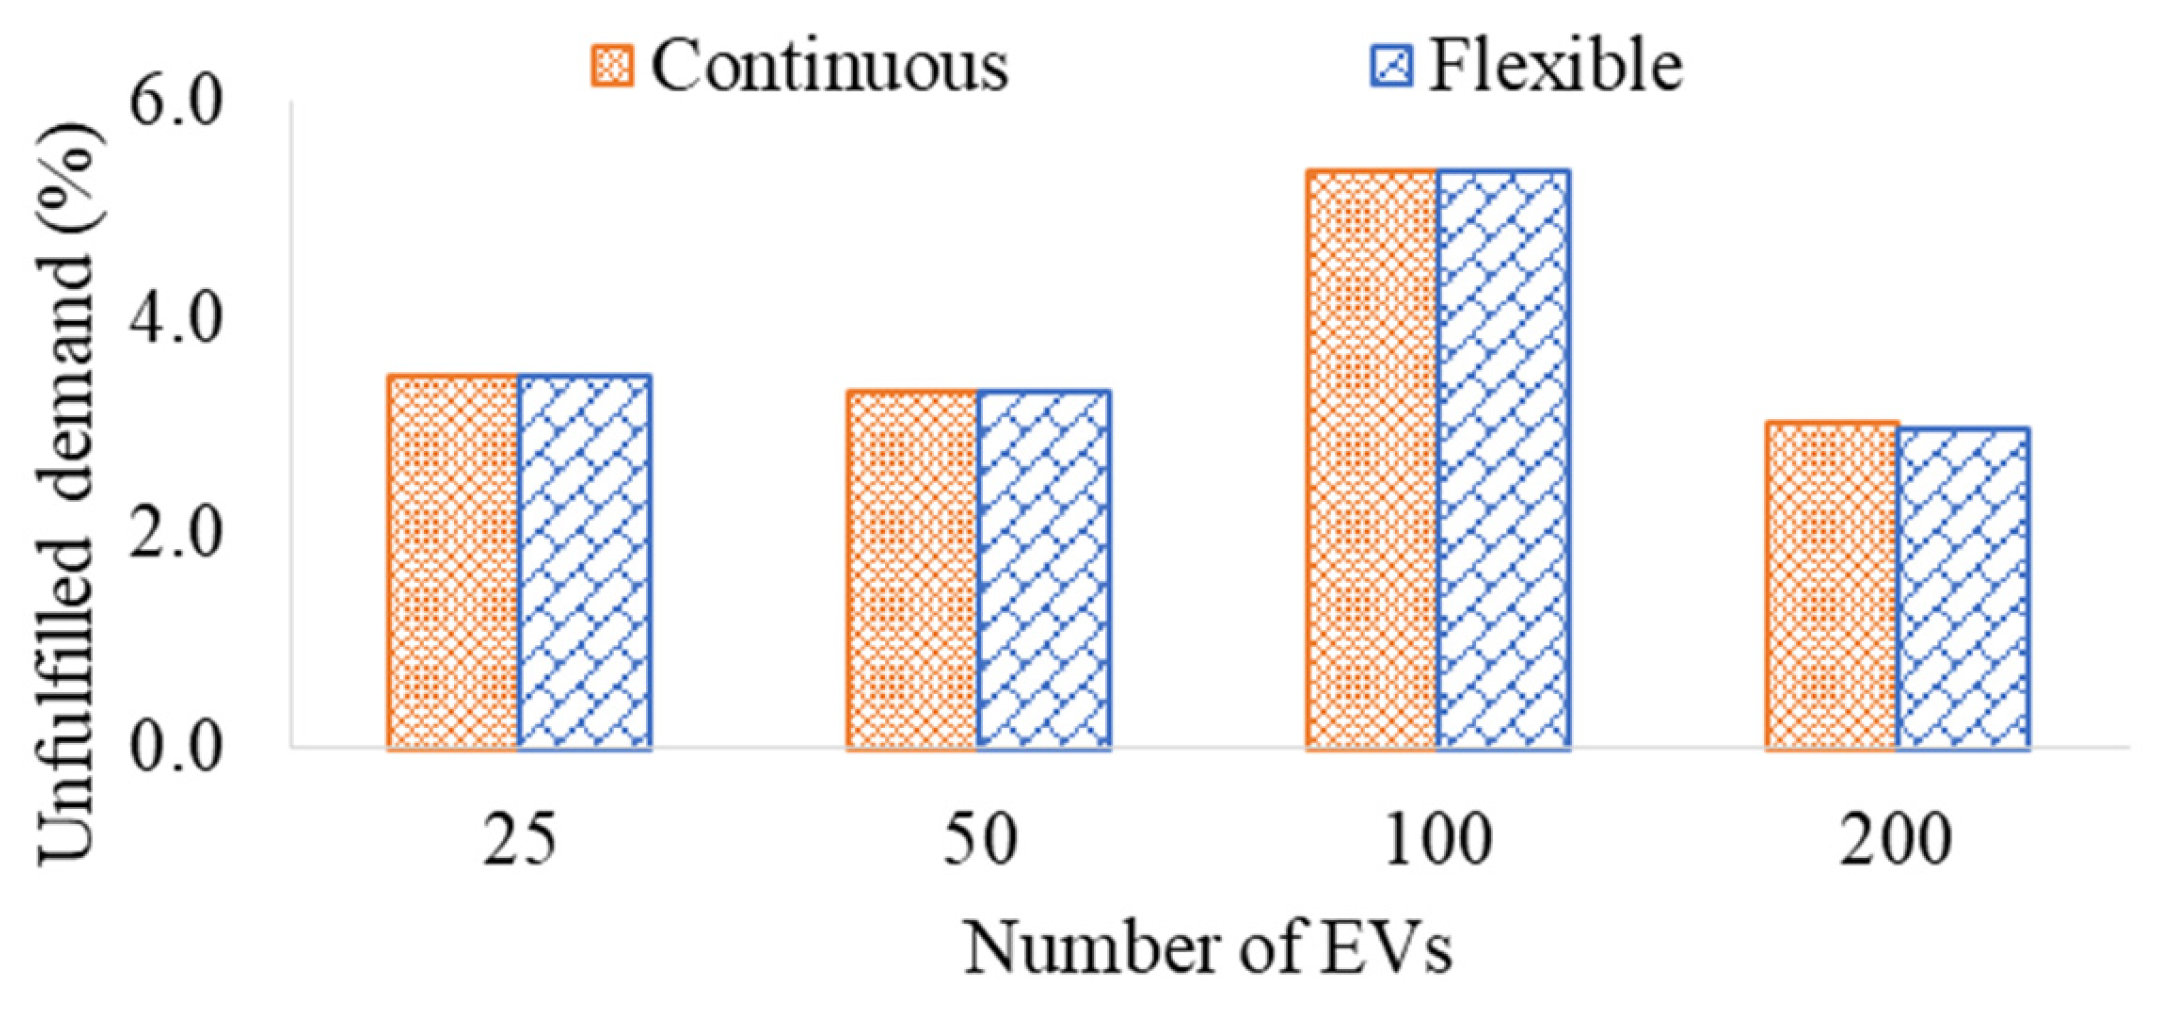
In this section, the number of EVs is varied between 25 and 200, and four cases are simulated with the required SOC for all EVs set to 50%. The number of chargers required under continuous and flexible charging schemes is shown in Figure 13, revealing that the flexible charging scheme requires significantly fewer chargers to achieve the same service level. The difference in the number of chargers for each scheme is depicted in Figure 14, showcasing a progressive increase with an upsurge in the EV fleet size. For instance, the difference in the number of chargers was about 62% for 25 EVs, increasing to about 76% for 200 EVs. It is worth mentioning that the unfulfilled demand is identical for both charging schemes (continuous and flexible) for different EV penetration levels, as shown in Figure 15. The unfulfilled demand ratio is approximately 4% for all cases except case 3 (100 EVs). The difference is due to the random selection of different EV parameters, with more EVs having shorter parking duration appearing in this case. The unfulfilled demand in other cases is also attributed to the shorter parking duration of a certain number of EVs.

5.2. Impact of Target Energy Level

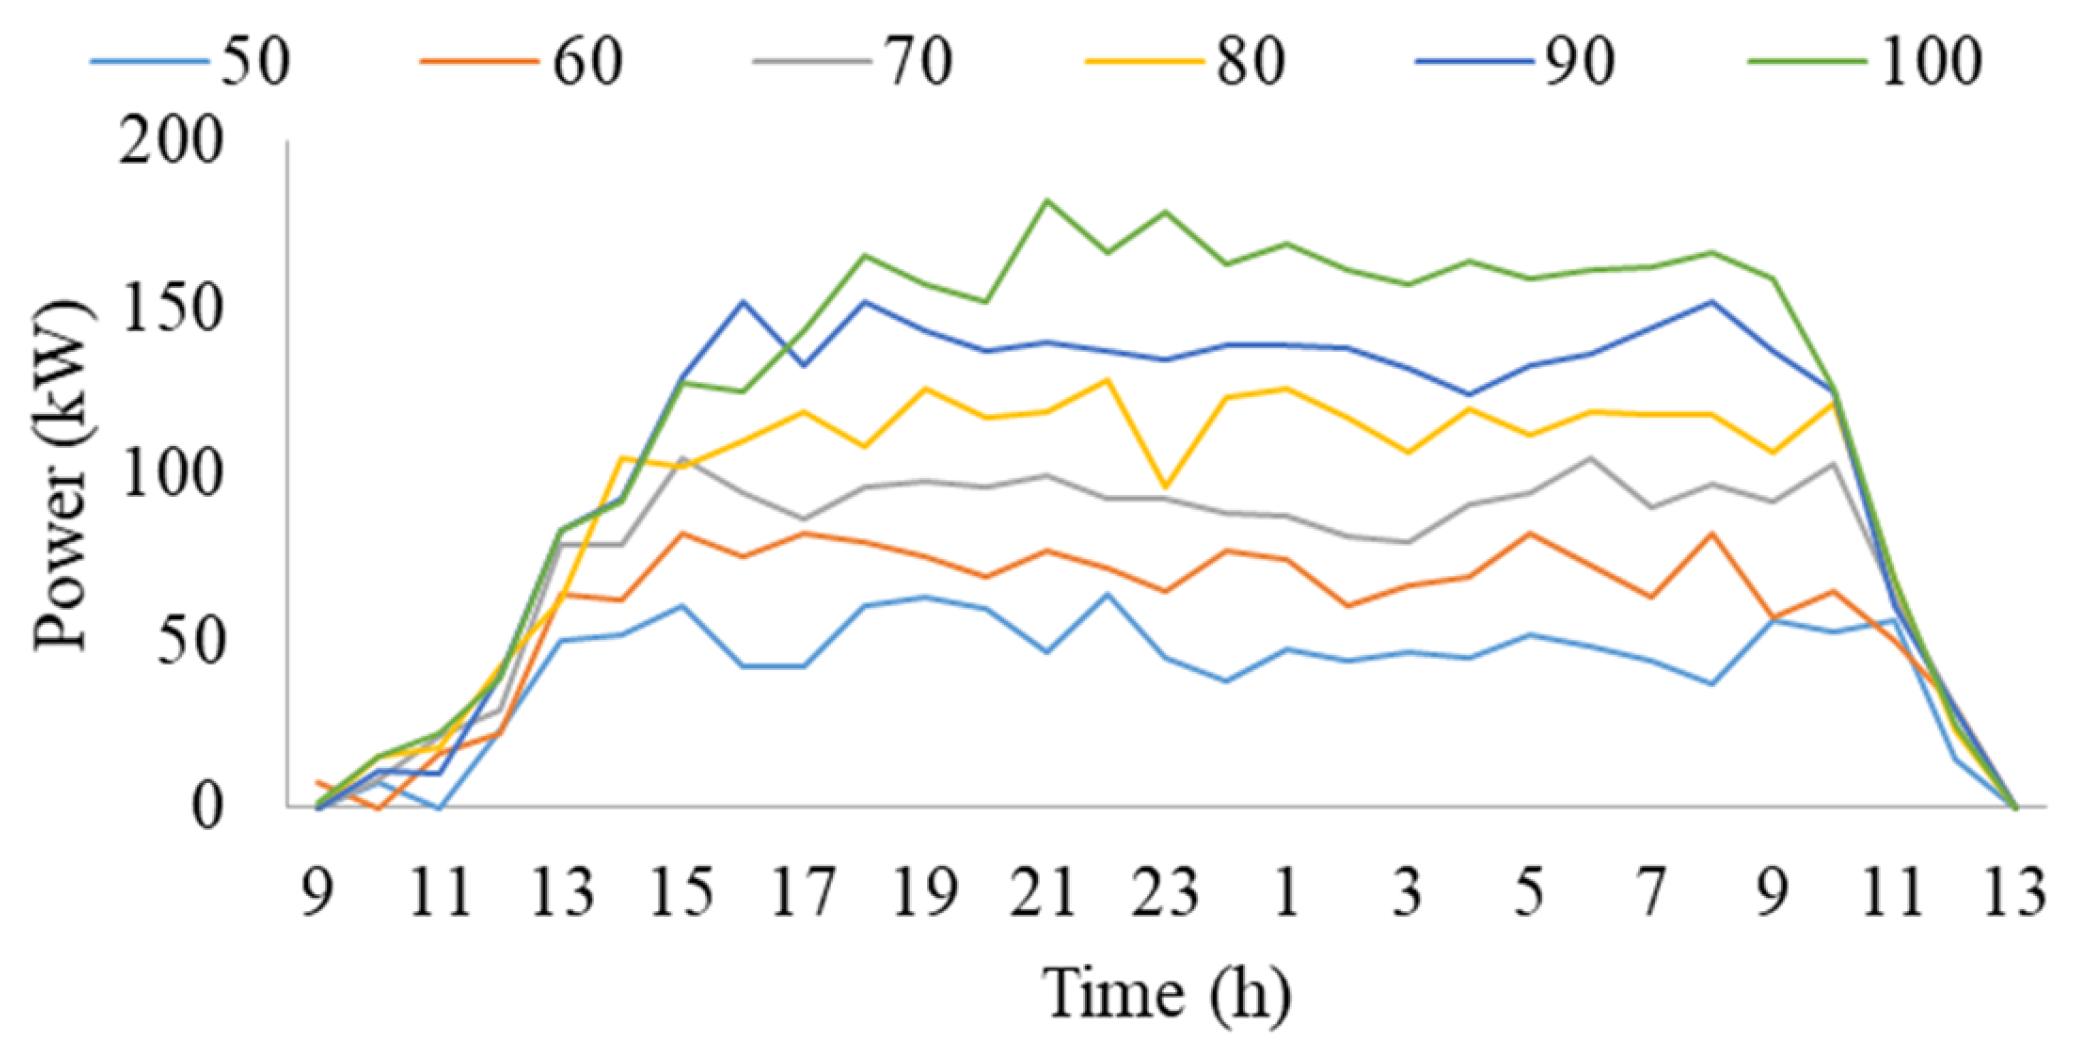
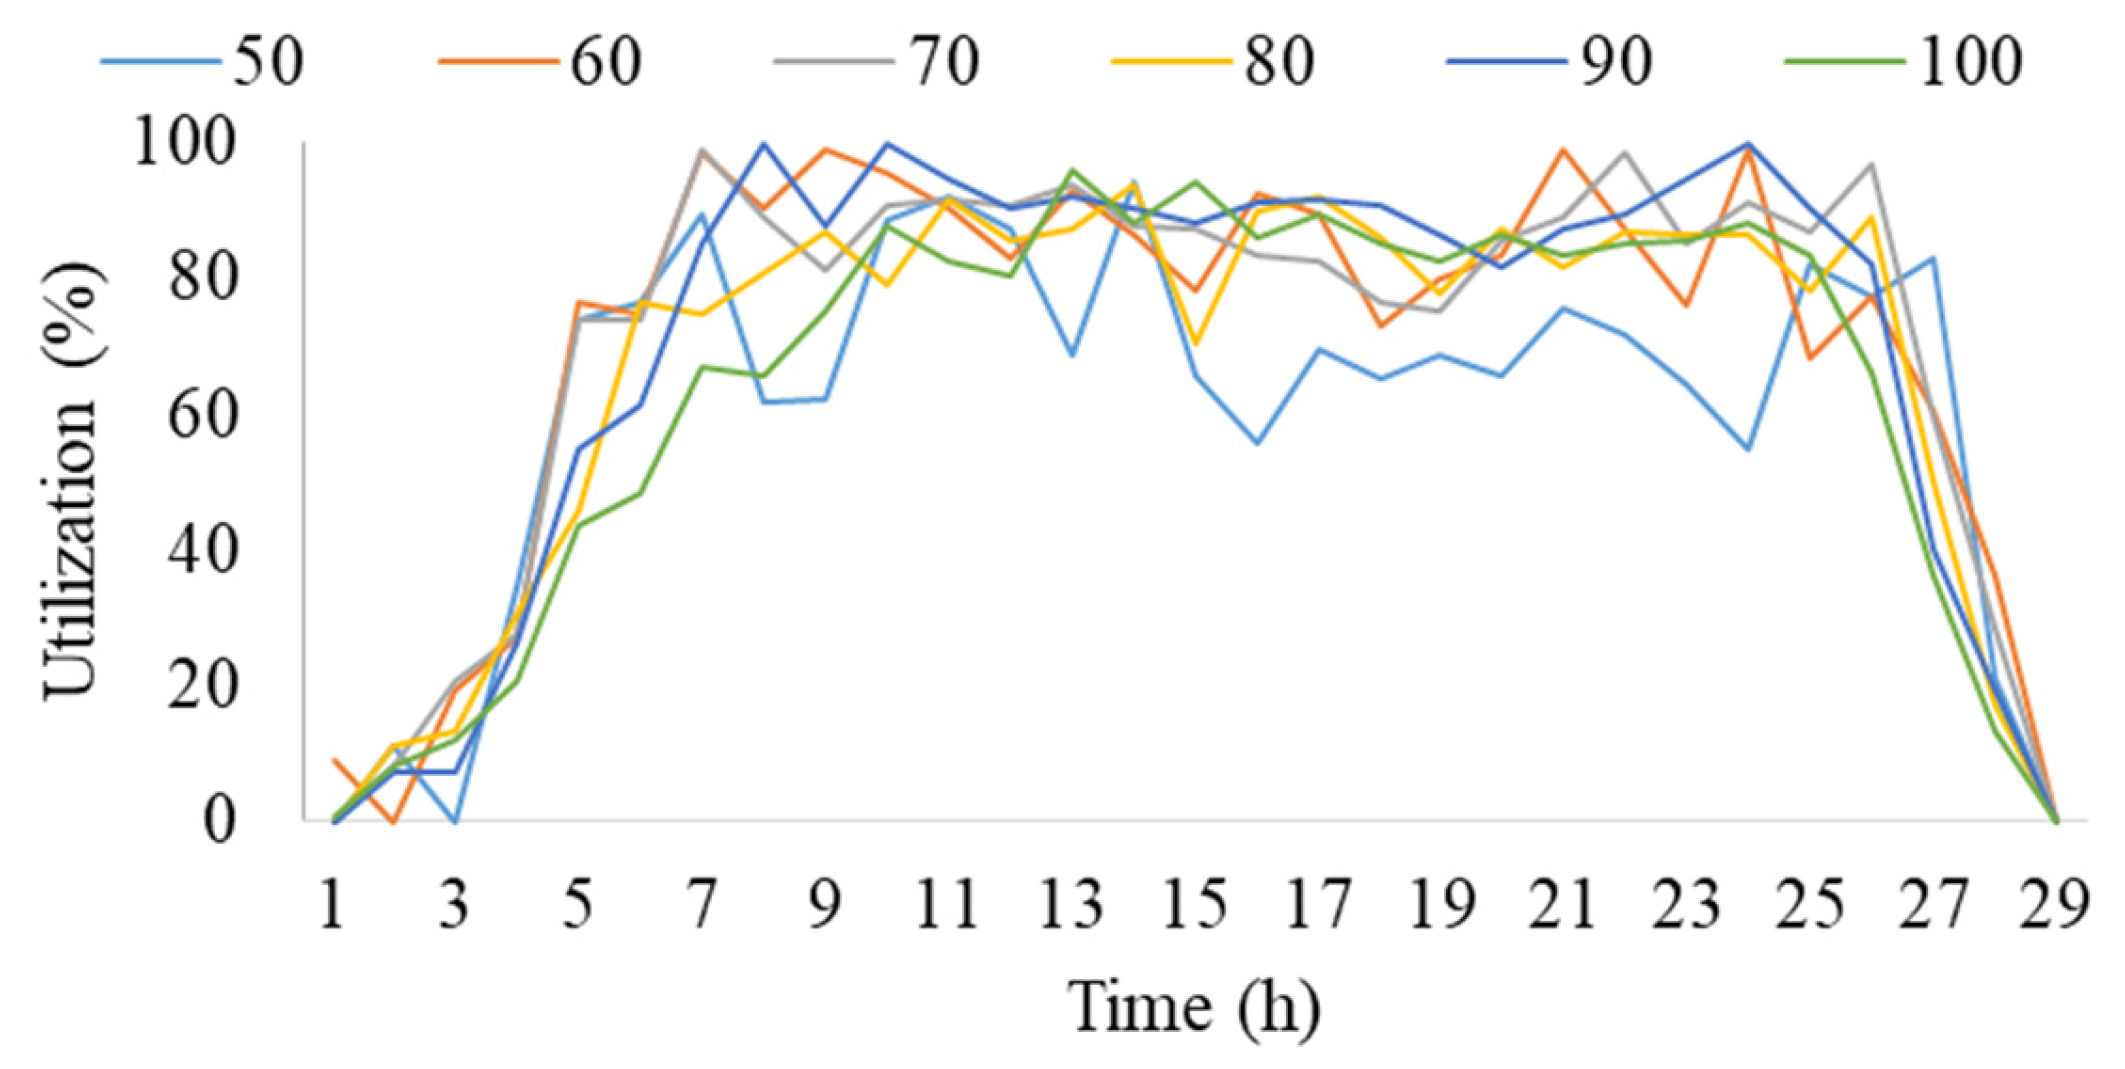
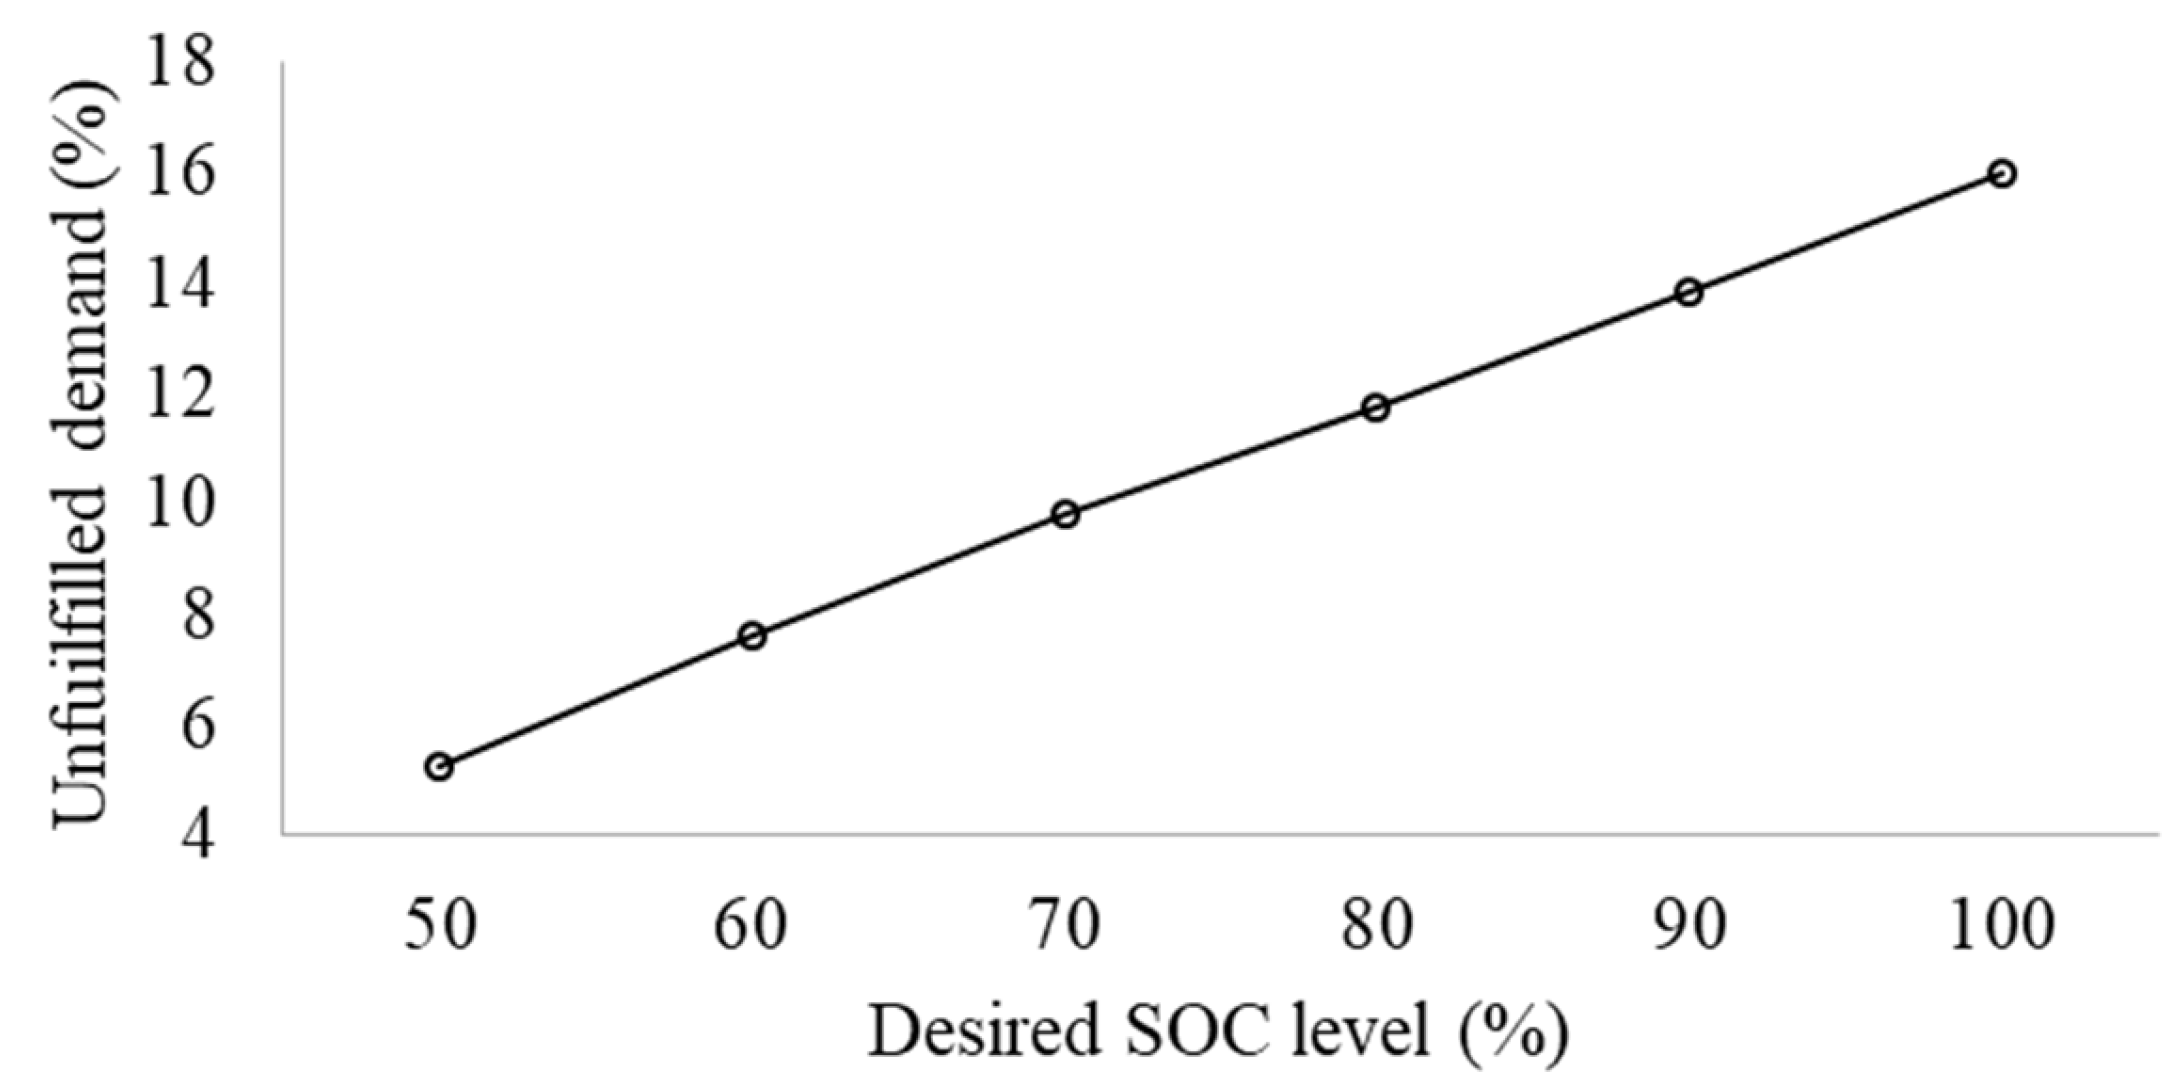
In this section, the required State of Charge (SOC) level is varied between 50% and 100%, and six cases are simulated with an EV fleet size of 100. Due to the advantages of flexible charging over continuous charging, only flexible charging is considered in this section. Figure 16 shows the total amount of power utilized by all chargers during each interval, with an increase in power utilization observed with an increase in SOC level, as expected since EVs require more energy before their departure time. However, the charger utilization remains similar for all cases, as shown in Figure 17. Interestingly, the unfulfilled demand increases with an increase in the required SOC level, as shown in Figure 18. This is because, with a higher required SOC level, more EVs are not able to fulfill their entire energy demand during their parking time. For example, EVs with under 4 h of charging duration may be able to charge up to 50% of SOC. With an increase in the required SOC level, some portion of energy for these EVs remains unfulfilled.

5.3. Practical and Managerial Implications

The results provide several important insights for building operators, planners, and policymakers. First, the significant reduction in required chargers under flexible charging highlights the value of coordinated charging management in multi-unit residential buildings. Rather than installing dedicated chargers for each EV, shared infrastructure combined with intelligent scheduling can substantially improve asset utilization and reduce capital investment. From a planning perspective, the results also indicate that parking duration and arrival patterns play a critical role in determining infrastructure needs. Buildings with highly synchronized evening arrivals may experience reduced flexibility benefits, suggesting that local travel behavior should be carefully considered during infrastructure planning. More broadly, the unified modeling framework presented in this work provides a systematic tool for evaluating trade-offs between infrastructure sizing and service quality in shared residential environments, thereby supporting more informed EV readiness planning in multi-unit residential buildings.
The results confirm the structural advantage of coordinated flexible charging observed in recent residential EV charging studies, particularly in improving infrastructure utilization under shared parking conditions. From a planning perspective, the findings suggest that building operators and utilities can significantly reduce over-provisioning of chargers by leveraging coordinated charging strategies rather than relying solely on dedicated infrastructure. However, the benefits of flexible charging are context dependent. In scenarios with highly synchronized evening arrivals, limited parking durations, low user participation, or non-negligible switching delays, the achievable flexibility may decrease and the required number of chargers may increase. These conditions should be carefully evaluated when applying flexible charging strategies in practice.

6. Limitations and Future Work

Despite the valuable insights provided, several limitations of this study should be acknowledged.
Charging model simplifications: The proposed framework assumes constant charging power during each charging session to maintain computational tractability. In practice, EV charging power typically varies with battery SOC and charger control strategies. Incorporating SOC-dependent charging profiles and nonlinear charging behavior represents an important direction for future work.
Flexible charging practicality: The flexible charging scheme assumes full user participation and negligible switching delay between vehicles. In real deployments, user acceptance levels and operational constraints may reduce achievable flexibility. Future research will integrate minimum charging duration constraints, switching delays, and user preference models to improve practical realism.
Scope of sustainability assessment: Sustainability benefits in this work are primarily reflected through infrastructure efficiency, charger utilization, and service quality metrics. Explicit environmental indicators (e.g., lifecycle emissions), detailed economic cost modeling, and social equity metrics are not directly optimized. Extending the framework to multi-objective sustainability formulations represents an important direction for future research.
Scenario coverage and robustness: Although multiple EV fleet sizes and SOC targets are examined, additional real-world factors such as highly synchronized arrival peaks, variations in charger power ratings, and transformer capacity uncertainty may affect system performance. Future work will expand the scenario space and conduct broader robustness validation.
Implementation considerations: The present study focuses on planning-level optimization. Practical deployment would require integration with building energy management systems and real-time smart charging platforms. Future research will explore implementation-oriented validation in real multi-unit residential environments.
Hybrid configurations: While this study examines continuous and fully flexible charging as two representative operational paradigms, hybrid configurations combining dedicated and shared chargers may be considered in specific building contexts. However, such configurations introduce additional assignment, management, and policy complexities that are highly site-dependent. Future work will investigate hybrid charging strategies, time-of-use pricing, and reservation-based mechanisms within an expanded multi-objective framework, along with more detailed factor attribution analysis of unfulfilled demand.

7. Conclusions

This study developed a unified optimization framework to determine the optimal number of shared electric vehicle chargers in multi-unit residential buildings under continuous and flexible charging strategies. Using heterogeneous electric vehicle characteristics and travel behavior data, the proposed model evaluates infrastructure requirements while maintaining acceptable service adequacy. The results consistently demonstrate that coordinated flexible charging can substantially reduce the required number of chargers compared with continuous charging while preserving comparable service performance. The infrastructure advantage of flexible charging becomes more pronounced as EV penetration increases, highlighting the importance of coordinated charging in high-adoption residential environments.
The analysis further reveals that parking duration and arrival patterns play a dominant role in shaping unfulfilled energy demand. Vehicles with shorter parking windows are more likely to experience unmet charging needs, particularly at higher target SOC levels. These findings indicate that user availability windows, rather than charger power limits alone, are critical determinants of service adequacy in shared residential charging contexts. From a practical standpoint, the results suggest that building operators and utilities can improve infrastructure utilization and avoid unnecessary over-provisioning by adopting coordinated charging strategies supported by smart charging platforms. The proposed MILP-based framework demonstrated strong computational efficiency, with global optimal solutions obtained in less than five seconds for the studied fleet sizes, confirming its suitability for planning-level applications. It is important to note that the flexible charging results represent an ideal coordination scenario. In real-world deployments, factors such as highly synchronized arrival patterns, varying levels of user participation, and non-negligible switching or vehicle relocation time may reduce achievable flexibility and increase the required number of chargers. Therefore, the quantitative reductions reported in this study should be interpreted in light of these operational considerations when applied to specific sites.
Future work will focus on incorporating more detailed charging dynamics, explicit switching-delay constraints, and expanded robustness analysis under diverse operating conditions. In addition, stochastic extensions and multi-objective formulations incorporating economic and fairness considerations represent promising directions to further enhance the practical applicability of the proposed framework. Overall, the methodology presented in this work provides a systematic and computationally efficient tool to support electric vehicle charging infrastructure planning in multi-unit residential environments.

Funding

The author extends the appreciation to the Deanship of Postgraduate Studies and Scientific Research at Majmaah University for funding this research work through the project number (R-2026-101).

Institutional Review Board Statement

Not applicable.

Informed Consent Statement

Not applicable.

Data Availability Statement

Data will be made available on request.

Conflicts of Interest

The author declares no conflicts of interest.

References

  1. Sajjad, A.; Asmi, F.; Chu, J.; Anwar, M.A. Environmental concerns and switching toward electric vehicles: Geographic and institutional perspectives. Environ. Sci. Pollut. Res. 2020, 27, 39774–39785. [Google Scholar] [CrossRef] [PubMed]
  2. Liu, H.; Zhou, S.; Gu, W.; Zhuang, W.; Zhou, A.; Peng, L.; Liu, M. Fast dynamic identification algorithm for key nodes in distribution networks with large-scale DG and EV integration. Appl. Energy 2025, 388, 125608. [Google Scholar] [CrossRef]
  3. Rajesh, M.; Ramachandran, S.; Vengatesan, K.; Dhanabalan, S.S.; Nataraj, S.K. Federated Learning for Personalized Recommendation in Securing Power Traces in Smart Grid Systems. IEEE Trans. Consum. Electron. 2024, 70, 88–95. [Google Scholar] [CrossRef]
  4. Shahidinejad, A.; Abawajy, J. Blockchain-Based Self-Certified Key Exchange Protocol for Hybrid Electric Vehicles. IEEE Trans. Consum. Electron. 2024, 70, 543–553. [Google Scholar] [CrossRef]
  5. Kapustin, N.O.; Grushevenko, D.A. Long-term electric vehicles outlook and their potential impact on electric grid. Energy Policy 2020, 137, 111103. [Google Scholar] [CrossRef]
  6. Hussain, A.; Musilek, P. Resilience Enhancement Strategies For and Through Electric Vehicles. Sustain. Cities Soc. 2022, 80, 103788. [Google Scholar] [CrossRef]
  7. Gao, Y.; Tahir, M.; Siano, P.; Hussain, S.; Sun, W.; He, Y.; Meng, Q. A bi-level hybrid game framework for stochastic robust optimization in multi-integrated energy microgrids. Sustain. Energy Grids Netw. 2025, 44, 102024. [Google Scholar] [CrossRef]
  8. Hussain, A.; Bui, V.-H.; Musilek, P. Local demand management of charging stations using vehicle-to-vehicle service: A welfare maximization-based soft actor-critic model. eTransportation 2023, 18, 100280. [Google Scholar] [CrossRef]
  9. Jaraniya, D.; Kumar, S. Power Quality Signal Conditioning and Mitigation by Using LMSEXF-Based Control Strategy for Grid-Tied PV Assisted EV Charging Station. IEEE Trans. Consum. Electron. 2024, 70, 564–573. [Google Scholar] [CrossRef]
  10. Almutairi, A.; Alrumayh, O. Optimal Charging Infrastructure Portfolio for Minimizing Grid Impact of Plug-In Electric Vehicles. IEEE Trans. Ind. Inform. 2022, 18, 5712–5721. [Google Scholar] [CrossRef]
  11. Lin, H.; Bian, C.; Wang, Y.; Li, H.; Sun, Q.; Wallin, F. Optimal planning of intra-city public charging stations. Energy 2022, 238, 121948. [Google Scholar] [CrossRef]
  12. Pan, L.; Yao, E.; Yang, Y.; Zhang, R. A location model for electric vehicle (EV) public charging stations based on drivers’ existing activities. Sustain. Cities Soc. 2020, 59, 102192. [Google Scholar] [CrossRef]
  13. Cui, Y.; Hu, Z.; Duan, X. Optimal Pricing of Public Electric Vehicle Charging Stations Considering Operations of Coupled Transportation and Power Systems. IEEE Trans. Smart Grid 2021, 12, 3278–3288. [Google Scholar] [CrossRef]
  14. Li, J.; Liu, Z.; Wang, X. Public charging station localization and route planning of electric vehicles considering the operational strategy: A bi-level optimizing approach. Sustain. Cities Soc. 2022, 87, 104153. [Google Scholar] [CrossRef]
  15. Chen, C.-M.; Miao, Q.; Khan, F.; Srivastava, G.; Kumari, S. Sustainable Secure Communication in Consumer-Centric Electric Vehicle Charging in Industry 5.0 Environments. IEEE Trans. Consum. Electron. 2024, 70, 1544–1555. [Google Scholar] [CrossRef]
  16. Lai, Q.; Xiong, C.; Chen, J.; Wang, W.; Chen, J.; Gadekallu, T.R.; Cai, M.; Hu, X. Improved Transformer-Based Privacy-Preserving Architecture for Intrusion Detection in Secure V2X Communications. IEEE Trans. Consum. Electron. 2024, 70, 1810–1820. [Google Scholar] [CrossRef]
  17. Meng, Q.; Hussain, S.; He, Y.; Lu, J.; Guerrero, J.M. Multi-timescale stochastic optimization for enhanced dispatching and operational efficiency of electric vehicle photovoltaic charging stations. Int. J. Electr. Power Energy Syst. 2025, 172, 111096. [Google Scholar] [CrossRef]
  18. Hussain, A.; Musilek, P. Utility-scale energy storage system for load management under high penetration of electric vehicles: A marginal capacity value-based sizing approach. J. Energy Storage 2022, 56, 105922. [Google Scholar] [CrossRef]
  19. Pellegrini, A.; Borriello, A.; Rose, J.M. Assessing the willingness of Australian households for adopting home charging stations for electric vehicles. Transp. Transp. Res. Part C Emerg. Technol. 2023, 148, 104034. [Google Scholar] [CrossRef]
  20. Bjørndal, E.; Bjørndal, M.; Bøe, E.K.; Dalton, J.; Guajardo, M. Smart home charging of electric vehicles using a digital platform. Smart Energy 2023, 12, 100118. [Google Scholar] [CrossRef]
  21. Klein, M.; Lüpke, L.; Günther, M. Home charging and electric vehicle diffusion: Agent-based simulation using choice-based conjoint data. Transp. Res. Part D Transp. Environ. 2020, 88, 102475. [Google Scholar] [CrossRef]
  22. Feng, J.; Yao, Y.; Liu, Z. Developing an optimal building strategy for electric vehicle charging stations: Automaker role. Environ. Dev. Sustain. 2025, 27, 12091–12151. [Google Scholar] [CrossRef]
  23. Cao, B.; Liu, K.; Wu, G.; He, Z.; Xin, D.; Chen, K.; Gao, G. A self-supervised evaluation approach of insulation condition for vehicle cable terminals using hypergraph neural network with dynamic features. IEEE Trans. Ind. Inform. 2025, 21, 9330–9340. [Google Scholar] [CrossRef]
  24. Hussain, A.; Musilek, P. Fairness and Utilitarianism in Allocating Energy to EVs During Power Contingencies Using Modified Division Rules. IEEE Trans. Sustain. Energy 2022, 13, 1444–1456. [Google Scholar] [CrossRef]
  25. Lopez-Behar, D.; Tran, M.; Froese, T.; Mayaud, J.R.; Herrera, O.E.; Merida, W. Charging infrastructure for electric vehicles in Multi-Unit Residential Buildings: Mapping feedbacks and policy recommendations. Energy Policy 2019, 126, 444–451. [Google Scholar] [CrossRef]
  26. Lopez-Behar, D.; Tran, M.; Mayaud, J.R.; Froese, T.; Herrera, O.E.; Merida, W. Putting electric vehicles on the map: A policy agenda for residential charging infrastructure in Canada. Energy Res. Soc. Sci. 2019, 50, 29–37. [Google Scholar] [CrossRef]
  27. Ramsebner, J.; Hiesl, A.; Haas, R.; Auer, H.; Ajanovic, A.; Mayrhofer, G.; Reinhardt, A.; Wimmer, A.; Ferchhumer, E.; Mitterndorfer, B.; et al. Smart charging infrastructure for battery electric vehicles in multi apartment buildings. Smart Energy 2023, 9, 100093. [Google Scholar] [CrossRef]
  28. Almutairi, A. Plug-in electric vehicles and their impact on power generation availability: A real survey-based analysis in Saudi Arabia. Sustain. Cities Soc. 2021, 75, 103389. [Google Scholar] [CrossRef]
  29. Almutairi, A.; Albagami, N.; Almesned, S.; Alrumayh, O.; Malik, H. Electric Vehicle Load Estimation at Home and Workplace in Saudi Arabia for Grid Planners and Policy Makers. Sustainability 2023, 15, 15878. [Google Scholar] [CrossRef]
  30. NHTS Datasets. Available online: https://nhts.ornl.gov/download.shtml (accessed on 4 January 2024).
  31. Gong, H.; Ionel, D.M. Optimization of aggregated EV power in residential communities with smart homes. In Proceedings of the 2020 IEEE Transportation Electrification Conference & Expo (ITEC), Chicago, IL, USA, 23–26 June 2020; pp. 779–782. [Google Scholar] [CrossRef]
  32. Dai, Z.; Liu, H.; Rodgers, M.O.; Guensler, R. Electric vehicle market potential and associated energy and emissions reduction benefits. Appl. Energy 2022, 322, 119295. [Google Scholar] [CrossRef]
  33. Compare Electric Vehicles—EV Database. Available online: https://ev-database.org/#sort:path~type~order=.rank~number~desc%7Crange-slider-range:prev~next=0~1200%7Crange-slider-acceleration:prev~next=2~23%7Crange-slider-topspeed:prev~next=110~350%7Crange-slider-battery:prev~next=10~200%7Crange-slider-towweight:pre (accessed on 4 January 2024).
  34. Hussain, A.; Musilek, P. Reliability-as-a-Service Usage of Electric Vehicles: Suitability Analysis for Different Types of Buildings. Energies 2022, 15, 665. [Google Scholar] [CrossRef]
  35. Almutairi, A. Impact Assessment of Diverse EV Charging Infrastructures on Overall Service Reliability. Sustainability 2022, 14, 13295. [Google Scholar] [CrossRef]
Figure 1. Distribution of vehicle trip duration during weekdays and holidays.
Sustainability 18 03051 g001
Figure 2. Distribution of daily vehicle mileage during weekdays and holidays.
Sustainability 18 03051 g002
Figure 3. Daily arrival and departure times of vehicles during weekdays.
Sustainability 18 03051 g003
Figure 4. Daily arrival and departure times of vehicles during holidays.
Sustainability 18 03051 g004
Figure 5. Relationship between EV battery capacity (kWh) and energy efficiency (Wh/km) for commercially available electric vehicles.
Sustainability 18 03051 g005
Figure 6. Distribution of daily energy consumption for EVs.
Sustainability 18 03051 g006
Figure 7. System configuration of the proposed MURBs network with shared parking stations.
Sustainability 18 03051 g007
Figure 8. Flowchart for determining optimal number of charging under different schemes.
Sustainability 18 03051 g008
Figure 9. EV-wise original and fulfilled energy demand under different schemes.
Sustainability 18 03051 g009
Figure 10. EV-wise unfulfillment index under different schemes.
Sustainability 18 03051 g010
Figure 11. Hourly charger utilization under different schemes.
Sustainability 18 03051 g011
Figure 12. Hourly charging power under different schemes.
Sustainability 18 03051 g012
Figure 13. Number of chargers required under different schemes.
Sustainability 18 03051 g013
Figure 14. Differences in the number of chargers across the considered schemes.
Sustainability 18 03051 g014
Figure 15. Charger utilization under different schemes.
Sustainability 18 03051 g015
Figure 16. Total charging station power profile for different target SOC levels (50–100%) under flexible charging.
Sustainability 18 03051 g016
Figure 17. Charger utilization profiles for different target SOC levels (50–100%) under flexible charging.
Sustainability 18 03051 g017
Figure 18. Variation in unfulfilled energy demand with target SOC level under flexible charging.
Sustainability 18 03051 g018
Table 1. Parameters of EV fleet used for evaluating the performance of different schemes.
EV IDArrival
Time
SOCDeparture
Time
Parking
Duration (h)
Battery
Capacity (kWh)
Energy
Demand (kWh)
1120.452917452.25
2130.2614166.515.96
3140.1131177730.03
4150.41216908.1
5160.2311510531.5
6160.111938834.32
7160.162264515.3
8160.343216457.2
9170.37236455.85
10170.433215775.39
11170.16331632.310.982
12180.29246459.45
13180.353315588.7
14180.12341623.89.044
15180.443416452.7
16190.253516379.25
17190.1336177728.49
18190.38201455.4
19200.443212905.4
20200.27311126.86.164
21210.453211683.4
22210.2832119019.8
23220.42331128.52.28
24230.363298712.18
25240.1630623.88.092
Table 2. Hourly EV-wise results for continuous charging.
t12345678910111213141516171819202122232425
120000000000000000000000000
1307.600000000000000000000000
140000000000000000000000000
150000000000000000000000000
16001.91.607.60000000000000000000
17001.91.62.27.60000000000000000000
180021.62.27.60000000000000000000
190021.62.205.100000000005.40000000
200021.62.205.1000000000000000000
210.10202.205.10.12.90.4000000000000000
220.10202.2000.12.90.501.90000000000000
230.10202.2000.100.507.60000000000000
240.10202.3000.100.5000000000000000.1
10.10202.3000.100.5000000000000000.1
20.10202.3000.100.5000000000000000.1
30.10202.3000.100.5000000000000000.1
41.602.102.3000.100.5000000000000000.1
5002.102.3000.100.5000000000006.6007.6
6002.102.3000.100.5000000006.206.606.100
70000006.200.53.401.1000005.403.46.606.100
80000000007.607.64.5007.1000002.3000
90000000000004.52.74.67.1000000000
10000000000000004.67.1000000000
110000000000000007.1000000000
120000000000000000000000000
Table 3. Hourly EV-wise results for flexible charging.
t12345678910111213141516171819202122232425
122.3000000000000000000000000
1307.600000000000000000000000
14007.60000000000000000000000
15007.67.6000000000000000000000
16007.2007.60000000000000000000
17000007.67.6000000000000000000
1800007.67.6000001.10000000000000
190000000000000007.65.400000000
200000.5007.6000000000000000000
210000000.105.95.4000000000000000
2200007.60000007.60000000000000
23000000000001.90000006.204.60000
2400007.600000000000000000007.6
1000000000000000005.40002.3000
2000000000007.61.4000000000000.5
300000000000000000000007.600
400007.600003.4000000000000000
500000000000000000003.47.60000
6007.601.1000000000000000004.600
70000007.200000000000007.60000
80000000007.6000005.7000000000
90000000000007.62.71.70000000000
100000000000000007.67.600000000
110000000000000007.6000000000
120000000000000000000000000
Disclaimer/Publisher’s Note: The statements, opinions and data contained in all publications are solely those of the individual author(s) and contributor(s) and not of MDPI and/or the editor(s). MDPI and/or the editor(s) disclaim responsibility for any injury to people or property resulting from any ideas, methods, instructions or products referred to in the content.