3.1. Raw Water Quality Overview
Natural organic matter (NOM) imparts colour in water and is a precursor for the formation of disinfection by-products, including trihalomethanes. It also contributes to chlorine demand and causes reduction in chlorine residuals. There are several water-quality parameters that serve as indicators of NOM in water, including DOC or total organic carbon (TOC), UV
254, UV transmissivity at 254 nm (UVT), and true colour [
17,
18]. The raw (WTP inlet) water, as indicated by four key water quality parameters—DOC, UV
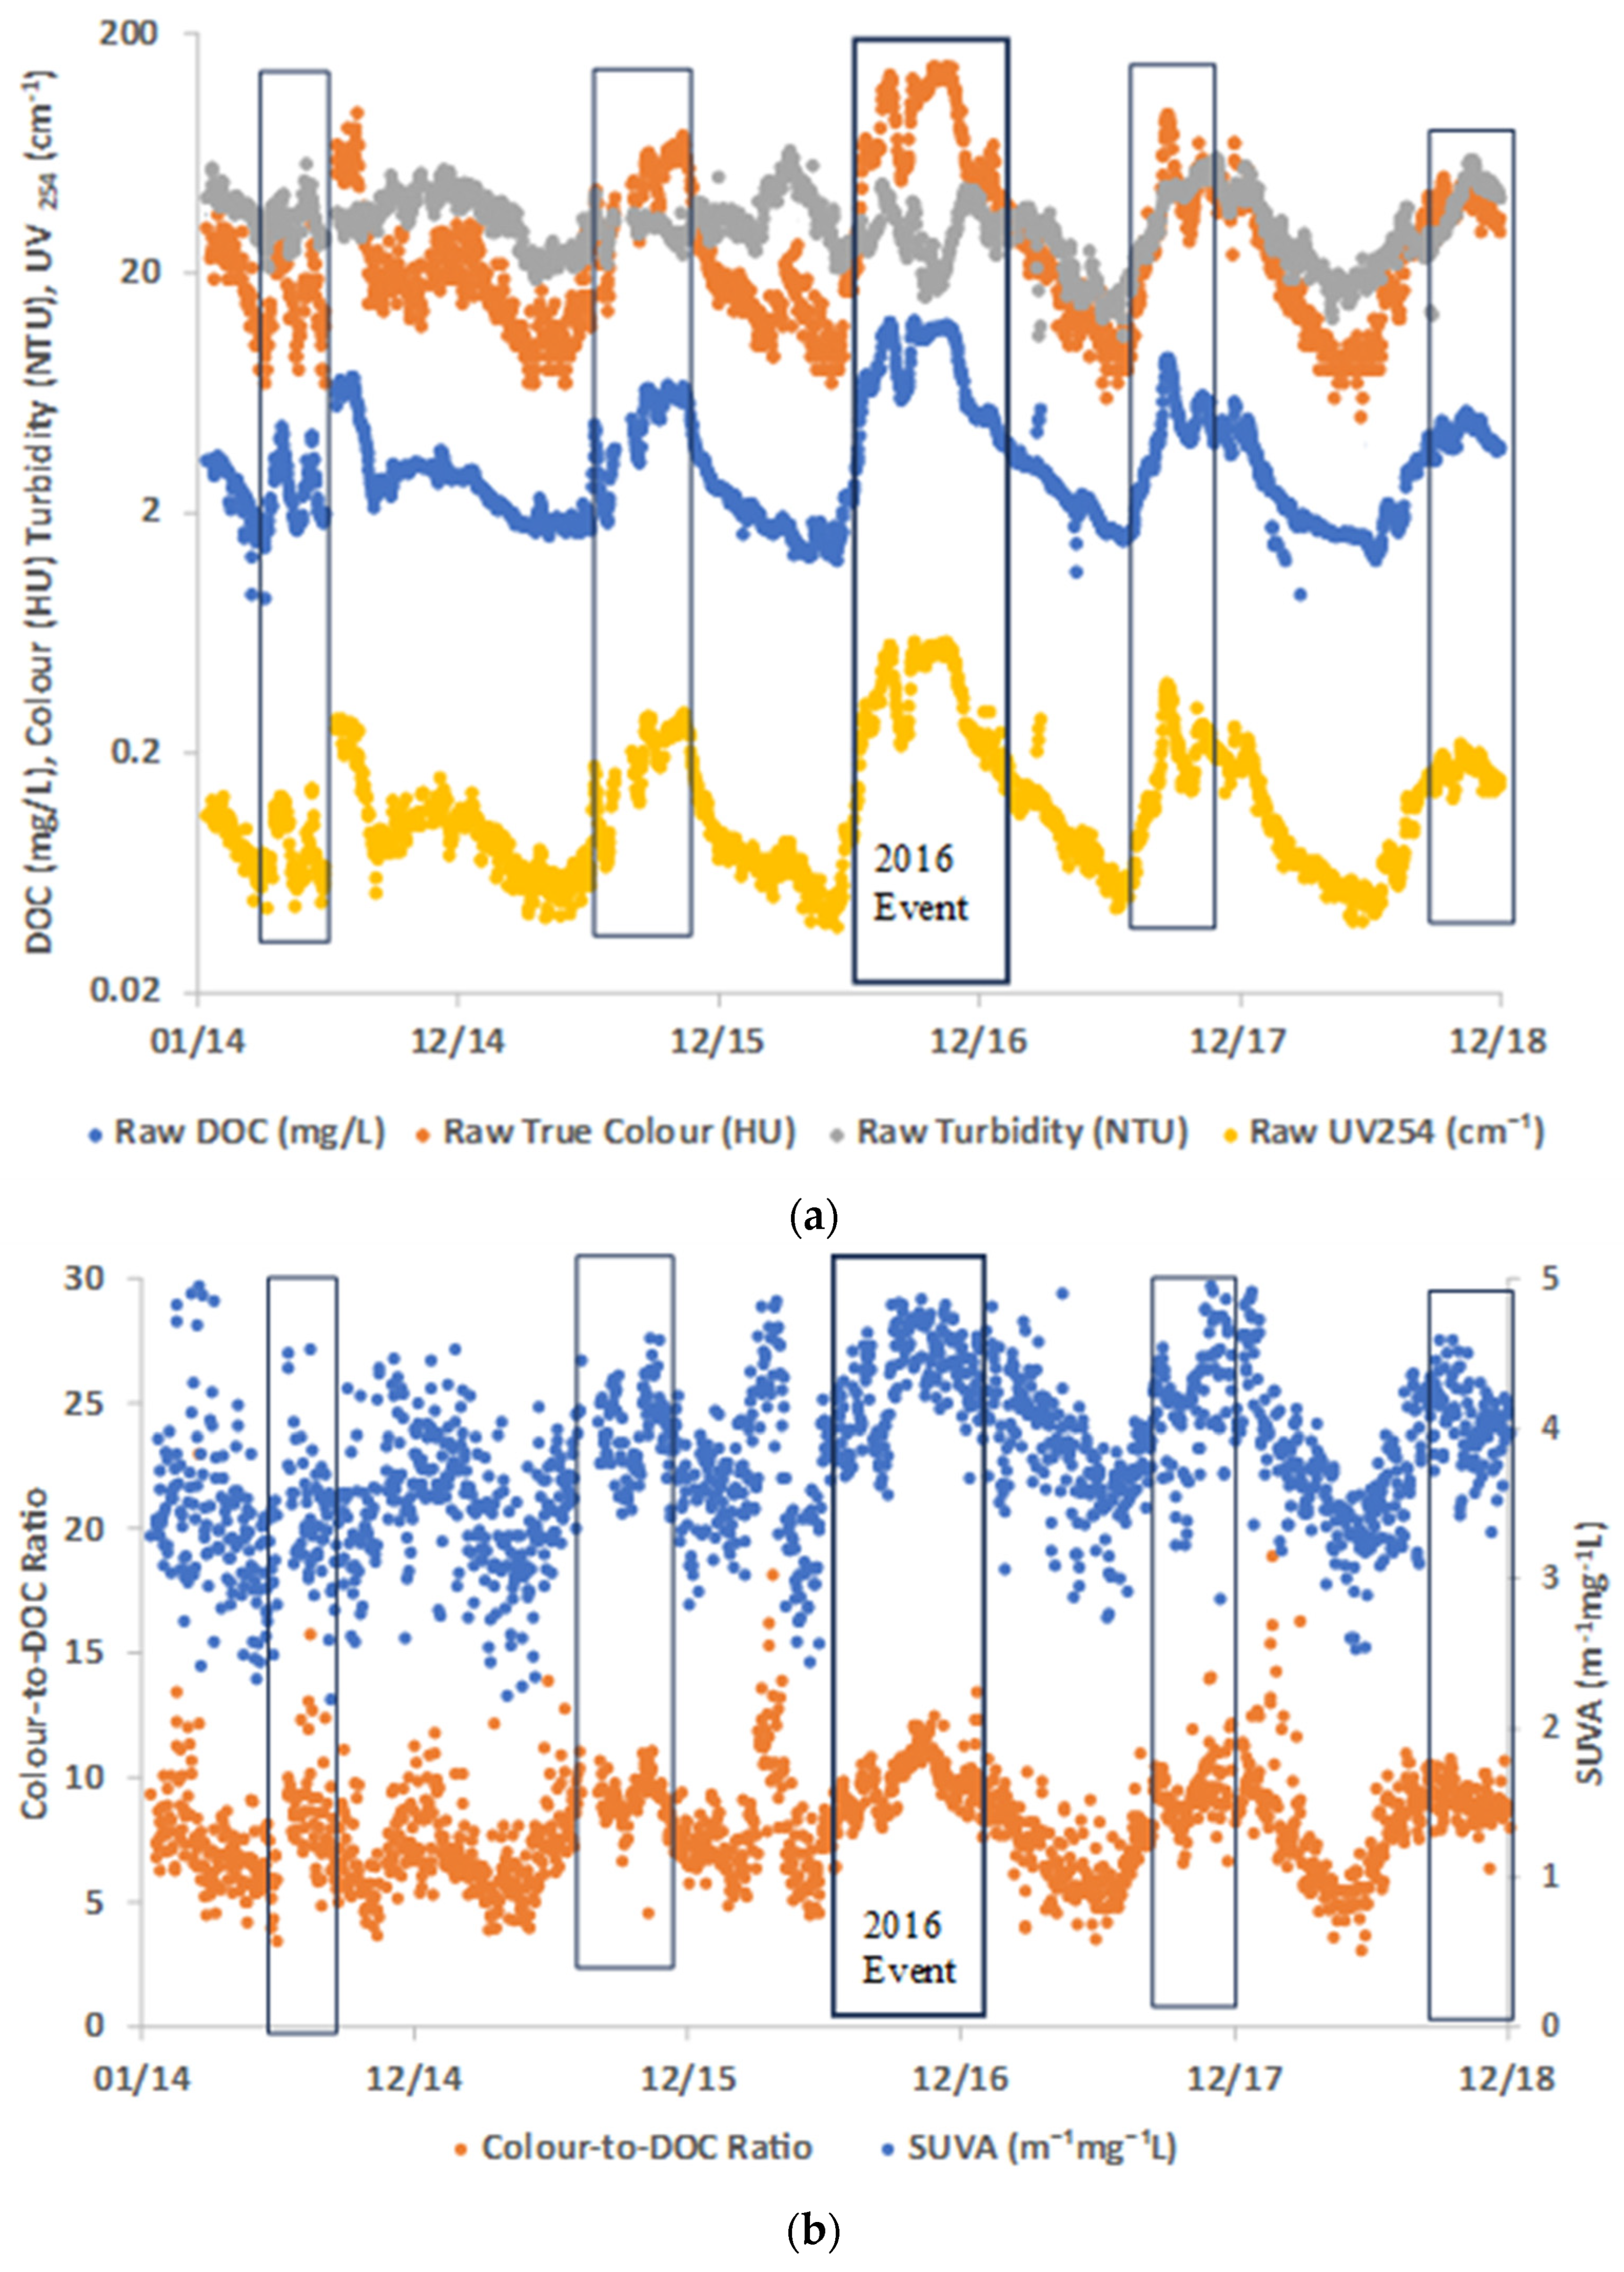
254, colour, and turbidity—follow a similar slight upward trend over the 5-year study period from January 2014 to December 2018 (
Figure 1). The DOC concentration was in the range of 0.9–12.6 mg/L with an average of 3.6 mg/L, UV
254 was between 0.04 and 0.59 cm
−1 (average 0.14 cm
−1), colour was between 5 and 145 HU (average 31 HU), and turbidity was between 11 and 223 NTU (average 33 NTU). All water quality data were within the WTC-Coag design limits (UV254 < 0.7 cm
−1, colour at 456 nm < 200 HU, and turbidity < 1000 NTU). WTC-Coag can provide alum dose prediction in the water quality range.
During the study period, the WTP was challenged by several extreme water quality incidents (high DOC, UV
254, turbidity, and colour) each year (i. July 2014–September 2014, ii. August 2015–December 2015, iii. June 2016–February 2017, iv. September 2017–December 2017, v. September 2018 to December 2018). Generally, these incidents are described as “black water” events, and one of the major “black water” events was in 2016 (
Figure 1a). Visual inspection shows that DOC, UV
254, and colour follow a similar diurnal trend. Generally, “black water” events occur after heavy rains caused flooding and NOM is washed into the river. Turbidity increased with DOC in 2017 and 2018 events, but during the 2014, 2015, and 2016 events, it showed no increase or a slightly decrease compared with the other three water quality parameters. The regression lines show a slight upward trend for DOC, UV
254, and colour, except for turbidity, which shows a flat/slight downward trend over the five-year study period (
Figure 1a). This shows that the sources of NOM and turbidity may not be related and change differently.
It is well understood that the removal mechanism of particulate matters (turbidity) by coagulation is not the same as the NOM (as DOC). Usually, removal of turbidity occurs more readily in a lower alum dose range than DOC. This may have an impact on the removal performance, particularly during “black water” events when these two parameters are changing differently. It is then further complicated by NOM character playing an important role in the coagulation efficiency and is strongly related to DOC removal [
17,
18]. Using simple parameters such as specific UV absorbance (SUVA) and Colour-to-DOC ratio is an easy and simple way to assess whether there was a NOM character change during “black water” events.
Figure 1b shows that “black water” events not only exhibit an increase in DOC concentration (
Figure 1a), but also an increase in both SUVA and Colour-to-DOC ratio, which are expected to affect the efficiency of the coagulation process as NOM character change can be linked with DOC removal performance. The change to a higher SUVA value and higher Colour-to-DOC ratio potentially improve the coagulation efficiency, resulting in a higher DOC removal at the same dose [
19]. Considering higher SUVA means that the DOC is more amenable to being removed by the process during the event, meaning even the raw-water DOC concentration is higher compared to the normal or “black water” event in unreported periods, alum dose may not need to be increased in proportion to the increase in the DOC concentration. Thus, using UV
254 as one of the input parameters for the WTC-Coag model to reflect the NOM character in relation to coagulant dose is practically important.
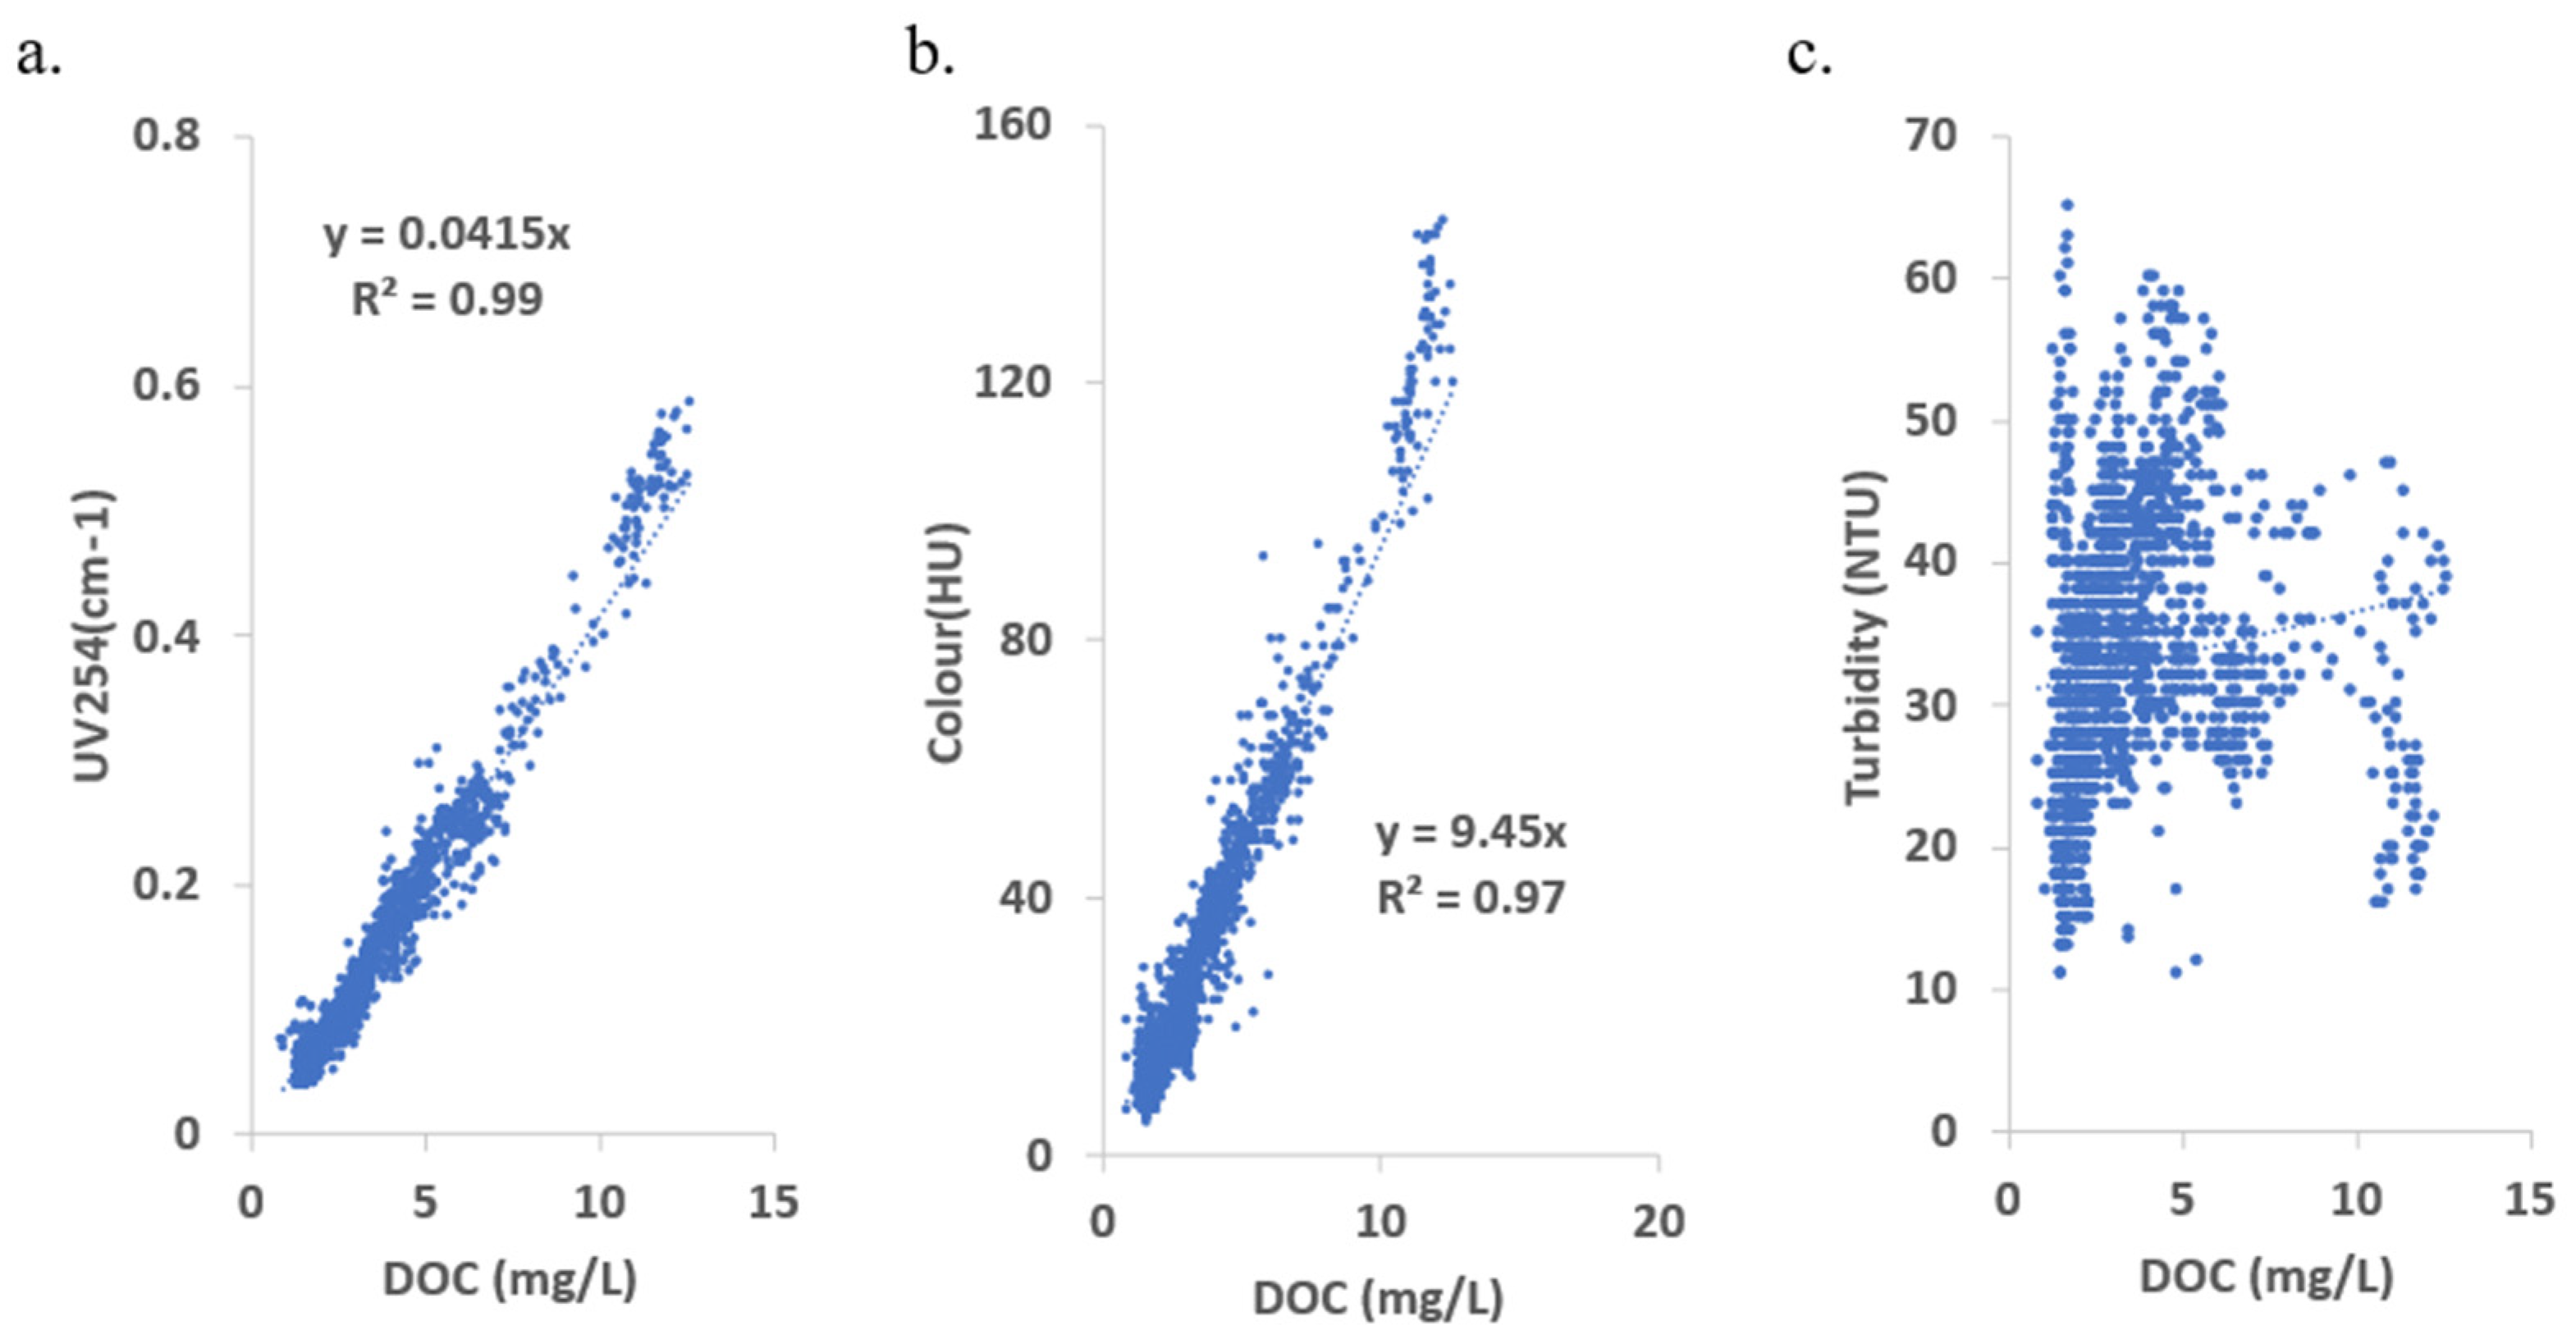
Figure 2 shows the correlation between UV
254, DOC, and colour, which is a simple method to understand how these parameters are inter-related, as well as providing additional information to understand the characteristics of raw water. UV
254, colour, and DOC are closely linked with good linearities (both R
2s are > 0.9), which confirms the observation that UV
254, colour, and DOC follow similar trends in
Figure 1a, while turbidity does not. In addition, the observed SUVA and Colour-to-DOC ratio increase (NOM character change) in
Figure 1b may not be as significant during the “black water” events as the UV
254 and DOC, and colour and DOC are still following a linear relationship in
Figure 2a,b.
3.2. Comparison of Predicted Doses with Actual WTP Doses
In this section, two WTC-Coag prediction functions, Enhanced Dose Prediction and Targeted Dose Prediction, are discussed. Enhanced Dose Prediction requires only the three raw water quality parameters, turbidity, colour, and UV
254, to predict the required alum dose for enhanced coagulation that can achieve maximum DOC removal. In
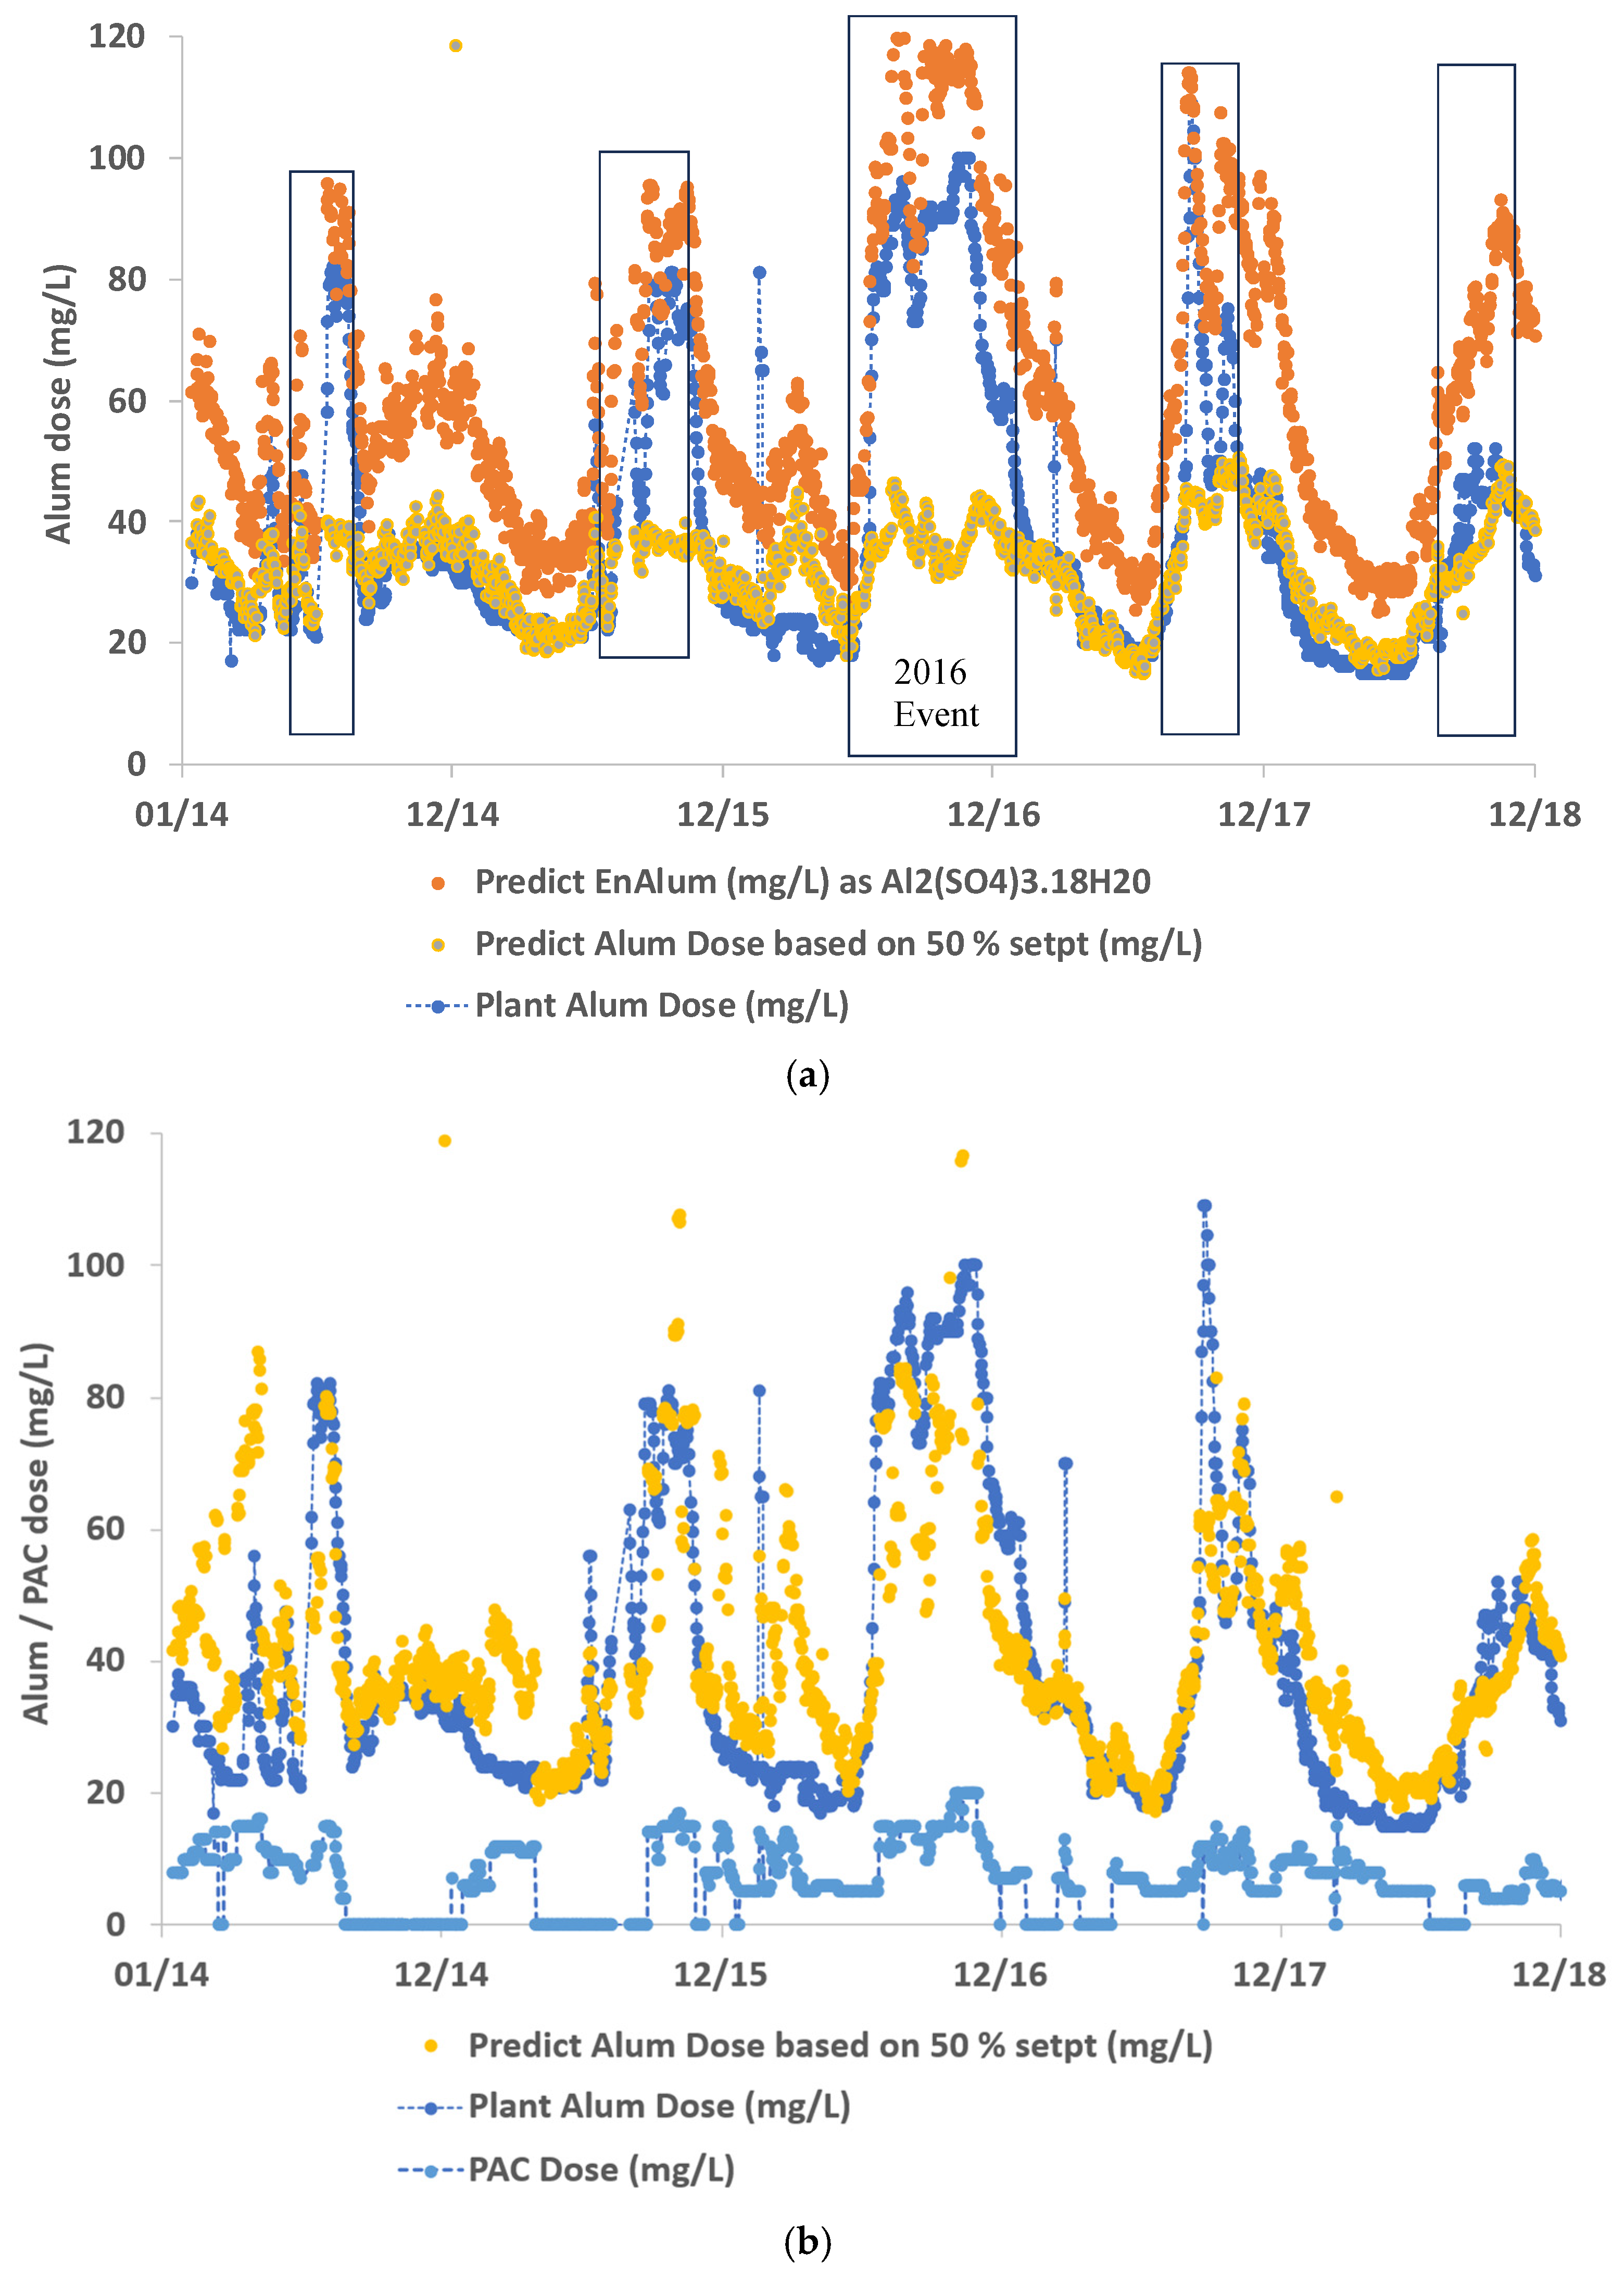
Figure 3a, the predicted enhanced dose is shown to be higher than the plant dose, which shows that the level of treatment by enhanced coagulation would not be required (operator’s decision). Especially during the normal or “black water” event during unreported periods, the Enhanced Dose Prediction was almost double that of the plant alum dose. This indicated high-quality treated water from enhanced coagulation was not required by operations. Therefore, the Targeted Dose Prediction function of WTC-Coag software, which allows us to input a % setpoint to select the most suitable treatment level for the targeted treated water quality, would be a more appropriate option in matching the decision of the operator.
The term “coagulable DOC” is introduced and defined as the maximum amount of DOC that can be removed by coagulation (approximately between 50 and 80% of total DOC); the remainder is recalcitrant and cannot be removed. An initial implementation procedure was set up using historical data to determine the % setpoint which can mimic the operator’s decision. It is worth mentioning that the original model design was based on using the response curve of % removal of coagulable DOC against dose [
14]. However, during the initial model implementation by operations, operators suggested to name it as % setpoint, which is easier for operators to understand and apply. The optimum % setpoint is determined by using a series of dose prediction outputs (timeseries plots) in a range of setpoints, such as 50, 60, 70, 80, and 90% coagulable DOC removal dose predictions, as well as by identifying the closest visual match between the plant and predicted alum doses from one of the % setpoints. In addition, in a threshold-based evaluation using the criteria of less than 10 mg/L difference between plant alum dose and predicted alum dose over the entire period, 50% setpoint was determined and selected for future evaluation (40% setpoint: 73.9% prediction within 10 mg/L, 50% setpoint: 74.5% prediction within 10 mg/L, 60% setpoint: 72.0% prediction within 10 mg/L, 70% setpoint: 55.8% prediction within 10 mg/L, 80% setpoint: 22.2% prediction within 10 mg/L).
From the first observation, during the normal periods, the predicted dose based on 50% setpoint matches well with the plant alum dose. However, during the “black water” events, the predicted dose based on 50% setpoint did not match with the plant alum dose. The plant alum dose during those periods was much higher than the targeted 50% predicted dose. This indicated that either the water quality and NOM character or the treatment process changed during the “black water” periods. It was also possible that both were changed. It would be logical to consider the “black water” period and normal period separately and use different % setpoints. An evaluation of the prediction during the normal period only, using 50% setpoint, was conducted, whereby 90% of the predicted doses were within ±10 mg/L of the plant dose and 95% of the predicted doses were within ±15 mg/L of the plant dose.
After obtaining additional dosing information from the WTP (Plant A), it was found that PAC was dosed at the head of the plant during the “black water” periods. Dosing PAC can add turbidity (particles) to the water, which increases alum demand. Therefore, using the same targeted 50% setpoint shows the predicted dose was lowered as compared with the plant alum dose used at that time, as the model did not consider the added PAC (particles) that would consume alum during their removal. Several equation types, including linear, exponential, logarithmic, polynomial, and power, were initially considered in establishing the relationship between turbidity (NTU) and PAC (mg/L) to obtain a conversion equation to convert PAC dose (as mg/L) to turbidity (NTU), with the combined turbidity used as the model input. A similar threshold-based evaluation using the same criteria of less than 10 mg/L difference between plant alum dose and predicted alum dose over the entire study period was employed to determine the best equation type and coefficients for the equation. An equation, Turbidity = 10
(a×PAC), a = 0.13, was determined to be used for further evaluation.
Figure 3b shows PAC dose, plant alum dose, and targeted predicted dose with PAC corrected as turbidity increases. The 50% setpoint matches with the plant alum dose over the entire period after accounting for the PAC dose, 70% of the predicted dose were within ±10 mg/L, and 80% were within ±15 mg/L of the plant dose. This study only used a single % setpoint for evaluation purposes. In real operations, the operator will adjust the % setpoint to optimise the process to meet water quality goals.
3.3. Coagulation pH Control Prediction
Alum is acidic, and adding it to water for coagulation depresses pH. The final pH after coagulant (alum) is added depends on the alkalinity (buffering capacity) of the raw water. Coagulation pH is one of the key process control parameters for higher DOC removal; a pH between 6.2 and 6.5 would be the optimum pH range. In practice, coagulation pH would be between pH 6 and 7. For low-pH water, alkaline is needed to bring pH up to the optimum range (pH 6–7); for high-pH water, acid is needed to bring the pH down. The traditional method of pH control involves trial and error. The coagulation pH control prediction function provides a pH control adjustment function to determine the required acid or alkaline solution for the optimum pH range. The function can help water treatment operators maintain balanced pH levels of inlet water more easily and allow them to automatically adjust the pH by dosing the appropriate amount of chemicals, particularly during extreme water quality events [
20].
The first two WTC-Coag prediction functions, Enhanced Dose Prediction and Targeted Dose Prediction, provide the predicted alum dose, and with the alkalinity of the water, the pH after alum addition can be predicted and the amount of acid or alkaline required to change to the targeted pH can be determined.
The standard WTC-Coag software obtained the predicted alum dose from the raw water quality. Then, using the predicted alum dose as the amount of alum (acid) added to the raw water and with the raw water alkalinity, the resultant pH can be predicted. Then, the amount of acid or alkaline needed to adjust the coagulation pH is determined by the difference between the predicted pH after alum is added and the targeted pH. In this study, a modified procedure was used with the WTC-Coag algorithms instead of using the standard WTC-Coag input procedure. The plant alum dose, alkalinity, and measured coagulation pH were input into the WTC-Coag algorithms in lieu of the standard procedure described. This modified input procedure uses the algorithm to predict the resultant pH under these conditions (plant dose and alkalinity). The difference between the predicted pH after alum addition and targeted pH was used to determine the acid or alkaline dose required.
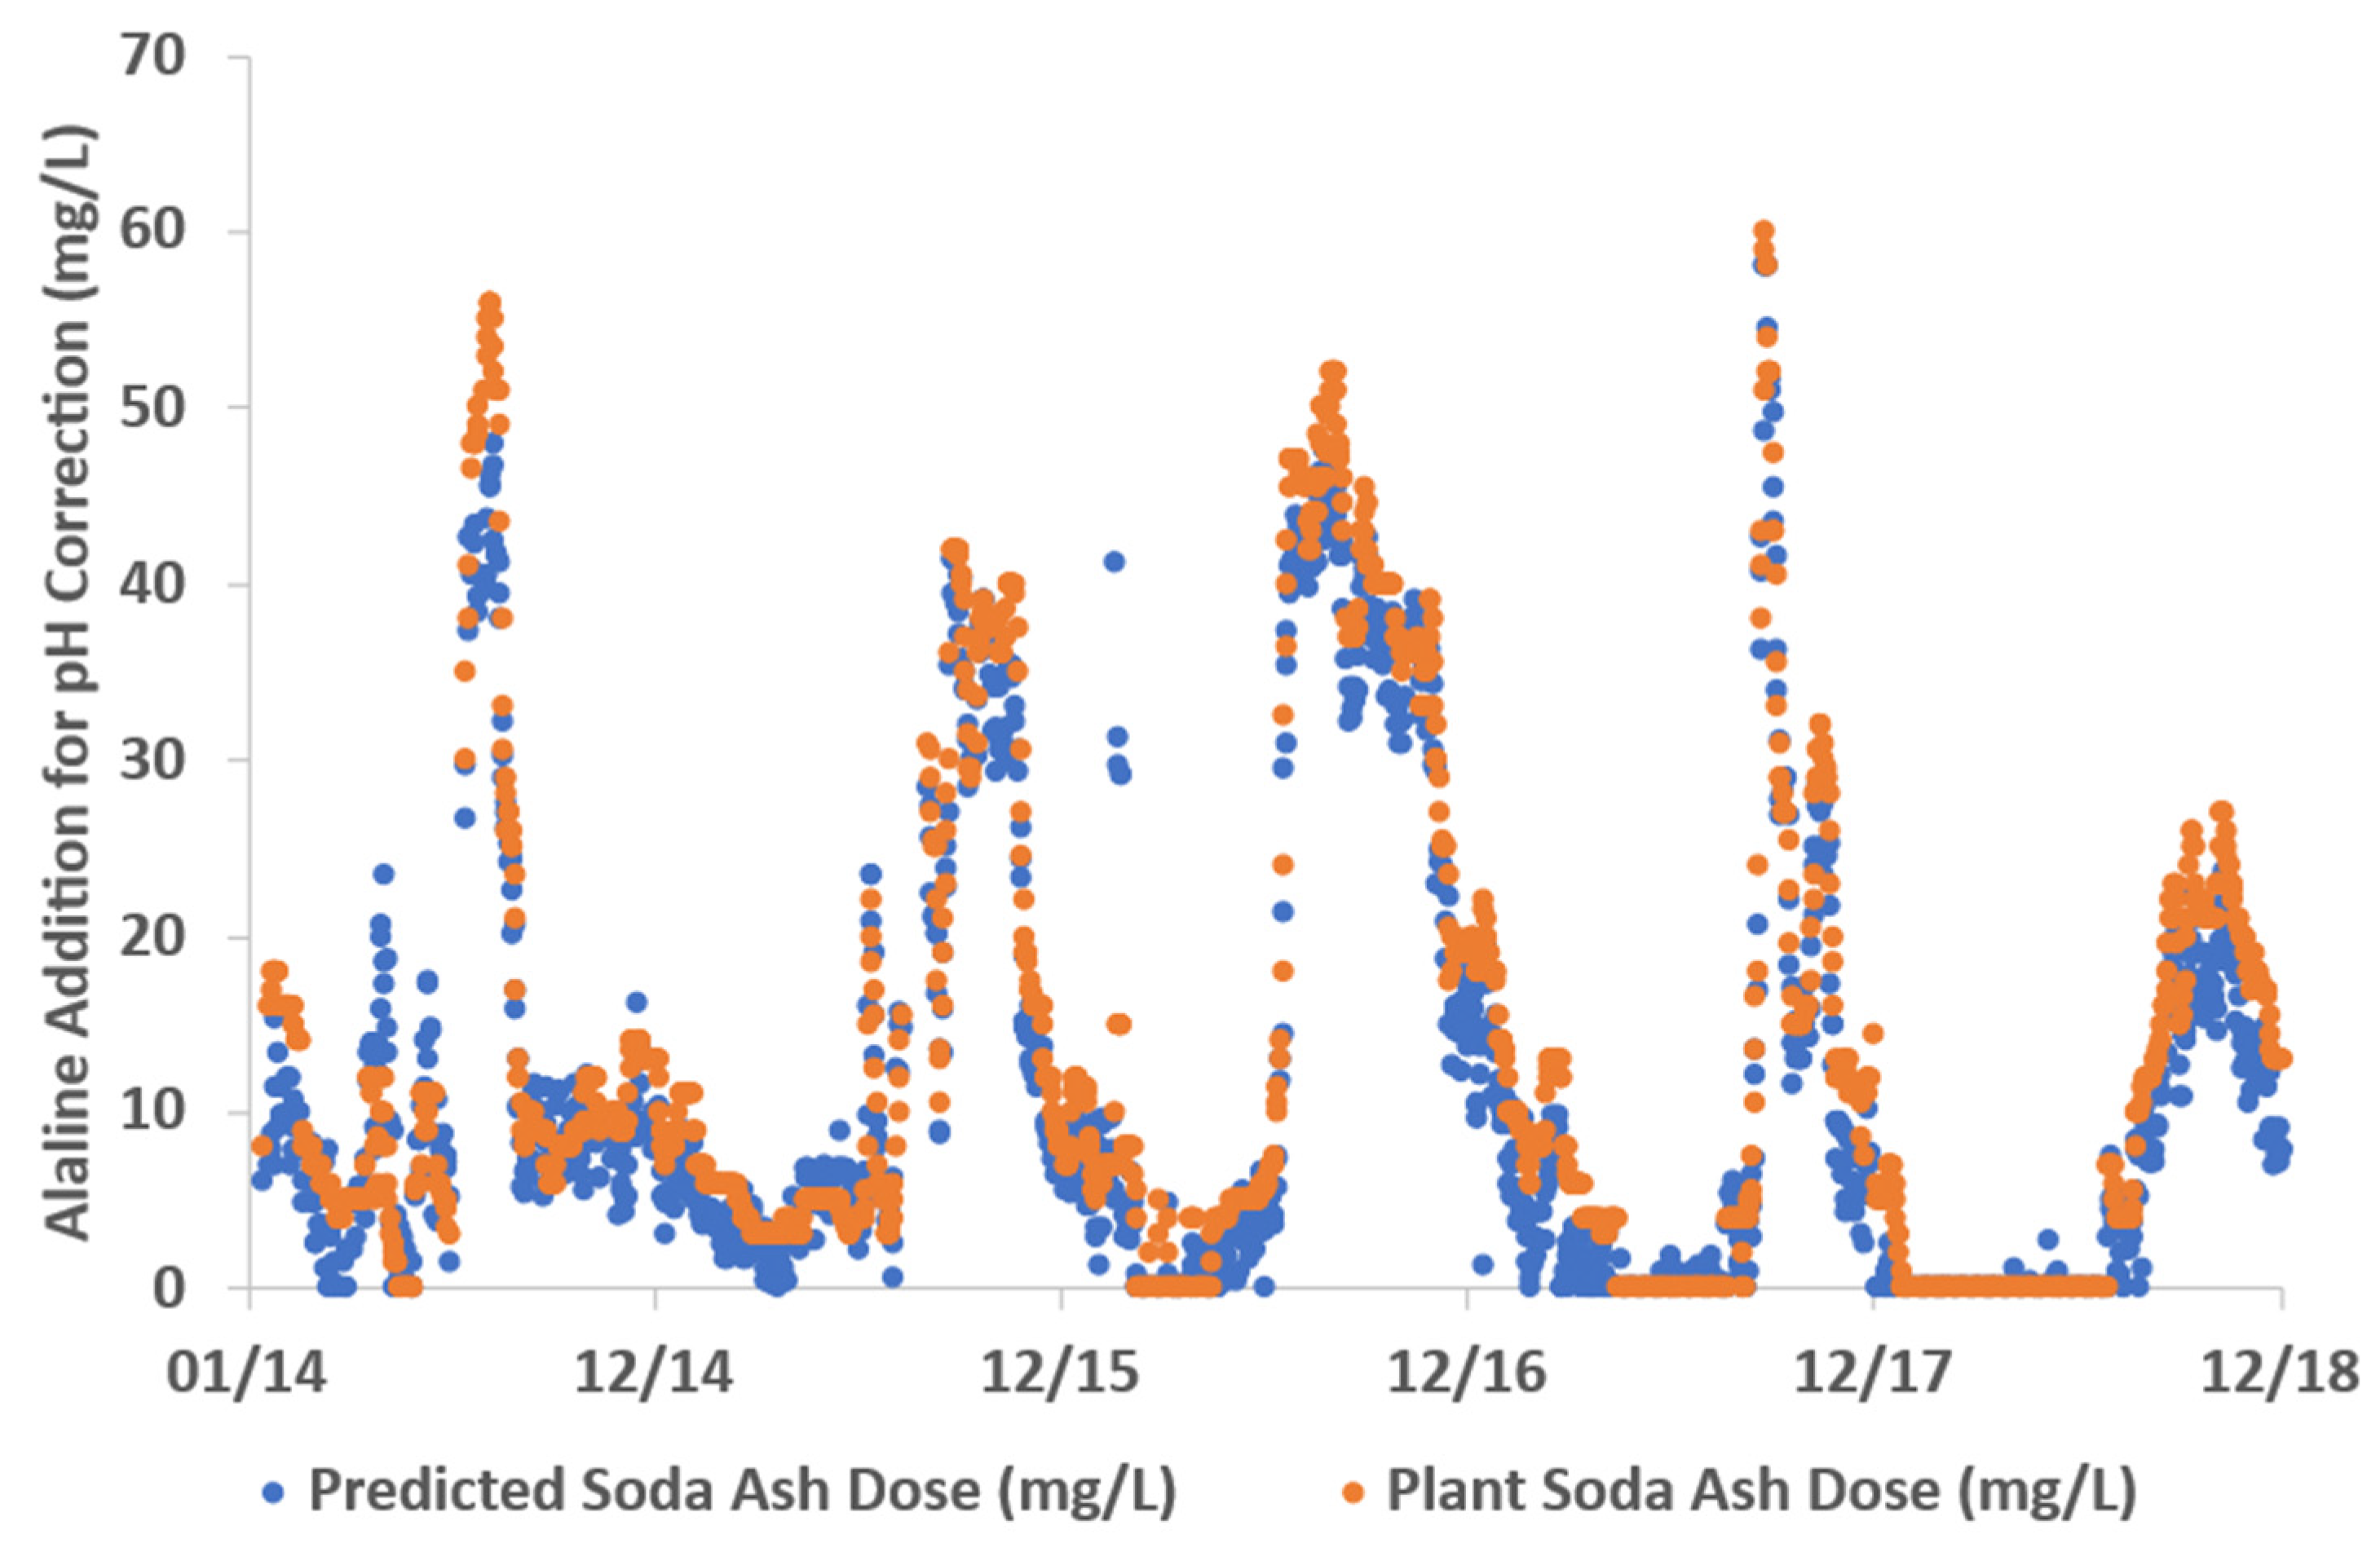
Figure 4 shows the predicted and actual doses at the treatment plant during the study period, and the close agreement between them demonstrates the predictive capability of the algorithm.
3.4. Treated Water Quality and Treatment Performance
Critical control point approach is used by the WTP to achieve good-quality treated water. Treatment plant operators target < 0.2 NTU and critical alert (shut down filter and contact regulatory agencies) if turbidity exceeds 0.5 NTU at the outlet of the individual filters. Corrective action is taken between target and critical alert to manage the incident. Generally, the dose selection is aimed at mainly managing both turbidity and DOC.
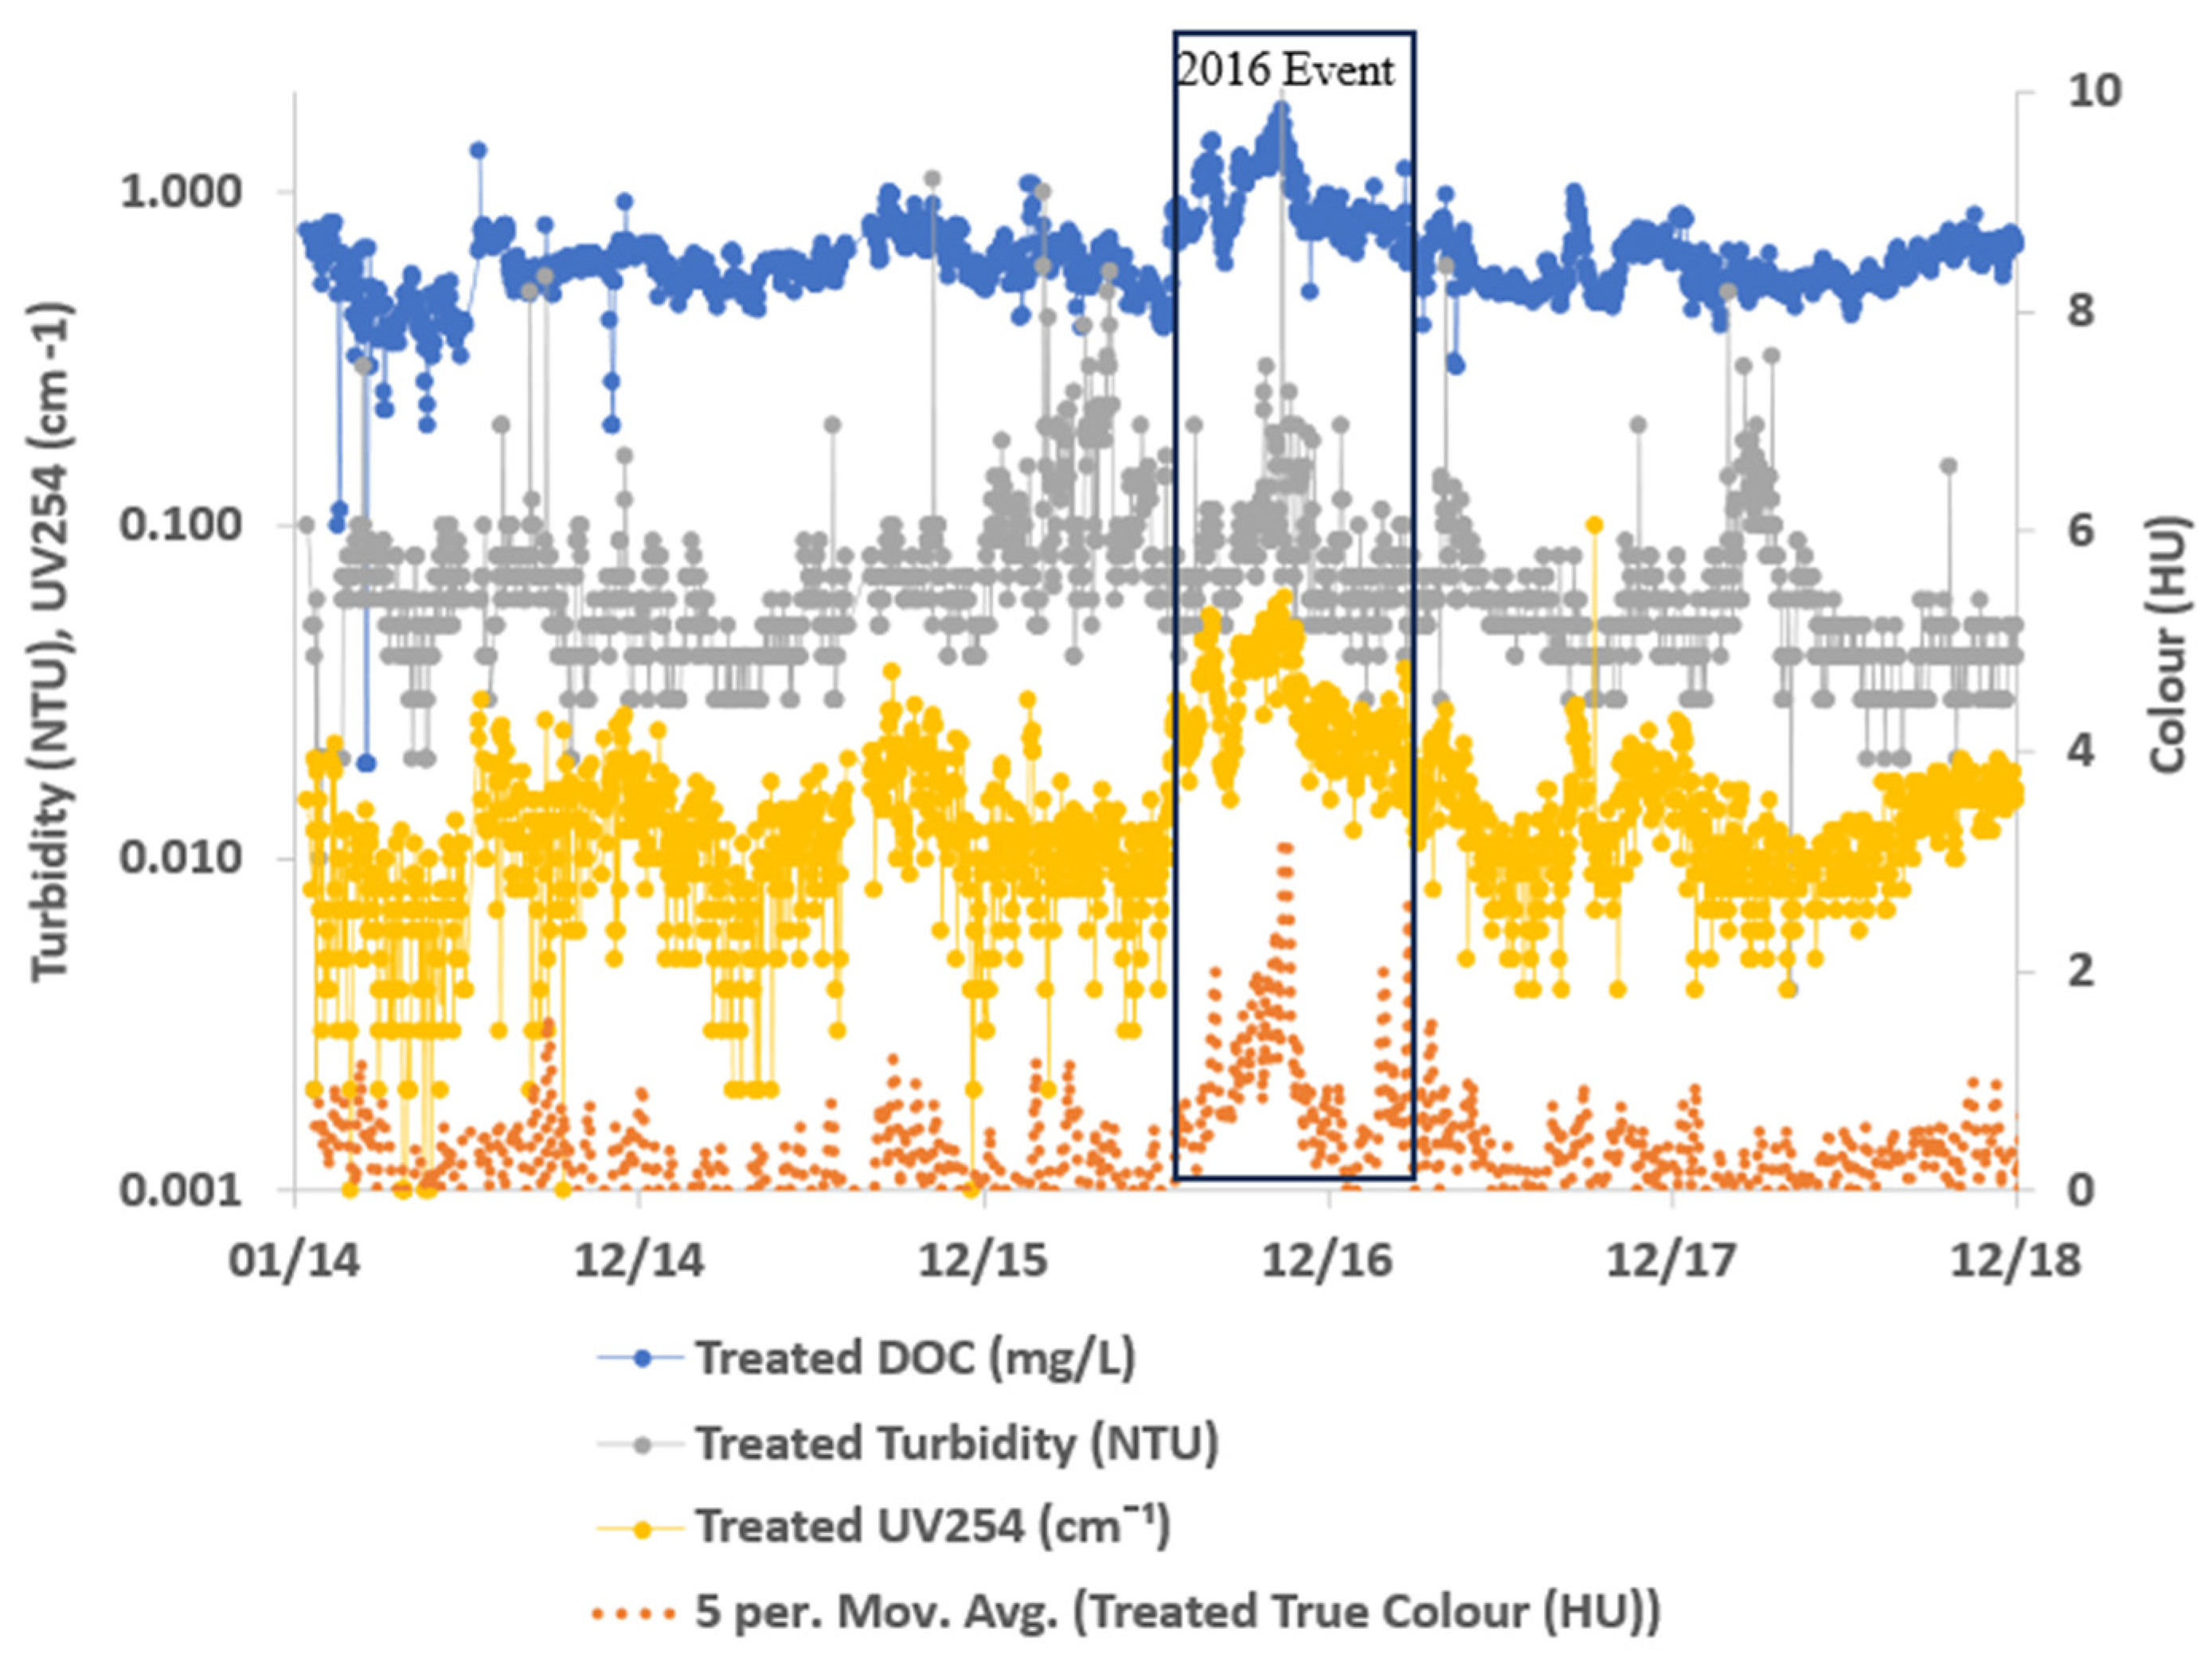
Both colour (0–5 HU) and turbidity (0.07–0.3 NTU) in treated water were well below the operation guideline levels (colour below 10 HU and turbidity below 0.5 NTU, with a small number of samples over the target level of 0.2 NTU) over the study period (
Figure 5). DOC and UV
254 show higher levels during the 2016 “black water” event.
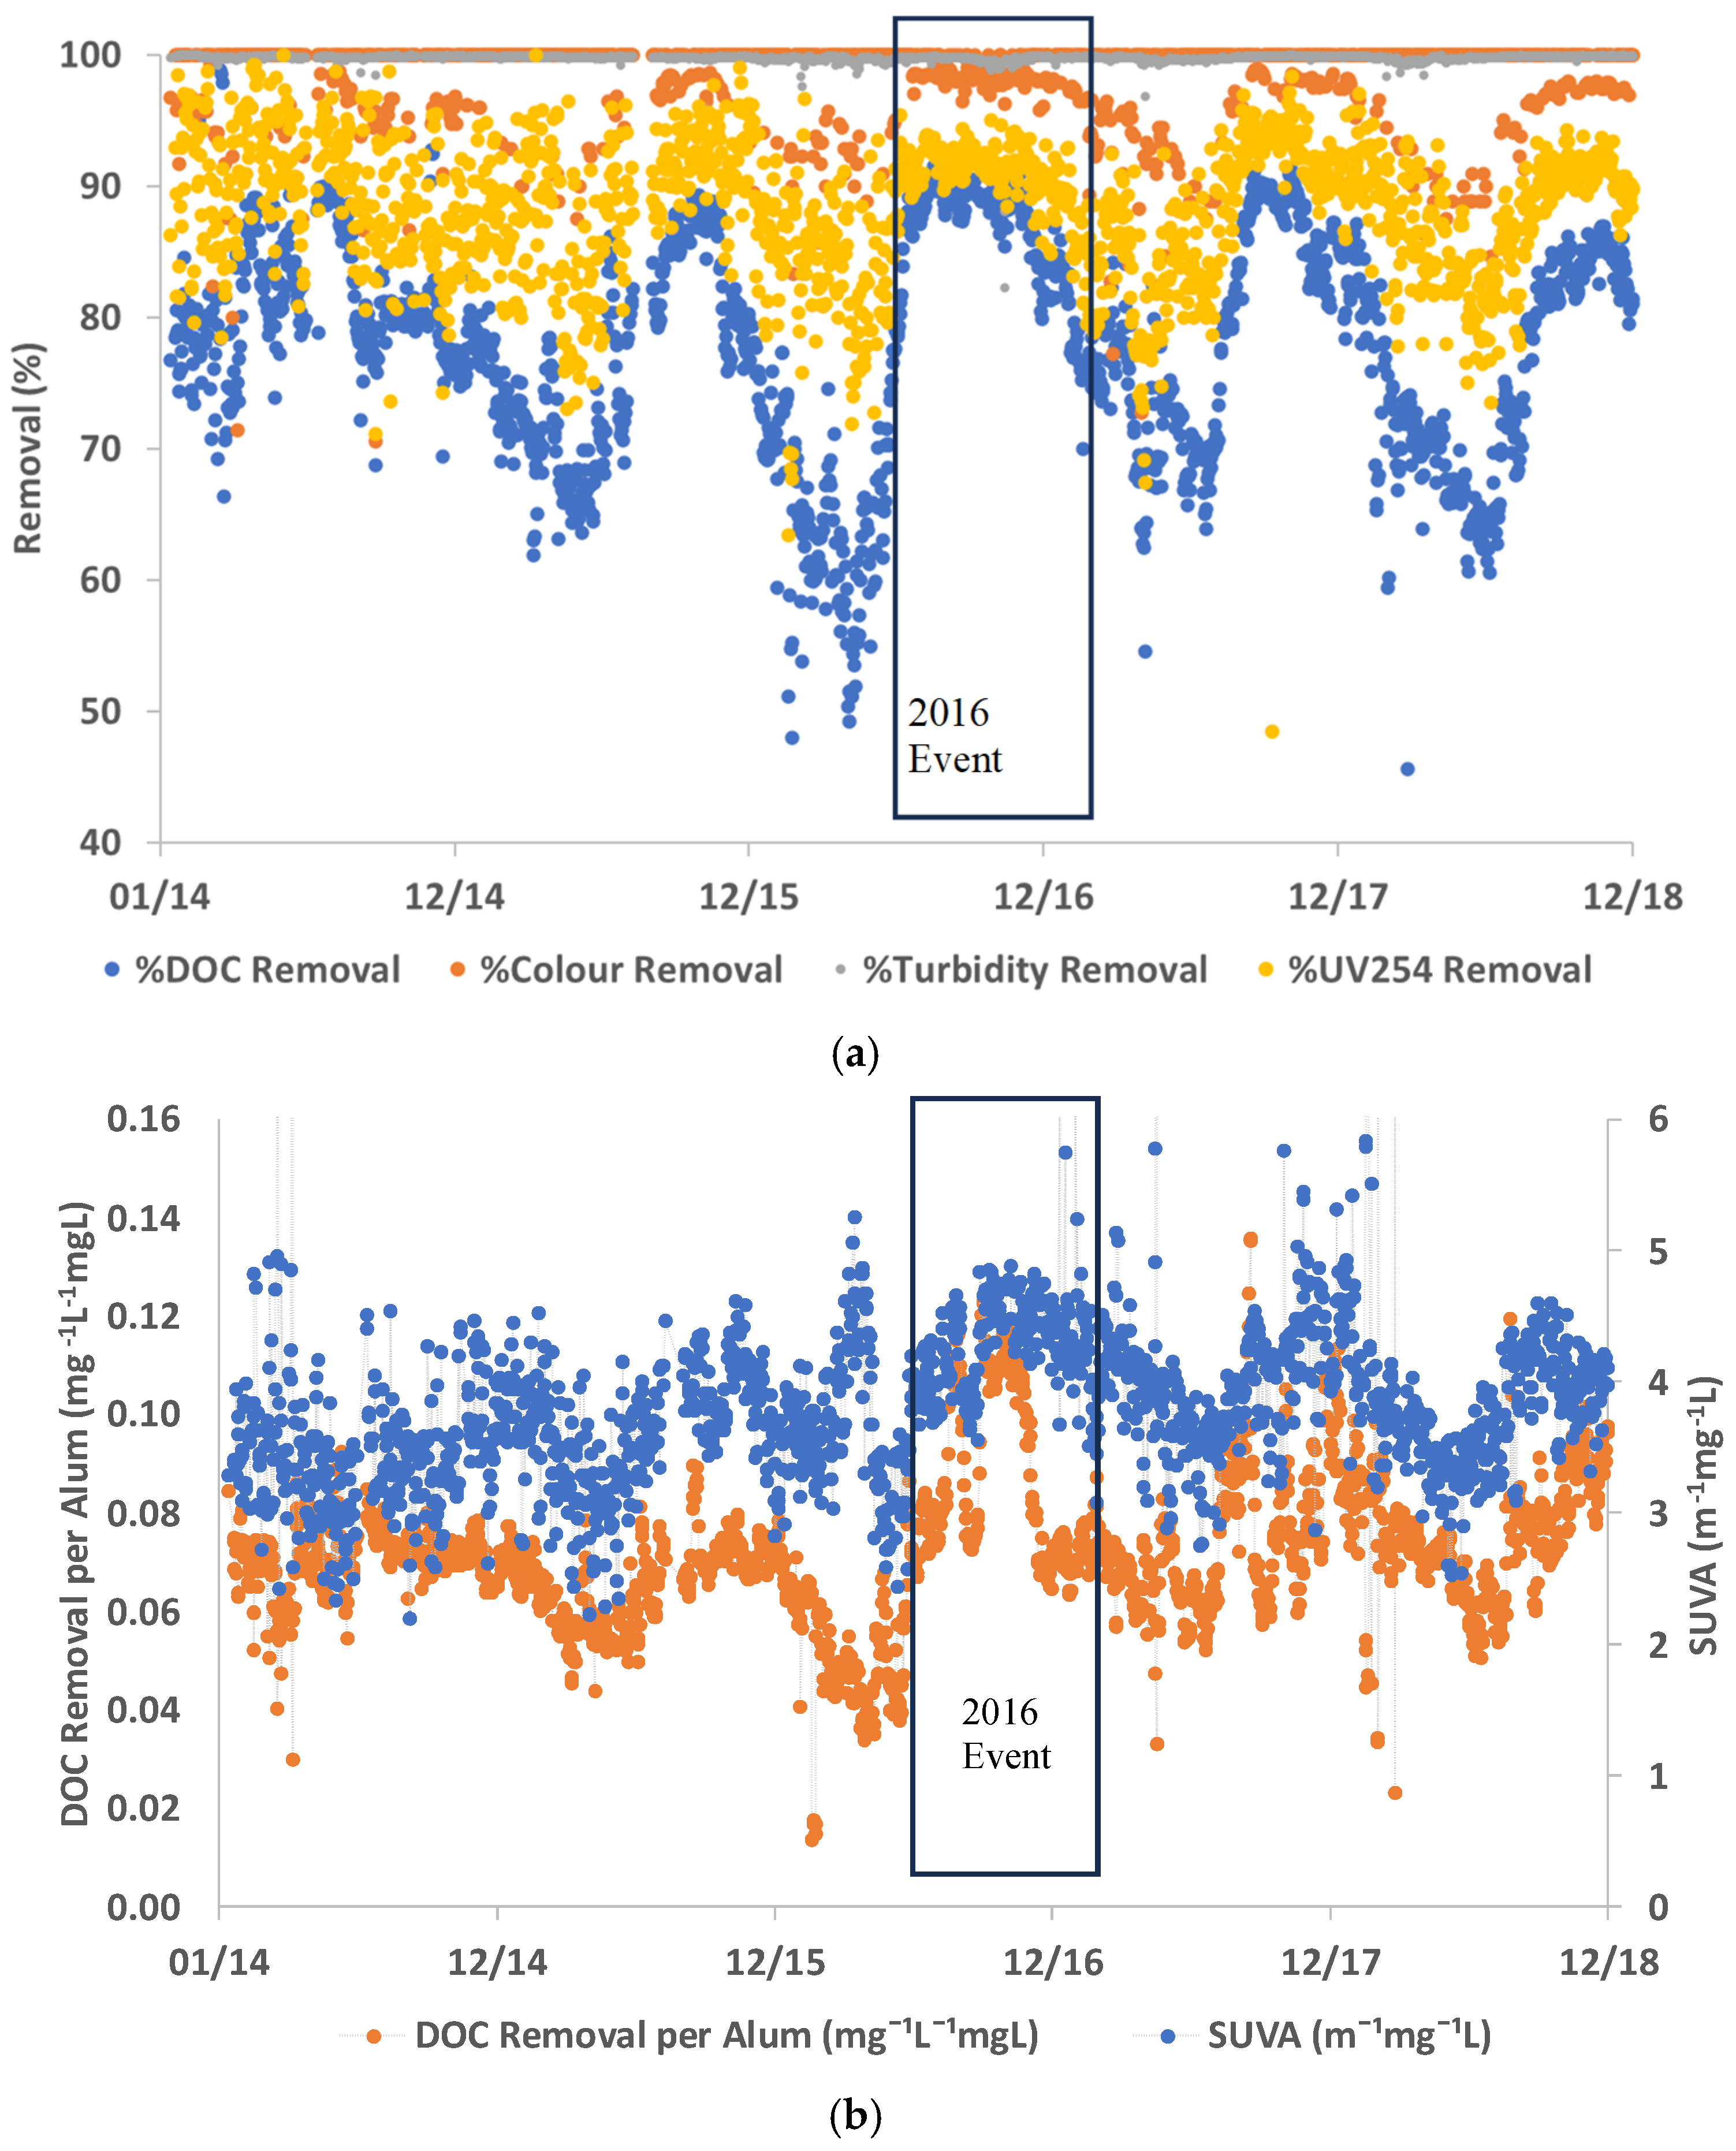
The treatment performance was assessed based on actual % removal of DOC, UV
254, colour, and turbidity (
Figure 6a). Both turbidity and colour showed excellent removal and achieved 99.7% and 98.6% average removal, respectively. UV
254 had an average removal of 88.3% while DOC had an average removal of 78.0%. In general, UV
254 is expected to have a higher % removal compared with the DOC for the same alum dose; this is in-line with the earlier findings [
14,
15]. Upon observation, both UV
254 and DOC had lower average % removal compared to turbidity and colour; in some periods, DOC removal dropped to around 50% (the lowest DOC removal was 45.7%). The turbidity, colour, UV
254, and DOC removal were in the range of 82.2–100%, 70.6–100%, 48.5–100, and 45.7–98.9%, respectively. When comparing % removal (difference between raw water and treated water) before and after the “black water” events in the study period, even when the raw-water DOC and UV
254 levels increased during the events (
Figure 6a), the % removal was higher than before the event. Higher DOC and UV
254 levels were observed in the treated water during the “black water” periods compared with the normal periods. This could be improved by optimised treatment to increase the removal of both parameters.
In relation to the 2016 event, all four water quality parameters have shown good % removal prior to the event. In fact, both DOC and UV254 showed even higher removal during the event, which indicated that the operators responded to the water quality change by using a different operation mode, such as a higher dose to ensure that they met the treated water quality target, or by introducing additional treatment, including PAC dose (to be further discussed later). Depending on how the targeted treated water quality was set, whether it was based on % DOC removal or treated water DOC concentration, it would be good to understand these water quality characteristics to ensure the lower DOC and UV254 in treated water can be achieved during “black water” events.
During the 2016 event, DOC removal per alum was higher (0.12 mg/L of DOC removed by 1 mg/L of alum) and the average DOC removal per alum was 0.07 mg/L of DOC removed by 1 mg/L of alum) over the entire study period, which indicated a better removal was achieved with the same alum dose (
Figure 6b). In other periods, DOC removal was between 0.04 and 0.06 mg/L of DOC removed by 1 mg/L of alum. This can be explained by using the SUVA value to reflect the NOM character: SUVA during “black water” events had a high SUVA range, where it was up to around 4.5 m
−1mg
−1L. Meanwhile, during the “non-black water” event period, the SUVA was between 3.0 and 3.5 m
−1mg
−1L. Organics with higher SUVA can be removed readily by coagulation.
3.5. Operator Response with and Without the Support of Online Water Quality Monitoring System
In this study, the WTP has an online water quality monitor installed and is able to display real-time water quality data to assist operators. In
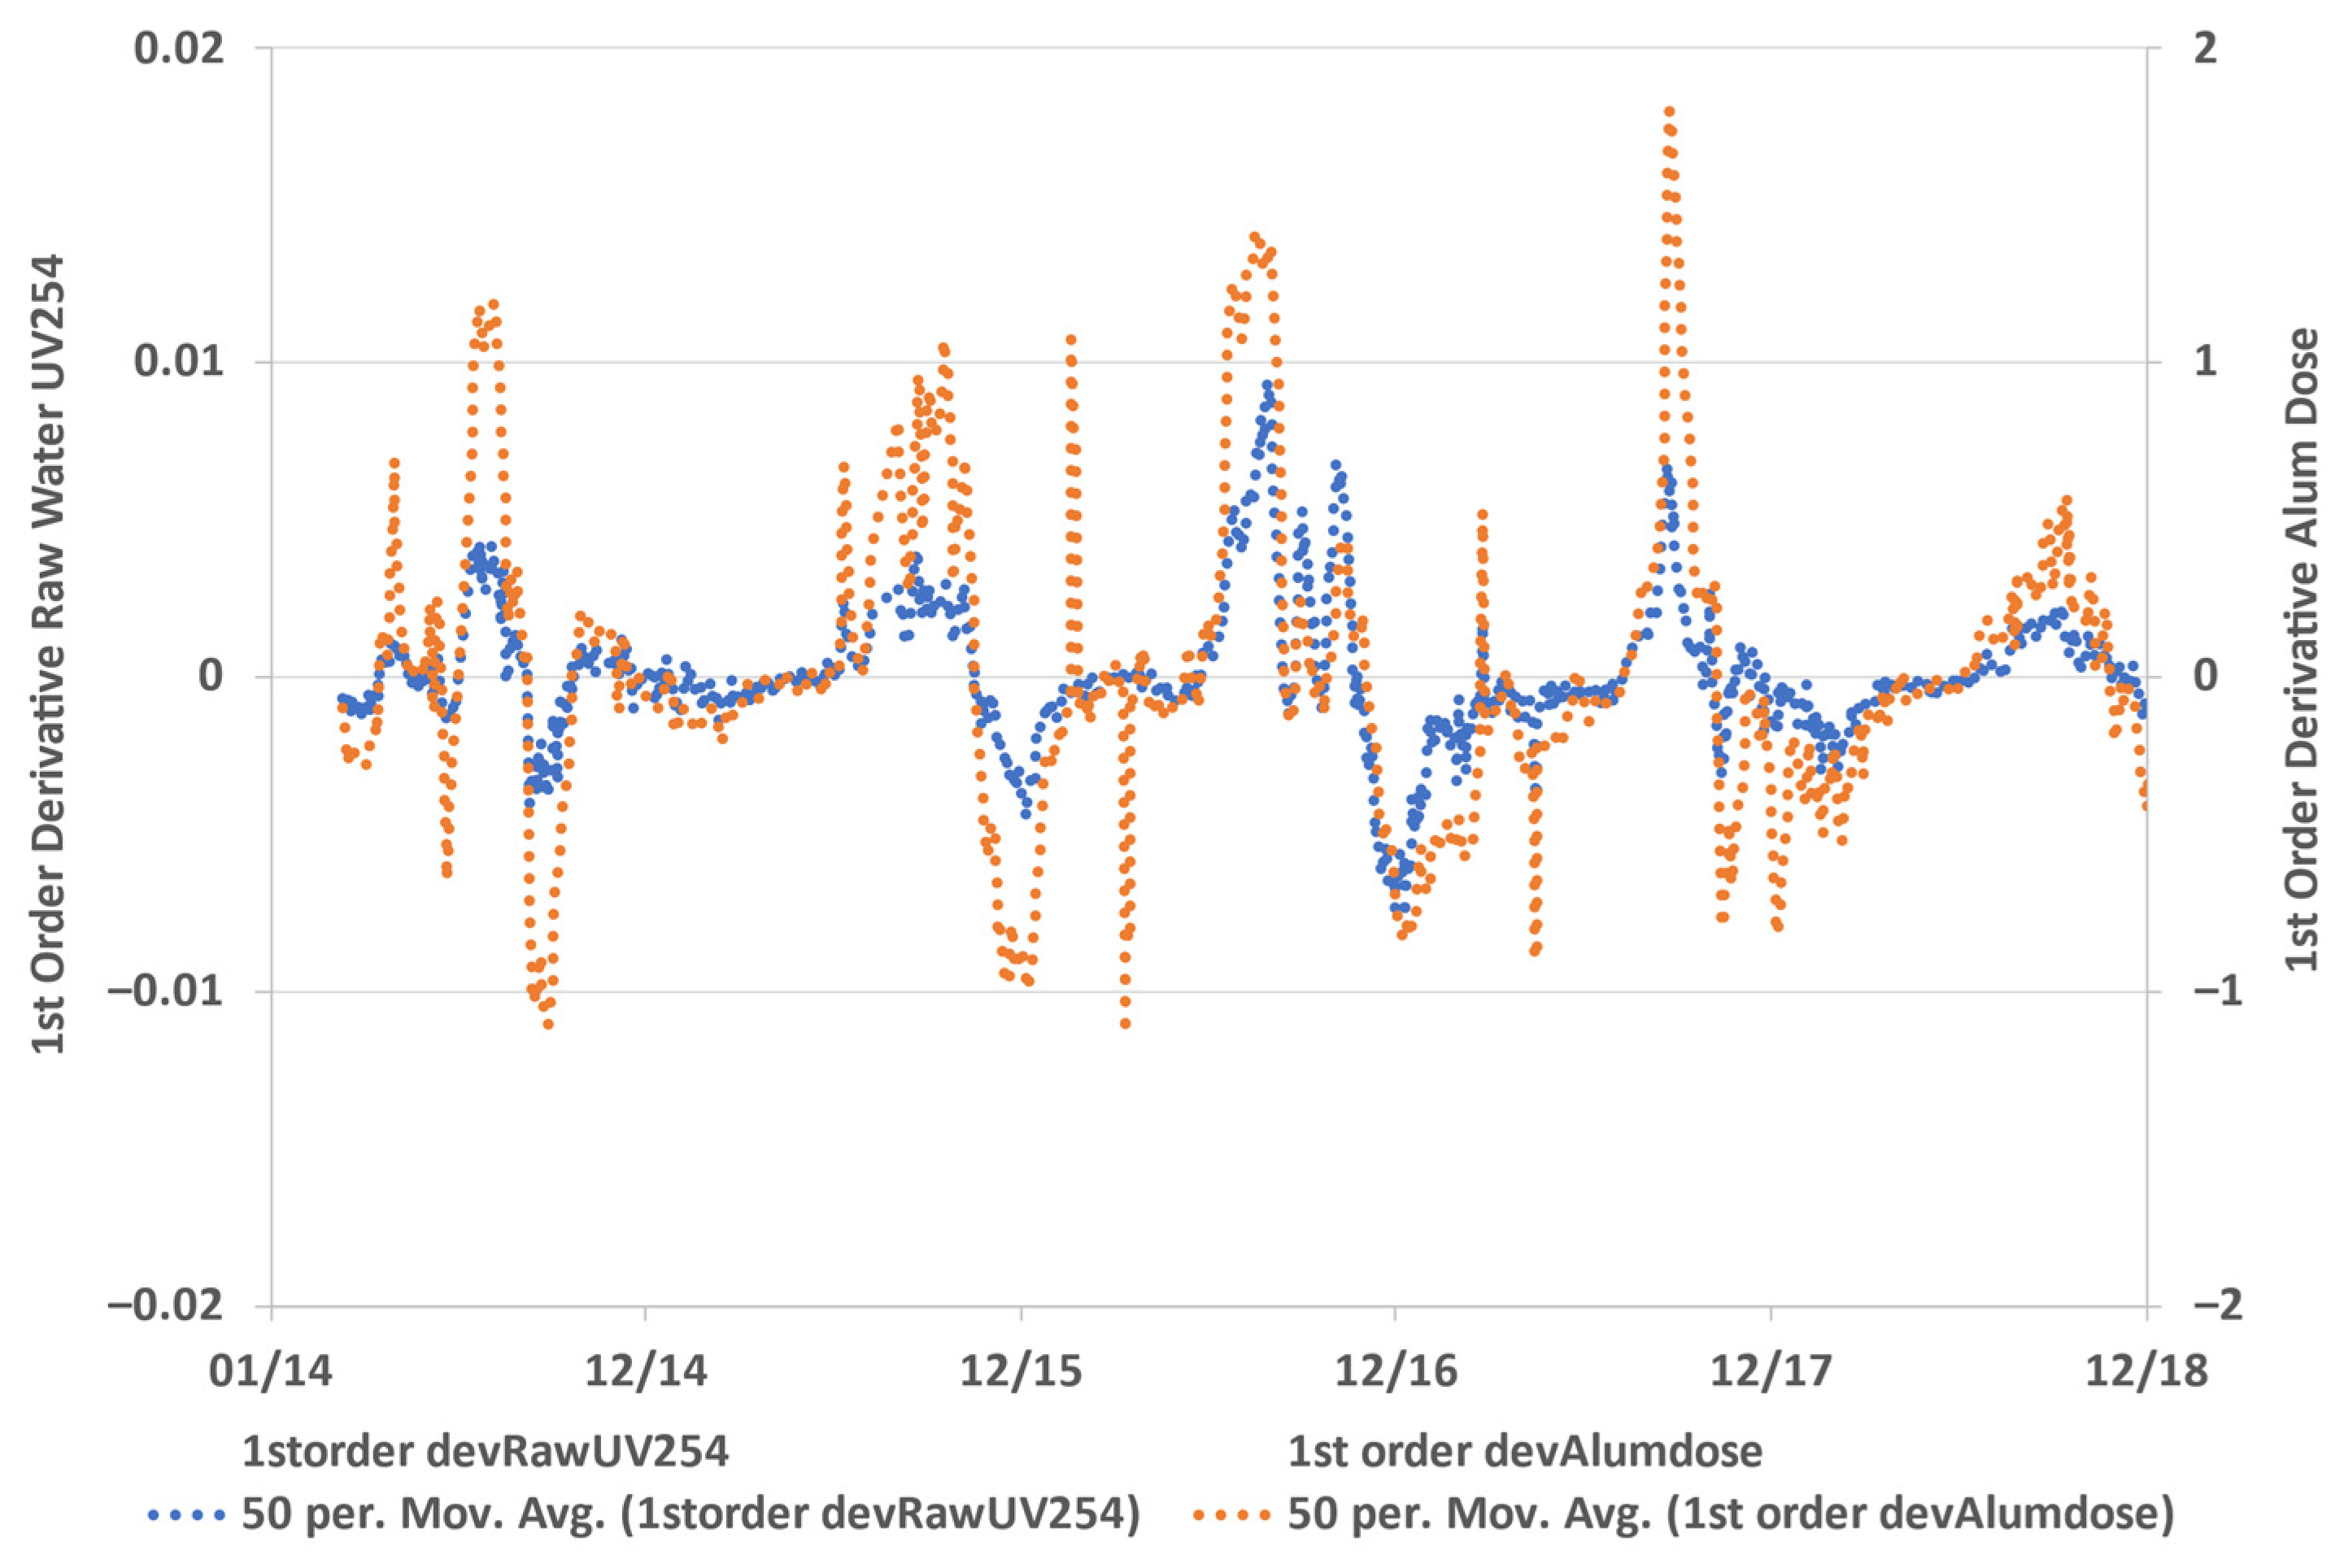
Figure 7, a 1st-order derivative is used to show the operator response (plant dose change) against water quality change; in this case, UV
254 was used. On the positive side of the y-axis (above zero) in
Figure 7, it is referring to either raw-water UV
254 or plant alum dose increase; on the negative side of the y-axis (below zero), it refers to raw-water UV
254 decrease or plant alum dose decrease.
The fact that there was no lag between the two curves indicated that the operator adjusted the dose immediately when water quality changed (just only one or two occasions of time lag). This response was different from an earlier (Barossa WTP) experience [
21] when operators were using jar-testing for optimisation, where a time lag was observed. This can be attributed to the use of an online water quality monitoring system, which provided immediate access to water quality change. This would be a different situation compared with that of the Barossa WTP case, in which their operations rely heavily on grab sample monitoring that delayed the response of the operators. The use of real-time water quality data is useful in terms of process control. WTP operations rely on the results of jar-tests to adjust coagulant doses when raw water quality changes, particularly for regional water utilities. However, when water quality events occur, operators often cannot adjust chemical doses quickly because jar-tests take hours, and repeated jar tests are often required. With online water quality monitoring instruments combined with coagulant dosing prediction software, operators can make dosing adjustments with greater confidence without worrying about under- or over-dosing, which may put additional constraints on the treatment process [
4]. Findings of a previous study showed that operators in South Australia have great confidence in using the WTC-Coag software for coagulation control [
21].