Article

An Integrated Life Cycle Assessment Model for the Carbon Storage Cycle of Wood Products: A Case Study of Medium-Density Fiberboard in China


1
Yunnan Provincial Key Laboratory of Wood and Bamboo Biomass Materials, Southwest Forestry University, Kunming 650224, China
2
Key Laboratory of Bio-Based Material Science and Technology of Ministry of Education, Northeast Forestry University, Harbin 150040, China
*
Author to whom correspondence should be addressed.
These authors contributed equally to this work.
Sustainability 2026, 18(6), 2681; https://doi.org/10.3390/su18062681
Submission received: 7 February 2026 / Revised: 3 March 2026 / Accepted: 6 March 2026 / Published: 10 March 2026
(This article belongs to the Special Issue Sustainable Homes of Tomorrow: Innovations in Materials and Design)

Abstract

Conventional life cycle assessment (LCA) of wood products often lacks a dynamic representation of biogenic carbon flows, leading to an oversimplified account of their climate impact. This study introduces a novel methodological framework by integrating a four-stage carbon storage cycle (carbon sequestration, first carbon emission, extension of carbon storage, and second carbon emission) with the ISO 14067:2018 standard for product carbon footprinting. We developed a transparent calculation model to partition CO2 emissions across production, transportation, and disposal stages using a representative medium-density fiberboard (MDF) production case in China for empirical validation. The results reveal a total emission of 32.8135 kg CO2/m2, with a striking 59% originating from the disposal and recycling stage, overshadowing production (39%) and transportation (2%). This finding underscores the critical, yet often neglected, role of end-of-life management in the carbon footprint of manufactured wood panels. The study provides a replicable template for dynamic carbon accounting of wood products.

1. Introduction

Trees are the biomass with huge carbon accumulation and the highest carbon storage in terrestrial ecosystems, but the carbon storage function of trees is not stable, and it will be changed by the influence of factors such as climatic conditions, standing conditions, cultivation measures, etc. For the wood after harvesting, after being processed into wood products, it will also store carbon, so another stage of carbon storage in the wood is in the wood products. At the United Nations Conference on Climate Change (COP17) in Durban, South Africa, in November 2011, it was proposed that a new plan for evaluating the storage of carbon in wood products should be developed [1]. Based on Guo et al.’s research on the carbon storage function of wood [2,3,4], it provides a scientific theoretical basis for the study of the carbon storage law of wood resources. In this study, the carbon storage function of wood is investigated and discussed, and the impacts on the environment caused by the processing and manufacturing process and the use of wood products are effectively evaluated by analyzing the life cycle of wood products, which lays a theoretical foundation for further evaluating the carbon storage function of wood products.

1.1. Carbon Storage and Emission Processes in Wood

In order to reduce carbon emissions, it is important to know exactly how much carbon is consumed in what place; that is, the process of carbon storage and emission of wood. The “Carbon Footprint” is due to the ever-increasing greenhouse gases, such as carbon dioxide, in the process of consumption [5]. It refers to the aggregation of greenhouse gas emissions caused by business organizations, activities, products, or individuals through transportation, food production and consumption, and various processes [6,7]. There are many different definitions of the “carbon footprint” of wood, but from the perspective of product assessment, it is generally recognized as a methodology used to assess the level of greenhouse gas emissions throughout the life cycle of a product, from raw materials to finished products [8,9,10].
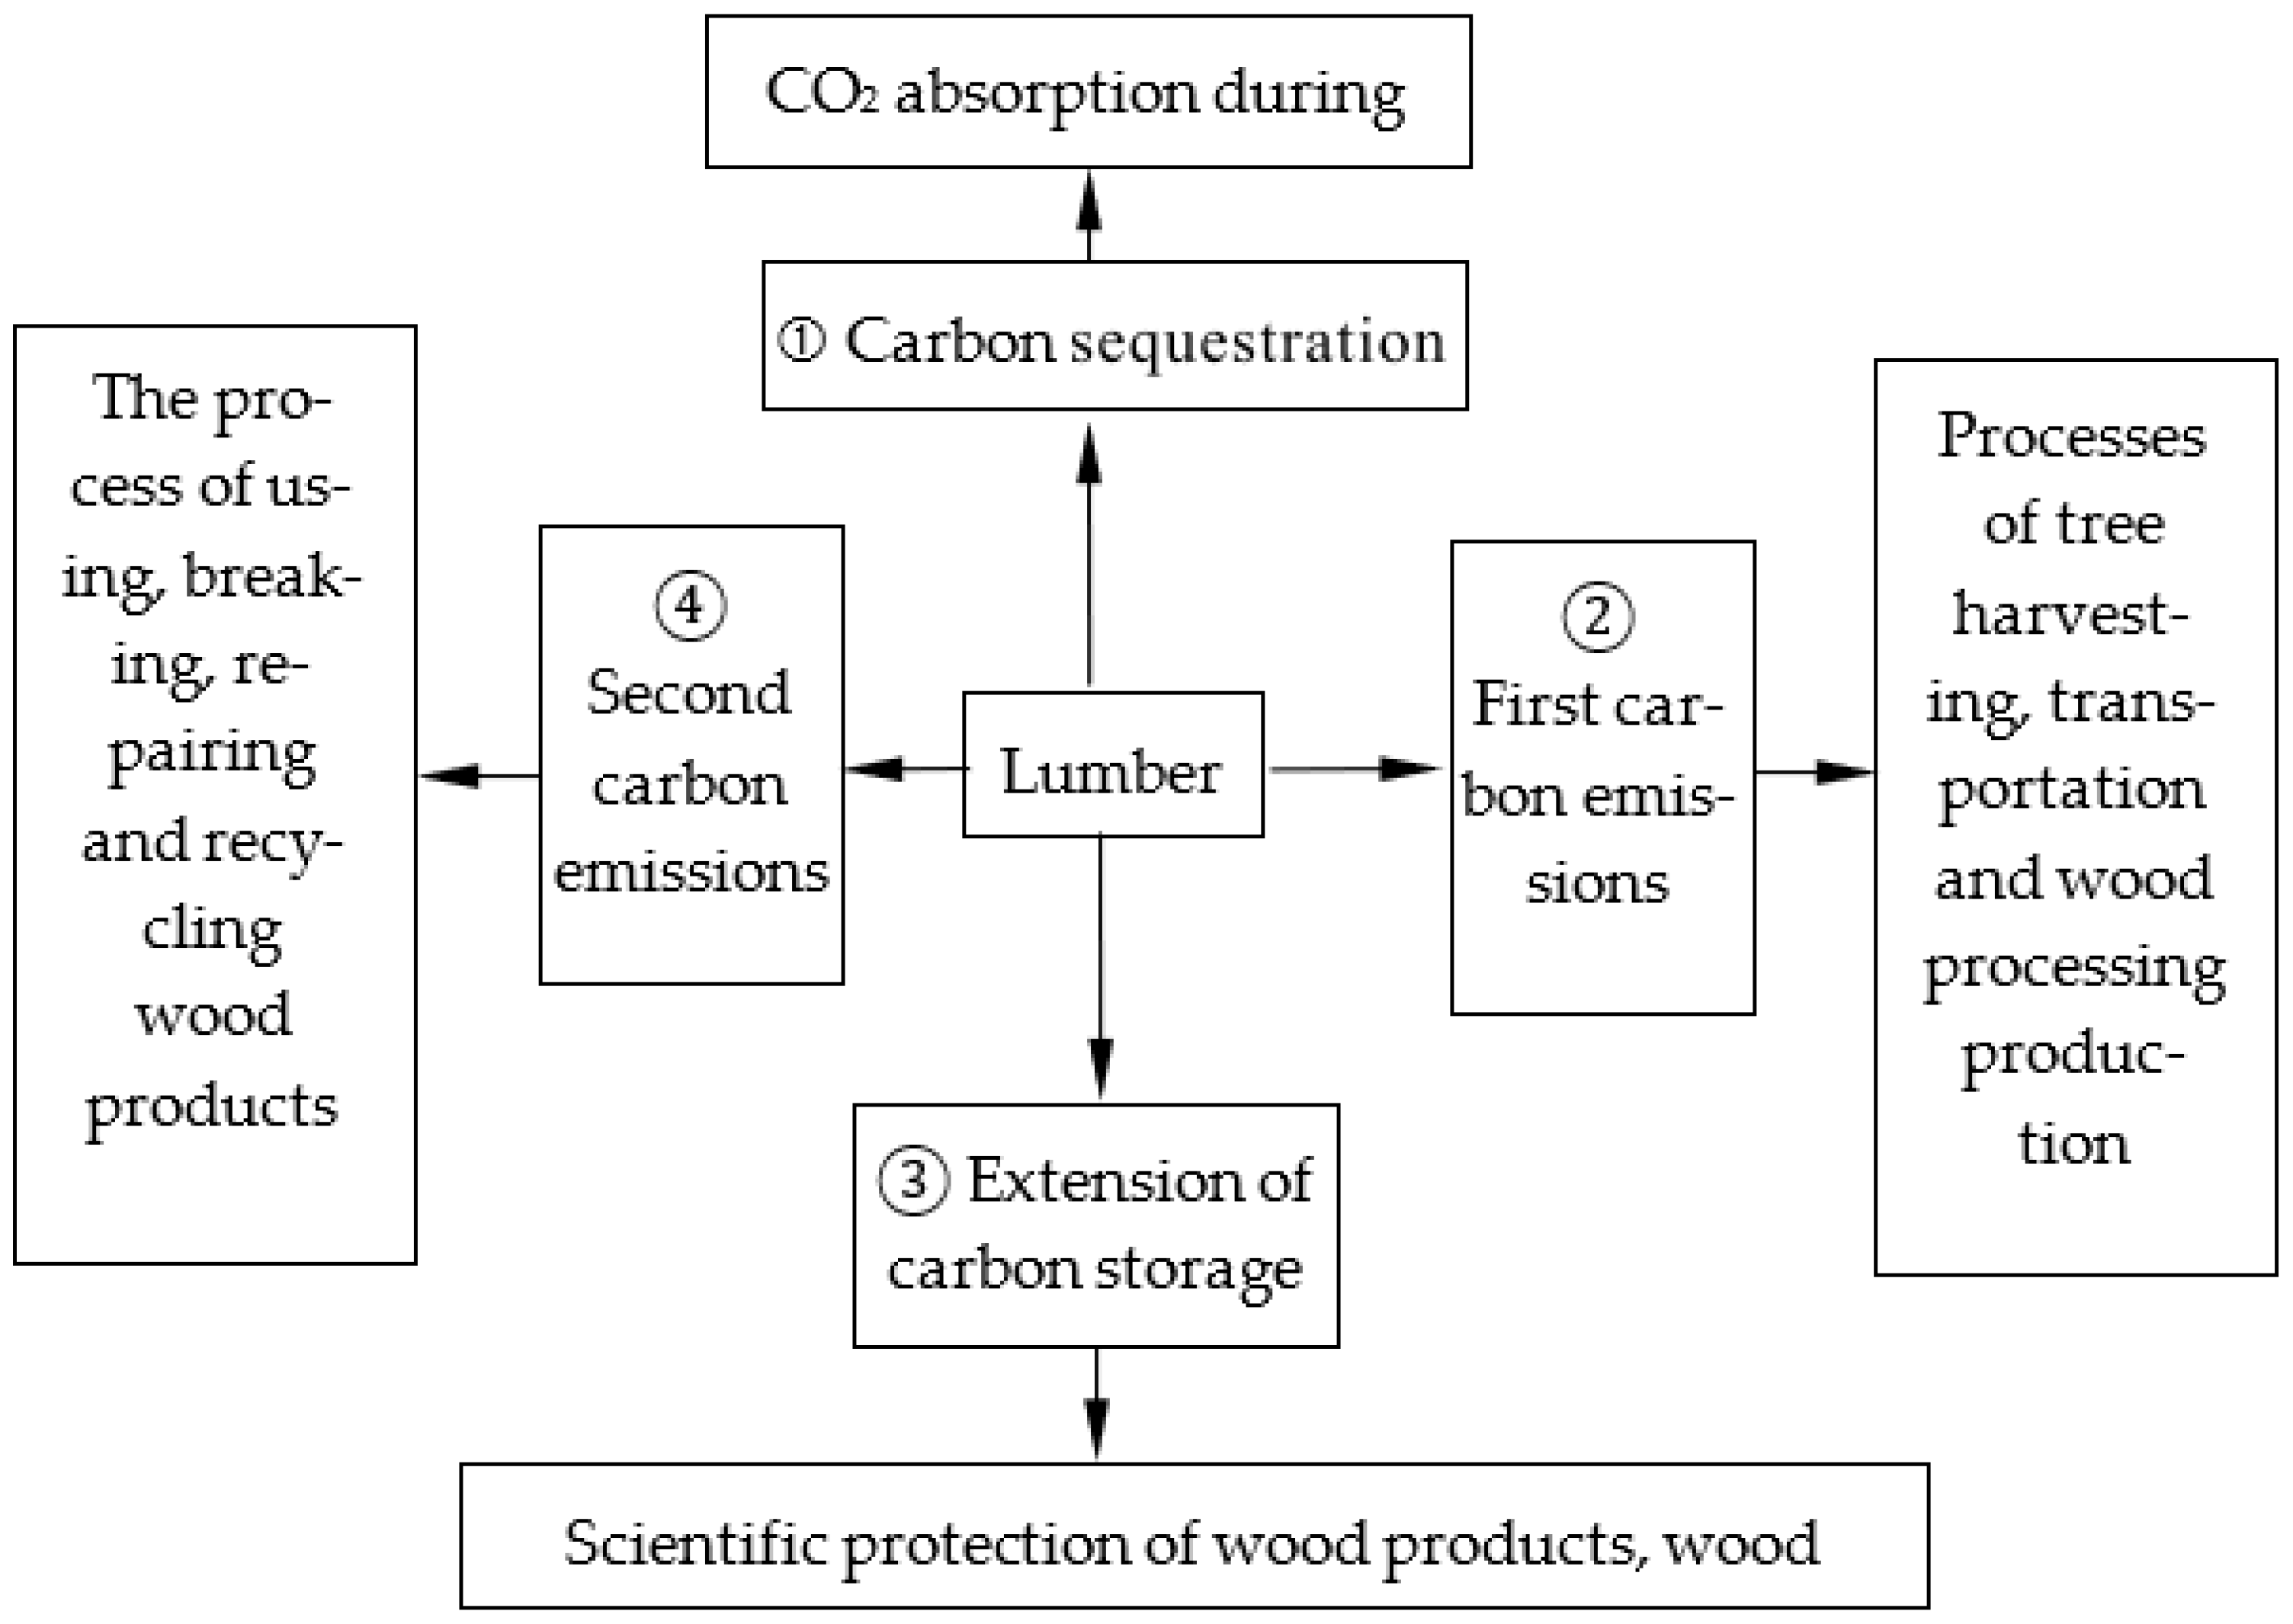
Figure 1 shows the specific process of carbon storage and emission of wood, i.e., the process of carbon footprint. It can be seen that the carbon footprint of wood is mainly divided into four processes. First, in the process of tree growth, photosynthesis is greater than respiration, and trees absorb more CO2 faster, which is known as “carbon absorption”. When the respiration of trees and the photosynthesis of the amount of carbon are gradually similar to the growth of trees slowing down, carbon absorption gradually becomes carbon emissions, so the carbon footprint is not a carbon footprint. Therefore, in order to reduce CO2 emissions, we should choose a reasonable rotation period for trees to increase their carbon storage. Secondly, a certain amount of CO2 will be released in the process of cutting down timber, transportation, and timber processing, which is the “first carbon emission process”. Thirdly, the timber will be processed into wood products in a timely manner through scientific protection, such as fire-retardant products, which will be protected by the government. Third, the timely processing of wood into wood products, through scientific protection, such as a fire retardant, anticorrosion treatment, etc., can reduce the opportunity for carbon release, known as the “extension of carbon storage”. Finally, in the process of using wood products, bacterial and fungal corrosion, insect eating, and other reasons will cause issues with wood products, such as breakage, cracks, etc., which will release part of the CO2, and, at the same time, the repair and recycling of wood products will release a certain amount of CO2. At the same time, when wood products are repaired and recycled, part of the CO2 will be released, and this process is called the “second carbon emission”; this whole process is the carbon footprint of wood.
The model depicts the dynamic carbon flow in wood products: ① carbon sequestration (biogenic carbon uptake during tree growth); ② first carbon emission (from harvesting, transport, and processing); ③ extension of carbon storage (during the product’s service life, potentially extended through protection); and ④ second carbon emission (from disposal, recycling, or degradation).
In the whole process of carbon storage and emission of wood, plantation forest wood has experienced the process of carbon absorption–carbon emission–carbon storage–carbon emission from growth to demise. It can be inferred from this that improving the harvesting efficiency of forest trees, reducing carbon emissions during processing and transportation, increasing the utilization rate of wood, and extending the lifespan of wood forest products will increase the amount of carbon stored in forest trees [11]. Also, since wood products emit less greenhouse gases, such as carbon dioxide, during their life cycle than other materials [12], it is evident that the carbon storage of wood products plays a significant role.

1.2. Carbon Storage for Wood Products

1.2.1. Classification of Wood Products

Studies have shown that long-term rational management of forests can effectively sequester carbon inside wood, and wood has good physical and chemical properties and unique environmental properties. Processing wood into wood products can help reduce the concentration of CO2 in the atmosphere [13]. As for wood products, by extending their service life and increasing the time of their carbon sequestration, the efficiency of carbon storage and sink can be effectively improved [14]. Therefore, wood products occupy a very important position in the saving and recycling of wood resources.
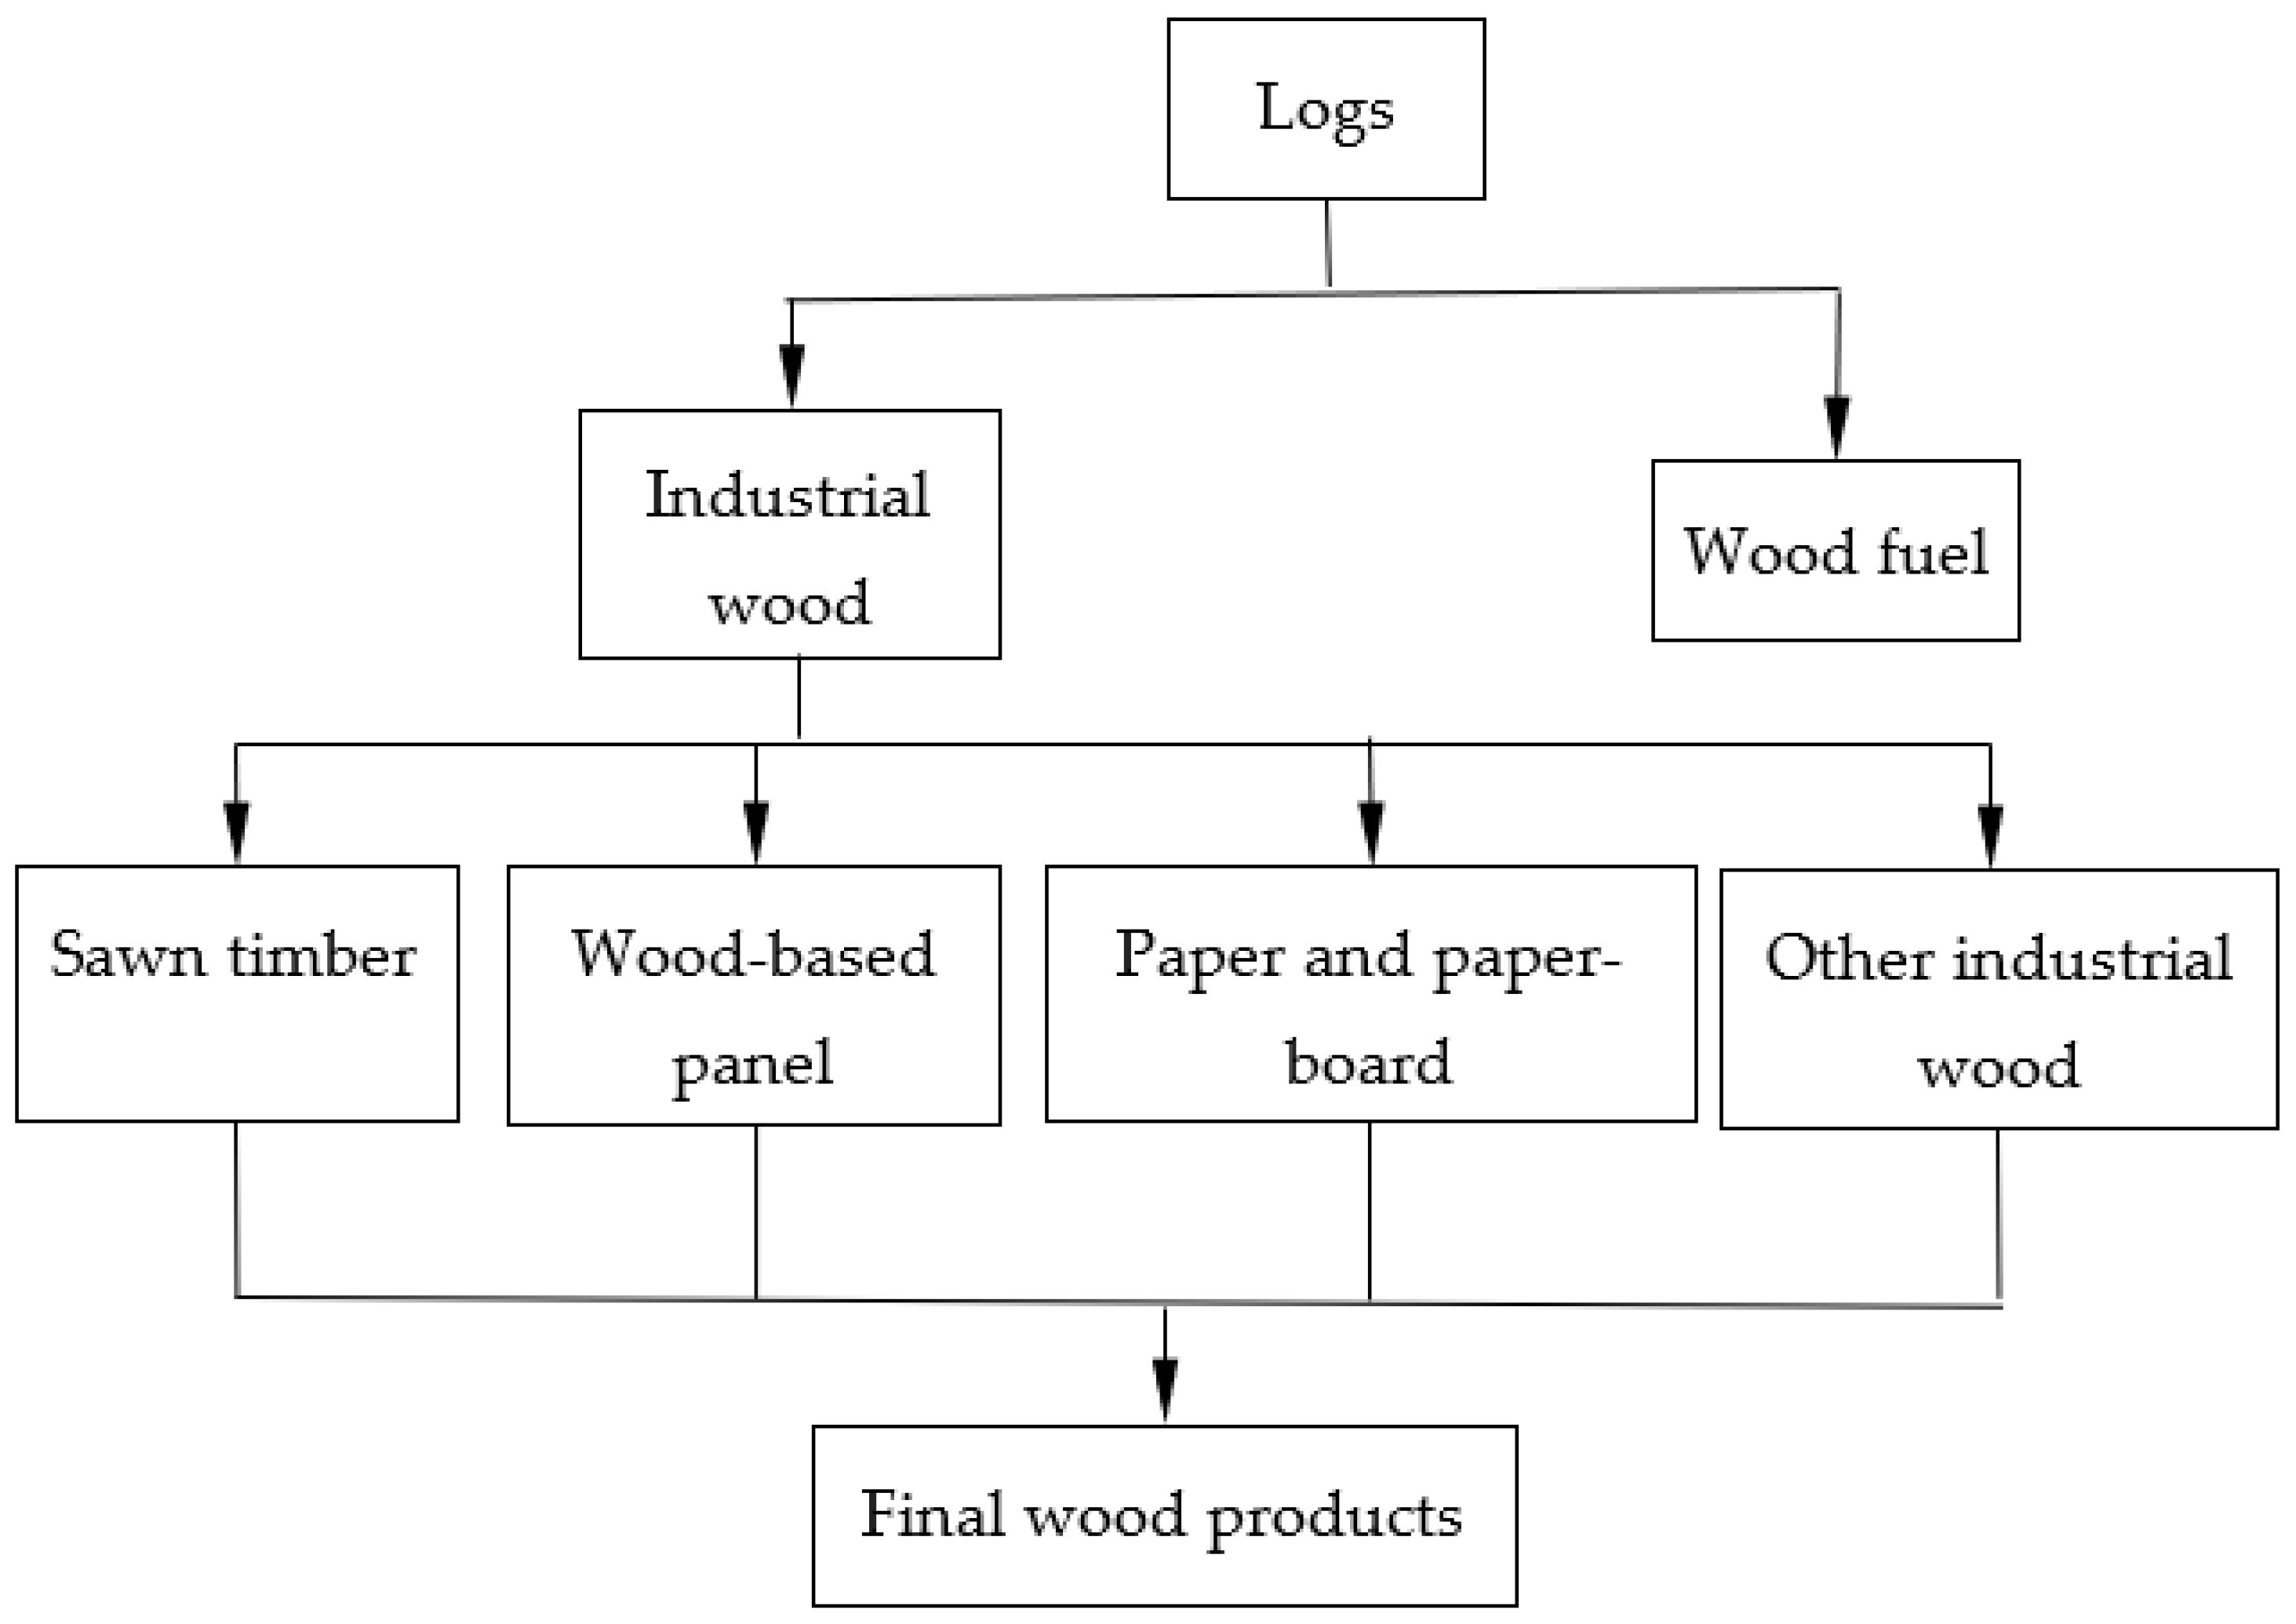
According to the current research on the classification of wood forest products, the classification is mainly based on the definition of the Food and Agriculture Organization of the United Nations (FAO) for wood forest products [15]; the data of this classification method is easier to obtain and easy to calculate. In this study, we will then combine the use of the product to classify the wood products, as shown in Figure 2.
This classification framework, adapted from FAO definitions [15], facilitates the assignment of product-specific parameters (e.g., service life, conversion factors) for carbon stock estimation, as utilized in Table 1 of this study. Abbreviations: MDF (medium-density fiberboard) falls under the “Wood-based panel” category.
The categorization of wood products reveals that wood and wood products are able to be used in a wide range of applications, such as home building materials, furniture, and paper. Although wood products are an extension of wood carbon storage, they cannot store carbon forever. In estimating the changes in carbon storage of different wood products in China, each conversion factor between specific parameters is listed in Table 1 with reference to existing research results.

1.2.2. Carbon Storage of Wood Products

Wood products have good carbon storage capacity and environmental characteristics, which can be made to store carbon for a longer period of time by improving the processing efficiency and extending the service life of wood products, thus slowing down the emission of greenhouse gases [18,19]. A workshop on the methodology of carbon stock measurement for wood forest products was held in 1988 in Dakar, Senegal, where alternatives to the three other methods were proposed as alternatives to the IPCC default method, i.e., the carbon stock change method, the atmospheric flow measurement method, and the production measurement method [20]. Scholars at home and abroad have estimated the carbon stock of wood products based on the default value using the atmospheric flux measurement method and the method of stock change, Pingoud, through the statistical data, conducted a systematic analysis, and determined that the annual growth of the global carbon stock of wood products is 40 Mt. Ruan Yu et al. estimated the global carbon stock of wood products using the statistical data of the FAO and statistical data released by our country, and using the atmospheric flux method, they determined the method of change in carbon stock and the method of the producing country. Ruan Yu et al. estimated the carbon stock and its change in wood forest products in China using the atmospheric flux method, the carbon stock change method, and the method of producing countries [21].
At present, some foreign scholars use life cycle assessment to study the potential impact of wood products and wood waste products on the greenhouse effect, which cannot only assess carbon dioxide emissions but also assess the emissions of methane, hydrogen fluoride, and other greenhouse gases and provide a comparative analysis of different processing methods of carbon emissions, assessing the total impact on the environment in the processing of wood products. It can be seen that the method has been generally recognized worldwide and is the inevitable trend of current research and development. In recent years, the methodology for assessing the carbon flows in harvested wood products (HWPs) has undergone significant refinement, driven by updates to international guidelines and a growing body of national-level research. Ref. [22] provides critical updates for national greenhouse gas inventories, offering refined methodologies for estimating carbon stock changes and emissions from HWPs, particularly emphasizing the production approach. Concurrently, research in major timber-producing countries has advanced considerably. For instance, recent studies in Russia have focused on refining the country’s greenhouse gas inventory for the HWP sector, addressing specific data challenges and improving the accuracy of carbon stock change estimates [23]. Similarly, updated assessments for Canada and the United States have incorporated country-specific parameters for HWP half-lives and end-use pathways, revealing significant carbon sinks in long-lived products [24]. In China, beyond the work cited in this study, newer analyses have begun to integrate dynamic material flow analysis with LCA to better capture the cascading use and final fates of wood products [25]. This growing body of international research underscores the necessity for a dynamic, stage-specific approach, which this study aims to provide through its integrated LCA model. Therefore, the method of life cycle assessment can be used to evaluate the carbon emissions of the carbon storage cycle of wood products in order to fully understand the carbon storage function of wood products.

1.3. Our Innovative Contribution and Paper Structure

This study develops an integrated evaluation model whose primary innovation lies in coupling the conceptual four-stage carbon storage cycle with the rigorous quantification framework of ISO 14067:2018. This approach enables a stage-specific attribution of emissions, moving beyond static accounting to explicitly model the critical end-of-life phase. Our work contributes by: (1) providing a methodological template for dynamic carbon accounting of wood products and (2) delivering empirical, China-specific insights for MDF using updated parameters. Section 2 details the materials and methods, Section 3 presents the results, which are discussed in depth in Section 4, and Section 5 concludes the study.

2. Materials and Methods

2.1. The Concept of the Wood Product Life Cycle

For a specific product, its life cycle is the whole process of coming from nature and returning to nature; the concept of life cycle evaluation is to systematically evaluate the whole process of the impact of something from its creation to its demise and eventual disappearance [26,27].
Compared with other materials, the life cycle energy consumption and carbon emissions of wood products are the lowest, which originate from forest resources and have the inherent advantage of energy saving and emission reduction [28,29,30]. As long as wood products are not decayed or burned, there is a carbon storage function, so extending the life cycle of wood products can prolong the time of carbon storage, which can help to reduce CO2 and other greenhouse gas emissions [31,32]. It can be seen that by evaluating the life cycle, the storage and emission of CO2 in wood products can be assessed [33].
In the life cycle of any wood product, there is a useful life, and at the end of which, it enters the carbon phase. At present, there is no relatively uniform standard for the service life of wood products, and it is generally accepted that the service life of fuelwood is about 1 year, that of paper and cardboard is about 20 years, and that of solid wood is about 40 years, and this is only an average value. The longer the service life of a wood product, the longer its life cycle and the longer the carbon storage cycle of the wood; therefore, the service life of a wood product is closely related to its carbon storage cycle, and a longer service life is likewise a contribution to the carbon storage function.
Life cycle assessment (LCA) theory, which first appeared in the late 1960s, is a globally recognized life cycle assessment method [34]; it is mainly used to assess and compare the environmental impacts caused by the inputs and outputs of different materials, products, etc., throughout their life cycle, from the extraction of the resources to their transportation, processing, use, and decommissioning, and finally, recycling or incineration are included in this life cycle [35].
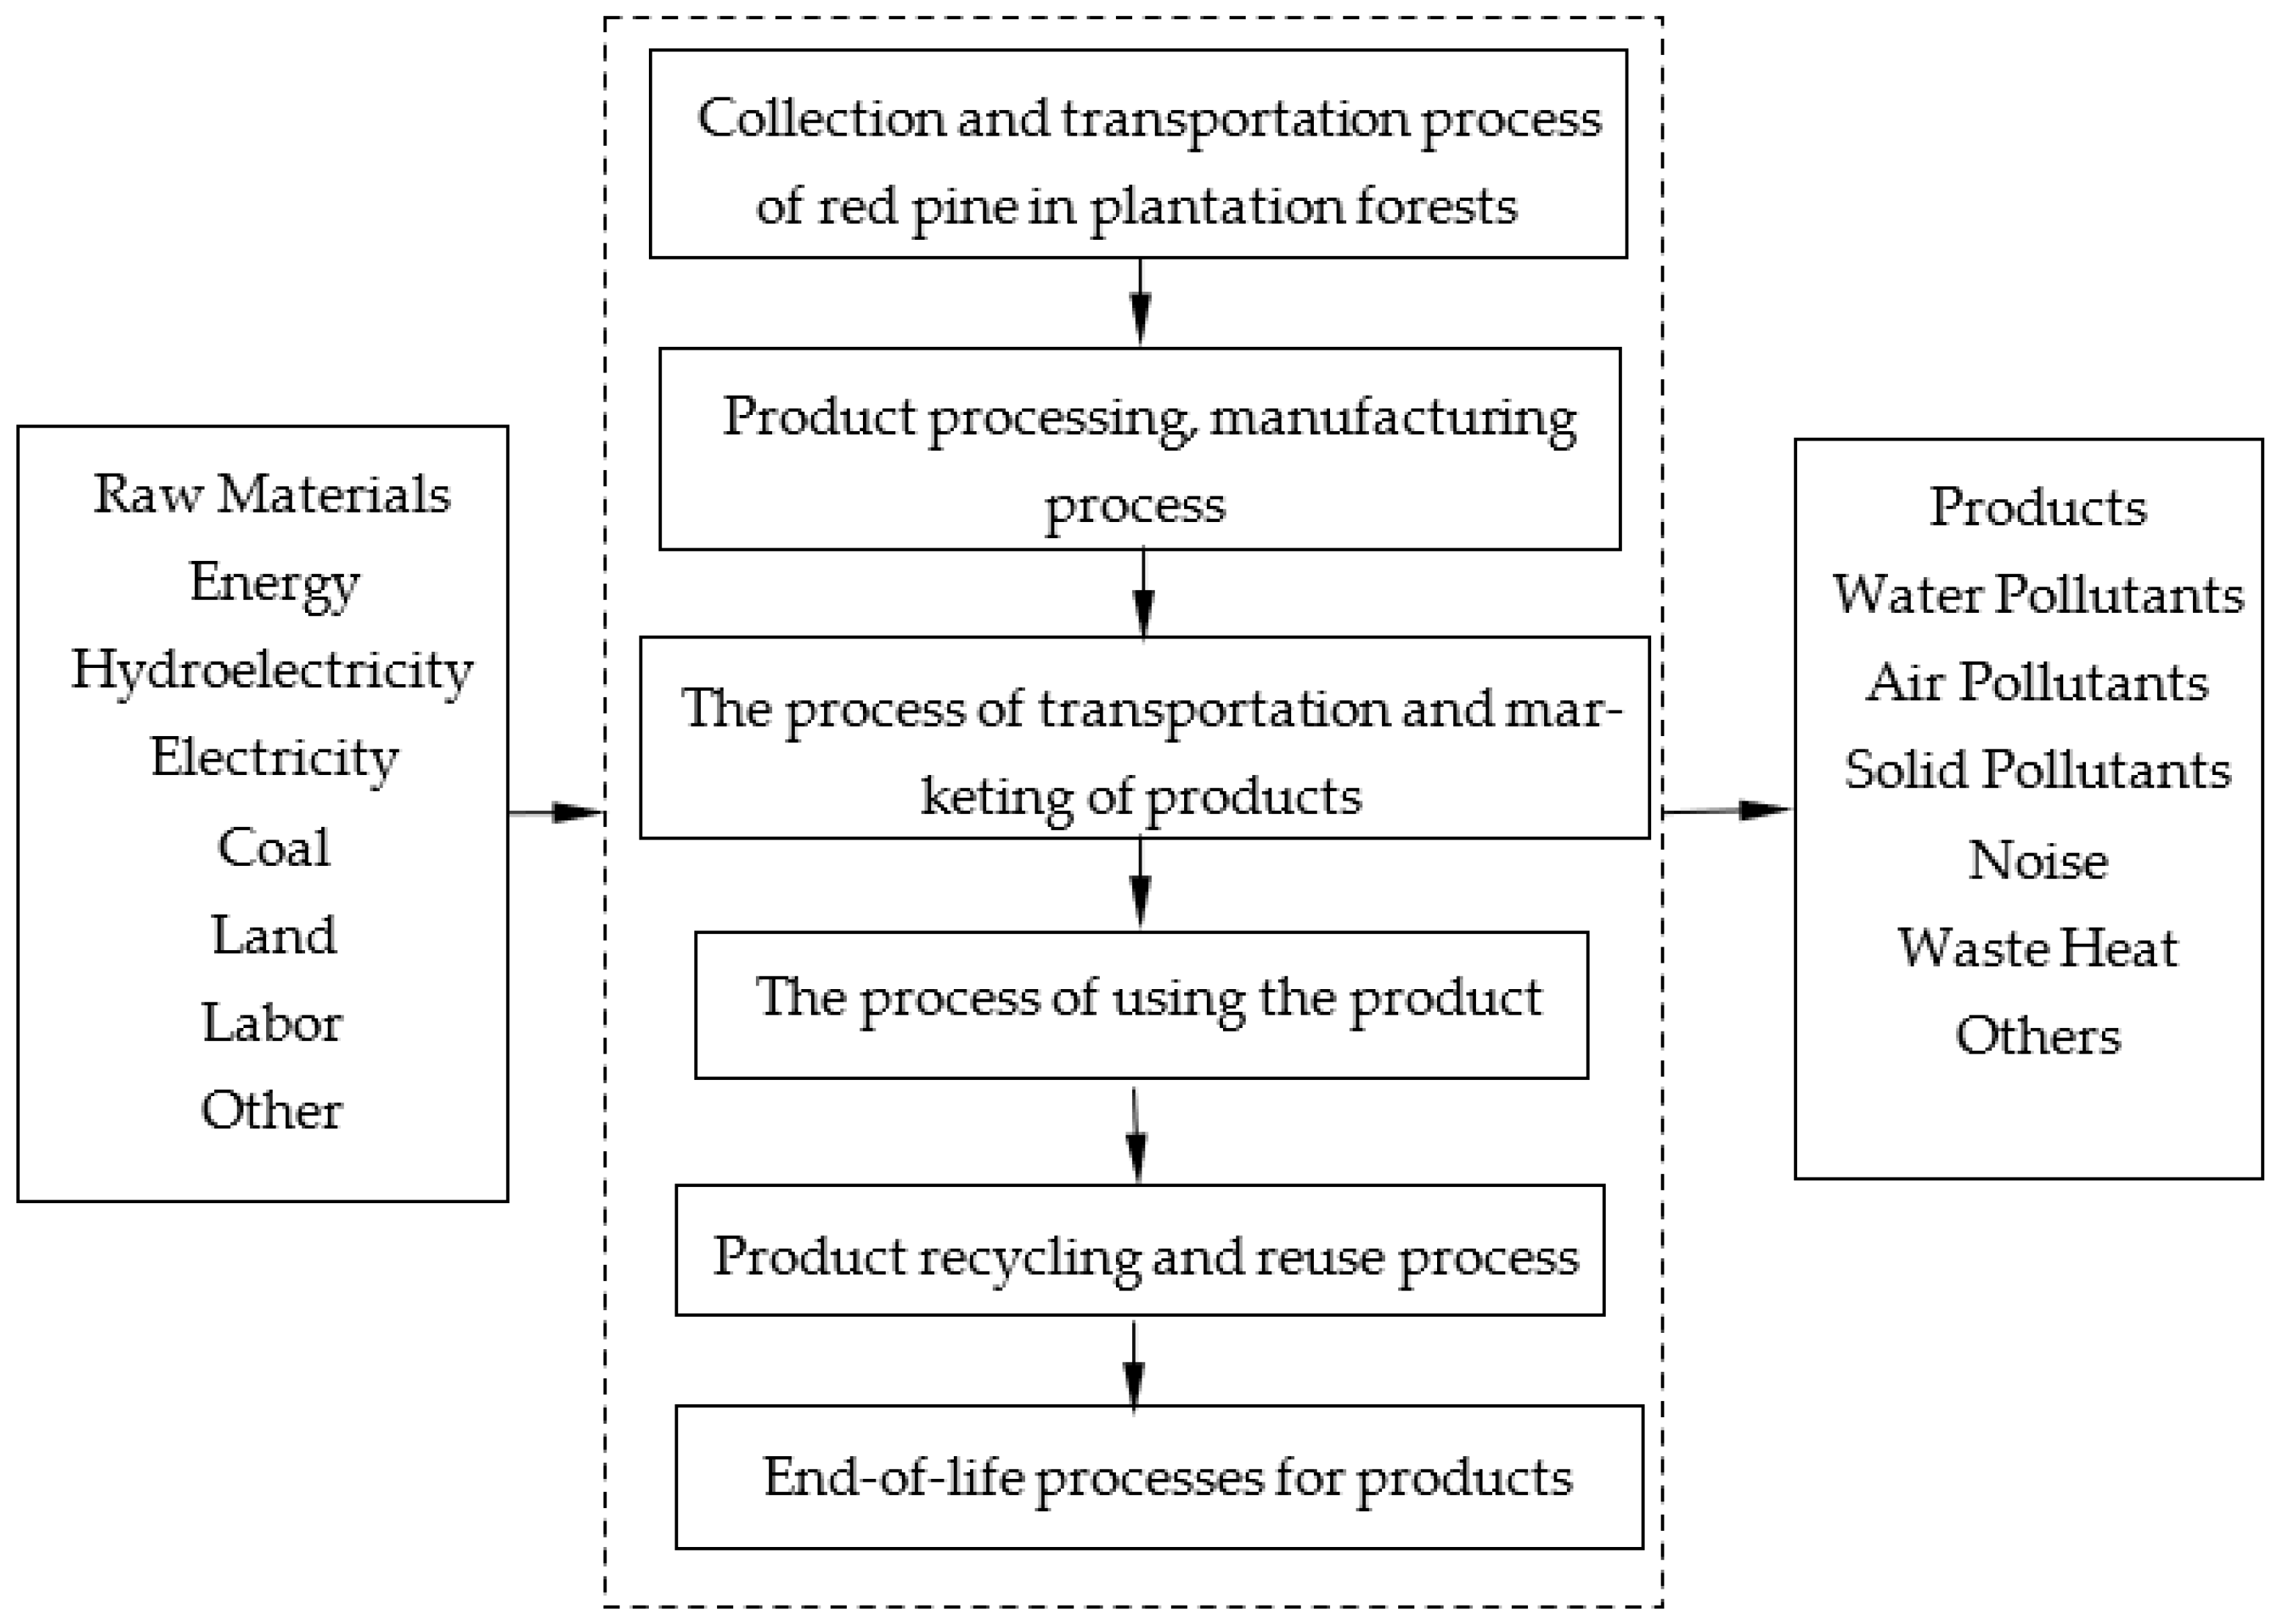
Based on the ISO 14067:2018 specification for the assessment of greenhouse gas emissions within the product life cycle [36,37], the study on the dynamic change in the carbon storage period of wood products covers the whole process of raw material “input–processing–output”. The principle of life cycle assessment is performed by the identification and quantification of raw materials, energy consumption, and pollutant emissions, as well as other factors, to assess the burden of a product, process, or activity on the environment, as shown in Figure 3, showing the whole process of the LCA of plantation red pine wood products. From the time of harvesting, the tree terminates the fixation of its own carbon and becomes a source of carbon emissions. In this process, carbon emissions do not only refer to the carbon released from the decomposition of the tree itself but also include the carbon emissions generated during harvesting and transportation, as well as the carbon dioxide emitted in the processing and manufacturing of the product, the transportation and marketing process, the use of the product, the recycling and reuse process, the end-of-life disposal process, and so on.
The diagram outlines the cradle-to-grave system boundary applied in this study, encompassing all relevant processes from raw material acquisition to end-of-life treatment. It visualizes the input flows (e.g., materials, energy) and output flows (e.g., products, emissions to air and water) considered in the inventory analysis phase of the LCA.
Over the past decade, research on wood LCA has shown that wood has obvious environmental advantages in terms of carbon storage function, processing energy consumption, and recycling; for example, 1 m3 of wood can reduce greenhouse gas emissions, such as carbon dioxide and other greenhouse gases, by 1.9 t when replacing the same volume of non-wood materials [38]. The LCA assessment has shown that, from the point of view of the environmental load value, wood products have an irreplaceably low environmental load value throughout the entire process of raw material acquisition, production and processing, use, and disposal. Moreover, according to the LCA assessment, wood products have an irreplaceable low environmental load value in the whole process of raw material acquisition, production, processing, use, and disposal.

2.2. Evaluation Method for Carbon Storage Period in Wood Products

The development of the calculation model in this study is guided by the principles and requirements of ISO 14067:2018 for quantifying the carbon footprint of products (CFP) [10]. The standard mandates a life cycle perspective, and accordingly, our system boundary—encompassing production, transportation, and disposal stages—is defined as a cradle-to-grave assessment, excluding the biogenic carbon uptake during forest growth as permitted by the standard for specific reporting purposes. The equations presented below operationalize the CFP quantification by allocating the total CO2 emissions (M) to these distinct life cycle stages (M1, M2, M3), in accordance with the standard’s requirement for a comprehensive and attributable inventory.
To bridge the conceptual model (Figure 1) and the quantitative LCA framework, we map the four carbon stages to the three life cycle phases as follows: carbon sequestration occurs outside the system boundary per ISO 14067; the first carbon emission is captured in the production phase (M1); the extension of carbon storage corresponds to the product’s use stage, during which no emissions are accounted; and the second carbon emission is represented by the disposal phase (M3). This mapping ensures that the dynamic nature of carbon flow is preserved within a standard-compliant accounting structure.
Treatment of Biogenic Carbon: In accordance with ISO 14067:2018, biogenic carbon uptake during tree growth is excluded from the reported carbon footprint, as the standard permits separate reporting of biogenic carbon flows. Our model tracks biogenic carbon as a stored pool that is released at end of life (captured in M3), but this release is reported as a separate inventory item rather than a net emission. This approach ensures alignment with the standard while maintaining transparency regarding the timing of carbon release.
Combined with Figure 3, from the perspective of the whole life cycle, the activities of wood products include the collection of raw materials, transportation, processing and manufacturing, transportation and marketing, use, recycling and reuse, end-of-life treatment, etc. CO2 is emitted in each process, which is categorized in terms of the source of its emission, including the input flow of energy consumption and material consumption into an activity process and the output flow of CO2 emission from leaving an activity process. Moreover, the key to calculating the CO2 emissions of the whole life cycle of wood lies in collecting and organizing the CO2 emission data of each activity process, including activity data and CO2 emission factors.
Since there are few data on the recycling and utilization of wood resources, this study will not discuss in detail the process of removing CO2 from recycling and utilization for the time being and will only study the process of emitting CO2 from the whole life cycle process of wood products.

2.2.1. Goal, Scope, and System Boundary

This study follows a cradle-to-grave approach in full alignment with ISO 14067:2018 [10]. The goal is to quantify the carbon footprint of 1 square meter of 18 mm MDF. As illustrated in Figure 3, the system boundary includes: raw material acquisition (wood), inbound transportation, MDF production (including energy consumption for drying, pressing, etc.), outbound transportation to market, and end-of-life processes (transport to disposal/recycling site and the recycling process itself). The system boundary excludes the production of capital equipment and the upstream emissions of adhesives, as their contribution is considered minor compared to the operational energy flows in this specific product system, a common simplification in LCA practice.
Through the comparative analysis of CO2 emission calculation methods for building materials by Zhang Tao et al. [1], the carbon emission coefficient method was chosen in this study to calculate the CO2 emission of wood, which is shown in Equation (1).
M = Q × C
where M is the CO2 emissions from wood products (kg/m2);
Q is the activity data, i.e., the amount of material used (t/m2);
C is the emission factor, which is the average value of the amount of CO2 emitted per unit of product processed under normal techno-economic and managerial conditions (kg/t).

2.2.2. Model for Calculating CO2 Emissions from the Carbon Storage Cycle of Wood Products

  • Calculation model of CO2 emissions from wood products
In order to facilitate the calculation, the collection, transportation and processing, and manufacturing processes of wood are considered as the production stage of wood products in this study. Moreover, the calculation models of CO2 emissions from the whole life cycle of wood products and the production stage, transportation stage, and disposal stage [34] are shown in Equations (2)–(5).
M = M1 + M2 + M3
where M is the CO2 emissions from the whole life cycle of wood products (kg/m2);
M1 is the CO2 emissions from the production phase of wood products (kg/m2);
M2 is the CO2 emissions from transportation of wood products (kg/m2);
M3 is the CO2 emissions from disposal of wood products (kg/m2).
M1 = QM × (1 + φ1) × CM1 × (1 − s)
where QM is the quantity of wood used (kg/m2);
CM1 is the CO2 emission factor for the production stage of wood products;
φ1 is the waste factor for wood products discarded due to process loss, etc.;
s is the recycling factor of wood products.
M2 = QM × (1 + φ2) × CM2
where CM2 is the CO2 emission factor for the transportation phase of wood products;
φ2 is the loss factor for wood products due to transportation losses.
M3 = QS × CM3
where QS is the quantity of wood products disposed of (kg/m2);
CM3 is the CO2 emission factor for the disposal phase of wood products.
  • Determination of CO2 emission factors
In the production stage, the method of selecting and determining the CO2 emission factor for wood products should first select the emission factor that is closest to the real situation, a comparable empirical emission factor, an average emission factor used internationally, etc.
During the transportation phase, the emission factor for CO2 from wood products is determined using an imputation method; see Equation (6).
CM2 = L × P × CP
where L is the transportation distance of wood products from the processing plant to the sales site (km);
P is the energy consumption during transportation (kJ/(t-km));
CP is the CO2 emission factor of the corresponding fuel during transportation (kg/kJ).
In the disposal stage, since the wood products can be recycled, the CO2 emissions during their recycling and transportation to the factory and reproduction need to be taken into account, and the CO2 emission factor for this stage is calculated, as shown in Equation (7).
CM3 = L′ × P × CP + C′M3
where L′ is the transportation distance (km) of the wood product from the sales site to the recycling plant.
C′M3 is the CO2 emission factor for the recycling process, similar to the value of CM1.

3. Results

This study takes the production of MDF as an example and calculates the CO2 emissions of the wood used in it throughout its life cycle at the production, transportation, and disposal stages.
The selection of 18 mm thick MDF as the case product is based on its status as a widely used specification in the Chinese furniture and interior decoration industries, making it a representative benchmark for manufactured wood panels [36]. This choice facilitates comparability with other studies and industry data. The key parameters used in this calculation, such as the wood consumption rate (35.1 kg/m2) and the production emission factor (CM1 = 0.91), are derived directly from project settlement data of a typical MDF factory in southern China [36]. The recycling rate (s = 0.6) is based on a national estimate for China’s wood product recovery [37]. While these values are considered robust for this case study, they introduce inherent uncertainty. Therefore, the results presented here are most directly applicable to 18 mm MDF produced under similar technological and regional conditions. Application to other types of wood-based panels would require recalibration with product-specific parameters.
According to the relevant project settlement information [39], an MDF factory in the southern city of China, the general production and processing of 18 mm thick MDF consumes 1950 kg/m3 of wood, i.e., 35.1 kg/m2, and QM = 35.1 kg/m2, and this amount has taken into account the process loss and transportation loss, so that φ1 = 0 and φ2 = 0. The CO2 emission of processing 1 m3 MDF is 1779.66 kg, i.e., 32.0 kg/m2. So, the CO2 emission factor CM1 = 1779.66/1950 = 0.91 at the production and processing stage, according to actual conditions, is 1779.66 kg, i.e., 32.0 kg/m2; therefore, at the production and processing stage, according to the actual situation, the CO2 emission factor CM1 = 1779.66/1950 = 0.91. In addition, the recycling coefficient of wood products in our country is about 60% [40], i.e., s = 0.6. The waste factors φ1 and φ2 are set to zero because the reported wood consumption (QM = 35.1 kg/m2) already includes process and transportation losses, as confirmed by factory data. The recycling rate s = 0.6 is derived from a national survey of the wood-based panel industry, representing the average proportion of wood waste collected for reprocessing.
In the transportation stage, the wood products were transported by road and mountain roads, i.e., they mainly consumed gasoline; then, based on Nancy Zhu et al.’s study on the case of life cycle energy consumption and environmental emissions of residential buildings [41], the transportation distance L of the wood products transported from the processing factory to the sales site and the energy consumption P during the transportation process were determined. Whereas the transportation distance of the wood products transported from the sales site to the landfill disposal site was 30 km, the gasoline’s CO2 emission factor CP for gasoline is the default value from IPCC and is obtained by multiplying by 44/12. From this, the CO2 emission factors for wood products at the transportation and disposal stages can be calculated.
C M 2 = L × P × C P     = 80   km × 3662   kJ/(t · km) × 6.93 × 10 5   kg/kJ     = 20.3   kg/t     = 0.0203
C M 3 = L × P × C P + C M 3     = 30   km × 3662   kJ/(t · km) × 6.93 × 10 5   kg/kJ + 0.91     = 0.0076 + 0.91     = 0.9176
Based on the recycling rate of wood products in China, which is about 60%, 60% of the amount of wood used is the amount of wood products disposed of. The enterprise production of medium-fiber boards used in the production of wood in the production, transportation, and disposal stages of the entire life cycle of CO2 emissions is determined as:
M = M1 + M2 + M3
 = QM × (1 + φ1) × CM1 × (1 − s) + QM × (1 + φ2) × CM2 + QS × CM3
 = 35.1 kg/m2 × 0.91 × 0.4 + 35.1 kg/m2 × 0.0203 + 35.1 kg/m2 × 60% × 0.9176
 = 12.7764 kg/m2 + 0.7125 kg/m2 + 19.3246 kg/m2
 = 32.8135 kg/m2

4. Discussion

4.1. Mechanistic Interpretation of the Emissions

The selection of medium-density fiberboard (MDF) for this case study is strategic, as it is an energy-intensive manufactured wood panel whose end of life presents a complex mix of landfilling, incineration, and recycling pathways [42]. This makes it an ideal subject for investigating the often-overlooked disposal phase. Our finding that this phase contributes 59% of the total carbon footprint can be mechanistically explained by two interconnected factors: (1) the eventual release of biogenic carbon stored in the wood, which occurs during decomposition or incineration at the product’s end of life, and (2) the fossil fuel emissions from the recycling process itself, including collection, transportation, and reprocessing energy, as captured by the emission factor C′M3.

4.2. International Comparison and the Influence of Regional Context

Our result presents a striking contrast to LCA studies from regions with advanced waste management systems and different product focuses, highlighting the necessity of product- and region-specific analyses. For instance, Hafner & Schäfer (2017) found that the use stage of solid wood in building applications can be a significant long-term carbon sink [−47%], dramatically shifting the emission profile away from end-of-life concerns [43]. This difference from our MDF case underscores the product-specific nature of carbon footprints: long-lived solid wood products derive their climate benefit from prolonged carbon storage, whereas the footprint of engineered panels like MDF is dominated by processing and end-of-life emissions. In China, a significant proportion of wood product waste is currently landfilled or incinerated without energy recovery, with an estimated recycling rate of only 60% [41]. This contrasts with Northern Europe, where over 80% of wood waste is recovered for energy or material use [34]. The lower efficiency of China’s end-of-life infrastructure explains the higher relative contribution of M3 emissions in our results.
Furthermore, even for similar products, regional disparities are evident. Studies in Northern Europe often report a lower emission share from disposal compared to our findings, primarily due to higher rates of efficient energy recovery from wood waste, which displaces fossil fuels and reduces net emissions [34]. This discrepancy highlights the profound impact of regional waste management infrastructure and energy grids on the carbon footprint. It suggests that the Chinese wood industry can achieve substantial emission reductions by modernizing its end-of-life treatment for wood products towards high-efficiency energy recovery and cascading use.
This regional disparity, while highlighting the specificity of our numerical results for China, does not diminish the broader applicability of our methodological framework. The core innovation of this study—the four-stage carbon storage cycle integrated with the ISO 14067 standard—is a universally applicable template. The model’s Equations (2)–(7) are generic and can be populated with region-specific parameters, such as local transportation distances (L, L′), fuel emission factors (CP), waste management practices (which define CM3), and recycling rates (s). Therefore, while the case study provides China-specific insights, the model itself serves as a robust, adaptable tool for dynamic carbon accounting of wood products in any geographical or economic context. Its value lies in its ability to systematically isolate and quantify the critical end-of-life stage, a feature that is essential for accurate carbon footprinting regardless of location.

4.3. Implications for Carbon Storage Extension and Policy

The concept of “carbon storage extension” is quantitatively validated by our model and forms the scientific basis for actionable strategies. First, any intervention that prolongs the service life of MDF (e.g., improved durability through protective treatments) directly delays the large emissions quantified in M3, providing immediate atmospheric carbon dioxide reduction benefits. Second, improving the quality and efficiency of recycling is paramount. Moving from downcycling or landfilling to efficient closed-loop recycling reduces the effective emission factor C′M3. Therefore, decarbonization strategies must look beyond the factory gate. Policies should incentivize: (1) the design and manufacture of more durable wood products and (2) the development of integrated, high-efficiency wood waste collection and recycling systems. Beyond these established strategies, emerging technologies and market trends present new opportunities. The integration of digital technologies, such as the Internet of Things (IoT) for tracking material flows and Artificial Intelligence (AI) for optimizing recycling processes, can enhance the efficiency and transparency of wood product cascading. Furthermore, the development of novel bio-based adhesives and preservatives can improve the durability and recyclability of engineered wood products like MDF, directly addressing the carbon release at the end-of-life stage. Future decarbonization strategies must not only focus on extending product life and improving recycling infrastructure but also on embracing these technological innovations to fundamentally redesign wood products for a circular and low-carbon bioeconomy.

4.4. Scenario Analysis and Policy Sensitivity

To enhance the robustness of our findings and explore the impact of different end-of-life management strategies, we outline a scenario analysis framework based on the developed model. The current result (M3 = 19.32 kg/m2) represents a mixed-recycling scenario based on a 60% recovery rate. Alternative pathways could significantly alter this outcome:
Landfill Scenario: If the majority of post-consumer MDF is landfilled without methane capture, the biogenic carbon stored in the wood would slowly decompose, releasing a portion as methane (CH4), a potent greenhouse gas. This would require a higher emission factor for CM3 than the current model’s assumption, potentially increasing the total carbon footprint.
Incineration with Energy Recovery Scenario: If disposed MDF is directed to waste-to-energy plants, the biogenic carbon is released as CO2 during combustion. However, if this energy displaces fossil-fuel-based electricity and heat (a common assumption in modern LCA), the net emissions could be lower than the landfilling scenario. This would be reflected by adjusting CM3 to account for avoided fossil emissions.
Closed-Loop Recycling Scenario: Advanced recycling technologies that produce new MDF from old MDF could significantly reduce the demand for virgin wood and lower the overall system emissions. This would be captured by an increase in the recycling factors and a potential reduction in CM1 for the subsequent product life cycle.
Furthermore, China’s evolving macroeconomic policies, particularly the “dual carbon” goals (carbon peak by 2030 and carbon neutrality by 2060) and the promotion of a “circular economy,” are likely to drive improvements in waste collection infrastructure, increase recycling rates, and incentivize cleaner production technologies. These policy shifts would directly influence the key parameters of our model (e.g., “s”, CM1, CM3). Future research should operationalize these scenarios by assigning specific, data-driven values to these parameters to quantify the potential emission reductions under different policy pathways.

4.5. Limitations and Future Research Directions

This study has limitations that point to future research directions. First, the recovery rate (“s”) and the approximate value of “C′M3 = CM1” introduce uncertainty. Future research should utilize sensitivity and Monte Carlo analyses to quantify this uncertainty. Second, the model does not distinguish specific end paths (landfill, incineration, open-loop recycling). Future research should develop scenario analyses to compare these pathways.
Future research should develop scenario analyses comparing alternative end-of-life pathways, such as: (1) landfill with methane capture vs. incineration with energy recovery; (2) closed-loop recycling vs. downcycling into particleboard; and (3) varying recycling rates (e.g., 40%, 60%, 80%) to assess the impact of policy interventions. These scenarios would provide actionable insights for waste management strategy development.

5. Conclusions

This study established a novel, integrated LCA model that successfully synthesizes the dynamic carbon storage cycle of wood with the ISO 14067:2018 standard. Its key scientific contribution is a stage-specific accounting framework that reveals the disposal and recycling phase as the dominant carbon emission source (59%) in the MDF life cycle—a finding that challenges the conventional focus solely on production efficiency. The model provides a transparent, reproducible template for the carbon footprinting of wood products, particularly in the Chinese context.
Taking medium-density fiberboard (MDF) produced by a certain MDF factory as an example, calculations show that the total CO2 emissions across the production, transportation, and disposal phases during the carbon storage cycle amount to 32.8135 kg/m2. Approximately 59% of these emissions originate from the disposal and recycling phase, 39% from the production and processing phase, and 2% from the transportation phase. The study also highlights several key considerations for reducing emissions throughout the entire life cycle of wood products, aiming to mitigate their environmental impact and decrease carbon dioxide emissions and concentrations. This framework can be extended to broader wood product sectors to establish a robust understanding of industry carbon dynamics.

Author Contributions

Conceptualization, methodology, formal analysis, and visualization, C.M., X.Q., M.G., H.W. and L.Q.; writing—review and editing, C.M., X.Q. and L.Q.; supervision, M.G., H.W. and L.Q. All authors have read and agreed to the published version of the manuscript.

Funding

This study was funded by the Yunnan Fundamental Research Project (Project No. 202401AT070292) and the “Xingdian Talent Support Plan” Young Talents Special Project of Yunnan Province.

Institutional Review Board Statement

Not applicable.

Informed Consent Statement

Not applicable.

Data Availability Statement

All the data are provided in the manuscript.

Conflicts of Interest

The authors declare no conflicts of interest.

Abbreviations

The following abbreviations are used in this manuscript:
LCALife Cycle Assessment
MDFMedium-Density Fiberboard
COPConference of the Parties
FAOFood and Agriculture Organization of the United Nations

References

  1. Zhang, T.; Wu, J.; Le, Y. Calculation Methods for CO2 Emissions over the Full Life Cycle of Building Materials. J. Eng. Manag. 2012, 26, 23–26. [Google Scholar]
  2. Dong, H.; Yun, J.; Wang, G. Overview of Carbon Sinks; Science Press: Beijing, China, 2012; pp. 9–15. [Google Scholar]
  3. Guo, M.; Li, J.; Guan, X. Wood Carbon Studies; Science Press: Beijing, China, 2012; pp. 25–26. [Google Scholar]
  4. Guo, M.; Qin, L. Radial Variation of Carbon Storage and Physical Properties in Plantation Red Pine Wood. Sci. Silvae Sin. 2015, 51, 97–102. [Google Scholar]
  5. Wiedmann, T.; Minx, J. A Definition of Carbon ‘Footprint’. In CC Pertsova, Ecological Economics Research Trends; Nova Science Publishers: Hauppauge, NY, USA, 2007; pp. 55–65. [Google Scholar]
  6. Dias, A.C.; Arroja, L. Comparison of Methodologies for Estimating the Carbon Footprint-Case Study of Office Paper. J. Clean. Prod. 2012, 24, 30–35. [Google Scholar] [CrossRef] [Scilit]
  7. Larsen, H.N.; Pettersen, J.; Solli, C.; Hertwich, E.G. Investigating the Carbon Footprint of a University-the Case of NTNU. J. Clean. Prod. 2013, 48, 39–47. [Google Scholar] [CrossRef] [Scilit]
  8. Zhu, L.; Li, J. Tracing the Carbon Footprint of Furniture. Furniture 2012, 2, 105–107. [Google Scholar] [CrossRef]
  9. Finkbeiner, M. Carbon Footprinting—Opportunities and Threats. Int. J. Life Cycle Assess. 2009, 14, 91–94. [Google Scholar] [CrossRef] [Scilit]
  10. ISO 14067; 2018 Greenhouse Gases—Carbon Footprint of Products—Requirements and Guidelines for Quantification. International Organization for Standardization: Geneva, Switzerland, 2018.
  11. Houghton, R. Converting Terrestrial Ecosystems from Sources to Sinks of Carbon. Ambio 1996, 25, 267–272. [Google Scholar]
  12. Churkina, G.; Organschi, A.; Reyer, C.P.O.; Ruff, A.; Vinke, K.; Liu, Z.; Reck, B.K.; Graedel, T.E.; Schellnhuber, H.J. Buildings as a global carbon sink. Nat. Sustain. 2020, 3, 269–276. [Google Scholar] [CrossRef] [Scilit]
  13. Liu, G.L.; Han, S.J. Long-Term Forest Management and Timely Transfer of Carbon into Wood Products Help Reduce Atmospheric Carbon. Ecol. Model. 2009, 220, 1719–1723. [Google Scholar] [CrossRef] [Scilit]
  14. Côté, W.A.; Young, R.J.; Risse, K.B. A Carbon Balance Method for Paper and Wood Products. Environ. Pollut. 2002, 116, S1–S6. [Google Scholar] [CrossRef] [Scilit]
  15. Hashimoto, S.; Nose, M.; Obara, T. Wood Products: Potential Carbon Sequestration and Impact on Net Carbon Emissions of Industrialized Countries. Environ. Sci. Policy 2002, 5, 183–193. [Google Scholar] [CrossRef] [Scilit]
  16. Bai, Y. Carbon Storage of China’s Wood Forest Products; Chinese Academy of Forestry Sciences: Beijing, China, 2010. [Google Scholar]
  17. Intergovernmental Panel on Climate Change (IPCC). 2006 IPCC Guidelines for National Greenhouse Gas Inventories: Agriculture, Forestry and Other Land Use; Intergovernmental Panel on Climate Change (IPCC): Geneva, Switzerland, 2006. [Google Scholar]
  18. Krankina, O.N.; Harmon, M.E.; Winjum, J.K. Carbon Storage and Sequestration in the Russian Forest Sector. Ambio 1996, 25, 284–287. [Google Scholar]
  19. Dias, A.C. The Contribution of Wood Products to Carbon Sequestration in Portugal. Ann. For. Sci. 2005, 62, 902–908. [Google Scholar] [CrossRef] [Scilit]
  20. Brown, S.; Lim, B.; Schlamadinger, B. Evaluating Approaches for Estimating Net Emissions of Carbon Dioxide from Forest Harvesting and Wood Products-Meeting Report. In Proceedings of the IPCC/OECD/IEA Expert Meeting, Dakar, Senegal, 5–7 May 1998. [Google Scholar]
  21. Ruan, Y.; Zhang, X.; Du, F. Carbon Storage of China’s Wood Forest Products. Acta Ecol. Sin. 2006, 26, 4212–4218. [Google Scholar]
  22. Intergovernmental Panel on Climate Change. 2019 Refinement to the 2006 IPCC Guidelines for National Greenhouse Gas Inventories; IPCC: Geneva, Switzerland, 2019; Available online: www.ipcc.ch/report/2019-refinement-to-the-2006-ipcc-guidelines-for-national-greenhouse-gas-inventories/ (accessed on 2 March 2026).
  23. Lalrinmawia, N.; Lalengmawia, R.; Vanlalhluna, P.; Ralte, V.; Lalremruata, B.; Lalnunmawia, F. Evaluating Carbon Emissions and Removals Resulting from Russia’s Trade in Harvested Wood Products. For. Policy Econ. 2025, 172, 103423. [Google Scholar] [CrossRef] [Scilit]
  24. Lucey, T.K.; Tase, N.; Nepal, P.; Bergman, R.D.; Nicholls, D.L.; Khatri, P.; Sahoo, K.; Gray, A.N. A Synthesis of Harvested Wood Product Carbon Models; USDA Forest Service, General Technical Report PNW-GTR-1020; U.S. Department of Agriculture: Portland, OR, USA, 2024. [CrossRef] [Scilit]
  25. Yu, Z.; Zhang, H.; Tu, Q.; Yang, H. Methodological Comparison of the Production Approach 2013 and 2019 for Quantifying the Carbon Stock in Harvested Wood Products in China. Front. Environ. Sci. 2022, 10, 758857. [Google Scholar] [CrossRef] [Scilit]
  26. Food and Agriculture Organization of the United Nations (FAO). State of the World’s Forests 1997; Food and Agriculture Organization of the United Nations (FAO): Rome, Italy, 1997. [Google Scholar]
  27. Gielen, D.J. Potential CO2 Emissions in the Netherlands Due to Carbon Storage in Materials and Products. Ambio 1997, 26, 101–106. [Google Scholar]
  28. Perez-Garcia, J.; Lippke, B.; Comnick, J.; Manriquez, C. An Assessment of Carbon Pools, Storage, and Wood Products Market Substitution Using Life-Cycle Analysis Results. Wood Fiber Sci. 2005, 37, 140–148. [Google Scholar]
  29. Schlamadinger, B.; Marland, G. The Role of Forest and Bioenergy Strategies in the Global Carbon Cycle. Biomass Bioenergy 1996, 10, 275–294. [Google Scholar] [CrossRef] [Scilit]
  30. Kohlmaier, G.H.; Weber, M.; Houghton, R.A. Carbon Dioxide Mitigation in Forestry and Wood Industry; Springer-Verlag: Berlin, Germany, 1998. [Google Scholar]
  31. Werner, F.; Taverna, R.; Hofer, P. Carbon Pool and Substitution Effects of an Increased Use of Wood in Buildings in Switzerland: First Estimates. Ann. For. Sci. 2005, 62, 889–902. [Google Scholar] [CrossRef] [Scilit]
  32. Skog, K.E. Sequestration of Carbon in Harvested Wood Products for the United States. For. Prod. J. 2008, 58, 56–72. [Google Scholar]
  33. Dwivedi, P.; Bailis, R.; Stainback, A. Impact of Payments for Carbon Sequestered in Wood Products and Avoided Carbon Emissions on the Profitability of NIPF Landowners in the US South. Ecol. Econ. 2012, 78, 63–69. [Google Scholar] [CrossRef] [Scilit]
  34. Hellweg, S.; Milà i Canals, L. Emerging approaches, challenges and opportunities in life cycle assessment. Science 2014, 344, 1109–1113. [Google Scholar] [CrossRef] [Scilit]
  35. Zhang, Z.; Shang, C.; Qian, K. Evaluation of Carbon Emissions in Building Life Cycle. Build. Econ. 2010, 2, 44–46. [Google Scholar]
  36. Finkbeiner, M. Carbon Footprinting of Products: The New ISO 14067; Leal Filho, W., Azul, A., Brandli, L., Eds.; Responsible Consumption and Production. Encyclopedia of the UN Sustainable Development Goals; Springer: Cham, Switzerland, 2020. [Google Scholar]
  37. Glover, J.; White, D.O.; Langrish, T.A.G. Wood Versus Concrete and Steel in House Construction: A Life Cycle Assessment. J. For. 2002, 100, 34–41. [Google Scholar] [CrossRef] [Scilit]
  38. Sathre, R.; O’Connor, J. Meta-analysis of greenhouse gas displacement factors of wood product substitution. Environ. Sci. Policy 2010, 13, 104–114. [Google Scholar] [CrossRef] [Scilit]
  39. Xue, Y.; Wang, J. Life Cycle Assessment of Panel Furniture Products. China Wood Ind. 2009, 23, 22–25. [Google Scholar]
  40. Chen, Z.; Fu, F.; Ye, K. Current Status of Wood Resource Utilization and Recycling Technology Measures in China. China Artif. Board 2007, 14, 1–3. [Google Scholar]
  41. Zhu, Y.; Chen, Y. Case Study on Life Cycle Energy Consumption and Environmental Emissions of Residential Buildings. Tsinghua Univ. J. Nat. Sci. Ed. 2010, 50, 330–334. [Google Scholar]
  42. Passarelli, N.M.; Love, C.S.; Guest, G. Life cycle assessment of waste wood cascading: Evaluating the carbon savings of recycling and reuse strategies. J. Ind. Ecol. 2022, 26, 932–946. [Google Scholar]
  43. Hafner, A.; Schäfer, S. Comparative LCA of a wooden single-family house and its conventional counterparts using different allocation procedures. IOP Conf. Ser. Earth Environ. Sci. 2017, 67, 012011. [Google Scholar]
Figure 1. The four-stage conceptual model of carbon storage and emission in wood, illustrating the carbon footprint.
Sustainability 18 02681 g001
Figure 2. Classification system for wood products based on FAO categories and end-use.
Sustainability 18 02681 g002
Figure 3. System boundary and inputs/outputs for the life cycle assessment (LCA) of a wood product, based on ISO 14067:2018.
Sustainability 18 02681 g003
Table 1. Carbon accounting parameters for different categories of wood and wood products [16,17].
Wood/Wood ProductsBulk Density
/t·m−3
Carbon Ratio
/%
Percentage of BarkProportion of Long-Term Woody Forest ProductsService Life
/a
industrial logs0.530.500.1----
fuelwood0.530.500.1--1
sawn timber0.530.50--0.850
synthetic board0.550.50--0.930
paper and paperboard0.900.50--0.720
other industrial products0.600.50--0.525
Disclaimer/Publisher’s Note: The statements, opinions and data contained in all publications are solely those of the individual author(s) and contributor(s) and not of MDPI and/or the editor(s). MDPI and/or the editor(s) disclaim responsibility for any injury to people or property resulting from any ideas, methods, instructions or products referred to in the content.