1. Introduction
In today’s increasingly volatile and complex environment, firms are under mounting pressure to sustain innovation amid constant disruption [
1]. Global economic uncertainty, rapid technological change, and intensifying market competition have made it difficult for firms to rely solely on static competitive advantages [
2,
3]. In this context, innovation resilience, defined as the capacity of a firm to withstand shocks, reconfigure resources, and sustain innovation momentum over time, represents a core dimension of corporate sustainability and a critical determinant of long-term organizational viability [
4,
5].
Innovation resilience is not simply a function of technological capability, but a strategic and organizational process shaped by how firms interpret uncertainty and respond to disruption. According to upper echelon theory [
6], such strategic responses are influenced by executives’ values, experiences, and discretion. As the central decision maker, the CEO plays a pivotal role in shaping firms’ sustainable innovation capacity [
7]. Previous studies have documented the influence of CEO power on innovation input and output [
8,
9]. However, the consequences of concentrated executive authority remain contested. Some studies argue that strong CEO authority facilitates bold strategic investments and long-term innovation initiatives [
10]. In contrast, other research links excessive power to overconfidence, governance distortions, risk misjudgment, and lower quality innovation outcomes [
11,
12,
13]. Additionally, risk preference theory suggests that powerful CEOs may become more conservative in order to protect personal career interests, thereby resisting long horizon strategic investments [
14,
15]. These mixed findings indicate that the relationship between CEO power and innovation outcomes is not inherently linear. Whether executive authority enhances or undermines firms’ sustainable innovation capacity remains theoretically unresolved.
To further examine this relationship, this study draws on signaling theory [
16,
17]. In information asymmetric environments, executives influence stakeholders by sending credible signals through strategic decisions and resource allocation. A powerful CEO may signal long term commitment to innovation through sustained research and development investments and tolerance for risk, thereby strengthening corporate reputation as an intangible asset [
18]. Reputation enhances stakeholder trust, facilitates resource acquisition, and increases tolerance for uncertainty, potentially supporting sustained innovation efforts [
19].
Yet corporate reputation is not universally beneficial [
20]. Research suggests that strong reputational capital may constrain strategic flexibility, increase conformity pressures, or lead managers to avoid risky experimentation in order to protect established status. Thus, reputation may simultaneously enable and restrict innovation dynamics [
21,
22,
23]. Existing literature has not sufficiently examined how corporate reputation mediates the relationship between CEO power and firms’ capacity to sustain innovation under disruption.
The contextual conditions under which CEO power translates into innovation resilience are also evolving. The rapid diffusion of artificial intelligence is transforming organizational decision-making structures. Artificial intelligence technologies may enhance executive effectiveness by improving information processing and strategic precision [
24,
25]. At the same time, algorithmic systems may redistribute decision rights, increase transparency, and reduce the distinct influence of executive authority. Moreover, digital transformation exhibits ambivalent effects. While artificial intelligence adoption can improve efficiency and innovation capability [
26], it may also induce employee burnout [
27], constrain organizational learning [
28], or generate structural rigidity [
29]. These dual effects suggest that artificial intelligence adoption may redefine the boundary conditions of executive power.
In light of these competing perspectives, existing research provides inconclusive evidence regarding whether CEO power ultimately strengthens or weakens firms’ sustainable innovation capacity. Similarly, corporate reputation and artificial intelligence adoption have been portrayed as both enabling and constraining forces in innovation processes [
30]. By integrating upper echelon theory and signaling theory within a unified framework, this study seeks to reconcile these tensions and identify the conditions under which CEO power contributes to innovation resilience rather than organizational rigidity.
This study makes three contributions. First, it extends the leadership literature by conceptualizing innovation resilience as a dynamic outcome shaped by executive characteristics. Second, it advances understanding of the signaling mechanism by positioning corporate reputation as a mediating channel that transforms executive authority into sustained stakeholder support. Third, it identifies artificial intelligence adoption as a contextual boundary condition that reshapes the governance environment in which CEO power operates. Together, these contributions advance understanding of how executive governance and digital transformation jointly shape sustainable innovation capacity and long-term corporate sustainability under uncertainty.
2. Theoretical Background and Hypotheses
This study is grounded in upper echelon theory [
6], which posits that organizational outcomes are shaped by the experiences, values, and characteristics of top executives. As the central figure in corporate decision-making, the CEO plays a critical role in shaping strategic responses to environmental uncertainty and driving the firm’s long-term innovation agenda [
31]. The extent of CEO power, defined as the degree of control and discretion a CEO holds within the organization, directly influences the firm’s capacity to manage crises, reallocate resources, and maintain innovation continuity. These capabilities collectively form the foundation of sustainable innovation resilience [
32,
33,
34], which is essential for long-term sustainability.
While CEO power provides the structural foundation for strategic influence, its effect on sustainable innovation resilience may be indirect. Executives also shape firm outcomes through the signaling of intentions and priorities to external stakeholders. Drawing on signaling theory [
16] as a complementary lens, we argue that CEOs with greater power are better positioned to convey long-term innovation commitment through observable strategic actions such as sustained R&D investment or tolerance for innovation failure [
35]. These actions contribute to the development of corporate reputation, an intangible asset that strengthens stakeholder trust, facilitates access to resources, and supports innovation continuity during periods of uncertainty [
36]. In this way, reputation becomes a key mechanism linking executive authority to sustainable innovation outcomes.
Moreover, the organizational context in which CEO power is exercised plays a crucial role in shaping its sustainability implications. In particular, the level of artificial intelligence (AI) adoption can influence how executive actions are interpreted, implemented and translated into organizational performance [
37]. As AI technologies become embedded in governance and operational processes, they may enhance analytical capabilities while simultaneously reshaping internal power structures and transparency. These changes can either amplify or constrain the effectiveness of CEO power in fostering sustainable innovation resilience. Therefore, we examine AI adoption as a contextual factor that moderates the relationship between CEO power and sustainable innovation resilience.
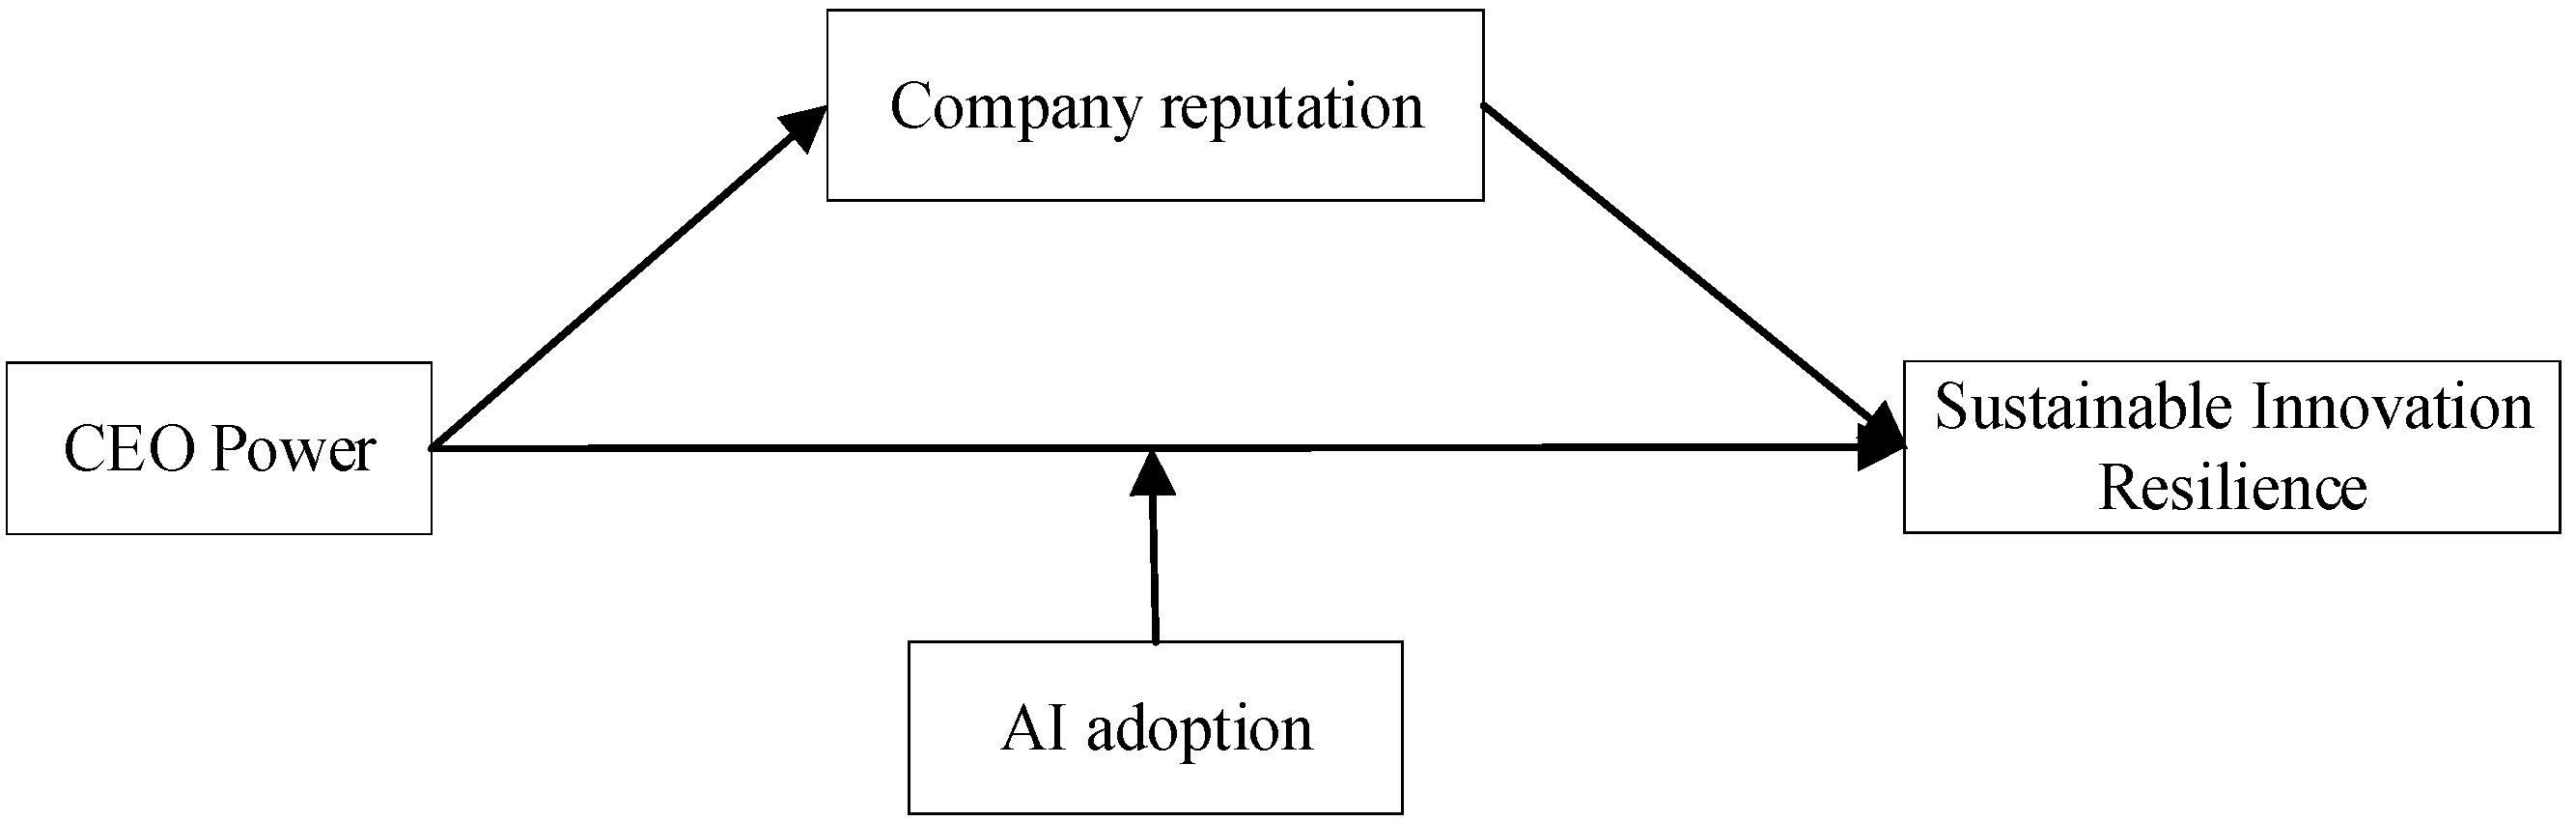
In summary, this study proposes a theoretical framework in which CEO power enhances sustainable innovation resilience indirectly through corporate reputation, with AI adoption influencing the strength of this indirect relationship. The concept model can be seen in
Figure 1.
2.1. CEO Power and Sustainable Innovation Resilience
The concept of resilience originated in ecology, psychology, and engineering, where it describes a system’s ability to absorb external shocks and recover functionality [
38]. In recent years, this concept has been extended to organizational and innovation studies. Oeij et al. [
39] introduced the idea of resilience into innovation management, laying the foundation for subsequent research. Innovation resilience is now widely understood as a dynamic capability that enables firms to maintain and recover innovation activity amid external disruptions [
40,
41]. From a sustainability perspective, such resilience represents the firm’s capacity to sustain innovation as a long-term value creation process rather than merely achieving short term innovation outcomes. Some scholars conceptualize innovation resilience through a dual-dimensional lens, distinguishing between stability, which refers to buffering external shocks and maintaining continuity, and adaptability, which involves transformation and opportunity-seeking in response to environmental change [
42]. While this dichotomy provides theoretical clarity, it may not fully capture the empirical complexity of how firms navigate uncertainty in practice. In reality, stability and adaptability often operate in parallel and are mutually reinforcing within firms’ innovation systems. Therefore, this study adopts an integrated perspective. Innovation resilience is defined as a firm’s overall capability to sustain innovation efforts, recover from setbacks, and adapt flexibly to external change in ways that support long-term corporate sustainability. Importantly, innovation resilience differs from innovation performance. Whereas innovation performance captures the level of innovative input or output at a given time [
43], innovation resilience emphasizes the persistence and stability of innovation activities across periods of uncertainty [
35]. A resilient firm is not necessarily one with the highest innovation output, but one whose innovation trajectory remains relatively stable when facing environmental volatility. This holistic view better reflects the interactive and dynamic nature of innovation responses in real-world contexts and allows for a more comprehensive examination of the organizational factors that shape innovation resilience [
44,
45].
Building on upper echelon theory [
6], CEO power refers to the extent to which a CEO can influence strategic decision making and organizational actions without substantial internal constraints. Following Finkelstein (1992) [
32], CEO power is conceptualized as the aggregate of structural, ownership, expert, and prestige-based sources of influence. Although these dimensions differ in their origins, they jointly determine the CEO’s ability to influence strategic resource allocation and organizational adaptation.
In turbulent environments, where innovation activities are exposed to high uncertainty and external shocks, CEO power plays a critical role in shaping how firms sustain and adjust their innovation strategies [
46,
47].
First, CEO power strengthens the firm’s capacity to sustain long-term innovation investment. In crisis periods, innovation activities are often the first to face budget cuts due to their high risk, delayed returns, and uncertain outcomes. However, powerful CEOs possess greater discretion over strategic resource allocation and are more likely to shield R&D budgets from short-term financial pressures. They can resist internal or external demands for conservative retrenchment, ensuring that critical innovation projects continue uninterrupted. This stability in innovation input is essential for maintaining organizational innovation momentum in turbulent times [
48].
Second, CEO power increases organizational tolerance for failure, which is a key component of adaptive learning [
49]. Innovation resilience requires not only the ability to withstand external shocks, but also to learn from failed attempts and quickly rebound. CEOs with stronger authority are better able to legitimize failure as part of the innovation process and to foster a culture that views setbacks as learning opportunities rather than liabilities. This reduces the risk-averse behavior that can emerge in bureaucratic settings and enhances the organization’s capacity to accumulate and leverage experiential knowledge for future innovation [
50,
51,
52].
Third, CEO power enhances strategic agility and responsiveness. When facing unexpected disruptions such as sudden regulatory shifts, supply chain breakdowns, or technological discontinuities, powerful CEOs can bypass organizational inertia and expedite strategic adjustments. They can reconfigure internal innovation structures, redirect R&D efforts, or form new external collaborations with speed and authority. This capacity to swiftly reorganize innovation strategies and mobilize resources contributes directly to the firm’s ability to adapt and sustain innovation under environmental volatility [
53,
54].
Taken together, CEO power not only supports stability in innovation investment but also enables adaptive learning and strategic responsiveness. These combined effects enhance the firm’s ability to recover from disruption, preserve innovation capacity, and sustain long-term innovation trajectories that underpin corporate sustainability.
H1: CEO power is positively associated with firm sustainable innovation resilience.
2.2. The Mediating Role of Corporate Reputation
Firm reputation, as an intangible strategic asset, plays a critical role in supporting firms’ innovation resilience under conditions of uncertainty [
55,
56]. Beyond short-term performance effects, reputation shapes stakeholders’ long-term expectations regarding a firm’s strategic orientation and sustainability commitment [
57]. It not only influences how stakeholders interpret and respond to a firm’s strategic decisions but also affects the firm’s ability to mobilize critical resources during crises [
58]. In this regard, reputation serves as a buffer that enhances a firm’s capacity to maintain innovation continuity, recover from disruption, and sustain long-term value creation [
18,
59].
According to signaling theory [
16,
60], firm leaders can influence stakeholders’ perceptions by sending credible signals through strategic actions. CEO power plays a crucial role in this signaling process. A powerful CEO has greater discretion and capacity to commit long-term resources to innovation, tolerate failures, and enact timely responses in times of turbulence. These behaviors signal strategic foresight, managerial competence, and organizational resilience to external audiences [
61,
62]. Over time, such repeated signals accumulate into a positive reputation, strengthening stakeholder confidence and trust [
63].
In turn, a strong firm reputation reinforces sustainable innovation resilience through two primary mechanisms. First, it mitigates information asymmetries and reduces external monitoring and financing costs, thereby enabling firms to access key innovation resources with lower institutional barriers [
64,
65]. Second, reputation enhances firms’ ability to form stable partnerships, attract high-quality talent, and participate in knowledge-sharing networks, factors that underpin adaptive learning and collaborative innovation [
66,
67]. Especially during crises, firms with favorable reputations are more likely to receive stakeholder support, regulatory flexibility, and social tolerance, providing the necessary space to recover and sustain long-term innovation trajectories that contribute to corporate sustainability.
Thus, CEO power facilitates the accumulation of reputational capital by enabling effective signaling through strategic behavior. In turn, reputation acts as a conduit through which this power is transformed into sustainable innovation resilience. Based on this reasoning, we propose the following hypothesis:
H2: Firm reputation mediates the relationship between CEO power and sustainable innovation resilience.
2.3. The Moderating Role of AI Adoption
Artificial intelligence adoption represents a fundamental transformation in how organizations process information, make decisions, and coordinate internal activities [
68,
69]. Beyond operational efficiency, AI adoption increasingly shapes firms’ capacity to sustain innovation and maintain long-term competitiveness [
70]. Unlike traditional decision making, which relies heavily on individual experience, intuition, and bounded rationality, AI-enabled decision systems integrate multidimensional, real time data and systematic analytics [
71]. This technological transformation reshapes internal governances and expands the informational reach of executives, thereby influencing the conditions under which sustainable innovation resilience can be developed.
From a theoretical perspective, AI adoption enhances a firm’s decision support system by dissolving traditional knowledge and information barriers [
72]. In environments characterized by uncertainty and rapid change, data-driven insights improve decision quality and reduce cognitive limitations associated with human judgment alone [
73]. This logic aligns with the arguments of dynamic capabilities theory, which emphasizes the importance of sensing, seizing, and transforming capabilities in dynamic environments [
74]. AI systems contribute to these capabilities by enabling more accurate environmental scanning, faster pattern recognition, and systematic learning, thereby contributing to sustained innovation under disruption.
When AI adoption is high, the influence of CEO power on sustainable innovation resilience is likely to be strengthened. First, AI provides powerful CEOs with richer informational support, enabling them to base strategic resource commitments on robust empirical evidence rather than intuition. Leaders can use predictive analytics and machine learning insights to anticipate environmental shifts and proactively shape innovation strategies. This enhances strategic foresight and reinforces the credibility of executive signals regarding long-term innovation commitment [
24,
75]. Second, high AI adoption facilitates cross-departmental integration and coordination, reducing implementation gaps between strategic intent and operational execution [
76]. In this context, CEO authority is translated more effectively into coherent innovation actions, strengthening the firm’s capacity to sustain innovation over time.
In contrast, when AI adoption is low, the capacity of CEOs to translate power into sustainable innovation resilience is comparatively constrained. Without advanced data analytics and integrated information systems, CEO decisions rely more on individual cognition and interpersonal coordination. This can amplify the effects of bounded rationality and increase coordination costs, thereby weakening the clarity and credibility of the strategic signals sent to external stakeholders. Low AI adoption also restricts the firm’s ability to configure resources swiftly and systematically in response to disruption. Research suggests that in low digital maturity contexts, firms struggle to align executive strategic intent with rapid organizational adaptation, which can dilute the effectiveness of powerful leadership in building resilience [
77,
78].
Taken together, AI adoption shapes the governance environment in which CEO power operates. High levels of AI adoption amplify the effectiveness of executive authority in fostering sustainable innovation resilience, whereas low levels may limit this translation mechanism. Based on this reasoning, we propose the following hypothesis:
H3: AI adoption positively moderates the relationship between CEO power and firm sustainable innovation resilience, such that the positive relationship is stronger when AI adoption is high compared to when AI adoption is low.
3. Methodology
3.1. Sample and Data
We constructed our sample based on Chinese A-share listed firms on the Shanghai, Shenzhen and Beijing Stock Exchanges from 2009 to 2024, drawing upon multiple authoritative data sources. The year 2008 has been excluded because the global financial crisis caused significant market volatility, and China’s new enterprise accounting standards were officially implemented on a large scale that year.
Firstly, the data on R&D investment in the innovation resilience and CEO power were obtained from the Chinese Stock Market and Accounting Research (CSMAR) database, while the patent data in innovation resilience and media report data were obtained from the Chinese Research Data Services (CNRDS).
Secondly, the AI adoption data were sourced from the annual reports and Management Discussion and Analysis (MD&A) documents of listed companies in the CSMAR database and Sina Finance website (
https://finance.sina.com.cn). Following the approaches of Niu et al. [
79], Yang and Kuang [
80], and Fu et al. [
81], Python 3.14.0 is employed to quantify the frequency of 73 artificial intelligence-related keywords.
Thirdly, the corporate-level governance and financial information—including the firm size, leverage ratio, firm age, return on assets, board size, board independence, ownership concentration, and firm market value—was obtained from the Chinese Stock Market and Accounting Research (CSMAR) database.
Finally, this study is based on an unbalanced panel dataset of all A-share listed firms in China from 2009 to 2024. To ensure data quality and consistency, the following screening procedures were applied: (1) firms marked as *ST, ST, or PT were excluded to avoid the influence of firms under special treatment due to financial distress; (2) firms in the financial and real estate sectors were removed due to their distinct regulatory environments and financial structures; (3) observations with missing data for key variables were dropped to enhance reliability; and (4) all continuous variables were winsorized at the 1st and 99th percentiles to mitigate the impact of extreme values.
After these procedures, the final dataset consists of 19,731 firm–year observations from 3477 listed companies across 31 provinces, providing broad coverage of China’s regional economic and institutional diversity.
3.2. Variables and Measurements
3.2.1. Sustainable Innovation Resilience
To capture the dynamic dimension of sustainable innovation resilience, we follow prior research on organizational resilience that emphasizes stability and continuity of core activities under uncertainty [
82,
83]. Consistent with this perspective, sustainable innovation resilience (Resi) is operationalized as the negative value of the rolling three-year standard deviation of firms’ patent applications.
Specifically, we compute the standard deviation of patent applications over three consecutive years (t − 2, t − 1, t), which captures the extent to which innovation output fluctuates across adjacent periods. Higher volatility indicates greater instability in innovation activities; lower volatility reflects stronger continuity and adaptive capacity in sustaining innovation over time, which is essential for long-term corporate sustainability. To facilitate interpretation, we multiply the rolling standard deviation by negative one, so that higher values of Resi correspond to greater innovation resilience.
The calculation is as follows:
In the above formula, represents the rolling standard deviation of the patent application volume of enterprise i over the past three consecutive years (from t − 2 to t) in year t. represents the number of patent applications made by enterprise i in the years t − 2, t − 1, and t. represents the innovation resilience of enterprise i in year t.
3.2.2. CEO Power
CEO power has been widely conceptualized as a multidimensional construct reflecting the chief executive’s overall capacity to influence strategic decision-making and resource allocation [
34]. Although different sources of power originate from distinct institutional and organizational foundations, prior research suggests that they jointly determine the degree of managerial discretion and strategic authority within the firm [
32]. Therefore, consistent with this theoretical tradition, we conceptualize CEO power as an integrated construct capturing the CEO’s cumulative influence over corporate strategic choices.
Building on the four-dimensional, eight-indicator framework originally developed by Finkelstein [
32] and extended by Daily and Johnson [
84], and widely adopted in recent studies [
50,
85,
86], we operationalize CEO power along four dimensions:
- (1)
Structural Power reflects formal authority within governance structures, measured by CEO duality (Dual) and insider director status (Inside-director);
- (2)
Ownership Power captures economic control rights, measured by CEO shareholding (CEO-share) and whether institutional ownership is below the industry median (Institute-share);
- (3)
Expert Power represents accumulated knowledge and experience-based authority, measured by professional rank (Rank) and tenure exceeding the industry median (Tenure);
- (4)
Prestige Power reflects symbolic and reputational influence, measured by educational attainment (Degree) and whether the CEO holds part-time positions in other firms (Part-time job).
To construct a comprehensive index of CEO power, we apply principal component analysis (PCA) to the eight indicators. PCA enables us to extract the shared variance across heterogeneous yet theoretically related dimensions, thereby capturing the latent construct of CEO strategic authority. The first principal component explains a substantial proportion of total variance and all indicators load positively, supporting the existence of a common underlying factor. The resulting normalized index (Power_pc) ranges from 0 to 1.
To ensure that our findings are not driven by a specific weighting scheme, we additionally compute an equally weighted index (Power_ew) as a robustness check.
3.2.3. Corporate Reputation
Following Ran and Ji [
59], this study measures corporate reputation using a media attention-based approach. The primary proxy variable (Repu) is constructed as the natural logarithm of one plus the total number of positive news reports from online platforms and print media, including both original and reprinted articles. The constant one is added to the raw count to avoid undefined values when the number of positive reports is zero, since the logarithm of zero is not defined. This transformation also helps retain firm–year observations with zero positive coverage, thereby reducing potential sample loss and improving estimation reliability. For robustness, we further construct an alternative measure (Repu_ori) based only on original news articles, excluding duplicated reports from reprints across different outlets. The same logarithmic transformation with the addition of one is applied to obtain this alternative indicator.
3.2.4. AI Adoption
Following Niu et al. [
79], Yang and Kuang [
80], and Fu et al. [
81], we measure AI adoption by calculating the frequency of 73 AI-related keywords in firms’ annual reports. We construct the proxy variable (AI_adopt) as the natural logarithm of one plus the total keyword count. The constant one is added to avoid undefined values for firms with zero mentions and to retain those observations in the analysis. For robustness, we follow Li et al. [
87] and calculate an alternative measure (AI_adopt_mda) based on the frequency of AI-related keywords in the “Management Discussion and Analysis” (MD&A) section of the annual reports. To address potential concerns regarding symbolic disclosure, we also construct an alternative investment-based proxy for AI adoption, which is employed in robustness tests.
3.2.5. Control Variables
Based on prior research [
88,
89,
90], we include the following control variables: firm size (Size), leverage ratio (Lev), firm age (Age), return on assets (Roa), board size (Board), board independence (Indp), ownership concentration (Oncon), and firm market value (Tobinq). All regression models also control for industry and year fixed effects.
Detailed definitions and data sources of all variables are summarized in
Table 1.
3.3. Model
3.3.1. Baseline and Mediation Models
Given that the influence of CEO power on firm outcomes may unfold over time and to mitigate potential reverse causality, we lag CEO power by one period in all baseline regressions. To examine the effect of CEO power on firms’ sustainable innovation resilience, we estimate the following panel fixed effects model:
Model (3) represents the baseline specification.
To examine the mediating role of corporate reputation while incorporating temporal ordering, we construct the following models:
In these equations, denotes the sustainable innovation resilience of firm i in year t; represents the CEO power index lagged by one period. denotes corporate reputation in year t; represents sustainable innovation resilience in year t + 1. includes the control variables. Industry and Year indicate industry and year fixed effects, respectively. α, β, and φ are the estimated coefficients, and is the error term.
3.3.2. Moderation Model
Based on the theoretical framework, AI adoption is posited as a contextual moderator in the relationship between CEO power and sustainable innovation resilience. To empirically test this moderating effect, we estimate the following panel fixed effects model:
In this model, represents the level of AI adoption for firm i in year t, and the interaction term captures the moderating effect of AI adoption on the relationship between CEO power and sustainable innovation resilience. A statistically significant indicates that the strength of the relationship between CEO power and sustainable innovation resilience varies with the level of AI adoption.
All other variables are defined as in Model (3). Industry and year fixed effects are included to control for time invariant industry characteristics and macro-level shocks. Standard errors are clustered at the firm level to account for within firm correlation over time.
4. Results
4.1. Main Findings
4.1.1. Descriptive Statistics and Correlation Analysis
Table 2 presents the descriptive statistics for all variables used in the study. The average value of sustainable innovation resilience (Resi) is −0.456, with a standard deviation of 0.399, indicating moderate variability across firms. The CEO power index (Lag_power_pc) ranges from −2.347 to 1.837, with a mean of 0.138, suggesting significant variation in CEO influence. The mean firm reputation (Repu) is 4.338, and the average level of AI adoption (AI_adopt) is 1.299, reflecting overall modest engagement with AI technologies. Control variables such as firm size (Size), leverage (Lev), and board characteristics also display reasonable dispersion, supporting the adequacy of variation for regression analysis.
Table 3 presents the Pearson correlation matrix. CEO power is positively and significantly correlated with sustainable innovation resilience (
p < 0.01), providing preliminary support for Hypothesis 1. Corporate reputation and AI adoption are also positively and significantly correlated with sustainable innovation resilience (
p < 0.01), offering initial evidence for the proposed mediation mechanisms. In addition, all pairwise correlation coefficients among the explanatory and control variables are below 0.6. Consistently, variance inflation factor (VIF) diagnostics report a maximum value of 2.23, well below the conventional threshold of 10, indicating that multicollinearity is not a concern in the regression analysis.
4.1.2. Baseline Estimation Results
Table 4 presents the results of the baseline regression, examining the main effect of CEO power on corporate sustainable innovation resilience. Column (1) reports the results with only control variables, while Column (2) adds the independent variable, CEO power. The results show that the coefficient of CEO power is significantly positive (α = 0.008,
p < 0.01), indicating that greater CEO power significantly enhances a firm’s sustainable innovation resilience. In Column (3), we have fixed the interaction term between the industry and the year (Year × Industry), and the regression results indicated that the CEO power still significantly positively influenced innovation resilience (α = 0.009,
p < 0.01), thus providing support for Hypothesis 1.
4.1.3. Mediation Effect Test
To address concerns regarding temporal ordering and causal identification, we implement a lagged mediation framework that explicitly incorporates time sequencing among the variables. Specifically, CEO power is measured at period t − 1, corporate reputation at period t, and sustainable innovation resilience at period t + 1. This temporal structure establishes sequential precedence, allowing us to examine whether changes in reputation follow changes in CEO power and whether innovation resilience subsequently responds to reputational dynamics.
Table 5 reports the estimation results. Column (1) shows that lagged CEO power significantly predicts future sustainable innovation resilience (α = 0.007,
p < 0.01), consistent with the baseline findings. Column (2) indicates that lagged CEO power positively affects corporate reputation (β = 0.043,
p < 0.01). Column (3) further demonstrates that corporate reputation significantly predicts future sustainable innovation resilience (φ = 0.018,
p < 0.01), while the coefficient of CEO power declines in magnitude, suggesting a partial mediation effect.
To further validate the mediation mechanism, we conduct Sobel and bootstrap tests. The Sobel test yields a statistically significant result (z = 3.378,
p < 0.01). Bootstrap estimation results reported in
Table 6 show that the confidence interval of the indirect effect does not include zero. These findings provide additional evidence for a statistically significant indirect pathway from CEO power to sustainable innovation resilience through corporate reputation.
As an additional robustness check, we employ an alternative measure of corporate reputation based on the frequency of original news reports (Repu_ori). The results remain consistent, reinforcing the stability of the mediation effect.
Collectively, these findings support Hypothesis 2 and provide temporally structured evidence for the mediating role of corporate reputation.
4.1.4. Moderation Effect Test
To further examine the moderating role of AI adoption in the relationship between CEO power and sustainable innovation resilience, this study incorporates the moderating variable (
) and its interaction with CEO power (
×
) into the baseline regression model. The results are reported in
Table 7. Column (1) presents the baseline regression, while Column (2) includes both the moderator and the interaction term. The coefficient of the interaction term is significantly positive (θ = 0.006,
p < 0.01), indicating that AI adoption significantly strengthens the positive effect of CEO power on sustainable innovation resilience. This finding supports Hypothesis 3. To further validate the moderating effect, an alternative measure of AI adoption (
), derived from the Management Discussion and Analysis (MD&A) section of corporate annual reports, is used. The results in Column (3) show that the interaction term remains significantly positive (θ = 0.005,
p < 0.01), reinforcing the moderating role of AI adoption.
Since AI adoption is measured based on the frequency of AI-related keywords in annual reports, this proxy may partially capture symbolic disclosure rather than substantive technological implementation. To address this concern, we supplement the analysis with an alternative measure that reflects firms’ actual financial commitment to artificial intelligence technologies. Following Zhang et al. [
91] and Xiao and Zhang [
92], we manually extract AI-related investment amounts from the explanatory notes of financial reports using a keyword screening method. Specifically, we identify investments in AI-related intangible assets and fixed assets, sum them to obtain total AI investment, and scale the amount by total assets to construct the variable AI invest. The results, reported in column (4) of
Table 7, indicate that the interaction term between CEO power and AI investment remains significantly positive (θ = 0.681,
p < 0.05). The consistency between the disclosure-based and investment-based measures supports the robustness of the moderating effect and suggests that the findings are not driven solely by symbolic reporting behavior.
4.2. Endogeneity Treatment and Robustness Checks
4.2.1. Endogeneity Treatment
To mitigate potential endogeneity concerns, including reverse causality, omitted variable bias, and dynamic simultaneity, we implement a series of complementary estimation strategies.
First, following Yang and Du [
93], we employ an instrumental variable approach. Specifically, we use the industry–year average of CEO power in the t − 1 period, excluding the focal firm, as the instrument (Mean_lag_power_pc). The exclusion of the focal firm avoids mechanical correlation between the instrument and the endogenous regressor. The first-stage results reported in Column (1) of
Table 4 show that the instrument is strongly correlated with CEO power (coefficient = 0.194,
p < 0.01). The Anderson canonical correlation LM statistic equals 29.860, and the Cragg–Donald Wald F statistic is 29.844, which exceeds the Stock and Yogo [
94] critical value of 16.38, suggesting that weak instrument concerns are unlikely. In the second stage, CEO power remains positively and significantly associated with sustainable innovation resilience (α = 0.727,
p < 0.01), consistent with the baseline results.
Second, to further alleviate concerns arising from unobserved time-invariant firm characteristics, we apply a first-difference specification. By regressing the change in sustainable innovation resilience (D_resi) on the change in CEO power (D_power_pc), this approach focuses on within-firm variations over time. The results reported in Column (3) of
Table 8 indicate that changes in CEO power are positively associated with changes in sustainable innovation resilience (α = 0.008,
p < 0.05), suggesting that the relationship is not driven solely by cross-sectional differences across firms.
Third, we implement propensity score matching to reduce potential selection bias. Firms with CEO power above the industry median are matched to comparable firms with lower CEO power using 1:1 nearest-neighbor matching based on a Logit model. The matched sample results in Column (4) of
Table 8 continue to show a positive and significant effect (α = 0.015,
p < 0.05), indicating that the findings are not attributable to observable differences between high-power and low-power firms.
Finally, to address dynamic endogeneity and potential feedback effects between CEO power and innovation resilience, we estimate a System GMM model. This approach incorporates the lagged dependent variable and employs internal instruments constructed from lagged levels and differences, thereby accounting for simultaneity and unobserved heterogeneity. As shown in Column (5) of
Table 8, CEO power remains positively associated with sustainable innovation resilience (α = 0.030,
p < 0.1). The AR (1) test is significant (
p = 0.044), while the AR (2) test is insignificant (
p = 0.304), indicating the absence of second-order serial correlation. In addition, both the Hansen test (
p = 0.120) and Sargan test (
p = 0.332) results support the validity of the instruments.
Taken together, the consistent results across instrumental variable estimation, first-difference specification, propensity score matching, and dynamic panel modeling suggest that the positive relationship between CEO power and sustainable innovation resilience is robust to multiple strategies designed to mitigate endogeneity concerns.
4.2.2. Robustness Test
To ensure the robustness of the results, this study conducts a series of robustness checks by (1) replacing the measurement of the independent variable, (2) replacing the measurement of the dependent variable, and (3) introducing high-dimensional fixed effects. The results are presented in
Table 9.
In Column (1), we replaced the measurement of CEO power with an alternative proxy (Lag_power_ew), calculated as the arithmetic average of the eight component indicators. The results show that CEO power continues to have a significantly positive effect on sustainable innovation resilience (α = 0.092,
p < 0.01). In Column (2), consistent with Zhang and Wei [
95], we use four indicators to calculate the comprehensive sustainable innovation resilience index (Resi_ew): the ratio of R&D expenditures to total assets, the number of R&D personnel, the standardized index of patent applications, and the logarithm of the number of patent applications per unit of R&D expenditure. This index is integrated using the entropy weight method and then scaled by 100. The results show that the coefficient for CEO power remains significantly positive (α = 0.293,
p < 0.01). Column (3) reports the results with fixed effects for firm, industry, and year simultaneously. Even under this high-dimensional fixed effects model, CEO power remains positively associated with sustainable innovation resilience (α = 0.010,
p < 0.05).
All robustness checks yield results consistent with the baseline model, further confirming the reliability of the main findings.
4.2.3. Heterogeneity Analysis
This study further conducts subgroup regressions based on four typical dimensions of firm heterogeneity: ownership structure, firm size, high-tech industry, and industry competition intensity. These analyses examine whether the effect of CEO power on innovation resilience differs across different conditions and contexts. In addition, Chow tests are performed to assess whether the differences in regression coefficients between groups are statistically significant.
Ownership Heterogeneity
Ownership structure shapes the competitive environment, internal governance mechanisms, and incentive systems faced by firms and their CEOs. This study argues that CEO power has a stronger effect on sustainable innovation resilience in non-state-owned enterprises (non-SOEs), for the following reasons:
First, compared with state-owned enterprises (SOEs), non-SOEs typically operate in more competitive markets where innovation is crucial for survival and growth. In contrast, SOEs may benefit from monopolistic positions or policy protection, which reduces market pressure and lowers the urgency for innovation. As a result, CEOs with greater power in non-SOEs are more motivated to direct resources toward innovation and enhance sustainable innovation resilience, while CEOs in SOEs may have weaker incentives to do so since innovation may not be a primary strategic goal.
Second, due to differences in ownership structure, SOEs and non-SOEs face distinct governance frameworks and institutional constraints. Non-SOEs often have flatter governance structures, giving CEOs more discretion and higher degrees of decision-making authority. In contrast, SOEs are typically subject to more rigid procedures and policy oversight, which restricts the exercise of CEO power. Therefore, CEO power tends to play a more significant role in non-SOEs.
Finally, CEO incentive mechanisms differ across ownership types. In non-SOEs, CEO compensation and equity incentives are more closely tied to long-term firm performance. Because innovation has the potential to generate high returns, CEOs in non-SOEs have stronger personal and professional motivations to enhance sustainable innovation resilience. In SOEs, such performance-based incentives may be weaker or less prevalent.
The empirical results in
Table 10 support this view: the effect of CEO power on sustainable innovation resilience is more significant in non-state-owned enterprises, while the positive effect is not obvious in state-owned enterprises. Moreover, the
p-value of the Chow test for the coefficient difference between groups is 0.000, indicating a statistically significant difference. These findings suggest that market-driven firms offer a more flexible governance environment that enables CEOs to more effectively leverage their power to strengthen sustainable innovation resilience.
Firm Size Heterogeneity
Firm size plays a critical role in shaping the effect of CEO power on sustainable innovation resilience, particularly in terms of power constraints and strategic agility. Regarding power constraints, CEOs of larger firms are typically subject to greater oversight from boards of directors or external institutions. In contrast, CEOs in smaller firms often occupy a central and dominant position, with fewer internal checks and balances from boards or supervisory bodies. Their decisions can be implemented more directly across the organization without complex internal negotiations or approval processes.
From the perspective of strategic agility, small firms often adopt focused strategies where the CEO’s vision effectively defines the strategic direction. When CEO power is concentrated, innovation paths tend to be more coherent, and cross-departmental alignment is easier to achieve, reducing the likelihood of strategic conflict. In times of external shocks, powerful CEOs in smaller firms can make swift innovation-related decisions and mobilize immediate execution across departments. This level of strategic agility is a key dimension of sustainable innovation resilience.
The regression results presented in
Table 11 support this view: the positive impact of CEO power on sustainable stainable innovation resilience is more significant in small enterprises, but not in large enterprises. Moreover, the influence coefficient of small enterprises is greater than that of large enterprises. The Chow test confirms the difference in coefficients between the two groups with a
p-value of 0.000. These findings suggest that CEOs in smaller firms are better positioned to leverage their concentrated power to enhance innovation strategy agility, thereby strengthening the firm’s capacity for sustainable innovation resilience.
High-Tech Industry Heterogeneity
Whether a firm operates within a high-tech industry constitutes an important contextual condition shaping the relationship between CEO power and sustainable innovation resilience. High-tech industries are characterized by rapid technological change, short product life cycles, and strong dependence on continuous innovation. In such environments, firms are frequently exposed to technological discontinuities and competitive shocks. Under these conditions, strategic discretion and centralized authority may become critical governance resources. Powerful CEOs are better positioned to make timely strategic adjustments, reallocate resources toward emerging technologies, and sustain long-term innovation investment despite heightened uncertainty. Consequently, the positive effect of CEO power on sustainable innovation resilience is expected to be more pronounced in high-tech sectors.
By contrast, non-high-tech industries typically exhibit more incremental innovation patterns and relatively stable competitive structures. Innovation activities in these sectors often involve gradual improvement rather than radical transformation, and the frequency of disruptive technological shocks is comparatively lower. As a result, the strategic value of concentrated executive authority in shaping firms’ adaptive innovation capacity may be attenuated. In such contexts, CEO power may be primarily directed toward operational efficiency or short-term performance objectives, with limited marginal contribution to sustainable innovation resilience.
Furthermore, innovation investment in high-tech industries is often associated with high sunk costs and extended development cycles. Firms operating in these sectors face stronger incentives to maintain innovation continuity in order to avoid value erosion from abandoned projects. Under these circumstances, CEO power can play a decisive role in safeguarding long-term innovation commitments and preserving organizational learning trajectories, thereby strengthening sustainable innovation resilience. In contrast, innovation activities in non-high-tech industries generally involve lower sunk costs and shorter adjustment cycles, reducing the urgency for centralized authority to actively sustain innovation trajectories.
Empirical results reported in
Table 12 are consistent with these theoretical expectations. The positive effect of CEO power on sustainable innovation resilience is statistically significant for firms in high-tech industries but insignificant for those in non-high-tech sectors. The Chow test confirms that the difference in coefficients between the two subsamples is statistically significant at the one percent level. These findings suggest that the governance value of CEO power in fostering sustainable innovation resilience is contingent upon the technological intensity and innovation dynamics of the industry environment.
Industry Competition Intensity Heterogeneity
Industry competition intensity represents another important contextual condition shaping the governance value of CEO power. From a market structure perspective, firms operating in highly competitive industries face stronger performance pressure, faster strategic turnover, and greater risks of market displacement. In such environments, sustaining innovation becomes critical for long-term survival. Sustainable innovation resilience allows firms to maintain innovation continuity and adapt to competitive shocks, thereby preserving strategic positioning under intense rivalry.
Under conditions of high competition intensity, CEO power may play a more pronounced role in fostering sustainable innovation resilience. Heightened competitive pressure reduces organizational slack and increases the urgency of strategic coordination. Powerful CEOs are better positioned to accelerate decision making, overcome internal resistance, and mobilize resources toward core innovation activities. The concentration of authority enables rapid reallocation of capital and human resources from low-value segments to strategically critical innovation projects. Such coordinated resource integration enhances the firm’s capacity to sustain innovation trajectories despite competitive turbulence.
In contrast, industries characterized by low competition intensity often exhibit greater strategic slack and relatively stable market structures. Resource redundancy may allow firms to pursue diversified initiatives without strong central coordination. In such contexts, dispersed decision structures may be sufficient to support incremental innovation. Consequently, the marginal governance contribution of CEO power to sustainable innovation resilience may be weaker.
The empirical results reported in
Table 13 support these arguments. The positive effect of CEO power on sustainable innovation resilience is statistically significant in industries with high competition intensity, but insignificant in low-competition industries. The Chow test confirms that the difference in coefficients between the two subsamples is statistically significant at the one percent level. These findings suggest that the effectiveness of CEO power in fostering sustainable innovation resilience is amplified under competitive pressure, where rapid coordination and strategic decisiveness become essential governance assets.
5. Conclusions and Implications
This study integrates upper echelon theory and signaling theory to examine how CEO power influences enterprise sustainable innovation resilience, considering the mediating role of corporate reputation and the moderating role of AI adoption. Drawing on a large panel dataset of Chinese listed firms, our findings offer new insights into how strategic leadership and digital transformation jointly shape firms’ long-term innovation sustainability.
First, the results demonstrate that CEO power significantly enhances sustainable innovation resilience. Extending upper echelon theory, we show that concentrated executive authority not only stabilizes innovation investment but also strengthens firms’ capacity to reconfigure resources and sustain innovation trajectories under environmental disruption. This finding clarifies that executive power can function as a governance mechanism supporting long-term organizational adaptability.
Second, corporate reputation serves as a key transmission channel linking CEO power to sustainable innovation resilience. Consistent with signaling theory, powerful CEOs can convey credible long-term innovation commitment through strategic actions. Over time, these signals accumulate into reputational capital, which enhances stakeholder trust, reduces institutional frictions, and provides external support during periods of uncertainty. This finding refines the understanding of how intangible assets convert executive authority into sustainable innovation outcomes.
Third, AI adoption amplifies the positive effect of CEO power on sustainable innovation resilience. By improving information processing, strategic precision, and coordination efficiency, AI strengthens the translation of executive intent into adaptive innovation action. This highlights the role of digital transformation in reshaping governance effectiveness in dynamic environments.
Heterogeneity analysis further reveals that the governance value of CEO power is more pronounced in non-state-owned firms, smaller firms, high-tech industries, and highly competitive industries. These contexts provide greater strategic discretion and stronger adaptive incentives, underscoring the contingent nature of executive power in building sustainable innovation resilience.
Overall, this study contributes to the literature by integrating executive leadership, reputational capital, and digital capabilities within a unified sustainability framework. It advances theoretical understanding of how governance structures and technological context jointly shape firms’ long-term innovation sustainability.
Drawing on these findings, the following managerial and policy implications are proposed, with particular relevance for firms operating in dynamic and uncertain industrial environments:
From a managerial perspective, firms should view sustainable innovation resilience as a strategic capability essential for long-term value creation. Beyond increasing R&D investment, firms must strengthen governance mechanisms, foster adaptive learning cultures, and integrate reputation management into executive evaluation systems. Given the moderating role of AI adoption, organizations should enhance digital literacy among senior leaders and establish governance frameworks that balance technological benefits with ethical and reputational considerations.
At the policy level, industry institutions can promote sustainable innovation resilience by encouraging responsible digital transformation, strengthening reputation-based governance mechanisms, and supporting firms engaged in long-term innovation efforts. Policies that enhance competitive dynamism and provide institutional flexibility may further enable executive leadership to translate authority into sustainable innovation capability.
In summary, this study underscores the importance of aligning executive authority, intangible assets, and digital technologies to foster sustainable innovation resilience in an increasingly uncertain environment.
6. Limitations and Future Research
Despite its theoretical and practical contributions, this study has several limitations that suggest promising directions for future research.
First, the empirical setting is confined to Chinese listed A-share firms. Given China’s distinctive institutional environment and governance structures, caution is warranted when generalizing the findings to Western economies or other emerging markets. Differences in ownership patterns, reputation formation mechanisms, digital infrastructure, and executive governance norms may shape the relationship between CEO power and sustainable innovation resilience in distinct ways. Future research could conduct cross-country comparisons or examine private and small- and medium-sized enterprises to assess the external validity of the findings.
Second, although corporate reputation is identified as a key mediating mechanism, CEO power may influence sustainable innovation resilience through additional channels. Constructs such as brand equity, strategic agility, organizational resilience culture, or internal innovation governance structures may also play important roles. Future studies could adopt more complex mediation frameworks to disentangle multiple parallel or sequential pathways.
Third, while AI adoption is measured using disclosure-based and investment-based proxies consistent with the prior literature, these indicators may not fully capture the depth, scope, or quality of actual AI implementation. Textual measures may partly reflect symbolic communication, whereas financial investment indicators may not isolate AI-specific applications from broader digital transformation initiatives. Future research could incorporate multi-source data, including survey evidence, internal digital adoption records, or third-party assessments of technological capability, to enhance measurement precision.
Fourth, although we include industry-by-year fixed effects to absorb time-varying industry-level shocks, the empirical design remains primarily at the firm level and does not explicitly model hierarchical institutional or regional structures. Broader contextual factors, such as regional governance quality, institutional development, or sector-specific innovation regimes, may interact with executive authority in shaping sustainable innovation outcomes. Future research could adopt multilevel modeling frameworks to further disentangle cross-level interactions and provide a more refined understanding of how leadership effects are embedded within broader institutional environments.
Finally, despite the use of panel data, the analysis lacks micro-level process evidence. Qualitative or mixed-method research, including longitudinal case studies or executive interviews, could offer richer understanding of how CEOs deploy authority, leverage AI tools, and mobilize reputational capital in specific crisis or transformation contexts. Such approaches would further illuminate the behavioral mechanisms underlying sustainable innovation resilience.