Article

Multi-Time-Scale Energy Storage Stochastic Planning for Power Systems During Typhoon

1
School of Electrical Engineering, Xi’an Jiaotong University, Xi’an 710049, China
2
School of Energy and Electrical Engineering, Qinghai University, Xining 810016, China
*
Author to whom correspondence should be addressed.
Sustainability 2026, 18(5), 2416; https://doi.org/10.3390/su18052416
Submission received: 26 January 2026 / Revised: 20 February 2026 / Accepted: 24 February 2026 / Published: 2 March 2026

Abstract

The high penetration of renewable energy is becoming an important feature of new power systems. However, the power grid is facing greater threats of failures with the increasing frequency of extreme weather, making it necessary to enhance the resilience of power systems. In this paper, a multi-time-scale energy storage planning system is proposed for power system resilience improvement. Firstly, the characteristics of multi-time-scale energy storage are analyzed, and models of battery energy storage and hydrogen energy storage are established. Secondly, based on an analysis of random extreme weather scenarios, a bi-level stochastic programming model for multi-energy storage aimed at enhancing the resilience of power systems is constructed. Finally, based on the modified IEEE-24 node system, the model solution and example analysis are carried out, and the optimal configuration scheme for multi-energy storage is obtained. The results show that multi-energy storage is able to adjust more flexibly and effectively improve the resilience of the power system. Compared with the configurations of short-term and long-term energy storage systems, adopting multi-timescale energy storage reduces the total cost by 22.77% and 14.08%, respectively, and improves resilience by 4.33% and 0.67%, respectively.

1. Introduction

As the consumption of fossil energy and climate challenges intensify, the large-scale application of renewable energy has become a crucial initiative for the clean energy transition [1,2,3]. At the same time, extreme disasters such as typhoons and heavy rainfall are occurring more frequently, posing serious threats to the safe operation of power systems [4]. However, traditional power systems are difficult to manage, given the uncertainty of renewable energy, and are vulnerable to large-scale blackouts caused by extreme weather [5]. Therefore, it is necessary to study methods of improving the resilience of the power system to ensure its safe and stable operation [6].
Resilience refers to a power system’s ability to limit the degradation, severity, and duration of its performance following extreme events [7]. The existing literature on resilient power systems mainly focuses on resilience assessments and resilience improvement [8]. Power system resilience assessments primarily include a static resilience assessment and a dynamic resilience assessment. Among static assessments, Ref. [9] used the graph theory approach to construct resilience indicators to quantify system resilience. In Ref [10], a capacity accessibility index based on grid topology is proposed and applied to the optimal configuration of photovoltaic and energy storage, thereby enhancing the resilience of the distribution network. Ref. [11] investigated local topology summaries derived from a topological data analysis framework to assess the resilience of transmission networks. The dynamic resilience evaluation index is mainly based on the system performance curve under extreme disasters, which can better reflect the robustness and resilience of the system under extreme disasters [12]. Ref. [13] used the Monte Carlo method to simulate the impact of typhoons on the power grid, and selected the weighted loss of load as the evaluation index for resilience. Ref. [14] synthesized the traditional area-missing index, the system transient steady-state index, and the economic index to construct a weighted resilience–economic space evaluation system. Ref. [15] proposed a resilience evaluation index based on the area ratio of the resilience curve, which effectively reflected the disaster duration, system recovery time and fault loss.
Numerous studies have examined methods of improving the resilience of power systems [16]. Based on the timing of resilience enhancement measures, they can be categorized into three stages: the preventive stage before an extreme event [17], the response stage during the event [18], and the recovery stage after the event [19]. The main measures in the prevention phase include line reinforcement, vegetation management and flexible resource planning. Ref. [20] proposed a three-layer optimization model considering line reinforcement and island formation, and used the relaxed Benders algorithm to solve the model. In Ref. [21], a vehicle-mounted mobile emergency generator is introduced into the distribution network, and a two-stage scheduling framework based on pre-positioning and real-time allocation is proposed. In the response stage, measures are primarily built on preparations from the preventive stage, further combining operational control strategies to enhance system resilience. In Ref. [22], a coordinated operation strategy considering high-voltage distribution network reconfiguration and energy storage control is proposed. Ref. [23] develops an emergency dispatch strategy that considers thermal unit ramping and distributed control coordination to improve the resilience of hybrid power systems under sudden disturbances. The main measures in the recovery stage include black start, network reconfiguration, and component repair operations. In Ref. [24], considering network reconfiguration and unit pre-deployment, the system is effectively restored by using a distributed power supply, regional communication system and other resources. Ref. [25] focuses on the coordinated black-starting of a wind–solar-storage microgrid and thermal power units, and proposes a coordinated control strategy for a wind–solar-storage energy power station as a black-start power source.
The optimal configuration of energy storage is of great significance in improving the resilience of power systems [26]. In extreme scenarios, current energy storage planning strategies mainly focus on the generation of typical scenario sets [27], the construction of planning models [28], and the improvement of solving algorithms [29]. In Ref. [30], considering the time–space characteristics of a typhoon and the uncertainty set of the line fault state, a DAD model considering energy storage configuration is established with the minimum weighted load loss as the goal. Ref. [31] proposed the coordinated planning of mobile electric–hydrogen energy storage for remote power system resilience enhancement. Ref. [32] proposed off-site and on-site modes of hydrogen energy storage, and constructed a bi-level programming algorithm to improve the resilience of a power system. Ref. [33] established a two-stage optimization method by using the spatial flexibility of mobile energy storage, and effectively improved the resilience of a power system by optimizing the investment and operation strategies for energy storage.
In summary, there are research foundations focused on energy storage planning to improve power system resilience. However, the current research results have some shortcomings in the large-scale application of energy storage. The primary weakness is the lack of an energy storage planning method to ensure sustained power support during long-lasting extreme weather events in power systems with high renewable penetration. The large-scale integration of renewable energy significantly increases operational uncertainty and the demand for system flexibility, while most currently deployed energy storage is designed for short-duration balancing and is insufficient to maintain critical supply across multi-day outages. Therefore, it is imperative to establish a safe and reliable multi-time-scale energy storage system to cope with long-lasting and destructive extreme weather.
To make up for the deficiencies of the current research, this paper proposes a multi-time-scale energy storage planning method for power system resilience improvement under a long-lasting disaster. The main contributions are as follows. Firstly, a multi-time-scale energy storage model is proposed to alleviate the short-term and long-term balance adjustment pressures on a power system under extreme weather. Secondly, the impact mechanism of prolonged typhoons on the structure of the power system and the output of renewable energy is analyzed, and a stochastic planning model for the allocation and siting of multi-timescale energy storage is proposed. Finally, an iterative solution method using a two-layer model is proposed, and the effectiveness of the model is verified in the improved case. Compared with the current literature, its features are shown in Table 1.
The remainder of this paper is organized as follows. Section 2 constructs the multi-time-scale energy model. Section 3 analyzes the impact of typhoons on the power system. Section 4 constructs a bi-level stochastic planning model to improve power system resilience. Section 5 proposes an iterative solution method for the two-layer model. Section 6 verifies the validity of the model based on a modified IEEE-24 node system. Section 7 is the conclusion of this paper.

2. Multi-Time-Scale Energy Storage Model

Different energy storage technologies have significantly different technical characteristics, and no single technology currently combines fast charge/discharge rates, large capacity, and long discharge durations. Therefore, this paper combines the short-term energy storage represented by battery energy storage and the long-term energy storage represented by hydrogen energy storage to construct a multi-time-scale energy storage model, which provides a multi-period and full-level resilience improvement scheme for the power system.

2.1. Battery Energy Storage Model

In siting and sizing energy storage systems, the time intervals are typically divided into several minutes or an hour, so it is unnecessary to consider the transient model of the storage system, and only the steady-state process needs to be analyzed. The main constraints of battery energy storage are as follows.
e i , t = e i , t 1 + η c h P i , t 1 c h Δ t P i , t 1 d s η d s Δ t
e i , 0 = e i , T
S O C i , t = e i , t E r a t e , i
S O C min S O C i , t S O C max
0 P i , t c h P r a t e , i
0 P i , t d s P r a t e , i
P i , t c h P i , t d s = 0
where e i , t is the residual energy of battery at time t of node i, MWh, Δ t represents a time interval, s, S O C i , t is the state of charge of the battery, S O C max and S O C max are the maximum and minimum limits of S O C i , t , respectively, E r a t e , i is the rated capacity of the battery, MWh, P r a t e , i is the rated power of the battery, MW, P i , t c h and P i , t d s represent the battery’s charging and discharging power, MW, respectively, η c h and η d s represent the battery’s charging and discharging efficiency, respectively, T is the total scheduling period. Equations (1)–(2) represent the power balance constraints, Equations (3)–(4) are the SOC constraints, and Equations (5)–(6) are the charging and discharging power constraints. Equation (7) is the operating state constraint, which means that the battery energy storage system can only be in one of three states: charging, discharging, or idle.

2.2. Hydrogen Energy Storage Model

Hydrogen energy primarily consists of hydrogen storage, electrolysis, and fuel cell systems [37]. The main processes of hydrogen energy operation can be divided into hydrogen production via electrolysis, hydrogen storage, and hydrogen consumption through fuel cells. The detailed mathematical models for each component are as follows.
h i , t el = η el P i , t el Δ t
δ min e l P rate , i e l P i , t e l δ max e l P rate , i e l
H i , t = H i , t 1 + h i , t 1 e l h i , t 1 f c
H i , 0 = H i , T
S O H i , t = H i , t H r a t e , i
S O H min S O H i , t S O H max
0 h i , t e l h r a t e , i
0 h i , t f c h r a t e , i
P i , t f c = η f c h i , t f c Δ t
δ min f c P rate , i f c P i , t f c δ max f c P rate , i f c
where h i , t e l and h i , t f c represent the hydrogen output of the electrolytic cell and fuel cell, Nm3/h, respectively, P i , t e l and P i , t f c represent the input power of the electrolytic cell and fuel cell, MW, respectively, P r a t e , i e l and P r a t e , i f c represent the rated power of the electrolytic cell and fuel cell, MW, respectively, η c h and η d s represent the charging and discharging efficiency, respectively, δ max e l and δ min e l are the maximum and minimum technical limits of the electrolytic cell, respectively δ max f c and δ min f c are the maximum and minimum technical limits of the fuel cell, respectively, H i , t is the residual hydrogen of the hydrogen tank, Nm3, H r a t e , i is the rated capacity of the hydrogen tank, Nm3, S O H i , t is the state of hydrogen, S O H max and S O H min are the maximum and minimum limits of S O H i , t , respectively. Equations (8)–(9) are related to the electrolytic cell, including the hydrogen production efficiency constraint and the power electrolytic cell constraint. Equations (10)–(15) represent the hydrogen model, including the hydrogen tank capacity balance constraint, the hydrogen tank state constraint, and the hydrogen tank output capacity range constraint. Equations (16)–(17) are the fuel cell model, including the fuel cell hydrogen consumption constraint and fuel cell power range constraint.

2.3. Multi-Time-Scale Characteristics of Energy Storage

The fast response speed of a battery is ideal for short-term power support in power systems. However, their storage capacity is heavily limited by energy rating and scale. In contrast, hydrogen storage, though less efficient and slower to respond, offers large-scale storage capacity and high discharge depth. The complementary characteristics of batteries and hydrogen storage allow them to work together to enhance system flexibility and performance. This paper focuses on the ramp rate and energy storage duration constraints of batteries and hydrogen storage, highlighting their respective strengths and limitations.
P i , t c h P i , t 1 c h Δ P i
P i , t d s P i , t 1 d s Δ P i
P i , t e l P i , t 1 e l Δ P i e l
P i , t f c P i , t 1 f c Δ P i f c
T B min η d s E rate , i P rate , i T B max
T H min η f c H rate , i P rate , i f c T H max
where Δ P i , Δ P i e l , Δ P i f c are the maximum ramp rates of a battery, electrolytic cell, and fuel cell, MW, respectively, T B max and T B min are the maximum and minimum battery storage duration, h, respectively T H max and T H min are the maximum and minimum hydrogen storage duration, h, respectively. Equations (18)–(19) are the ramp rate constraints of battery energy storage, Equations (20)–(21) are the ramp rate constraints of hydrogen energy storage, and Equations (22)–(23) represent the duration constraint of battery energy storage and hydrogen energy storage, respectively.

3. The Influence of Typhoons on Power Systems

A typhoon is accompanied by high wind speeds and heavy rainfall, which seriously affect grid structures and aggravate the uncertainty of renewable energy. Therefore, this section first proposes a method to evaluate the resilience of a power system under the influence of a typhoon, and then analyzes the impact of a typhoon on the power system structure and renewable energy based on a physical modeling method and probability statistical method, respectively.

3.1. Resilience Evaluation Model

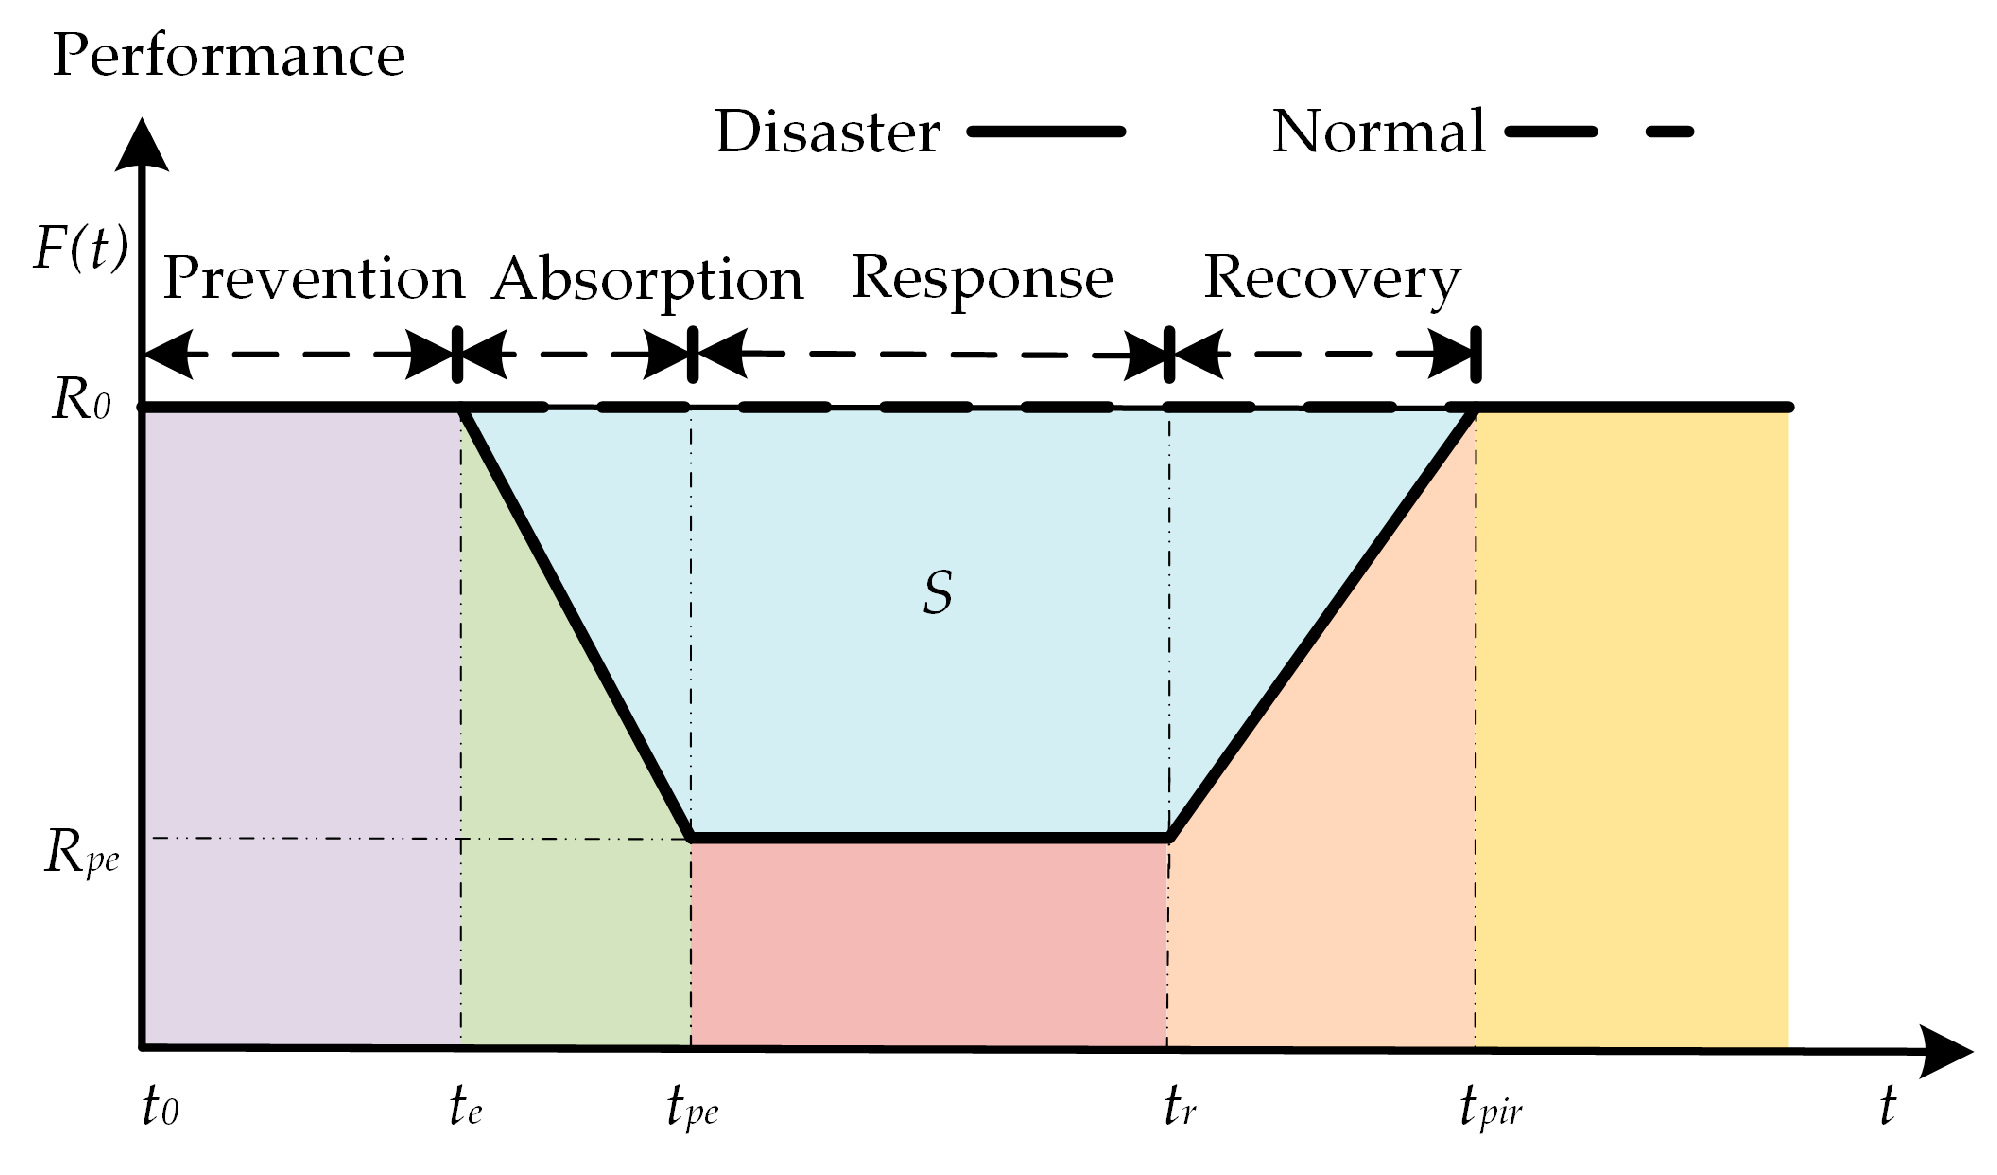
To better quantify the resilience level of power systems under extreme disasters and compare the advantages of different strategies, it is necessary to establish a scientific and rational resilience evaluation index. In Figure 1, the resilience curve of the power system illustrates its performance following extreme events. Under normal operating conditions, the system’s performance is represented by the solid line, while under extreme conditions, the system’s operational performance is represented by the dotted line.
Before te, the system operates normally. From te to tpe, the system withstands the impact of the event. It then enters an adaptive state from tpe to tr. After recovery is completed, the system returns to its original normal state at tpir. Based on the operation performance curve between te and tpir, the resilience of the system can be measured and quantified [38].
R S = t e t p i r F ( t ) d t = t e t p i r i N ( P l o a d , i P L S , i ( t ) ) d t
where R S is the resilience evaluation index, F ( t ) is the actual system performance, P l o a d , i ( t ) is the rated load power, MW, and P L S , i ( t ) is the load-shedding amount, MW.
To further facilitate calculations and comparisons, Rs is normalized as follows.
R M = R S R 0 = t e t p i r i N ( P l o a d , i P L S , i ( t ) ) d t t e t p i r i N P l o a d , i d t
where R M is the normalized resilience evaluation index and R 0 is the resilience level under normal conditions. This normalized resilience evaluation index can simultaneously reflect the duration of the power system’s fault-to-recovery process and the magnitude of the loss caused by the fault. It provides a more accurate assessment of the system’s ability to withstand extreme disasters.

3.2. Uncertainty of Line Faults During Typhoons

The Batts model is a mature and simple typhoon wind field model, and is used to analyze the influence of a typhoon on a power system in this paper [39]. The specific formula for wind speed is as follows.
v = V R max r R max , r R max V R max R max r x , r > R max
where r is the distance from any point to the typhoon center, km, R max is the maximum radius of the typhoon, km, V R max is the maximum wind speed of the typhoon, km/h, and x is the intensification coefficient. Based on different geographic locations, x generally ranges between 0.5 and 0.7.
In the classic Batts model, the maximum wind radius R max is negatively correlated with the pressure difference between the typhoon center and the ambient pressure. The empirical formula is as follows [39].
R max = exp 0.1239 Δ P 0.6003 + 5.1034
where Δ P is the Typhoon pressure difference, hPa. Existing studies suggest that empirical formulations established from North Atlantic basin data can also provide reasonable applicability for tropical cyclone modeling in the Western North Pacific basin [40]. Therefore, this paper assumes that Asian typhoons and U.S. hurricanes share similar wind-field characteristics, and the Batts model’s empirical equation is adopted to analyze extreme typhoon-induced hazard events in Asia.
The ability of transmission lines to resist typhoon-induced damage mainly depends on their maximum wind resistance. When the actual wind speed acting on the transmission line exceeds this limit, the probability of failure significantly increases. Under these circumstances, the fault probability model for transmission lines is shown in Equation (28).
P f = 0 , v v des exp 0.6931 ( v v des ) v des 1 , v des < v < 2 v des 1 , v 2 v des
where P f is the fault probability of the transmission line and v des is the maximum wind resistance speed of the transmission line, km/h.
When calculating the fault probability of transmission lines, the lines are divided into multiple sections of equal length to reflect the impact of disasters on line faults. Assuming that each segment is very short and the fault probabilities of different segments are independent, the fault probability of the transmission line can be expressed as follows:
P i j err = 1 k = 1 n err 1 P f , k m i j
where P i j err is the fault probability of line ij, n e r r is the number of segments of line ij, P f , k is the fault probability of the k-th segment of line ij, and m i j is the number of conductors in line ij.
In order to ensure the safety of the repair personnel, it is assumed that the damage to the transmission line can be evaluated and the repair process can be started only after the typhoon subsides. The repair time is generally assumed to follow a lognormal distribution, and its probability density function can be expressed as follows.
f ( T ) = 1 T 2 π σ l exp ( ln T μ l ) 2 σ l 2 ,   T > 0
where μ l and σ l represent the mean and standard deviation of the recovery time distribution, respectively.
Therefore, the lognormal distribution can be used as an approximate model for the repair time of transmission lines. Through Monte Carlo sampling, the repair time for faulted lines can be obtained.

3.3. Uncertainty of Wind and Solar Power Output During Typhoons

The output of renewable energy sources is closely related to weather conditions. The obvious fluctuation in meteorological factors during typhoon events makes it difficult to simulate uncertainty [41]. In addition, wind farms may experience turbine cut-outs and even blade damage during typhoon passage, while PV systems typically operate under significantly reduced irradiance. Therefore, to simplify the impact of typhoons on renewable energy, this paper assumes that renewable energy units operate in a derated mode during typhoon passage and adopts a probabilistic statistical model to characterize the uncertainty of renewable energy.
The Weibull distribution is the most widely used in the probabilistic analysis of wind power, and the probability density function of wind speed can be expressed as follows:
f ( v ) = β θ v θ β 1 exp v θ β
where v is the wind speed, km/h, β is the shape parameter, and θ is the scale parameter. β and θ collectively determine the range of wind speed fluctuations.
P wind ( v ) = 0 , v < v c i P w i n d N + A + B v + C v 2 , v c i v < v r P w i n d N , v r v < v c o 0 , v v c o
where A, B, and C are coefficients determined by the characteristics of the wind turbine, P w i n d N is the rated power of the wind turbine, MW, v c i is the cut-in speed of the wind turbine, km/h, v r is the rated wind speed of the wind turbine, km/h, and v c o is the cut-out speed of the wind turbine, km/h.
According to statistical studies, the Beta distribution effectively models the relationship between solar irradiance and output efficiency [42]. Therefore, it is assumed that daytime solar irradiance follows a Beta distribution, with its probability density function given by
f ( r ) = Γ ( α + β ) Γ ( α ) + Γ ( β ) ( r r max ) α 1 1 r r max β 1
where α and β are the shape parameters of the Beta distribution. r and rmax represent the solar irradiance and the maximum solar irradiance, W/m2, respectively.
Due to the strong linear relationship between PV power output and solar irradiance, the probability density function of PV output in the daytime is also approximated as a Beta distribution. Therefore, Equation (34) can be rewritten as follows:
f ( r ) = Γ ( α + β ) Γ ( α ) + Γ ( β ) P PV P PV max α 1 1 P PV P PV max β 1
where Γ ( ) is the gamma function, and P PV and P PV max represent the output power and rated power of the photovoltaic, MW, respectively.

4. Bi-Level Stochastic Model for Enhancing Power System Resilience

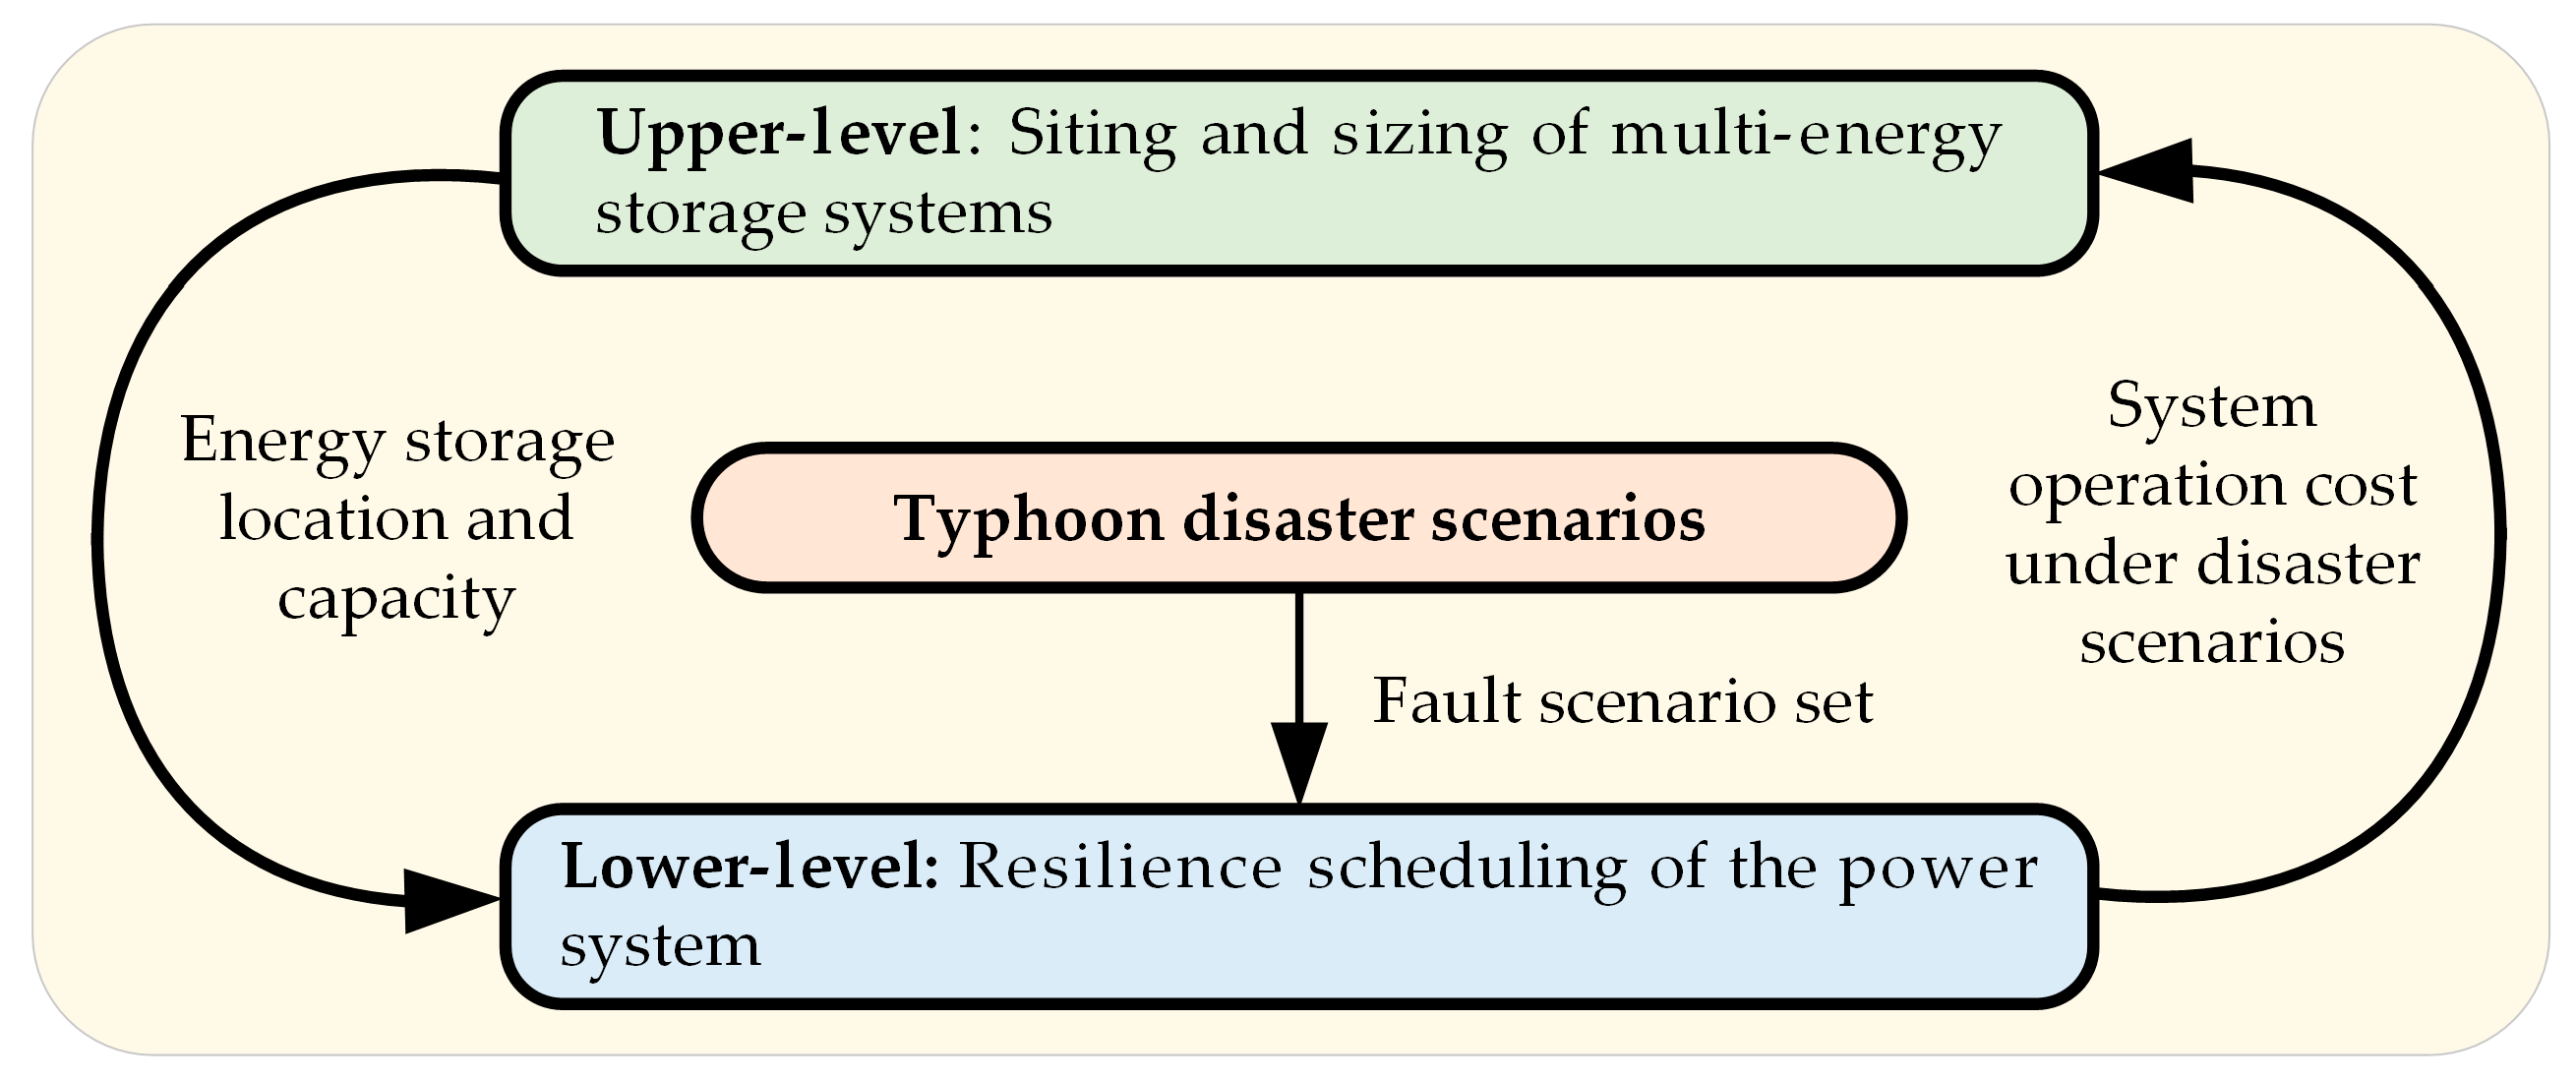
Based on the construction of the multi-time-scale energy storage model and the analysis of extreme disasters’ impact on a power grid, this section develops a two-level stochastic programming model aimed at enhancing the resilience of the power system. The specific framework is shown in Figure 2. The upper-level model addresses the siting and sizing of multi-time-scale energy storage, aiming to minimize the investment costs of energy storage and the operational costs. The lower-level model is constructed by first developing power system failure scenarios during typhoons, and then considering the resilience displayed by the power system under these disaster scenarios. Through the continuous iteration of the upper and lower models, the optimal energy storage planning scheme with the lowest sum of energy storage investment cost and grid operation cost during the disaster is realized.

4.1. Upper-Level Energy Storage Siting and Sizing Model

The upper-level problem addresses the siting and sizing of multi-time-scale energy storage systems. The objective function is to minimize the annual investment cost of multi-time-scale energy storage systems and the system operation cost under extreme disaster scenarios. The specific objective function is as follows.
min C = C inv + s S p s C op , s
where C inv is the investment cost, CNY, S is the set of extreme weather scenarios, p s is the probability of occurrence of scenario s, and C op , s is the system operation cost under scenario s, CNY. The investment cost of the storage system includes the initial purchase cost C p u r , replacement cost C r e p , maintenance cost C r m , and residual value C r e s . The specific function is as follows.
C inv = C pur + C rep + C rm C res
The initial purchase cost of energy storage is primarily related to the cost of purchasing battery energy storage and hydrogen energy storage. The purchase cost of hydrogen storage includes electrolysis, hydrogen tanks, and fuel cells. The specific expressions are as follows.
C p u r = C pur k , ( k = B , e l , H , f c )
C pur B = ζ CR c E pur B E rate , i + c P pur B P rate , i
C pur el = ζ CR c pur el P r a t e , i e l
C pur H = ζ CR c pur H H rate , i
C pur fc = ζ CR c pur fc P r a t e , i f c
ζ CR = γ ( 1 + γ ) Y ( 1 + γ ) Y 1
where C pur k , ( k = B , e l , H , f c ) is the initial purchase cost of the battery, electrolysis, hydrogen tanks, and fuel cells, CNY; c E pur B and c pur H are the unit capacity purchase cost of the battery storage and hydrogen tanks, CNY/MWh; c P pur B , c pur el and c pur fc are the unit power purchase cost of battery storage, electrolysis, and fuel cells, CNY/MW; ζ CR is the capital recovery factor; Y is the system planning period; and γ is the discount rate.
The energy storage replacement cost is related to the replacement of battery storage and hydrogen storage systems. The specific formula is as follows.
C rep = k C rep k ,   ( k = B , el , H , fc )
C rep k = ζ CR n = 1 N rep k C pur k 1 + γ n Y N rep k + 1 ,   ( k = B , el , H , fc )
where C rep k , ( k = B , el , H , fc ) is the replacement cost of the battery, electrolysis, hydrogen tanks, and fuel cells, CNY; and N rep k , ( k = B , el , H , fc ) is the number of replacements of the battery, electrolysis, hydrogen tanks, and fuel cells.
In order to ensure the normal operation of energy storage across the life cycle, it is necessary to carry out maintenance work, such as maintenance and repair. The maintenance cost of energy storage can be expressed as follows:
C r m = C r m k , ( k = B , e l , H , f c )
C r m B = c r m B E rate , i
C r m el = c r m el P r a t e , i e l
C r m H = c rm H H rate , i
C r m f c = c r m f c P r a t e , i f c
where C rm k , ( k = B , e l , H , f c ) is the maintenance cost of the battery, electrolysis, hydrogen tanks, and fuel cells, CNY; c E rm B and c rm H are the unit capacity maintenance costs of battery storage and hydrogen tanks, CNY/MWh; and c rm el and c rm fc are the unit power maintenance costs of electrolysis and fuel cells, CNY/MW.
The residual value is primarily related to the initial purchase cost and remaining lifespan of the energy storage system. The specific expression is as follows.
C res = k C res k ,   ( k = B , el , H , fc )
C res k = ζ CR n = 1 N rep k + 1 ρ res C pur k 1 + γ n Y N rep k + 1 ,   ( k = B , el , H , fc )
where C res k , ( k = B , e l , H , f c ) is the residual value of the battery, electrolysis, hydrogen tanks, and fuel cells, CNY; and ρ r e s is the residual value rate of energy storage.
The constraints of the upper-level model need to satisfy the energy storage planning constraints.
0 E rate , i E rate , max
0 P rate , i P rate , max
0 P rate , i el P rate , max el
0 H rate , i H rate , max
0 P rate , i fc P rate , max fc
where E rate , max and H rate , max are the maximum configuration capacity of energy storage, MWh, and P rate , max , P rate , max el and P rate , max fc are the maximum configuration power of energy storage, MW.

4.2. Lower-Level Power System Operation Scheduling Model

The lower-level model focuses on each fault scenario caused by extreme disasters, where multi-time-scale energy storage systems collaborate with other components of the power system to enhance power system resilience. In addition, the economy of system operation should be taken into account to improve the utilization rate of renewable energy and reduce the cost of power generation. In order to facilitate the calculation, the lower-level model uses economy as the objective function, including power generation cost, penalties for renewable curtailment and resilience cost. In this paper, the load-supply level is used as the resilience performance curve, and the resilience cost can be quantified by the load-shedding cost. Therefore, the objective function can be expressed as follows:
min C op , s = C gen , s + C ab , s + C LS , s
where C g e n , s is the power generation operation cost, CNY; C a b , s is the penalty cost for abandoned renewable energy, CNY; and C L S , s is the load-shedding cost, CNY.
The specific expressions for each component are as follows.
C gen , s = n s g , t a g P gen , g , t , s 2 + b g P gen , g , t , s + c g
C abs , s = n s i , t c ab P ab , i , t , s
C LS , s = n s i , t c LS P LS , i , t , s
where P gen , g , t , s , is the power output of generator g, MW; P ab , i , t , s is the curtailed power of renewable energy, MW; P LS , i , t , s is the load-shedding amount, MW; a g , b g and c g are the generator unit cost coefficient, in units of CNY/MW2, CNY/MW, and CNY, respectively; c ab is the penalty cost per unit of curtailed power, CNY/MW; c LS is the penalty cost per unit of load shedding, CNY/MW; and n s is the number of scheduling cycles included within one year.
To ensure the reliability of the power system, the lower-level model must satisfy power system operational constraints. These constraints include system supply–demand balance, transmission capacity, and generator output limits. In particular, to avoid the nonlinearity introduced by alternating-current (AC) power flow in the optimization model, this paper adopts a direct-current (DC) power flow model to simplify the power flow equation into a set of linear equations. In DC power flow, bus voltage and line resistances are neglected, and the voltage phase angles are constrained, with the reference bus angle fixed at 0. The specific expressions are as follows.
i P wind , i , t , s + P PV , i , t , s P ab , i , t , s P load , i , t , s + P LS , i , t , s + g P gen , g , t , s + i P i , t , s ds P i , t , s ch + P i , t , s fc P i , t , s el = j P i , j , t , s
P i j max P i , j , t , s P i j max
P gen , g min P gen , g , t , s P gen , g max
P gen , g , t , s P gen , g , t 1 , s R U g
P gen , g , t 1 , s P gen , g , t , s R D g
0 P LS , i , t , s P load , i , t , s
0 P wind , i , t , s P wind , i max
0 P PV , i , t , s P PV , i max
P ab , i , t , s 0
P i , j , t , s = δ i , t , s δ j , t , s X i j
π 2 δ i , t , s π 2
where P wind , i , t , s is the wind power generation, MW; P PV , i , t , s is the solar power generation, MW; P load , i , t , s is the load demand, MW; P i , j , t , s is the power flow from node i to node j, MW; P i j max is the maximum transmission capacity, MW; P gen , g max is the maximum output limit of generator g, MW; P g e n , g min is the minimum output limit of generator g, MW; R U g is the maximum ramp-up rate of generator g, MW; R D g is the maximum ramp-down rate of generator g, MW; P wind , i max is the maximum output of wind power, MW; P PV , i max is the maximum output of solar power, MW; δ i , t , s is the voltage angle; and X i j is the impedance between nodes i and j. Equation (61) is the supply–demand balance constraint, Equation (62) is the transmission capacity constraint, Equation (63) is the generator output limits, Equations (64)–(65) are the generator ramp rate constraints, Equation (66) is the load-shedding constraint, Equations (67)–(69) are the renewable energy constraints, and Equations (70)–(71) represent the DC power flow constraints.
In addition to the above constraints, the lower model also includes the energy storage operation constraints mentioned in Section 2. Considering the coupling relationship between the upper-level planning stage and the lower-level operational stage, this study formulates a two-level stochastic planning model for multi-energy storage. The model can be described as follows.
min x C inv + E p h ( x , S ) s . t .   E q s .   ( 52 ) ~ ( 56 ) h ( x , s ) = min y ( s ) C op , s s . t .   E q s .   ( 1 ) ( 23 ) E q s .   ( 61 ) ~ ( 71 )
where x represents the decision variables of the upper-level model, E p h ( x , s ) represents the expected operational cost under all scenarios S, and h(x, s) is the operational cost function.

5. Solution Technique

5.1. Solution Method for the Lower Layer

The lower-level model is a nonlinear programming model that requires linearization processing. Nonlinearity mainly arises from two aspects: the quadratic terms in the generator operational cost function in Equation (58) and the nonlinear logical constraints in Equation (7).
For the generator operational cost in Equation (58), where the generator fuel cost is a quadratic function of power output, piecewise linearization is used to divide the quadratic terms into N segments. After processing, the generator operational cost can be expressed as follows.
C gen = n s g , t C gen , 0 + j = 1 N m g , j P gen , g , j
m g , j = C gen , j + 1 C gen , j P gen , j + 1 P gen , j
0 P gen , g , j P gen , j + 1 P gen , j N
where N is the number of segments, C gen , j represents the maximum cost of segment j, CNY, P gen , j represents the power output at the end of segment j, MW, and m g , j represents the slope of segment j.
The nonlinear logical constraint in Equation (7) is processed using the big M method.
0 P i , t c h u 1 M
0 P i , t d s u 2 M
u 1 , u 2 { 0 , 1 }
u 1 + u 2 = 1
where M is a sufficiently large positive number, and u1, u2 are binary variables used only for the transformation and solution of the model.

5.2. The Solution Method for the Bi-Layer Stochastic Planning Model

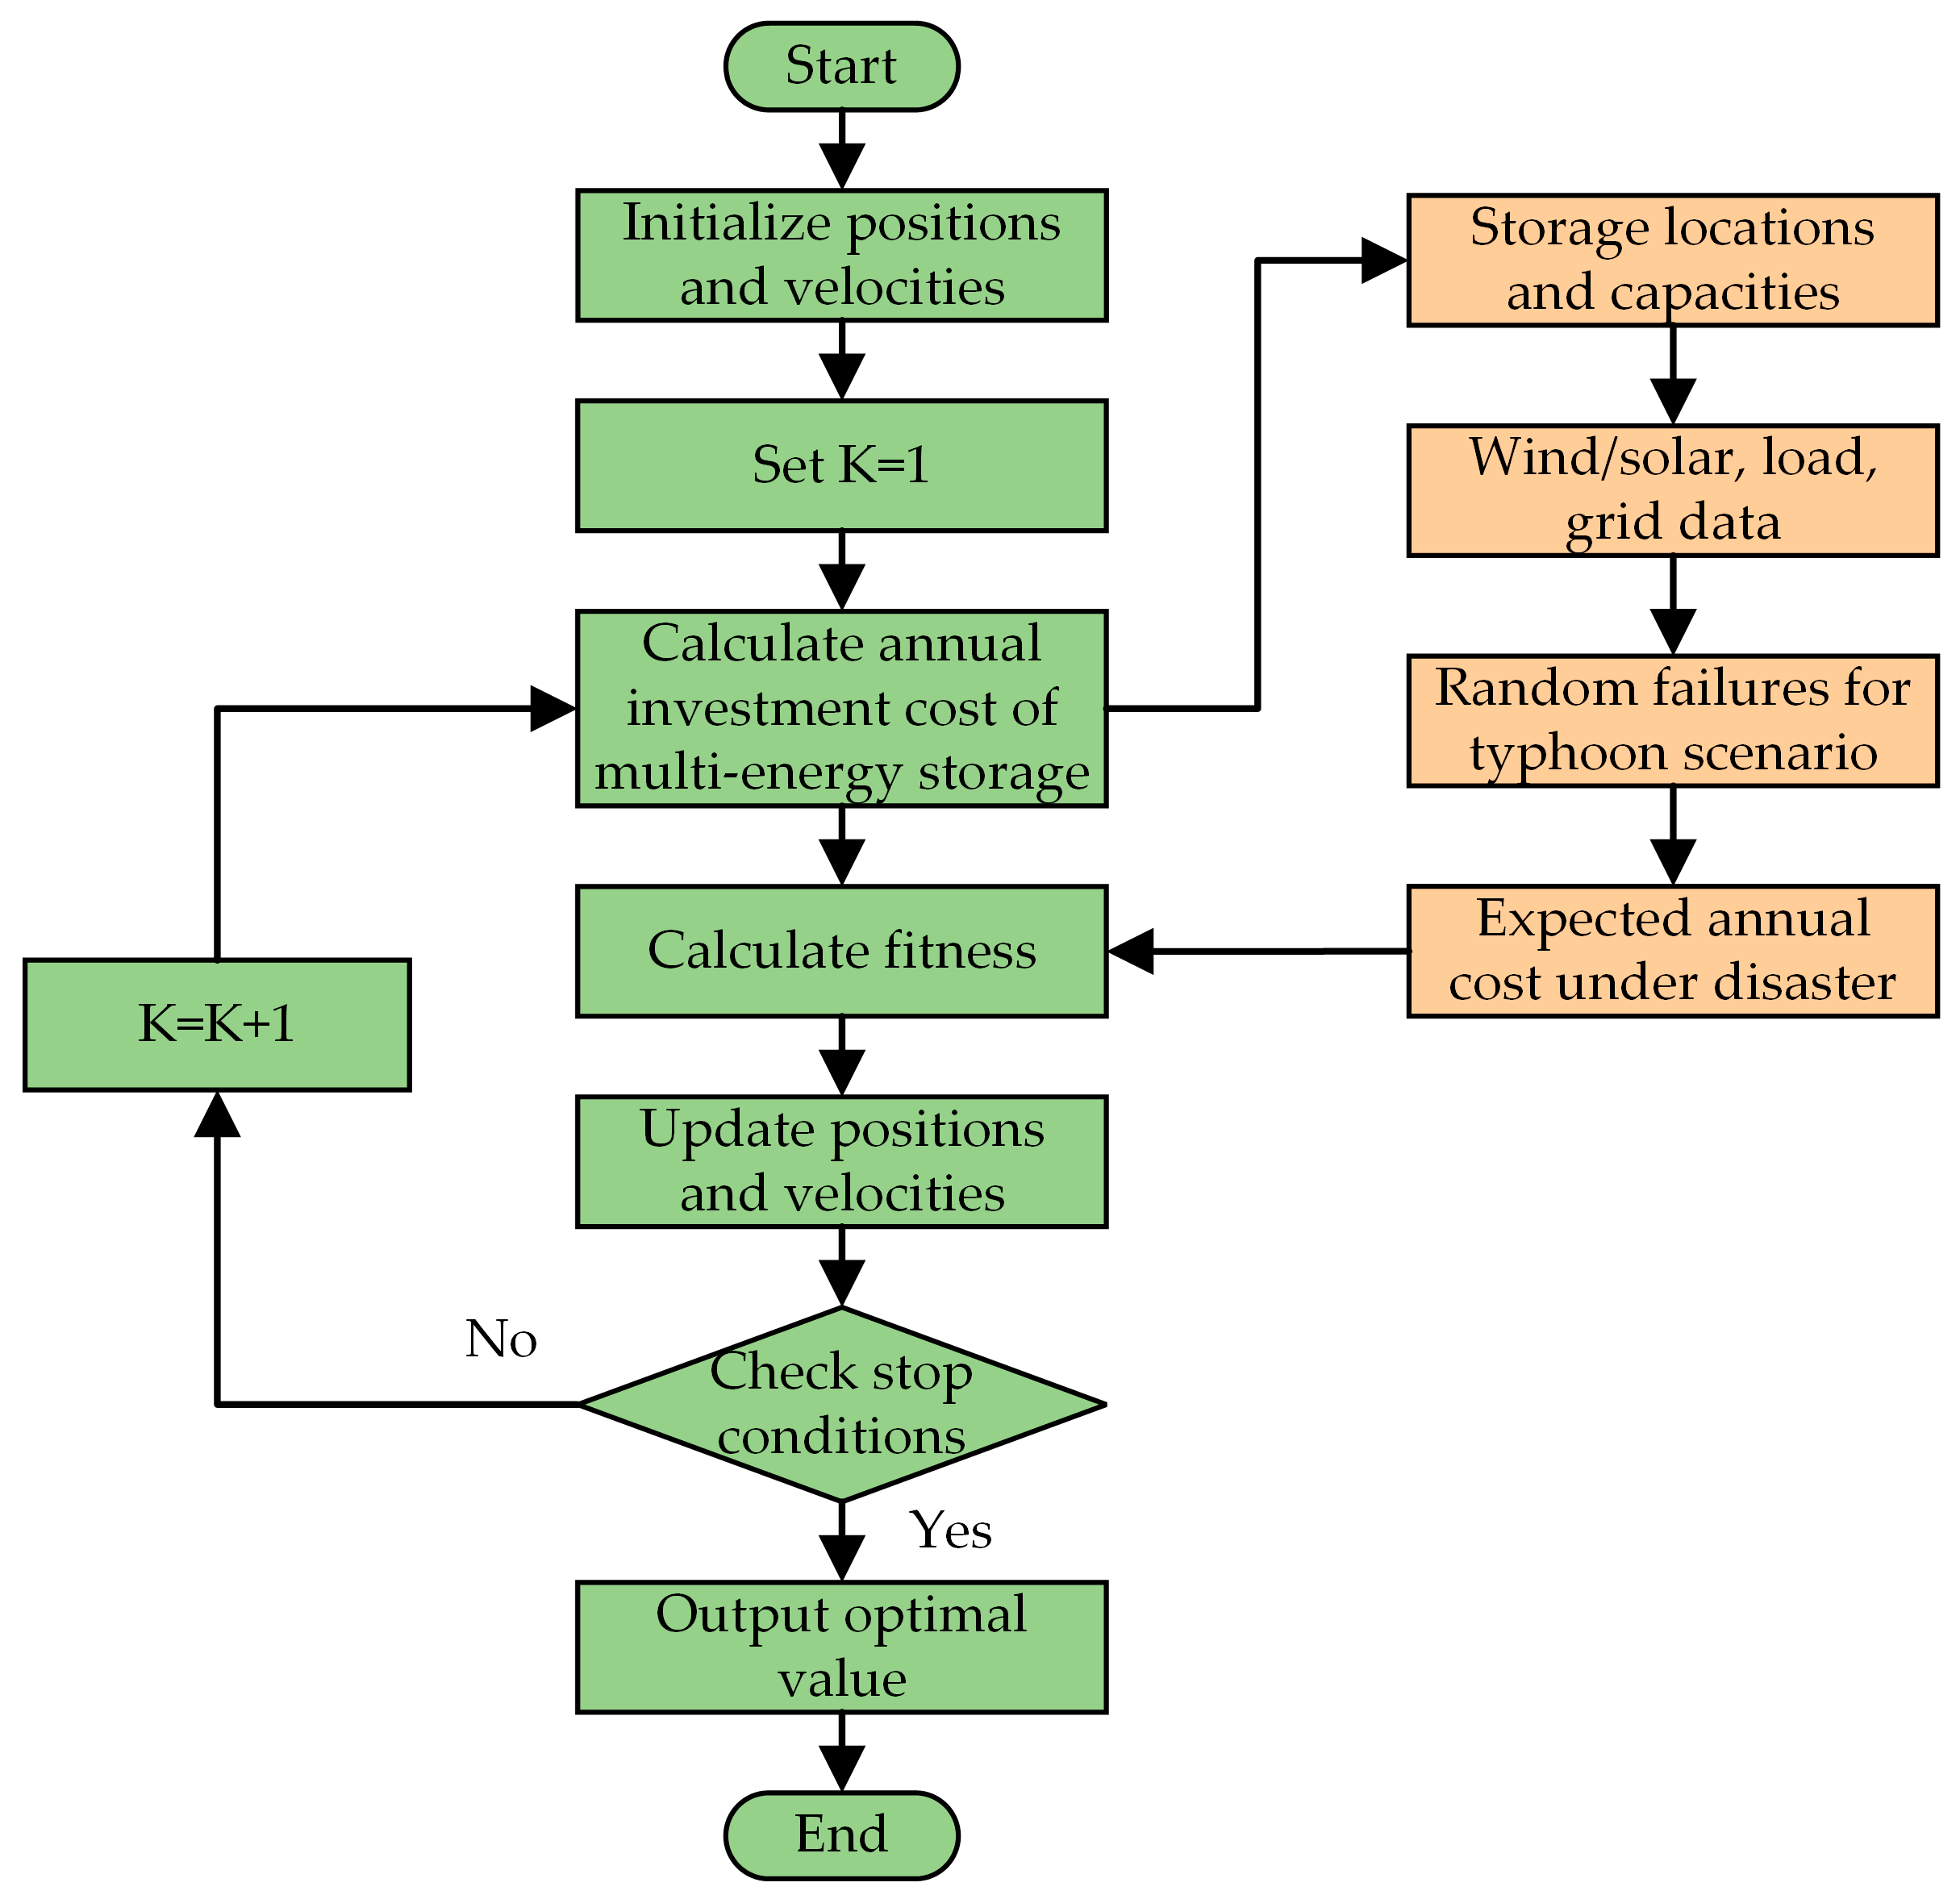
In this paper, the model is solved by combining an intelligent algorithm with mixed integer linear programming. The upper-level model uses the PSO algorithm with adaptive inertia weights to optimize the energy storage planning variables, while the lower-level model is programmed using Python 3.11.5 and the Gurobi 11.0.1 framework after linearization. The upper and lower optimization problems are solved iteratively, resulting in the optimal multi-energy storage planning solution. The solution process is shown in Figure 3.

6. Case Study

6.1. Case Description

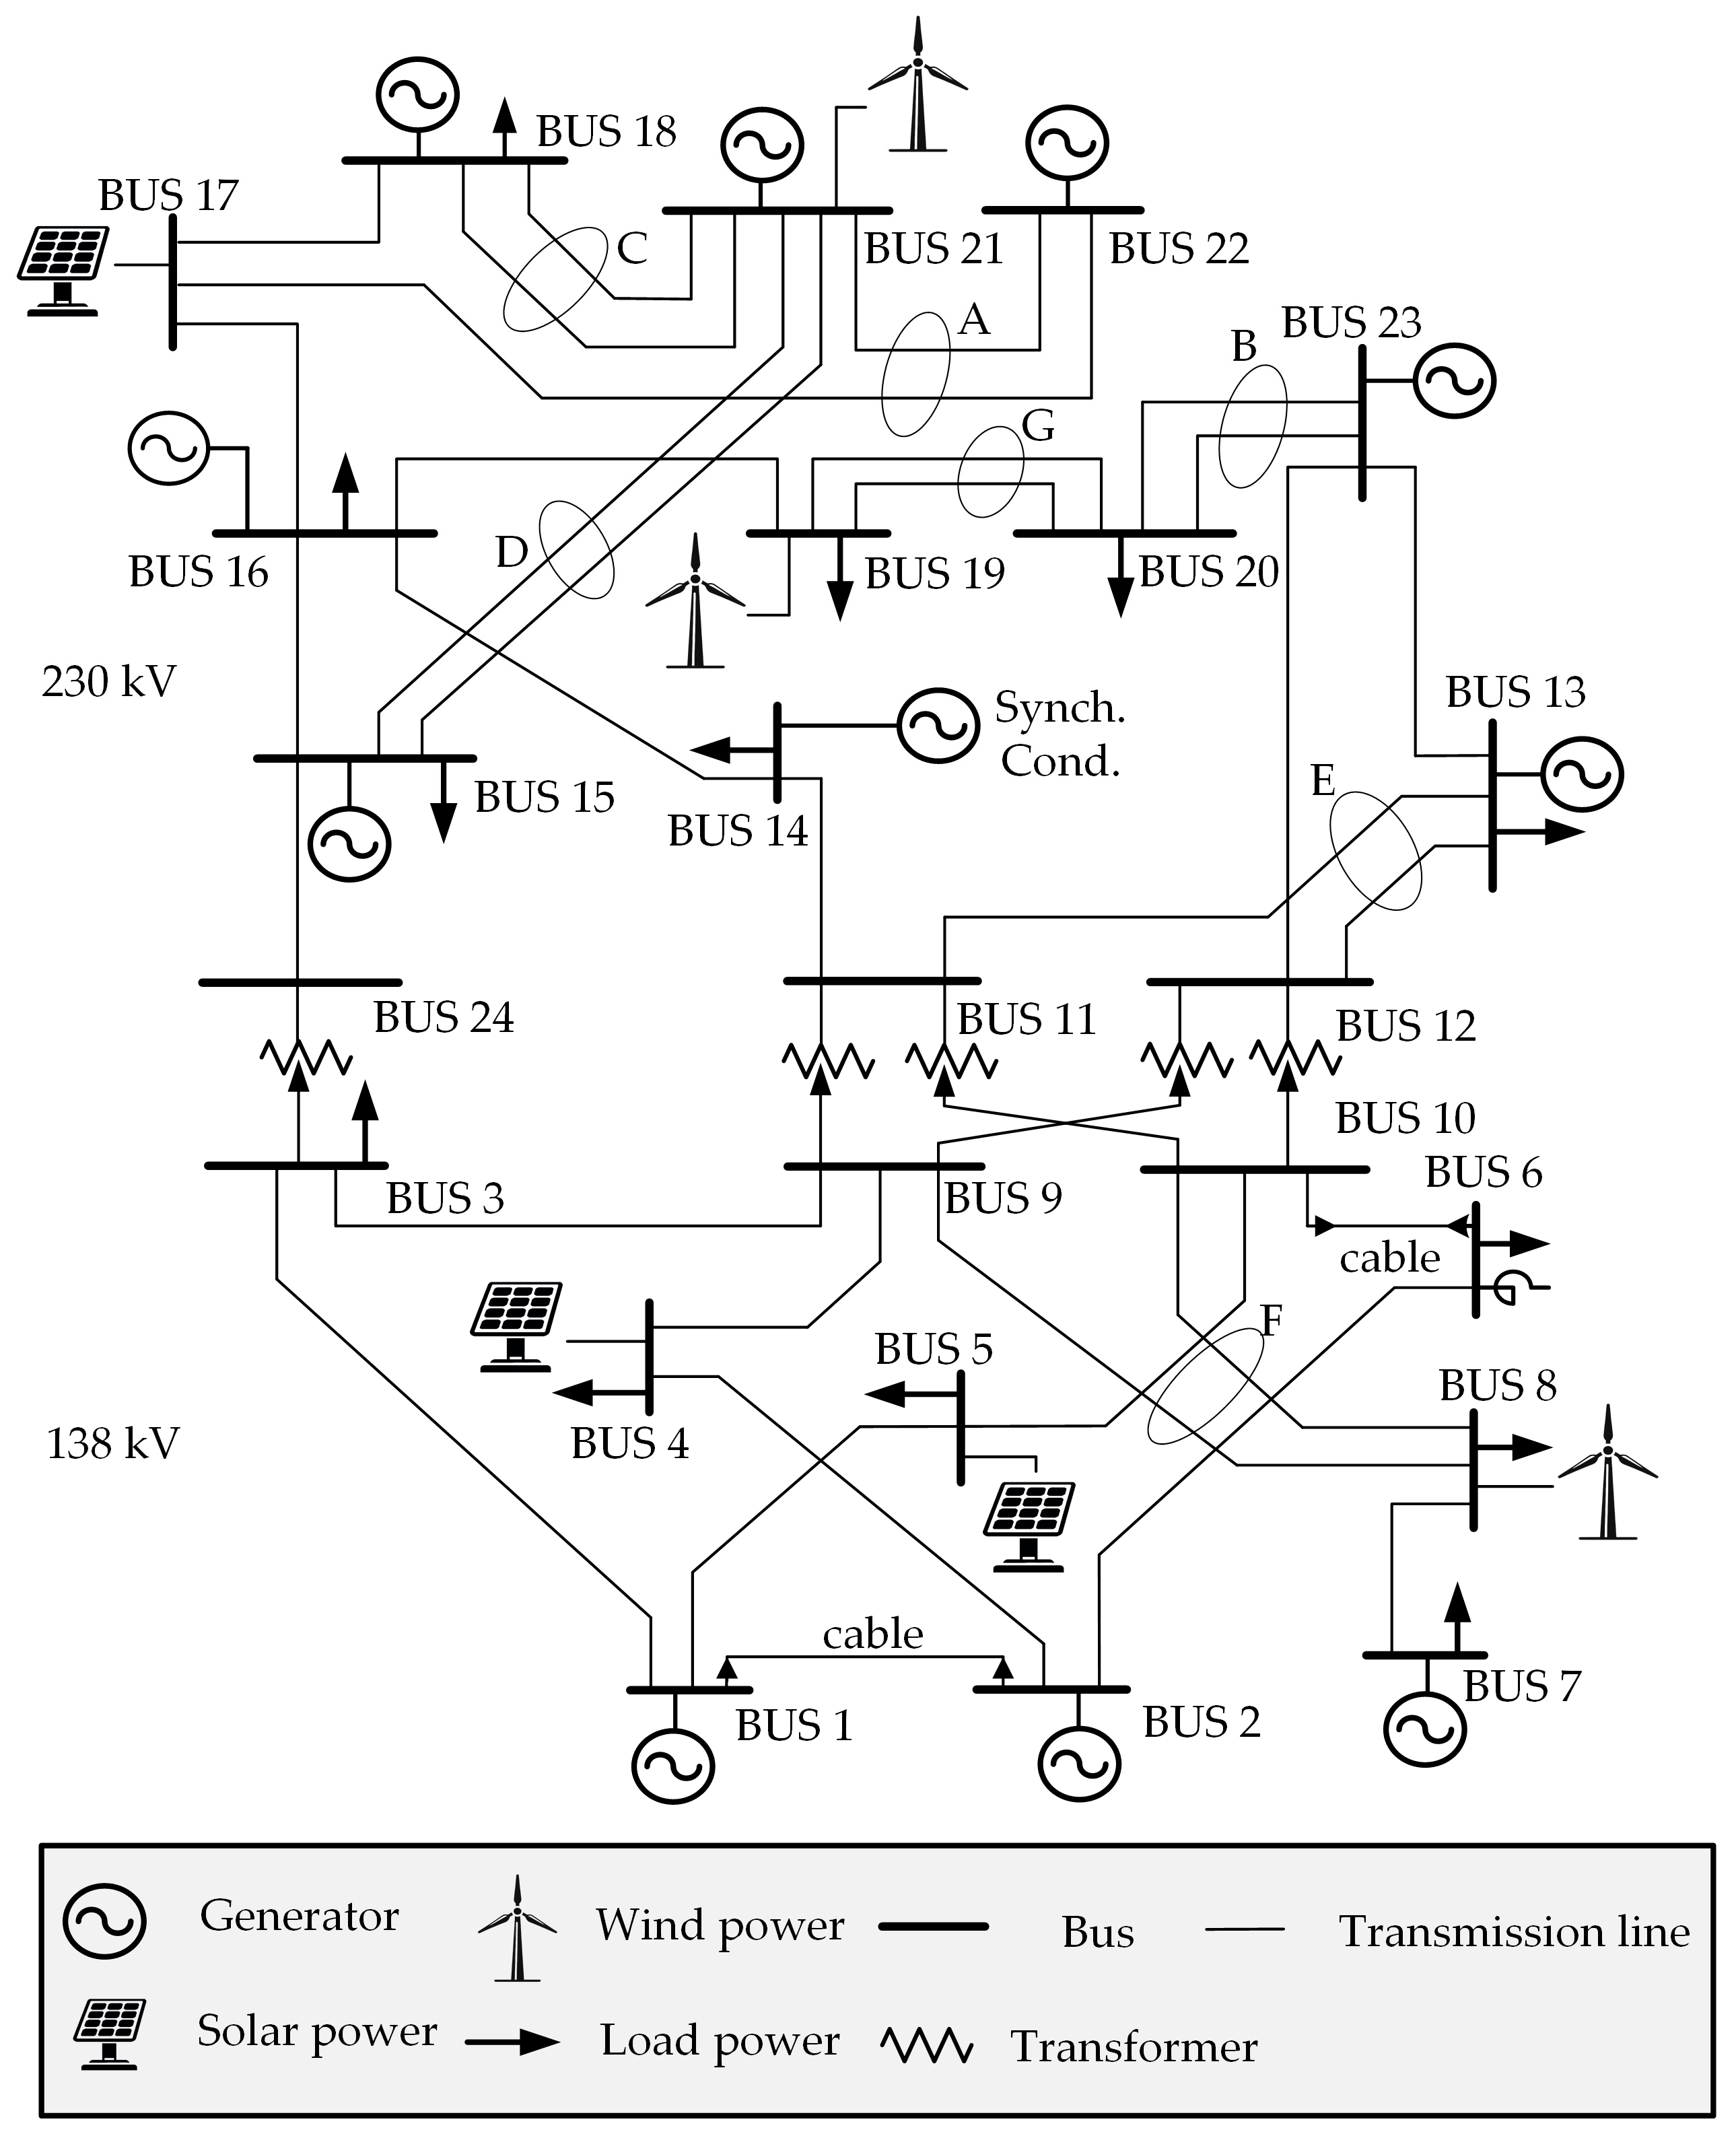
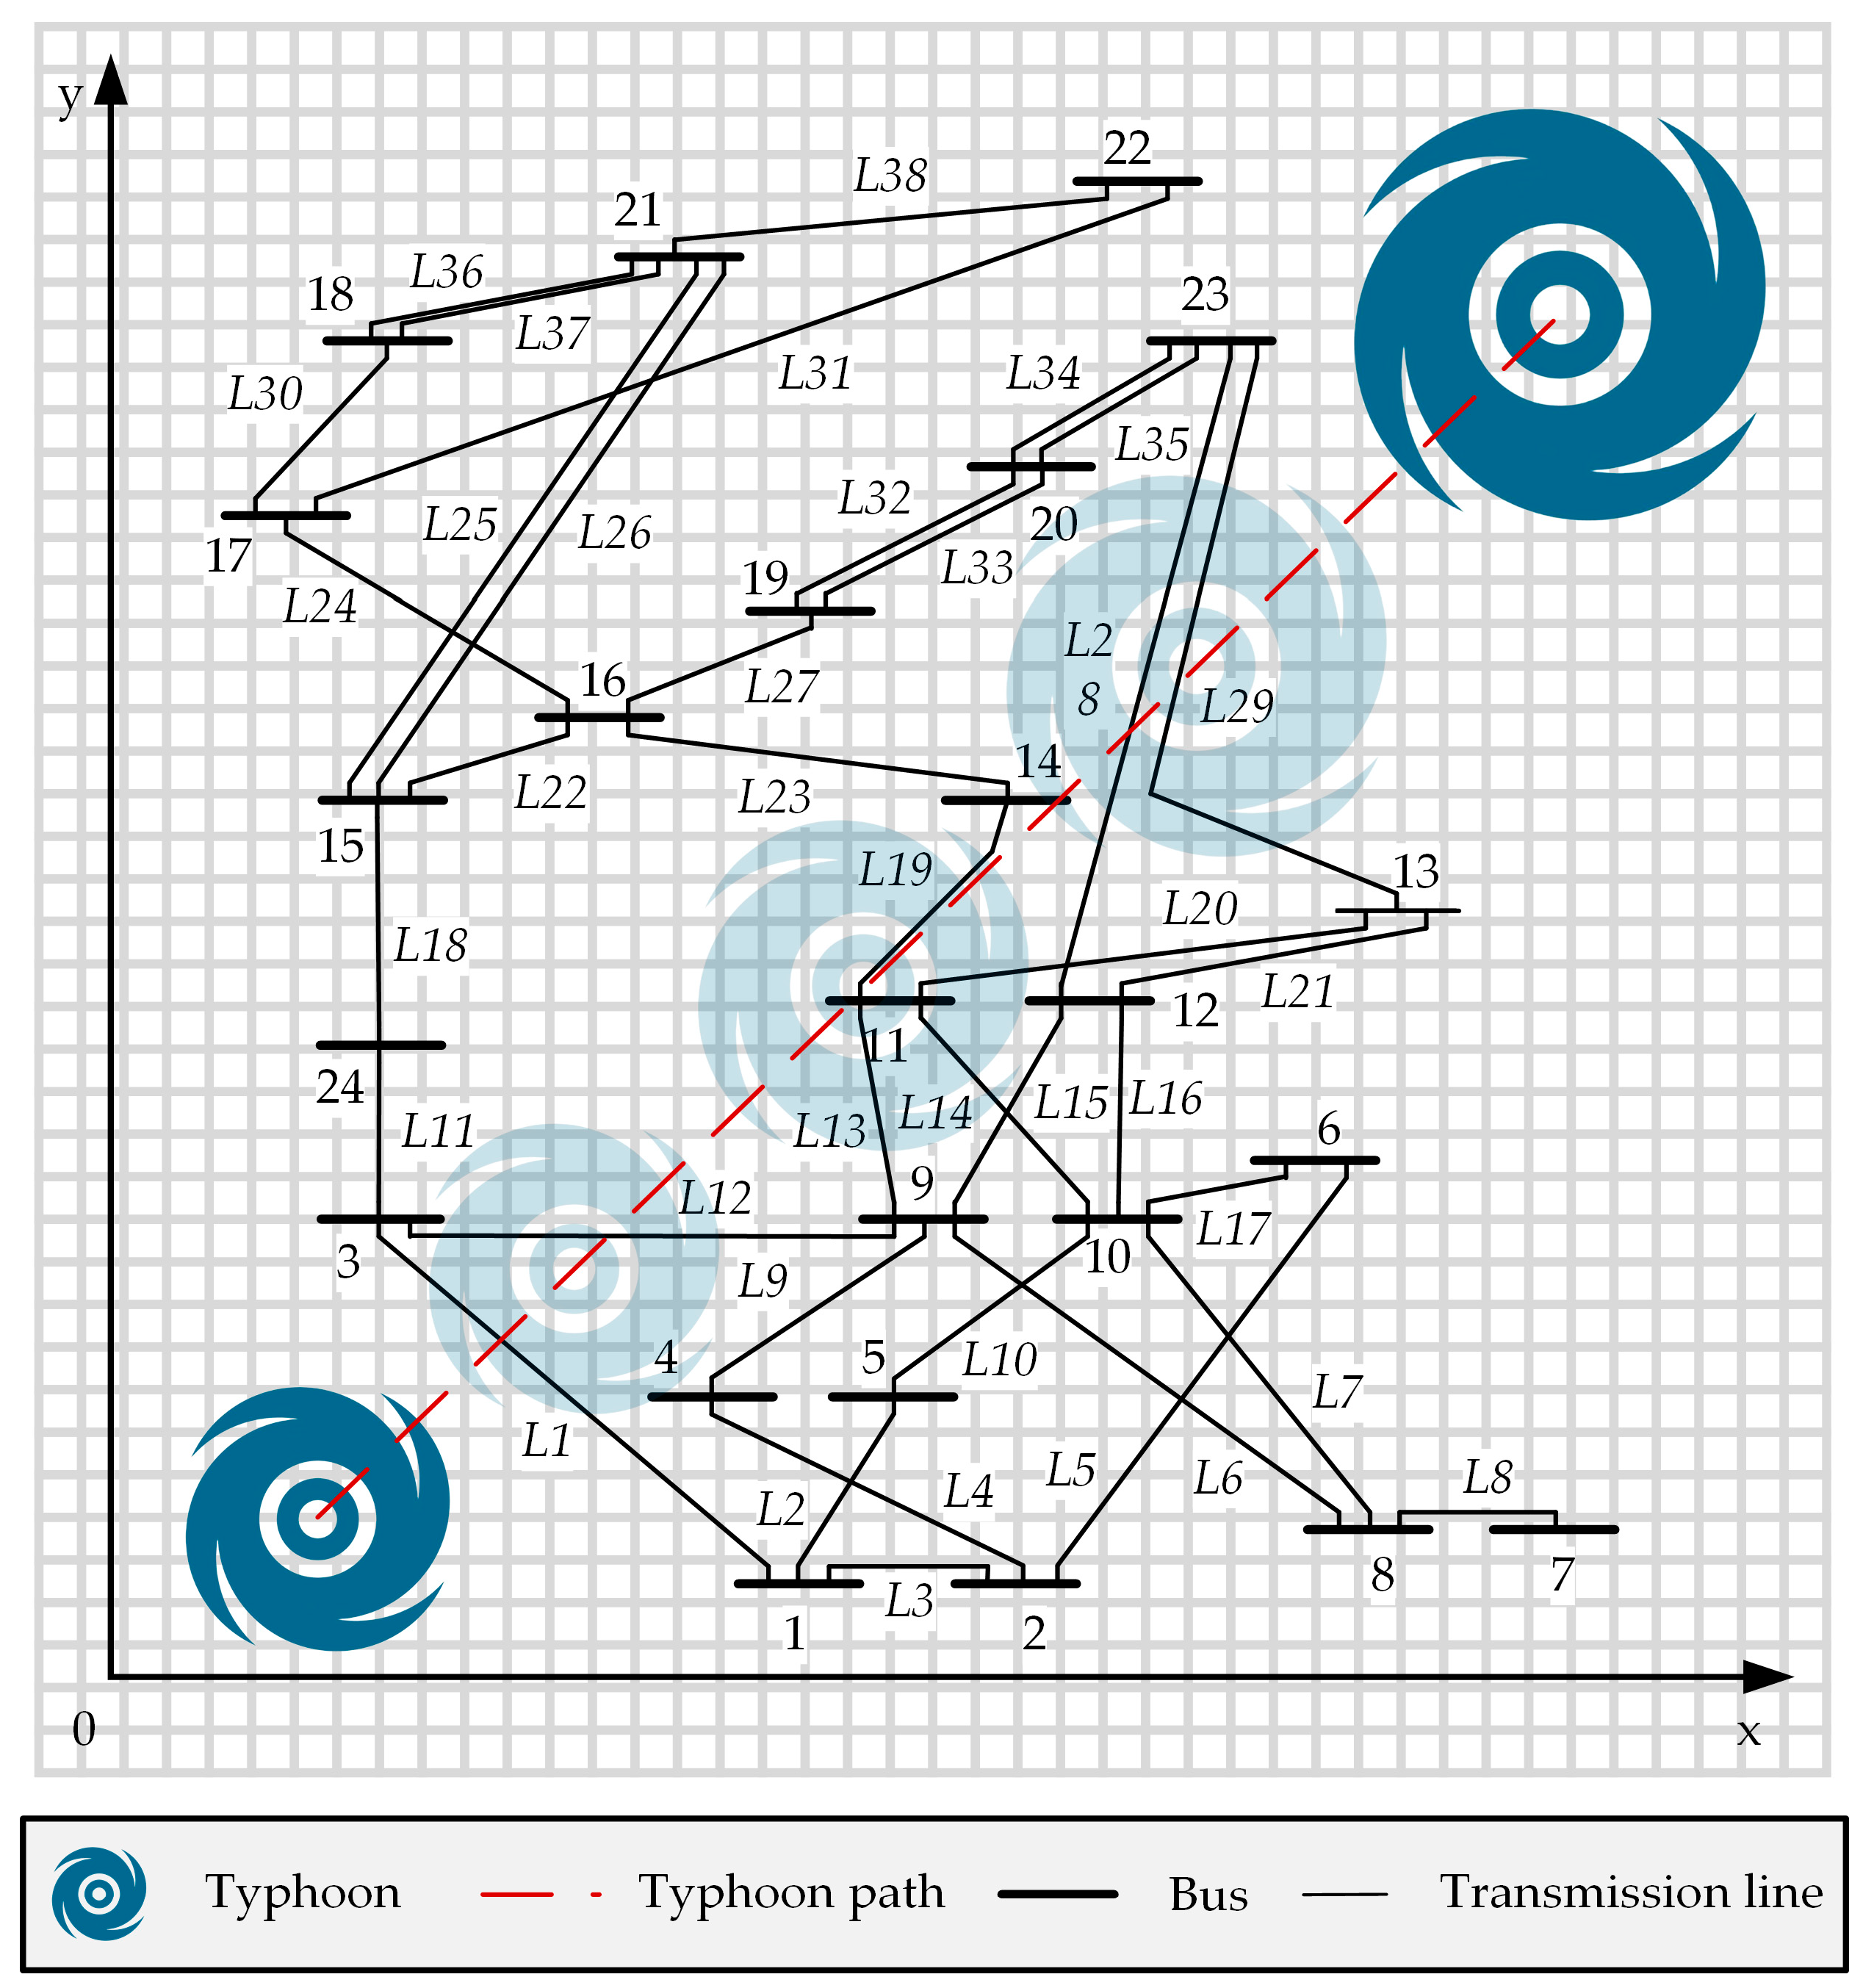
A modified IEEE RTS-79 system is used for the case study analysis in this paper. The specific node connection diagram is shown in Figure 4 [43]. This system consists of 24 nodes, 38 transmission lines, 14 generators, 5 transformers, and 17 load nodes. The total system generation capacity is 3455 MW, with a peak load of 2850 MW. On this basis, wind power generation units with rated capacities of 400 MW, 350 MW, and 200 MW are added to nodes 8, 19, and 21, respectively. Solar power generation units with rated capacities of 100 MW, 150 MW, and 270 MW are added to nodes 4, 5, and 17, respectively. In the modified RTS-79 system, the proportion of renewable energy sources reaches 30%, making it a high-renewable-penetration system.
For optimization, the planning period is set to 30 years, with a discount rate of 5%, a residual value rate of 5%, a load-shedding penalty of 1600 CNY/MWh, and a curtailment penalty of 400 CNY/MWh. The specific penalty parameters reflect special considerations for this problem, including potential renewable energy utilization and system resilience improvement bias. Other parameters, such as storage efficiency, investment costs, and operational costs, are set as described in Table 2.

6.2. Generation and Reduction in Line Outage Scenarios

This paper uses the IEEE RTS-79 system as a case study to examine the impact of typhoons on power systems in both temporal and spatial dimensions. Assuming that during a specific typhoon invasion process, meteorological departments obtained the center air pressure Po = 975 hPa, with a landfall location of (0, 0) and a landfall trajectory along the line y = x. The typhoon moves at a speed of 20 km/h. A schematic representation of the typhoon’s trajectory and the power system lines is shown in Figure 5.
To investigate the ability of multi-energy storage to maintain resilience over a several-day disaster, this paper used a simulation step size of 1 h. Over a simulated week of 168 h, a period spanning from the fourth day at 00:00 to the fifth day at 23:59 was set as the period during which the power grid was subjected to typhoon impact.
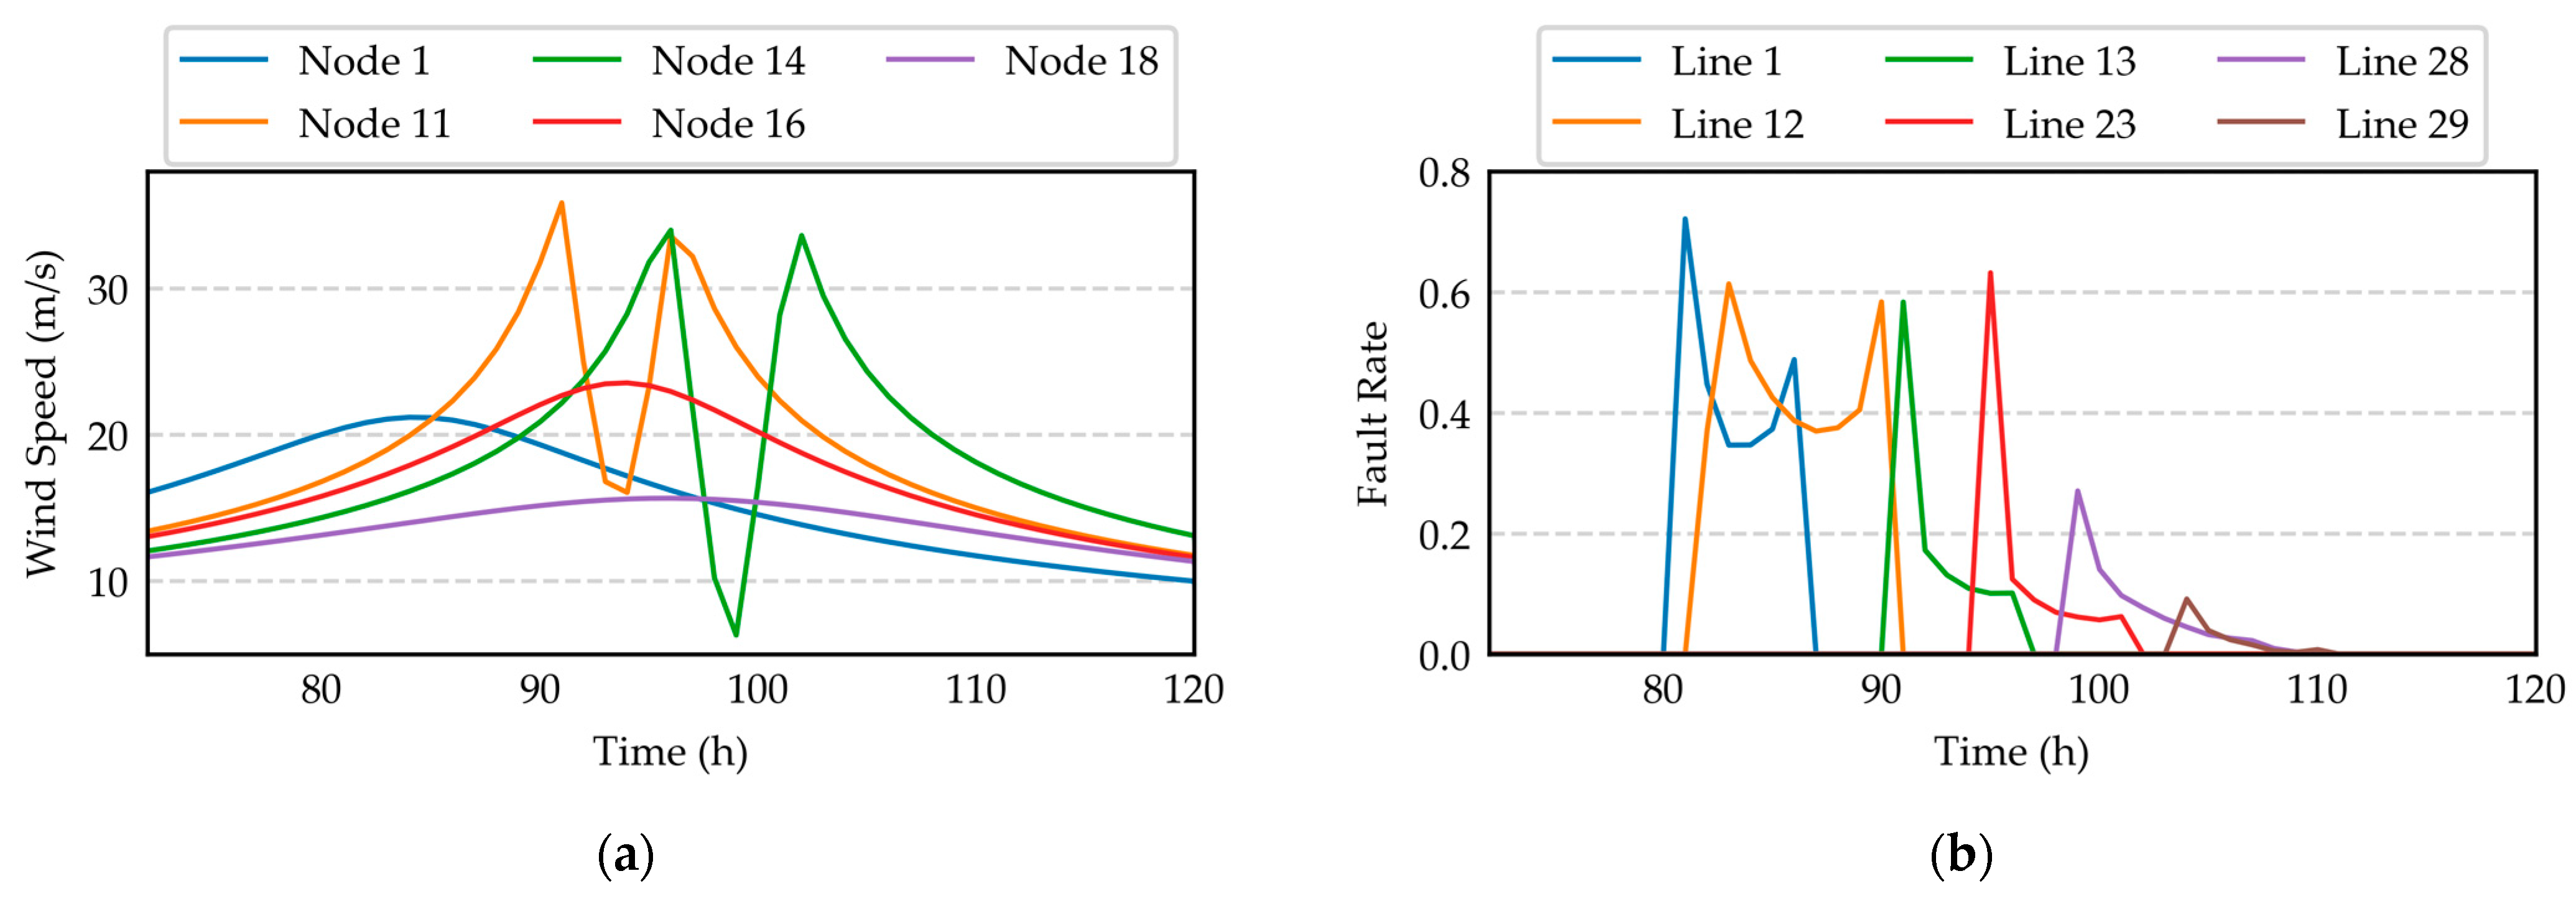
After the typhoon subsides, maintenance personnel start inspecting and repairing the damaged transmission lines, with a line recovery time model with parameters μl = 6, σl = 1.5. Furthermore, this paper assumes a design standard of 35 m/s for the maximum wind resistance of the lines. Based on the Batts model, the failure rates of individual lines were derived under varying wind speeds over time. The simulation results for line failures and wind speeds at specific nodes are shown below in Figure 6.
From Figure 6a, it can be observed that the wind speeds at Nodes 11 and 14 exhibit overall double-peak variations, while those at Nodes 1, 16, and 18 display only single-peak changes. This is because Nodes 11 and 14 are located within the maximum wind circle of the typhoon’s movement range, whereas Nodes 1, 16, and 18 are outside this range. This basic trend aligns with the Batts typhoon model’s simulation predictions.
Figure 6b illustrates the time-varying failure probability curves of specific transmission lines during the typhoon passage period. These curves correspond to the wind speed variations at the nodes, and the failure probability of each line reflects the relative position of the transmission line to the maximum wind circle of the typhoon. The results indicate that the severity of line failures is not only related to wind intensity but also closely associated with the spatial location of the lines and the relative position of the typhoon.
Based on the time-varying failure probability curves in Figure 6b, it is evident that one cannot directly determine the operational status of the disconnected transmission lines. Therefore, this study utilizes Monte Carlo simulations to generate 1000 possible disconnection scenarios. The number of scenarios is reduced using a fast scenario reduction algorithm, ultimately obtaining four types of reduced disconnection scenarios. The results of the scenario reduction are shown in Table 3.

6.3. Generation and Reduction in Wind and Solar Scenarios

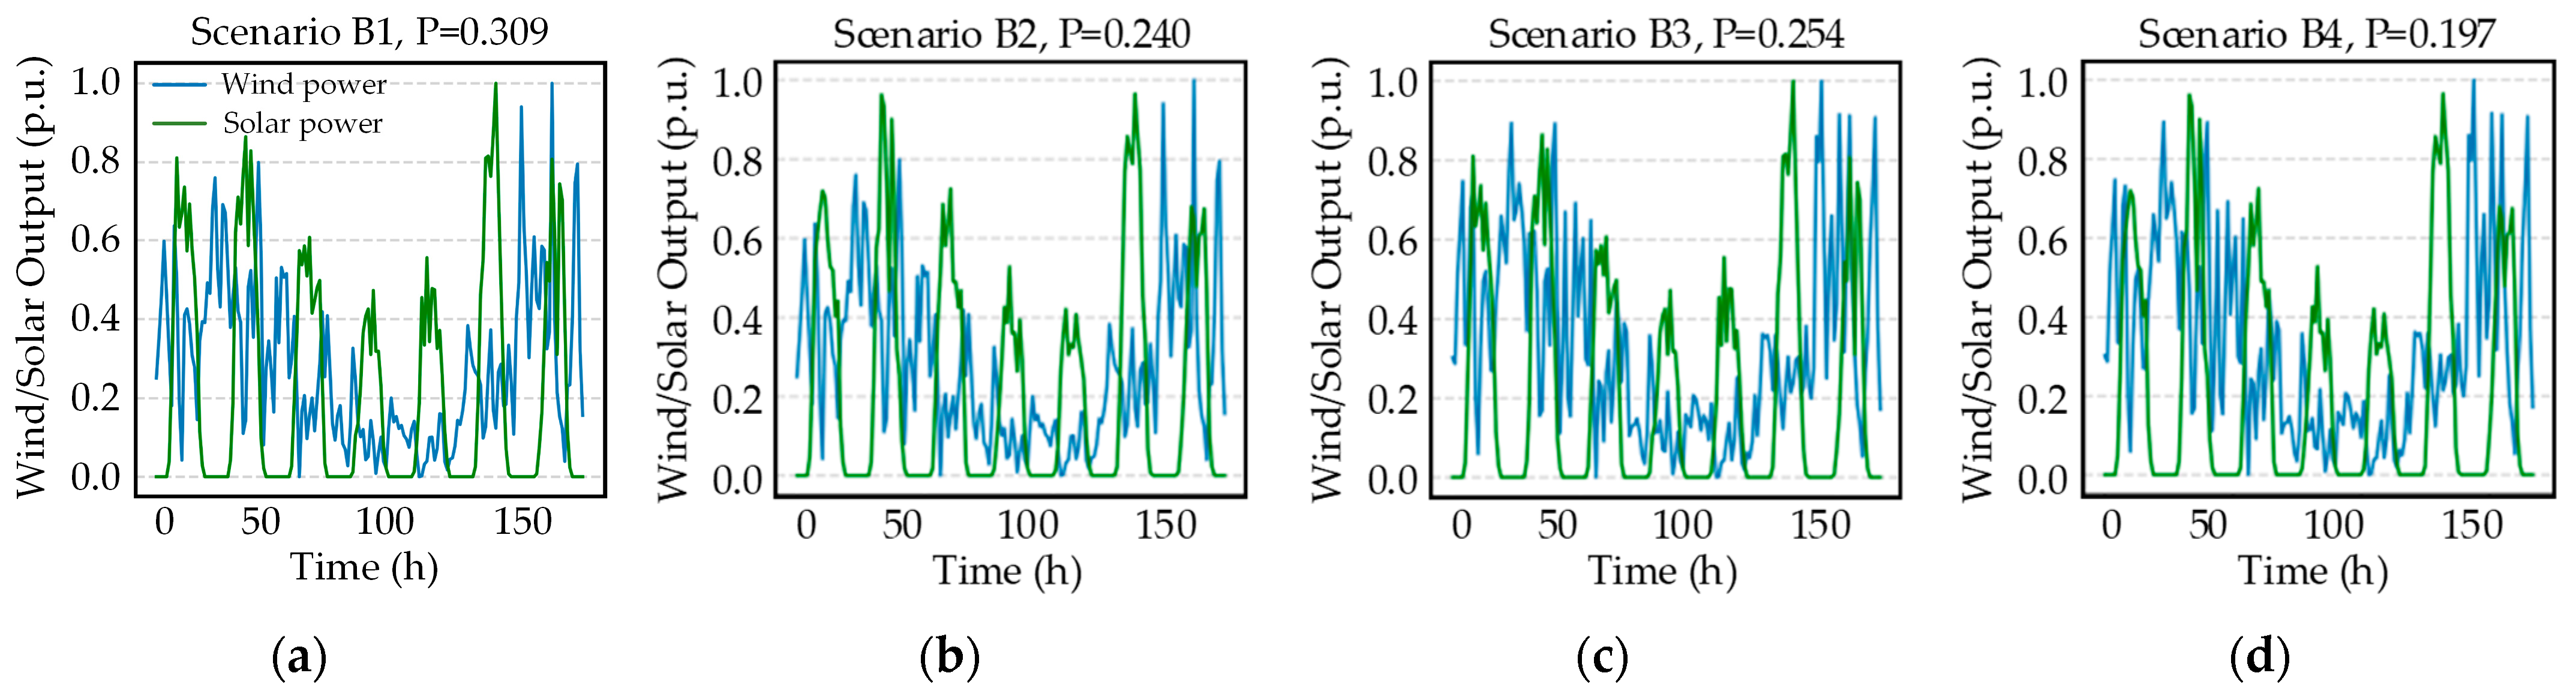
In the uncertainty analysis of wind and solar power output, sequential characteristics between power sources and loads must be considered. Based on wind speed and solar irradiance following Weibull and Beta distributions, respectively, this section generates 1000 initial scenarios for wind and solar power outputs using Latin hypercube sampling. The K-means clustering algorithm is used to reduce the number of scenarios, and the wind power and solar power generation scenarios are divided into four representative scenarios, as shown in Figure 7.
Based on the scenario sets for the line failures and wind–solar power outputs described above, this paper adopts a Cartesian product method to combine the two and generate the final scenario set. This provides the basis for the two-layer stochastic programming model. The combined scenarios and their respective probabilities are shown in Table 4.

6.4. Analysis of Multi-Energy Storage Planning Results

This paper employs the improved particle swarm optimization algorithm, with a population size of 10, 10 iterations, and a solution time of 4537 s. To validate the effectiveness of the proposed solution method, a performance comparison among different algorithms is presented in Table 5. When Gurobi is used to solve the problem alone, it is difficult to obtain the results due to the large scale of the solution. When the original PSO-based bi-level coupled algorithm (PSO-MILP) is adopted [44], the metaheuristic significantly accelerates the solution process, but suffers from larger solution errors. In contrast, when the proposed improved metaheuristic combined with the Gurobi-based solving algorithm is used, the solution time is further reduced, while the result is closer to the optimal solution, which substantially enhances the effectiveness of the solution algorithm.
The planning results are presented in Table 6. Battery storage is primarily distributed at nodes 1, 12, 13, and 17, while hydrogen energy storage is distributed at nodes 3, 9, and 21. The duration of battery storage is nearly 2 h, while hydrogen energy storage provides load support for approximately 20 h. Additionally, the investment in hydrogen energy storage accounts for 68% of the total investment cost, making it the most significant portion of the system’s investment. Among the total investment costs, fuel cells incur the highest expenditures.
In this paper, the scenarios with the highest probabilities, A3 and B1, serve as the basis for analyzing the lower-level optimization results. Over a 30-year project lifecycle, the total cost of the multi-time-scale energy storage system is approximately 34,412.607 million CNY, with the energy storage investment cost at 34,222.416 million CNY, the dispatch cost at 1650.1032 million CNY, and the penalty cost for load shedding at 567.9728 million CNY. Notably, the penalty cost accounts for less than 5% of the total cost, while the energy storage investment comprises the most significant proportion of the total investment cost.
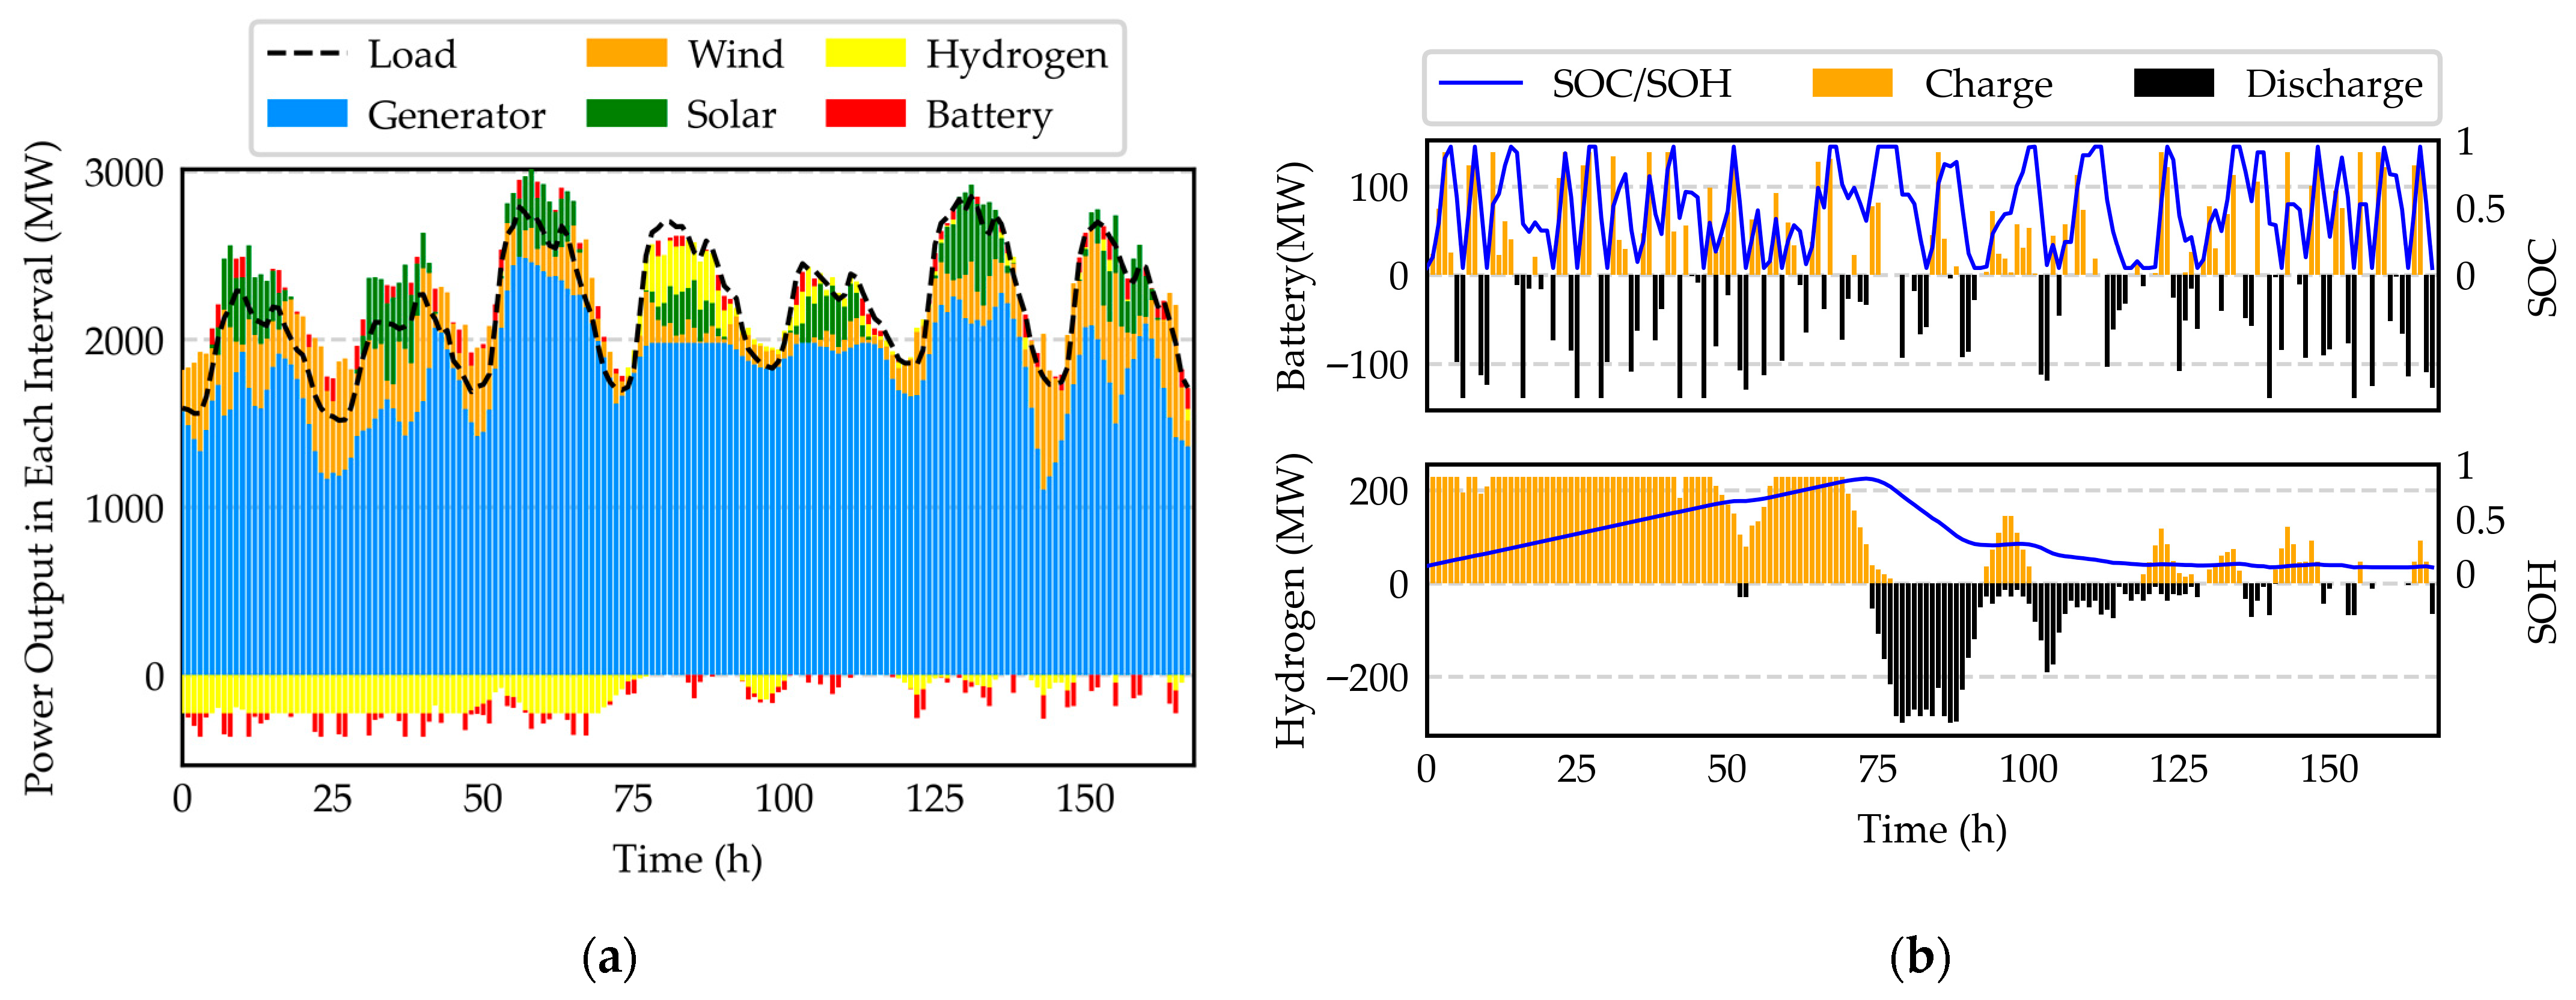
Figure 8 shows the result of the resilience simulation. Figure 8a depicts the resulting power flow regulation and system operation adjustments in this scenario. In the figure, the black solid lines represent the ideal state without load shedding, and the red and green lines represent the power flows adjusted by the battery and hydrogen storage systems, respectively. For the 0–72 h period, energy storage primarily compensates for power imbalances during system operation. During this period, battery storage functions mainly as peak shaving, providing rapid power output during load fluctuations, while hydrogen storage mainly supports the base load over extended durations. During the 72–120 h period, the system experiences greater fluctuations in load and renewable energy output. To compensate for this variability, hydrogen energy systems continue to operate as base load compensation. In contrast, battery storage takes on the role of stabilizing fluctuations, reducing peak loads during sudden increases or decreases in renewable energy generation. From 120 to 168 h, the system continues to rely on energy storage for balance, with reduced load fluctuations due to the improved stability of renewable energy output. Overall, the integrated multi-energy storage system effectively balances supply and demand while mitigating interruptions, thus maintaining operational reliability and enhancing renewable energy utilization efficiency.
The description for Figure 8b explains the charging and discharging power profiles of energy storage systems along with their corresponding load states. The yellow areas represent energy storage charging, while the black areas represent energy storage discharging. It can be observed that the battery storage system undergoes frequent charge and discharge cycles over 24 h to balance the short-term power output fluctuations from the renewable energy. Meanwhile, the hydrogen storage system is used to store the excess renewable energy converted into hydrogen over the first three days. During the disaster period on the fourth and fifth days, the hydrogen storage system discharges to provide a power supply, compensating for the significant power shortages to meet the load demand. In the post-disaster recovery period, hydrogen storage continues to discharge during nighttime valleys and charges during daytime peaks, utilizing its energy-shifting capabilities to maximize its role. This operation reduces the peak-to-valley differences in the power load, effectively lowering energy costs.

6.5. Analysis of the Effectiveness of Multi-Energy Storage in Enhancing System Resilience

To verify the effectiveness of the proposed multi-energy storage planning method in improving the resilience of the power system, four different energy storage configuration scenarios are considered for comparative analysis:
  • Scenario 1: No energy storage is used;
  • Scenario 2: Only short-term energy storage is used;
  • Scenario 3: Only long-term energy storage is used;
  • Scenario 4: Both short-term and long-term energy storage systems are used.
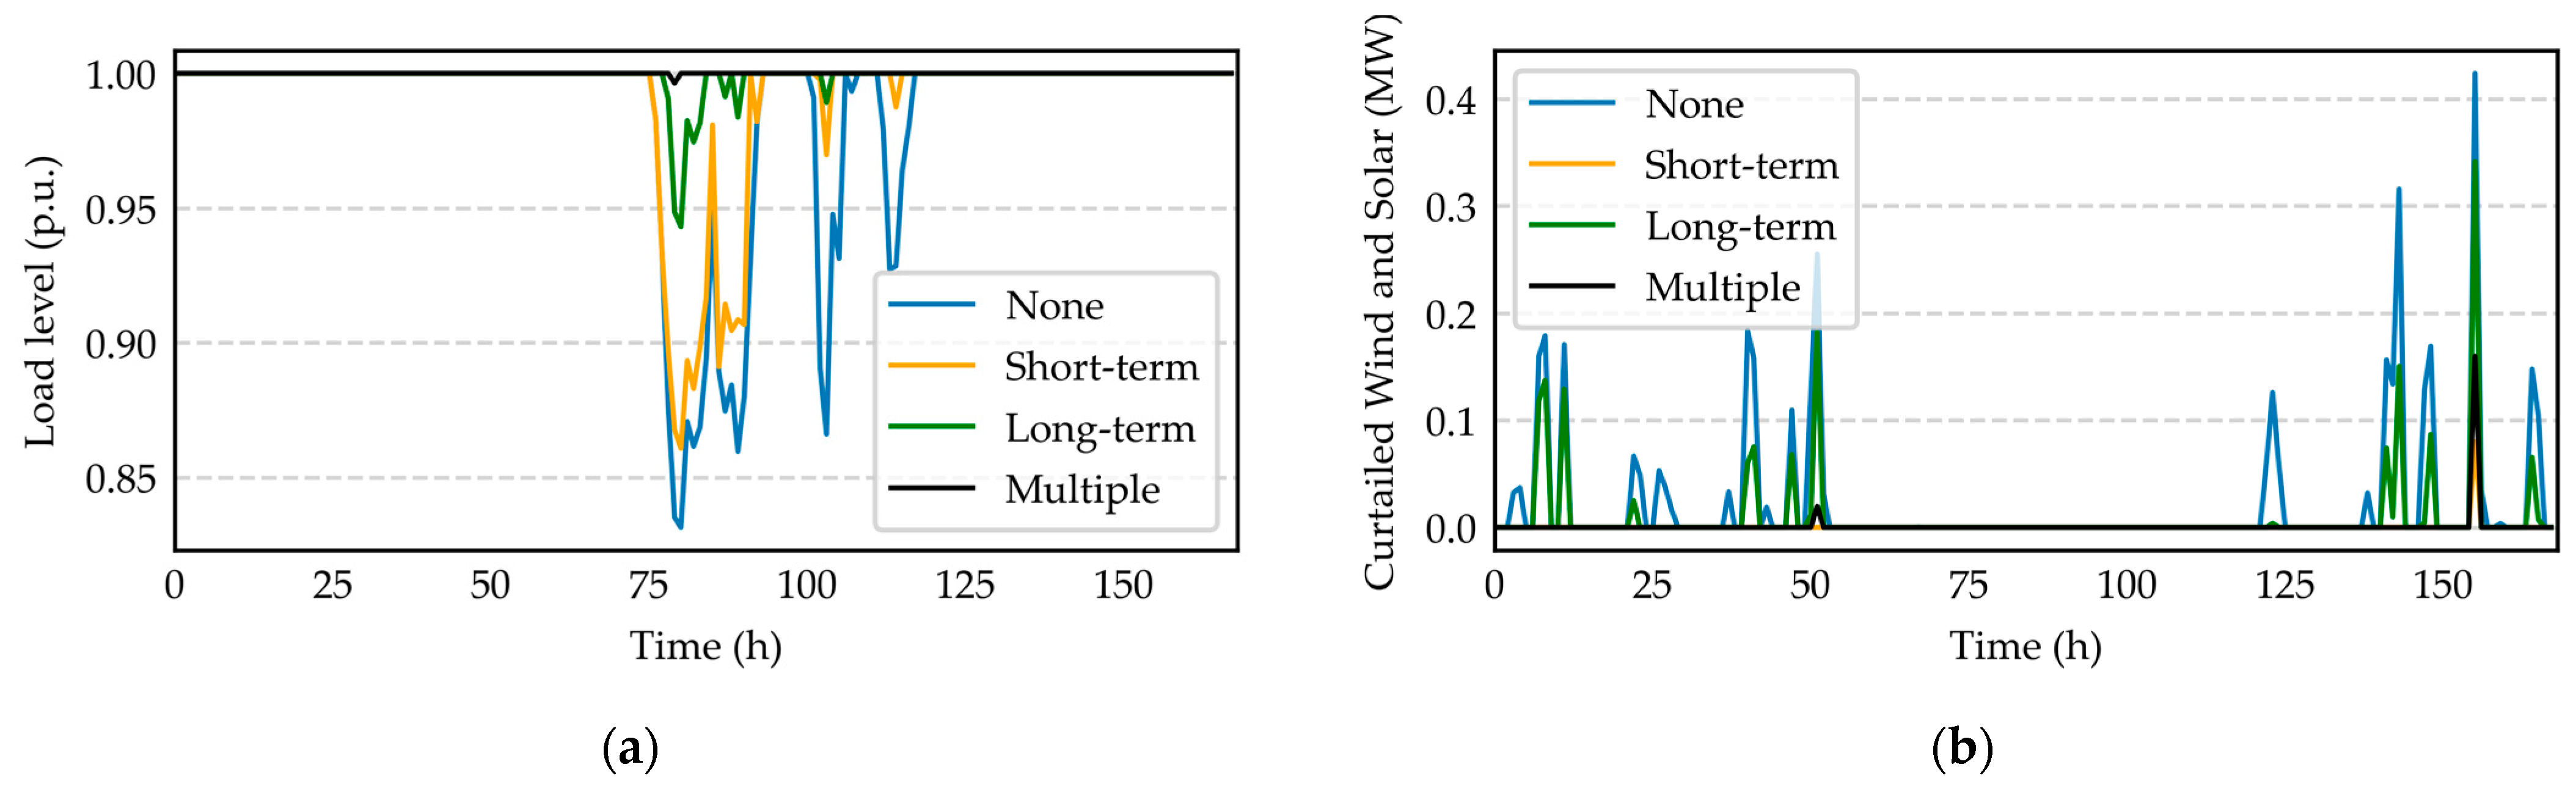
The resulting system resilience improvement can be seen in Figure 9. In the comparison of the different energy storage configurations, it is evident that the system without energy storage has the highest total load shedding and the largest amount of curtailed renewable energy. When only battery storage is used, the system struggles to meet long-term load demands due to its limited power output capacity over extended periods. When only hydrogen energy storage is used, it does not contribute effectively to accommodating renewable energy due to its low response speed during short-term events. When both short-term and long-term energy storage systems are used, the combined effect significantly reduces both load shedding and renewable energy curtailment. This result highlights the superiority of the proposed multi-energy storage planning method over single-energy storage configurations.
The results in the planning and resilience indicators for different configuration schemes are shown in Table 7. Among the no storage, short-term storage, long-term storage, and multi-energy storage scenarios, the total system cost decreases sequentially, primarily due to the ability of energy storage to reduce the costs associated with curtailed renewable energy and load shedding.
In the short-term energy storage scenario, the excellent energy consumption capacity of the storage system significantly reduces the cost of wind and solar curtailment, while also improving the load shedding cost. As a result, the total cost is reduced by 14.72% compared to the scenario without energy storage. In the long-term energy storage scenario, the long-duration discharge capability of hydrogen storage greatly reduces load shedding costs, offsetting the increase in storage investment. Consequently, the total cost is reduced by 23.23% compared to the scenario without energy storage.
For the multi-energy storage scenario, the combined effects of short-term battery storage and long-term hydrogen storage not only enhance the ability to respond to long-term load demand but also allow for flexible adjustments to supply and demand dynamics. The system’s resilience is significantly improved, highlighting the effectiveness of multi-energy storage in providing economic and technical value while ensuring system resilience to extreme disasters.
In summary, the adoption of multi-energy storage enhances the resilience of the power system. Its adaptable adjustment capabilities enable better resource allocation, avoiding unnecessary losses and establishing a robust defense against weather-induced disruptions. Additionally, the integration of multi-energy storage systems forms an inseparable unit, where battery storage provides short-term capacity support and hydrogen storage compensates for the lack of quick-response capacity. By optimizing the design of multi-energy storage systems, an integrated system capable of more dynamic adjustment capabilities is realized, ultimately improving the resilience of the system.
In practical engineering, short-term energy storage, represented by battery energy storage, is already a relatively mature technology, with a solid foundation for large-scale engineering applications [45]. It is well-suited for rapid adjustment to alleviate short-term power imbalance during extreme events. Long-term energy storage, represented by hydrogen energy storage, is a key direction for future development. Hydrogen energy storage is a typical example. One of its main drawbacks is its low energy conversion efficiency. During the energy conversion process from hydrogen to electricity, the overall round-trip efficiency is typically between 30% and 40%, which is lower than the 70% to 90% of battery energy storage [46]. Hydrogen storage also requires a high upfront investment. The manufacturing costs of electrolyzers and fuel cells are expensive, posing challenges to the economic viability of projects throughout their entire life cycle [47]. Moreover, the safety of hydrogen storage and transportation, and incomplete infrastructure, also restrict its large-scale promotion [48]. At present, hydrogen storage has demonstrated economic and social value in practice, capable of providing long-term support for critical loads during multi-day power outages caused by disasters. With progress in the related technology and a reduction in cost, the advantages of hydrogen storage technology in engineering applications will be more significant.

7. Conclusions

In the context of increasing renewable energy penetration and frequent extreme disasters, this paper presents a multi-time-scale energy storage planning method to enhance power system resilience. The simulation’s results demonstrate that the multi-time-scale energy storage system acts as an integrated whole, with batteries offering rapid response for short-term support, and hydrogen storage ensuring sustained output with capacity advantages. This complementary approach maximizes storage potential, providing a comprehensive solution to improve resilience.
However, it is essential to mention that the proposed multi-time-scale energy model primarily addresses large-scale, cross-temporal, power-energy balancing needs but cannot fully resolve the mismatch among the temporal and spatial scales. In future work, mobile energy storage can be further integrated on the basis of this research to fully leverage the potential of multi-space–time energy storage systems in enhancing power system resilience.

Author Contributions

Conceptualization, S.H. and B.Q.; methodology, S.H. and B.Q.; software, S.H. and P.C.; validation, S.H.; formal analysis, S.H. and W.S.; investigation, S.H. and Y.S.; resources, P.C. and Z.W.; data curation, S.H. and T.M.; writing—original draft preparation, S.H. and P.C.; writing—review and editing, S.H., B.Q. and P.C. All authors have read and agreed to the published version of the manuscript.

Funding

This research was funded by the Basic Research Program of Qinghai Province (2025-ZJ-929Q).

Institutional Review Board Statement

Not applicable.

Informed Consent Statement

Not applicable.

Data Availability Statement

Data are contained within the article.

Conflicts of Interest

The authors declare no conflicts of interest.

Correction Statement

This article has been republished with a minor correction to the Funding statement. This change does not affect the scientific content of the article.

References

  1. Qin, B.; Wang, H.; Liao, Y.; Li, H.; Ding, T.; Wang, Z.; Li, F.; Liu, D. Challenges and Opportunities for Long-Distance Renewable Energy Transmission in China. Sustain. Energy Technol. Assess. 2024, 69, 103925. [Google Scholar] [CrossRef]
  2. Qin, B.; Hong, S.; Wang, H.; Zhao, J.; Li, H.; Chen, P.; Ding, T. Non-Isothermal Dynamic Model and Collaborative Optimization for Multi-Energy System Considering Pipeline Energy Storage. J. Energy Storage 2026, 141, 119083. [Google Scholar] [CrossRef]
  3. Jiang, B.; Qin, C.; Wang, Q. An Unsupervised Physics-Informed Neural Network Method for AC Power Flow Calculations. IEEE Trans. Power Syst. 2025, 40, 4407–4410. [Google Scholar] [CrossRef]
  4. Kamruzzaman, M.; Duan, J.; Shi, D.; Benidris, M. A Deep Reinforcement Learning-Based Multi-Agent Framework to Enhance Power System Resilience Using Shunt Resources. IEEE Trans. Power Syst. 2021, 36, 5525–5536. [Google Scholar] [CrossRef]
  5. Tobajas, J.; Garcia-Torres, F.; Roncero-Sánchez, P.; Vázquez, J.; Bellatreche, L.; Nieto, E. Resilience-Oriented Schedule of Microgrids with Hybrid Energy Storage System Using Model Predictive Control. Appl. Energy 2022, 306, 118092. [Google Scholar] [CrossRef]
  6. Wang, H.; Qin, B.; Hong, S.; Xu, X.; Su, Y.; Lu, T.; Ding, T. Enhanced GAN-Based Joint Wind-Solar-Load Scenario Generation with Extreme Weather Labelling. IEEE Trans. Smart Grid 2025, 16, 4213–4224. [Google Scholar] [CrossRef]
  7. Ghanbari, M.; Jiang, J. A Comprehensive Review on Power System Resilience: Definition, Assessment, and Enhancement Strategies. Int. J. Electr. Power Energy Syst. 2025, 172, 111149. [Google Scholar] [CrossRef]
  8. Qin, B.; Chen, P.; Zhang, Z.; Wang, H.; Ding, T. Coordinated Preventive Control Strategy for Transient Overvoltage Suppression in Hybrid AC/DC Sending-Side Systems. Int. J. Electr. Power Energy Syst. 2025, 171, 111017. [Google Scholar] [CrossRef]
  9. Bajpai, P.; Chanda, S.; Srivastava, A.K. A Novel Metric to Quantify and Enable Resilient Distribution System Using Graph Theory and Choquet Integral. IEEE Trans. Smart Grid 2018, 9, 2918–2929. [Google Scholar] [CrossRef]
  10. Zhang, B.; Dehghanian, P.; Kezunovic, M. Optimal Allocation of PV Generation and Battery Storage for Enhanced Resilience. IEEE Trans. Smart Grid 2019, 10, 535–545. [Google Scholar] [CrossRef]
  11. Li, B.; Ofori-Boateng, D.; Gel, Y.R.; Zhang, J. A Hybrid Approach for Transmission Grid Resilience Assessment Using Reliability Metrics and Power System Local Network Topology. Sustain. Resilient Infrastruct. 2021, 6, 26–41. [Google Scholar] [CrossRef]
  12. Raoufi, H.; Vahidinasab, V.; Mehran, K. Power Systems Resilience Metrics: A Comprehensive Review of Challenges and Outlook. Sustainability 2020, 12, 9698. [Google Scholar] [CrossRef]
  13. Luo, D.; Xia, Y.; Zeng, Y.; Li, C.; Zhou, B.; Yu, H.; Wu, Q. Evaluation Method of Distribution Network Resilience Focusing on Critical Loads. IEEE Access 2018, 6, 61633–61639. [Google Scholar] [CrossRef]
  14. Li, S.; Qin, W.; Zhang, B.; Liu, J.; Zhang, Y. Resilience Assessment of Transmission Network Considering Aging Effects and Cascading Failures. In Proceedings of the 2025 10th Asia Conference on Power and Electrical Engineering (ACPEE), Beijing, China, 15–19 April 2025; pp. 2217–2222. [Google Scholar]
  15. Hou, G.; Muraleetharan, K.K.; Panchalogaranjan, V.; Moses, P.; Javid, A.; Al-Dakheeli, H.; Bulut, R.; Campos, R.; Harvey, P.S.; Miller, G.; et al. Resilience Assessment and Enhancement Evaluation of Power Distribution Systems Subjected to Ice Storms. Reliab. Eng. Syst. Saf. 2023, 230, 108964. [Google Scholar] [CrossRef]
  16. Qin, B.; Liu, J.; Wang, H.; Wang, Z.; Xiong, Z.; Wang, M.; Qian, Q. Energy-Efficient and Reliable Urban Rail Transit: A New Framework Incorporating Underground Energy Storage Systems. iEnergy 2025, 4, 86–97. [Google Scholar] [CrossRef]
  17. Wang, C.; Zhang, C.; Luo, L.; Qi, X.; Kong, J. Optimal Resilience and Risk-Driven Strategies for Pre-Disaster Protection of Electric Power Systems against Uncertain Disaster Scenarios. Energies 2024, 17, 3619. [Google Scholar] [CrossRef]
  18. Wan, H.; Liu, W.; Zhang, S.; Shi, Q.; Wang, Y.; Zhang, Y. Pre-Disaster and Mid-Disaster Resilience Improvement Strategy of High Proportion Renewable Energy System Considering Frequency Stability. Int. J. Electr. Power Energy Syst. 2023, 151, 109135. [Google Scholar] [CrossRef]
  19. Zhang, C.; Li, Y.-F.; Zhang, H.; Wang, Y.; Huang, Y.; Xu, J. Distributionally Robust Resilience Optimization of Post-Disaster Power System Considering Multiple Uncertainties. Reliab. Eng. Syst. Saf. 2024, 251, 110367. [Google Scholar] [CrossRef]
  20. Wang, X.; Li, Z.; Shahidehpour, M.; Jiang, C. Robust Line Hardening Strategies for Improving the Resilience of Distribution Systems With Variable Renewable Resources. IEEE Trans. Sustain. Energy 2019, 10, 386–395. [Google Scholar] [CrossRef]
  21. Lei, S.; Wang, J.; Chen, C.; Hou, Y. Mobile Emergency Generator Pre-Positioning and Real-Time Allocation for Resilient Response to Natural Disasters. IEEE Trans. Smart Grid 2018, 9, 2030–2041. [Google Scholar] [CrossRef]
  22. Liu, C.; Huang, Y.; Yang, X.; Teng, Y.; Chen, G.; Tang, W.; Jin, D.; Liu, Y.; Zhang, X. Flexible Operation Strategy of an Urban Transmission Network Considering Energy Storage Systems and Load Transfer Characteristics. Power Syst. Prot. Control 2021, 49, 56–66. [Google Scholar]
  23. Zhou, B.; Wu, J.; Zang, T.; Cai, Y.; Sun, B.; Qiu, Y. Emergency Dispatch Approach for Power Systems with Hybrid Energy Considering Thermal Power Unit Ramping. Energies 2023, 16, 4213. [Google Scholar] [CrossRef]
  24. Taheri, B.; Safdarian, A.; Moeini-Aghtaie, M.; Lehtonen, M. Enhancing Resilience Level of Power Distribution Systems Using Proactive Operational Actions. IEEE Access 2019, 7, 137378–137389. [Google Scholar] [CrossRef]
  25. Li, C.; Zhang, S.; Li, J.; Zhang, H.; You, H.; Qi, J.; Li, J. Coordinated Control Strategy of Multiple Energy Storage Power Stations Supporting Black-Start Based on Dynamic Allocation. J. Energy Storage 2020, 31, 101683. [Google Scholar] [CrossRef]
  26. Nazemi, M.; Moeini-Aghtaie, M.; Fotuhi-Firuzabad, M.; Dehghanian, P. Energy Storage Planning for Enhanced Resilience of Power Distribution Networks Against Earthquakes. IEEE Trans. Sustain. Energy 2020, 11, 795–806. [Google Scholar] [CrossRef]
  27. Fu, X.; Guo, Q.; Sun, H.; Pan, Z.; Xiong, W.; Wang, L. Typical Scenario Set Generation Algorithm for an Integrated Energy System Based on the Wasserstein Distance Metric. Energy 2017, 135, 153–170. [Google Scholar] [CrossRef]
  28. Yang, Y.; Lu, Q.; Yu, Z.; Wang, W.; Hu, Q. Multi-Type Energy Storage Collaborative Planning in Power System Based on Stochastic Optimization Method. Processes 2024, 12, 2079. [Google Scholar] [CrossRef]
  29. Zhang, Y.; Li, B.; Hong, W.; Zhou, A. MOCPSO: A Multi-Objective Cooperative Particle Swarm Optimization Algorithm with Dual Search Strategies. Neurocomputing 2023, 562, 126892. [Google Scholar] [CrossRef]
  30. Kim, J.; Dvorkin, Y. Enhancing Distribution System Resilience with Mobile Energy Storage and Microgrids. IEEE Trans. Smart Grid 2019, 10, 4996–5006. [Google Scholar] [CrossRef]
  31. Wang, H.; Qin, B.; Su, Y.; Li, F.; Hong, S.; Ding, T. Coordinated Planning of Mobile Electric-hydrogen Energy Storage for Remote Power System Resilience Enhancement. J. Energy Storage 2026, 147, 120160. [Google Scholar] [CrossRef]
  32. Wang, H.; Qin, B.; Hong, S.; Cai, Q.; Li, F.; Ding, T.; Li, H. Optimal Planning of Hybrid Hydrogen and Battery Energy Storage for Resilience Enhancement Using Bi-Layer Decomposition Algorithm. J. Energy Storage 2025, 110, 115367. [Google Scholar] [CrossRef]
  33. Arsad, A.Z.; Hannan, M.A.; Al-Shetwi, A.Q.; Mansur, M.; Muttaqi, K.M.; Dong, Z.Y.; Blaabjerg, F. Hydrogen Energy Storage Integrated Hybrid Renewable Energy Systems: A Review Analysis for Future Research Directions. Int. J. Hydrogen Energy 2022, 47, 17285–17312. [Google Scholar] [CrossRef]
  34. Oikonomou, K.; Maloney, P.R.; Bhattacharya, S.; Holzer, J.T.; Anderson, O.; Ke, X.; Westman, J.; Burleyson, C.D.; Datta, S.; Twitchell, J.B.; et al. Energy Storage Planning for Enhanced Resilience of Power Systems against Wildfires and Heatwaves. J. Energy Storage 2025, 119, 116074. [Google Scholar] [CrossRef]
  35. Lim, J.; Shafieezadeh, A. Resilience-Driven Planning in Smart Distribution Systems: A Multi-Stage Stochastic Robust Optimization Framework for Solar Farm and Battery Integration. Appl. Energy 2026, 406, 127235. [Google Scholar] [CrossRef]
  36. Chen, Y.; Shi, Q.; Tang, B.; Zhang, Y.; Wang, H. A Distributed Energy Storage-Based Planning Method for Enhancing Distribution Network Resilience. Energies 2026, 19, 574. [Google Scholar] [CrossRef]
  37. Qin, B.; Wang, H.; Li, F.; Liu, D.; Liao, Y.; Li, H. Towards Zero Carbon Hydrogen: Co-Production of Photovoltaic Electrolysis and Natural Gas Reforming with CCS. Int. J. Hydrogen Energy 2024, 78, 604–609. [Google Scholar] [CrossRef]
  38. Li, B.; Liu, C.; Yin, Y.; Jiang, Q.; Zhang, Y.; Liu, T. Study on Power System Resilience Assessment Considering Cascading Failures during Wildfire Disasters. Energy Rep. 2025, 13, 1819–1833. [Google Scholar] [CrossRef]
  39. Wang, Z.; Wang, Z. A Novel Preventive Islanding Scheme of Power System under Extreme Typhoon Events. Int. J. Electr. Power Energy Syst. 2023, 147, 108857. [Google Scholar] [CrossRef]
  40. Sheng, C.; Hong, H.P. Assessing Holland’s Wind Pressure Profile Parameters Used for Tropical Cyclone Wind Field Modelling. J. Wind Eng. Ind. Aerodyn. 2024, 245, 105650. [Google Scholar] [CrossRef]
  41. Alrashidi, M. Estimation of Weibull Distribution Parameters for Wind Speed Characteristics Using Neural Network Algorithm. Comput. Mater. Contin. 2023, 75, 1073–1088. [Google Scholar] [CrossRef]
  42. Fernandez-Jimenez, L.A.; Monteiro, C.; Ramirez-Rosado, I.J. Short-Term Probabilistic Forecasting Models Using Beta Distributions for Photovoltaic Plants. Energy Rep. 2023, 9, 495–502. [Google Scholar] [CrossRef]
  43. Yang, R.; Li, Y. Resilience Assessment and Improvement for Electric Power Transmission Systems against Typhoon Disasters: A Data-Model Hybrid Driven Approach. Energy Rep. 2022, 8, 10923–10936. [Google Scholar] [CrossRef]
  44. Ferreira, V.H.; Filho, P.d.M.O.; Queiroga, E.V.; Silva, J.M.P.; Barboza, E.U.; Abud, T.P.; Borba, B.S.M.C.; Fortes, M.Z.; Moreira, B.S.; Machado, P.H.C. Two-Phase Optimization Approach for Maintenance Workforce Planning in Power Distribution Utilities. Electr. Power Syst. Res. 2022, 211, 108236. [Google Scholar] [CrossRef]
  45. Jiang, T.; Shen, D.; Zhang, Z.; Liu, H.; Zhao, G.; Wang, Y.; Tan, S.; Luo, R.; Chen, W. Battery Technologies for Grid-Scale Energy Storage. Nat. Rev. Clean Technol. 2025, 1, 474–492. [Google Scholar] [CrossRef]
  46. Sadeq, A.M.; Homod, R.Z.; Hussein, A.K.; Togun, H.; Mahmoodi, A.; Isleem, H.F.; Patil, A.R.; Moghaddam, A.H. Hydrogen Energy Systems: Technologies, Trends, and Future Prospects. Sci. Total Environ. 2024, 939, 173622. [Google Scholar] [CrossRef] [PubMed]
  47. Haoxin, D.; Qiyuan, D.; Chaojie, L.; Nian, L.; Zhang, W.; Hu, M.; Xu, C. A Comprehensive Review on Renewable Power-to-Green Hydrogen-to-Power Systems: Green Hydrogen Production, Transportation, Storage, Re-Electrification and Safety. Appl. Energy 2025, 390, 125821. [Google Scholar] [CrossRef]
  48. Xie, Z.; Jin, Q.; Su, G.; Lu, W. A Review of Hydrogen Storage and Transportation: Progresses and Challenges. Energies 2024, 17, 4070. [Google Scholar] [CrossRef]
Figure 1. Power system resilience curve.
Sustainability 18 02416 g001
Figure 2. Framework of the bi-level stochastic programming model.
Sustainability 18 02416 g002
Figure 3. Flowchart of the model solution.
Sustainability 18 02416 g003
Figure 4. Structural diagram of the IEEE RTS-79 system.
Sustainability 18 02416 g004
Figure 5. Schematic diagram of typhoon invasion on the power grid.
Sustainability 18 02416 g005
Figure 6. The simulation results for line failures and wind speeds at specific nodes: (a) wind speed curves for selected nodes; (b) time-varying fault probability curves.
Sustainability 18 02416 g006
Figure 7. Renewable energy output scenarios: (a) Scenario B1; (b) Scenario B2; (c) Scenario B3; (d) Scenario B4.
Sustainability 18 02416 g007
Figure 8. The result of the resilience simulation: (a) power balance result; (b) energy storage charge and discharge power and state of charge.
Sustainability 18 02416 g008
Figure 9. The resulting resilience improvement: (a) load levels in different configuration scenarios; (b) wind and solar curtailment in different configuration scenarios.
Sustainability 18 02416 g009
Table 1. Comparison of resilience-oriented energy storage planning methods. (Note: “√” indicates the feature is considered; “×” indicates the feature is not considered).
LiteratureScenario ConstructionEnergy Storage AllocationEnergy Storage Siting
Uncertainty of DisconnectionUncertainty of Renewable EnergyShort-Term Energy StorageLong-Term Energy StorageShort-Term Energy StorageLong-Term Energy Storage
[10]××××
[18]×××
[26]×××
[28]×
[31]×
[32]××
[34]×××××
[35]××
[36]×××
This paper
Table 2. Statistics on power shortage in extreme scenarios.
ParameterValueParameterValue
Battery capacity cost coefficient (10 k CNY/MWh)120Fuel cell power cost coefficient (10 k CNY/MWh)350
Battery power cost coefficient (10 k CNY/MW)35Hydrogen storage maintenance cost ratio (%)2
Battery maintenance cost ratio (%)2SOH limit0.1~0.9
SOC limit0.1~0.9Electrolytic cell life (year)15
Battery life (year)15Hydrogen tank life (year)30
Battery efficiency0.95Fuel cell life (year)15
Battery ramp rate (%)90E-H conversion efficiency0.6
Battery duration (h)2~8Electrolytic cell ramp rate limit (%)20
Electrolytic cell power cost coefficient (10 k CNY/MWh)250Fuel cell ramp rate limit (%)20
Hydrogen storage capacity cost coefficient (10 k CNY/MWh)10Hydrogen duration (h)10~15
Table 3. Scenario set for line fault.
ScenarioFailed LinesProbability
A1L12, 14, 190.280
A2L1, 12, 19, 270.214
A3L1, 12, 14, 19, 20, 27, 350.397
A4L1, 11, 12, 19, 20, 27, 340.109
Table 4. Combined scenario results.
Scenario GroupProbabilityScenario GroupProbability
A1, B10.08652A2, B10.066126
A1, B20.0672A2, B20.05136
A1, B30.07112A2, B30.054356
A1, B40.05516A2, B40.042158
A3, B10.122673A4, B10.033681
A3, B20.09528A4, B20.02616
A3, B30.100838A4, B30.027686
A3, B40.078209A4, B40.021473
Table 5. Performance comparison among different algorithms.
GurobiPSO-MILPProposed Method
Objective function (10 k CNY)/34,463.237334,222.4676
Solution time (s)>24 h71364537
Table 6. Multi-time-scale energy storage planning results.
Energy Storage TypeConfiguration NodeCapacity/MWhPower/MWInvestment/10 k CNYTotal Investment/10 k CNY
Battery storage169.953634.97684427.703034,222.4676
1266.450833.2254
1388.829844.4149
1751.005925.5029
Hydrogen energy storageElectrolytic cell348.21086514.0422
981.6467
2198.6549
Hydrogen tank32393.319562.8216
94053.15
214897.49
Fuel cell372.519313,717.9008
9122.814
21148.398
Table 7. Planning results and resilience indicators.
Configuration SchemeInvestment Cost (10 k CNY)Curtailed Renewable Cost (10 k CNY)Load Shedding Cost (10 k CNY)Total Cost (10 k CNY)Resilience Indicator
No energy storage011,082.458850,063.444278,105.51490.9325
Battery energy storage18,642.7427246.398431,716.733966,606.15890.9562
Hydrogen energy storage32,867.88734771.66935140.019259,872.97150.9928
Multi-energy storage34,222.4676567.972880.717151,441.26070.9995
Disclaimer/Publisher’s Note: The statements, opinions and data contained in all publications are solely those of the individual author(s) and contributor(s) and not of MDPI and/or the editor(s). MDPI and/or the editor(s) disclaim responsibility for any injury to people or property resulting from any ideas, methods, instructions or products referred to in the content.