1. Introduction
1.1. Background and Significance of the Research
Under the influence of global warming, changes in underlying surface conditions, and intensive human activities, the frequency and intensity of floods and droughts have continued to rise [
1,
2]. These extreme events not only constrain agricultural production but also threaten food security [
3,
4].
Initially, most farmlands were designed solely to address irrigation needs. However, with the increasing occurrence of floods and droughts, excess water often cannot be drained promptly, resulting in waterlogging and waterlogging-induced salinity, both of which negatively affect the quality of crops and fruits [
5,
6,
7].
During subsequent phases of farmland management, infrastructure for flood control was constructed without incorporating controlled drainage principles. As a result, drainage systems evolved into free-drainage systems, leading to rapid surface runoff diversion, excessive groundwater discharge, declining groundwater levels, and deterioration of the ecological environment [
8,
9,
10].
With the development of industry and agriculture and the continuous rise in population, demand for water resources has intensified, further aggravating the imbalance between water supply and demand [
11,
12]. Against this backdrop, controlled drainage technology has emerged as a timely and necessary solution.
1.2. Research Progress of Controlled Drainage Technology
Research on “controlled drainage technology in farmland” began in the 1970s. Controlled drainage technology [
13] involves installing control structures on drainage ditches (or pipes) to regulate outflow or maintain desired water levels. This regulation helps reduce the loss of water and nutrients caused by uncontrolled drainage and minimizes the pollution of receiving water bodies by nitrogen- and phosphorus-rich drainage water [
14]. The approach is designed to mitigate excessive drainage, promote the efficient utilization of rainwater resources, and effectively prevent environmental degradation caused by pollutants in drainage water [
15,
16].
Christen et al. [
17] pointed out that most existing drainage systems operate under conditions of excessive drainage. The amount of salt discharged significantly exceeds the incoming load, and the drainage rate is greater than what is necessary to maintain appropriate water levels and control waterlogging. Alaa et al. [
18] proposed that controlled drainage not only enables more efficient utilization of water resources but also effectively improves the agricultural water environment. Shouse et al. [
19], through a field experiment on controlled drainage, found that soil variability within fields is the primary factor influencing the distribution of salts and boron. Wesström et al. [
20] conducted controlled drainage experiments in Sweden and demonstrated that controlled drainage significantly reduces nitrogen and phosphorus loads in drainage water compared with free drainage. Similarly, an experimental study by Madramootoo and Stampfli [
21] in Quebec, Canada, demonstrated that controlled drainage enhances water use efficiency while offering economic advantages, including lower investment and reduced operational costs, along with certain environmental benefits. Kroger et al. [
22] implemented low weirs in open ditches as a drainage control measure and reported substantial reductions in soluble inorganic phosphorus, total phosphorus, nitrate nitrogen, and ammonium nitrogen by 92%, 86%, 98%, and 67%, respectively. Research findings by Skaggs et al. [
23] indicated that the direct discharge of agricultural drainage water enriched with nitrogen and phosphorus can severely degrade aquatic environments, whereas controlled drainage measures can reduce nitrogen loads by 30% to 50%.
Luo et al. [
24] regulated the water depth in a drainage ditch from 1.0 m to 0.6 m, resulting in an approximately 50% reduction in sub-surface drainage volume from agricultural ditches throughout the crop growth period. Jing [
25] applied the DRAINMOD model to simulate the effects of controlled drainage and found a significant decrease in both subsurface drainage volume and total drainage output, thereby contributing to the conservation of regional water resources and improvement of aquatic environmental quality. Wang et al. [
26,
27] employed an integrated approach combining field prototype observations with simulation modeling. At a prototype site in a plain area, they investigated the regulatory effects of controlled drainage on groundwater dynamics. Using a three-dimensional groundwater flow simulation model, they simulated groundwater behavior under different control scenarios and proposed optimized strategies for various drainage regulation schemes.
1.3. Research Background of Huaibei Plain
The per capita water availability in the Huaibei Plain of Anhui Province is only 400 cubic meters, indicating a severe water shortage. Covering a total area of 37,400 km
2 and containing 2059 × 10
3 hm
2 of cultivated land, the Huaibei Plain serves as an important production base for grain, cotton, and oil, supported by relatively abundant soil, water, light, and heat resources [
26,
27].
The region experiences a warm temperate, semi-humid monsoon climate, with an average annual precipitation ranging from 750 to 980 mm. However, the pronounced spatial and temporal unevenness in precipitation leads to frequent occurrences of both floods and droughts.
Over the past 60 years, particularly since the 1980s, the construction of drainage engineering projects has effectively mitigated waterlogging disasters that once impeded economic development. These projects were designed using main ditches as the primary waterlogging control units. However, because irrigation needs were not considered during system design, control structures were not incorporated into the main drainage ditches. This omission resulted in substantial surface runoff losses, excessive groundwater discharge, and a gradual decline in groundwater levels. In recent years, rapid industrial and agricultural development, combined with population growth, has further increased the demand for water resources, exacerbating the imbalance between water supply and demand. Therefore, it has become urgent to regulate farmland water resources through the widely distributed main drainage ditches to improve water-use efficiency and alleviate the growing conflict between water supply and demand.
1.4. Research Design and Key Findings of This Study
In 2002, a large-scale field research area was established in Lixin County, located in the central part of the Huaibei Plain in Anhui Province. Utilizing the extensive network of main drainage ditches across the region, controlled structures were installed within these ditches. This study investigated the impacts of the controlled drainage project in the main ditch on water storage variations within the ditch, changes in groundwater depth, drainage efficiency, and overall water resource regulation. The findings indicate that the controlled drainage project effectively retains local rainfall runoff, increases groundwater levels in farmland to an appropriate extent, enhances rainfall utilization efficiency, and facilitates agricultural water resource regulation. This approach enables the rational allocation and efficient use of water resources, alleviates water scarcity pressures, and reduces the pollution of receiving water bodies by agricultural chemicals, thereby contributing to environmental protection.
2. Research Area and Data
2.1. Experimental Site and Design
Covering a total area of 160 km2 and containing 12,000 ha of cultivated land, the study area is located in Lixin County in the central Huaibei Plain of Anhui Province, China. The multi-year average precipitation is 957 mm, with pronounced spatial and temporal variability both between years and within each year. Annual precipitation ranges from a maximum of 1215.7 mm to a minimum of 496 mm. Rainfall from June to August accounts for 53.5% of the annual total. Summers are hot with concentrated rainfall, resulting in alternating droughts and flood conditions. Waterlogging occurs more frequently than drought, and the associated damage is more severe. The main crops grown in the area include wheat, corn, and soybeans. The dominant soil type is Shajiang black soil, characterized by a weak aggregate structure, strong shrinking–swelling behavior in response to moisture changes, high permeability, and generally unfavorable physical properties. These features make the soil highly susceptible to both drought and waterlogging.
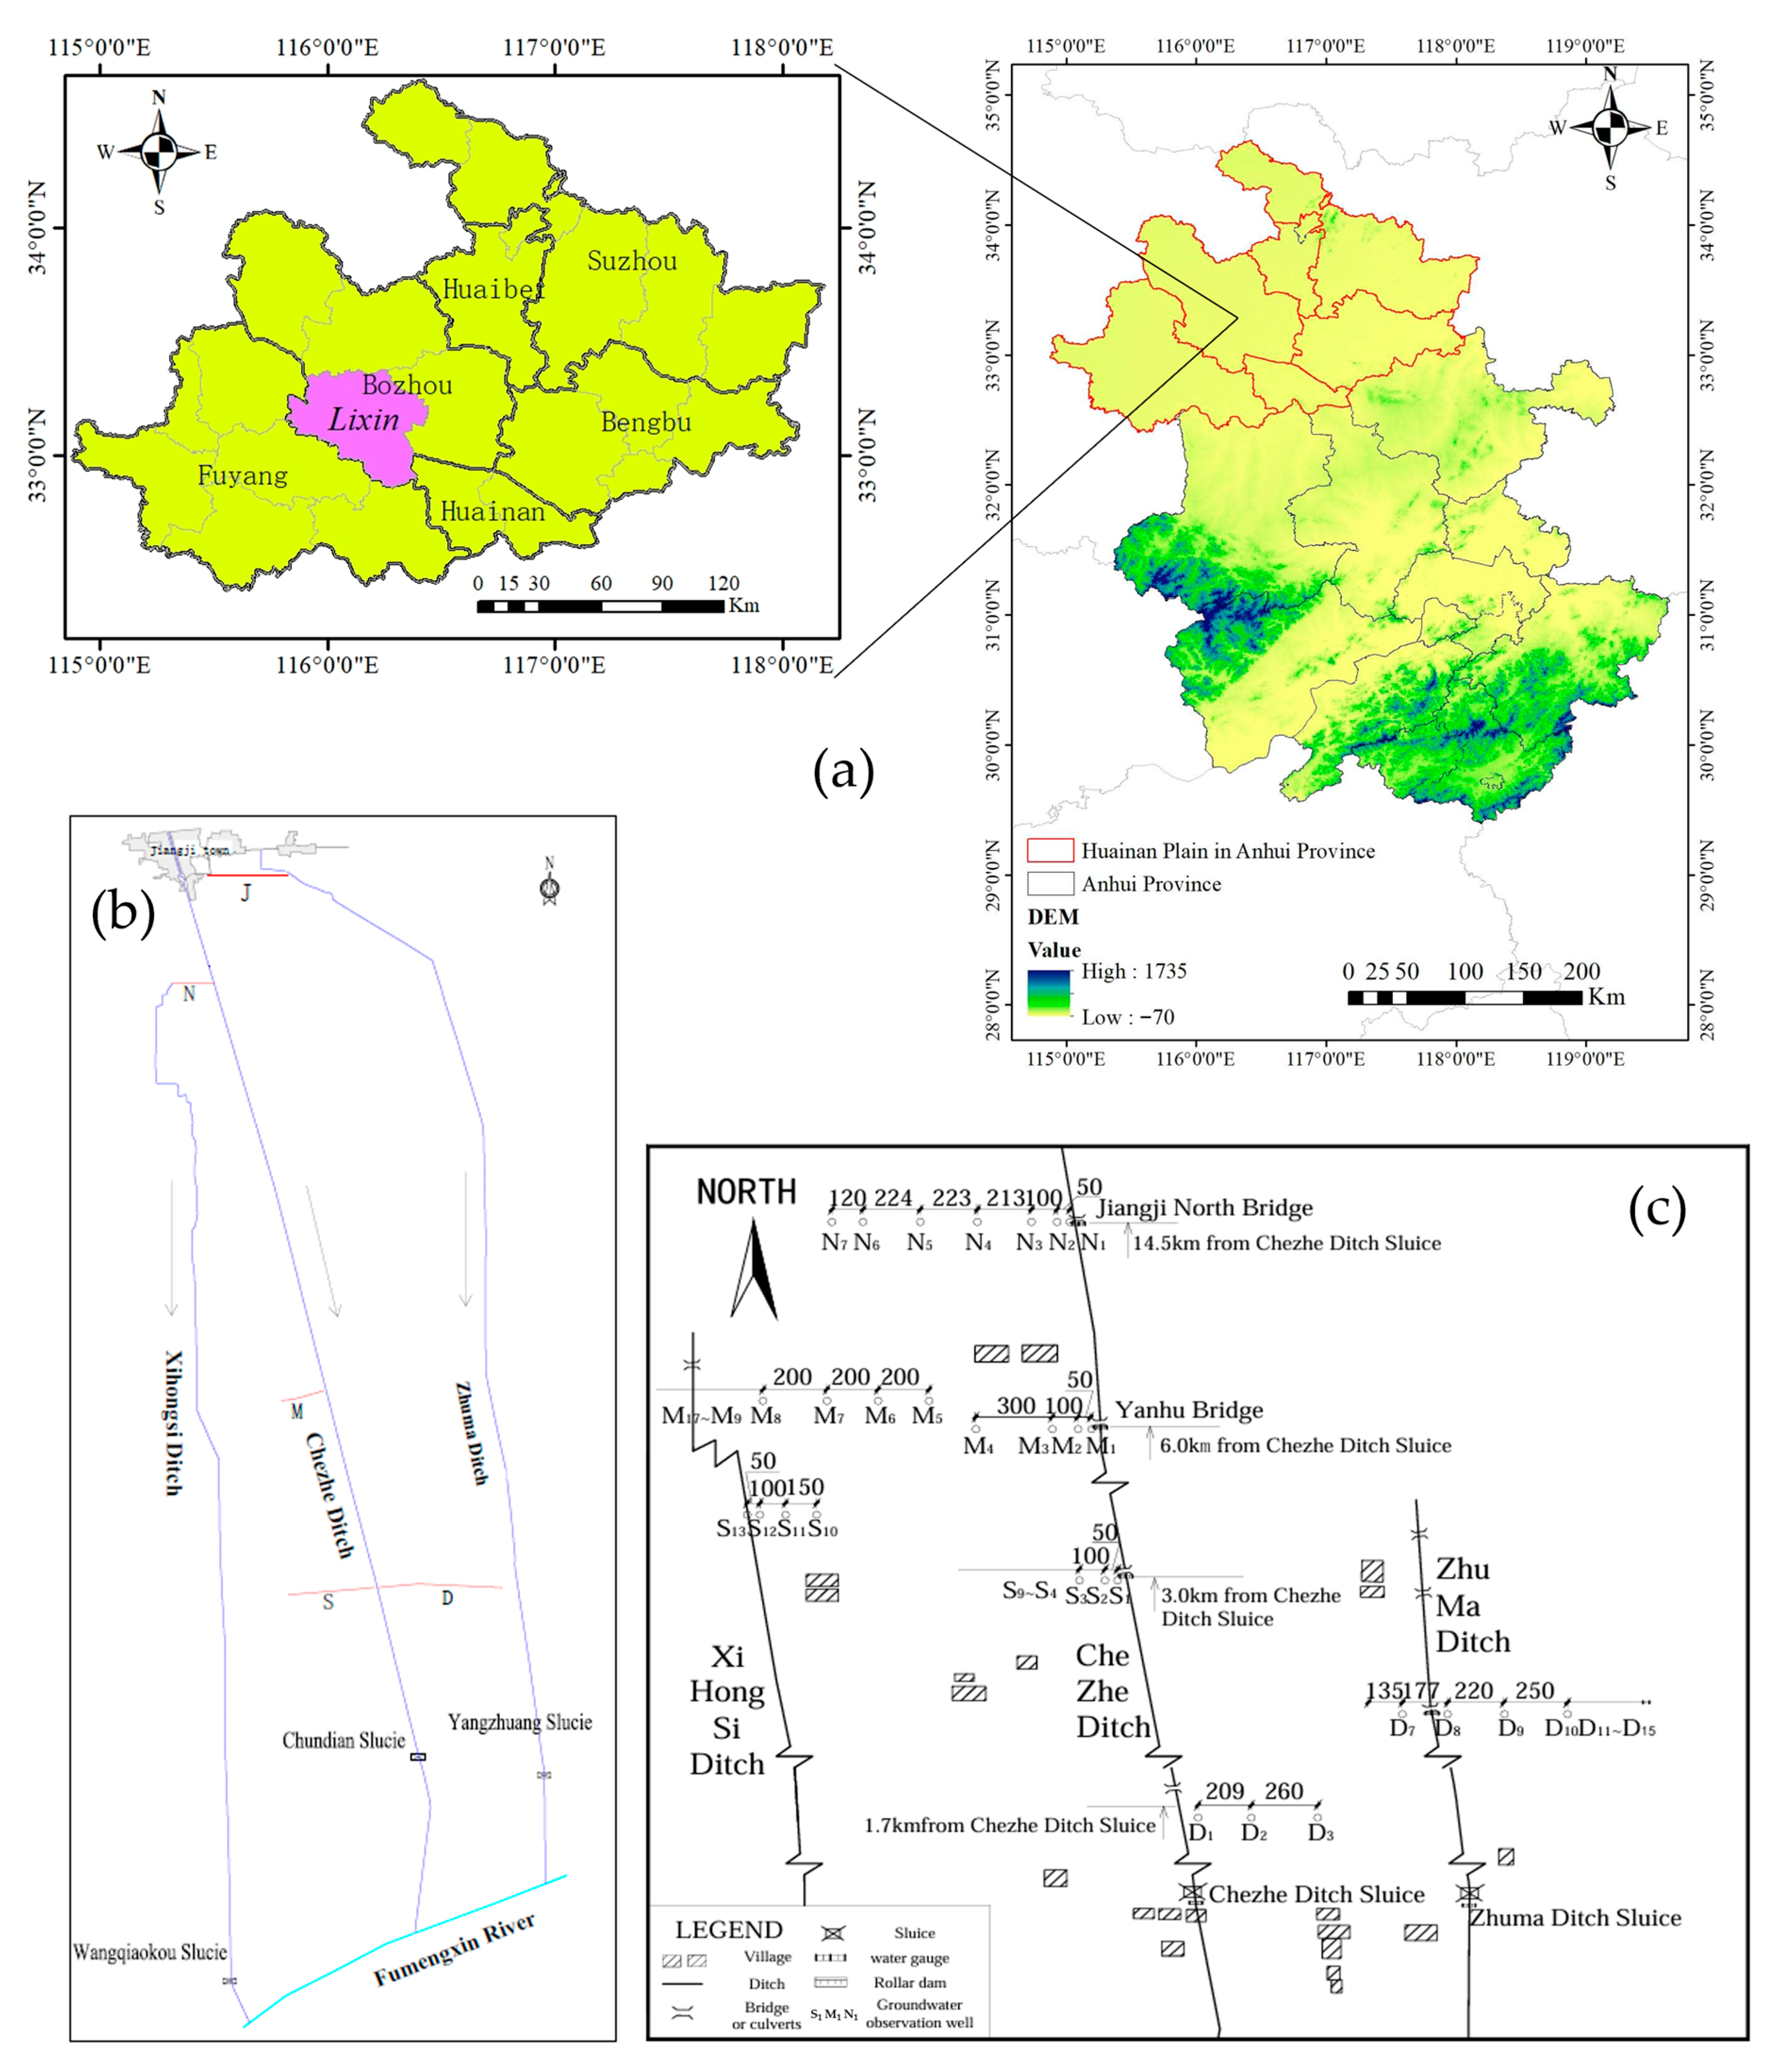
The drainage system in the study area is generally well-developed, comprising large, medium, and small ditches, see
Figure 1. Three main drainage ditches, Dongliu Ditch, Chezhe Ditch, and Xihongsi Ditch, flow from north to south and dis-charge into the Fumengxin River. The design standard for waterlogging control in the main ditch is a re-turn period of once every five years. These ditches have depths ranging from 3.0 to 4.5 m, surface widths of 20 and 40 m, and bottom widths of approximately 5 m. The spacing between adjacent main ditches varies from 1.5 to 2.5 km. Control structures were installed at the downstream sections of all three ditches.
The Chundian sluice is located at the downstream end of Chezhe Gou, 1.5 km from the drainage outlet, and controls a catchment area of 37.5 km2. Designed to meet a 5-year return period drainage standard, it has a design discharge capacity of 39.3 m3/s. The designed upstream and downstream water levels are 26.95 m and 26.80 m, respectively. The sluice chamber features an open-structured, combined sluice-weir system, comprising two openings, each with a clear width of 3.5 m, operated by manual–electrical screw hoists. The ground elevation at the sluice site is 27.60 m.
2.2. Data
Observations included main ditch water levels, groundwater levels, drainage flow, soil moisture, crop growth, and rainfall.
Six gauges were installed at the upstream and downstream sides of the sluice, the overflow dam, and other appropriate locations. These gauges were positioned at Jiangji Sluice (section N), Yanhu Bridge (section M), and Chundian Sluice.
Five rows of groundwater observation wells were established, see
Figure 1b. Three rows were located on the right side of Chezhe Ditch, perpendicular to the ditch, at distances of 3.0 km (section S), 6.0 km (section M), and 14.5 km (section N) upstream of the Chezhe Ditch Sluice. Two rows were installed on the left side of the ditch, also perpendicular, located 3.0 km (section D) and 15.6 km (section J) upstream of the sluice. In total, 53 groundwater level observation wells were deployed.
An automatic weather station was installed near the Chezhe ditch Sluice to obtain daily meteorological data, including rainfall, air pressure, wind direction, wind speed, temperature, and humidity.
3. Results and Discussion
3.1. Effect of the Control Projects on Water Levels in the Main Ditch
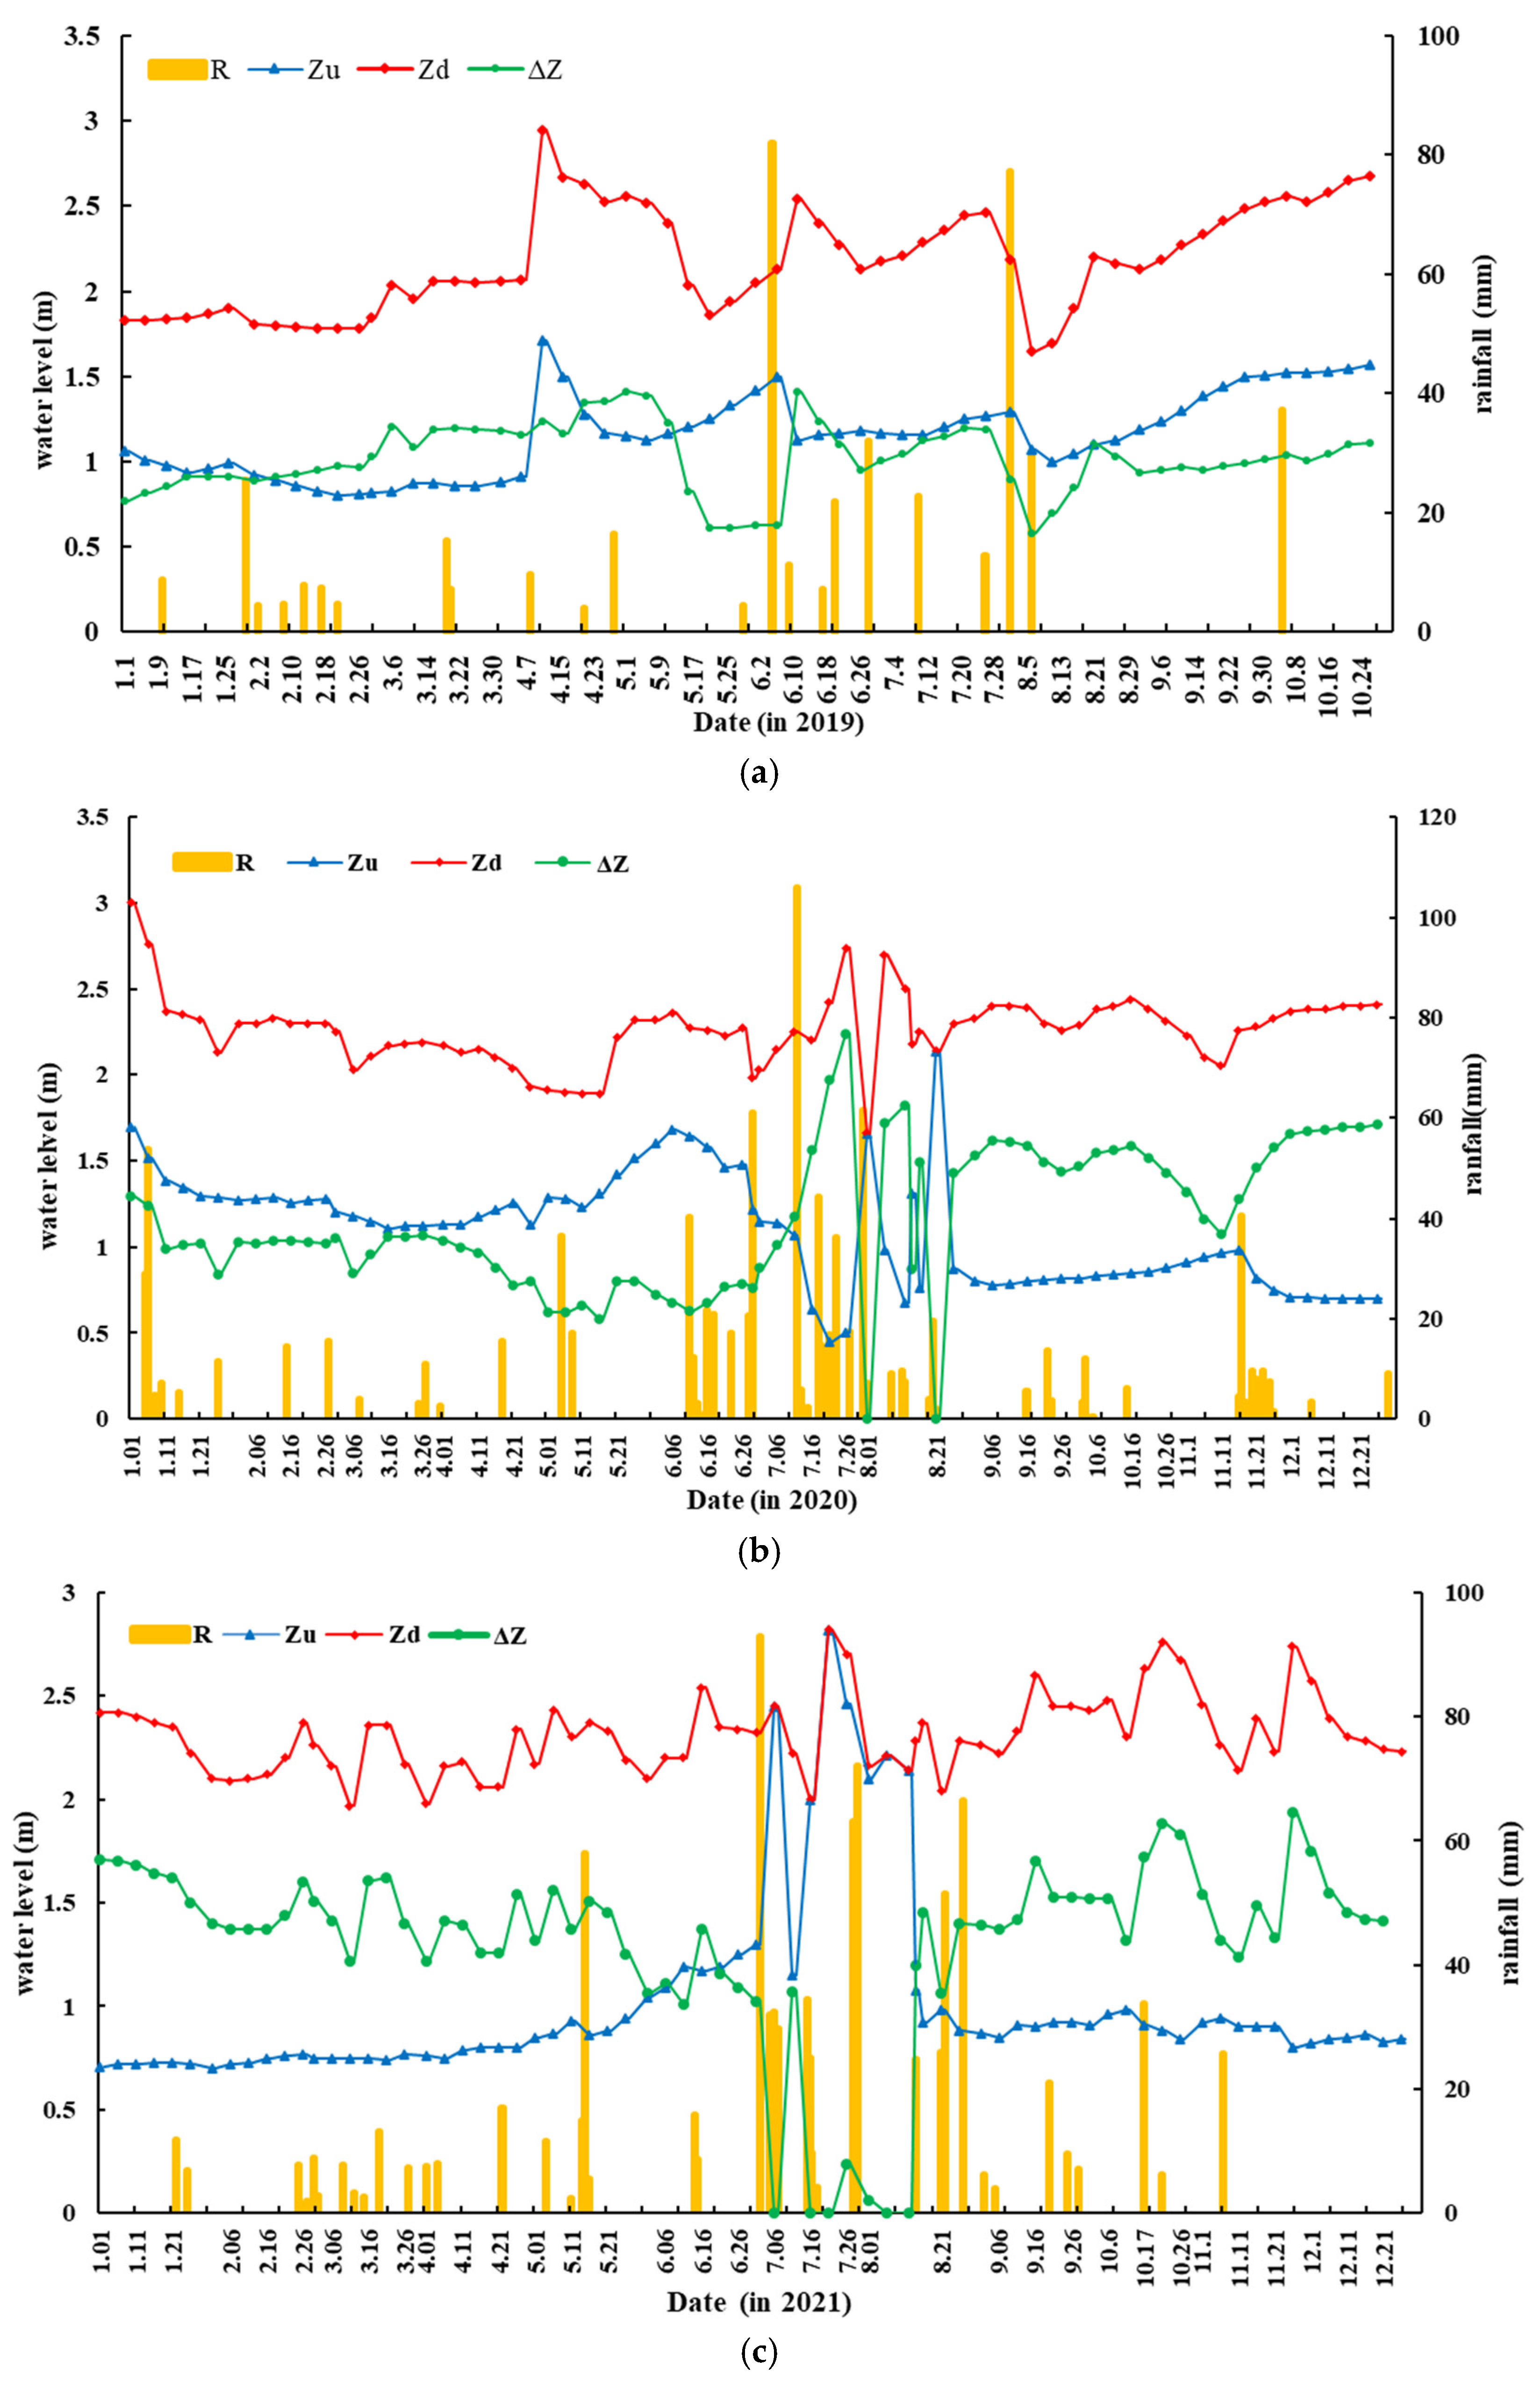
Based on the dynamic water level variations observed upstream and downstream of the Chundian Sluice on the Chezhe ditch from 2019 to 2021 (see
Figure 2), the statistical results are summarized in
Table 1. The data show that the average upstream water depth was 1.09 m, while the average downstream water level was 2.24 m, resulting in a mean water level difference of 1.14 m between the two sides. During the flood season and non-flood season, the water level differences were 1.03 m and 1.22 m, respectively.
In 2019, the annual rainfall was only 480.9 mm. The maximum 1-day and 3-day rainfall events both reached 82 mm, with little significant rainfall occurring before or after these events. Due to the overall low precipitation, the system remained in a water storage state throughout the year. Although the water level in the main ditch exhibited minor fluctuations, the variations were relatively small. The water storage control project implemented on the Chezhe ditch contributed to improved rainfall utilization efficiency.
In 2020, the maximum 3-day rainfall reached 131.58 mm, occurring from 11 July to 13. Considering its temporal distribution and antecedent precipitation, this event represented the type of rainfall most likely to cause waterlogging and associated damage, making it the most critical scenario for waterlogging risk. Two water storage events were observed during the year: one on 19 July and another on 1 August, both following the maximum 3-day rainfall event and subsequent periods of continuous rainfall.
According to daily rainfall records for the project area, precipitation in July 2021 totaled 395.8 mm, occurring in four distinct rainfall events. The maximum 3-day rainfall reached 135.2 mm from 28 July to 30, constituting the fourth event. Owing to the antecedent three rainfall events, this episode represented the most critical scenario likely to cause waterlogging damage, making it the most unfavorable rainfall in terms of waterlogging risk. Four water storage operations were carried out during the year following the maximum 3-day rainfall and subsequent continuous rainfall periods, effectively regulating the storage water level.
As shown in
Figure 2, fluctuations in water levels are closely related to rainfall. Higher rainfall leads to elevated water levels in the ditch, whereas lower rainfall results in decreased levels. Under the combined influence of precipitation, evaporation, and water use, the storage water level undergoes dynamic changes, often exhibiting multiple cycles of filling and drainage within a year. Generally, water levels during the flood season are higher than those in the non-flood season, while the water level difference between upstream and downstream is greater in the non-flood season. This pattern reflects the regulatory function of the control structure, demonstrating its role in redistributing rainfall runoff over time.
Thus, the control project in the main ditch not only effectively retains surface runoff generated during the flood season but also limits the discharge of surface water during the non-flood season. When the control project meets the drainage requirements of the experimental area, the regulated water volume can provide a significant source of supplemental irrigation for crops and help mitigate the decline of groundwater levels in the Huaibei region.
Research on the impact of control structures in main drainage ditches on water storage variations indicates a strong correlation between ditch water level fluctuations and rainfall. Under the combined influence of rainfall, evaporation, and water use, the storage level often undergoes multiple cycles of filling and draining within a year. The multi-year average water level difference upstream and downstream of the control sluice in the main ditch reaches 1.14 m, with an average annual storage volume of 30 mm, accounting for 3.7% of the total precipitation. The control structure not only effectively retains surface runoff generated during flood-season rainfall and regulates the temporal distribution of runoff but also limits the discharge of surface water from the main ditch during dry-season.
3.2. Effect of Control Projects on Groundwater Depth
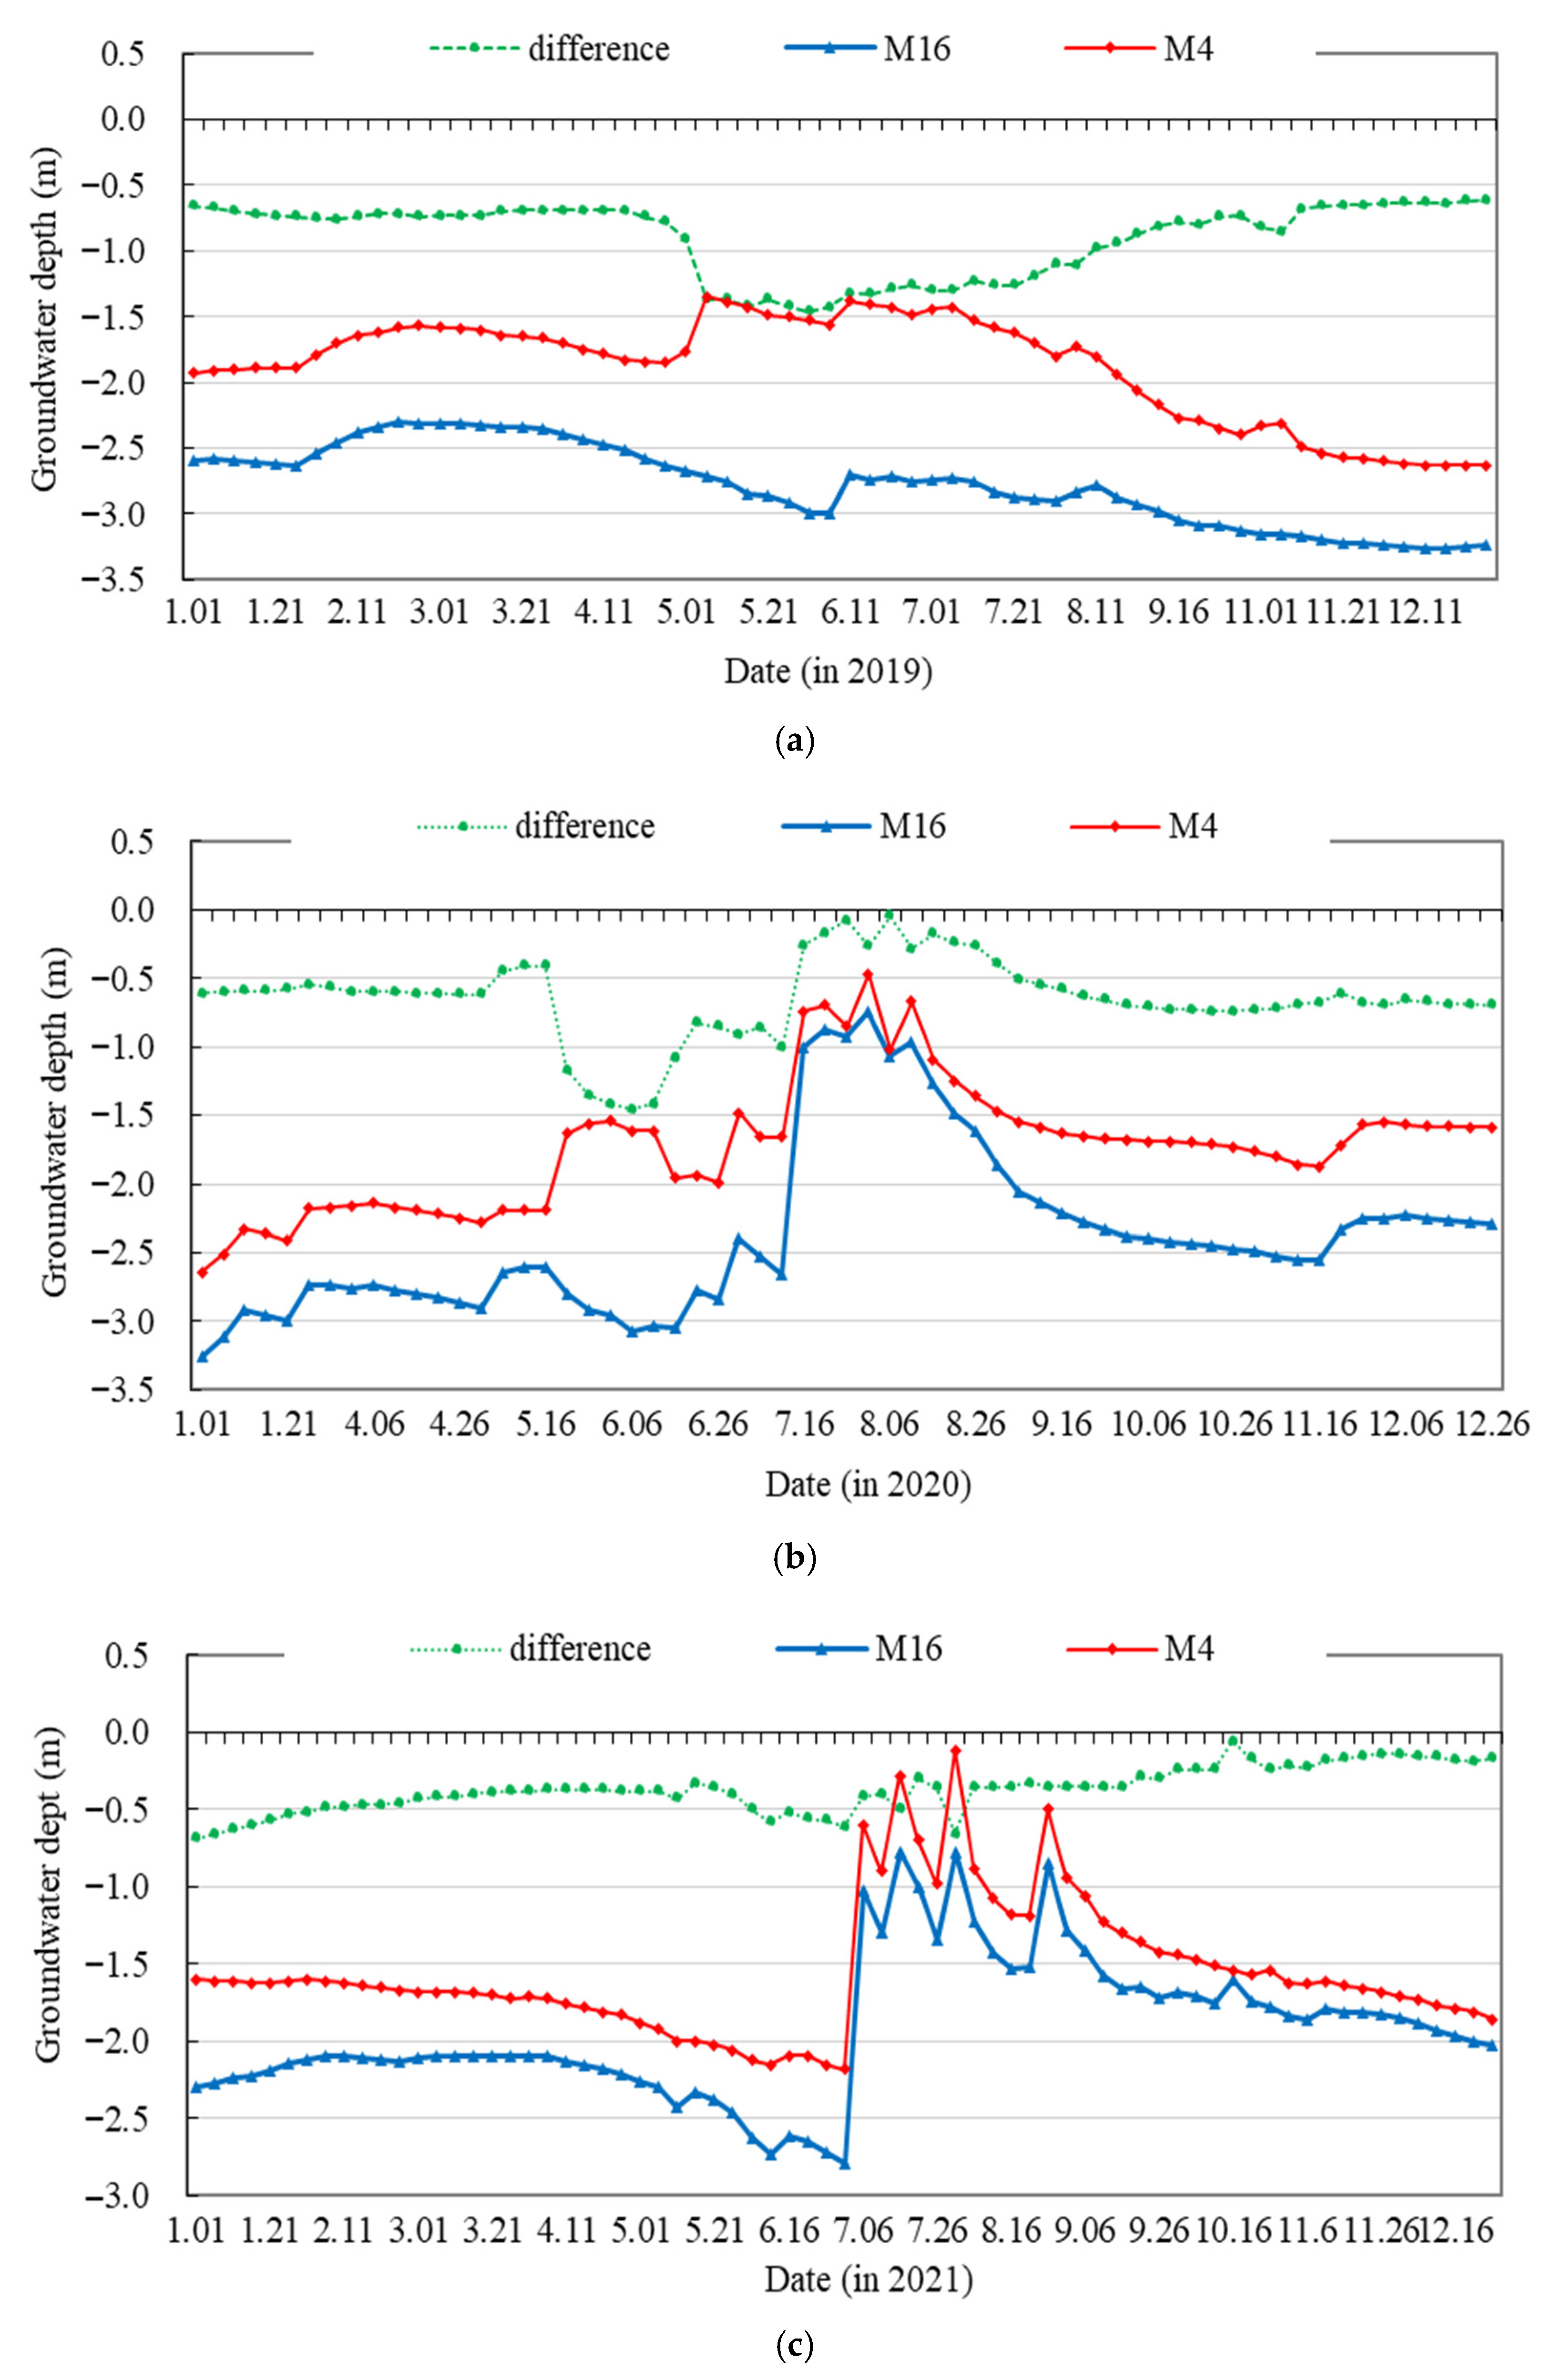
To minimize the influence of upstream and downstream control structures and rivers on groundwater levels, data from section M, located 6.0 km upstream of the Chezhe ditch Sluice within the watershed, were selected for analysis. Monitoring point M4 represents a site within the area influenced by the main control structures, while point M16 represents a site outside the controlled area. The dynamic variations in groundwater depth at farmland sites M4 and M16 from 2019 to 2021 are presented in
Figure 3.
The root depth of winter wheat in the Huaibei Plain ranges from 1.5 to 3.0 m, while that of summer corn ranges from 1.5 to 2.0 m, and soybean roots can reach depths of up to 1.5 m.
As shown in
Figure 3a, during the critical water requirement period of winter wheat in early January, the groundwater depth at monitoring point M4 was approximately 1.90 m, enabling direct groundwater supply to meet the soil moisture needs of the crop. In contrast, the groundwater depth at M16 exceeded 2.60 m. During the growth period of corn and soybeans in July, the groundwater depth at M4 was about 1.55 m, whereas at M16 it reached approximately 2.81 m. These results indicate that the water storage control project in the main ditch can provide sufficient available soil moisture for crops.
As shown in
Figure 3b,c, the patterns of groundwater depth variation in 2020 and 2021 were generally consistent with those observed in 2019. From January until the onset of the flood season, groundwater levels fluctuated moderately while exhibiting a declining trend. Following rainfall during the flood season, groundwater levels gradually rose with fluctuations until the difference in depth between M4 and M16 reached its minimum. After the flood season, groundwater levels gradually declined and eventually stabilized, while the difference in groundwater depth between M4 and M16 increased with fluctuations before also reaching stability. These results indicate that the water storage control project in the main ditch effectively regulates groundwater levels.
As shown in
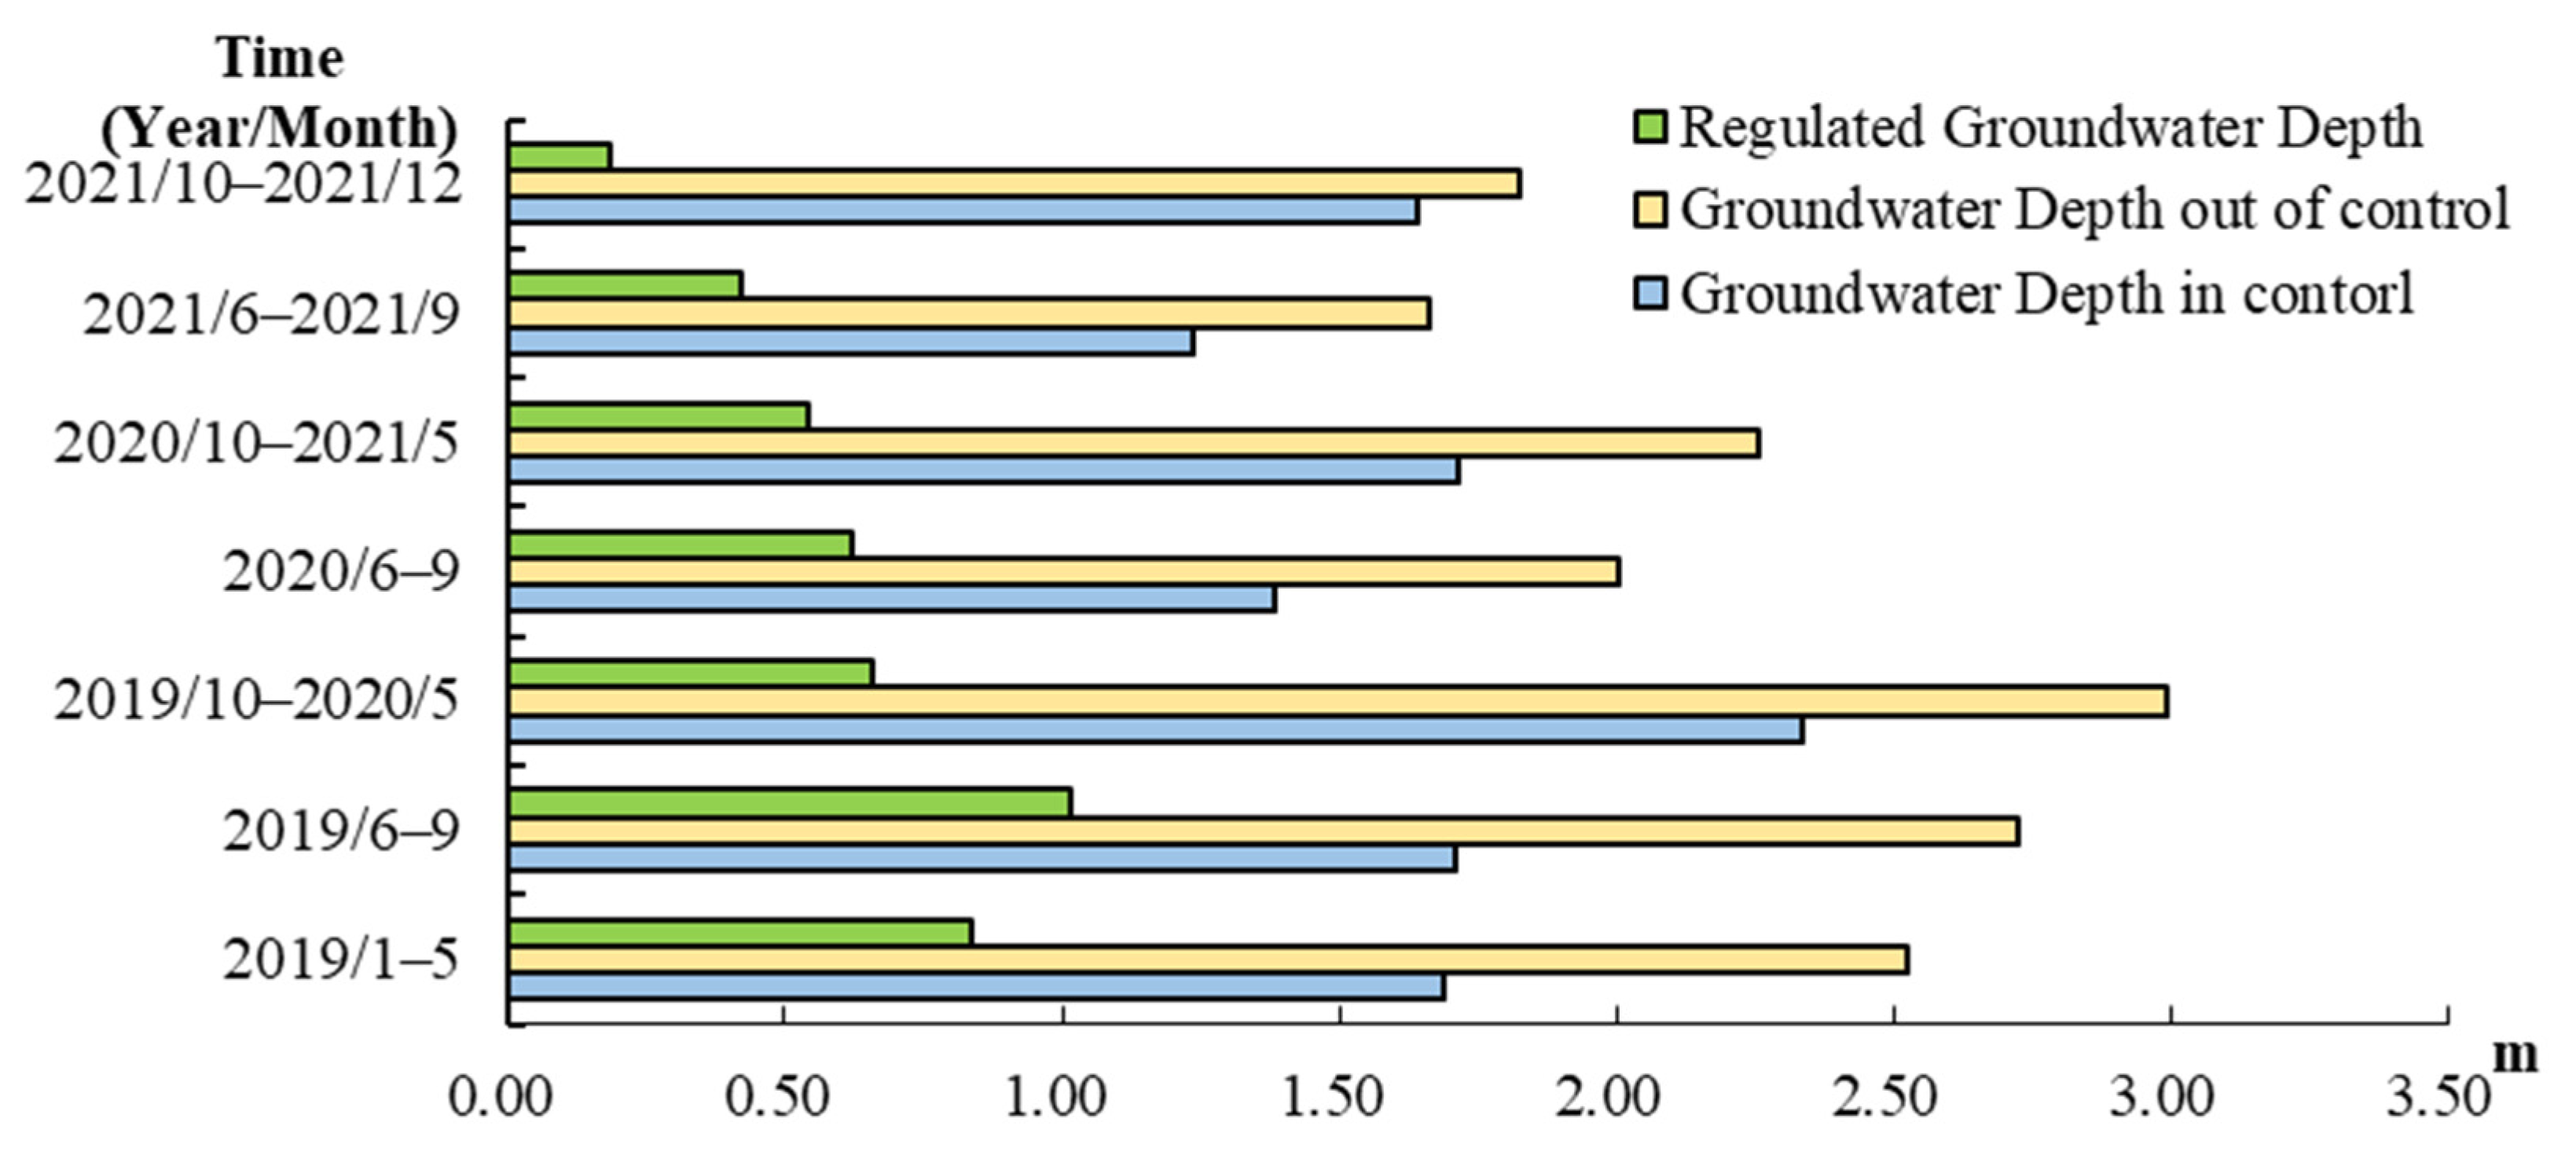
Table 2, over the three-year period, the water storage control project in the main ditch raised groundwater levels by 0.69 m during flood seasons and 0.78 m during non-flood seasons. From 2019 to 2021, the regulated groundwater depth increases were 0.89 m, 0.65 m, and 0.37 m, respectively, indicating that the control project effectively contributes to groundwater level elevation. During flood seasons, excessive rainfall often causes groundwater to reach the surface, generating runoff; consequently, the magnitude of groundwater level rise is relatively limited. Conversely, within the same hydrological year, groundwater level increases are more pronounced during non-flood seasons than during flood seasons.
From the above, it is evident that within the influence range of the main ditch, groundwater levels near the edge of the controlled main ditch are higher than those at locations farther from the ditch. In contrast, in areas without control, groundwater levels near the ditch edge are lower than those farther away. This indicates that the construction of control projects on the ditch not only retains natural rainfall, stores surface runoff, and raises groundwater levels, but also suppresses the discharge of shallow groundwater, providing a supplementary effect to the groundwater supply. By implementing controlled drainage in accordance with farmland soil moisture conditions, it is possible to improve rainfall utilization while alleviating water scarcity pressures, all while meeting the required drainage standards.
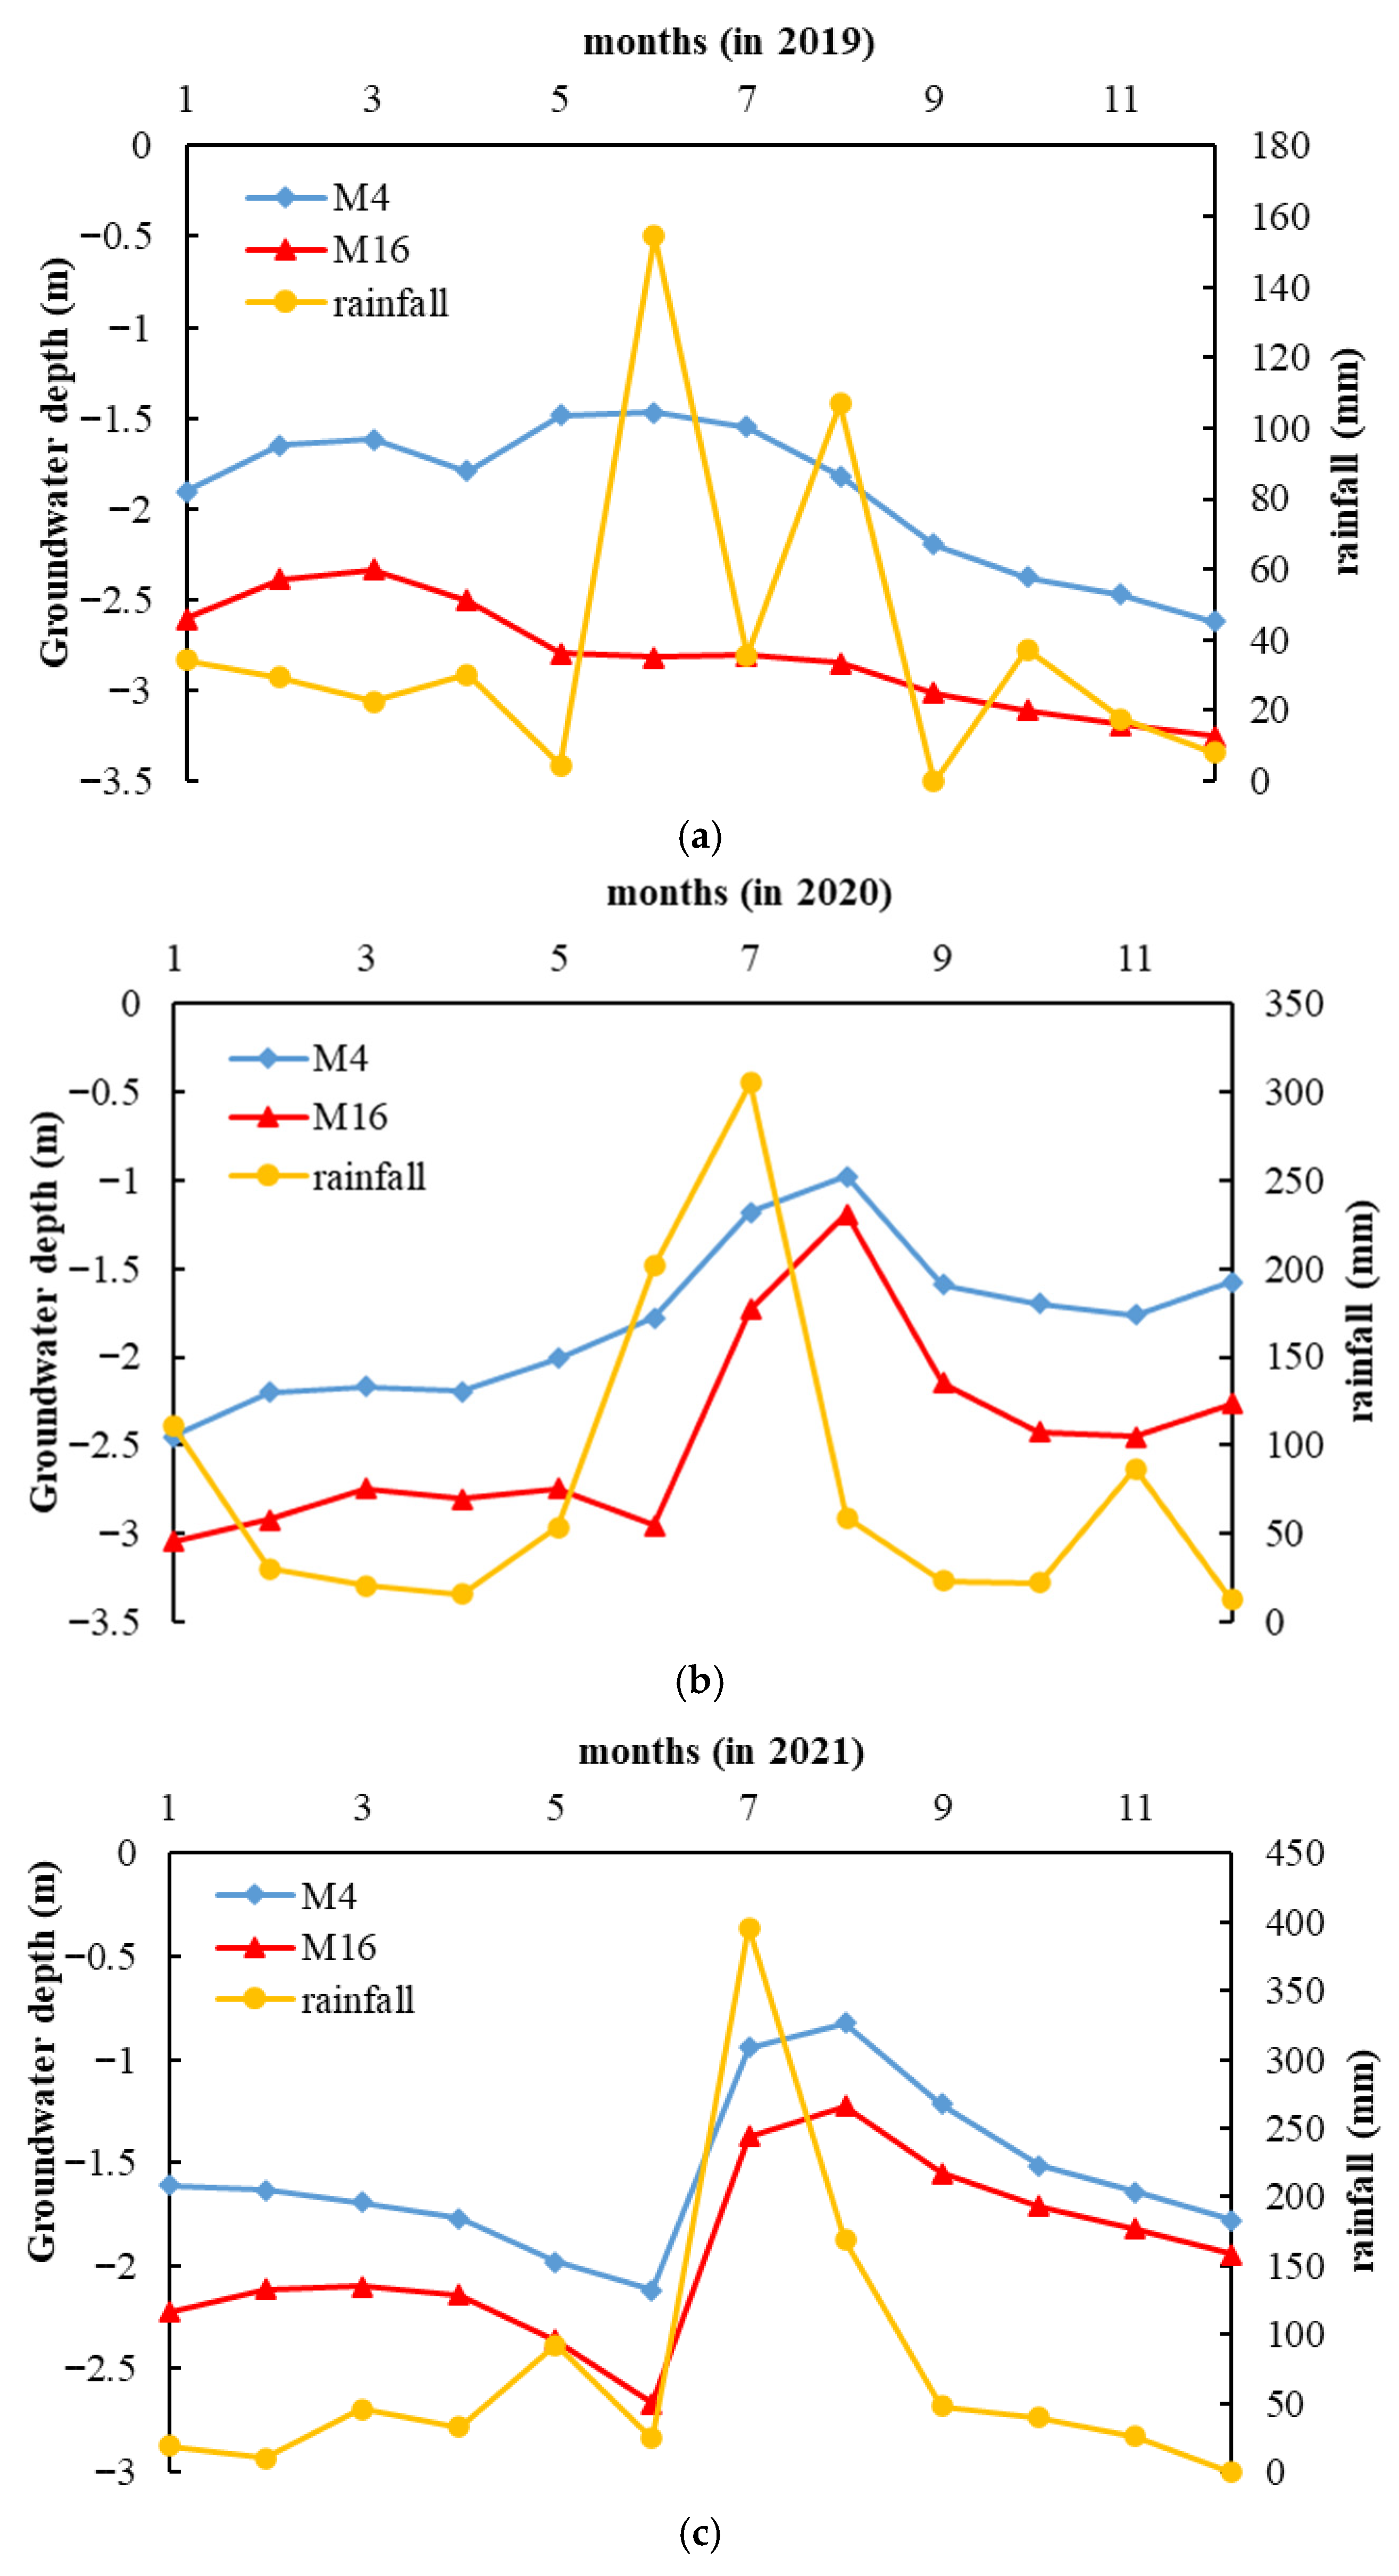
As illustrated in
Figure 4, groundwater depths at monitoring points M4 and M16 exhibit consistent trends of increase and decrease: levels are low prior to the flood season, rise rapidly in response to rainfall during the flood season, and gradually decline afterward due to evaporation and extraction. Notably, groundwater depth at M4 is consistently shallower than at M16. Before the flood season, the groundwater depth at M4 is significantly lower than at M16. Following the rapid rise during the flood season, the subsequent decline in both magnitude and rate at M4 is markedly smaller than at M16, reflecting the water storage effect of the control structure.
The influence of the control structure on groundwater extends approximately 800 m. The difference in groundwater depth between farmland with and without control structures is about 0.5 m. The elevated groundwater level not only enhances agricultural water resource regulation and increases direct crop access to groundwater but also contributes to the improvement of the regional ecological environment. The multi-year average groundwater level rise is 0.64 m, corresponding to an additional groundwater storage of 56 mm, which represents 6.8% of the annual precipitation.
3.3. Effect of Control Projects on Drainage
In the Huaibei Plain, the drainage standard for farmland requires the removal of stagnant water within one day following three consecutive days of rainfall. The waterlogging control standard stipulates that groundwater levels should recede to 0.5 m below the surface within three days after rainfall, even if levels initially reach the surface.
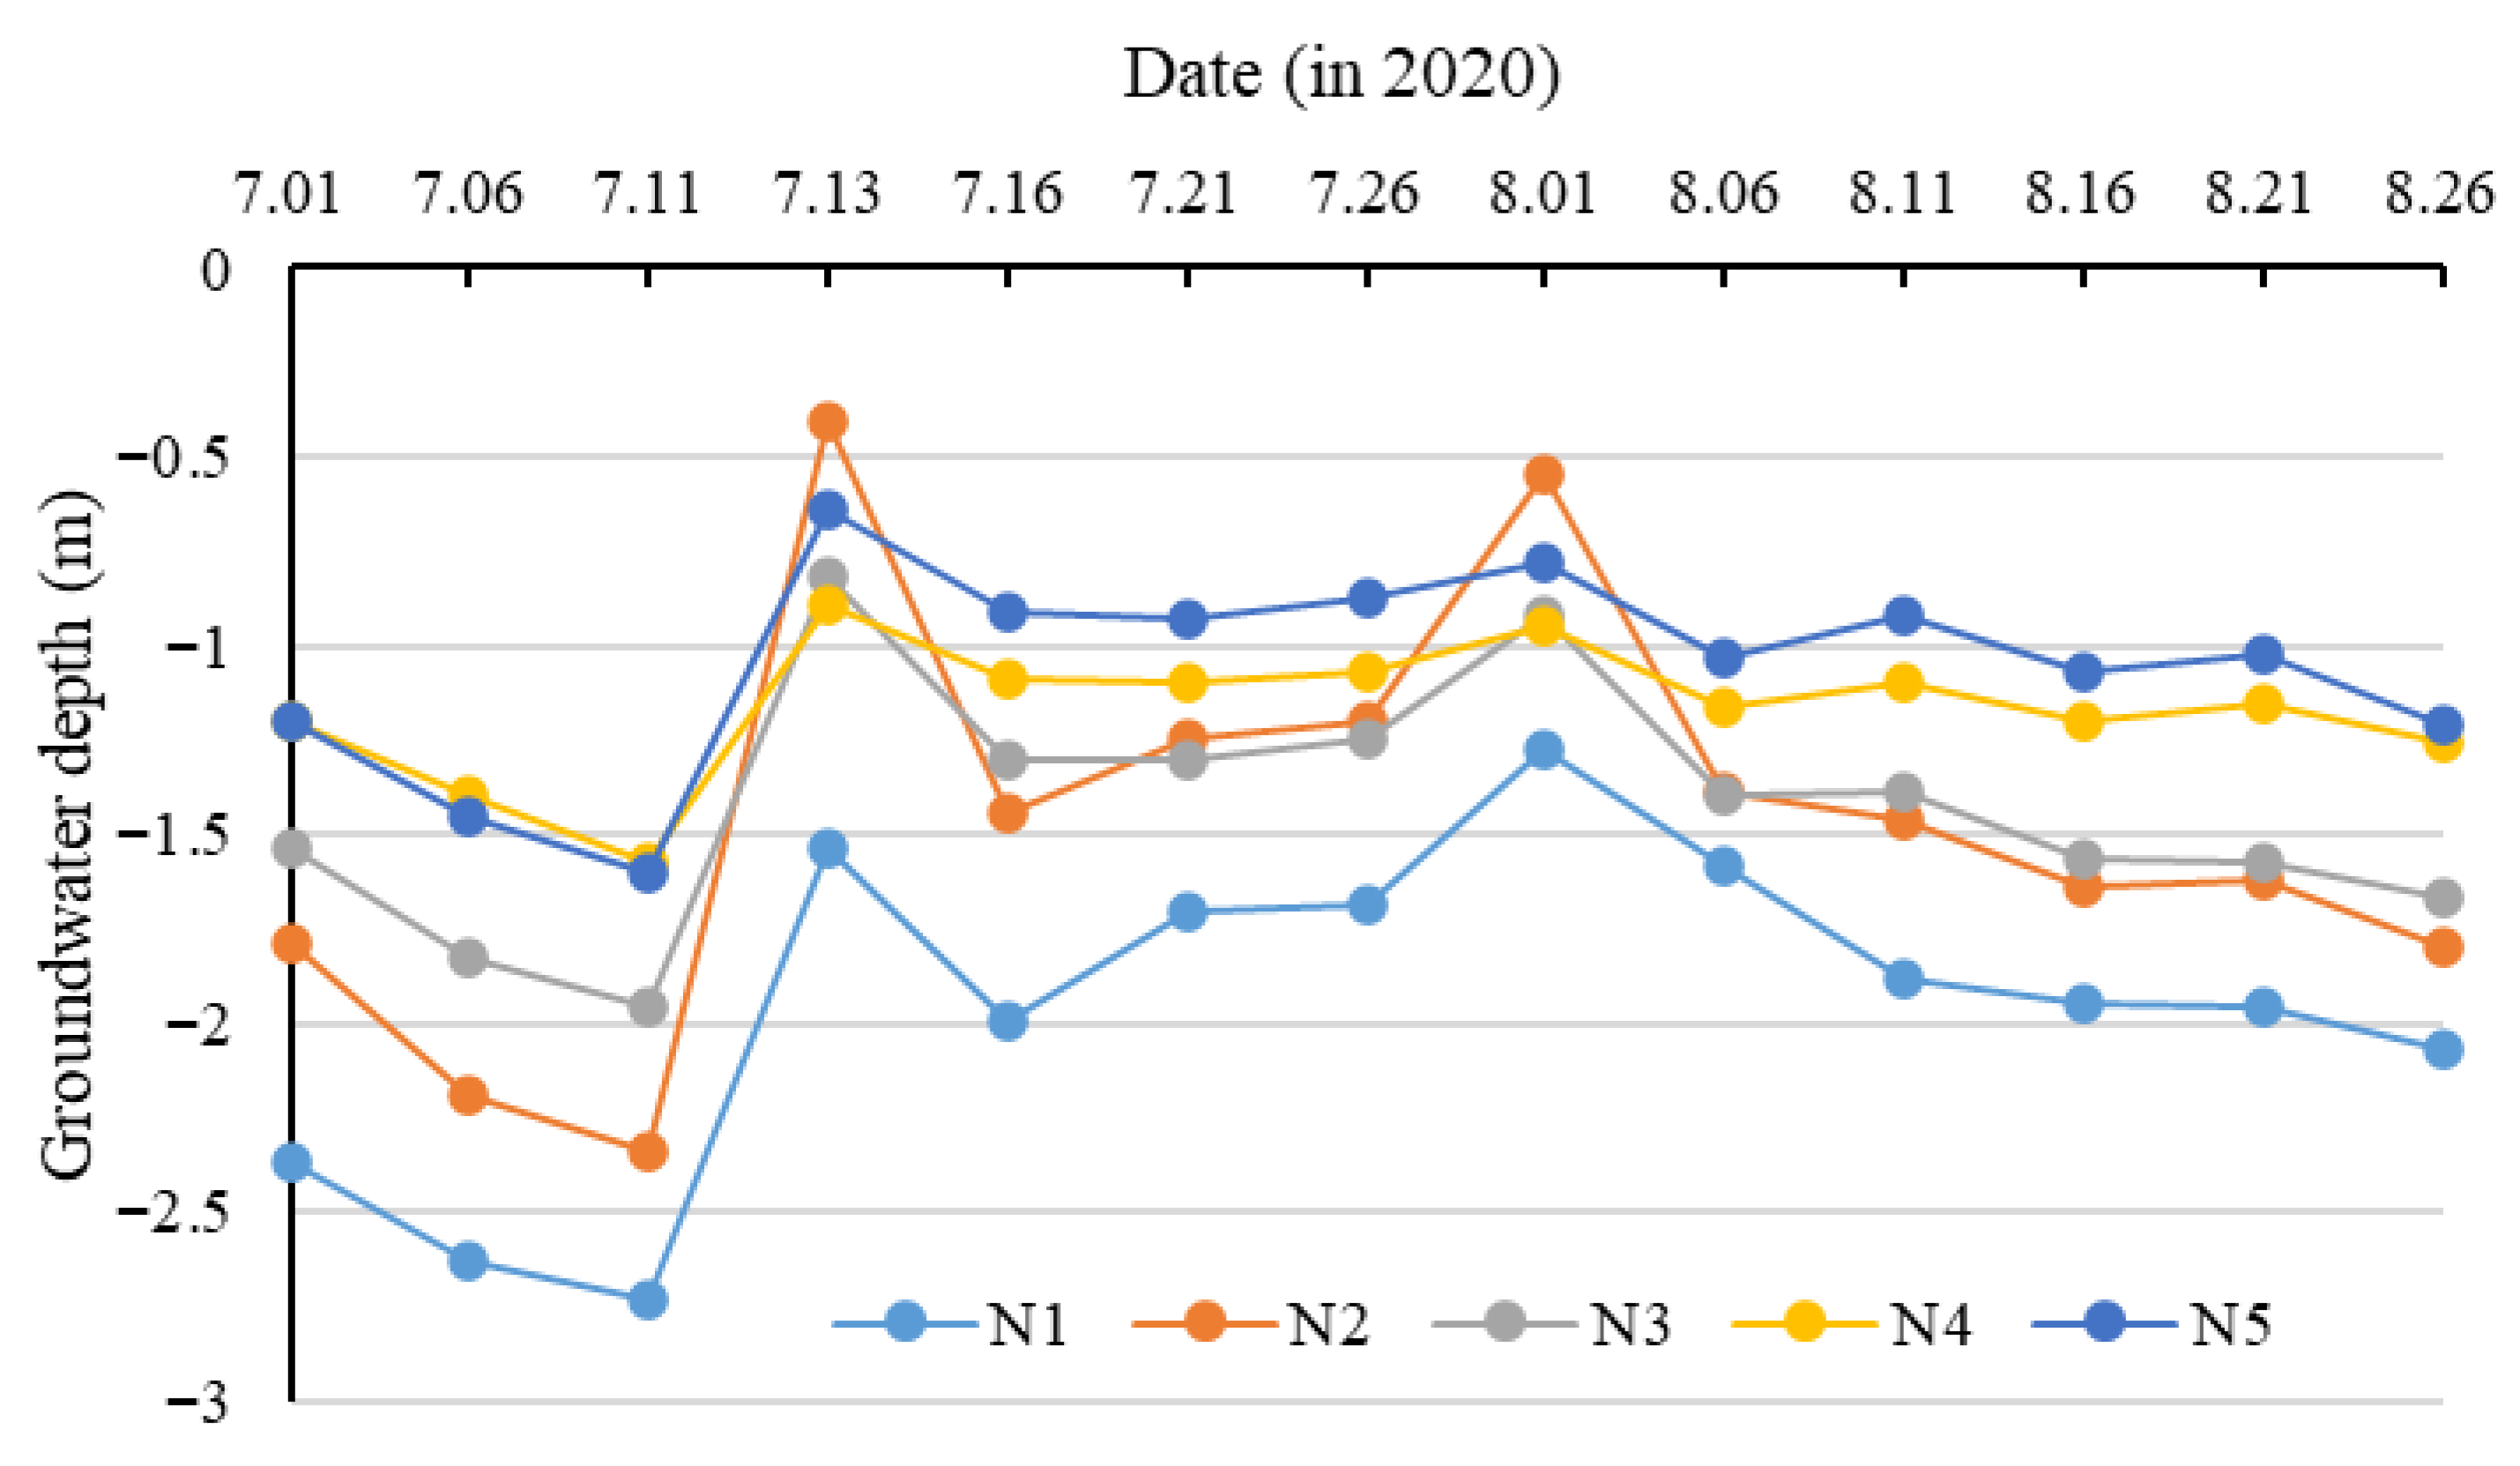
In July 2020, monthly rainfall reached 376.89 mm, with two major rainfall events occurring during the month. Rainfall amounts of 131.58 mm and 113.55 mm were recorded from 11 to 12 July and 30 to 31 July, respectively. According to measured groundwater level records (
Figure 5), during these heavy rainfall events, surface water along section N, which was influenced by the control project, was drained within one day after rainfall. Moreover, the minimum groundwater depth in the retention zone of the main ditch declined to 0.42 m within three days following each heavy rainfall event, thereby meeting the waterlogging control standard.
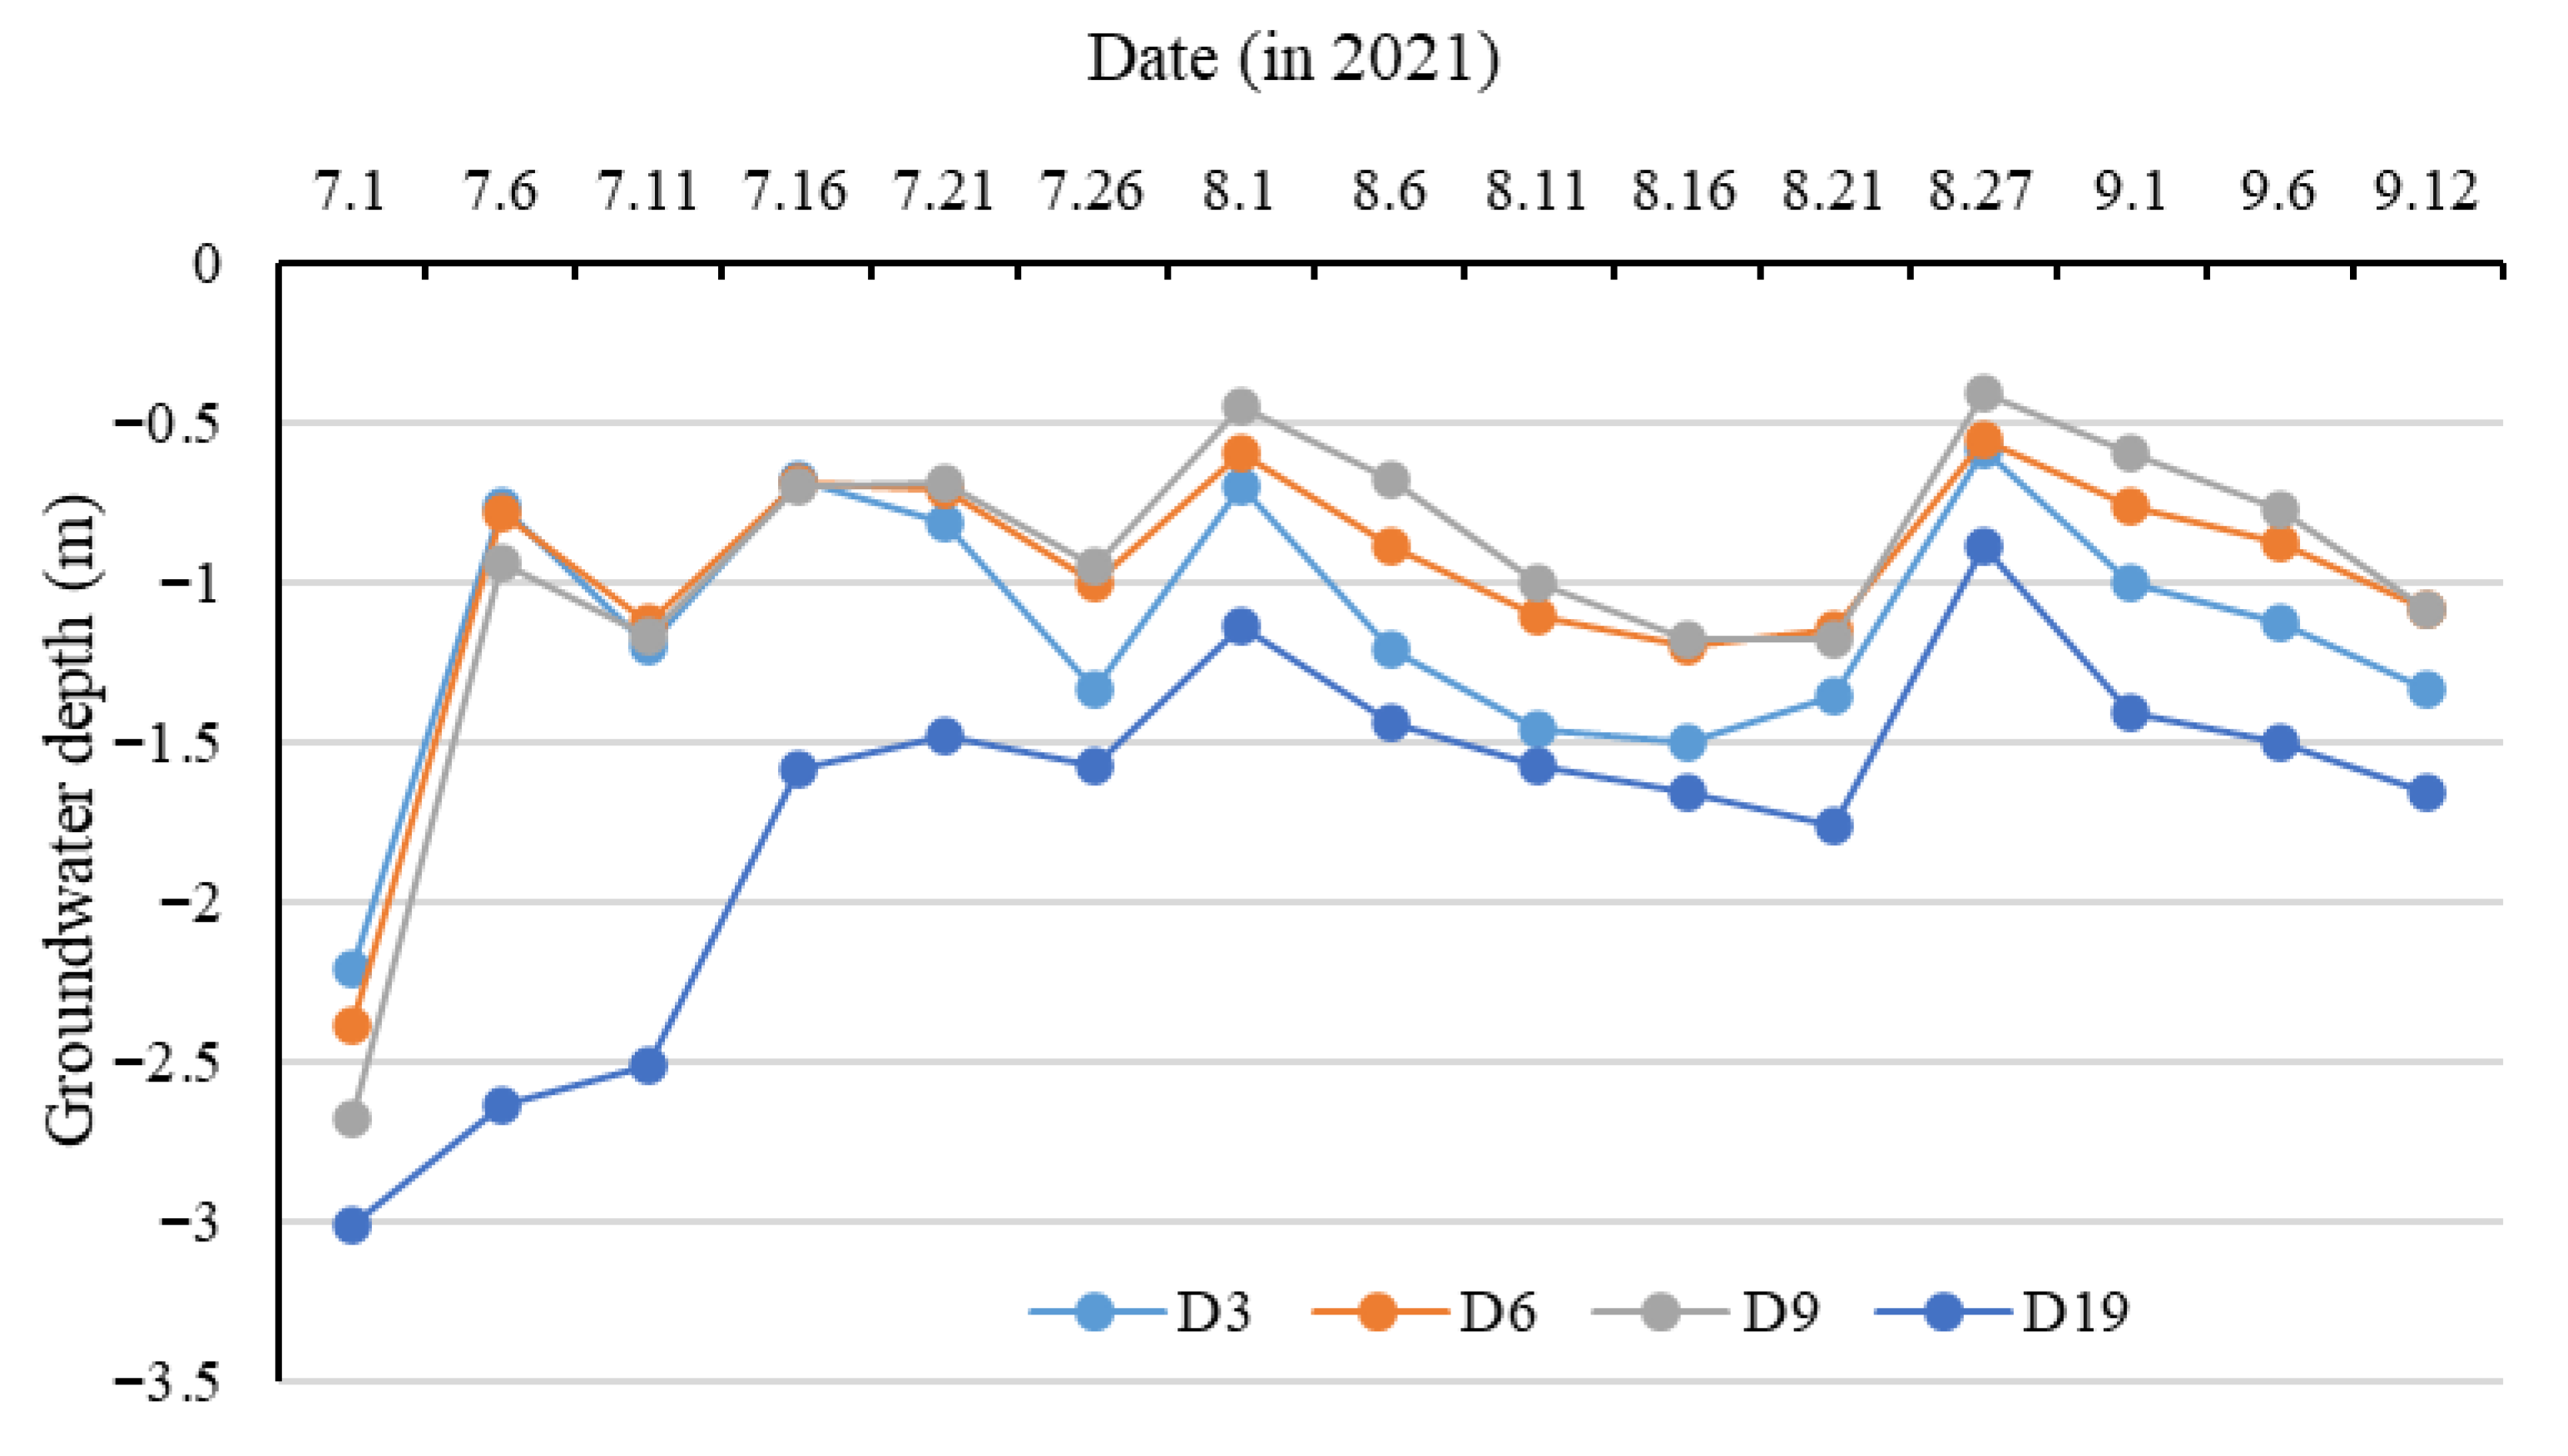
In July 2021, total rainfall reached 484.4 mm, including events of 92.8 mm on 2 July and 94.2 mm, 73.6 mm, and 174.6 mm during 5–7 July, 15–18 July, and 27–29 July, respectively. In August, rainfall totaled 136.41 mm, with 62.21 mm occurring from 21 August to 24. As shown in
Figure 6, surface water accumulation at the cross-section D area influenced by the control structure was drained within one day after each rainfall event. Furthermore, the minimum observed groundwater depth in the water storage control area of the main drainage ditch receded to below 0.5 m within three days following all heavy rainfall events, thereby meeting the waterlogging control standard.
It can be observed that, on the third day after surface water was drained following heavy rainfall events, the groundwater level at the controlled points along the cross-section declined to 52–98 cm below the surface, while the maximum groundwater rise decreased to 39–61 cm below the surface. All values meet the requirements of the design drainage standard and do not pose adverse effects on crop growth. These results demonstrate that the influence of the control structure on the drainage process fully satisfies the design criteria for both drainage and waterlogging mitigation. During heavy rainfall and continuous precipitation in the flood season, the scientifically managed control project in the main drainage ditch effectively reduces waterlogging, alleviates soil moisture stress, and improves soil water conditions. Furthermore, the benefits of the multi-level drainage system are fully realized. Provided that engineering parameters are properly designed and operational measures are appropriately implemented, the water storage project in the main ditch will not impair drainage performance.
3.4. Regulation Effect of Agricultural Water Resources
The regulatory function of the control project on water resources is evaluated through direct retention of rainfall-induced runoff and enhancement of groundwater resources resulting from elevated groundwater levels.
3.4.1. Control Engineering for Regulating and Storing Rainfall Runoff
The annual regulated water volume of the control project was estimated by multiplying the average annual regulated water volume, derived from the mean water level difference between the upstream and downstream sides of the structure, by the number of effective regulation events. The number of regulation events was determined based on observed water level fluctuations, rainfall characteristics, and irrigation conditions. As shown in
Table 3, the differences in water level variations inside and outside the controlled storage area of the main ditch from 2019 to 2021 were analyzed. The relationship between the regulated water level and corresponding rainfall events is illustrated in
Figure 7. Based on these calculations, the regulated water volumes were 3.41 × 10
5 m
3 in 2019, 7.43 × 10
5 m
3 in 2020, and 7.86 × 10
5 m
3 in 2021.
3.4.2. Control Engineering for Regulating and Storing Underground Water
The regulatory capacity of the control project on groundwater resources was estimated based on the increase in soil water storage corresponding to the maximum rise in groundwater level during the dry season. Using the Chundian Sluice as an example, groundwater regulation volumes were calculated from field observations. The length of the main ditch upstream of the Chundian Sluice is 13 km, with an influence range extending 800 m on both sides of the ditch. Using a specific yield of 0.04 [
26,
28], the calculated groundwater regulation volumes are summarized in
Table 3.
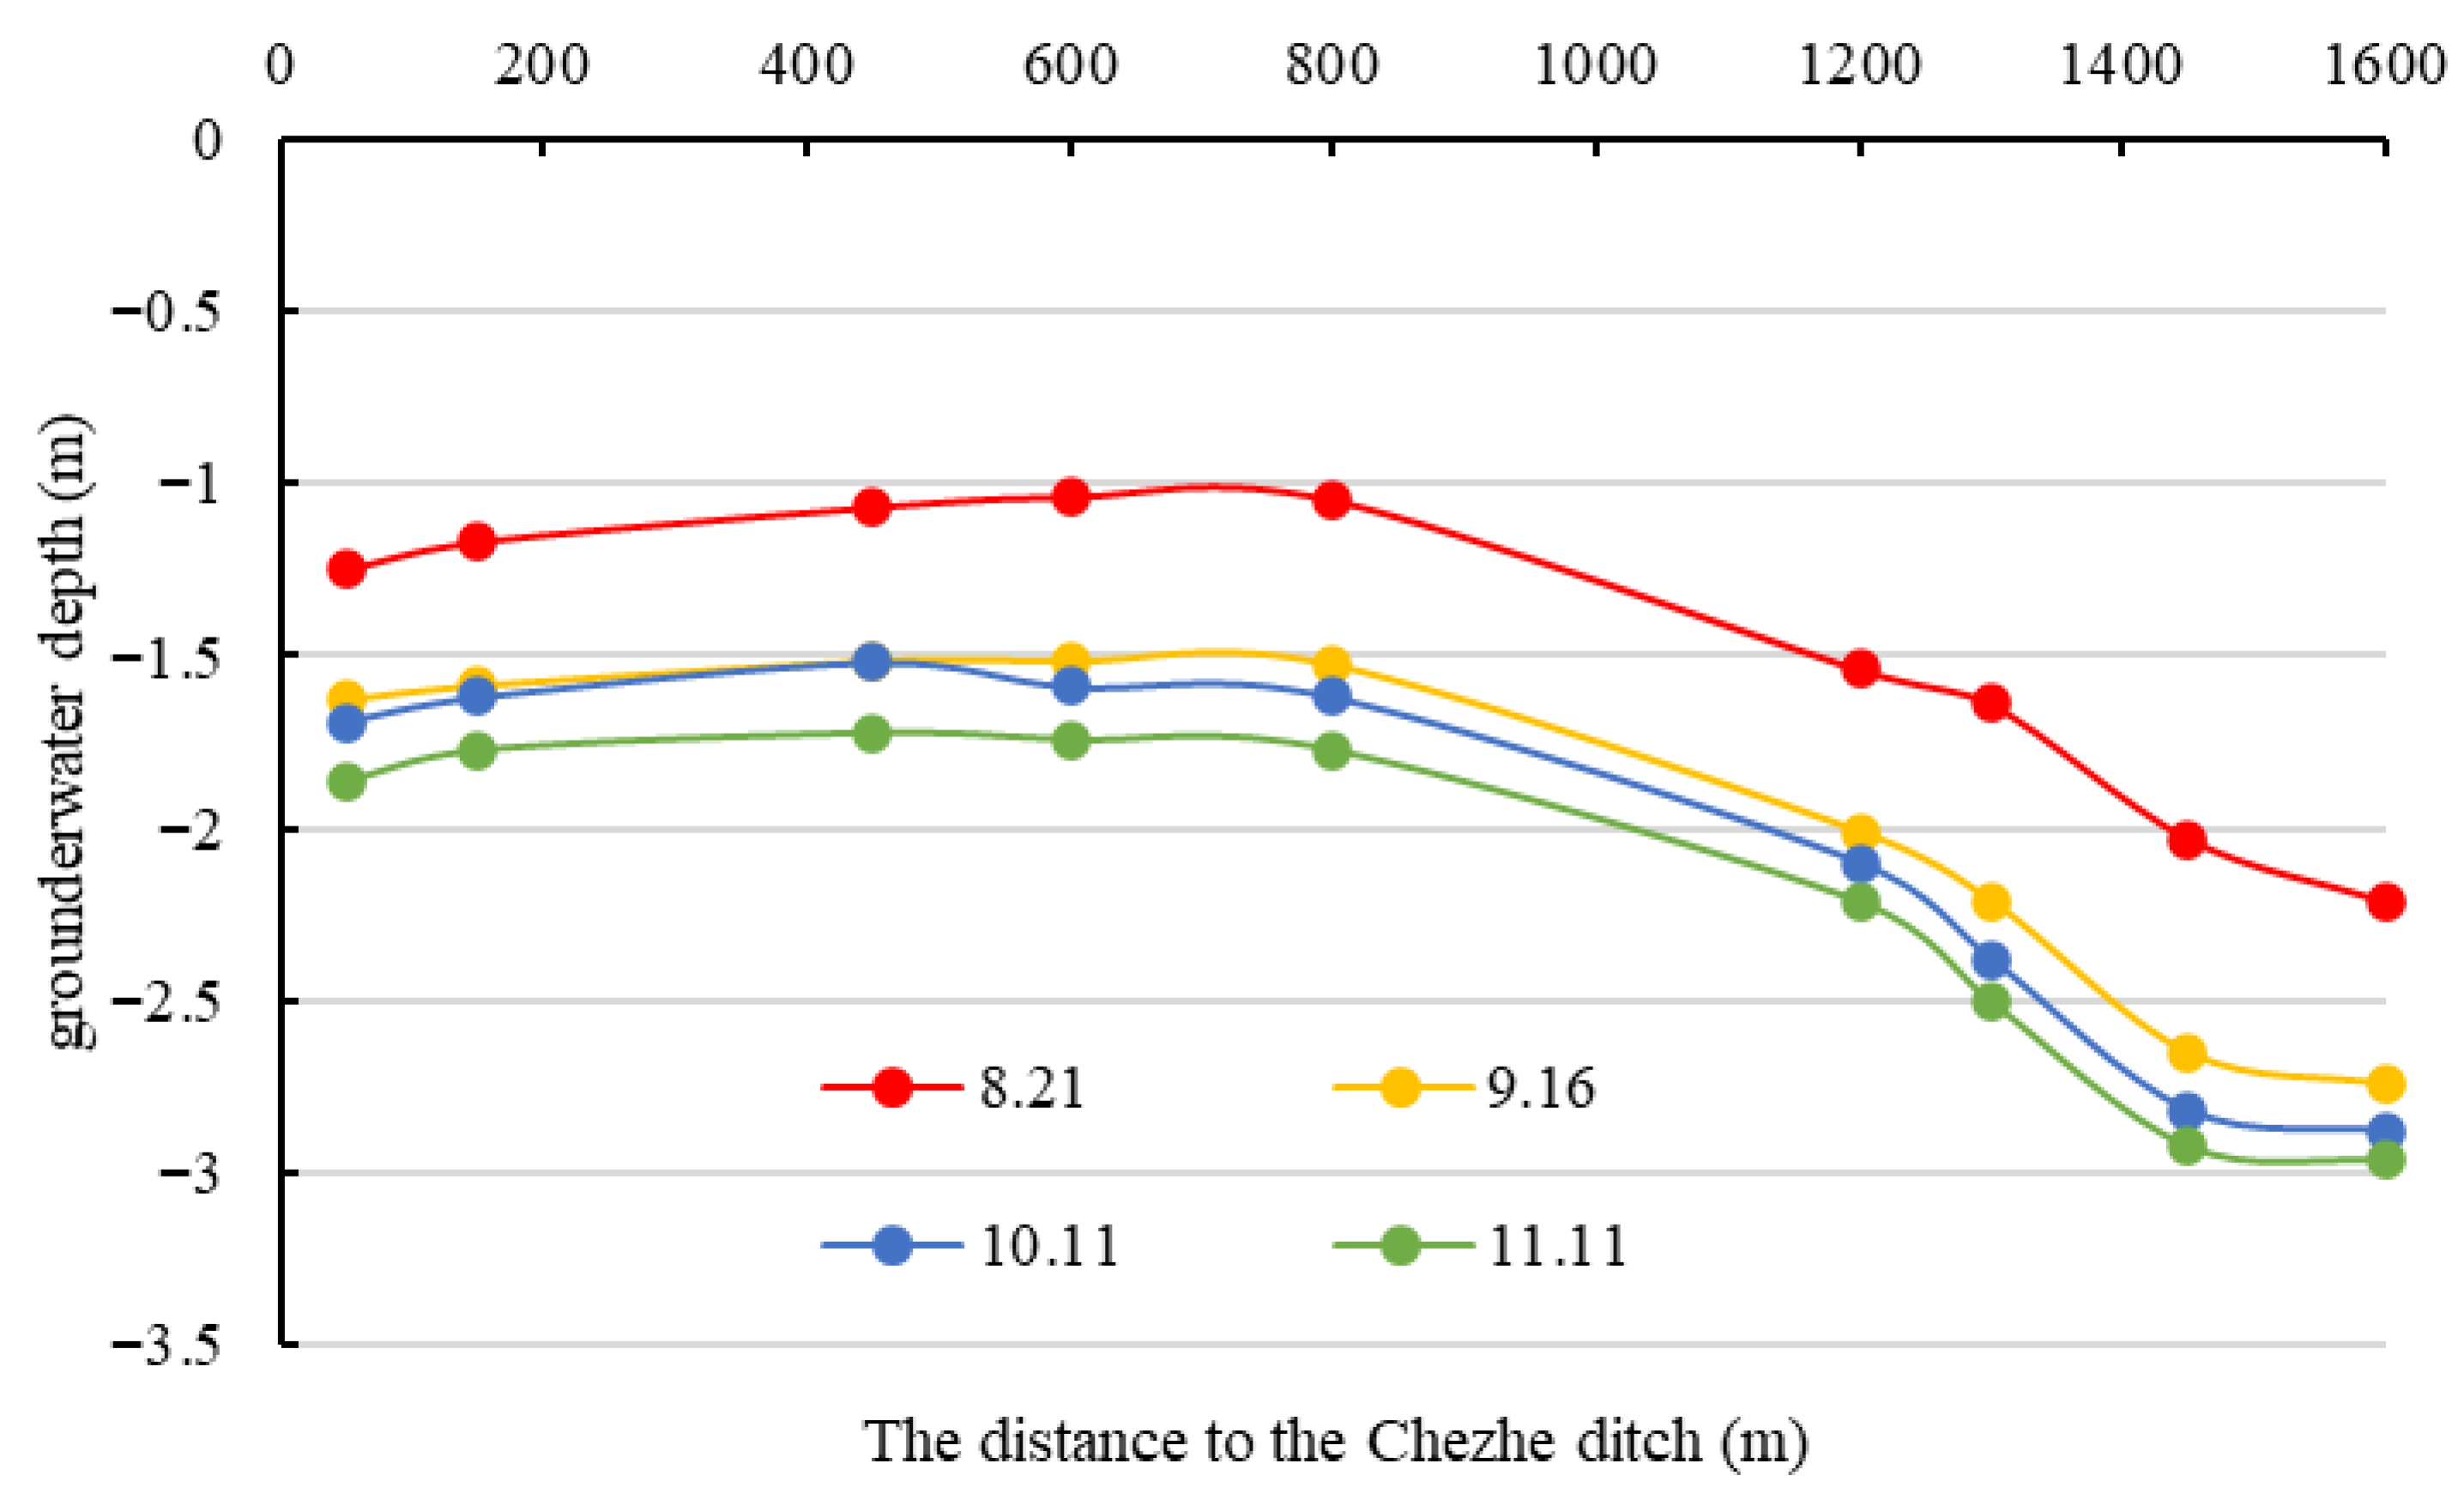
Groundwater fluctuations during different periods at section M of Chezhe ditch are illustrated in
Figure 8. At distances greater than 800 m from Chezhe ditch, the groundwater level contours during various periods are approximately parallel, suggesting that the groundwater level in this zone is negligibly influenced by water storage in the main ditches. Nevertheless, groundwater level variations within 1000 m do not show a consistent amplitude pattern. According to the analysis over different observation periods, the influence radius of the main control projects on groundwater is approximately 800 m.
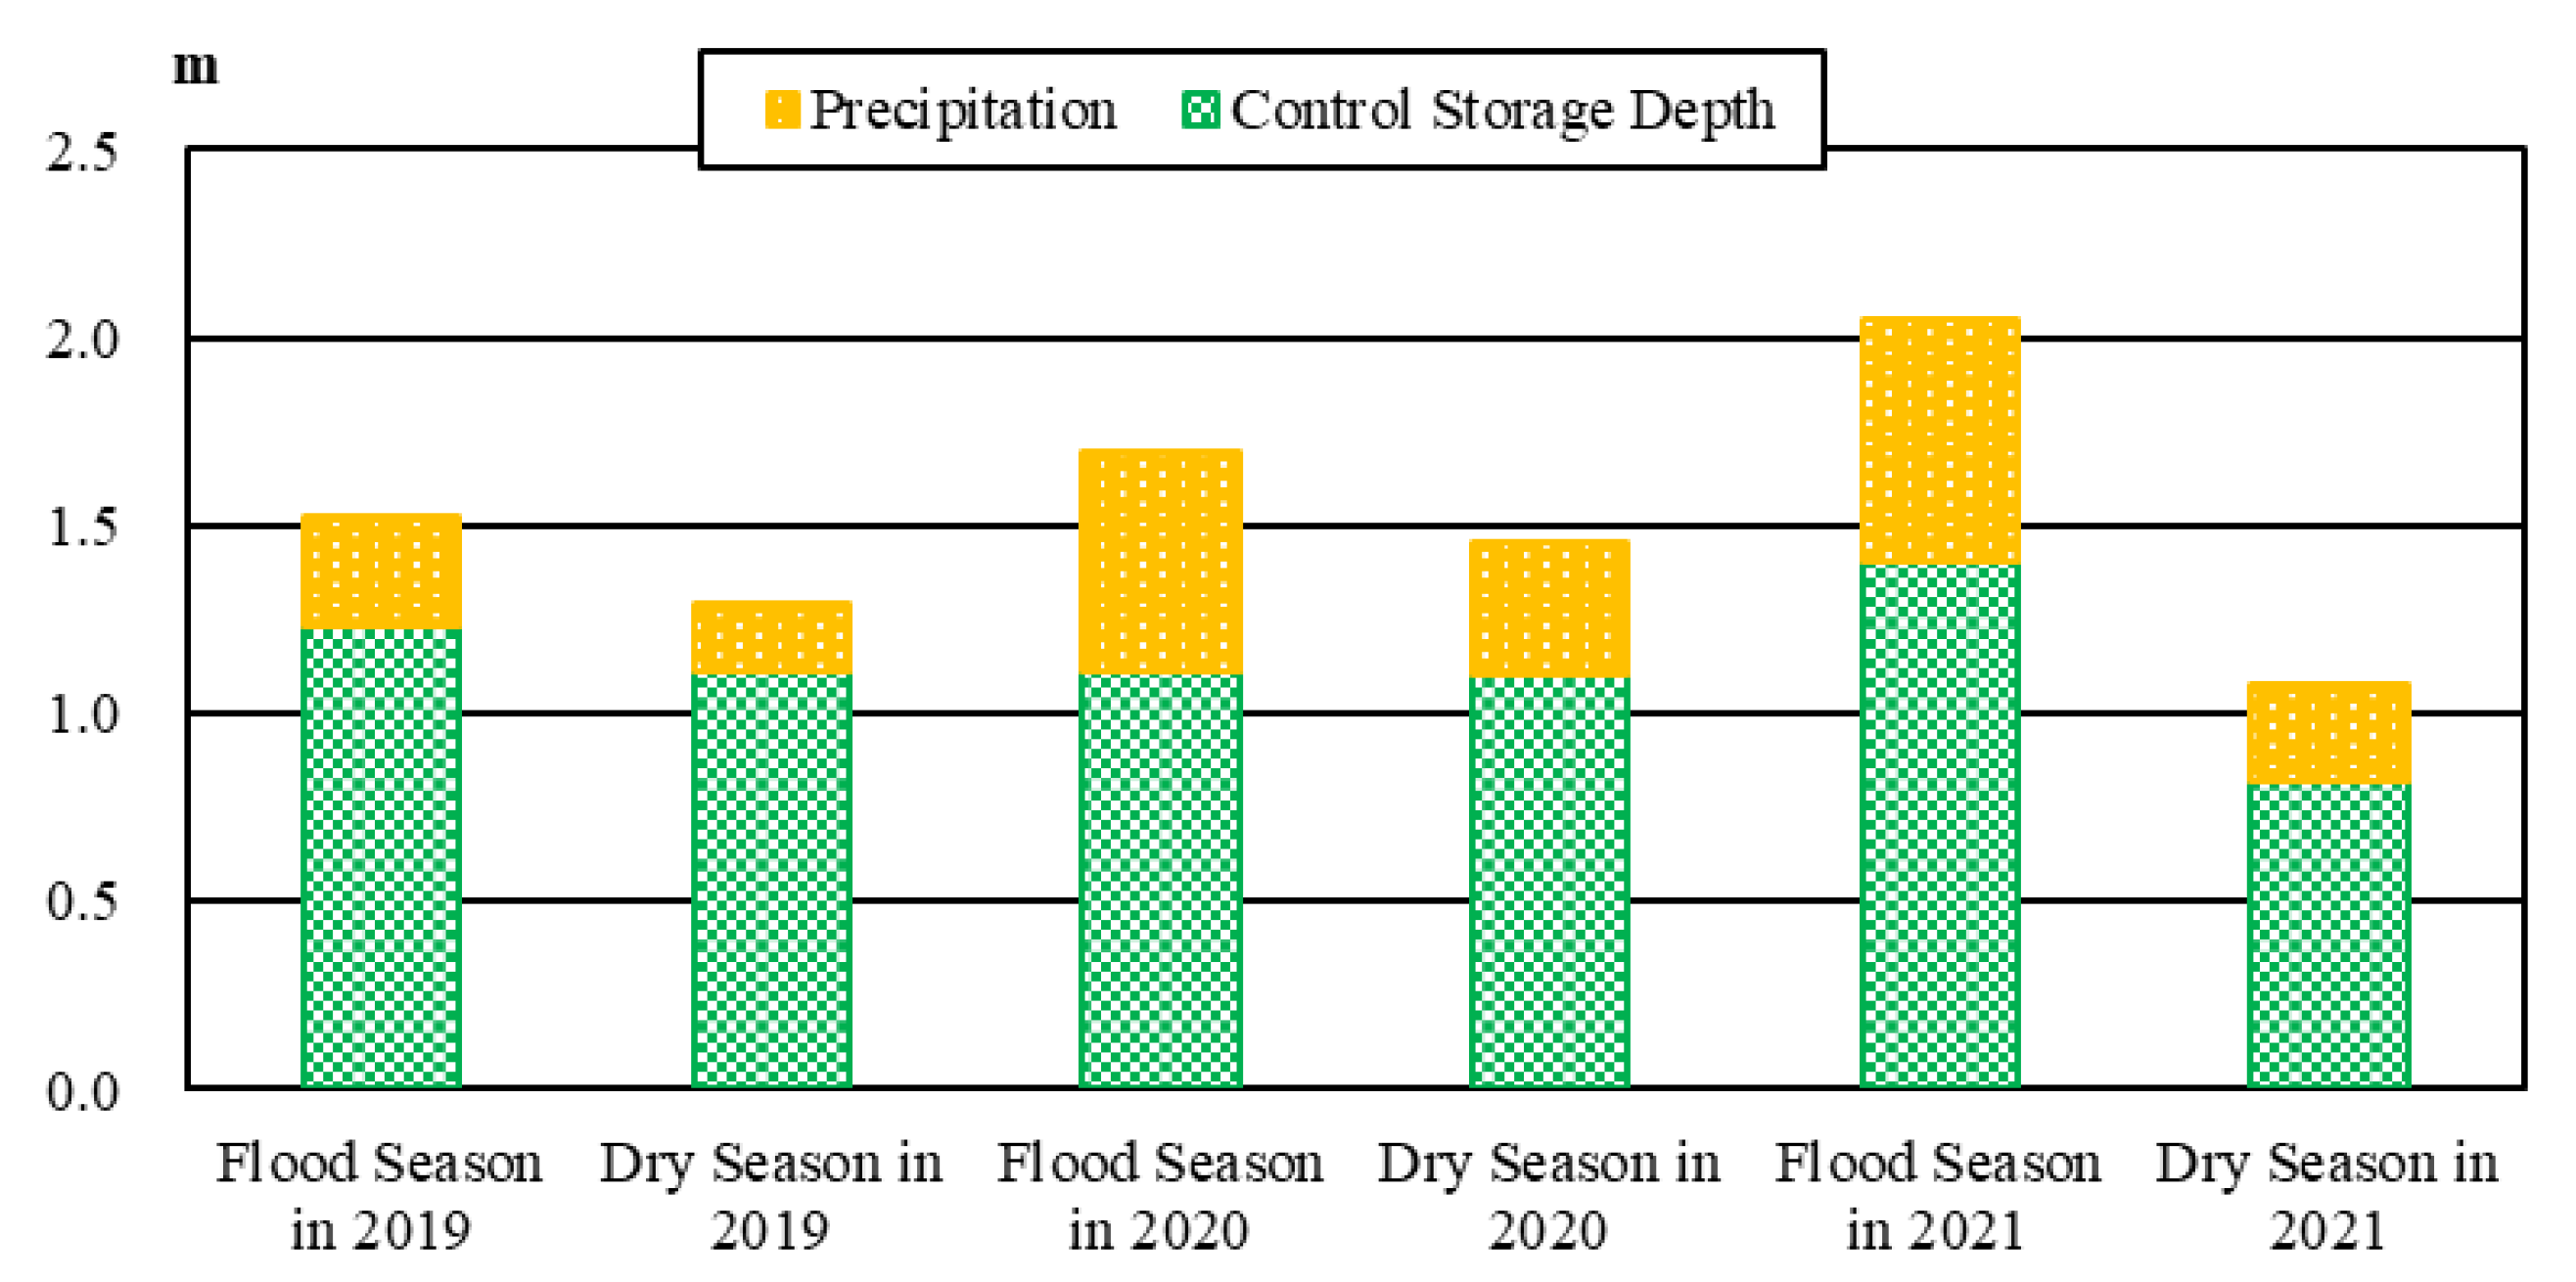
The groundwater regulation capacity of the Chundian Sluice on Chezhe Ditch during 2019–2021 is illustrated in
Figure 9. Based on field-measured data, the regulated groundwater volumes were calculated as 8.69 × 10
5 m
3 in 2019, 12.57 × 10
5 m
3 in 2020, and 13.38 × 10
5 m
3 in 2021. The average annual regulated groundwater volume at the Chundian Sluice over these three years was 11.54 × 10
5 m
3.
3.4.3. Control of Total Water Resources for Engineering Regulation and Storage
The total volume of regulated water resources, comprising both groundwater and surface water, achieved through the comprehensive control project is summarized in
Table 4. In 2019, 2020, and 2021, the regulated water volumes were 1.210 million m
3, 2.000 million m
3, and 2.124 million m
3, corresponding to water depths of 58.2 mm, 96.1 mm, and 102.1 mm, respectively. Based on these values, the ratios of regulated water volume to annual precipitation were calculated as 12.1% in 2019, 9.4% in 2020, and 10.8% in 2021.
The regulatory effect of the control project on water resources was assessed by considering both the direct retention of rainfall runoff in the main ditch and the increase in groundwater resources resulting from elevated water tables. The multi-year average total regulated volume of surface water and groundwater achieved through storage and drainage management was 86 mm, representing 10.5% of the multi-year average precipitation.
4. Conclusions
This study systematically investigated the regulatory effects of controlled drainage (CD) projects on farmland water resources in the Huaibei Plain, Anhui Province, China—an area characterized by severe water scarcity, frequent floods and droughts and a fragile agricultural ecological environment. By conducting long-term field observations, data monitoring, and statistical analysis of the CD structures installed in the main drainage ditches (with Chezhe Ditch and Chundian Sluice selected as typical cases) from 2019 to 2021, this study clarified the impacts of CD on main ditch water levels, groundwater depth, drainage efficiency, and total water resource regulation capacity. The key findings and comprehensive conclusions are summarized as follows:
Controlled drainage structures effectively regulate water levels in main drainage ditches and enhance rainwater retention capacity. The multi-year average water level difference between the upstream and downstream of the control sluice in the main ditch reaches 1.14 m, with an average annual storage volume of 30 mm, accounting for 3.7% of the total annual precipitation. Dynamic monitoring results indicate that water level fluctuations in the main ditch are closely correlated with rainfall: higher rainfall induces a significant rise in ditch water levels, while lower rainfall results in a gradual decline. Under the combined effects of precipitation, evaporation, and agricultural water consumption, the storage water level in the ditch undergoes multiple filling–draining cycles within a single year. Notably, water levels during the flood season are generally higher than those in the non-flood season, whereas the water level difference between the upstream and downstream of the sluice is greater in the non-flood season—this pattern fully reflects the temporal redistribution function of CD structures on rainfall runoff. During the flood season, the structures can effectively retain surface runoff generated by heavy rainfall, thereby reducing the risk of waterlogging; during the non-flood season, they restrict the excessive discharge of surface water, ensuring that stored water can serve as a supplementary irrigation source for crops and thus alleviating seasonal water shortages in the Huaibei Plain.
Controlled drainage significantly elevates groundwater levels and optimizes soil moisture conditions for crop growth. The multi-year average groundwater level rise in the controlled area is 0.64 m, corresponding to an additional groundwater storage of 56 mm, which accounts for 6.8% of the annual precipitation. Comparative analysis of groundwater monitoring data from sites inside and outside the controlled area (e.g., M4 and M16) reveals that groundwater levels in the controlled area are consistently 0.37–0.89 m shallower than those in the uncontrolled area. During the critical water requirement periods of winter wheat, summer corn, and soybeans—the main crops in the study area—the groundwater depth in the controlled area (1.24–1.90 m) falls within the range of crop root depths (1.5–3.0 m for winter wheat, 1.5–2.0 m for summer corn, and up to 1.5 m for soybeans), enabling direct groundwater supply to meet crop soil moisture demands. Additionally, the influence of CD structures on groundwater extends approximately 800 m on both sides of the main ditch, with a significant difference in groundwater depth (approximately 0.5 m) between farmland with and without control structures. This not only inhibits the excessive discharge of shallow groundwater but also supplements groundwater recharge, improving the stability of regional groundwater systems and mitigating the long-term decline in groundwater levels caused by traditional free-drainage systems.
Controlled drainage ensures drainage efficiency while achieving comprehensive regulation of surface water and groundwater resources. This study confirms that the CD project fully meets the farmland drainage and waterlogging control standards of the Huaibei Plain: after heavy rainfall events, surface stagnant water in the controlled area can be completely drained within one day, and groundwater levels can recede to 0.5 m below the surface within three days, avoiding adverse impacts of waterlogging on crop growth. In terms of total water resource regulation, the multi-year average total regulated volume of surface water and groundwater through storage and drainage management is 86 mm, accounting for 10.5% of the multi-year average precipitation. Specifically, the average annual regulated surface water volume is 6.23 × 10⁵ m3, and the average annual regulated groundwater volume is 11.54 × 10⁵ m3—this comprehensive regulation capacity effectively optimizes the spatiotemporal distribution of water resources in the study area, improves water use efficiency, and alleviates the contradiction between water supply and demand caused by uneven rainfall distribution and intensive agricultural water use.
For the control structures built on drainage canals in the Huaibei Plain, the CD structures investigated in this study (e.g., Chundian Sluice) are typical representatives. These structures mainly adopt open-type combined sluice-weir systems, equipped with manual-electric screw hoists to adjust gate openings, thereby regulating the outflow of the main ditch and maintaining the target water level. During flood seasons, gates are fully opened to speed up drainage and reduce waterlogging; in non-flood seasons, gates are partially closed to store water, raise groundwater levels, and supply supplementary irrigation. This flexible regulation matches the seasonal flood-drought characteristics of the Huaibei Plain and achieves the dual purposes of flood control and water conservation.
In summary, installing control structures on main drainage ditches and implementing scientific CD management is a feasible and effective measure to address water resource shortages and ecological environment deterioration in the Huaibei Plain. This approach integrates the functions of irrigation, drainage, and groundwater recharge, which not only ensures the effective drainage of excess water during flood and waterlogging events but also prevents excessive drainage that leads to groundwater decline and ecological degradation. Meanwhile, it raises groundwater levels to meet crop water needs and utilizes stored water in drainage ditches as an additional irrigation source, thereby improving agricultural water use efficiency and promoting the sustainable development of agricultural production in water-scarce plain areas.