Article

Source-Dependent Bioaccessibility of Potentially Toxic Elements in Multi-Size Urban Road Dust: Health Risks and Carbon Emission Reduction Implications


1
College of Geography and Environment, Shandong Normal University, Jinan 250358, China
2
Shandong Provincial Geo-mineral Engineering Exploration Institute, Shandong Provincial Bureau of Geology & Mineral Resources, Jinan 250014, China
*
Authors to whom correspondence should be addressed.
Sustainability 2026, 18(5), 2255; https://doi.org/10.3390/su18052255
Submission received: 3 February 2026 / Revised: 14 February 2026 / Accepted: 24 February 2026 / Published: 26 February 2026

Abstract

Urban road dust is an important way for people to contact potentially toxic elements (PTEs). However, the correlation between the bioaccessibility of PTEs in road dust and the contribution rate of pollution sources has not yet reached a consensus. Road dust was divided into three particle sizes (<63, 63–125, and 125–250 μm). Then, the Mantel test was used to analyze the correlation between the contributions of the four pollution sources (composite sources, traffic sources, industrial sources, and fuel combustion) and the bioaccessibility of PTEs. Finally, by incorporating bioaccessibility into the health risk assessment system, Ni was identified as the priority lifetime carcinogenic risk element and fossil fuel combustion as the priority pollution source. The remediation target obtained by the probabilistic risk assessment of bioaccessibility guidance is 3.91 times the target value based on the total content and reduces carbon emissions by 22.6%. Overall, this study not only enhances the precision of identifying pollution sources and pollutants in complex urban environments by integrating PMF with the bioaccessibility of PTEs but also highlights the potential value of bioaccessibility in urban environmental management for carbon emission reduction. This facilitates the implementation of precise risk assessments and low-carbon sustainable development.

1. Introduction

With the rapid development of the industry, fossil fuels are consumed in various human production activities, and a large amount of CO2 and potentially toxic elements (PTEs)-containing dust are discharged into the atmospheric environment, resulting in a series of health problems, such as climate change and human health [1,2]. Urban air pollution is a serious issue, especially with the number of people living in cities exceeding 50% of the worldwide population [3,4]. Road dust is a key cause of urban air pollution because it can accumulate various environmental pollutants that are harmful to humans, with PTEs receiving significant attention due to their toxicity and bioaccumulation [5,6]. Accidental ingestion serves as a critical pathway of population exposure to PTEs in road dust for urban populations, especially children with frequent hand-to-mouth contact [7,8]. For children with elevated blood lead levels, a strong correlation has been found with Pb in road dust content [9]. This is due to children experiencing 3 to 15 hand-to-mouth contacts per hour during daily outdoor play, resulting in a daily dust intake of approximately 200 mg [10,11]. Therefore, accurate assessment and efficient control of PTEs’ health risks in road dust is essential for urban public health.
The complexity of PTE sources in urban road dust is a major challenge for its management. A report summarized that Zn (250 mg kg−1), Cu (100 mg kg−1), and Cd (0.3 mg kg−1) in road dust in many urban areas of China exceeded the “maximum permissible concentrations of potentially toxic elements” [12]. In addition, previous reports showed industrial activities to be the main pollution source of PTEs in road dust of Nanjing, China [3]. In Katowice, coal combustion and industrial activities dominate PTE sources, and As in road dust poses health risks to children [13]. In Beijing, As, Cr, and Ni in road dust present cancer risks to children, with vehicle exhaust being the largest contributor [14]. In Datong, despite the high contribution of traffic sources to PTEs in road dust, the chromium and smelting industry emissions are the main factors causing cancer risks to children [15]. Although these cities have varying industrial histories, the sources causing health risks to the public differ significantly.
Reliable and advanced risk assessment indicators not only accurately control priority pollutants in the process of urban governance but also reduce carbon emissions [16]. Traditional pollution and health risk assessments are mostly based on total content. Integrating bioaccessibility into the probabilistic framework plays an important role in reducing overestimation [17]. As reported by a previous study [18], As was found to be the main non-carcinogenic risk contributor based on total PTE concentrations in Jinan, while V became the largest non-carcinogenic risk contributor when assessed via bioaccessibility. The bioaccessibility of PTEs in road dust could be influenced by various factors. Research indicates that particle size is a key determinant of health risks, with particulate matter smaller than 50 μm serving as a reliable indicator for health assessments [9]. This is because fine particles contain higher levels of organic matter compared to coarse particles, significantly enhancing the bioavailability of PTEs [19]. However, another research reported that Cu, Zn, and Cd bioaccessibility in coarse particles in road dust was higher than that of fine particles [20]. In brief, particle size impacts PTE bioaccessibility in road dust, but it is not the root cause. For instance, in traffic-sourced dust, extractable iron and manganese correlate with anthropogenic origins, whereas non-extractable iron and manganese are soil-associated [21]. Compared to natural sources, Pb in road dust under anthropogenic conditions was inferred to achieve higher bioavailability [20]. Therefore, sources play a major role in influencing PTE bioaccessibility in road dust. Previous studies quantified the correlation between Pb bioaccessibility and Pb isotope composition and sources [22,23]. In general, PTEs in urban road dust are significantly affected by pollution sources. However, the specific methods for efficiently analyzing the bioaccessibility and pollution sources of multiple PTEs in urban road dust remain unclear.
The potential applications of bioaccessibility in urban management extend far beyond this. Traditional content-based risk assessment usually leads to an overestimation of health risks, which also increases the cost and carbon emissions in the governance process [16,18]. Recently, a study employed bioaccessibility to assess health risks at As-contaminated sites, with carbon emissions during remediation projected to decrease by 155,414 t CO2e compared to traditional assessment methods [17]. In urban environmental management, every aspect of road dust control is accompanied by carbon emissions. For example, some of the dust from industrial activities is accompanied by fossil fuel combustion and equipment operation. These dusts are discharged into the atmospheric environment after being treated by dust removal facilities. Most of the previous studies focused on the optimization of industrial production technology [24,25]. Therefore, the incorporation of bioaccessibility into the risk assessment system not only avoids the overestimation of health risks but also achieves scientific inference of governance endpoints through accurate assessments to achieve the purpose of carbon emission reduction. Till now, few studies have focused on carbon emissions from industrial waste gas treatment.
This study was conducted due to the current lack of effective methods for analyzing the bioaccessibility of PTEs in road dust and their correlation with pollution sources after incorporating bioaccessibility into the urban road dust health risk, and the lack of awareness of the potential application of bioaccessibility in carbon emission reduction in the process of urban management. To enhance result reliability, road dust from Jinan City was collected, sieved into three particle sizes, and used to investigate the relationship between PTE bioaccessibility and sources across different particle sizes. The specific objectives of this study were to (1) analyze the characteristics and sources of PTEs in road dust of different particle sizes, (2) explore the correlation between contributions of pollution sources and bioaccessibility of PTEs in road dust of different particle sizes, (3) prioritize recommendations for pollution source management based on the bioassessible-based health risk assessment of PTEs in road dust, and (4) derive a remediation target via bioaccessibility and evaluate the corresponding carbon emission reduction.

2. Materials and Methods

2.1. Sample Collection, Preparation, and Analysis

Jinan (36.67° N, 117° E) is the capital of Shandong Province, China, and a typical industrial city with a large population and a prominent historical pollution problem. By late 2019, the number of private vehicles in Jinan reached about 2.6 million [26]. A large number of industrial parks are distributed in the western part of the city, including machinery, boilers, electroplating plants, steel, and electrical manufacturing industries. The city center includes residential, educational, and commercial areas, with a complex road network and high traffic flow. Previous studies have shown that PTEs in road dust from Jinan have a complex source profile [18,26], which aligns with the requirements of this study. Therefore, road dust from Jinan was selected as the research subject. Sampling point figures are shown in Figure S1 in the Supplementary Materials. In this study, a total of 100 road dust samples were collected. Individual dust samples were sampled using polyethylene brushes and trays, sealed in polyethylene bags, numbered, and taken back to the laboratory. Considering the influence of the basic lithology of the soil in the sampling area on the content of road dust PTEs, soil samples (>20 cm depth) were collected using a soil corer. All operations were carried out in accordance with the GB/T36197-2018 standard issued by the Standardization Administration of China [27], where the distance between each two neighboring samples was >200 m.
In the lab, all dust samples were naturally air-dried at room temperature and then homogenized. The dust particle size was determined by the Breuning-Madsen and Awadzi (2005) method with modification [28]. For further analysis, samples were separated into three sizes by sieving through a nylon sieve, including total size (<250 μm), size 1 (<63 μm), size 2 (63–125 μm), and size 3 (125–250 μm). The total As, Cd, Cr, Ni, Pb, Cu, Ti, V, and Zn contents in the different-sized road dust samples were determined via inductively coupled plasma mass spectrometry (ICP–MS, iCAP RQ, Thermo Scientific, Madison, WI, USA) following digestion using the US EPA 3050B method. Details regarding the determination of particle size distribution, digestion, and all quality control and quality assurance can be found in Texts S1 and S2. The technology roadmap is provided in Figure S2.

2.2. Source Analysis

2.2.1. Enrichment Factor

The enrichment factor (EF) was used to assess the level of a single PTE pollution. The formula is as follows:
EF = (Cn × Bref)/(Cref × Bn)
where Cn and Bn are the measured contents of elements (mg kg−1) in the sample and background, respectively. Cref and Bref are the contents of reference elements in the sample and background. In this study, the background values in soil were obtained from the collected deep soil (Table S1). Ti was selected as the reference element in this study, with the assumption that Ti is derived exclusively from crustal material [29]. The classification criteria of EF are provided in Table S2.

2.2.2. PMF Modeling

In this study, the U.S. Environmental Protection Agency (EPA) PMF 5.0 model was used to analyze the sources of PTEs in road dust of different particle sizes [30]. Two data packages, including the sample PTE content and sample PTE uncertainty information, were prepared. The uncertainty (Unc) was obtained by calculating the specified method detection limit (MDL). Details regarding the MDL determination method are provided in the Supplementary Material. When the content was not greater than the MDL:
Unc = MDL × 5/6.
If the content was greater than the MDL, Unc was calculated based on the content fraction and the MDL:
Unc = ((Error fraction × concentration)2 + (0.5 × MDL)2)1/2
The PTE content and uncertainty information files were imported into the model, and the signal-to-noise ratio (S/N) < 2 was defined as weak [31]. Different numbers of factors were then tested for iterative PMF runs to ensure that the best-fit parameter Q was obtained. The stability detection method of the dataset and output results is provided in Text S5.

2.3. Health Risk Assessment Based on Oral Bioaccessibility Using the In Vitro Method

2.3.1. Bioaccessibility of PTEs via SBRC In Vitro Method

The gastric phase of the solubility bioaccessibility research consortium (SBRC) method was applied in this study due to its superior predictive strength of the relative bioavailability of PTEs in road dust [22]. Details are provided in Supplementary Material. All samples were then diluted with 0.1 mol L−1 HNO3, and the contents of carcinogenic elements (As, Cd, Cr, Ni, and Pb) were determined via ICP-MS. The formula for calculating bioaccessibility is as follows:
Bioaccessibility (%) = (Cbioaccessible × 100)/Ctotal,
where Cbioaccessible is the bioaccessible content of PTEs in the road dust sample, and Ctotal denotes the total content.

2.3.2. Health Risk Assessment

Following the recommendations of the USEPA [32] and USEPA [33], the health risk assessment (HRA) method categorizes the potential health risk of PTEs into non-carcinogenic risk (NCR) and lifetime carcinogenic risk (LCR). Non-carcinogenic risk can be summarized by the hazard index (HI), with total lifetime carcinogenic risk (TLCR) integrating individual risks from the carcinogenic PTEs. To obtain a more accurate potential health risk from PTEs (As, Cd, Cr, Ni, and Pb) exposure through hand-to-mouth behavior, the bioaccessibility of PTEs was incorporated into the traditional HRA method. The simulated population was categorized into children and adults according to physiological variations for non-carcinogenic risk. The average daily dose (ADDingest, mg kg−1 day−1) was subsequently used to predict exposure via the ingestion pathway. HI was calculated by the quotient of ADDingest and the reference dose (RfD) of different PTEs. Lifetime average daily doses (LADDs) were used to evaluate the cancer risk of five carcinogenic PTEs, with LCR calculated by the product of LADDingest and the slope factor (SFi) of different PTEs to estimate an individual exposure to carcinogenic risk during a lifetime. The calculation formulas are as follows:
ADDingest = (Ci × Ringest × EF × ED × 10−6)/(BW × AT),
HI = ∑HQ = ∑ADDi/RfDi,
LADDingest = Ci × EF × (Ringest× EDChild/BWChild + Ringest× EDAdult/BWAdult) × 10−6/AT,
TLCR = ∑LCR = ∑LADDi/SFi,
where Ci represents the bioaccessible content of PTEs (mg kg−1), Ringest represents the ingestion rate (kg d−1), EF is the exposure frequency (d year−1), ED represents the exposure duration (year), BW denotes human body weight (kg), and AT represents the period over which the dose was averaged (d). The potential non-carcinogenic effect could occur when HI > 1, while if TLCR > 10−4, it indicated a significant lifetime carcinogenic risk. The acceptable level of carcinogenic risk was when TLCR < 10−6. The exposure parameters for the Chinese population were the same as in a previous study (Tables S5 and S6) [18].
In addition, the Monte Carlo simulation method was employed for health risk assessment to avoid overestimating or underestimating risks due to the use of deterministic parameters [26,34]. In Crystal Ball 11.1.2.4, 10,000 Monte Carlo simulations of the frequency and cumulative probability of health risks for the population exposed to PTEs were performed [15].

2.4. Statistical Analysis

The results were statistically analyzed via SPSS software (version 26.0, Chicago, IL, USA). Analysis of variance (ANOVA) with a Tukey post hoc was used to compare PTE content and bioaccessibility in different particle sizes. Mean differences were considered statistically significant when p < 0.05. Pearson analysis was used to determine the correlation between the biological accessibility of different PTEs. The Mantel test was used to determine the correlation between pollution factors and the PTE content or bioaccessibility. Pearson’s r coefficient at p < 0.05, p < 0.01, and p < 0.001 indicates a significant correlation.

3. Results and Discussion

3.1. Road Dust Characteristics

Road dust in Jinan was dominated by size 1 (83.3 ± 5.26%), which was significantly higher than size 2 (10.3 ± 3.98%) and size 3 (5.42 ± 2.42%) (Table S6 and Figure S4). This is consistent with many cities [10,20,35].
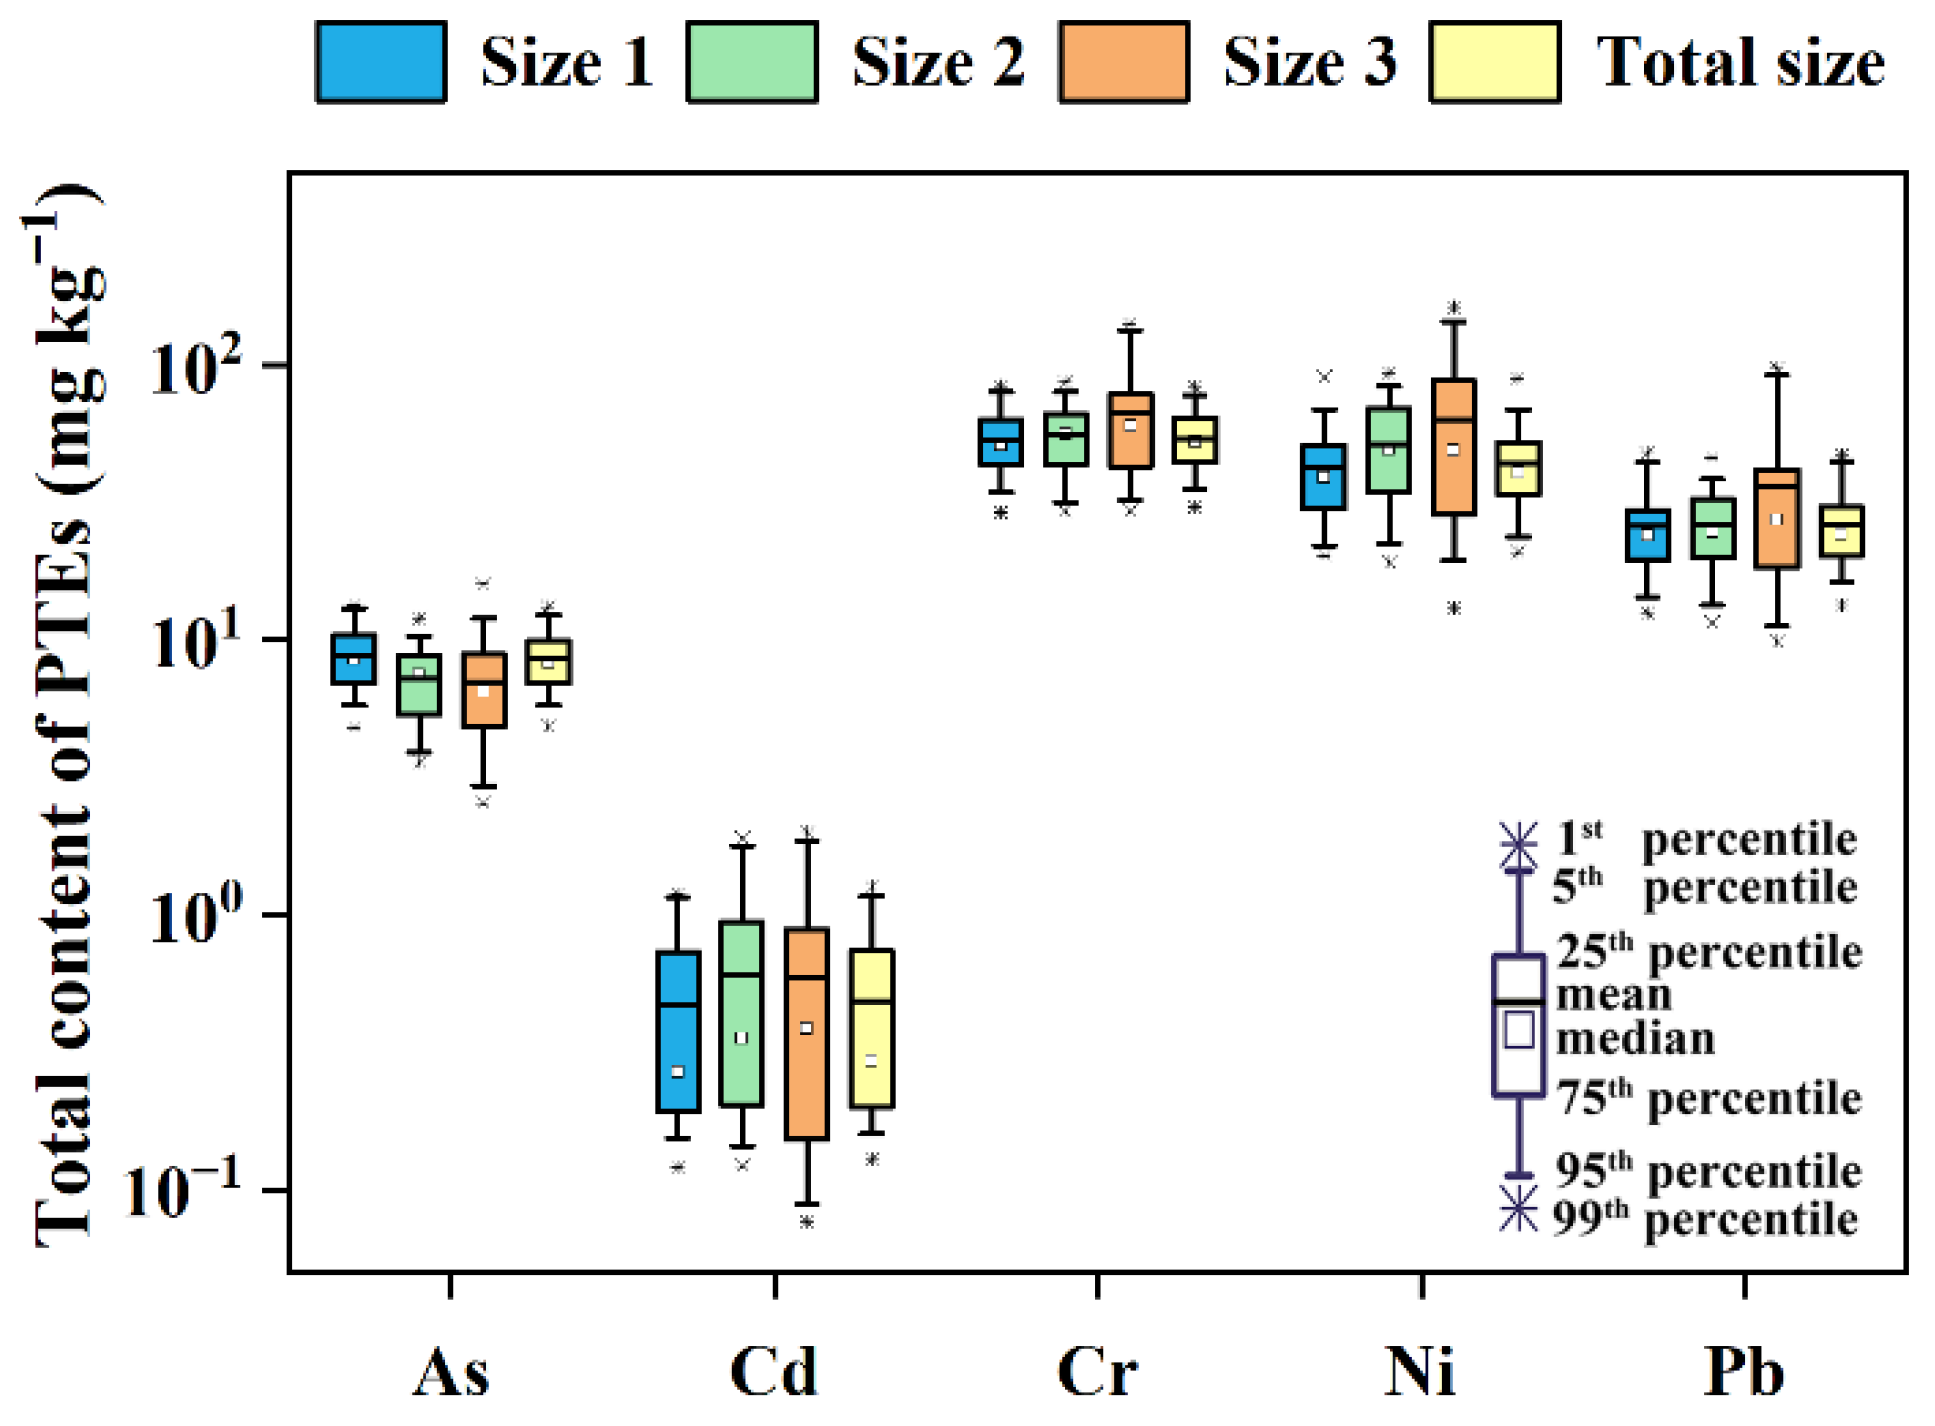
The contents of five carcinogenic PTEs in road dust of three particle sizes and total size were compared (Table S7 and Figure 1). The contents of PTEs followed the order of Cr > Ni > Pb > As > Cd. The results are similar to those of other industrial cities in China [36,37]. Although the contents of PTEs in size 1 can predict the total PTE contents in road dust at a ratio of 0.56–1.12, PTEs in size 2 and 3 road dust also deserve attention due to the potential for urban industrial structure adjustment. Previous reports suggest that fine-grained particles usually have higher PTEs [10,20,38]. In this study, dust in size 3 showed the highest contents of Cr (66.9 ± 30.4 mg kg−1), Ni (63.7 ± 42.9 mg kg−1), and Pb (36.2 ± 24.8 mg kg−1), while Cd (0.60 ± 0.54 mg kg−1) was most concentrated in size 2 (p < 0.05). In contrast to earlier research, which focused on dust collected near emission sources, this study examined urban road dust that was influenced by a variety of potential pollution sources (such as high vehicular traffic, building construction, demolition activities, and industrial activities). The levels of PTEs in road dust can be affected by different contributions of these sources [39]. The evidence is that the coefficient of variation for Cd, Ni, and Pb showed high variations (CV > 30%), especially Cd (74.9–93.2%), indicating that the content distribution of sampling points is uneven due to differences in anthropogenic emissions.

3.2. PTE Sources Identify

To investigate the source apportionment of PTEs in road dust, Pearson correlation analysis was conducted to identify correlations among PTEs. In addition, the PMF model was employed to quantify the potential sources of PTEs (Figure 2). The appropriate number of PMF model extraction factors is determined to be four by applying the minimum objective function Q of the residual matrix.
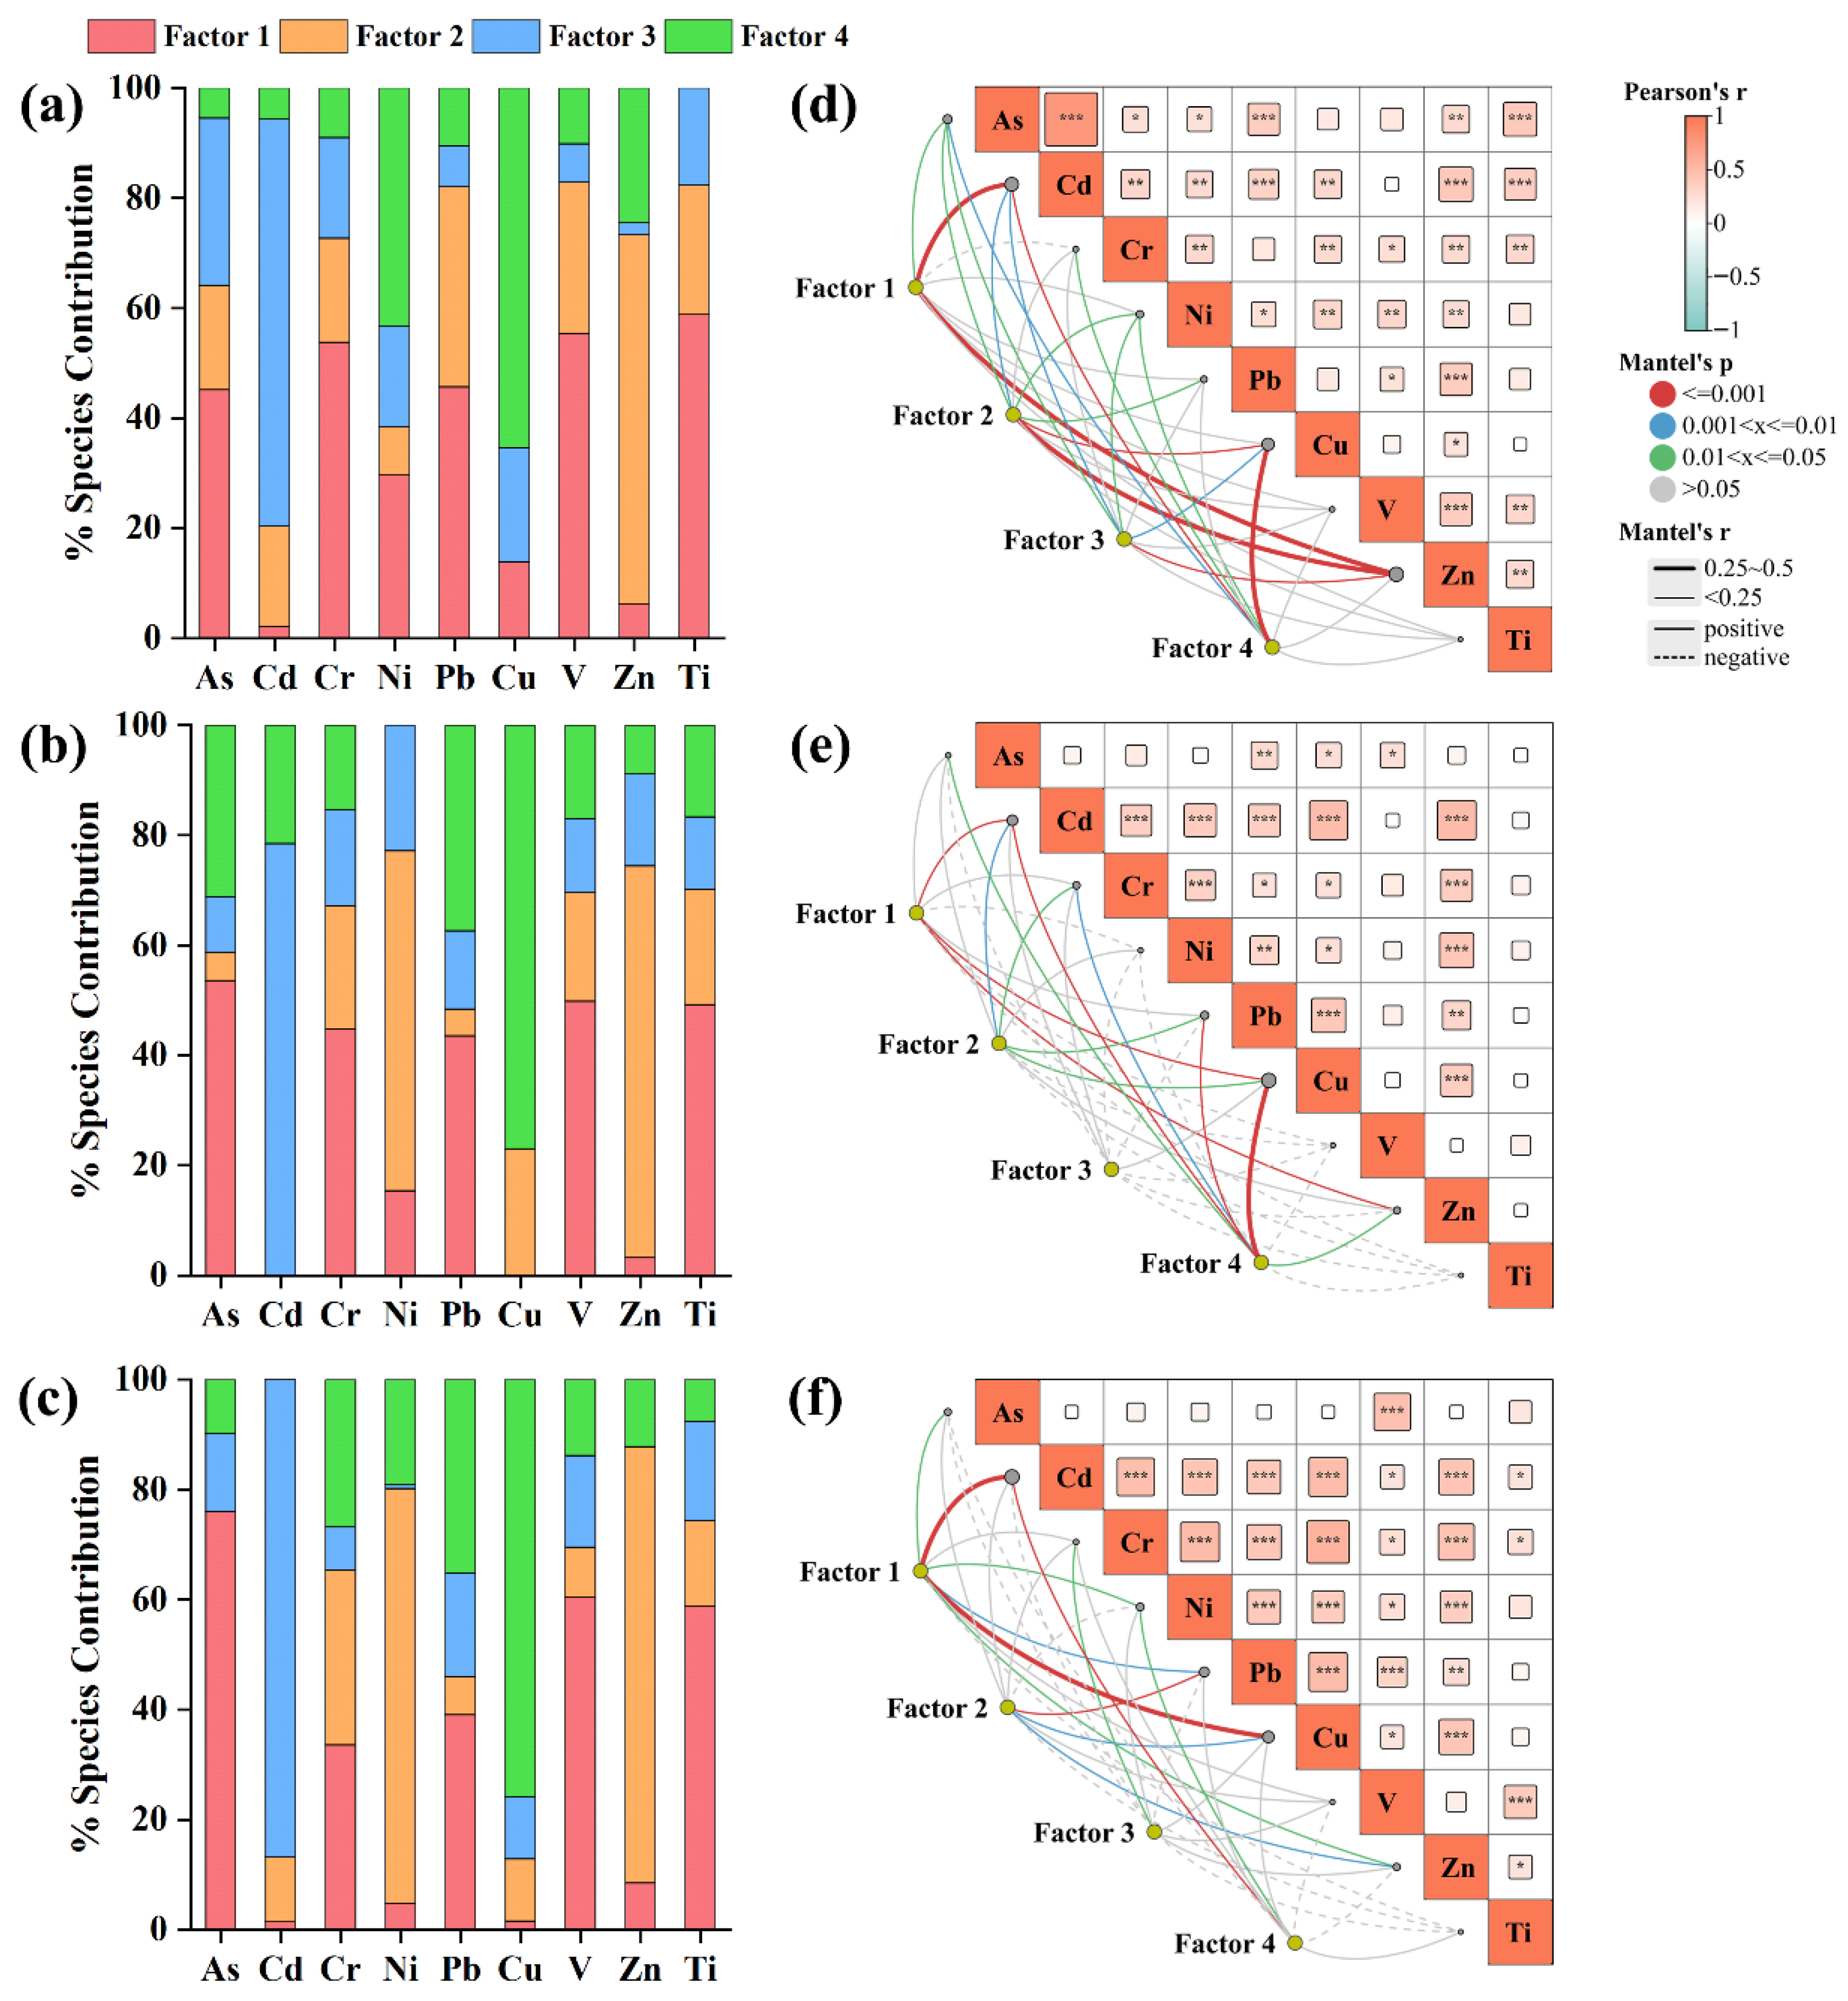
The common characteristic elements of factor 1 were As (45.2–76.1%), Cr (33.6–53.8%), Pb (39.1–45.1%), Ti (49.2–58.9%), and V (49.9–60.4%) in the three size fractions, which were found to be generally derived primarily from natural geological weathering processes [40]. Factor 1 exhibited the highest contribution rate of 28.8–34.6% (Figure S5). In this study, the average EFs of As (0.94–1.18), Cr (1.50–1.85), Pb (0.97–1.36), and V (0.98–1.02) for road dust were less than 2 (Table S7 and Figure S6), indicating that As, Cr, Pb, and V were mainly derived from natural sources. However, factor 1 was significantly related to Cd, Cu, and Zn in both sizes 2 and 3 dust (p < 0.05) (Figure 2d,e). These PTEs are generally considered to be closely linked to anthropogenic activities. Previous studies have identified a composite source in road dust, including natural, traffic, and combustion sources [41]. This is attributed to the resuspension of road dust and its subsequent deposition onto the surface layer of soils adjacent to roads, which increases the PTE content in the surface soil [9,21,26,34]. Therefore, factor 1 was identified as a composite source.
Factor 2, which accounted for 24.3–26.8% of the contribution rate, had a significant correlation with Cd, Cu, Pb, and Zn (p < 0.05). EF results showed that the pollution levels of Cd (5.93–8.25), Cu (2.04–4.31), and Zn (4.24–5.12) exceeded moderate pollution, indicating that they were from anthropogenic sources. Cd, Pb, and Cu were derived from the automotive parts wear and leaded gasoline, while Zn was mainly derived from tire wear [34,42]. Although the application of lead-containing gasoline has been restricted for a long time in China, there are still a lot of Pb elements in road dust [43,44]. These Pb are derived from previous traffic emission deposits and are still highly correlated with traffic sources. Therefore, factor 2 was presumed to be a traffic source.
Factor 3 showed a contribution rate of 19.4–21.8%. The characteristic elements of factor 3 are Cd (73.9–86.7%), Cr (7.80–18.2%), and Ni (0.67–22.8%). These PTEs are usually associated with a variety of industrial processes. The northern part of Jinan comprises highly industrialized areas, including steel mills, electroplating plants, and chemical plants. For example, the main industrial process of Jinan Yuxing Chemical Plant, located in the north of Jinan, is chromium salt manufacturing [26]. The battery dismantling activities of Shandong Higgs New Energy Company could produce cadmium and copper-containing particles [45]. These industrial activities become the important sources of PTEs in factor 3 [4,46]. Therefore, factor 3 was identified as an industrial source, which was basically consistent with the field survey.
Factor 4 was mainly loaded on Cu (0.05–43.3%), Ni (0.01–43.3%), and Pb (65.4–77.0%), with a contribution rate of 19.3–25.0%. Notably, the similar contribution rates of factor 3 and factor 4 in the three particle sizes indicate a potential correlation between these two factors. These elements were typically associated with fossil fuel combustion [47]. Meanwhile, there was a close relationship between the use of fossil fuels and industrial production. Therefore, factor 4 was associated with fossil fuel combustion. Fossil fuel combustion may be the primary anthropogenic source driving Ni pollution levels beyond moderate pollution. It is worth noting that studies have shown that particulate matter produced by different fossil fuel combustion has different adsorption capacity for PTEs [48], which may have an impact on the bioavailability of PTEs.
Notably, the contribution rate of composite sources decreases with increasing particle size, while that of traffic sources shows an upward trend (Figure S5). The fossil fuel combustion source has the highest contribution rate in size 2 of road dust. In contrast, the contribution rate of industrial sources remains stable across different particle sizes.

3.3. Effect of Source on the PTE Bioaccessibility

The bioaccessibility of five typical carcinogenic PTEs in road dust of different particle sizes was assessed using the SBRC method (Figure S7). The mean bioaccessibility of PTEs in the total size of road dust followed the order of Cd (66.1%)> Pb (51.0%) > As (25.9%) > Ni (11.3%) > Cr (9.21%), which was similar to the street dust in Nanjing (Hu et al., 2011) [36]. The bioaccessibility of As, Cr, Ni, and Pb increased with decreasing dust particle size. For example, As (26.2%), Cr (9.44%), Ni (11.6%), and Pb (52.5%) showed the highest bioaccessibility in size 1 dust, consistent with previous reports that fine particles have higher bioaccessibility of PTEs [19,20,38]. In contrast, Cd displayed an opposing size-dependent trend, and its bioaccessibility increased with the increase in dust particle size. Specifically, the highest bioaccessibility of Cd (78.1%) is observed in the size 3 fraction. In this study, the pollution sources and enrichment factors of PTEs indicated that Cd was more significantly affected by anthropogenic activities. Therefore, we speculated that pollution sources were one of the important factors affecting the bioaccessibility of PTEs.
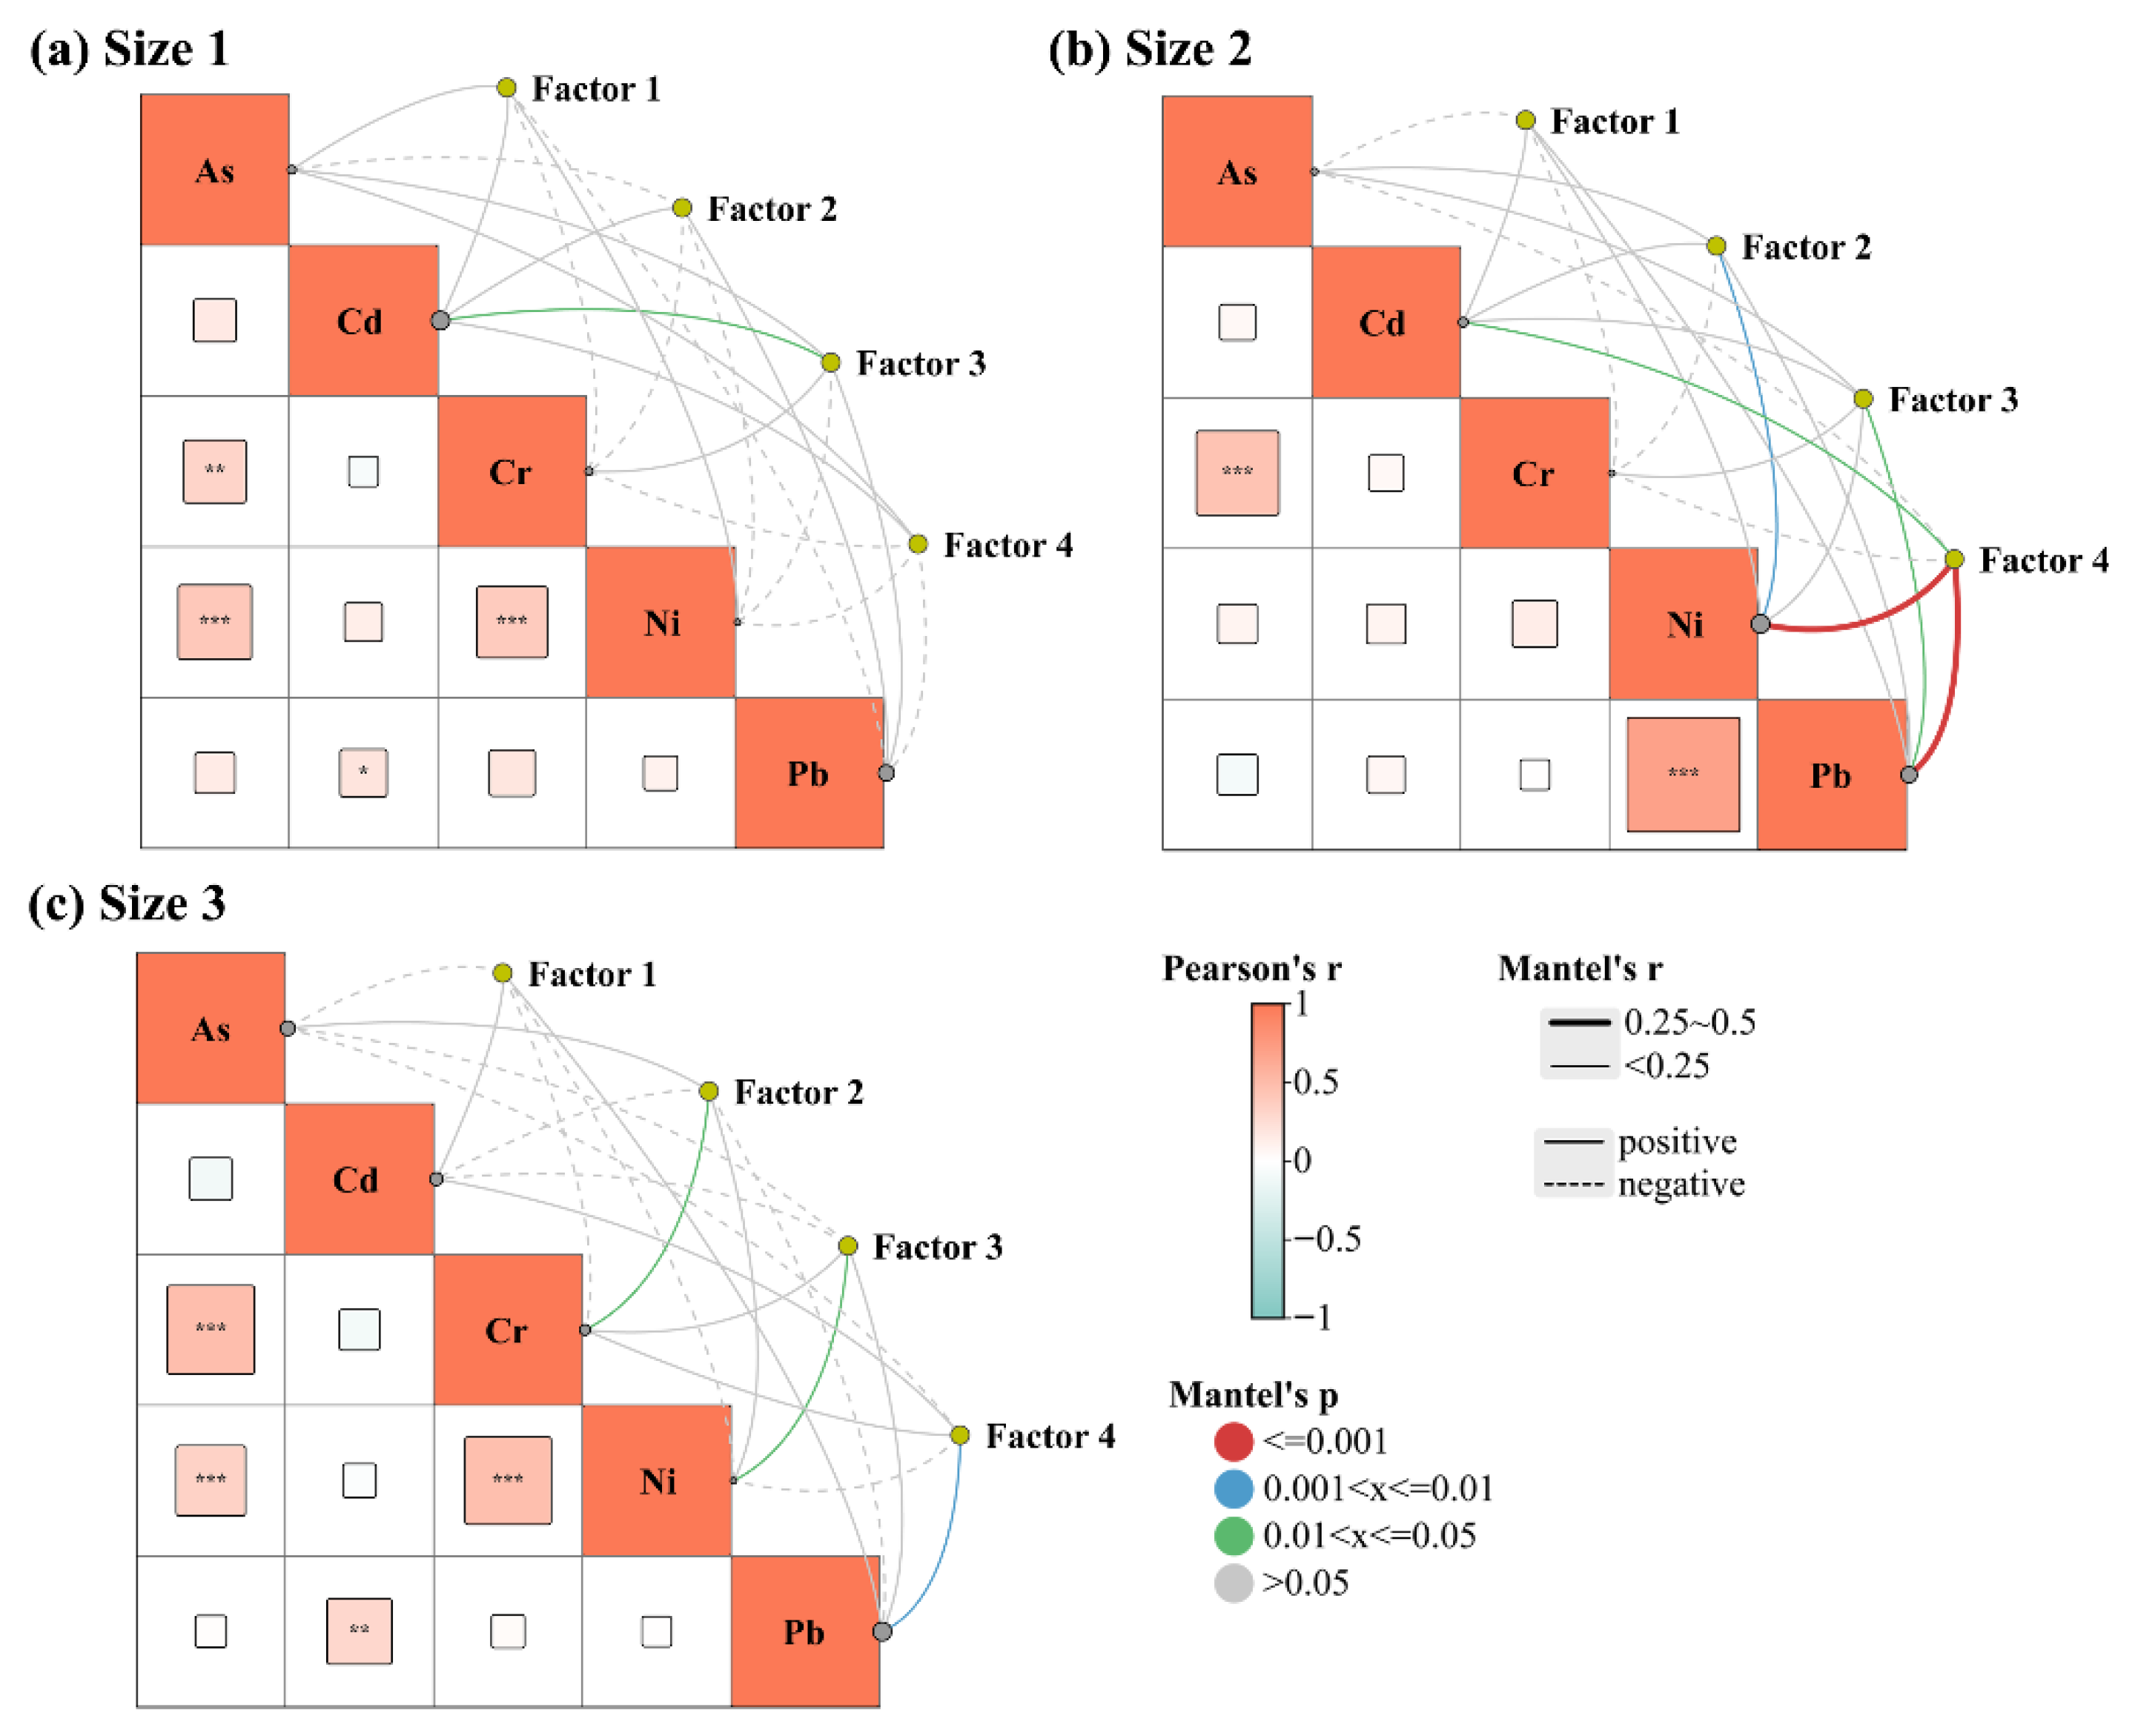
To effectively allocate the impacts of different sources on the bioaccessibility of PTEs, Pearson correlation analysis was used to determine the correlations between the bioaccessibilities of PTEs. Then, the correlations between pollutant source factors and bioaccessibility with different particle sizes were analyzed using the Mantel test (Figure 3). When the pairwise comparison of the dust PTE bioaccessibility showed a strong correlation (r = 0.6), this indicated a potential common source [49]. In size 1 dust, the contribution of industrial sources was significantly correlated with the bioaccessibility of Cd (p = 0.013). In size 2, traffic sources were significantly correlated with the bioaccessibility of Ni (p = 0.008), industrial sources were significantly correlated with the bioaccessibility of Pb (p = 0.038), and fossil fuels were significantly correlated with the bioaccessibility of Cd (p = 0.041), Ni (p = 0.001), and Pb (p = 0.001). Meanwhile, the bioaccessibility of Ni and Pb showed a strong correlation (r = 0.70), indicating that the bioaccessibility of Ni and Pb was strongly affected by fossil fuels. In size 3, traffic sources were significantly correlated with the bioaccessibility of Cr (p = 0.019), industrial sources were significantly correlated with the bioaccessibility of Ni (p = 0.037), and fossil fuels were significantly correlated with the bioaccessibility of Pb (p = 0.006). Notably, although the industrial source contributed 86.7% to Cd in size 3 road dust, no correlation was found between Cd bioaccessibility and industrial source contributions. A similar report indicated that when the bioaccessibility of Pb in mixed particles is comparable to that of Pb in fly ash sources, the bioaccessibility of Pb in particles does not change with the increase in fly ash contribution rate [50]. Therefore, we speculate that the bioaccessibility of Cd in size 3 road dust may reflect the solubility of Cd in industrial sources. More importantly, the trend of the contribution rate of industrial sources to PTEs with particle size was consistent with the changes in the bioaccessibility of Cd, Cr, and Ni. For example, the contribution rate of industrial sources to Cd increases with the increase in dust particle size (from 73.9% to 86.7%), and the bioaccessibility of Cd also increases with the increase in particle size (from 66.4% to 78.1%). The contribution rate of industrial sources to Cr (from 18.2% to 7.80%) and Ni (from 18.3% to 0.67%) decreased, resulting in a decrease in the bioaccessibility of Cr (from 9.44% to 6.76%) and Ni (from 11.6% to 9.24%). The above data indicated that industrial sources led to higher bioaccessibility of PTEs, which was consistent with previous research results [18,51]. Overall, variations in anthropogenic sources (especially industrial sources) are the key driving factor for the change in PTE bioaccessibility in road dust.

3.4. Bioaccessibility-Specific Health Risk Assessment

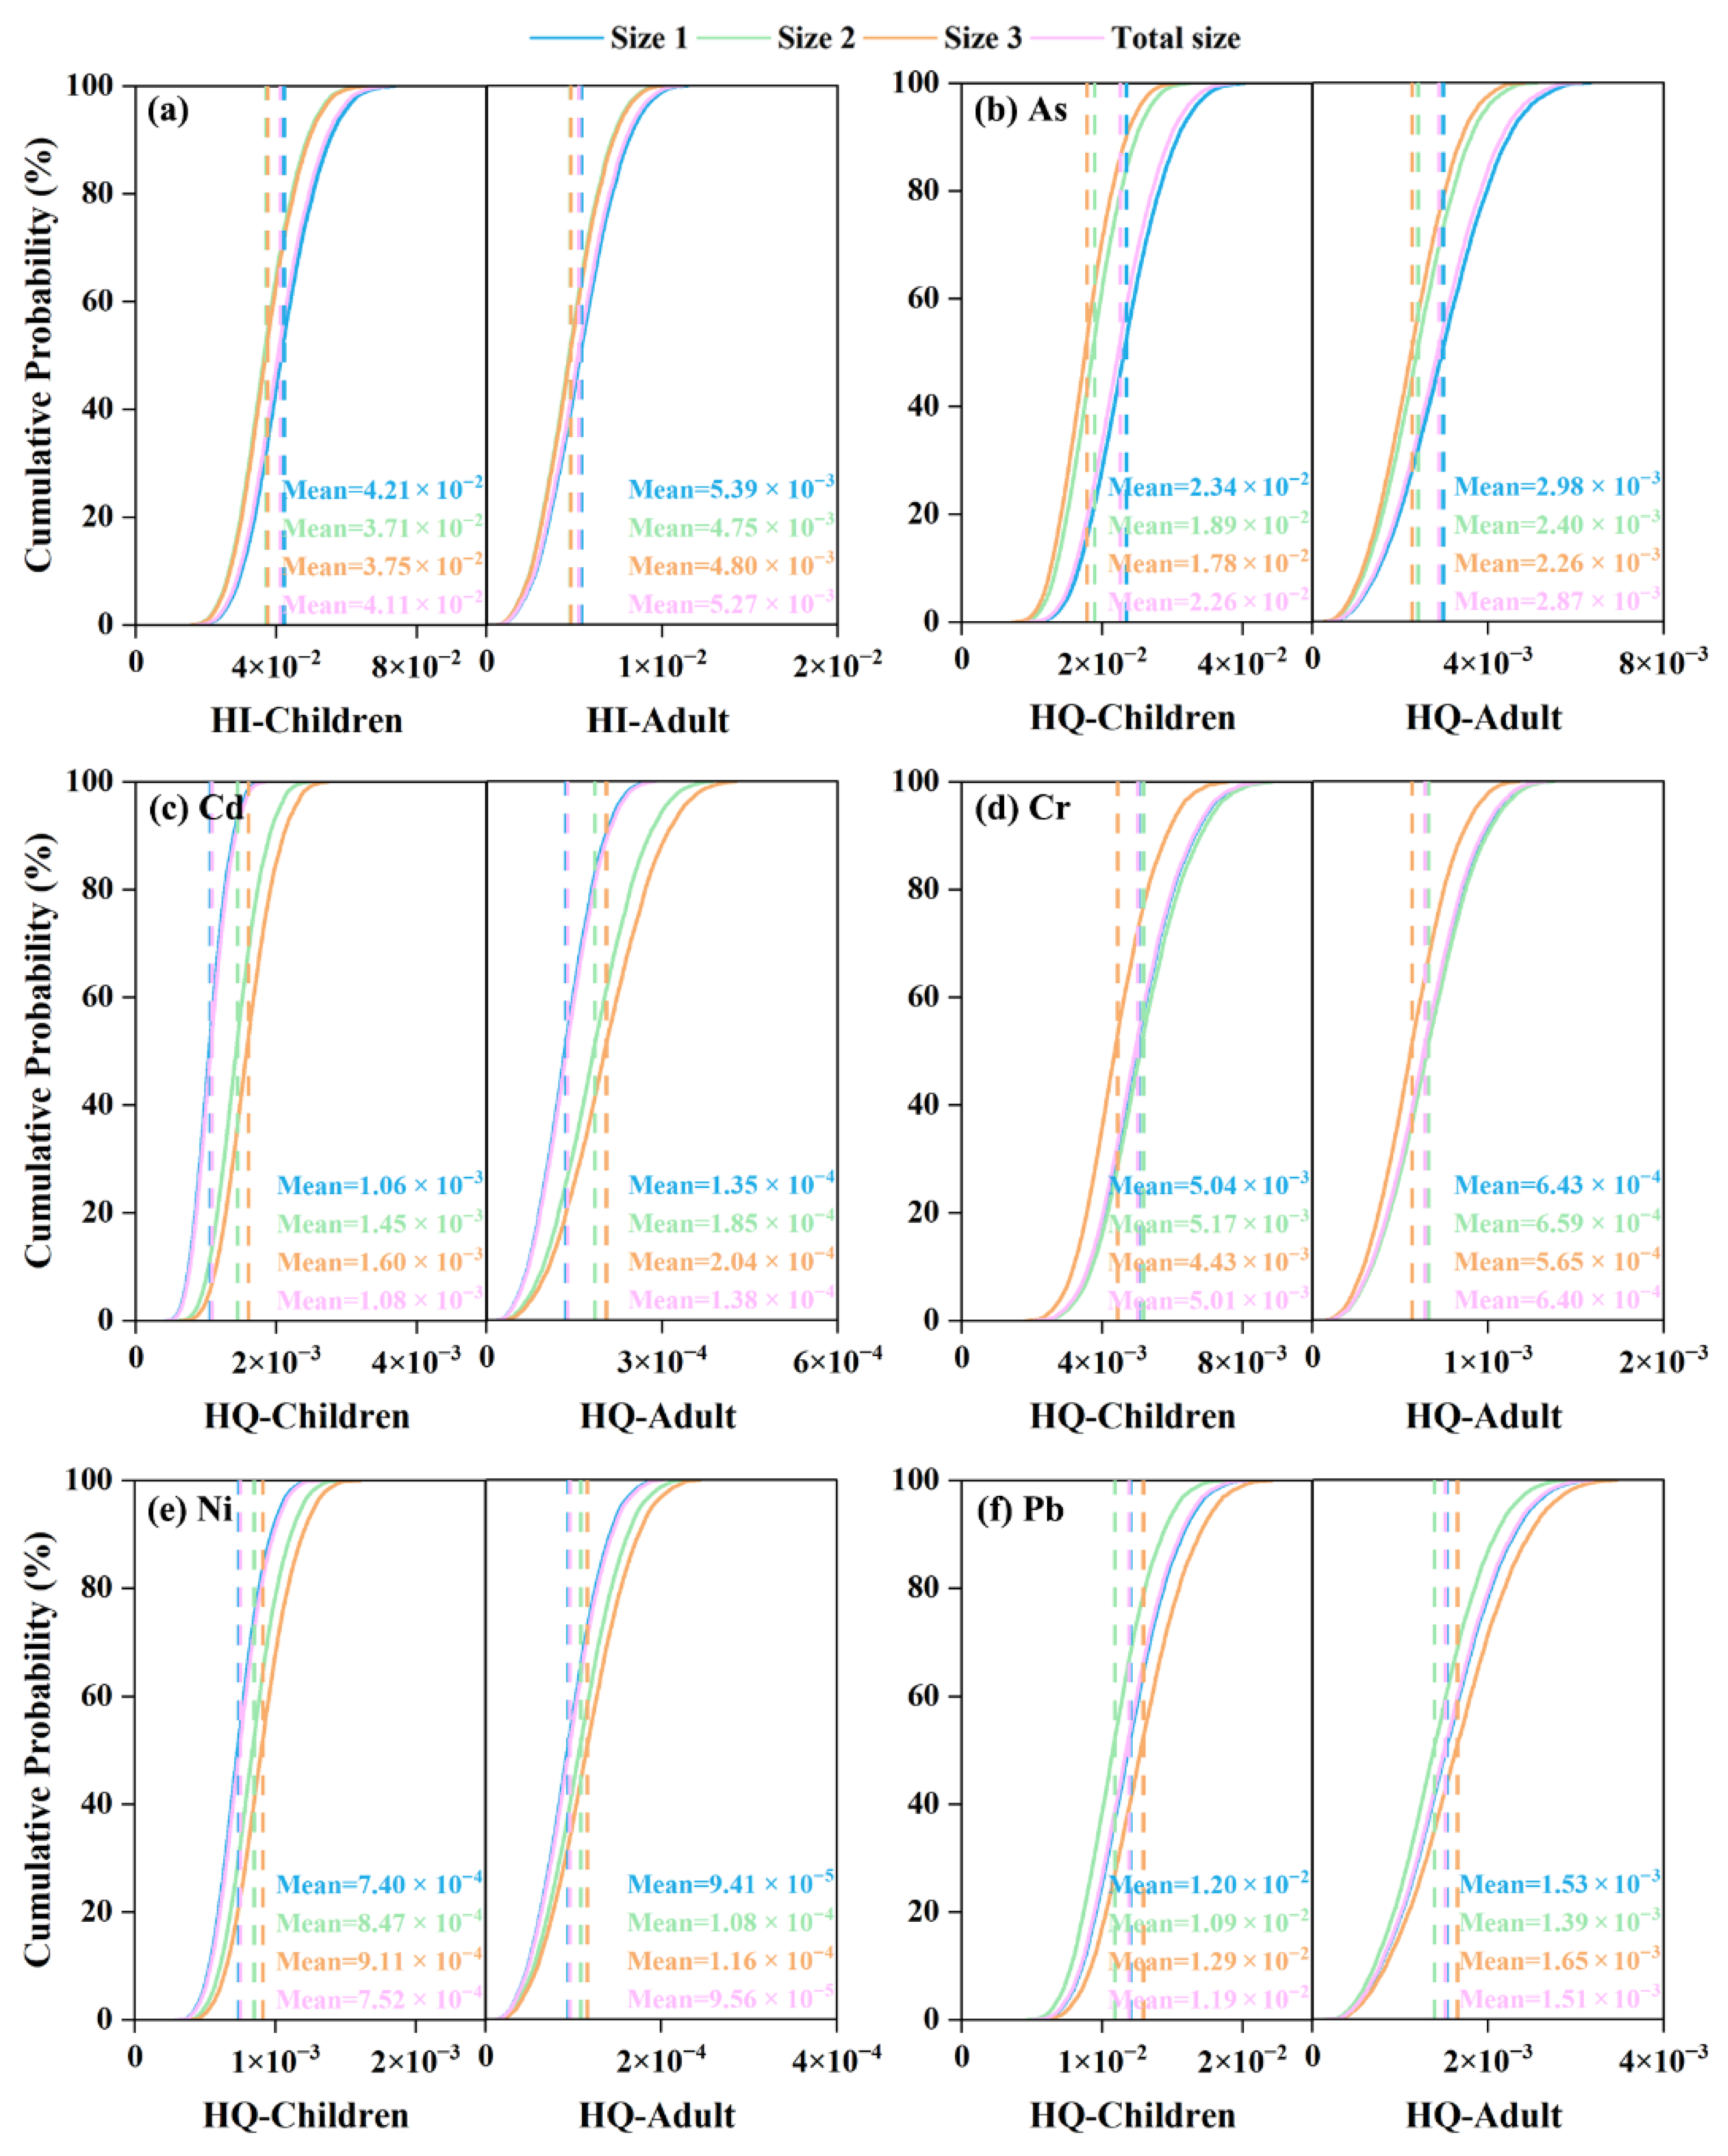
A Monte Carlo simulation was conducted to evaluate the non-carcinogenic risk (NCR) (Figure 4) and lifetime carcinogenic risk (LCR) (Figure 5) posed by the bioaccessible content of PTEs in three sizes of road dust via oral ingestion. This method minimizes the uncertainty of health risk assessment by considering the variability in exposure factors (exposure frequency and dust ingestion rate) and the uncertainty characteristics of PTEs concentration.
The hazard index (HI) and hazard quotient (HQ) values for the five PTEs detected in road dust were generally below the safety threshold (<1), indicating that non-carcinogenic risks posed by these metals were within acceptable limits for the population (Figure 4). Children are a sensitive group that needs more attention because their cumulative non-carcinogenic risk is one order of magnitude higher than that of adults. Specifically, for the three particle sizes of dust, the bioaccessibility-specific HQ values for both children and adults followed the order: As > Pb > Cr > Cd > Ni. The HI values varied with particle size distribution, with size 1 > size 3 > size 2, indicating the fine particle dust providing the highest non-carcinogenic risk. Similar results were obtained by others, with fine particle dust (such as <50 μm and <63 μm) having the highest non-carcinogenic risk [10,52]. Therefore, regarding non-carcinogenic risks, pollution sources of As in fine particles require prioritized management, and regulating composite sources and industrial sources (which contributed 45.2% and 30.4% to As in size 1 road dust, respectively) is an effective measure to reduce health risks.
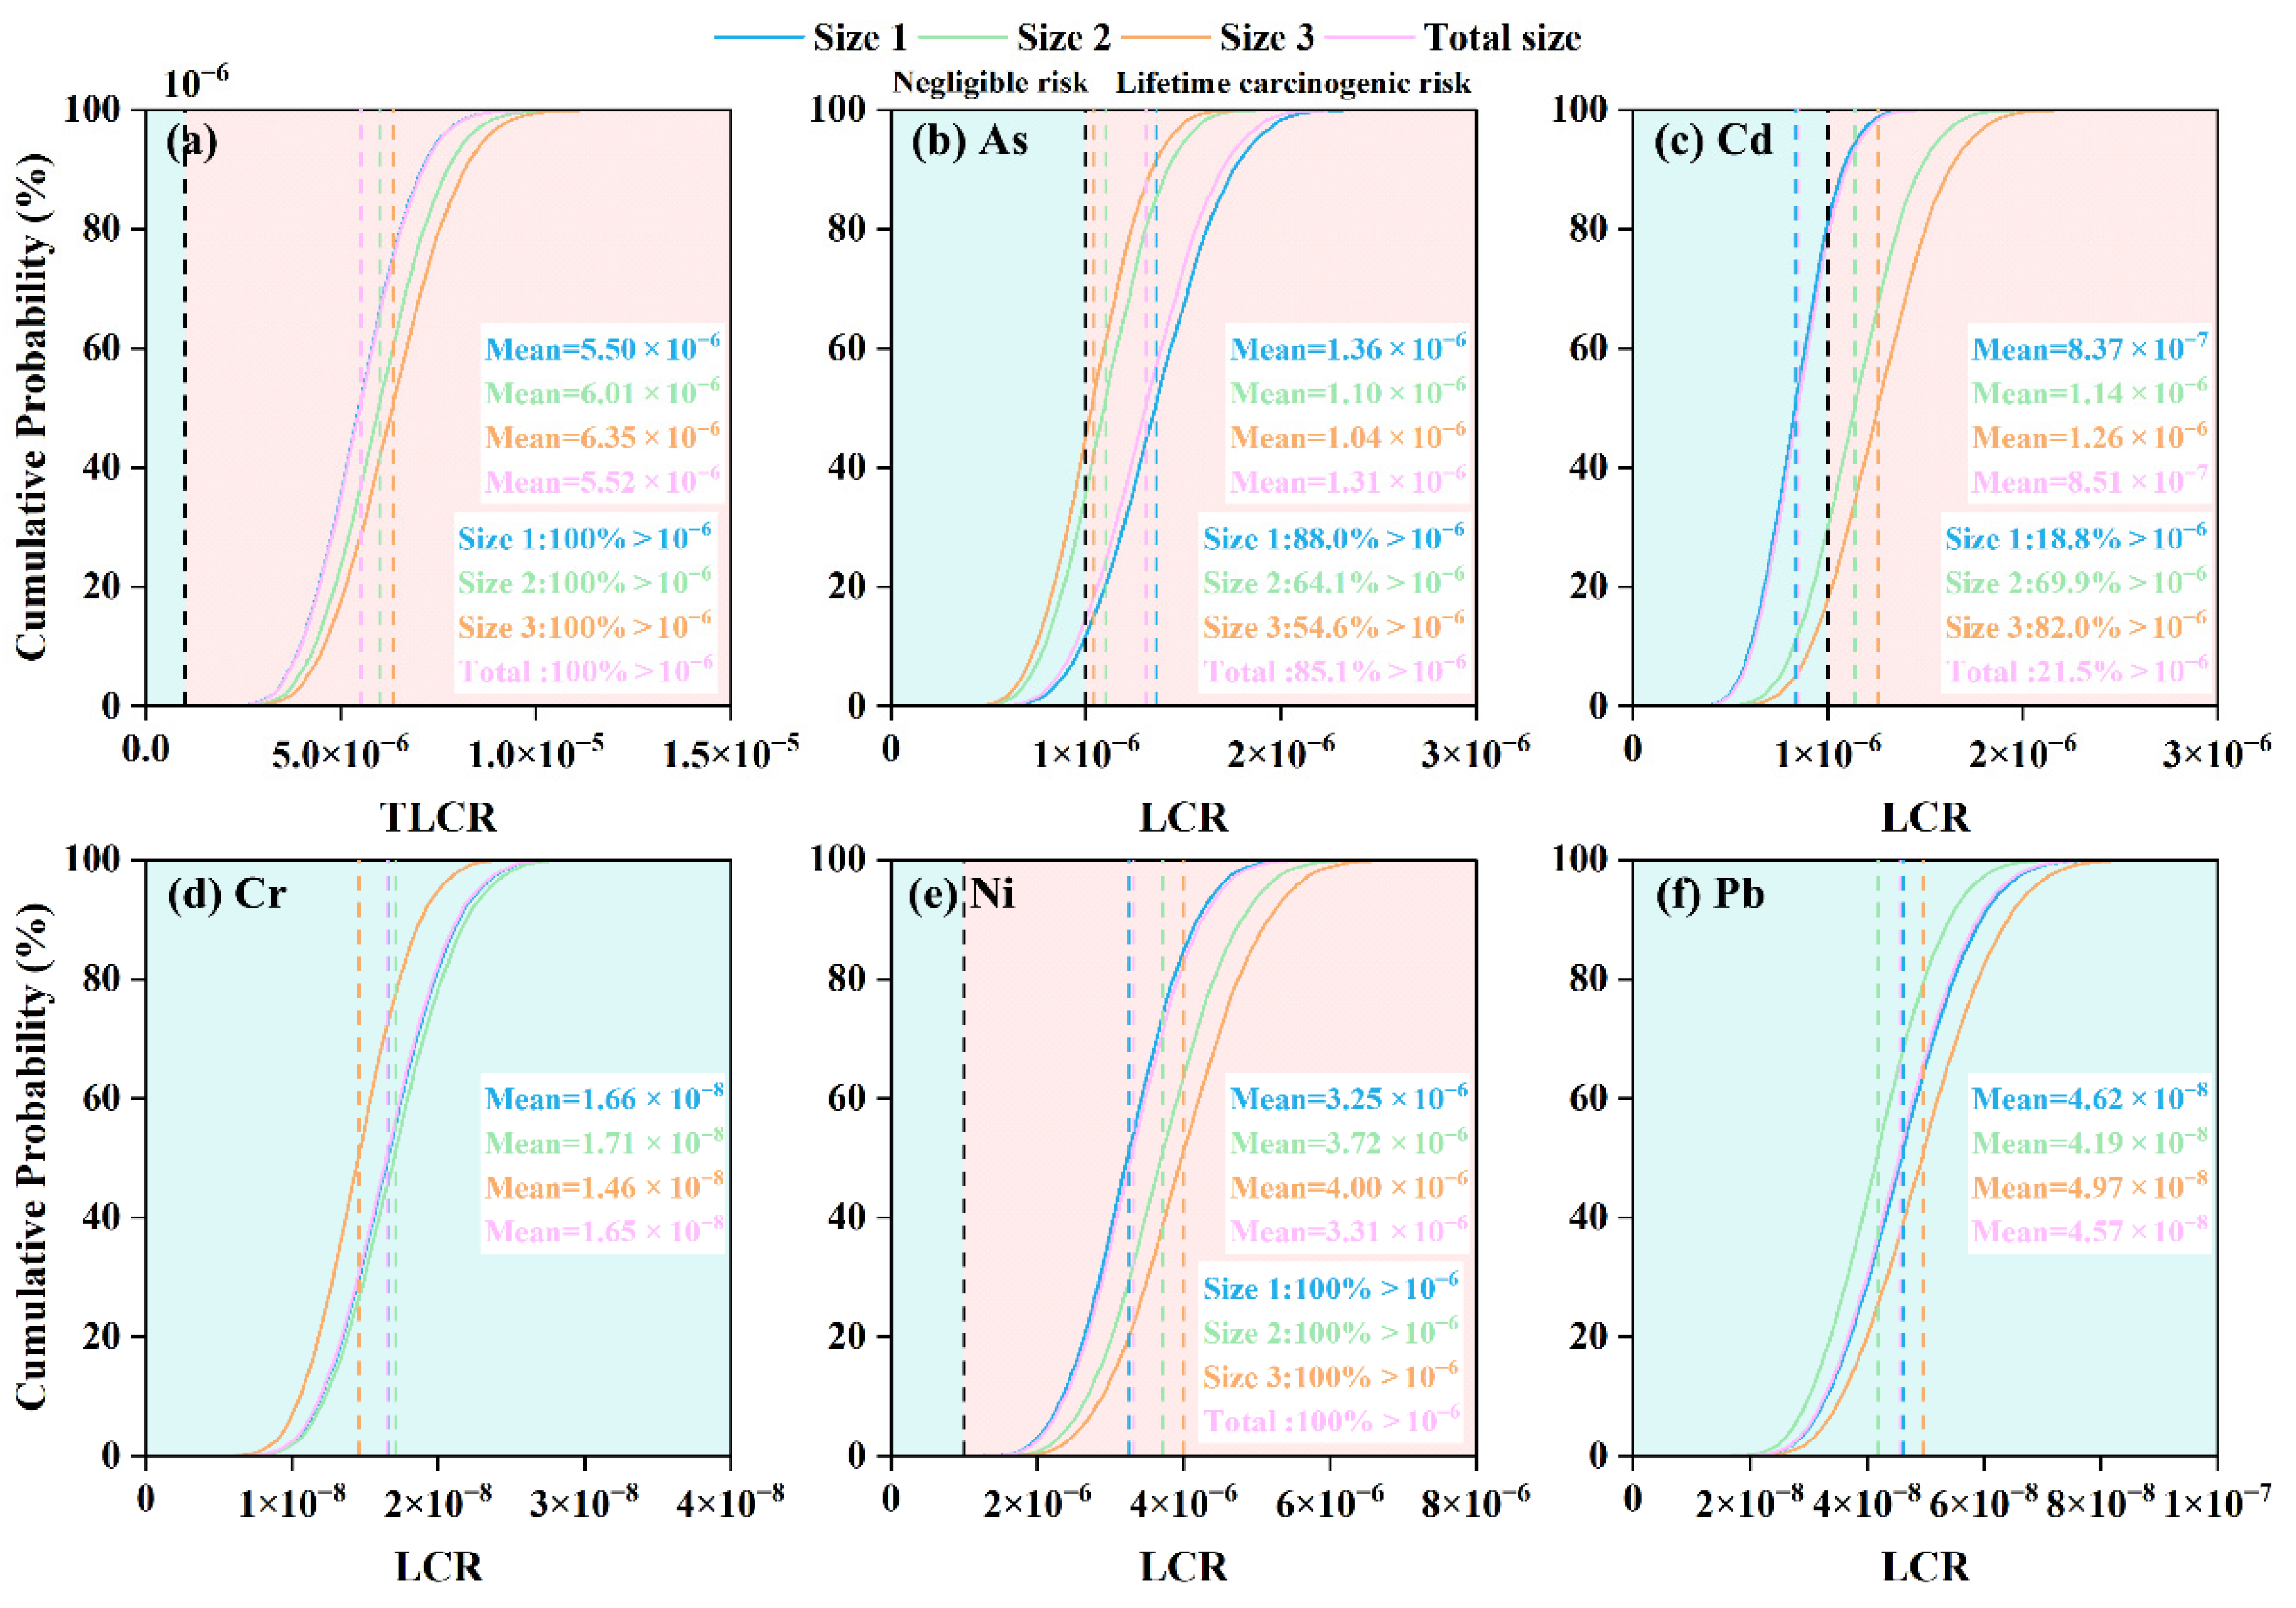
Although the non-carcinogenic risk of PTEs in different particle sizes of dust was within the acceptable range, the total lifetime carcinogenic risk (TLCR) exceeded the acceptable threshold (10−6) in this study (Figure 5). The mean TLCR value of road dust reached 5.52 times the acceptable threshold for total size, indicating a significant carcinogenic risk in the study area. Meanwhile, dust in size 3 exhibited the highest TLCR (6.35 × 10⁻⁶), with size 2 (6.01 × 10⁻⁶) and size 1 (5.50 × 10⁻⁶) following in lower order. The mean lifetime carcinogenic risk (LCR) values varied with five PTEs, with the order of Ni (3.31 × 10⁻⁶) > As (1.31 × 10⁻⁶) > Cd (8.51 × 10⁻⁷) > Pb (4.57 × 10⁻⁸) > Cr (1.65 × 10⁻⁸) for total size dust. The exceedance rates of LCR for Ni, As, and Cd were 100%, 85.1%, and 21.5%, respectively. In addition, As showed the highest LCR in size 1 dust, Cr showed the highest LCR in size 2, and Cd, Ni, and Pb showed the highest LCR in size 3. Although size 3 fraction had the highest TLCR, size 1 road dust had a greater impact due to its dominance in road dust (83.3% vs. 10.3% and 5.42%). Therefore, pollution sources of Ni, As, and Cd in fine particles need prioritized management in this study area, particularly for Ni sources.
The Mantel test results show that in size 1 road dust, the total content of Ni is significantly correlated with traffic sources, industrial sources, and fossil fuel combustion (Figure 2d). Fossil fuel combustion should be prioritized, as it provides the highest contribution rate of Ni in road dust (43.3%) (Figure 2a). Additionally, the particle size distribution of road dust may be altered due to adjustments in urban industrial structures. If the proportion of dust in size 3 increases, it will lead to higher health risks, because dust in size 3 has a higher TLCR. For example, the total concentration and bioaccessibility of Ni are significantly correlated with industrial sources in size 3. Therefore, strengthening the management of industrial emissions (including industrial production and emissions from fossil fuel combustion) can effectively control the total concentration of Ni in road dust and the health risks based on bioaccessibility.

3.5. Implications of Bioaccessible-Based Health Risks for Carbon Emission Reduction

In this study, size 1 road dust had the greatest impact on overall lifetime carcinogenic risk, with Ni from fossil fuel combustion being the primary risk element.
The PMF model was used to distribute Ni in road dust, of which 18.3 mg kg−1 was derived from fossil fuel combustion. According to the conservative value of Ni bioaccessibility (25.6%), the bioaccessible-Ni concentration produced by fossil fuel combustion was simulated to be 4.67 mg kg−1. Considering the bioaccessibility, the population still faces an unacceptable lifetime cancer risk threshold. The results showed that the LCR after bioaccessibility adjustment was only 25.6% of the conventional assessment value (3.55 × 10⁻⁶ vs. 1.39 × 10⁻⁵). This finding highlights the importance of incorporating bioaccessibility into the health risk assessment system to reduce risk overestimation. Based on the threshold of acceptable LCR (10−6), the safety value of Ni was derived to be 1.32 mg kg−1. In contrast, incorporating bioaccessibility into the health risk assessment model identified a more protective remediation target value of 5.16 mg kg−1, which reduced the removal efficiency requirement from 92.8% to 71.8% (Table S8). The possible environmental impacts were further assessed by estimating associated carbon emissions. The dust of fossil fuel combustion will be treated by a bag filter, which is the main dust control technology in China [53,54]. After considering only the power consumption of the bag filter (Text S6), it is estimated that the carbon emission per facility can be reduced by about 2.51 tCO2e a−1 (from 11.1 tCO2e a−1 to 8.59 tCO2e a−1). Recently, research has vigorously promoted carbon emission reduction in soil remediation [17,55]. However, research on carbon mitigation strategies during PTE control in road dust remains limited. Although this study was not included in the life cycle assessment, it clearly revealed the great potential of integrating bioaccessibility into urban dust PTE pollution remediation planning.

4. Conclusions

In this study, the PMF model was used to identify PTE pollution sources in road dust with different particle sizes, and the SBRC method was used to evaluate the bioaccessibility of PTEs. Four urban road dust sources identified by the PMF model include composite sources, traffic sources, industrial sources, and fossil fuel combustion. In addition, the bioaccessibility of As, Cr, Ni, and Pb increased with decreasing particle size, whereas the bioaccessibility of Cd increased with increasing particle size. The Mantel test analysis revealed correlations between pollution sources and the bioaccessibility of PTEs based on three practical sizes, indicating that fossil fuel combustion is identified as the main source of total and bioaccessible Ni. Then, health risk assessment based on the bioaccessibility of PTEs showed that <63 μm road dust was the main health risk source, and the bioaccessible As and Ni provide the most contribution to the non-carcinogenic risk and lifetime carcinogenic risk, respectively. Therefore, Ni emitted from fossil fuel combustion is the priority control factor in Jinan’s urban environmental management. Overall, the incorporation of size-specific and source-dependent bioaccessibility into human health risk is critical for more accurate and protective evaluations, especially in urban environmental management under the background of energy conservation and emission reduction.
Due to the typical regionality of the urban environment, this study only studied the road dust in Jinan City, and it is necessary to carry out more studies on urban dust samples to verify the applicability of the method. This study reveals the possibility of carbon emission reduction in the process of fossil fuel emission control by incorporating bioaccessibility into the health risk assessment framework, and provides a theoretical basis and practical reference for future industrial dust pollution control. In addition, pollution sources exhibit the characteristic of phased changes with urban development. Therefore, it is necessary to conduct long-term and sustainable research. In addition, this study only considered the treatment of PTEs in fuel combustion emission dust by dust removal facilities. However, with the popularization and application of clean technology, the influence of road transportation and fossil fuel combustion technology optimization on the PTE content of road dust is worthy of further study.

Supplementary Materials

The following supporting information can be downloaded at: https://www.mdpi.com/article/10.3390/su18052255/s1, Text S1: Road dust particle size distribution analysis; Text S2: Detailed method for the determination of total potentially toxic elements in road dust; Text S3: Quality assurance/quality control; Text S4: Determination of method detection limit (MDL); Text S5: Stability test of PMF results; Text S6: Carbon emission calculation of bag filter; Figure S1: Distribution of (a) sampling sites (n = 100) and (b) functional buildings in the study area; Figure S2: Technology roadmap for processing road dust in the laboratory; Figure S3: Box plots of base model bootstrap results. (a–c) represent the result in size 1, 2, and 3 i, respectively. Mapping of bootstrap factors to base factors is over 80%; Figure S4: Frequency accumulation curves of road dust particle size distribution (n = 100); Figure S5: Contribution of different sources to PTEs in road dust in different particle size ranges; Figure S6: Enrichment factor (EF) of different PTEs in road dust of different particle sizes in size 1 (a), size 2 (b), and size 3 (c). When EF ≤ 2, it represents “Minimal pollution”; when 2 < EF ≤ 5, it means “moderate pollution”; when 5 < EF ≤ 20, there is “Significant pollution”; when 20 < EF ≤ 40, it represents the existence of “Strong pollution”; when EF > 40, there is “Extreme pollution”; Figure S7: Box plots of 5 PTEs’ bioaccessibility (%) in different particle sizes (size 1: <63 μm, size 2: 63–125 μm, size 3: 125–250 μm, and total size: <250 μm) of Jinan city; Figure S8: Health risk assessment based on total and bioaccessible contents of PTEs in road dust; Table S1: Classification standard of enrichment factor (EF); Table S2: Dust exposure risk health risk assessment model calculated parameters and values; Table S3: Corresponding reference dose (RfD) and slope factor (SF) values for PTEs under ingestion exposure pathways in a health risk assessment model; Table S4: Applicability assessment of factor analysis for potentially toxic elements in road dust (Kaiser-Meyer-Olkin (KMO) and Bartlett sphericity tests); Table S5: Descriptive statistics on the distribution of different particle sizes of urban road dust in two zones; Table S6: Description of the content of PTEs (mg kg−1) in road dust and soil in Jinan; Table S7: Characterization of PTEs’ enrichment factors (EF) in road dust of 3 particle sizes in Jinan; Table S8: Carbon emission reduction calculation results. Refs. [56,57,58] are cited in Supplementary Material.

Author Contributions

Conceptualization, L.H., E.L. and J.L.; methodology, H.L. and G.W.; software, S.C.; validation, Y.S. and H.L.; formal analysis, S.C., E.L. and J.L.; investigation, L.H. and H.L. and G.W.; data curation, S.C.; writing—original draft preparation, S.C.; writing—review and editing, L.H., E.L. and J.L.; project administration, Y.S.; funding acquisition, J.L. All authors have read and agreed to the published version of the manuscript.

Funding

This research was supported by the National Natural Science Foundation of China (41807485), Shandong Provincial Natural Science Foundation (ZR2019BD002), and China Postdoctoral Science Foundation (2018T110705, 2017M622264).

Institutional Review Board Statement

Not applicable.

Informed Consent Statement

Not applicable.

Data Availability Statement

The original contributions presented in the study are included in the article/Supplementary Materials, and further inquiries can be directed to the corresponding authors.

Conflicts of Interest

The authors declare no conflicts of interest.

References

  1. Miyazaki, K.; Bowman, K. Predictability of fossil fuel CO2 from air quality emissions. Nat. Commun. 2023, 14, 1604. [Google Scholar] [CrossRef] [Scilit]
  2. Sun, W.; Zhou, Y.; Lv, J.; Wu, J. Assessment of multi-air emissions: Case of particulate matter (dust), SO2, NOx and CO2 from iron and steel industry of China. J. Clean. Prod. 2019, 232, 350–358. [Google Scholar] [CrossRef] [Scilit]
  3. Wang, X.; Liu, E.; Lin, Q.; Liu, L.; Yuan, H.; Li, Z. Occurrence, sources and health risks of toxic metal(loid)s in road dust from a mega city (Nanjing) in China. Environ. Pollut. 2020, 263, 114518. [Google Scholar] [CrossRef] [Scilit] [PubMed]
  4. Zheng, N.; Hou, S.; Wang, S.; Sun, S.; An, Q.; Li, P.; Li, X. Health risk assessment of heavy metals in street dust around a zinc smelting plant in China based on bioavailability and bioaccessibility. Ecotoxicol. Environ. Saf. 2020, 197, 110617. [Google Scholar] [CrossRef] [Scilit] [PubMed]
  5. Li, H.; Qian, X.; Hu, W.; Wang, Y.; Gao, H. Chemical speciation and human health risk of trace metals in urban street dusts from a metropolitan city, Nanjing, SE China. Sci. Total Environ. 2013, 456–457, 212–221. [Google Scholar] [CrossRef] [Scilit]
  6. Gope, M.; Masto, R.E.; George, J.; Hoque, R.R.; Balachandran, S. Bioavailability and health risk of some potentially toxic elements (Cd, Cu, Pb and Zn) in street dust of Asansol, India. Ecotoxicol. Environ. Saf. 2017, 138, 231–241. [Google Scholar] [CrossRef] [Scilit]
  7. Li, H.-B.; Li, J.; Juhasz, A.L.; Ma, L.Q. Correlation of in Vivo Relative Bioavailability to in Vitro Bioaccessibility for Arsenic in Household Dust from China and Its Implication for Human Exposure Assessment. Environ. Sci. Technol. 2014, 48, 13652–13659. [Google Scholar] [CrossRef] [Scilit]
  8. Huang, F.; Liu, B.; Yu, Y.; Lv, L.; Luo, X.; Yin, F. Heavy metals in road dust across China: Occurrence, sources and health risk assessment. Bull. Environ. Contam. Toxicol. 2022, 109, 323–331. [Google Scholar] [CrossRef] [Scilit]
  9. Li, X.; He, A.; Cao, Y.; Yun, J.; Bao, H.; Yan, X.; Zhang, X.; Dong, J.; Kelly, F.J.; Mudway, I. Exposure risks of lead and other metals to humans: A consideration of specific size fraction and methodology. J. Hazard. Mater. 2024, 469, 133549. [Google Scholar] [CrossRef] [Scilit]
  10. Li, H.-B.; Cui, X.-Y.; Li, K.; Li, J.; Juhasz, A.L.; Ma, L.Q. Assessment of in Vitro Lead Bioaccessibility in House Dust and Its Relationship to in Vivo Lead Relative Bioavailability. Environ. Sci. Technol. 2014, 48, 8548–8555. [Google Scholar] [CrossRef] [Scilit] [PubMed]
  11. Duan, B.; Zhang, W.; Zheng, H.; Wu, C.; Zhang, Q.; Bu, Y. Comparison of Health Risk Assessments of Heavy Metals and As in Sewage Sludge from Wastewater Treatment Plants (WWTPs) for Adults and Children in the Urban District of Taiyuan, China. Int. J. Environ. Res. Public Health 2017, 14, 1194. [Google Scholar] [CrossRef] [Scilit]
  12. Shahab, A.; Hui, Z.; Rad, S.; Xiao, H.; Siddique, J.; Huang, L.L.; Ullah, H.; Rashid, A.; Taha, M.R.; Zada, N. A comprehensive review on pollution status and associated health risk assessment of human exposure to selected heavy metals in road dust across different cities of the world. Environ. Geochem. Health 2023, 45, 585–606. [Google Scholar] [CrossRef] [Scilit]
  13. Rybak, J.; Wróbel, M.; Stefan Bihałowicz, J.; Rogula-Kozłowska, W. Selected Metals in Urban Road Dust: Upper and Lower Silesia Case Study. Atmosphere 2020, 11, 290. [Google Scholar] [CrossRef] [Scilit]
  14. Men, C.; Liu, R.; Xu, F.; Wang, Q.; Guo, L.; Shen, Z. Pollution characteristics, risk assessment, and source apportionment of heavy metals in road dust in Beijing, China. Sci. Total Environ. 2018, 612, 138–147. [Google Scholar] [CrossRef] [Scilit]
  15. Yang, Y.; Lu, X.; Yu, B.; Wang, Z.; Wang, L.; Lei, K.; Zuo, L.; Fan, P.; Liang, T. Exploring the environmental risks and seasonal variations of potentially toxic elements (PTEs) in fine road dust in resource-based cities based on Monte Carlo simulation, geo-detector and random forest model. J. Hazard. Mater. 2024, 473, 134708. [Google Scholar] [CrossRef] [Scilit]
  16. Li, X.; Wang, S.; Zhong, M.; Jiang, L.; Zhang, W.; Li, J. Carbon reduction and co-benefits through nature-based solution at a large petrochemical contaminated site in beijing: Policy implications for China. J. Clean. Prod. 2025, 497, 145172. [Google Scholar] [CrossRef] [Scilit]
  17. Zhang, H.N.; Han, D.; Zhong, M.S.; Xia, T.X.; Yang, S.; Wang, S.J.; Zhang, P.; Jiang, L. Predicting arsenic bioaccessibility: A global data-driven machine learning approach and its implication for reducing carbon emissions. J. Hazard. Mater. 2025, 496, 15. [Google Scholar] [CrossRef] [Scilit] [PubMed]
  18. Chen, S.; Han, L.; Wu, Y.; Liu, X.; Liu, C.; Liu, Y.; Li, H.; Li, J. Health Risk Assessment of Road-Dust-Bound Heavy Metals via Ingestion Exposure from One Typical Inland City of Northern China: Incorporation of Sources and Bioaccessibility. Sustainability 2024, 16, 6550. [Google Scholar] [CrossRef] [Scilit]
  19. Cai, Y.; Li, F.; Zhang, J.; Zhu, X.; Li, Y.; Fu, J.; Chen, X.; Liu, C. Toxic metals in size-fractionated road dust from typical industrial district: Seasonal distribution, bioaccessibility and stochastic-fuzzy health risk management. Environ. Technol. Innov. 2021, 23, 101643. [Google Scholar] [CrossRef] [Scilit]
  20. Wang, P.; Xue, J.; Zhu, Z. Comparison of heavy metal bioaccessibility between street dust and beach sediment: Particle size effect and environmental magnetism response. Sci. Total Environ. 2021, 777, 146081. [Google Scholar] [CrossRef] [Scilit]
  21. Padoan, E.; Romè, C.; Ajmone-Marsan, F. Bioaccessibility and size distribution of metals in road dust and roadside soils along a peri-urban transect. Sci. Total Environ. 2017, 601–602, 89–98. [Google Scholar] [CrossRef] [Scilit] [PubMed]
  22. Zhao, L.; Yu, R.; Yan, Y.; Cheng, Y.; Hu, G.; Huang, H. Bioaccessibility and provenance of heavy metals in the park dust in a coastal city of southeast China. Appl. Geochem. 2020, 123, 104798. [Google Scholar] [CrossRef] [Scilit]
  23. Kelepertzis, E.; Chrastný, V.; Botsou, F.; Sigala, E.; Kypritidou, Z.; Komárek, M.; Skordas, K.; Argyraki, A. Tracing the sources of bioaccessible metal(loid)s in urban environments: A multidisciplinary approach. Sci. Total Environ. 2021, 771, 144827. [Google Scholar] [CrossRef] [Scilit] [PubMed]
  24. Di, Z.; Wang, Y.; Chang, C.; Song, H.; Lu, X.; Cheng, F. Synergistic gas–slag scheme to mitigate CO2 emissions from the steel industry. Nat. Sustain. 2025, 8, 763–772. [Google Scholar] [CrossRef] [Scilit]
  25. Shamsuzzaman, M.; Shamsuzzoha, A.; Maged, A.; Haridy, S.; Bashir, H.; Karim, A. Effective monitoring of carbon emissions from industrial sector using statistical process control. Appl. Energy 2021, 300, 117352. [Google Scholar] [CrossRef] [Scilit]
  26. Wang, X.; Liu, E.; Yan, M.; Zheng, S.; Fan, Y.; Sun, Y.; Li, Z.; Xu, J. Contamination and source apportionment of metals in urban road dust (Jinan, China) integrating the enrichment factor, receptor models (FA-NNC and PMF), local Moran’s index, Pb isotopes and source-oriented health risk. Sci. Total Environ. 2023, 878, 163211. [Google Scholar] [CrossRef] [Scilit]
  27. GB/T 36197-2018; National Standard of the People’s Republic of China: Technical Guide for Soil Sampling of Soil Quality. China National Standardization Administration Committee: Beijing, China, 2018.
  28. Breuning-Madsen, H.; Awadzi, T.W. Harmattan dust deposition and particle size in Ghana. Catena 2005, 63, 23–38. [Google Scholar] [CrossRef] [Scilit]
  29. Chen, L.; Zhang, H.; Ding, M.; Devlin, A.T.; Wang, P.; Nie, M.; Xie, K. Exploration of the variations and relationships between trace metal enrichment in dust and ecological risks associated with rapid urban expansion. Ecotoxicol. Environ. Saf. 2021, 212, 111944. [Google Scholar] [CrossRef] [Scilit]
  30. USEPA. EPA Positive Matrix Factorization (PMF) 5.0 Fundamentals and User Guide; U.S. Environmental Protection Agency: Washington, DC, USA, 2014.
  31. Tian, S.; Liang, T.; Li, K.; Wang, L. Source and path identification of metals pollution in a mining area by PMF and rare earth element patterns in road dust. Sci. Total Environ. 2018, 633, 958–966. [Google Scholar] [CrossRef] [Scilit]
  32. USEPA. Exposure Factors Handbook 2011 Edition (Final Report); U.S. Environmental Protection Agency: Washington, DC, USA, 2011.
  33. USEPA. Regional Screening Levels (RSLs)—User’s Guide; National Center for Environmental Assessment: Washington, DC, USA, 2018.
  34. Huang, J.; Wu, Y.; Sun, J.; Li, X.; Geng, X.; Zhao, M.; Sun, T.; Fan, Z. Health risk assessment of heavy metal(loid)s in park soils of the largest megacity in China by using Monte Carlo simulation coupled with Positive matrix factorization model. J. Hazard. Mater. 2021, 415, 125629. [Google Scholar] [CrossRef] [Scilit] [PubMed]
  35. Doyi, I.N.Y.; Strezov, V.; Isley, C.F.; Yazdanparast, T.; Taylor, M.P. The relevance of particle size distribution and bioaccessibility on human health risk assessment for trace elements measured in indoor dust. Sci. Total Environ. 2020, 733, 137931. [Google Scholar] [CrossRef] [Scilit]
  36. Hu, X.; Zhang, Y.; Luo, J.; Wang, T.; Lian, H.; Ding, Z. Bioaccessibility and health risk of arsenic, mercury and other metals in urban street dusts from a mega-city, Nanjing, China. Environ. Pollut. 2011, 159, 1215–1221. [Google Scholar] [CrossRef] [Scilit]
  37. Ali, M.U.; Liu, G.; Yousaf, B.; Abbas, Q.; Ullah, H.; Munir, M.A.M.; Fu, B. Pollution characteristics and human health risks of potentially (eco)toxic elements (PTEs) in road dust from metropolitan area of Hefei, China. Chemosphere 2017, 181, 111–121. [Google Scholar] [CrossRef] [Scilit]
  38. Pelfrêne, A.; Douay, F. Assessment of oral and lung bioaccessibility of Cd and Pb from smelter-impacted dust. Environ. Sci. Pollut. Res. 2018, 25, 3718–3730. [Google Scholar] [CrossRef] [Scilit] [PubMed]
  39. Li, X.; Gao, Y.; Zhang, M.; Zhang, Y.; Zhou, M.; Peng, L.; He, A.; Zhang, X.; Yan, X.; Wang, Y.; et al. In vitro lung and gastrointestinal bioaccessibility of potentially toxic metals in Pb-contaminated alkaline urban soil: The role of particle size fractions. Ecotoxicol. Environ. Saf. 2020, 190, 110151. [Google Scholar] [CrossRef] [Scilit] [PubMed]
  40. Chen, X.; Lu, X. Contamination characteristics and source apportionment of potentially toxic elements in the topsoil of Huyi District, Xi’an City, China. Environ. Earth Sci. 2021, 80, 595. [Google Scholar] [CrossRef] [Scilit]
  41. Zeng, Y.; Jiang, Y.; Li, Y.; Xu, X.; Zhang, X.; Yu, W.; Yu, R.; Liu, X. Early warning of urban heavy metal pollution based on PMF- MeteoInfo model combined with physicochemical properties of dust. Stoch. Environ. Res. Risk Assess. 2024, 38, 1541–1556. [Google Scholar] [CrossRef] [Scilit]
  42. Hou, S.; Zheng, N.; Tang, L.; Ji, X.; Li, Y.; Hua, X. Pollution characteristics, sources, and health risk assessment of human exposure to Cu, Zn, Cd and Pb pollution in urban street dust across China between 2009 and 2018. Environ. Int. 2019, 128, 430–437. [Google Scholar] [CrossRef] [Scilit]
  43. Ayrault, S.; Catinon, M.; Boudouma, O.; Bordier, L.; Agnello, G.; Reynaud, S.; Tissut, M. Street Dust: Source and Sink of Heavy Metals To Urban Environment. E3S Web Conf. 2013, 1, 4. [Google Scholar] [CrossRef] [Scilit]
  44. Deocampo, D.M.; Reed, P.J.; Kalenuik, A.P. Road Dust Lead (Pb) in Two Neighborhoods of Urban Atlanta, (GA, USA). Int. J. Environ. Res. Public Health 2012, 9, 2020–2030. [Google Scholar] [CrossRef] [Scilit]
  45. Jinan Municipal Government. Shandong Higgs New Energy Co., Ltd. New Energy Vehicles Retired Power Battery Recycling Industrialization Construction Project Environmental Impact Report; Jinan Municipal Government: Jinan, China, 2022; p. 210. (In Chinese)
  46. Li, F.; Zhang, J.; Huang, J.; Huang, D.; Yang, J.; Song, Y.; Zeng, G. Heavy metals in road dust from Xiandao District, Changsha City, China: Characteristics, health risk assessment, and integrated source identification. Environ. Sci. Pollut. Res. 2016, 23, 13100–13113. [Google Scholar] [CrossRef] [Scilit] [PubMed]
  47. Łach, M.; Mikuła, J.; Hebda, M. Thermal analysis of the by-products of waste combustion. J. Therm. Anal. 2016, 125, 1035–1045. [Google Scholar] [CrossRef] [Scilit]
  48. Weinbruch, S.; Zou, L.; Ebert, M.; Benker, N.; Drotikova, T.; Kallenborn, R. Emission of nanoparticles from coal and diesel fired power plants on Svalbard: An electron microscopy study. Atmos. Environ. 2022, 282, 119138. [Google Scholar] [CrossRef] [Scilit]
  49. Jin, Y.; O’Connor, D.; Ok, Y.S.; Tsang, D.C.W.; Liu, A.; Hou, D. Assessment of sources of heavy metals in soil and dust at children’s playgrounds in Beijing using GIS and multivariate statistical analysis. Environ. Int. 2019, 124, 320–328. [Google Scholar] [CrossRef] [Scilit]
  50. Li, H.-B.; Zhao, D.; Li, J.; Li, S.-W.; Wang, N.; Juhasz, A.L.; Zhu, Y.-G.; Ma, L.Q. Using the SBRC Assay to Predict Lead Relative Bioavailability in Urban Soils: Contaminant Source and Correlation Model. Environ. Sci. Technol. 2016, 50, 4989–4996. [Google Scholar] [CrossRef] [Scilit]
  51. Wang, Y.; Guo, J.; Qu, Z.; Li, F. Toxic Metals in Road Dust from Urban Industrial Complexes: Seasonal Distribution, Bioaccessibility and Integrated Health Risk Assessment Using Triangular Fuzzy Number. Toxics 2025, 13, 842. [Google Scholar] [CrossRef] [Scilit]
  52. Sutherland, R.A. Lead in grain size fractions of road-deposited sediment. Environ. Pollut. 2003, 121, 229–237. [Google Scholar] [CrossRef] [Scilit]
  53. Wang, P.; Cao, Y.; Luo, H.; Li, T.; Yang, B.; Li, H.; Liang, T.; Yu, J.; Wang, L.; Ma, F.; et al. Remarkable enrichment of heavy metals in baghouse filter dust during direct-fired thermal desorption of contaminated soil. J. Hazard. Mater. 2022, 430, 128301. [Google Scholar] [CrossRef] [Scilit] [PubMed]
  54. Chen, X.; Mao, Y.; Fan, C.; Wu, Y.; Ge, S.; Ren, Y. Experimental investigation on filtration characteristic with different filter material of bag dust collector for dust removal. Int. J. Coal Prep. Util. 2022, 42, 3554–3569. [Google Scholar] [CrossRef] [Scilit]
  55. Xiao, M.; Li, X.; Zhang, H.; Meng, H.; Dong, J. Environmental impact assessment and remediation decision-making of a contaminated megasite: Combining LCA and IO-LCA. J. Cleaner Prod. 2024, 462, 142586. [Google Scholar] [CrossRef] [Scilit]
  56. Dodd, M.; Rasmussen, P.E.; Chénier, M. Comparison of Two In Vitro Extraction Protocols for Assessing Metals’ Bioaccessibility Using Dust and Soil Reference Materials. Hum. Ecol. Risk Assess. 2013, 19, 1014–1027. [Google Scholar] [CrossRef] [Scilit]
  57. Dodd, M.; Lee, D.; Nelson, J.; Verenitch, S.; Wilson, R. In vitro bioaccessibility round robin testing for arsenic and lead in standard reference materials and soil samples. Integr. Environ. Assess. Manag. 2024, 20, 1486–1495. [Google Scholar] [CrossRef] [Scilit] [PubMed]
  58. USEPA 2016 Procedures for Detection and Quantitation—Documents. Office of Science and Technology. Available online: https://www.epa.gov/cwa-methods/procedures-detection-and-quantitation-documents (accessed on 23 February 2026).
Figure 1. Box plots of 5 PTE contents (mg kg−1) in different particle sizes (size 1: <63 μm, size 2: 63–125 μm, size 3: 125–250 μm, and total size: <250 μm) of Jinan city.
Sustainability 18 02255 g001
Figure 2. Source contributions of road dust with different particle sizes obtained via PMF modeling. Identify the correlations between PTEs and sources by combining Mantel correlation analysis and the PMF model. (a,d) represent dust in size 1, (b,e) represent in size 2, (c,f) represent in size 3, and (df) were generated using the online data visualization platform ChiPlot, https://www.chiplot.online/ (accessed on 7 October 2025). Marks indicate significant correlation at p < 0.05 (*), p < 0.01 (**), and p < 0.001 (***), respectively.
Sustainability 18 02255 g002
Figure 3. Pearson correlations between the bioaccessibility of different PTEs, and correlations between pollutant source factors and the bioaccessibility of PTEs in (a) size 1, (b) size 2, and (c) size 3 road dust obtained using the Mantel test. Marks indicate significant correlation at p < 0.05 (*), p < 0.01 (**), and p < 0.001 (***), respectively.
Sustainability 18 02255 g003
Figure 4. Probability distribution and mean values for bioaccessible-based (a) hazard index (HI), and for the hazard quotient (HQ) of (b) As, (c) Cd, (d) Cr, (e) Ni, and (f) Pb. The blue, green, orange, and pink vertical dashed lines represent the mean values for size 1, size 2, size 3, and total size, respectively.
Sustainability 18 02255 g004
Figure 5. Probability distribution and the percentage overpassed 10–6 for bioaccessible-based (a) total lifetime carcinogenic risk (LTCR) and lifetime carcinogenic risk (LCR) index of (b) As, (c) Cd, (d) Cr, (e) Ni, and (f) Pb. The black vertical dashed line represents the acceptable threshold (10−6). The blue background represents a negligible risk, and the red part represents a lifetime carcinogenicity risk.
Sustainability 18 02255 g005
Disclaimer/Publisher’s Note: The statements, opinions and data contained in all publications are solely those of the individual author(s) and contributor(s) and not of MDPI and/or the editor(s). MDPI and/or the editor(s) disclaim responsibility for any injury to people or property resulting from any ideas, methods, instructions or products referred to in the content.