Article

Physical Modeling of Hydrodynamics, Pore-Water Pressures, and Local Scour in a Sandy Seabed Around Pile Groups Under Regular Wave–Current and Irregular Wave Loading


1
College of Civil Engineering, Qingdao University of Technology, Qingdao 266033, China
2
Guangxi Laboratory on the Study of Coral Reefs in the South China Sea, Coral Reef Research Center of China, School of Marine Sciences, Guangxi University, Nanning 530004, China
3
College of Transportation and Civil Engineering, Shandong Jiaotong University, Jinan 250300, China
4
School of Engineering & Built Environment, Griffith University, Gold Coast Campus, Gold Coast, QLD 4222, Australia
*
Authors to whom correspondence should be addressed.
Sustainability 2026, 18(5), 2252; https://doi.org/10.3390/su18052252
Submission received: 5 January 2026 / Revised: 12 February 2026 / Accepted: 24 February 2026 / Published: 26 February 2026
(This article belongs to the Special Issue Marine Renewable Energy and Sustainable Ocean Resources)

Abstract

Seabed response and local scouring around pile groups under combined wave–current loading pose critical threats to the stability and long-term performance of offshore structures, particularly those supporting offshore renewable energy infrastructures. In this study, we present a systematic experimental investigation on the pore-water pressure and local scour around pile groups subjected to regular waves, combined regular wave–current conditions, and irregular waves generated using the JONSWAP spectrum under wave-only conditions. Pore-water pressures and seabed morphology were analyzed for different hydrodynamic conditions, pile spacings, and pile arrangements. The experimental results demonstrate that the presence and magnitude of current are the dominant factors controlling scour development. Increasing the current velocity from 0 to 0.25 m/s leads to a three (3) to five (5) times increase in maximum scour depth, whereas comparable variations in wave height and wave period produce relatively small effects. The direction of a current affects the location of maximum scour, with the wave–forward current condition promoting the development of an interconnected scour area within the pile array and wave–opposing current condition, shifting local scour toward downstream piles. Small-spaced piles ( G / D = 1) intensify hydrodynamic interactions and increase scour depth by approximately 30–40% compared with wider spacing. Irregular waves generate more spatially distributed but shallower scour than regular waves of comparable wave characteristics. These findings provide insights into the mechanisms governing seabed instability around pile group foundations and contribute to more sustainable design and operation of offshore infrastructure, such as offshore wind turbine foundations.

1. Introduction

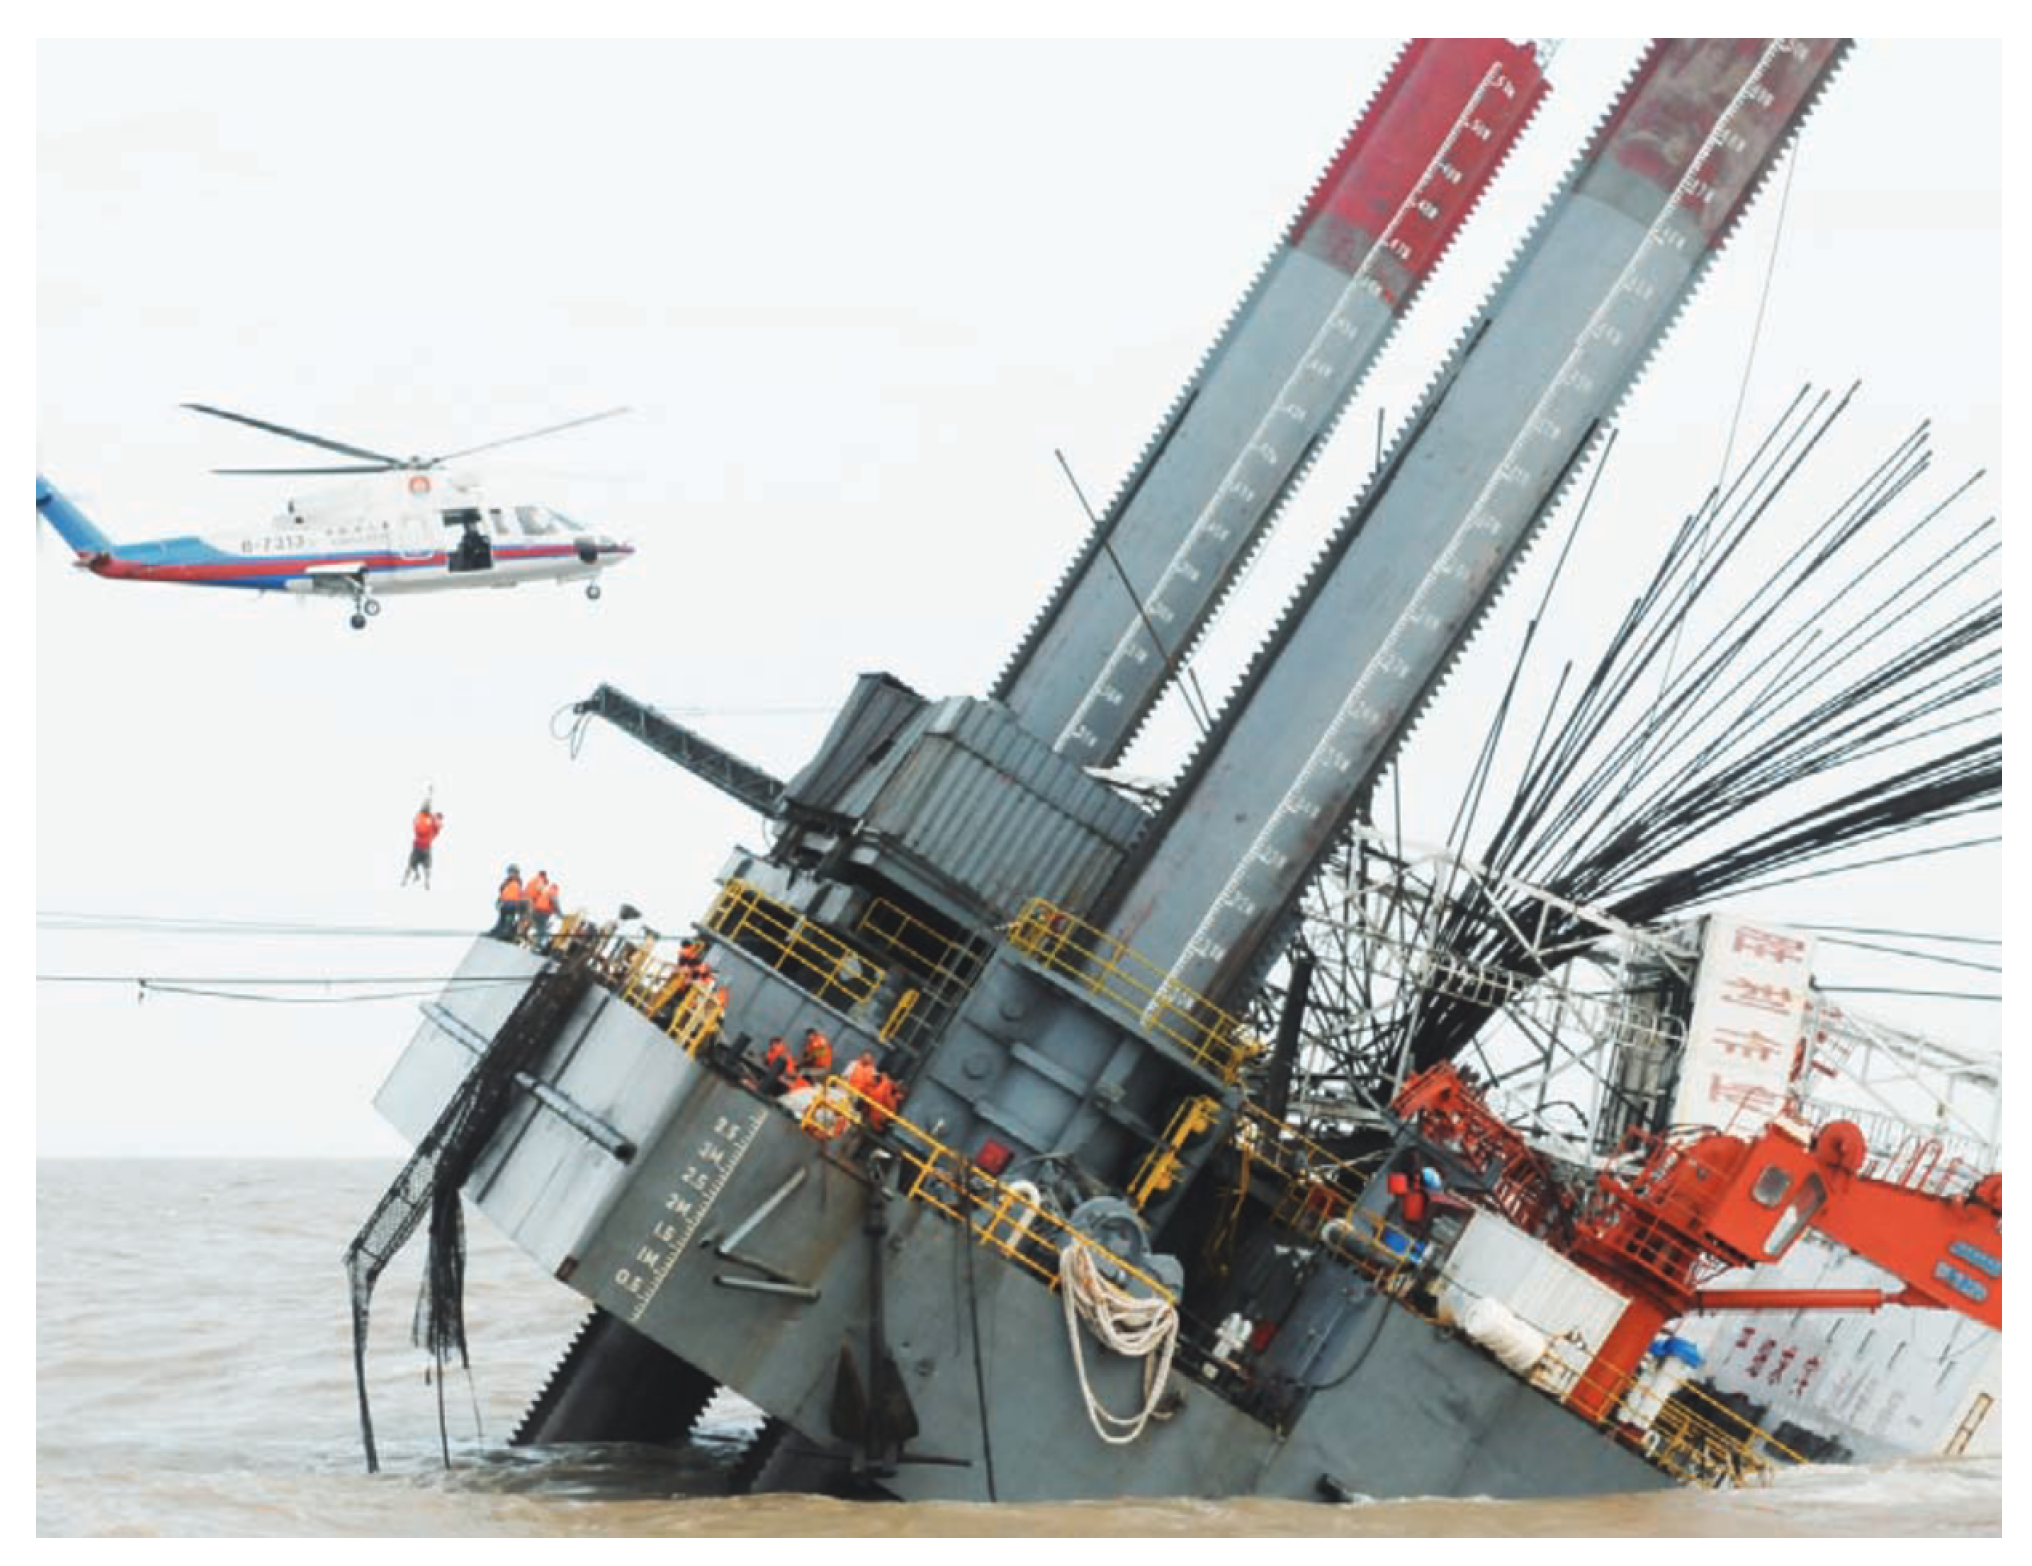
Pile group foundations have been widely used in coastal and offshore structures, such as offshore wind turbine foundation systems, offshore platforms, cross-sea bridges, port terminals, and other marine infrastructures [1]. In recent years, pile group foundations have become particularly important in offshore renewable energy developments, where long-term seabed stability is essential for ensuring structural safety, reducing maintenance requirements, and supporting sustainable energy production. These structures are frequently exposed to complex marine environments where waves and currents coexist. Meanwhile, with the growing engineering activities in marine environments, the stability of the seabed around pile group foundations has attracted great attention among scholars and engineers. One of the most critical threats to the stability of pile group foundations is local scour, which can lead to excessive exposure of the foundation and attached submarine cables, stiffness degradation, and even structural failure [2,3]. Excessive scour and seabed instability may compromise structural performance, increase maintenance demand, and reduce the service life of offshore energy infrastructures. One example is the severe failure that occurred at the No.3 offshore platform (pile group foundation) in the Shengli Oilfield in September 2010, which led to severe economic losses and casualties (Figure 1). Post-accident investigations further indicated that, under the action of wind, waves, and currents, the near-bed flow velocities were significantly increased, leading to severe local scour and partial liquefaction. These processes caused the loss of seabed bearing capacity, which, in turn, triggered the secondary sliding and tilting of the platform foundation (pile group foundation) [4].
Previous investigations into seabed response around pile foundations mainly focused on a mono-pile subjected to wave loading. Through wave flume experiments, Wang et al. [5] investigated wave-induced pore-water pressure within a sandy seabed around a single pile. Their results show that the pore-water pressure increases with increasing wave height and period; the wave period affects its spatial distribution, whereas the wave height acts only on the amplitude. Yang et al. [6] investigated the interaction between relatively shallow-water waves and currents and identified three distinct modes of variations in pore-water pressure in sandy seabeds under combined wave–current loading. Zhang et al. [7] studied pore-water pressures around a single pile under irregular wave conditions and reported that irregular waves induce a stronger seabed response than regular waves, with the most pronounced response associated with the Pierson–Moskowitz (P–M) spectrum. Similarly, Yu et al. [8] conducted comparative flume experiments under JONSWAP-spectrum-based random waves and regular waves, confirming substantial differences in the temporal evolution and magnitude of transient pore-water pressure between regular waves and random waves. Wang et al. [9] investigated the characteristics of pore-water pressures in sandy seabeds around a single pile and double piles under random waves. The pore-water pressure around the double piles increases with the increase in significant wave height and period, while it decreases with the increase in seabed depth. When the relative spacing ratio ( G / D , where G denotes the surface distance between two piles and D is the pile diameter) increases, the effect of the pile group weakens; if the front pile has a large incident angle and a large diameter, pore-water pressures will increase.
Local scour around mono-piles and pile groups has been extensively studied in the past [1,2,10]. To predict local scour around a single pile, numerous analytical and empirical models have been proposed. Dey [11] developed a time-dependent scour model based on the principle of sediment mass conservation, while Mia and Nago [12] proposed an alternative time-dependent framework using sediment transport theory. Additionally, Hong et al. [13] proposed an empirical formula for estimating the equilibrium scour depth by fitting experimental datasets from previous studies, which offers practical predictive value for engineering applications. More recently, Zhai [14] integrated hydrodynamic and seabed models into a conventional scour model within the OpenFOAM framework (PORO-FSSI-SCOUR-FOAM [15]) and further explored the influence of seepage on local scour around bridge piers. Through physical experiments conducted under pure wave conditions, Sumer et al. [16] and Kobayashi and Oda [17] found that the horseshoe vortex and the wake vortex are two key flow structures that induce local scour around piles, and the Keulegan–Carpenter number [18] is the dominant parameter that governs the depth of the scour.
In addition to the conventional mono-pile foundation, Lin et al. [19] numerically studied the near-field effects of a four-cylinder array on the seabed response under nonlinear waves. They found that these effects can increase seabed liquefaction around the structure to 1.05 to 1.2 times that of a single pile under the same wave parameters, and the liquefaction potential in the central region of the matrix is significantly higher than that in the outer regions. Wei et al. [20] investigated oscillatory pore-water pressure and transient liquefaction around jacket structures under combined wave–current action. Their results revealed that smaller pile spacing leads to deeper seabed liquefaction and that the presence of currents introduces pronounced differences in liquefaction potential between upstream and downstream piles.
Beyond wave-induced local scour around pile foundations, current-induced local scour has also been extensively investigated through wave flume experiments. Among these studies, Liang et al. [21] conducted unidirectional flow tests in single piles, in-line piles, side-by-side piles, and 3 × 3 pile groups, aiming to elucidate the mechanisms of hydrodynamic interaction between adjacent piles. Their findings revealed that turbulent interactions and wake interference effects result in significant variations in the geometric characteristics of scour pits. Ji et al. [22] examined the evolution process for scour under bidirectional flow conditions through physical modeling, finding that the scour process begins with a rapid development stage, followed by a gradual deceleration phase, and finally reaches a stable equilibrium state. At the equilibrium stage, scour pits form around each individual pile and pair together; in particular, the external width of these interconnected pits is substantially larger than their internal width.
In contrast to the extensive literature on steady currents and wave-only conditions, the number of studies addressing local scour under combined wave–current loading is comparatively limited. Qi et al. [23] experimentally investigated the coupled effects of incident flow angle, pile spacing, and pile number on equilibrium scour depth. Their results showed that under combined wave–current loading, the influence of pile spacing on local scour is more pronounced for parallel pile arrangements than for in-line configurations, highlighting the role of pile group geometry in modulating scour development. Much previous research has established that the ultimate scour potential around cylindrical structures is strongly correlated with the Keulegan–Carpenter (KC) number and is largely independent of seabed soil properties. Corvaro et al. [24] conducted wave flume experiments to examine the hydrodynamic field and associated scour morphology around a single pile under combined wave–current conditions. Based on their results, a quantitative relationship was proposed between the KC number and the maximum scour depth. It should be noted, however, that this relationship was derived for single-pile configurations and cannot be directly extended to pile groups, where pile–pile interaction significantly alters flow and scour mechanisms. Sumer and Fredsøe [25] proposed the velocity ratio ( U c w = U c / ( U c + U m ) ) as a key parameter for systematically investigating local scour under combined wave–current action, where U c denotes the undisturbed current velocity, while U m represents the maximum undisturbed orbital velocity on the seabed surface. Their experimental results demonstrated that local scour development is governed primarily by two key parameters, namely the KC number and the velocity ratio ( U c w ). In addition to seabed scour around pile foundations, Zhao et al. [26] also conducted research on seabed scour around pipelines under combined wave–current conditions. They focused on investigating the seabed response characteristics and scour evolution laws for pipelines on seabeds with different clay contents (CCs) and proposed a predictive formula for equilibrium scour depth incorporating clay content (CC), the Keulegan–Carpenter number (KC), and the Shields parameter ( θ ).
Moreover, the majority of available studies focus on mono-pile, while pile group foundations have received relatively limited attention. Sumer and Fredsøe [27] conducted systematic experiments covering seven different pile group configurations, aiming to assess the effects of the pile spacing ratio ( G / D ) and the KC number on the equilibrium scour depth. Their findings indicated that when the pile spacing ratio G / D is less than 0.1, the group-scale scour behavior can be approximated as that of a single equivalent pile. The maximum scour depth was observed in the case of two side-by-side piles, where the corresponding KC number was approximately ten times that of a single pile under the same hydrodynamic conditions. For three-pile assemblies or 4 × 4 pile groups, the equilibrium scour depth was found to be highly sensitive to both the pile arrangement pattern and the spacing ratio. Amini et al. [28] and Bayram and Larson [29] further elucidated the underlying mechanisms through which pile spacing and layout patterns influence the magnitude and spatial extent of local scour. They developed empirical predictive equations that correlate the G / D ratio and pile arrangement with the local scour depth. Their research findings revealed that when the pile spacing ratio G / D is less than 5, the geometric morphology of the scour pits around the individual piles within the group differs significantly from that around an isolated single pile, which is indicative of strong hydrodynamic interactions between the piles.
Extensive studies have been carried out to investigate seabed response and local scour around pile-type foundations. However, existing studies differ considerably in terms of loading conditions, structural configurations, and response variables considered. A comparison of previous experimental research on local scour around pile foundations and the present study is listed in Table 1.
The above review and comparison indicate that, despite extensive research on the seabed response and local scour around pile foundations, comprehensive understanding of pore pressure response and local scour around pile groups under combined wave–current and irregular wave loadings remains limited. The relative importance of steady currents compared with wave parameters, as well as the roles of pile spacing and pile arrangement in governing scour development around pile groups, have not yet been clearly investigated through experimental tests. Motivated by these gaps, in this study, we conducted a series of systematic flume experiments to investigate the wave/current-induced pore-water pressure response and the local scour around pile groups. Regular waves, combined wave–current conditions with different current directions, and irregular waves generated using the JONSWAP spectrum were considered. The effects of pile spacing and pile arrangement were examined.
The remainder of the study is organized as follows. In Section 2, the experimental facility, the design of the experiments, and the experimental procedures are described. The experimental results are presented and discussed in Section 3, including hydrodynamics (wave profiles and dynamic wave pressures acting on piles), pore-water pressure around pile groups, local scour around pile groups, and the effects of different pile group arrangements under combined regular wave/current loading. Irregular wave loading is discussed in Section 3.5. Finally, the key findings of the experimental results are summarized in Section 4.

2. Experimental Design

2.1. Experimental Facility

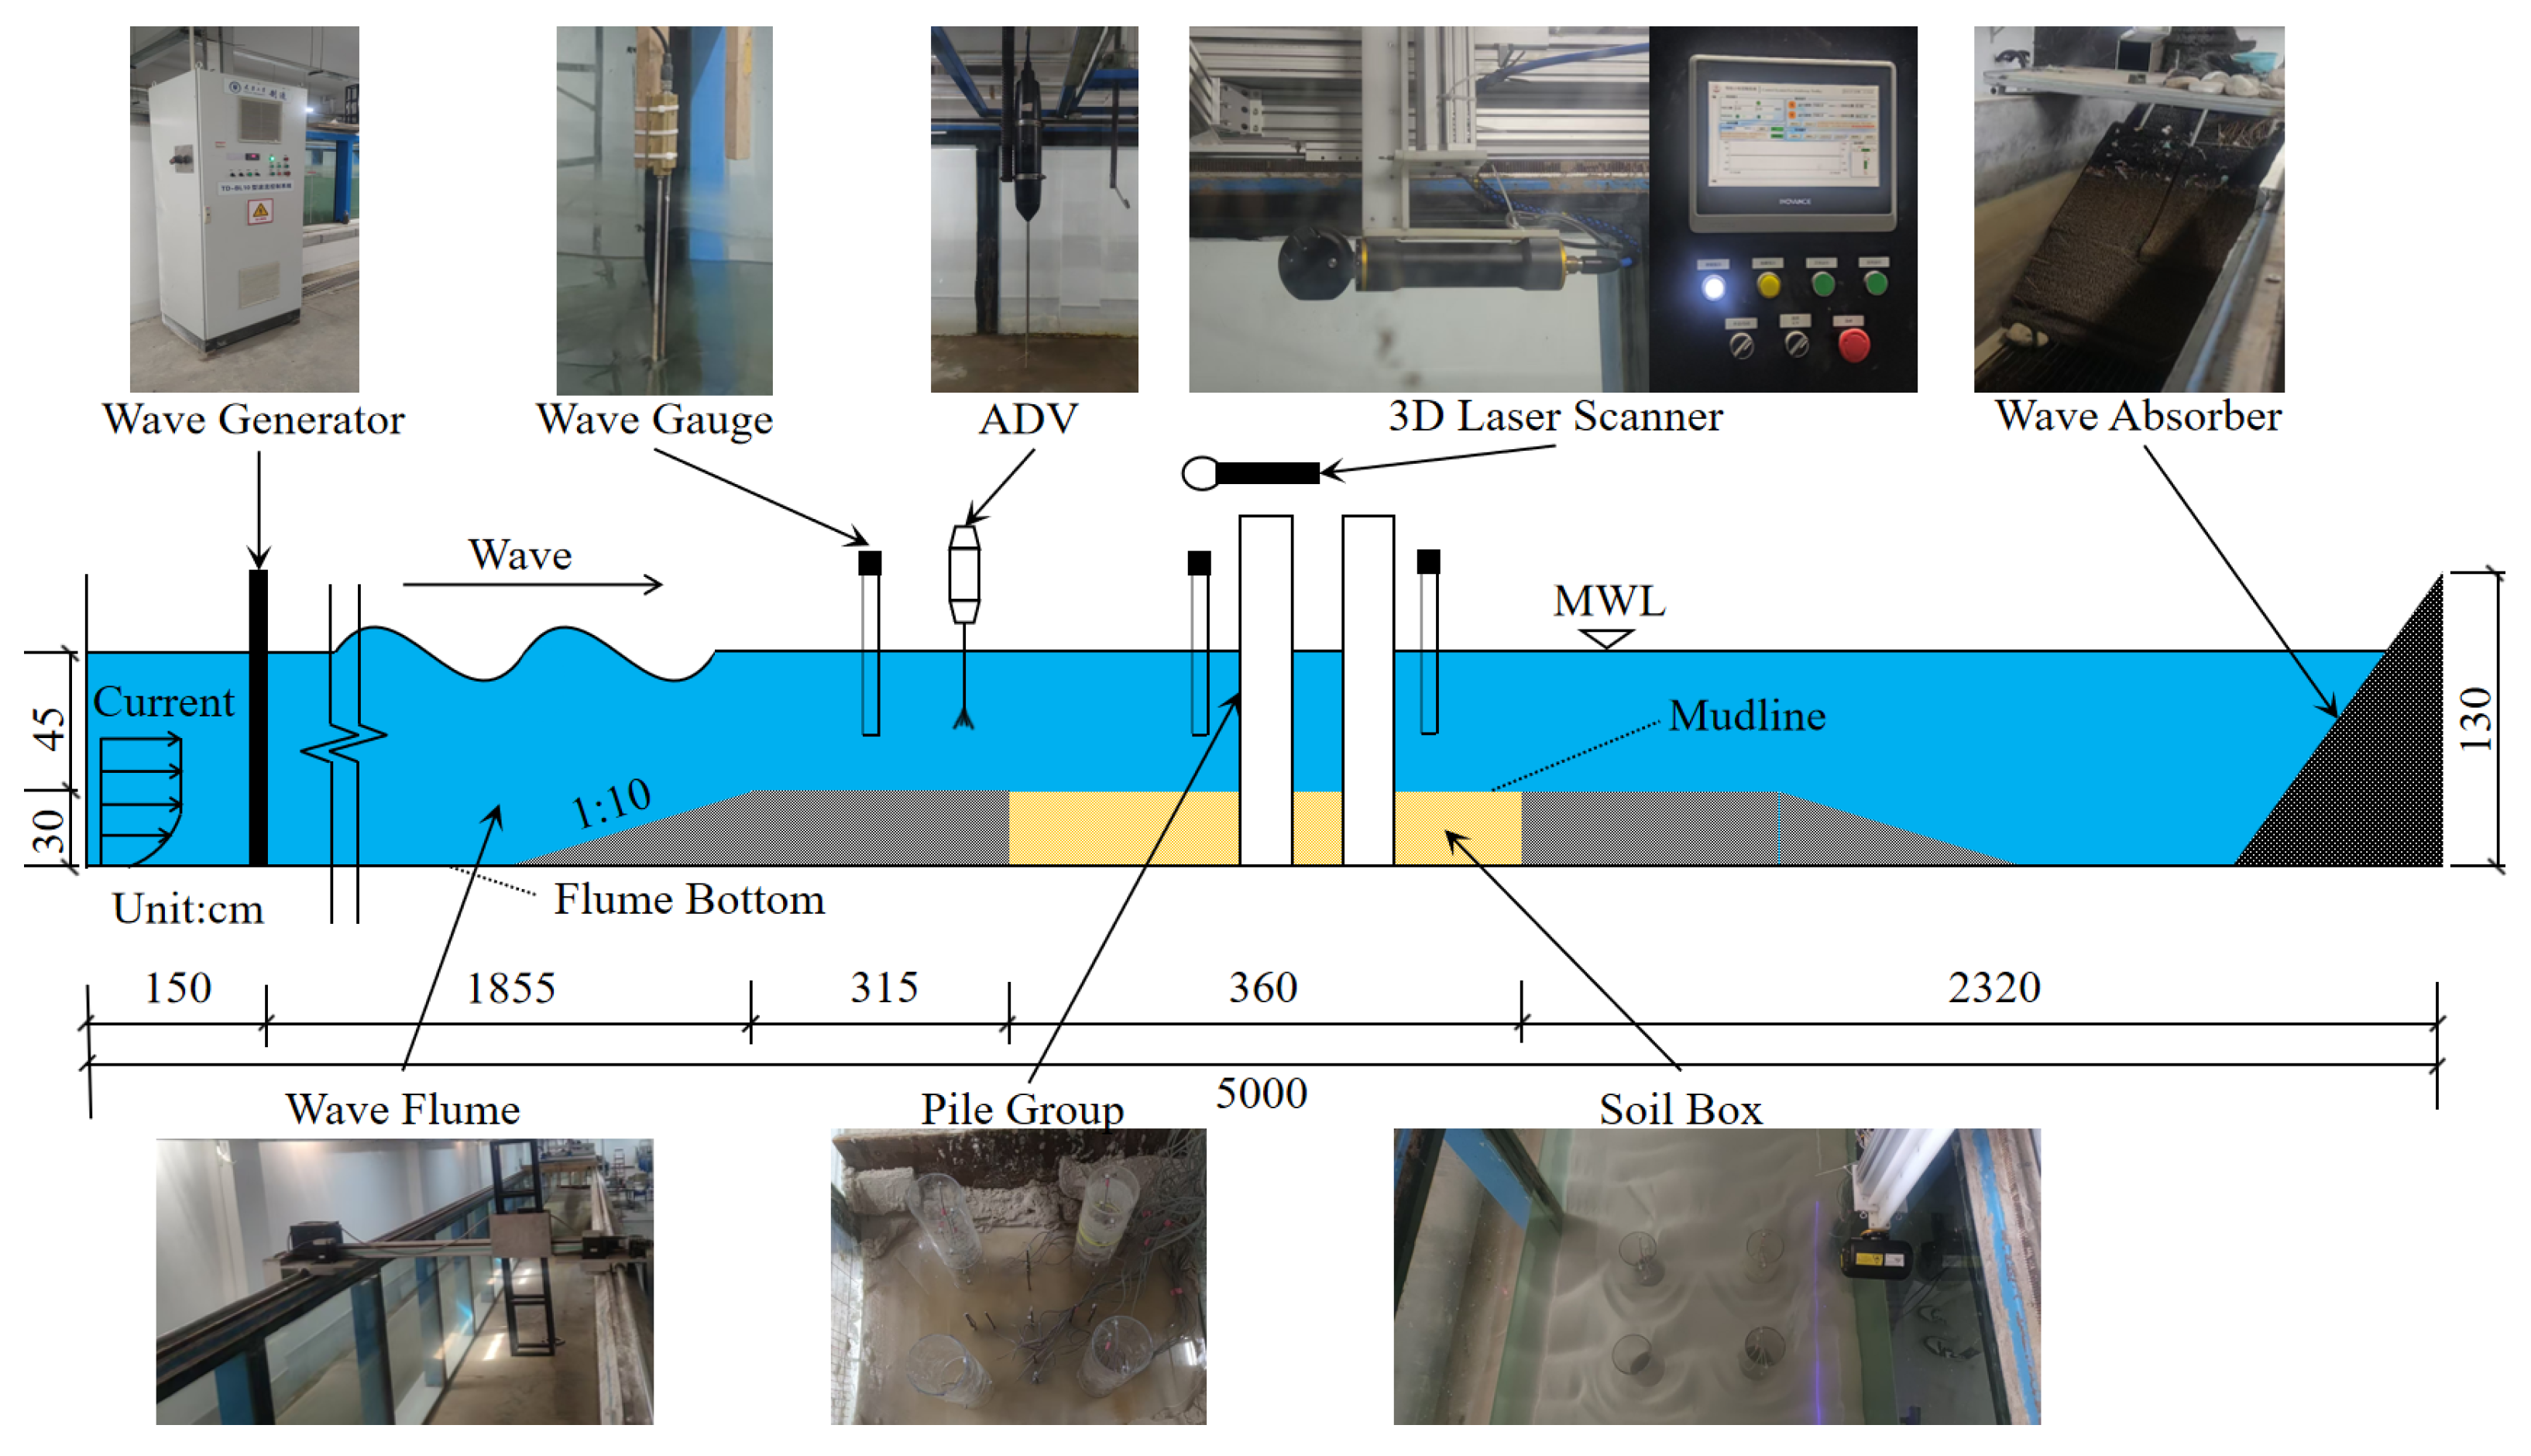
The experiments were conducted at the Port and Maritime Hydrodynamics Laboratory of Shandong Jiaotong University. The wave–current flume is 50 m long, 1.2 m wide, and 1.3 m high, featuring transparent acrylic panels on both sides to enable the real-time monitoring of the test process, as shown in Figure 2. The facility was equipped with a piston-type wave maker and a current circulation system. A sediment tank is located in the middle section of the flume, with cement cast on both sides with a slope of 1:10. The sediment bed, measuring 3.6 m long and 0.30 m thick, consisted of sand with a median particle size ( d 50 ) of 0.37 mm. For the scour experiments, acrylic tubes with diameters (D) of 13.5 cm were used as model piles. These piles were instrumented with sensors along their surfaces and then vertically embedded in the sand bed, located 23.7 m downstream of the wave generator. The experiments were carried out at a still water depth (h) of 0.45 m. Additionally, a passive wave absorber (i.e., energy dissipation net) was installed at the flume outlet to reduce wave reflection and minimize interference with the experimental results.
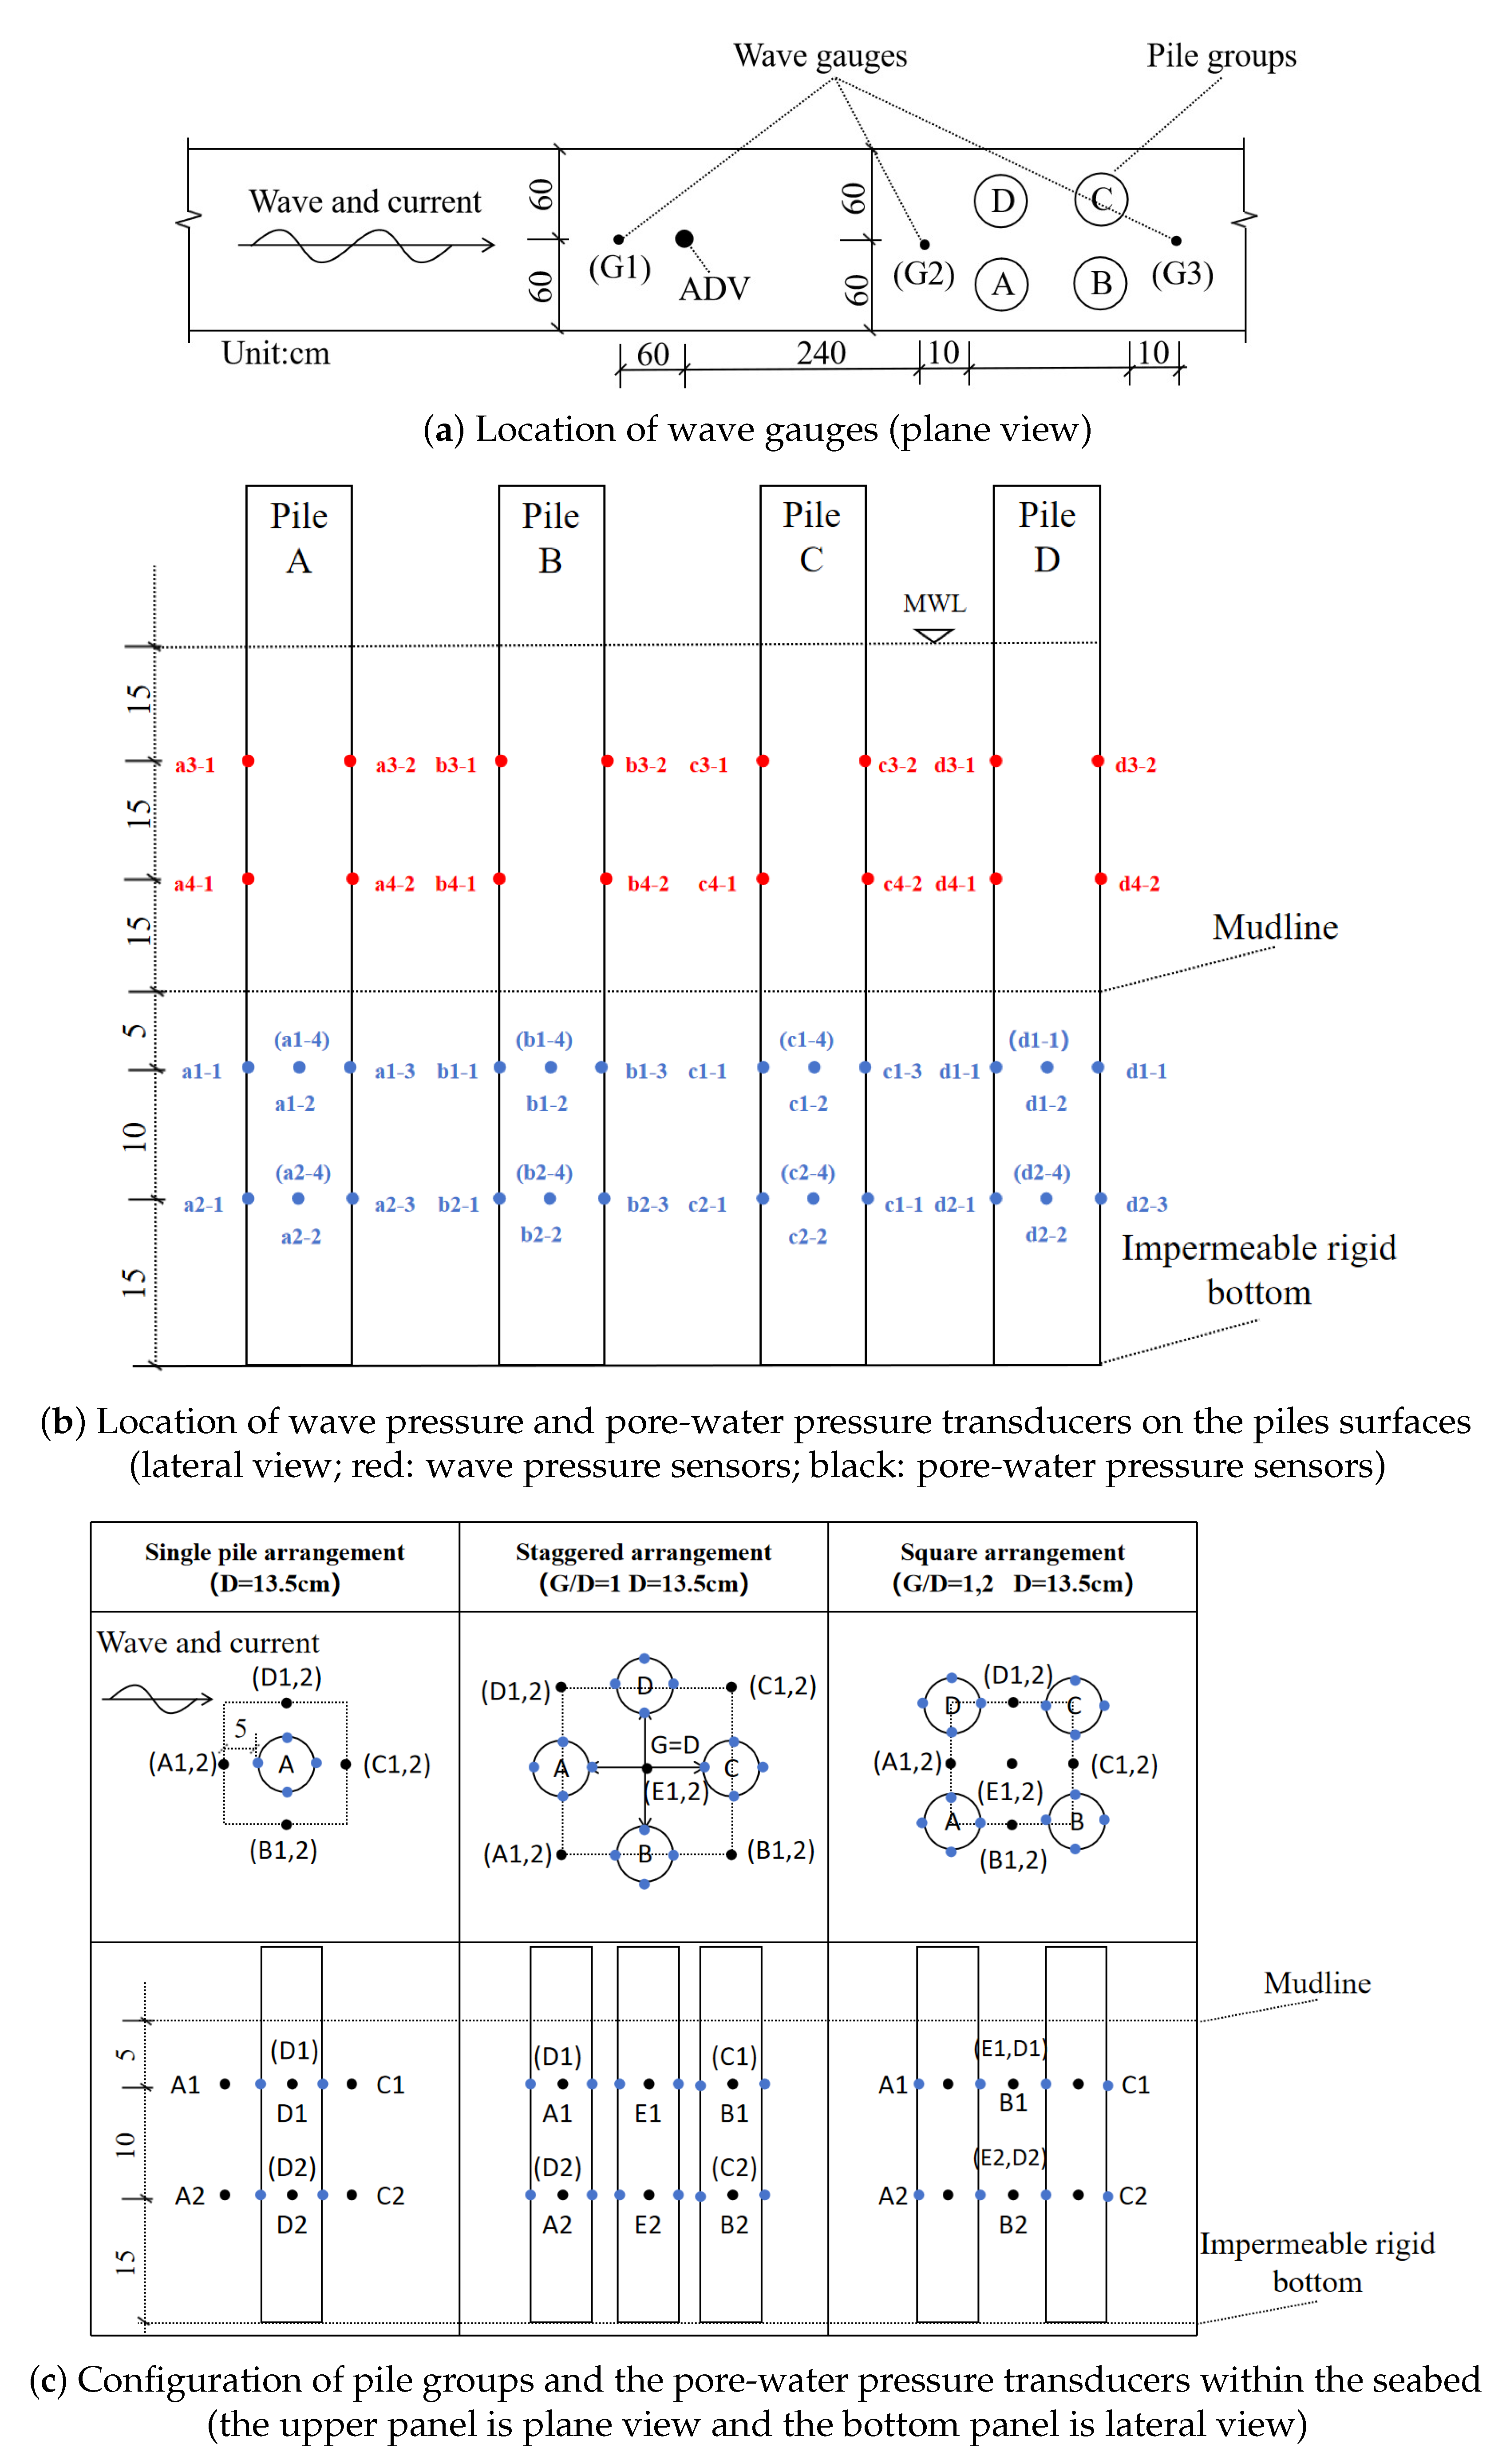
As shown in Figure 3, the measuring instruments used in the tests include the following:
  • Wave gauges: Three wave gauges (G1, G2, and G3; Model YWS200-WXX, Chengdu Yufan Technology Co., Ltd., Chengdu, China) were installed to measure the elevation of the water surface in time, as shown in Figure 3a. These wave gauges have a measurement range of 0–0.60 m and an accuracy of ±0.5%. The G1 wave gauge was positioned to measure the height of the incident wave, while other G2 and G3 wave gauges were placed 10 cm upstream and downstream of the pile model, respectively.
  • Wave pressure transducers: Sixteen wave pressure sensors (model CY302, Chengdu Dasheng Yingji Co., Ltd., Chengdu, China; points a3-1 to d4-2) were mounted on the pile surface to measure dynamic wave pressures. These transducers have an outer diameter of 6 mm, a measurement range of 0–20 kPa, and a precision of ±0.01%. As shown in Figure 3b, they were arranged in vertical intervals of 15 cm on both the upstream and downstream sides, starting 15 cm above the surface of the seabed.
  • Pore-water pressure transducers: A total of forty-two pore-water pressure transducers (model CY303, Chengdu Dasheng Yingji Co., Ltd., Chengdu, China) were used to monitor pore-water pressure within the seabed, as shown in Figure 3b. The pore-water pressure transducers have an outer diameter of 8 mm, a measurement range of 0–30 kPa, and an accuracy of ±0.01%. The arrangement consists of the following: (1) ten sensors embedded within the seabed in the gaps between piles, distributed across two layers at depths of 5 cm and 15 cm (denoted as Ai, Bi, Ci, Di and Ei, for which “i” is 1 or 2, referring to the first layer or the second layer); (2) thirty-two sensors mounted on the pile surfaces, arranged in two layers with four sensors per layer, spaced 10 cm apart vertically (denoted as ai–j, bi–j, ci–j, di–j, for which “i” is a similar index to that above, referring to two layers on the pile surface, while “j” is 1, 2, 3 or 4, referring to four different sensors within the same layer). The arrangement is employed to capture the distributions of the pore-water pressures in both horizontal and vertical directions, which has not been carried out in most previous experimental studies due to the limited number of transducers used [23,30,31].
  • ADV: An Acoustic Doppler Velocimeter (ADV, Nortek AS, Norway; range—±1.4 m/s; accuracy—±0.5% of the measured value plus ±1 mm/s) was used to measure current velocity U c .
  • Three-dimensional laser scanner: A GoPro camera was used to record the progress of the scouring process. To quantify topographic changes, the sand bed was leveled prior to each test. Following each scouring event, an underwater 3D laser scanner was mounted. The scanner (Model—Insight Nano, Voyis company, Canada; scanning range—0.13–1.0 m; accuracy—0.3 mm in the x- and y-directions, respectively, 0.1 mm in the z-direction, when the water depth is less than 0.5 m) was used to scan and record the seabed morphology.

2.2. Soil Sample

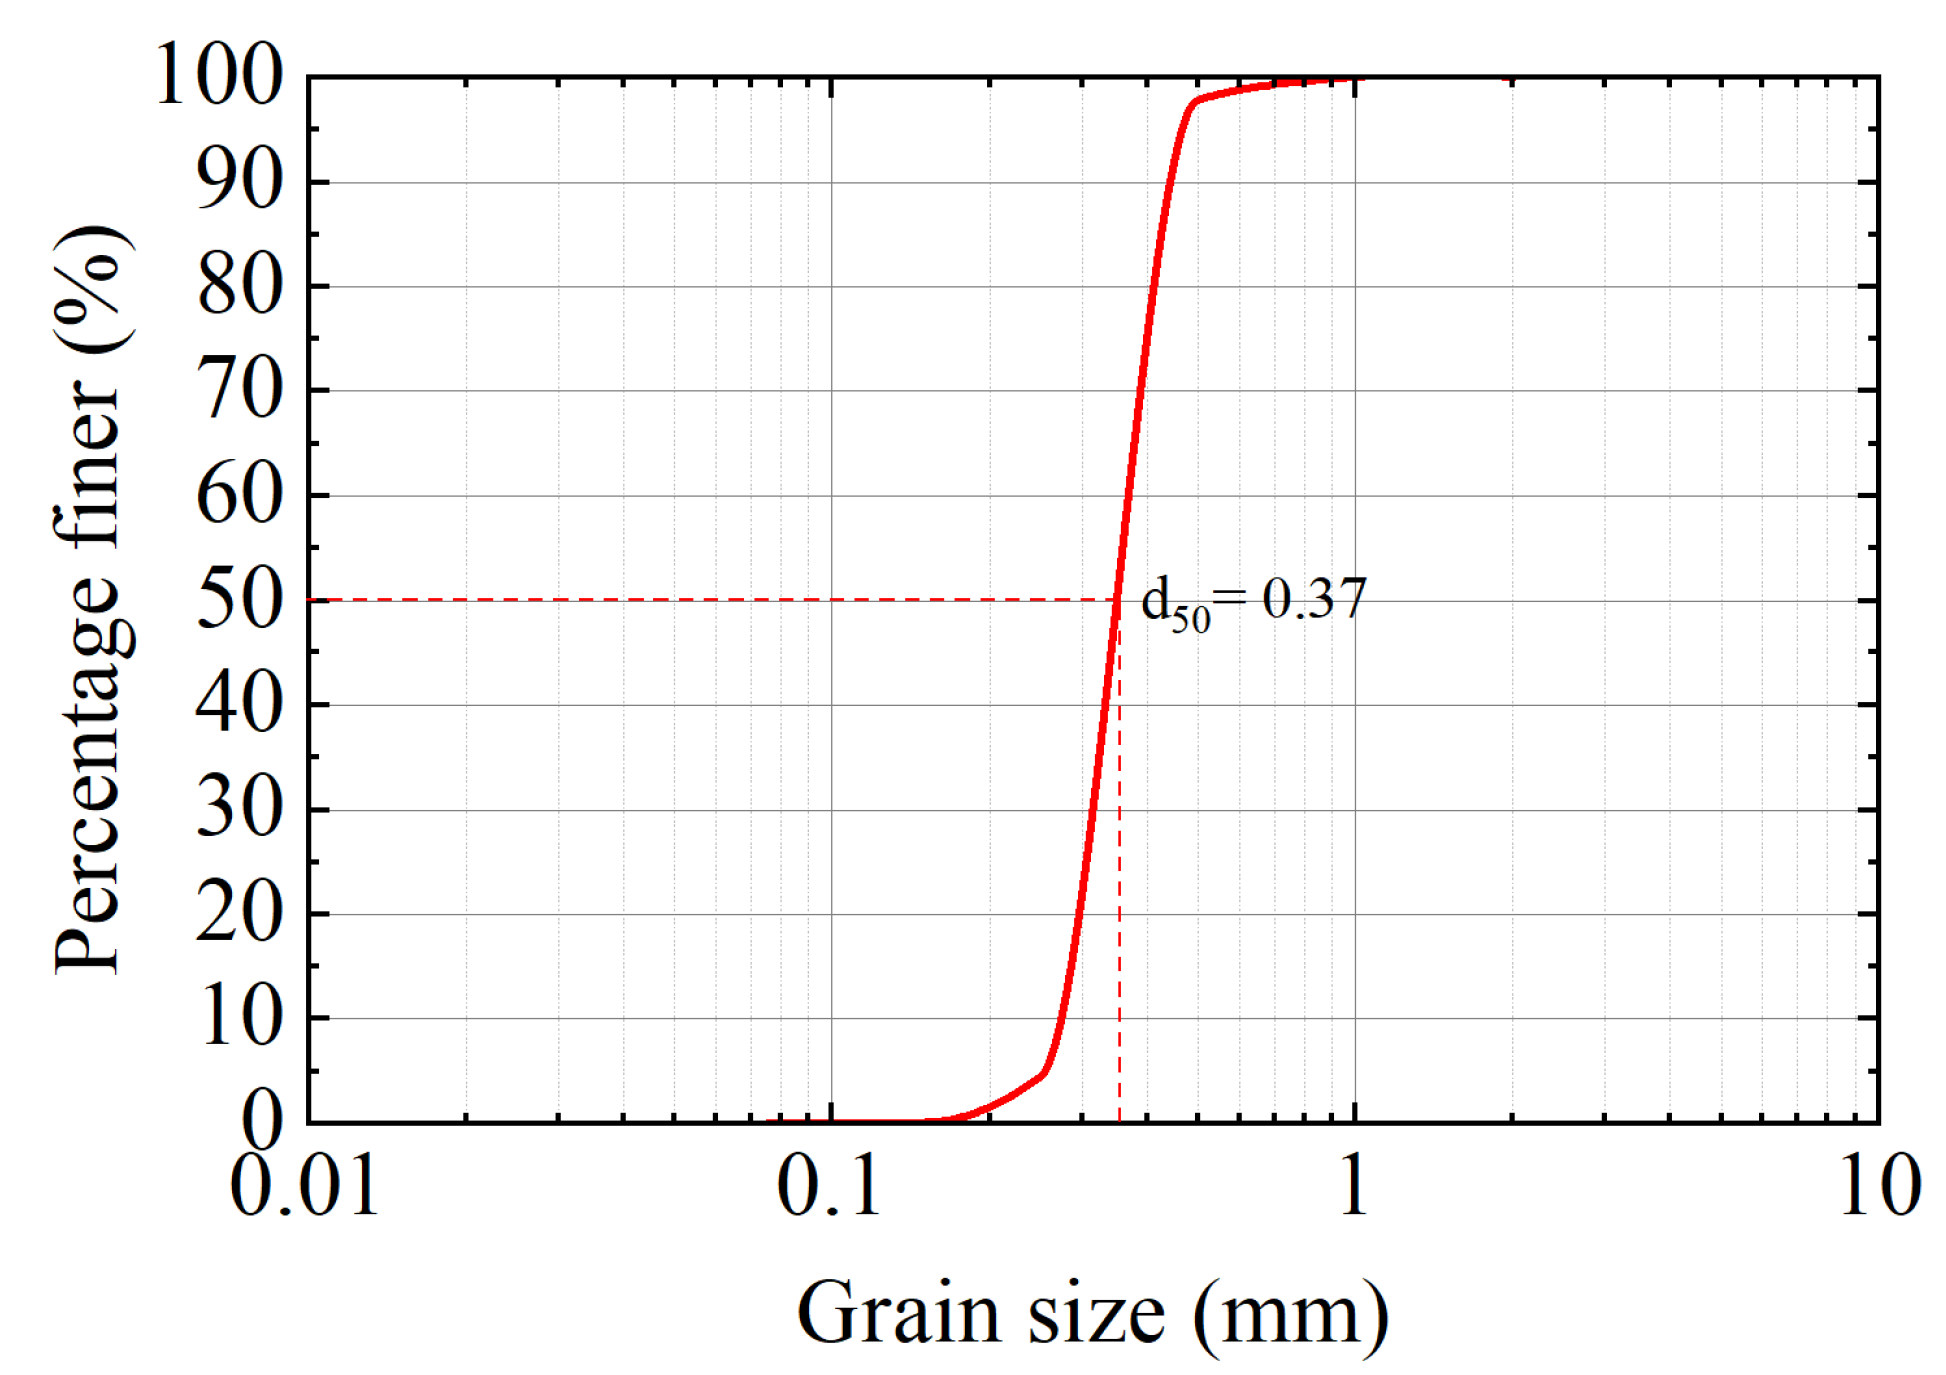
In this study, quartz sand was used and the particle size distribution was determined via standard sieving analysis. As shown in Figure 4, the median grain size ( d 50 ) is 0.37 mm. In addition, d 10 = 0.26 mm, d 30 = 0.32 mm, and d 60 = 0.40 mm (the particle diameters corresponding to 10 % , 30 % , and 60 % of the soil mass fraction). Based on these definitions, the uniformity coefficient ( C u = d 60 / d 10 ) was calculated to be 1.54, and the curvature coefficient ( C c = d 30 2 / ( d 60 d 10 ) ) was found to be 0.98. Other soil parameters are shown in Table 2.
The dry density of the soil sample ( ρ d ) was measured using the cutting ring method, while the maximum dry density ( ρ d   max ) and the minimum dry density ( ρ d   min ) of the soil samples were measured via relative density testing. The specific gravity of the soil particles ( G s ) was determined using the pycnometer method. The porosity of the soil sample, n, was calculated using the formula n = e / ( 1 + e ) , where e is the void ratio. The void ratio was calculated from the measured dry density and particle specific gravity. The permeability coefficient of the soil sample ( k s ) was determined through constant head permeability tests. Regarding other mechanical parameters, the elastic modulus (E) of the soil was directly determined via triaxial tests. Accounting for the compatibility of the test conditions with engineering experience, the Poisson ratio ( μ ) of the soil was determined using empirical values. The Poisson ratio ( μ ) of the sand was assumed to be 0.3, which is a commonly adopted empirical value for medium-to-dense quartz sands [2,32]. The shear modulus (G) of the soil was calculated using the relationship between the elastic modulus (E) and the Poisson ratio ( μ ) with G = E / 2 ( 1 + μ ) .
Based on dry densities, the relative density of soil was determined via
D r = ρ d ρ d   min ρ d   max ρ d   max ρ d   min ρ d .

2.3. Hydrodynamic Conditions

In this study, three hydrodynamic load scenarios are considered. They are (1) regular wave, (2) combined regular wave, and steady current (3) irregular wave. The test conditions are outlined in Table 3. Nine independent test cases were conducted in this experimental program. For each hydrodynamic condition, only one experimental test was performed due to the large-scale physical modeling and extended duration required for each test. We acknowledge that the absence of repeated tests may have introduced uncertainty [33,34,35]. All tests were conducted via the same experimental protocol to ensure consistency. In the table, the maximum combined wave and current velocity ( U m ) are shown, determined via U m = U w + U c , where U c represents the mean velocities of the current and wave orbital velocity components determined via the second Stokes wave theory as follows [36]:
U w = π H T sinh k h + 3 4 π 2 H 2 T L sinh 4 k h ,
where H is the wave height, T is the period and the wave number (k) is defined as k = 2 π / L (L is the wavelength), and h is the still water depth.
In (2), the wave number under a combined wave and current can be determined via the wave dispersion relation [37]
( ω k U c ) 2 = g k tanh ( k h ) ,
where ω (= 2 π / T ) is the wave angular frequency, and g = 9.8 m/s2 is the acceleration of gravity.
The Reynolds number R e for the flow around the piles is determined via
R e = U m D ν
where the kinematic viscosity of the water is ν = 10 6 m2/s, while D is the diameter of the pile.
The KC number (Keulegan–Carpenter number) is defined as follows [18]:
K C = U m T D ,
and the Shields parameter is defined as follows [38,39]:
θ = U m 2 g ( s 1 ) d 50 .
The critical Shields parameter ( θ c r ) is an important dimensionless index used to determine whether sediment particles start to move under the action of water flow, and it is widely applied in research on sediment transport and bed scouring [2]. When θ > θ c , lived-bed scour ensures that the sediment is moved away and a scour hole is formed. The critical Shields number ( θ c r ) is determined via the following empirical formula [40,41]:
θ c r = 0.3 1 + 1.2 D * + 0.055 1 exp 0.02 D * , D * = g ( s 1 ) ν 2 1 / 3 d 50 .
Based on (7), the critical Shields parameter ( θ c r ) of the sand samples for this experiment is 0.034.
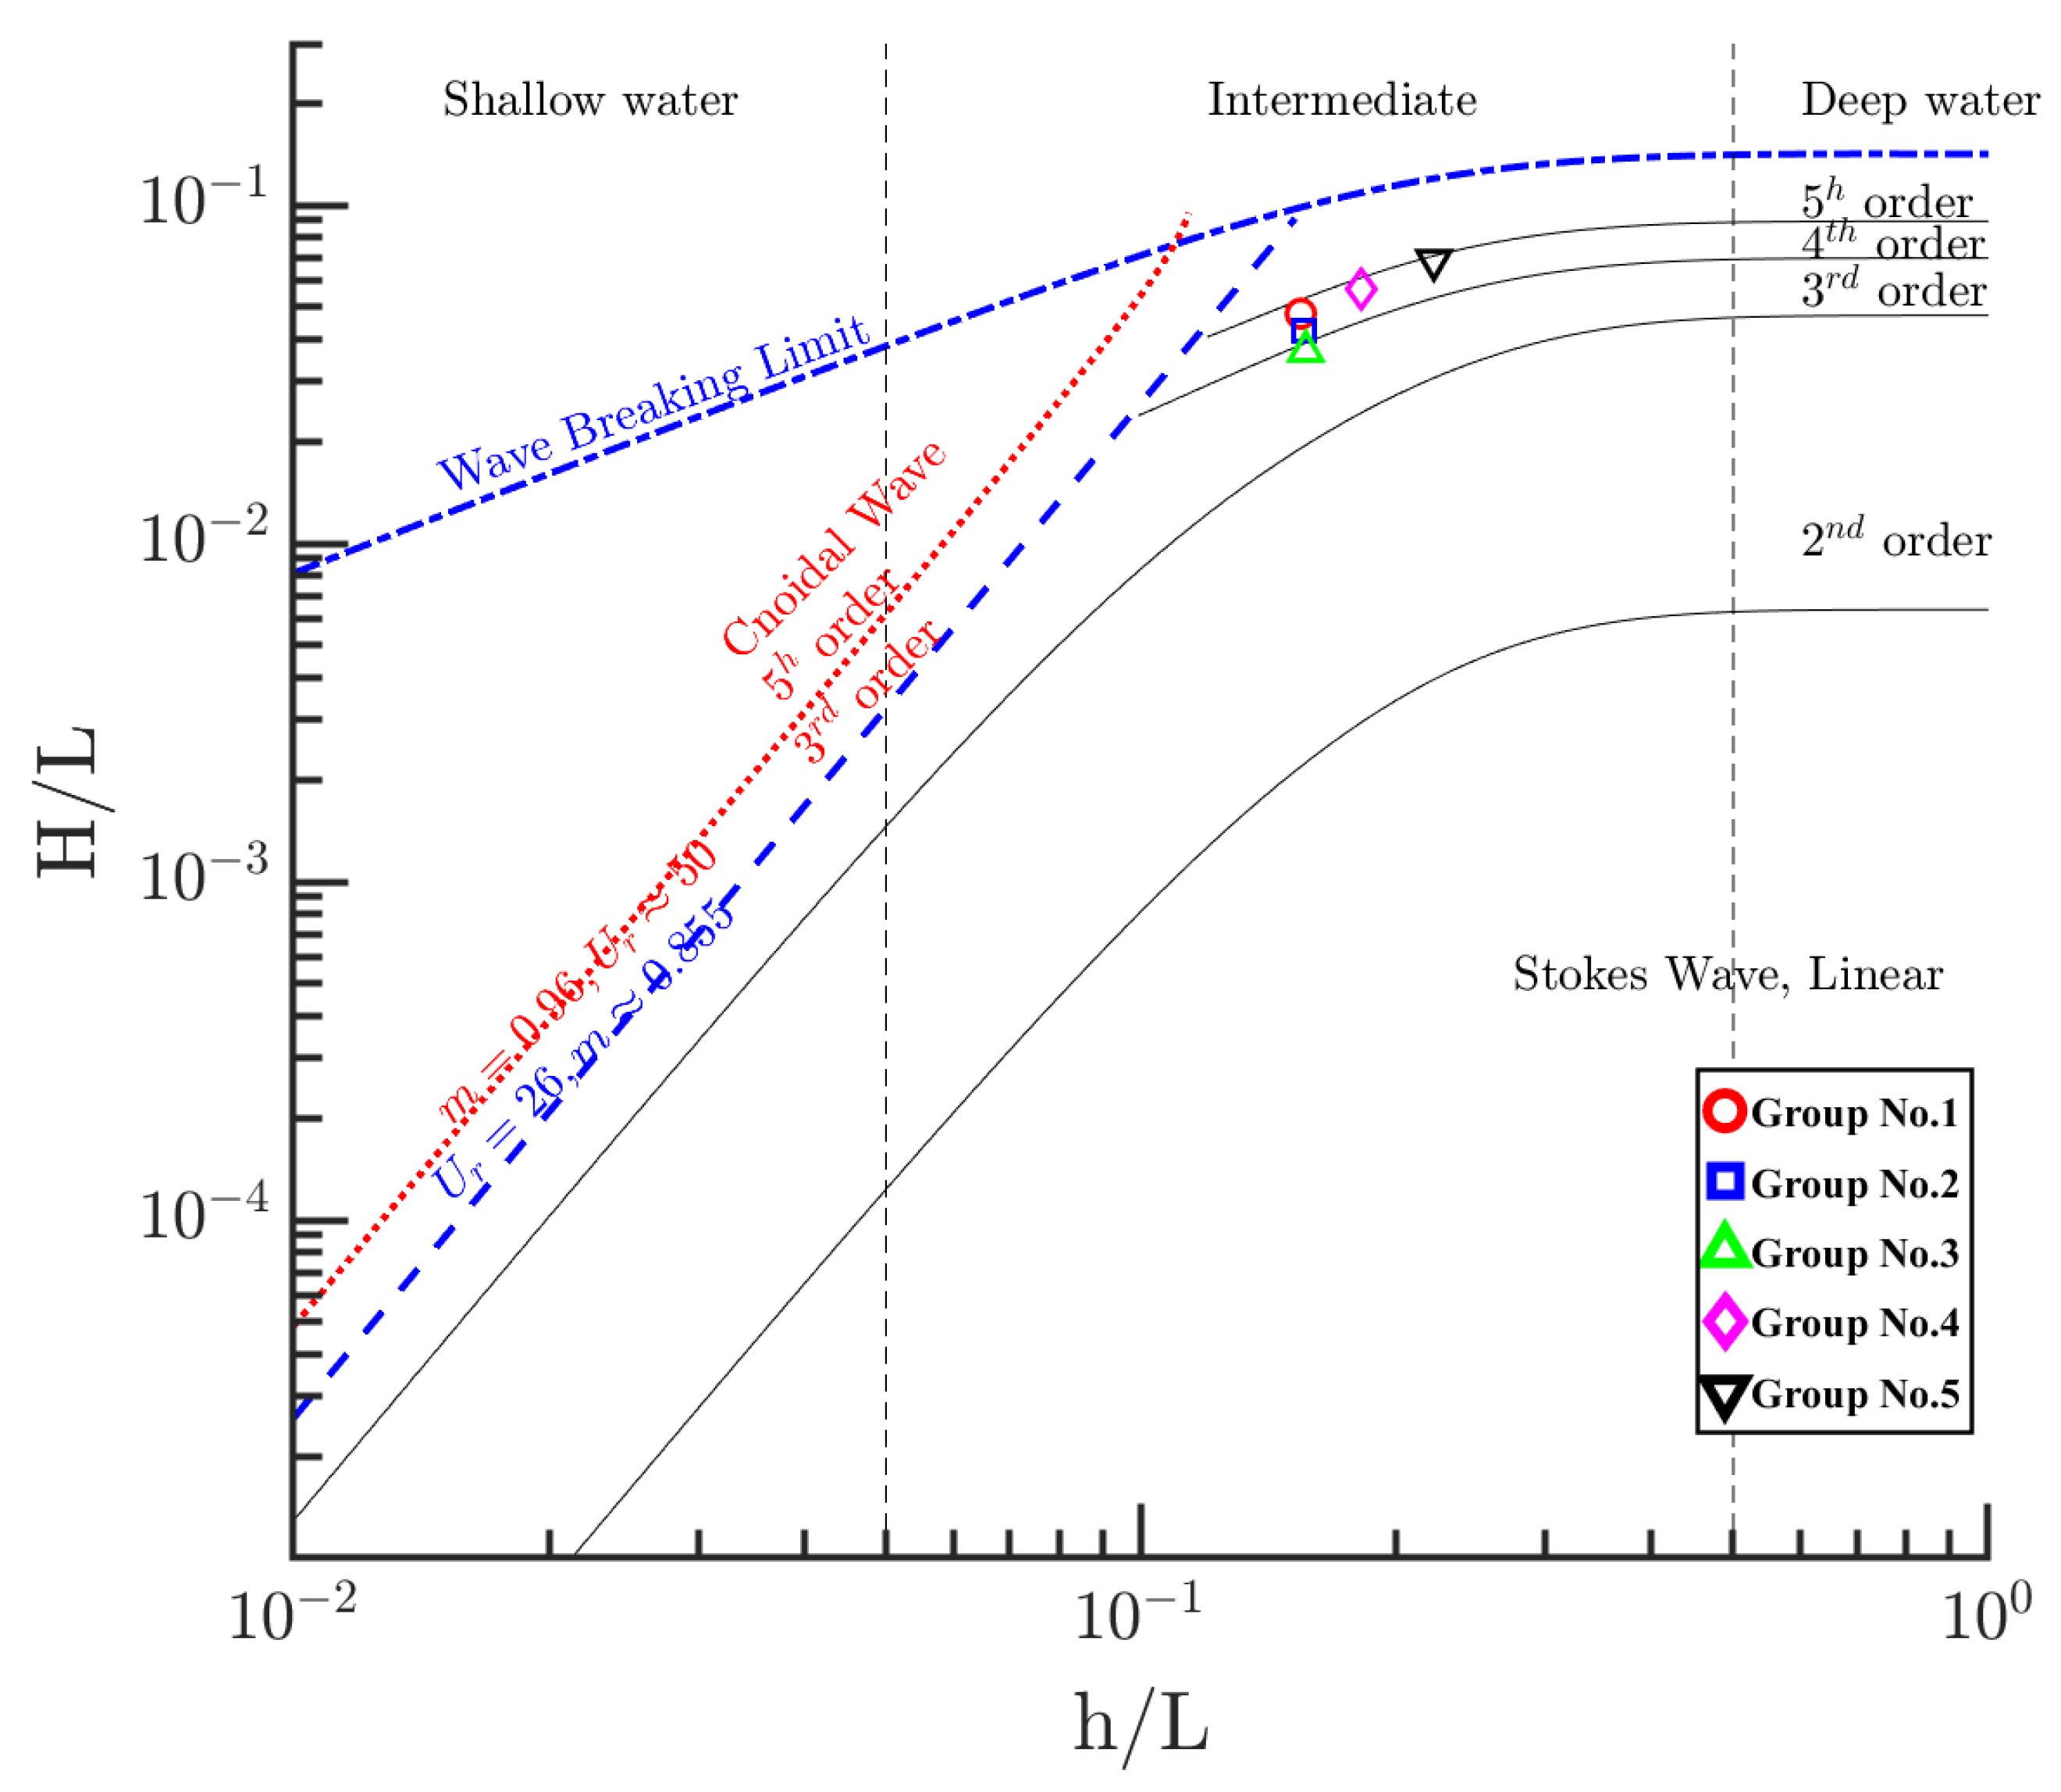
Based on the tested wave conditions listed in Table 3, the relative wave steepness H / L ranges from approximately 0.034 to 0.075. According to classical linear and finite-amplitude wave theories, these values correspond to shallow-to-intermediate water wave conditions, where both wave-induced orbital motion and water depth significantly influence near-bed hydrodynamics [36]. Under intermediate water conditions, wave–seabed interactions remain pronounced, and the combined effects of waves and steady currents play an important role in controlling near-bed velocities, bed shear stress, and sediment mobilization, which are directly relevant to scour development around pile groups.
The selected non-dimensional parameters represent typical hydrodynamics and sediment transport conditions relevant to offshore and coastal engineering applications. The Reynolds number associated with the pile diameter is sufficiently large to ensure fully turbulent flow around the piles. The Keulegan–Carpenter number covers regimes where both oscillatory wave motion and steady current effects contribute to vortex formation and scour development. The Shields parameter covers conditions for live-bed scour regimes, allowing the systematic examination of scour initiation and evolution under combined wave–current loading.
Irregular wave loading was included in this study to provide a comparative assessment of seabed response and scour characteristics under stochastic wave conditions relative to regular waves with comparable representative parameters. Only one irregular wave test was conducted, and irregular waves were not combined with steady currents to isolate the fundamental effects of wave randomness on pore-water pressure response and scour development. Introducing combined irregular wave–current loading would significantly increase the complexity of the flow field and sediment response. Our experimental design, therefore, prioritized mechanistic clarity and controlled comparison. Investigating combined irregular wave–current loading is recognized as an important topic for future studies and will be addressed in subsequent research.
For the regular wave tests, each run had eight durations (900 s for each duration, with 2 h in total for a run), with each duration corresponding to approximately 450–750 wave cycles depending on the wave period. For the irregular wave test, eight durations of 900 s were generated based on the JONSWAP spectrum, ensuring sufficient statistical convergence of the stochastic wave characteristics.
In addition, the steady current in the flume was generated using a recirculation system. The system consists of a variable-speed circulation pump, allowing the current velocity to be adjusted and maintained at a prescribed level. Flow enters the test section uniformly from the upstream end and is returned downstream through the recirculation channel. To minimize flow non-uniformity and large-scale turbulence, flow straighteners were installed upstream of the test section. Prior to each test, the current velocity was calibrated and monitored using an Acoustic Doppler Velocimeter (ADV) to ensure a stable and quasi-uniform velocity.

2.4. Experimental Procedure

The experimental procedure used in this study is outlined below:
(1)
Transducer layout and preprocessing: As shown in Figure 3a, four pile foundation models were placed at the center of the flume, avoiding interference from the flume walls. Instrumentation ports were pre-drilled on the surface of each pile to accommodate wave pressure and pore-water pressure transducers. Ten pore-water pressure transducers were fixed to steel brackets and buried in the seabed at specified depths. A wooden frame was erected above the flume to mount three wave gauges at their designated calibration positions. To ensure data accuracy, all transducers were soaked for at least 24 h prior to the removal of air bubbles and to prevent signal distortion.
(2)
Sediment filling and bed preparation: Following the calibration and placement of the piles and transducers, the sediment pit was filled. Pre-screened quartz sand was gradually added in batches to minimize impact forces that could cause transducer displacement or pile tilting. Once filled, water was slowly introduced to submerge the sand bed. The tank was then left to stand for at least 24 h to ensure the complete consolidation of a sandy bed. Upon full consolidation, the sand bed was leveled with a scraper, ensuring that the area around the test piles was at the same level as the entire sand tank.
(3)
Water filling: After seabed consolidation, a secondary injection of water was performed. The flow rate was strictly controlled using low-velocity pumping to prevent rapid currents from scouring the seabed or inducing morphological changes. Injection continued until the water level rose to 0.45 m above the bed surface. The subsequent step commenced after the water surface stabilized naturally.
(4)
Initiation of wave and current generation: Once the water surface was stable without observable fluctuations, the wave maker and current generation systems were activated according to the design parameters required for the specific test conditions.
(5)
Data acquisition: Synchronized through activating the wave generator, the data acquisition system was triggered for all transducers. The sampling frequency was uniformly set to 10 Hz for all measurement instruments, including wave gauges, wave pressure sensors, and pore-water pressure transducers. Data transmission was monitored in real time to ensure that there was no loss of data or anomalies. For each test condition, the total duration was 2 h. To minimize the accumulation of wave reflection due to long-term continuous wave generation and to allow scour scanning, the test was divided into eight consecutive runs, each lasting 15 min. At the end of each run, wave generation was stopped and a high-resolution scan of the seabed morphology was performed. This procedure was applied consistently to all experimental cases. In the experimental design phase, considering that a 2-h acquisition period would lead to redundant data processing and be constrained by storage capacity, the sampling frequency was set to 10 Hz.
(6)
Seabed morphology scanning: After hydrodynamic loading ceased, the 3D laser scanner was positioned over the measurement area to perform a full-scale scan of the sand bed around the pile groups. Scanner calibration parameters, such as the resolution and scanning range, were pre-configured. The movement speed of the scanner was kept constant, strictly adhering to a pre-set trajectory to ensure data continuity and accuracy. Once the scan was completed and any data gaps were addressed, the scanner was returned to its initial position, and equipment checks were performed in preparation for the next run.
(7)
Multi-condition test cycle: Under the same test conditions, steps (4)–(7) were repeated to obtain multiple datasets to improve the reliability and repeatability of the results. When switching to a new test condition, the entire procedure from steps (1)–(7) was re-executed, including transducer re-deployment, seabed leveling, and water level adjustment. This ensured that each test condition remained independent and met the specific design requirements.

2.5. Experimental Uncertainties and Scaling Considerations

In our experiments, wave elevations were measured in the vicinity of the pile groups and, therefore, represent the total wave field, including both incident and reflected wave components. No formal wave decomposition technique was used to separate incident and reflected waves. Moreover, although a passive wave absorber was installed at the downstream end of the flume, partial wave reflection and re-reflection within the flume could not be fully eliminated. Consequently, the reported wave signals should be interpreted as representative of the combined hydrodynamic loading acting on the pile groups, rather than purely incident waves.
Regular waves were generated using a piston-type wave-maker based on linear wave theory. However, due to the finite wave steepness and intermediate water depth conditions considered in the experiments, the resulting wave field exhibited weakly nonlinear characteristics. The wave conditions adopted in the present study are shown in Figure 5 according to classical wave regime classification criteria [42].
In addition, measurement uncertainties associated with sensor accuracies inevitably propagate into the results reported in this study. However, the magnitude of these uncertainties is small relative to the range of hydrodynamic conditions and seabed responses investigated. Thus, while absolute values may be subject to minor uncertainty, the comparative trends and physical interpretations presented in this study remain valid.
The physical model was designed following Froude similarity, commonly adopted in flume tests to ensure the dynamic similarity of gravity-dominated free-surface flows. Through this scaling approach, kinematic and dynamic similarities of wave propagation, wave–structure interaction, and near-bed orbital motion were preserved. The full similitude of sediment transport and pore-pressure response in a porous sandy seabed could not be simultaneously satisfied due to the incompatibility between Froude scaling and Reynolds similarity. Nevertheless, our experiments aimed to capture the relative effects of wave–current interaction, pile spacing, and pile arrangement on scour development and pore-pressure response. These comparative trends are considered less sensitive to scale effect, as widely recognized in previous physical modeling studies [33,34,35].

3. Experimental Results and Discussion

The objectives of this study are as follows: (1) to understand the variations in the wave/current-induced pore-water pressure within the sandy bed around pile groups; (2) to investigate local scour in the vicinity of pile groups.
The test data collected by wave gauges, wave pressure transducers, and pore-water pressure transducers were converted into text files for storage via SmartSensor 4.10 software, and then imported into Origin software to complete the plotting of relevant curves. For processing topographic scanning data, topographic scanning was first performed, and the corresponding data were exported using ViewLS version: 6.0.8, the dedicated software for the 3D laser scanner. The XYZ-format text obtained from scanning was imported into CloudCompare for processing, with denoising preprocessing conducted on the original point cloud data simultaneously. Finally, the processed valid data were imported into Origin in text format to complete the plotting of relevant graphs.

3.1. Hydrodynamics Around Pile Groups

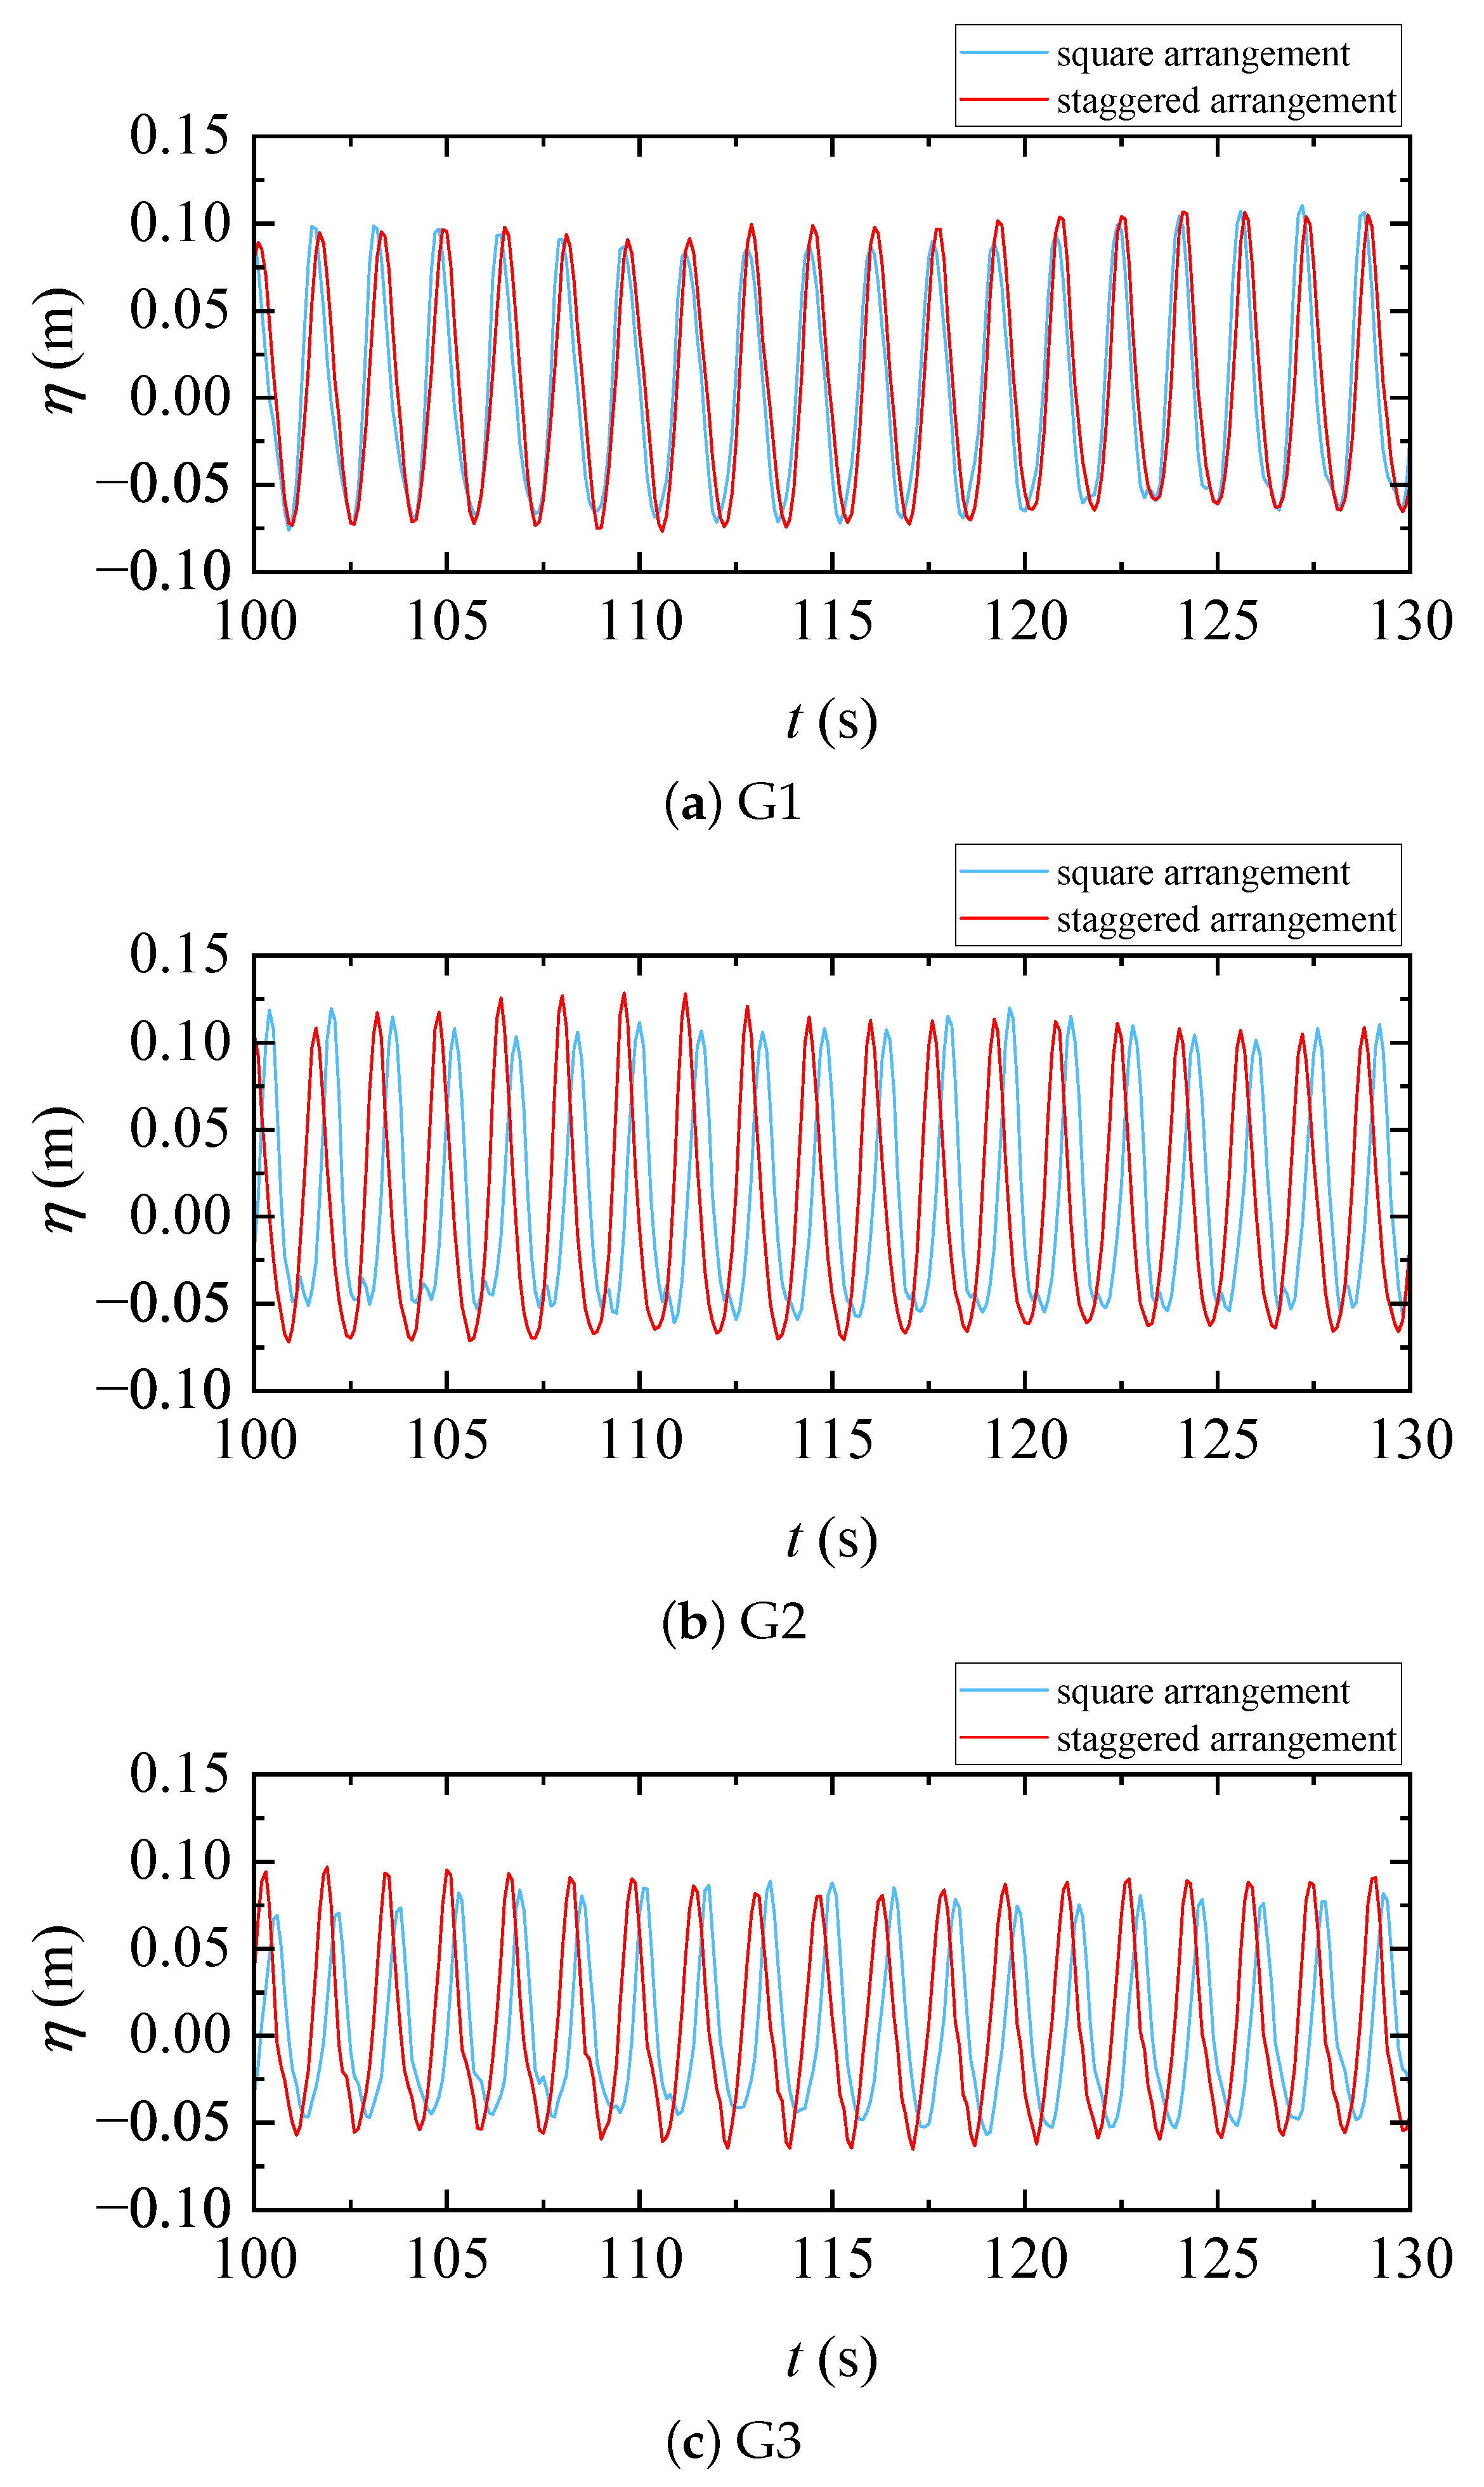
In the experimental tests, three wave gauges (G1, G2, and G3) were used to monitor the wave surface changes around the pile groups. As shown in Figure 6, a time series of wave profiles is presented for both square and staggered arrangement pile groups. G1 is located at the far end near the wave generator; therefore, the wave profiles are almost identical for both arrangements. However, the wave heights both upstream and downstream are obviously larger for the staggered pile group compared with the square pile group due to the stronger reflected waves induced by the front pile (Pile A) on the centerline. A reduction in wave height from G2 to G3 can be observed for both arrangements, with a damping effect of approximately 33% on incident waves.
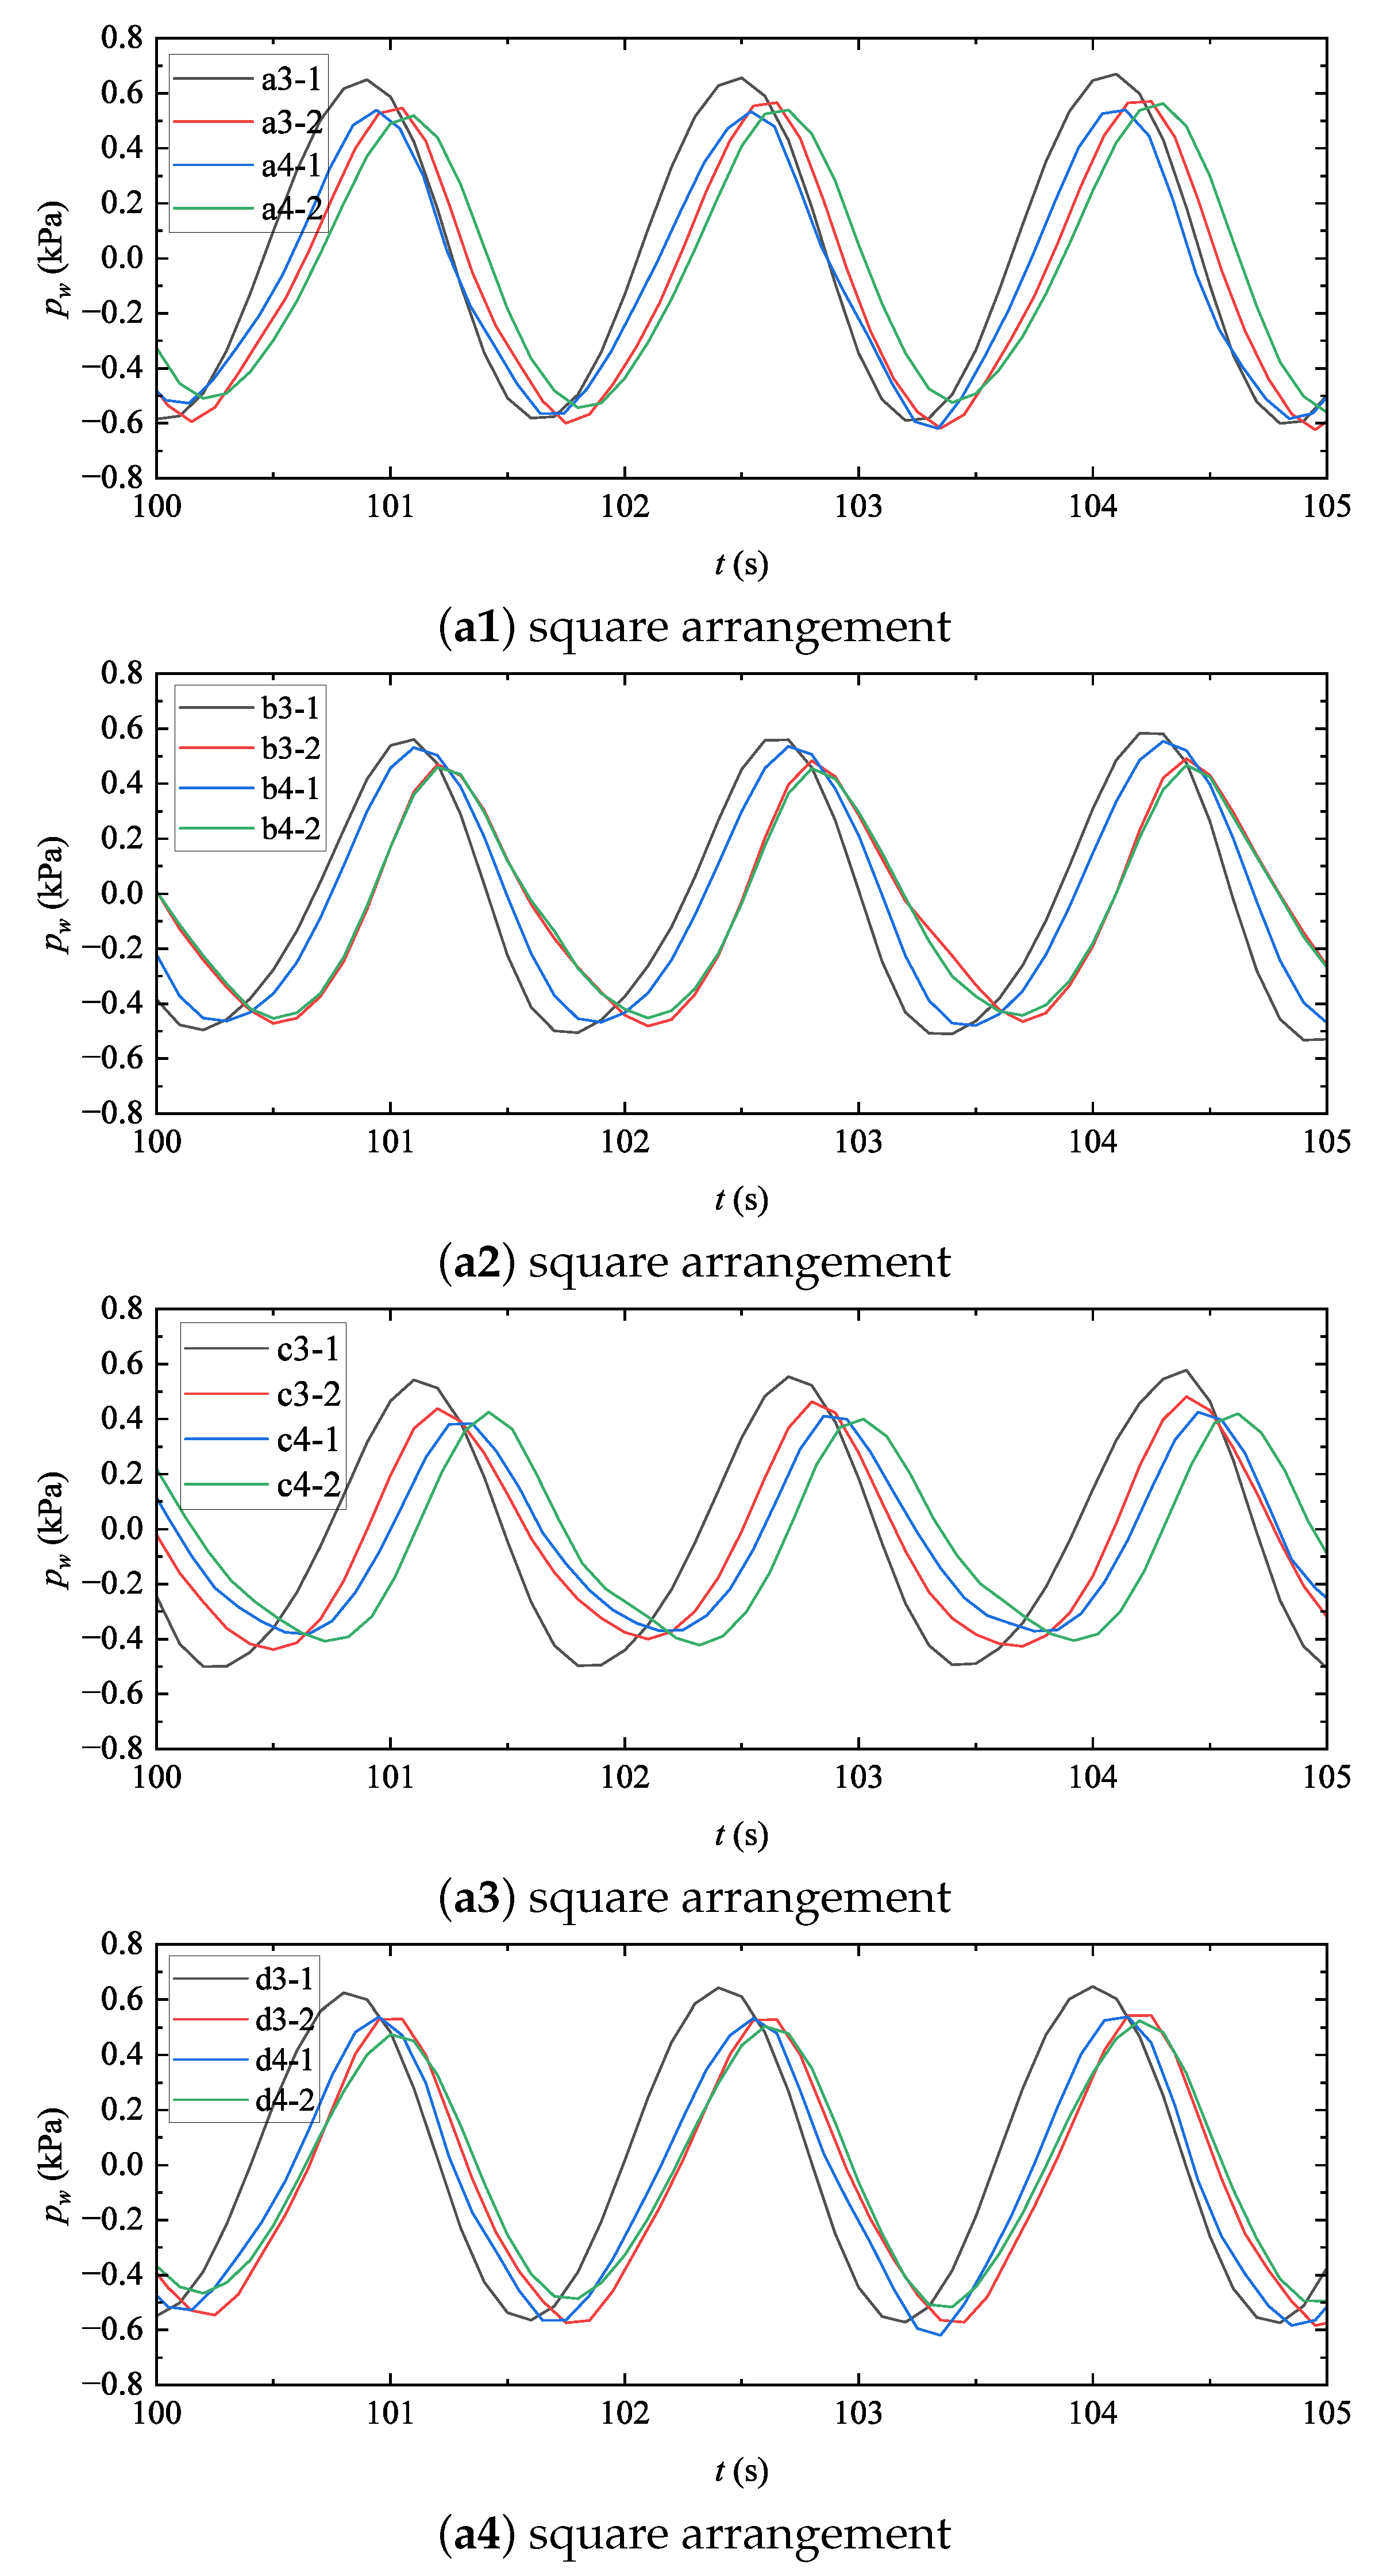
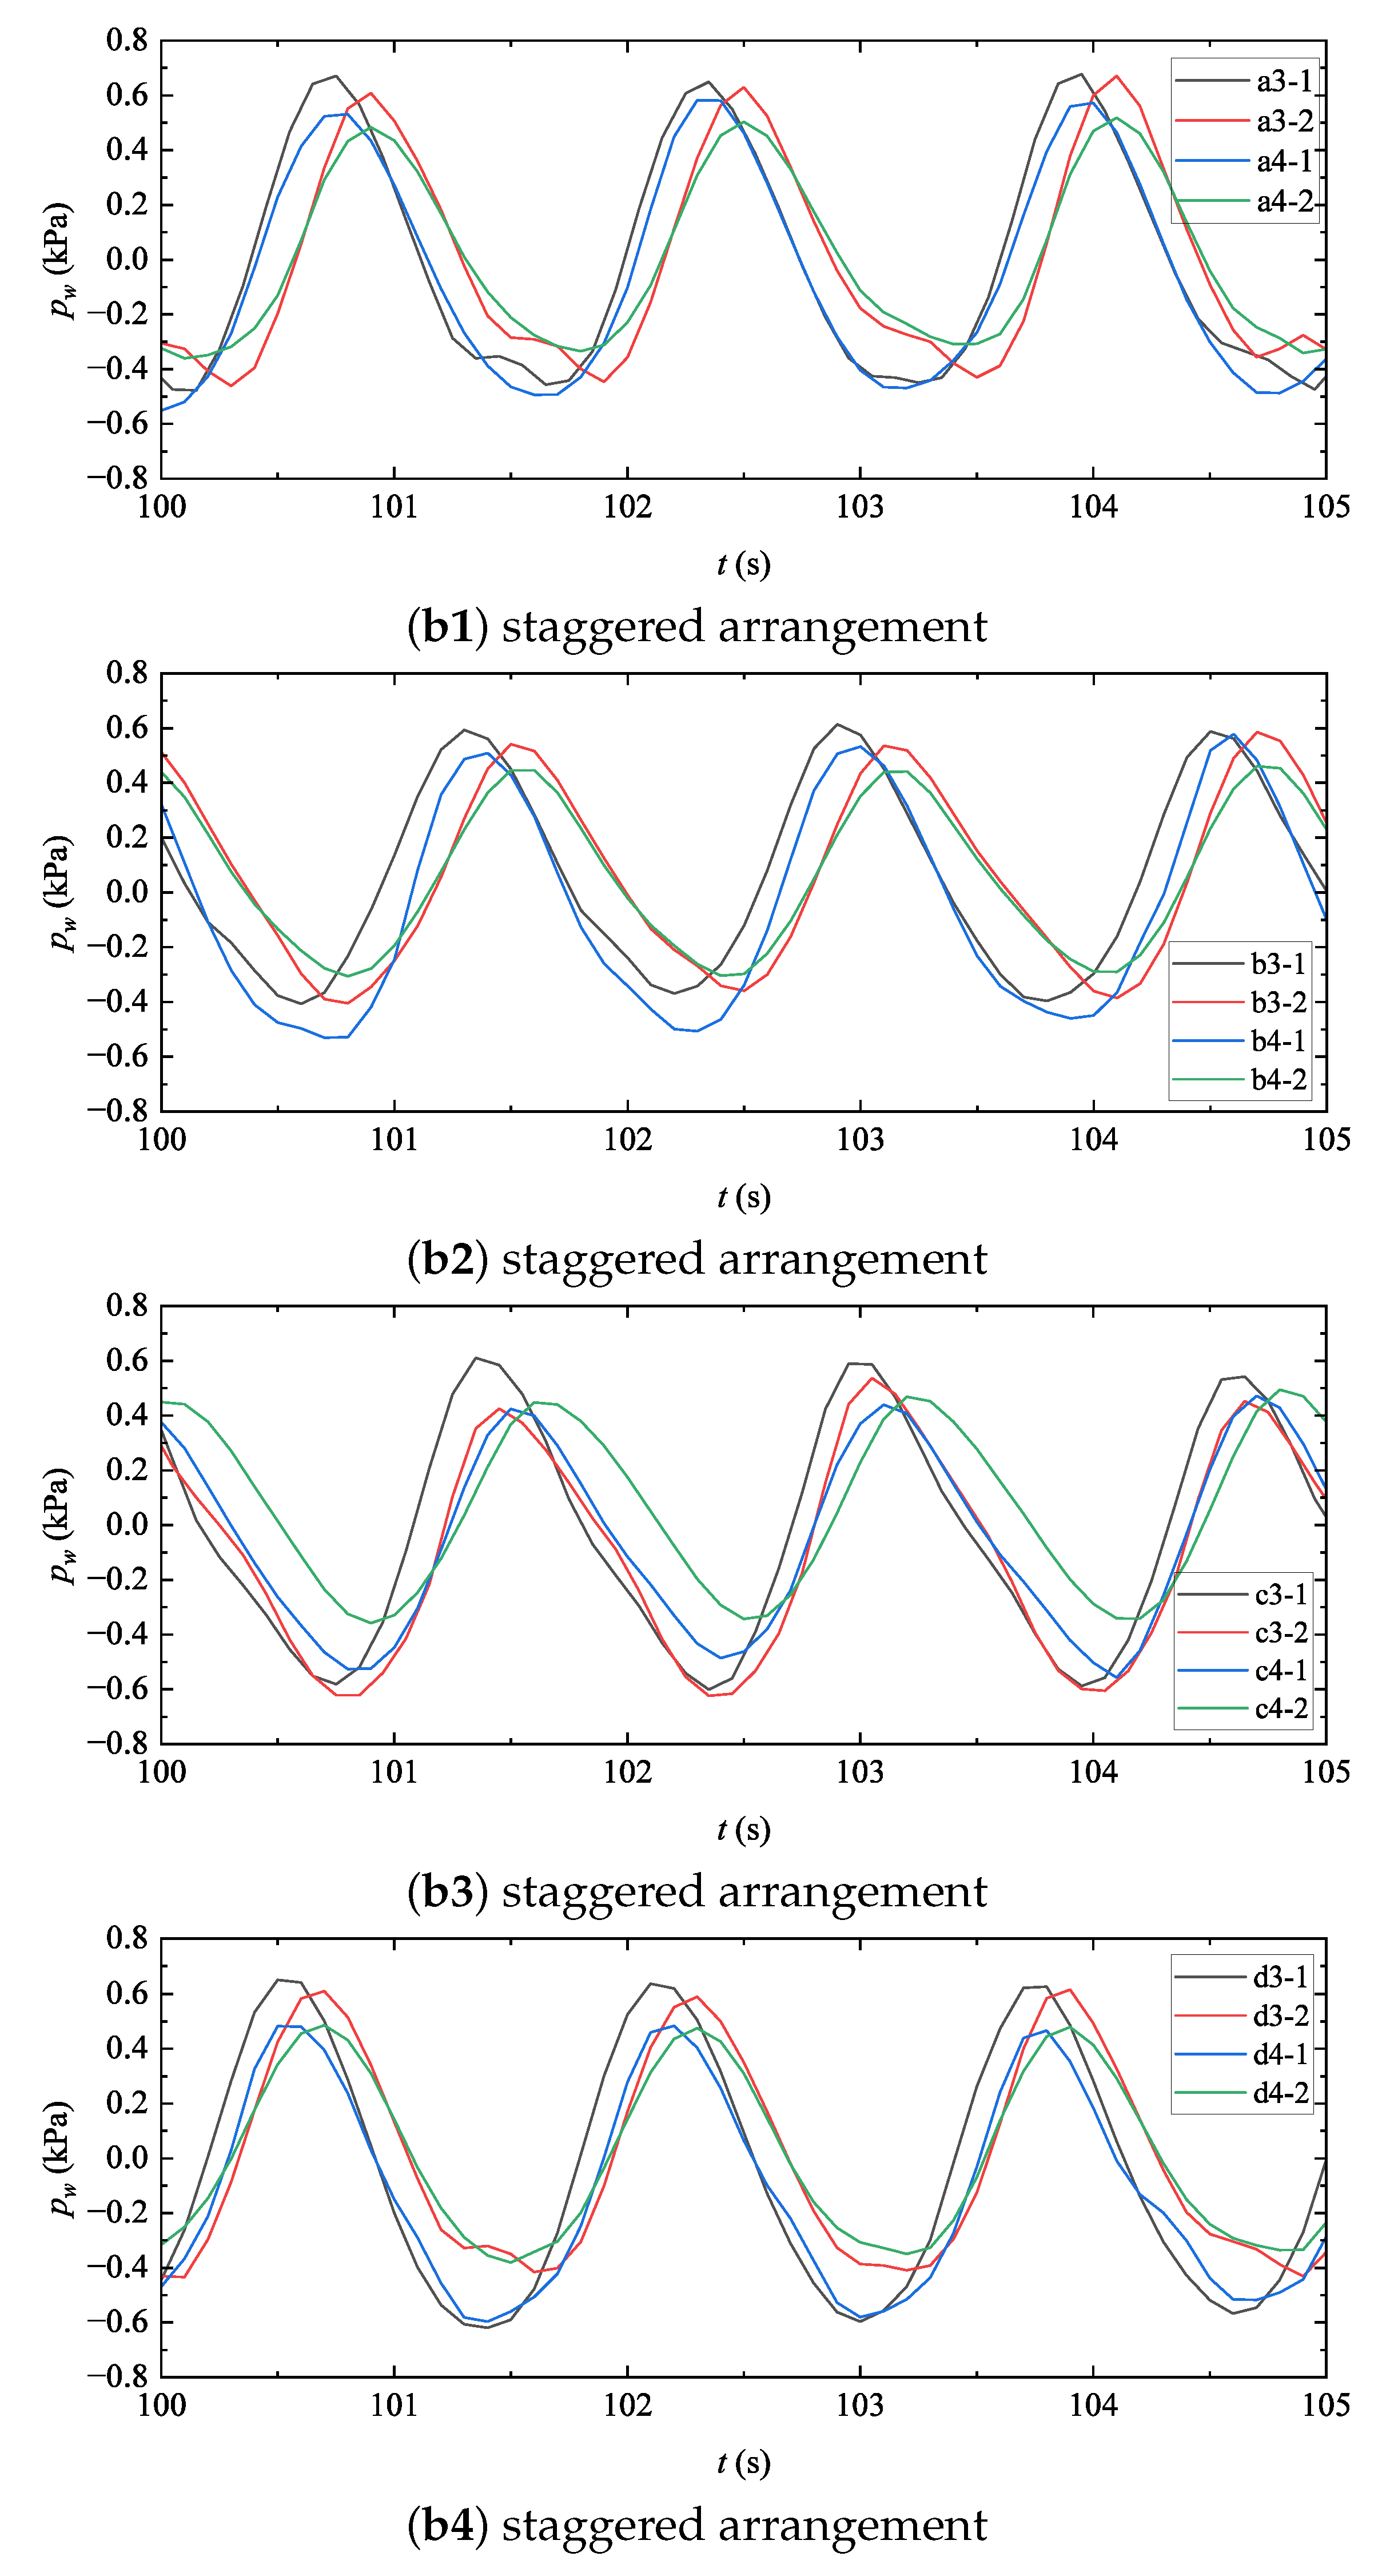
Figure 7 shows the time series of dynamic wave pressure acting on the front and rear sides of the pile surface for both the square and staggered pile groups. Two layers of wave pressure sensors were mounted on the pile surfaces at elevations of 15 cm and 30 cm above the seabed surface, respectively. As shown in the figure, the dynamic wave pressures near the free surface (a3-x, b3-x, c3-x, d3-x) are significantly higher than those at greater depths (a4-x, b4-x, c4-x, d4-x). Furthermore, the dynamic wave pressure on the upstream side of the pile noticeably exceeds that on the downstream side, accompanied by an obvious phase difference. The structure of the pile group has a shielding effect on incident waves, resulting in the partial wave energy being attenuated during propagation, so the amplitude of the dynamic wave pressure on the front surface of the piles is always greater than that on the rear surface. Taking the square pile group as an example, comparing the wave pressure in the front-row piles (A, D) with the rear-row piles (B, C), the maximum pressure values on the surfaces of the front columns A and D are 22.64 % and 20.52 % higher than those on the surface of columns B and C, respectively.

3.2. Pore-Water Pressure Around Pile Groups

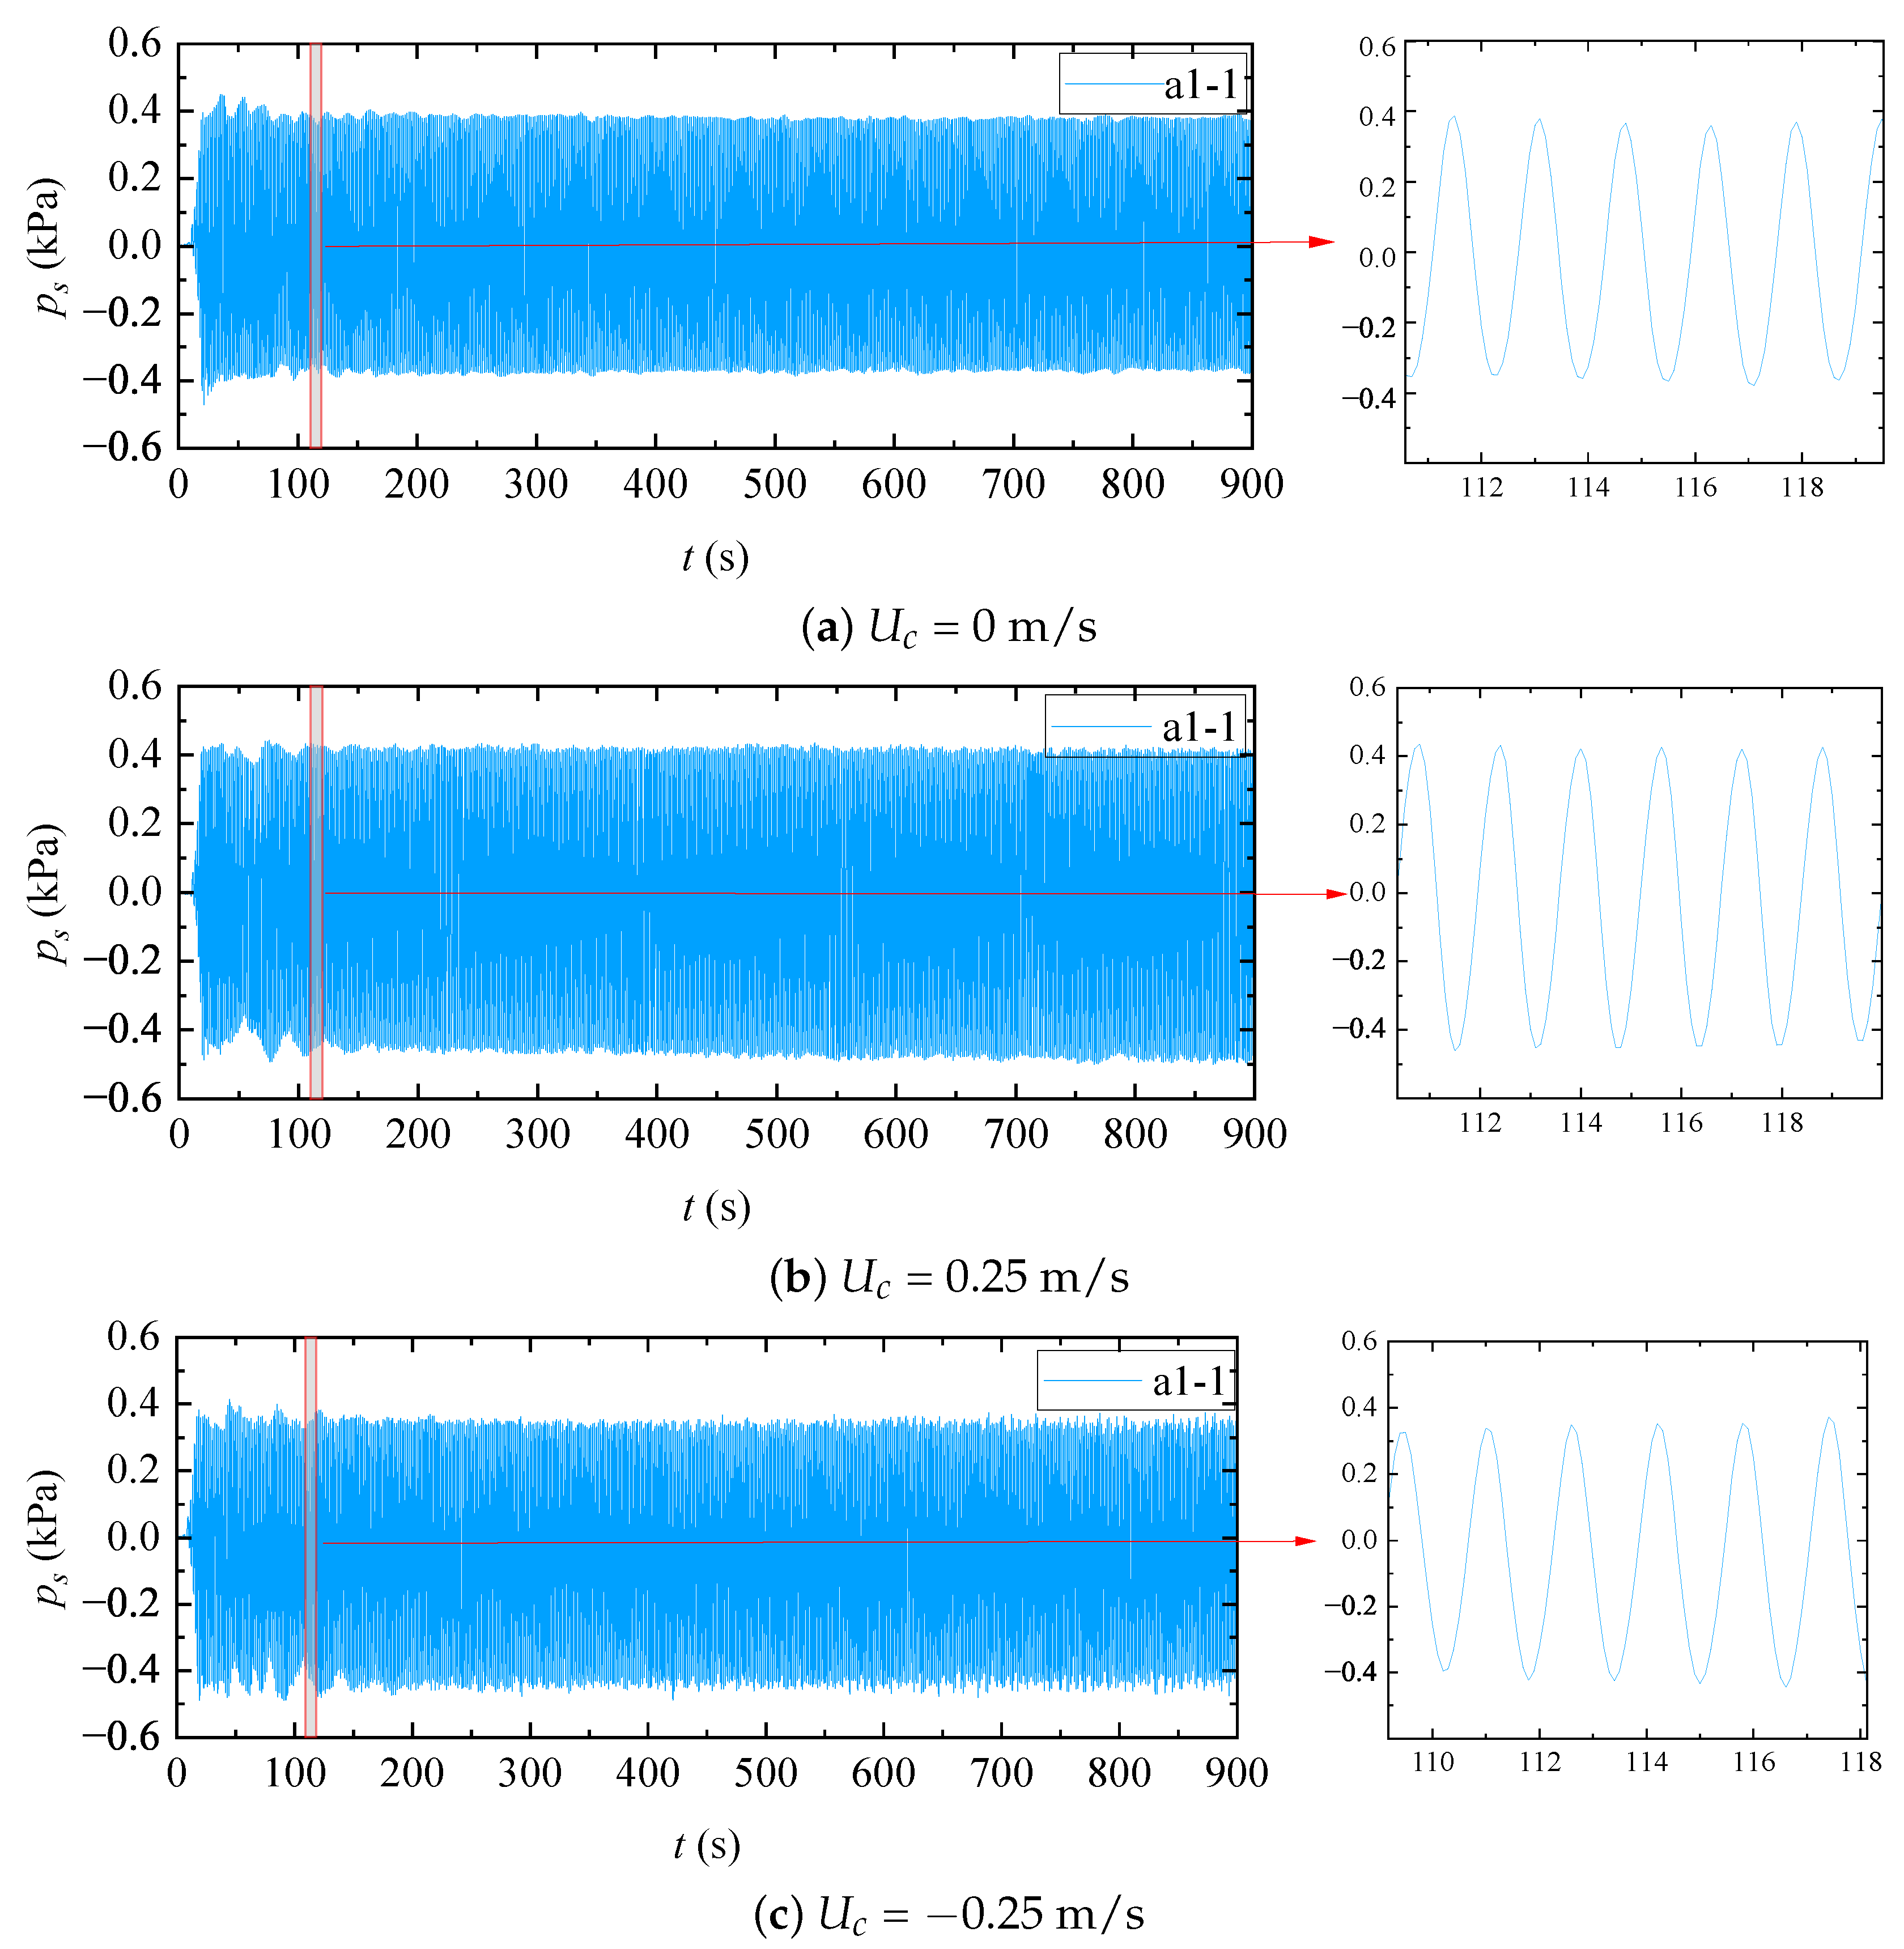
Figure 8 presents the time series of pore-water pressure for various current velocity conditions on the upstream surface (a1–1) of Pile A in the square pile group. Both the full duration (900 s) and enlarged views of selected time intervals (112–118 s) for cases 3, 7, and 8 (see Table 3) are presented. Steady oscillatory responses of the pore-water pressure are observed for all three cases. Moreover, both the magnitude and direction of the current (i.e., forward or opposite along the waves) exert a pronounced influence on the pore-water pressure responses. When only waves are present, the magnitude of the pore-water pressure is around 0.3786 kPa. However, the magnitude of the pore-water pressure increases to around 0.4343 kPa under a forward current of 0.25 m/s, corresponding to an approximate 14.71% increase relative to the wave-only condition. In contrast, for an opposite current with U c = −0.25 m/s, the magnitude of the pore-water pressure decreases to 0.3396 kPa. Consequently, the pressure difference between the forward current (0.25 m/s) and the opposite current (−0.25 m/s) reaches 0.0947 kPa, corresponding to a relative variation of 27.89%.
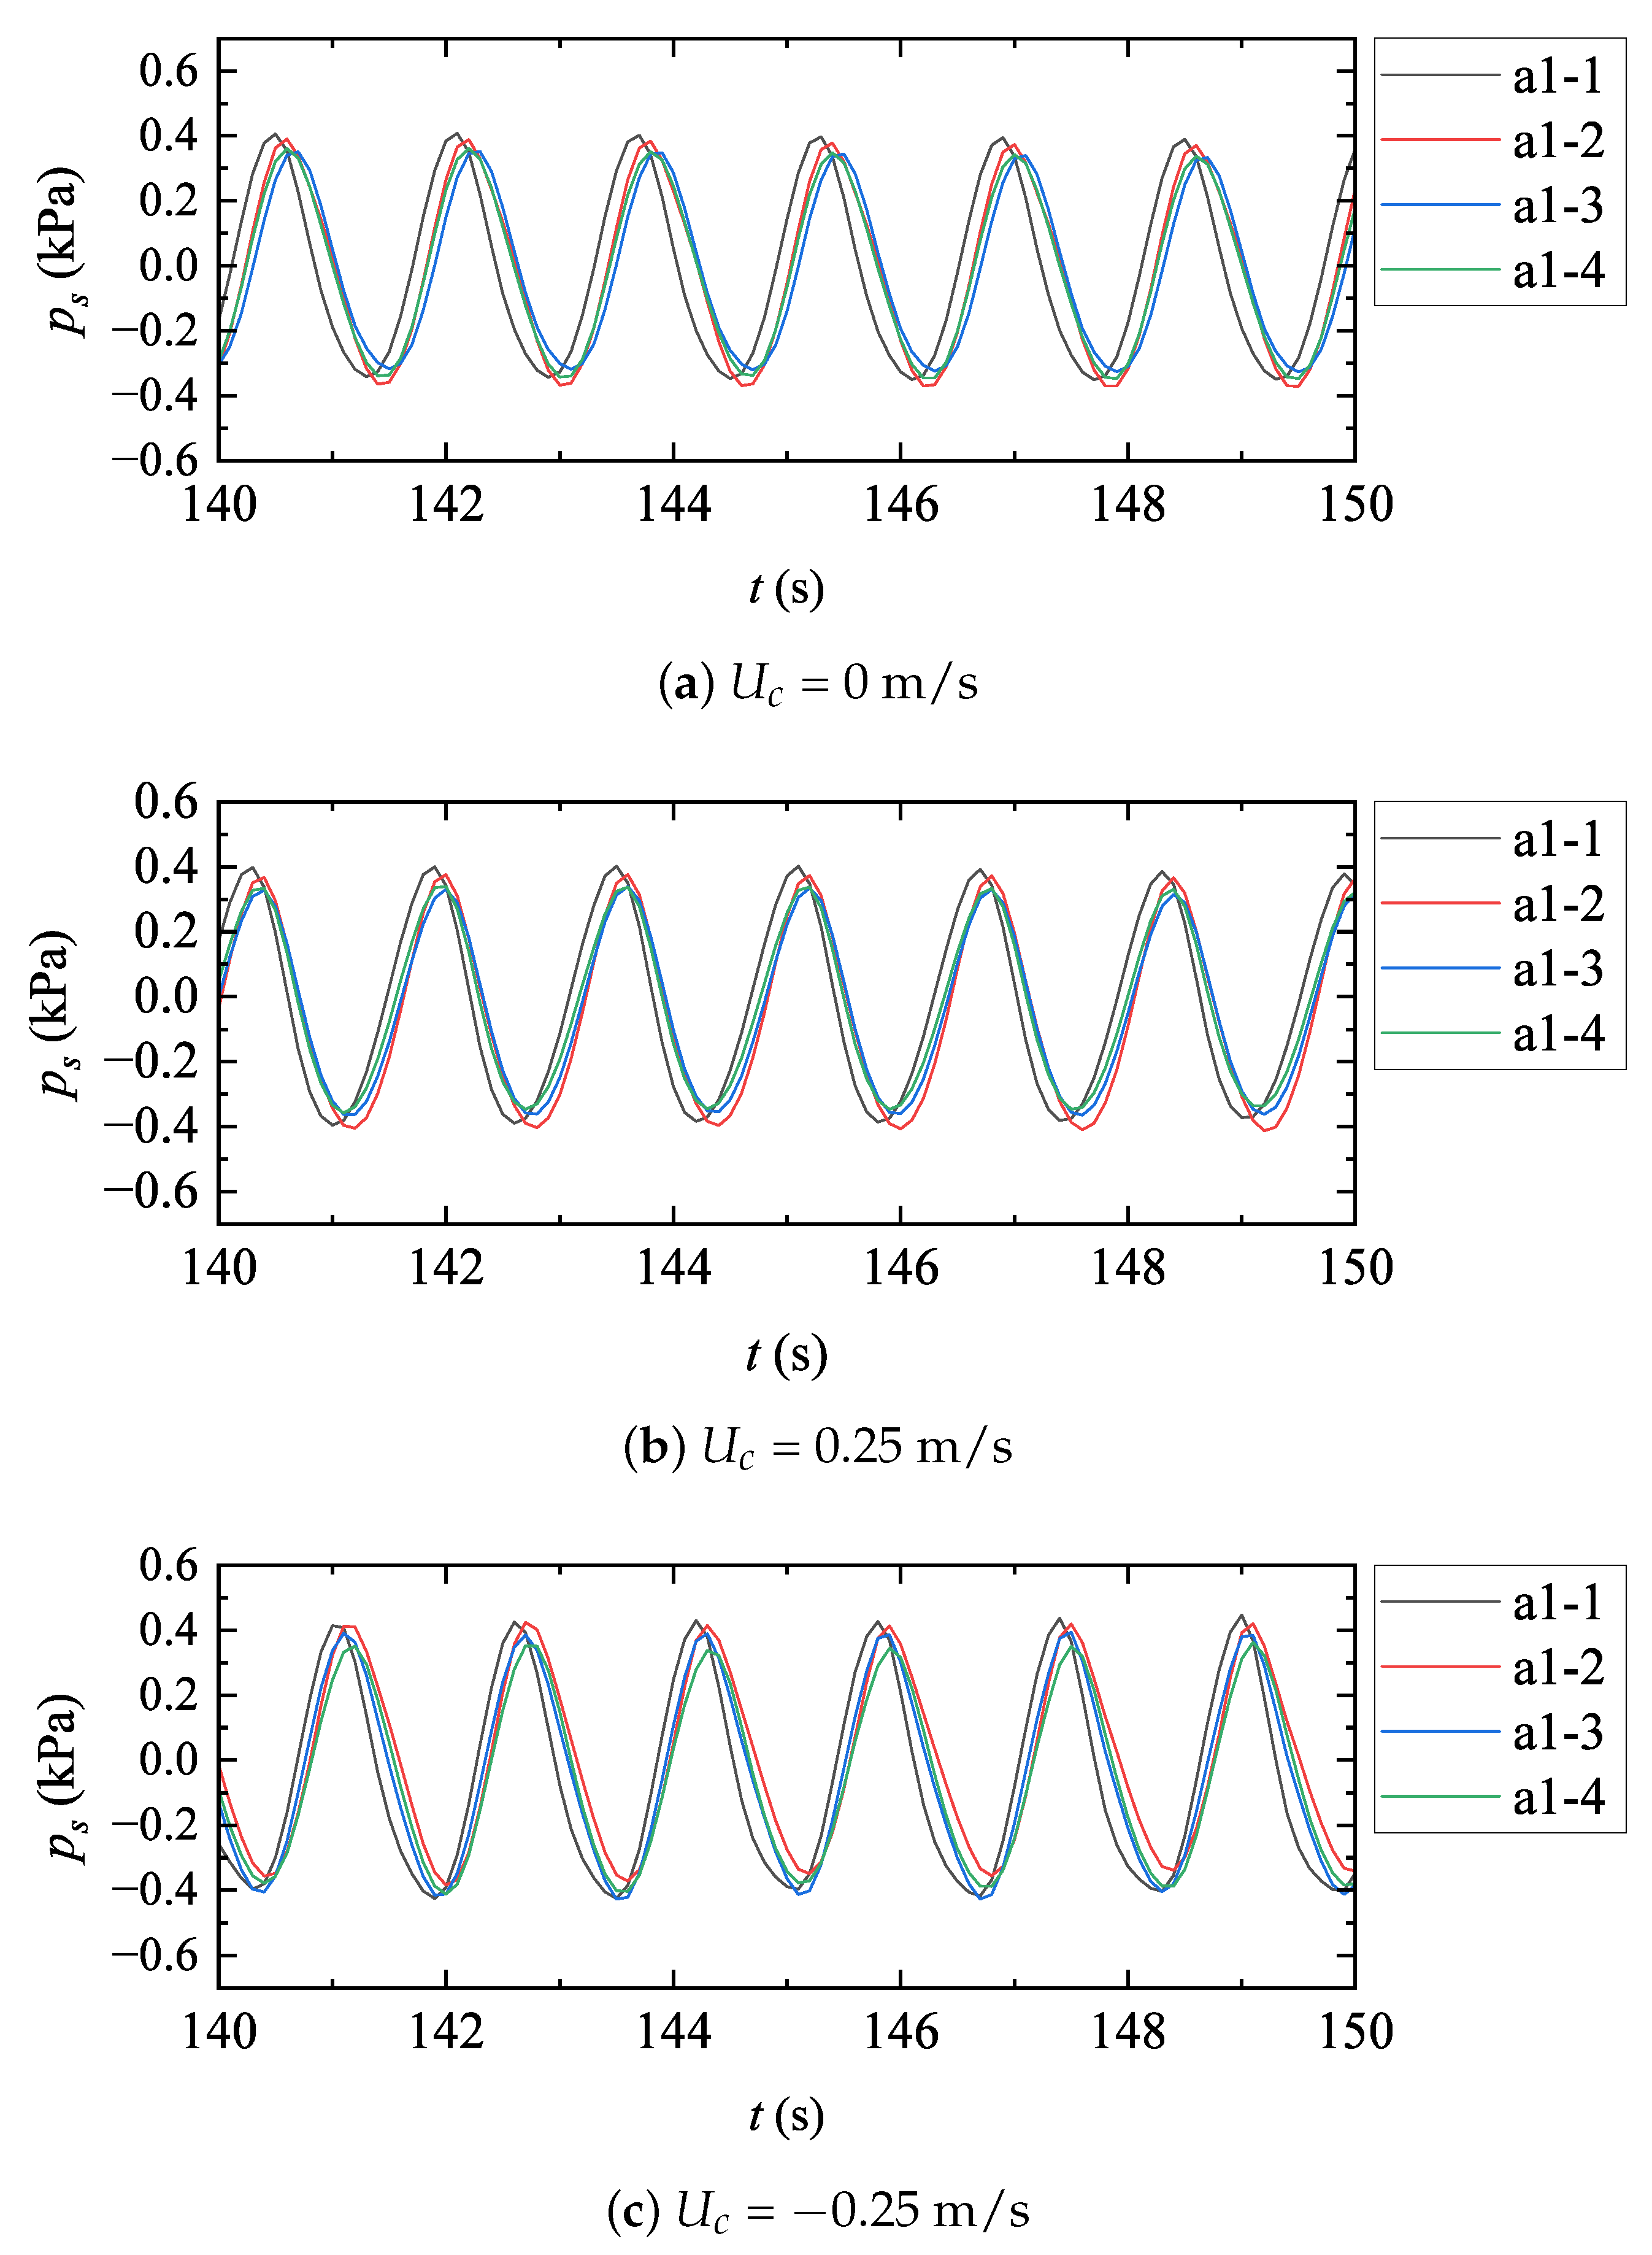
As shown in Figure 9, the time series of pore-water pressure at different locations on the surface of Pile A in the square pile group is further examined (upstream side: a1-1; downstream side: a1-3; lateral sides: a1-2 and a1-4; refer to Figure 3b). The upper-layer pore-water pressure sensors are selected among the two layers of the sensors, which are 5 cm deep from the seabed surface. Cases 3, 7, and 8 are used for the wave-only case, the forward current of U c = 0.25 m/s case, and the opposite current of U c = −0.25 m/s case, respectively. Similarly, the pore-water pressure at all locations around the pile surface increases with the presence of the forward current, and vice versa for the presence of the opposite current. Comparing the pore-water pressure at four locations, the largest pore-water pressure occurs at the upstream surface of Pile A (i.e., a1-1), while the smallest one occurs at the downstream side and the inner lateral side of Pile A (a1-3 and a1-4, respectively). The difference in magnitude reaches around 15%, so the pore-water pressure on the outer lateral side of the pile being greater than that on the inner lateral side could be attributed to the consolidation effect of the pile group. Furthermore, obvious phase differences can be observed at different locations around the pile surface, where the response begins earliest on the upstream side of the pile, is last on the downstream side, and is intermediate on both lateral sides. Another noteworthy observation is that when comparing the pore-water pressure on the downstream surface of the pile (a1-3) under different current conditions, the pressure under opposite current not only fails to decrease but actually increases. This is likely associated with enhanced flow interaction effects induced by the opposing current. This interpretation is based on the observed pore-water pressure response, as detailed flow fields (e.g., velocity or vorticity fields) were not measured in the present experiments.
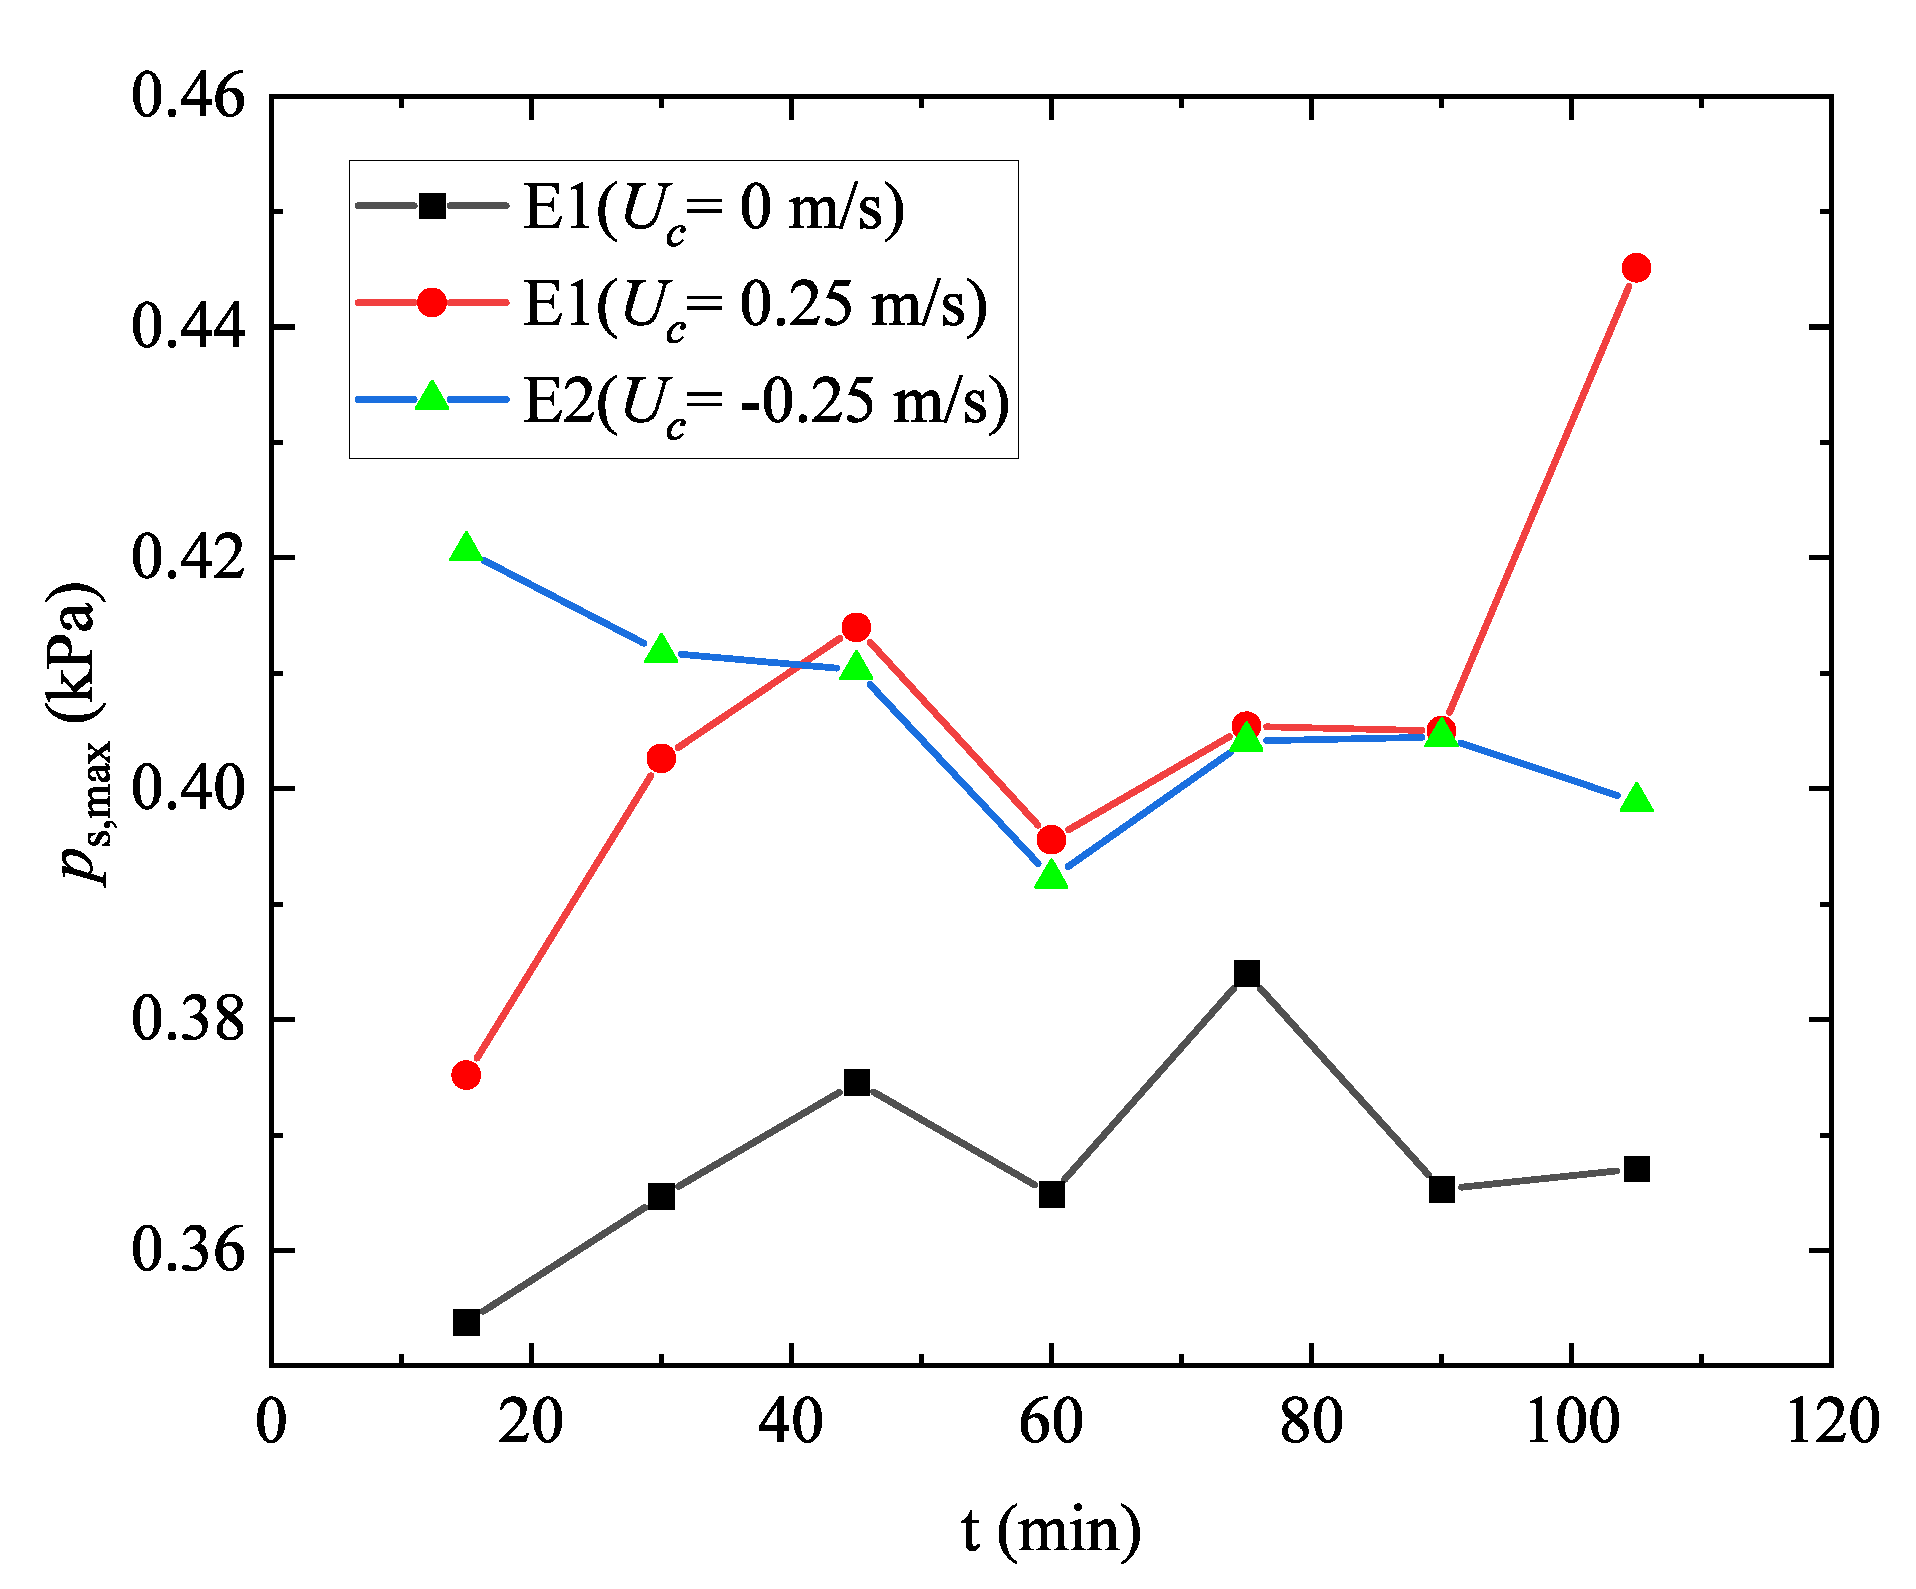
Given the potential influence of the pile group’s effect on the pore-water pressure, in addition to the locations on the surface of Pile A, the central point of the square pile group (i.e., E1, 5 cm in depth) was further selected to investigate variation in the maximum pore-water pressure under different current velocities, as shown in Figure 10. Currents from both directions exert significant influence on the pore-water pressure. However, their effects differ notably from those observed at the front surface of Pile A. At the front surface of Pile A, the forward current increases the pore-water pressure amplitude, whereas the opposing current reduces it. In contrast, at the central point E1 of the square pile group, both forward and opposing currents cause clear increases in the maximum pore-water pressure. This discrepancy may be attributed to the more pronounced flow disturbance around the center of the pile group resulting from wave–current–structure interactions, while the flow field in front of Pile A is relatively simple and the difference is primarily governed by the direction of the currents. The maximum pore-water pressure is also generally increased for the current condition U c = 0.25 m/s. In contrast, under the opposing current U c = −0.25 m/s, the maximum pore-water pressure exhibits a notable decrease, revealing an asymmetric response to the direction of the current.
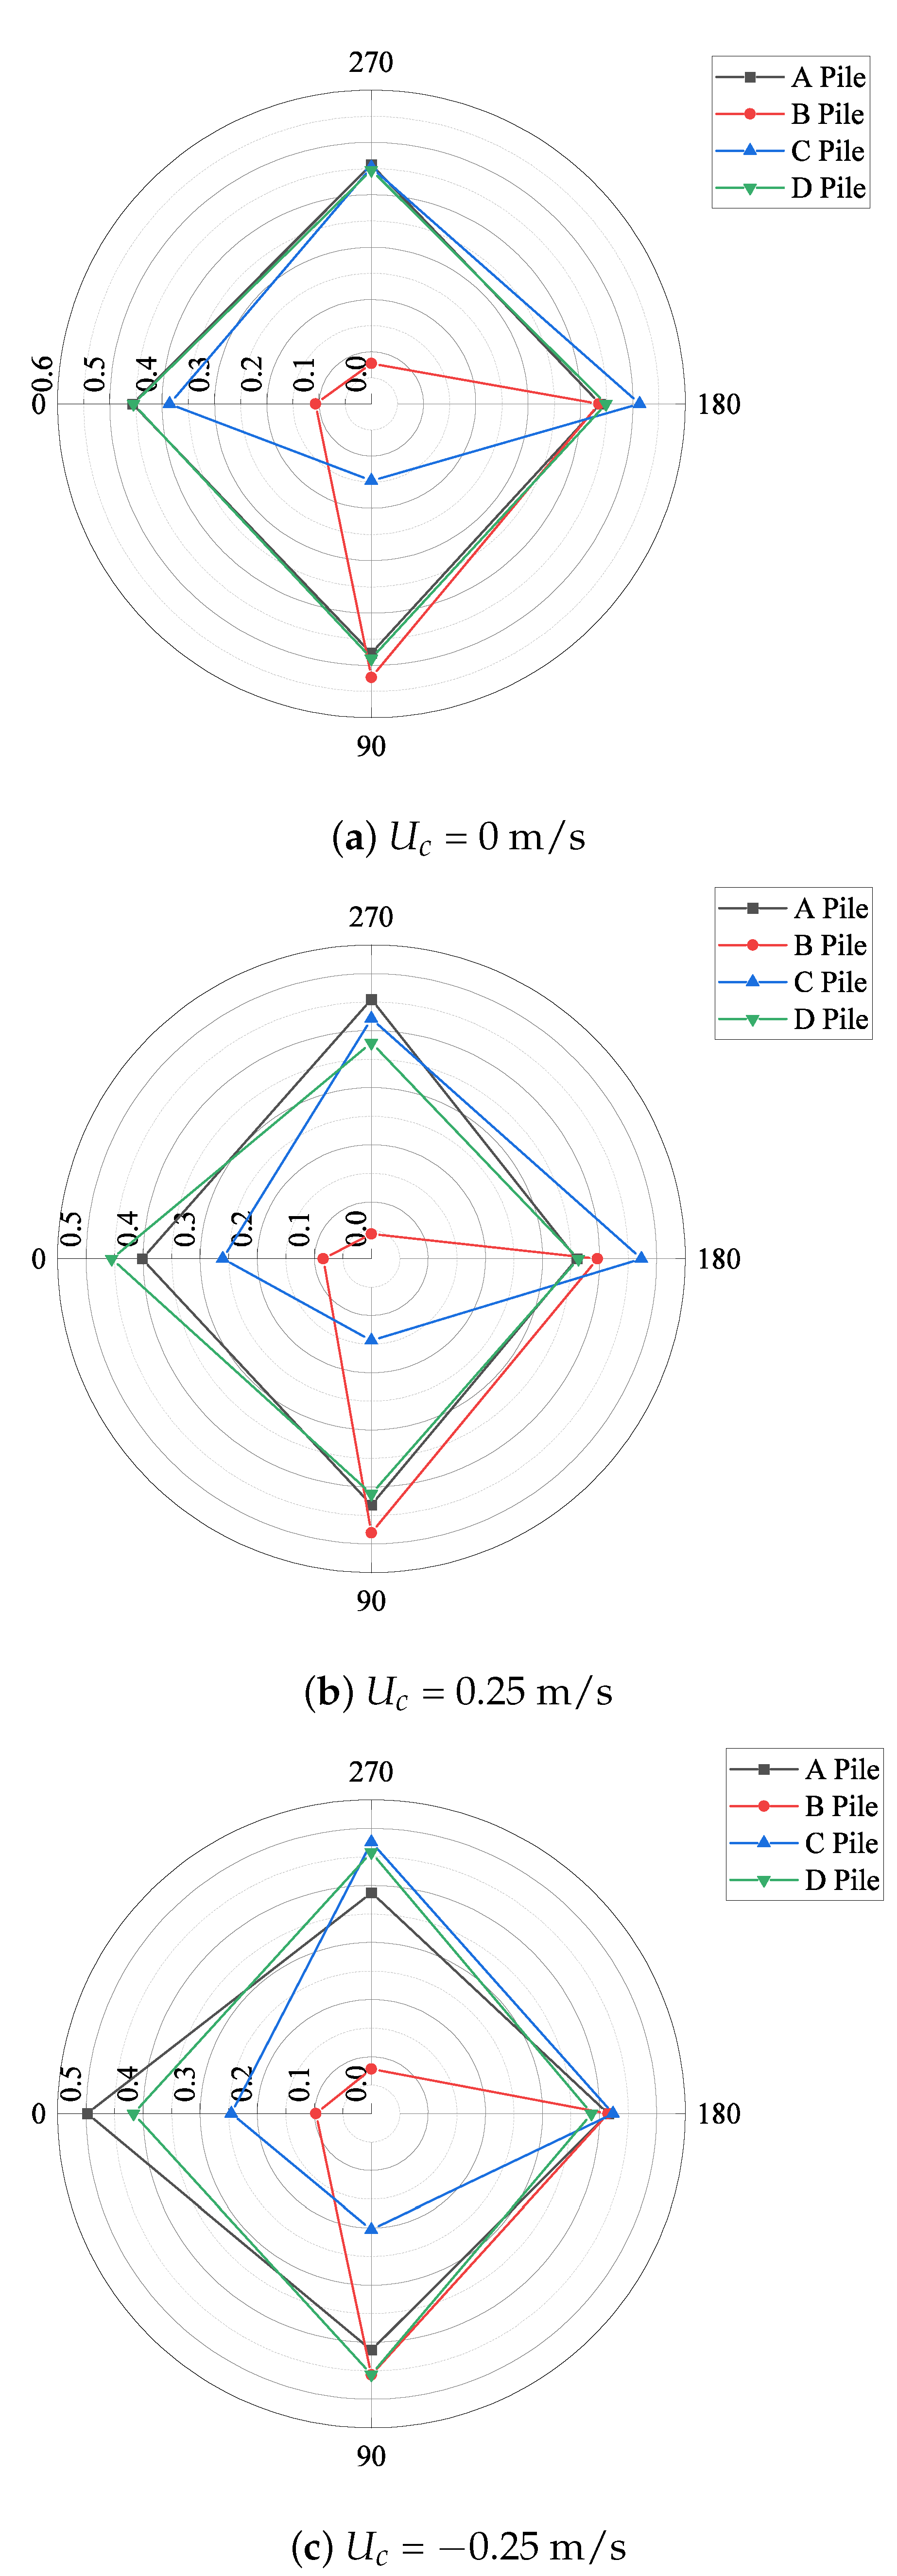
Figure 11 demonstrates the spatial distribution of the maximum pore-water pressure around the surfaces of each pile in the square pile group, where Piles A and D are located on the wave-facing side and Piles B and Pile C are on the downstream side. The upper layer of the pore-water pressure sensors with a buried depth of 5 cm is selected. Three current conditions are considered: U c = 0, 0.25 and −0.25 m/s. Generally, the largest pore-water pressure occurs at 0° (wave-facing side) for the front-row piles (Pile A and Pile D), while the magnitude of pore-water pressure at similar locations on the rear-row piles (Pile B and Pile C) is significantly reduced as they are in the shielding area of the front row piles. In addition, the pore-water pressure on the outer lateral sides of Pile B and Pile C is significantly higher than that on the inner lateral sides. Taking the current condition of the forward position as an example (Figure 11b), the pressure attenuation ratio between the front and rear rows is approximately 50– 60 % , indicating that the pile group has a certain protective capacity under this spacing configuration.

3.3. Local Scour Around the Square Pile Group

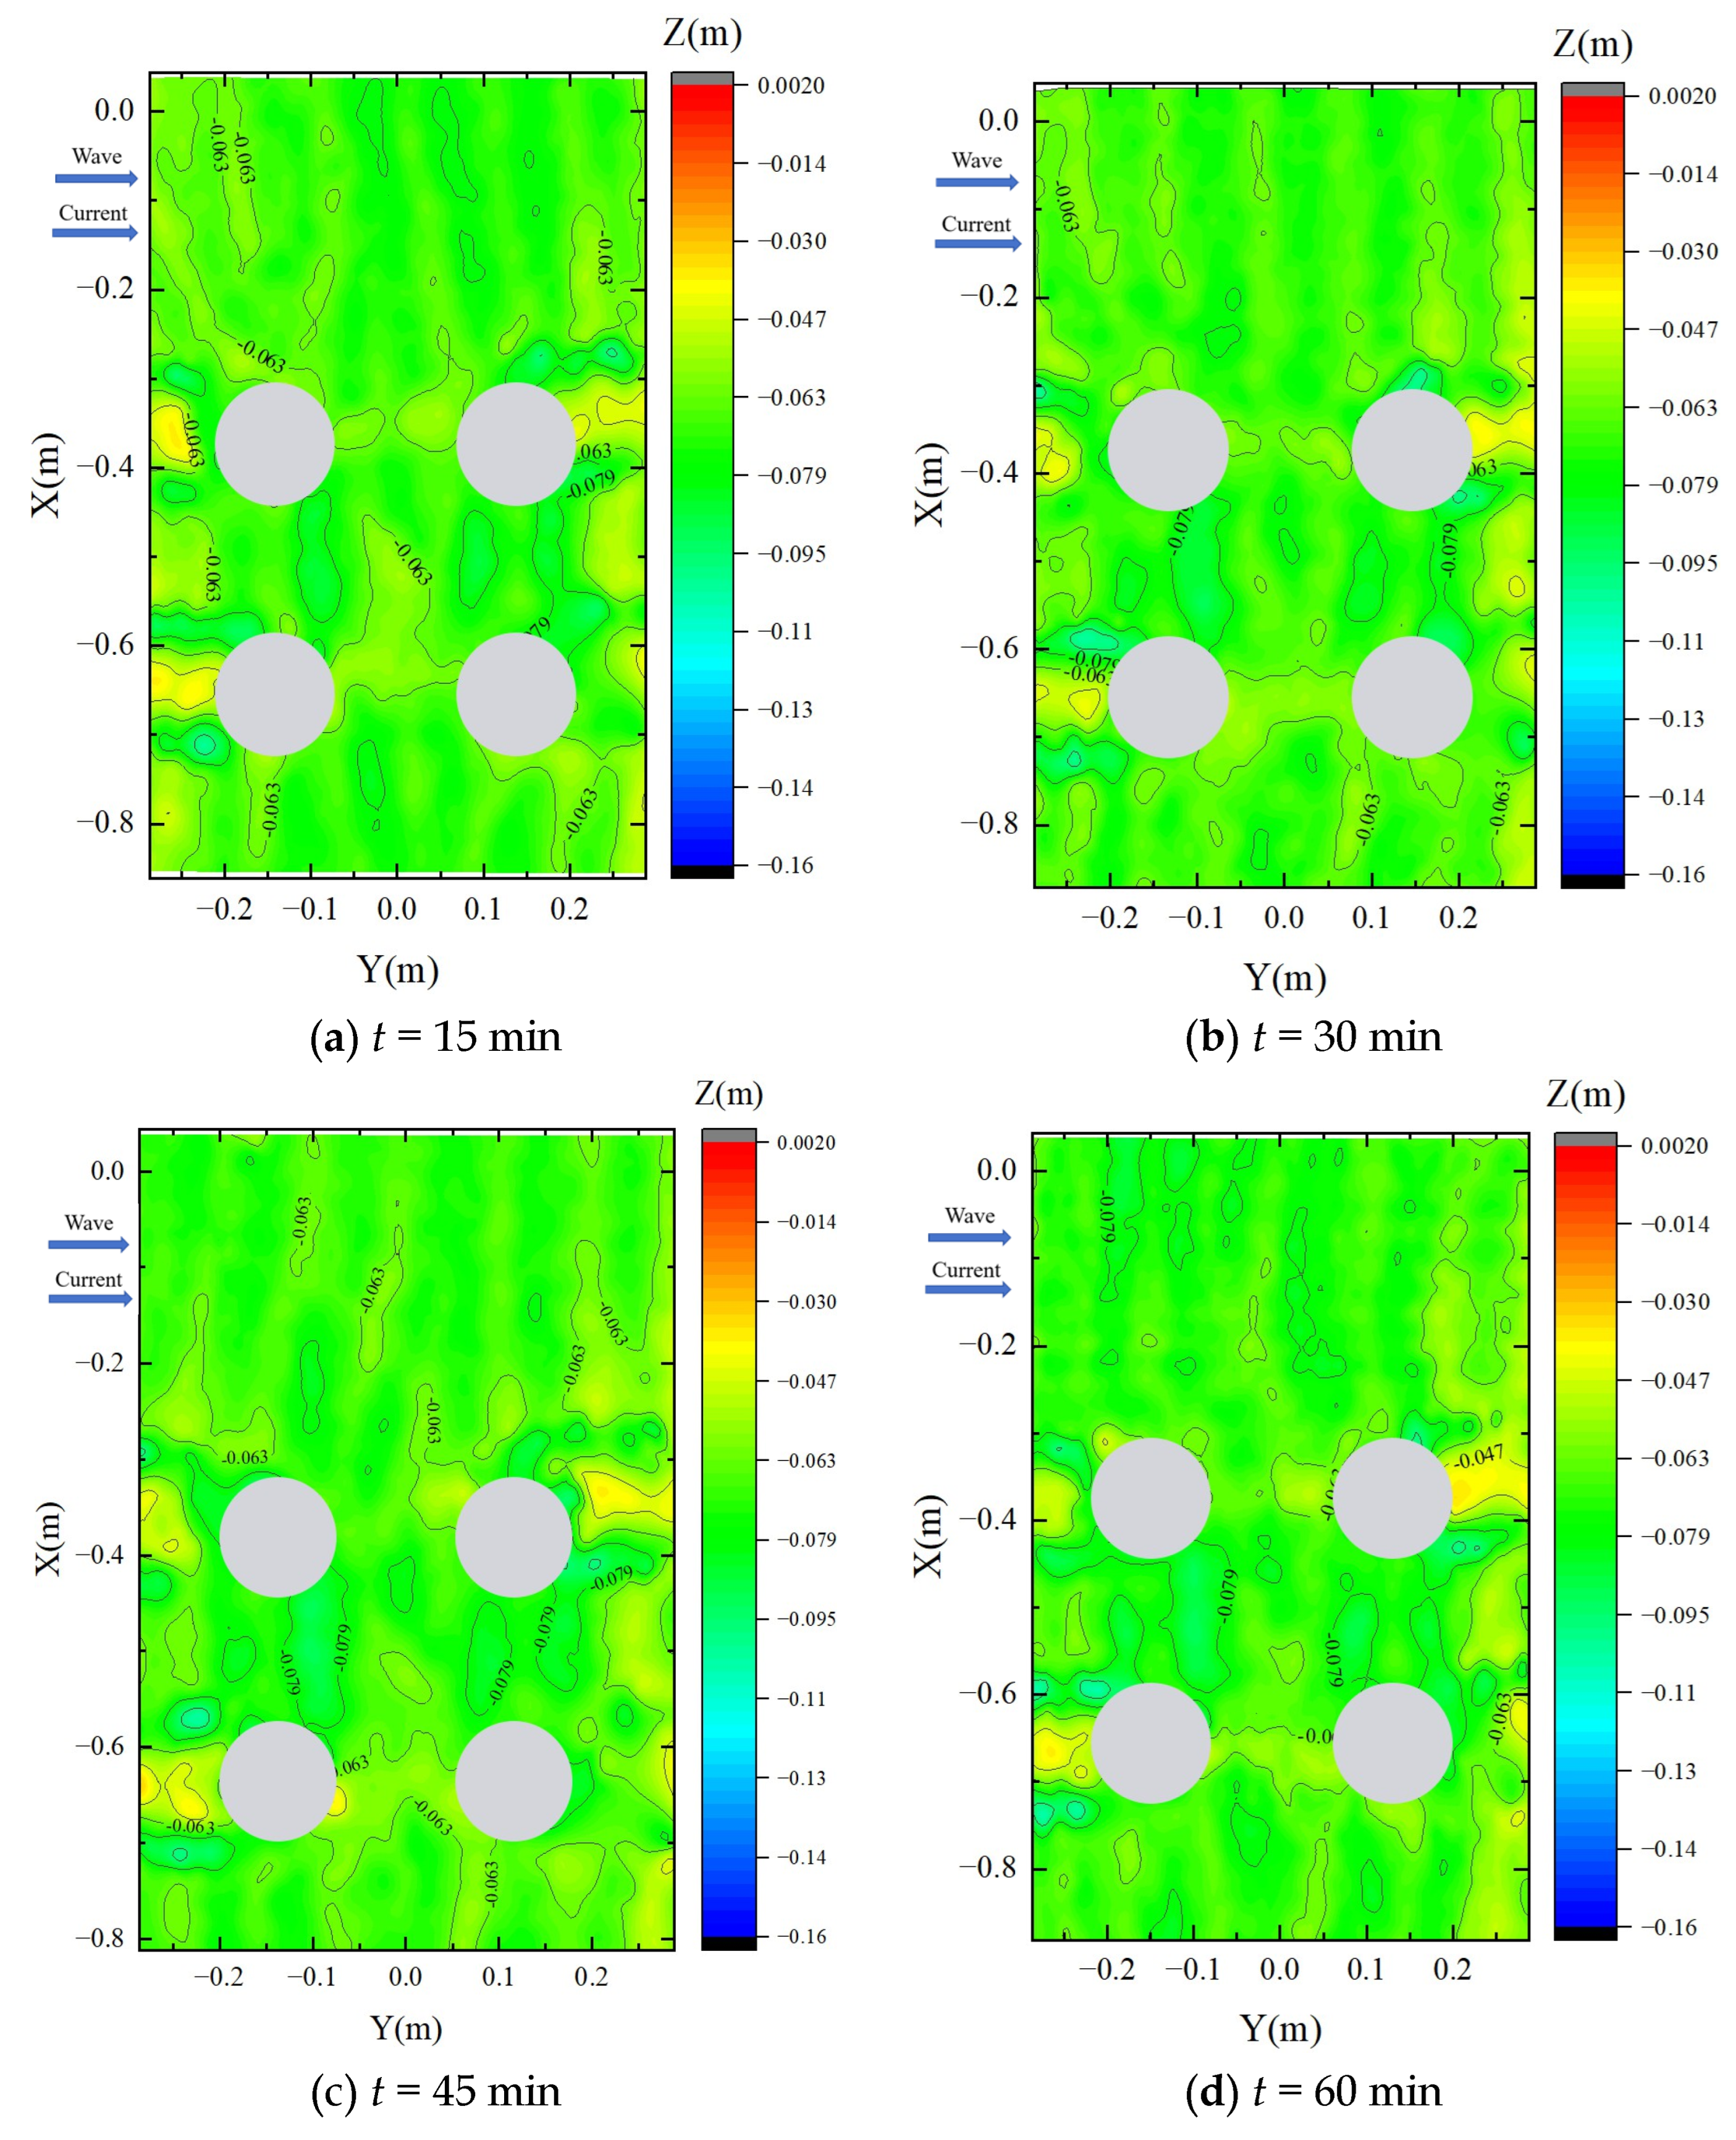
Each experimental test consisted of eight successive scour development cycles, each lasting 900 s, resulting in a total test duration of 120 min. At the end of every cycle, the model area was scanned using the high-precision three-dimensional underwater 3D laser scanner (Insight Nano by Voyis company Canada), producing eight post-scour bathymetric datasets for each hydrodynamic case. The scanned data were subsequently processed using specialized software to generate high-resolution three-dimensional seabed elevation maps (Figure 12). In these maps, the x-y plane defines the horizontal coordinate system, while the z-direction represents the elevation of the bed referenced to the initial unscoured seabed (z = 0). In the following figures, the positive y-direction corresponds to the wave–current propagating direction, while the x-direction is perpendicular to the wave flume. Circular markers indicate the locations of the pile elements within the group.
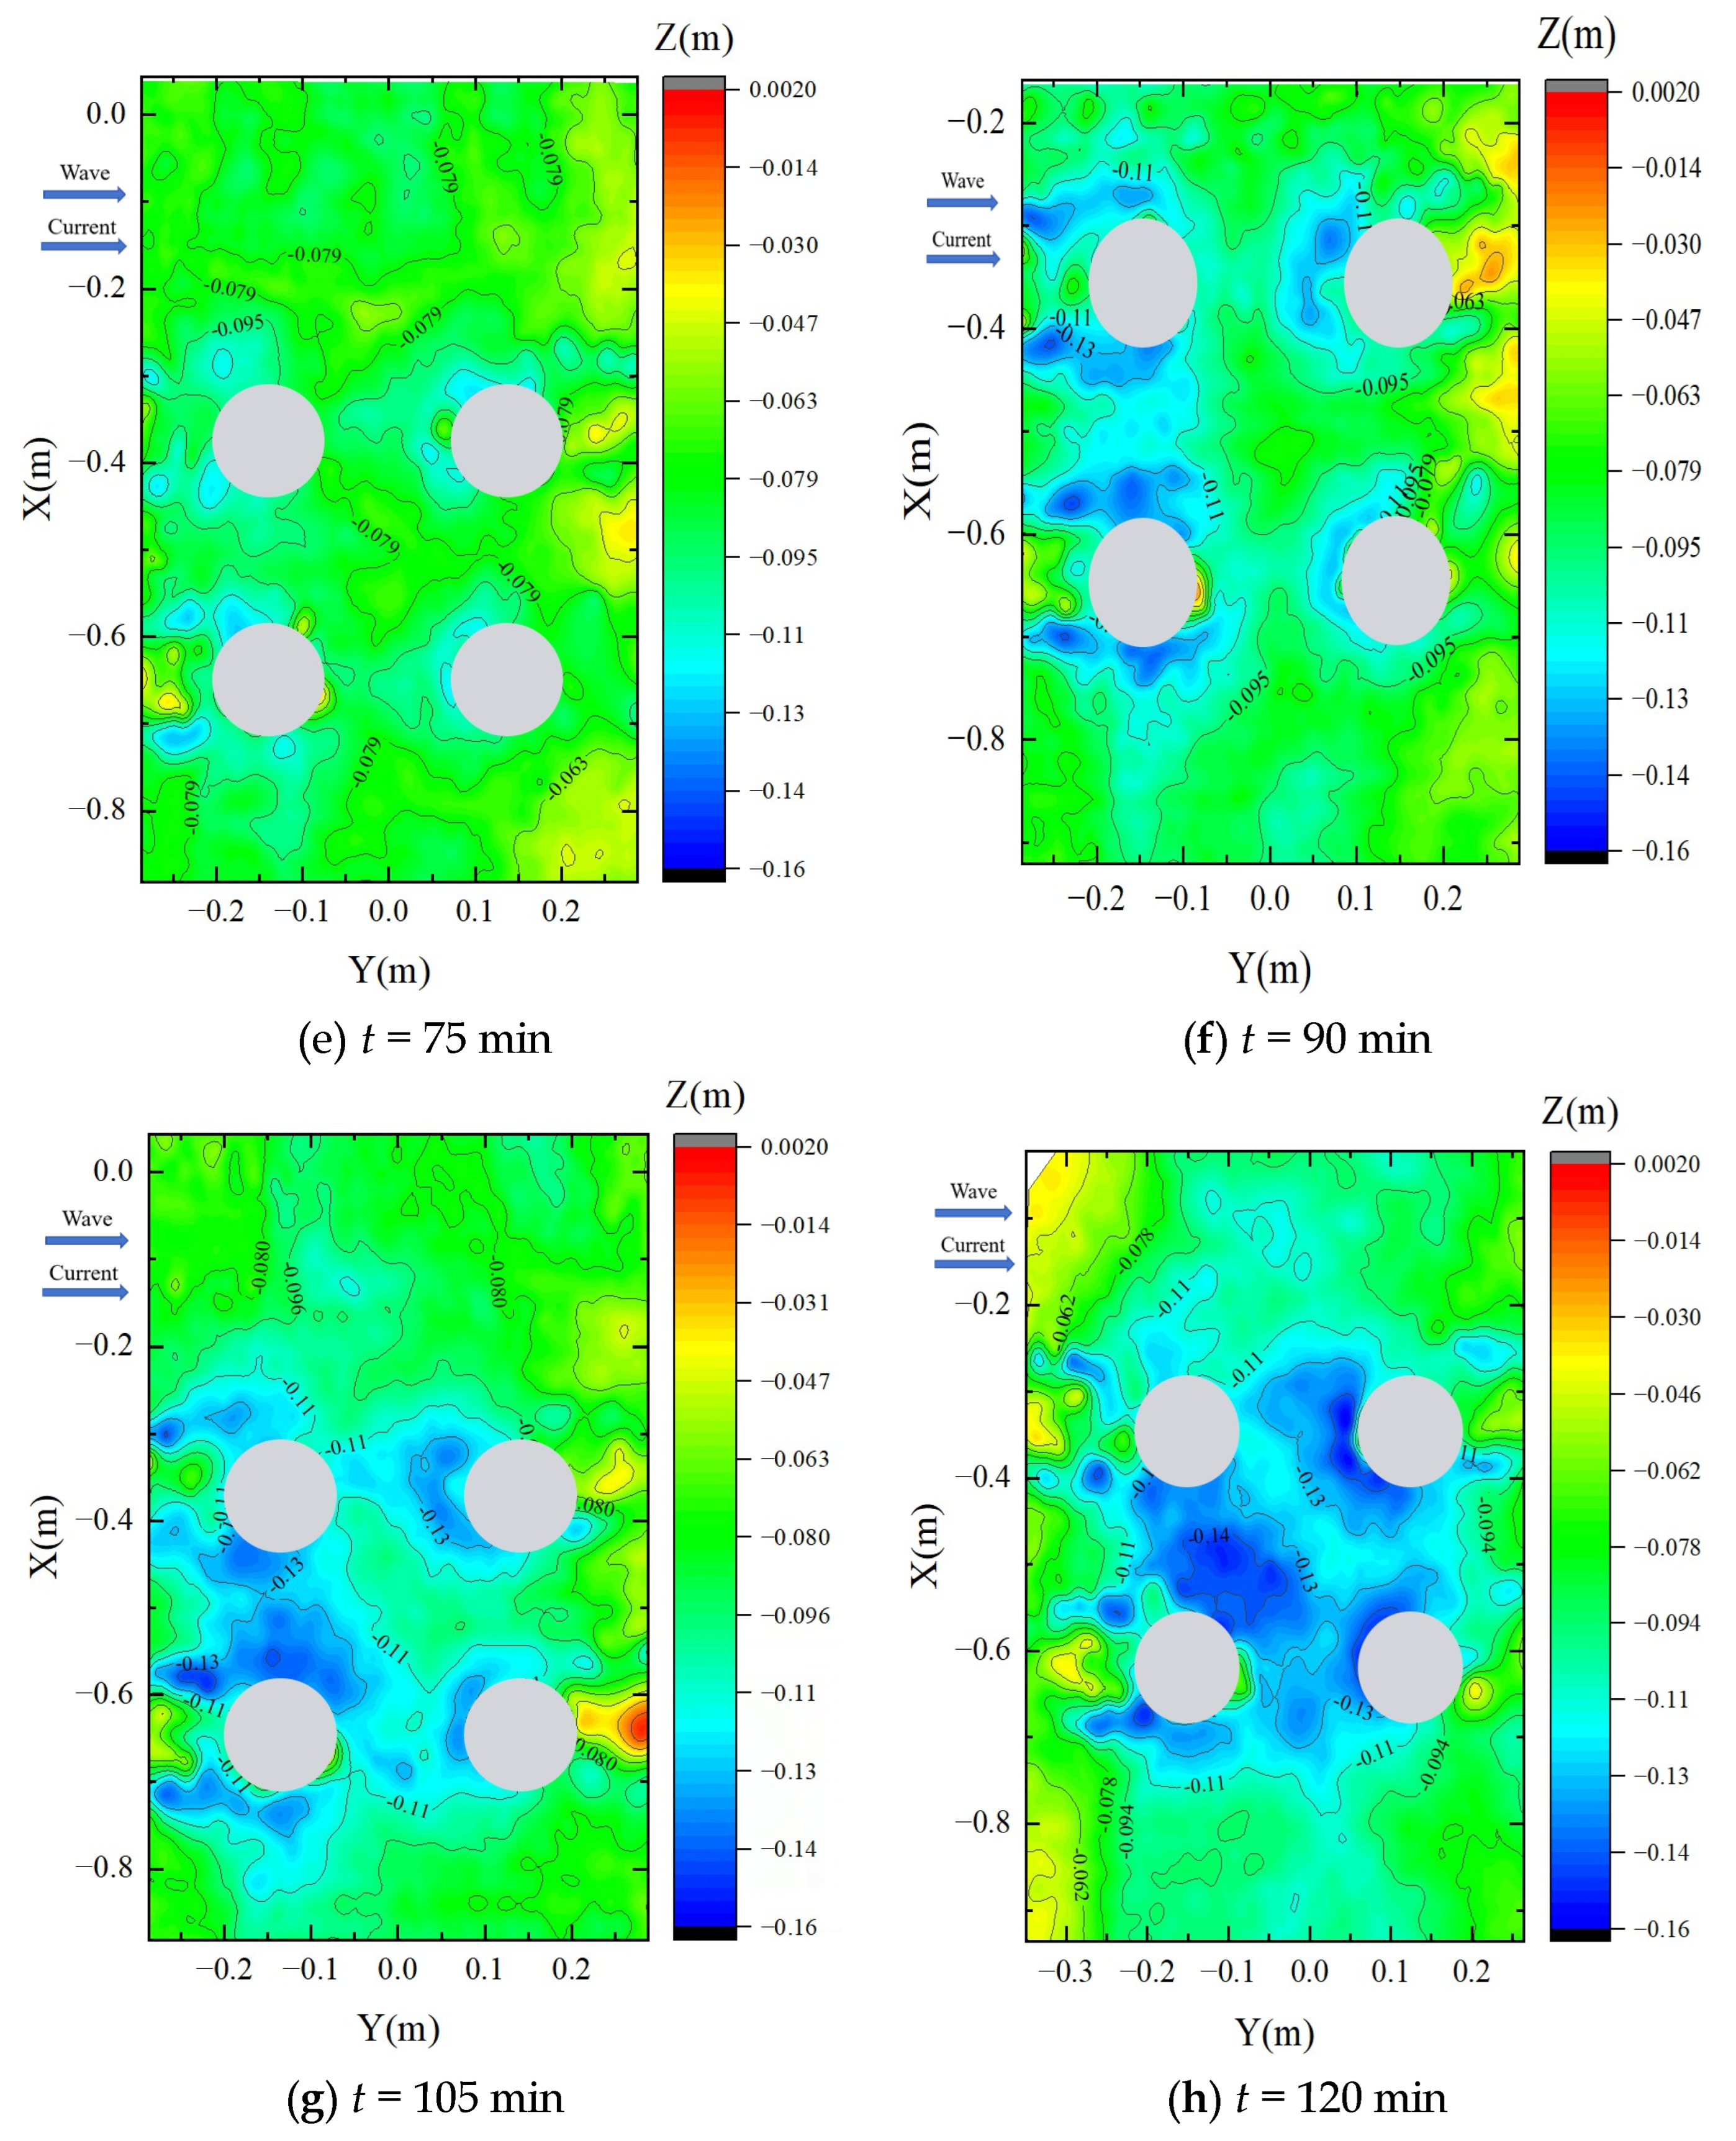
Figure 12 shows the temporal evolution of the seabed morphology around the square pile group during the eight scour development cycles mentioned above. The forward-current case is adopted. As shown in the figures, during the initial stages (i.e., the first hour), only shallow and spatially scattered local terrain changes appear around the upstream and lateral sides of the piles, indicating that local sediment movement is still governed by the early adjustment of the bed to combined wave–current loading. As the test progresses to the second hour, these localized scour pits gradually deepen and merge, forming more distinguishable scour holes adjacent to, in particular, the upstream piles, while mild sediment deposition emerges in the wake region behind the downstream piles. By the final stages (i.e., 105–120 min), the scour pattern becomes significantly more pronounced, with interconnected scour holes within the four piles and a more extensive deposition zone downstream. The morphology after 120 min suggests that the scour process is approaching a quasi-equilibrium state.
The observed scour patterns around the pile group can be attributed to the hydrodynamic mechanisms that govern sediment erosion and deposition under combined wave–current loading. As incident flow approaches the upstream piles, the adverse pressure gradient forces the near-bed streamlines to accelerate near the pile base. This generates a strong three-dimensional horseshoe vortex system, which enhances the local bed shear stress and initiates sediment movement. The horseshoe becomes more intense under combined wave and current conditions, producing progressively deeper scour holes around the upstream pile faces. As the test continues, the flow restriction between adjacent piles further amplifies the local velocity field, enhancing the shear stress of the bed along the lateral edges of the pile group. This results in non-uniform scour that may subsequently merge into a larger, interconnected scour zone, as shown in Figure 12g. In addition, secondary vortices and complex recirculation develop within the pile array due to wake interactions, destabilizing the bed and forming larger scour holes (Figure 12h).
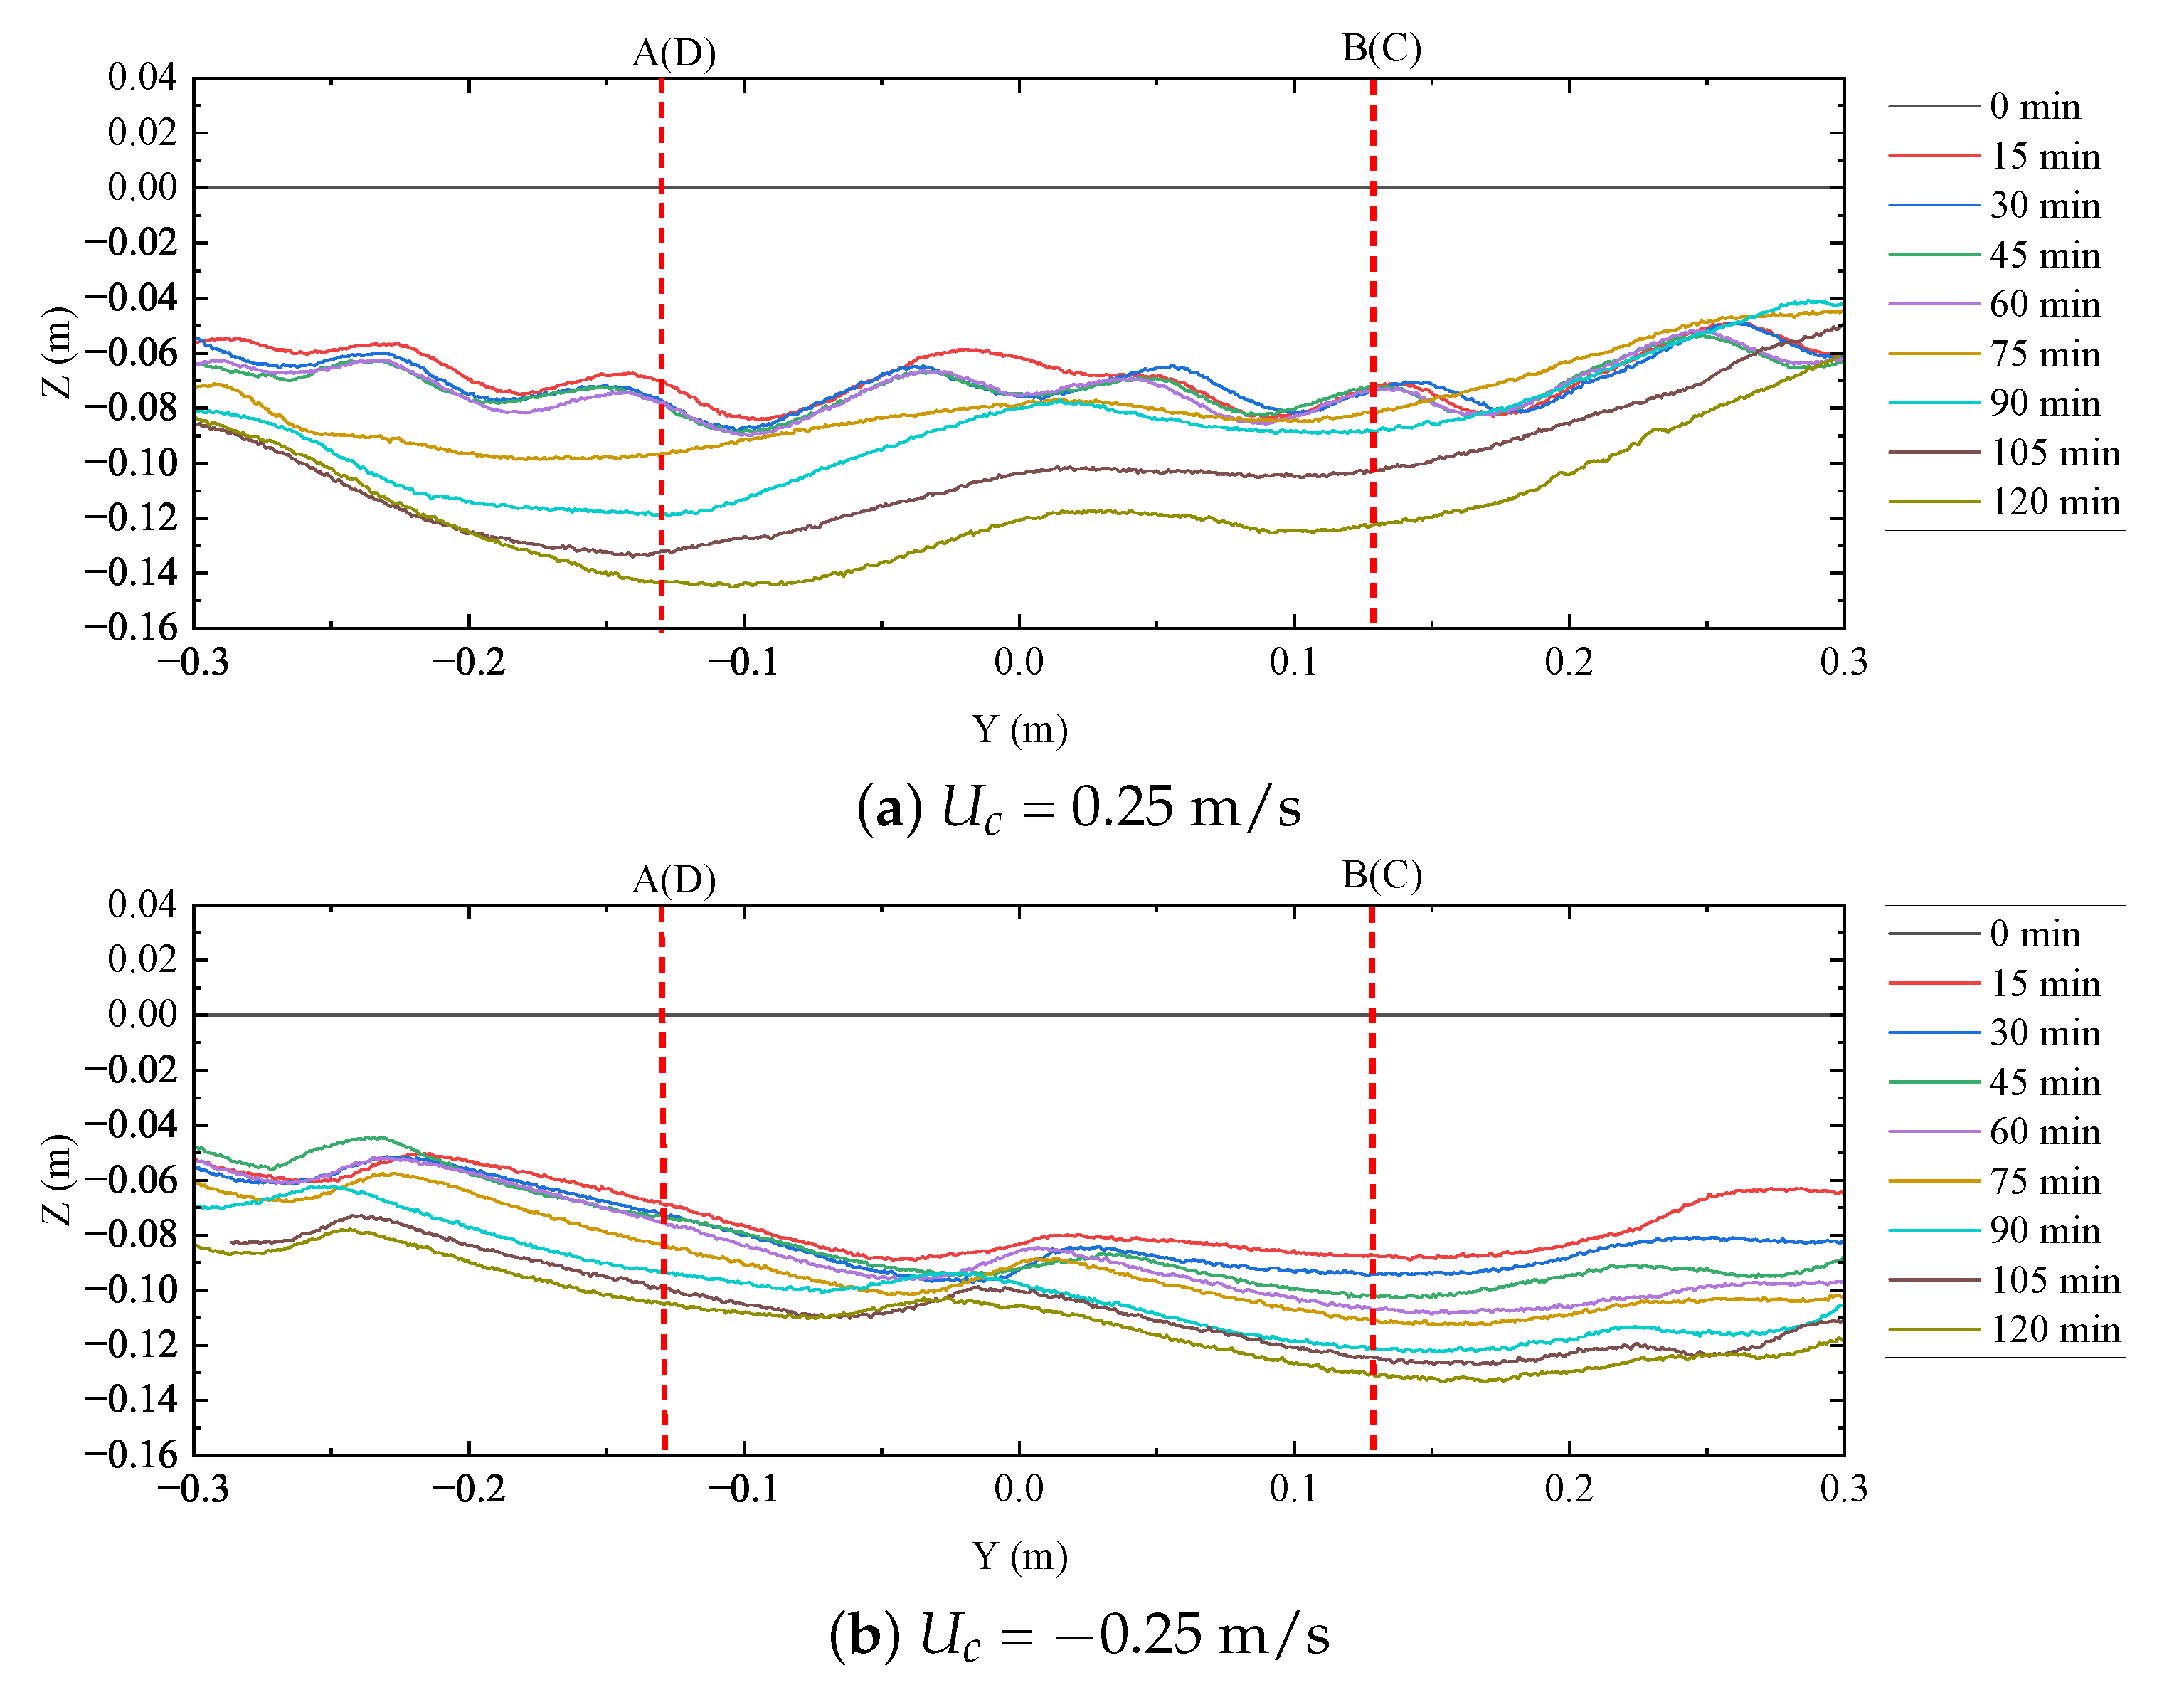
Figure 13 presents the temporal development of the scour depth along the centerline within the pile group under combined wave and current conditions; both the forward current ( U c = 0.25 m/s) and the opposing current ( U c = −0.25 m/s) are considered. The profiles were extracted from the scanned seabed elevation data at successive time intervals to reveal the evolution of local scour and deposition around the pile group. z = 0 indicates the initial horizontal seabed, and the red dashed lines represent the locations of the upstream (A, D) and downstream (B, C) piles. Similar to Figure 12, under the co-current conditions, the scour process develops relatively slowly during the first 60 min, while the scour deepens rapidly, ultimately reaching a maximum depth of around 0.14 m at 120 min. Notably, the deepest scour consistently occurs between the two upstream piles and the area within the pile group interior. In contrast, when the steady current opposes the incident waves ( U c = −0.25 m/s, Figure 13b), the scour develops more uniformly over time, exhibiting an almost linear increase in scour depth from 0 to 120 min. The peak scour, reaching approximately 0.12–0.14 m, shifts downstream and occurs primarily around piles B and C. This spatial shift, compared to the co-current condition, arises because the dominant steady current component reverses the position of the primary horseshoe vortex and relocates the highest near-bed shear stress to the downstream side of the array. Additionally, the upstream region under this reversed-current condition experiences weaker flow and reduced vortex intensification, leading to smaller scour depths relative to the co-current case.
Comparison of the two cases demonstrates that the interaction between wave propagation and the steady current direction strongly alters the pile group scour pattern. In the co-current scenario, the wave–current flow enhances the incident wave velocities, promoting vortex amplification, gap acceleration, and sediment movement in the upstream region. Conversely, in the counter-current case, the scour develops more gradually but becomes more significant around the rear piles, where the combined effect of reversed horseshoe vortices and wake reattachment zones drives enhanced sediment removal.
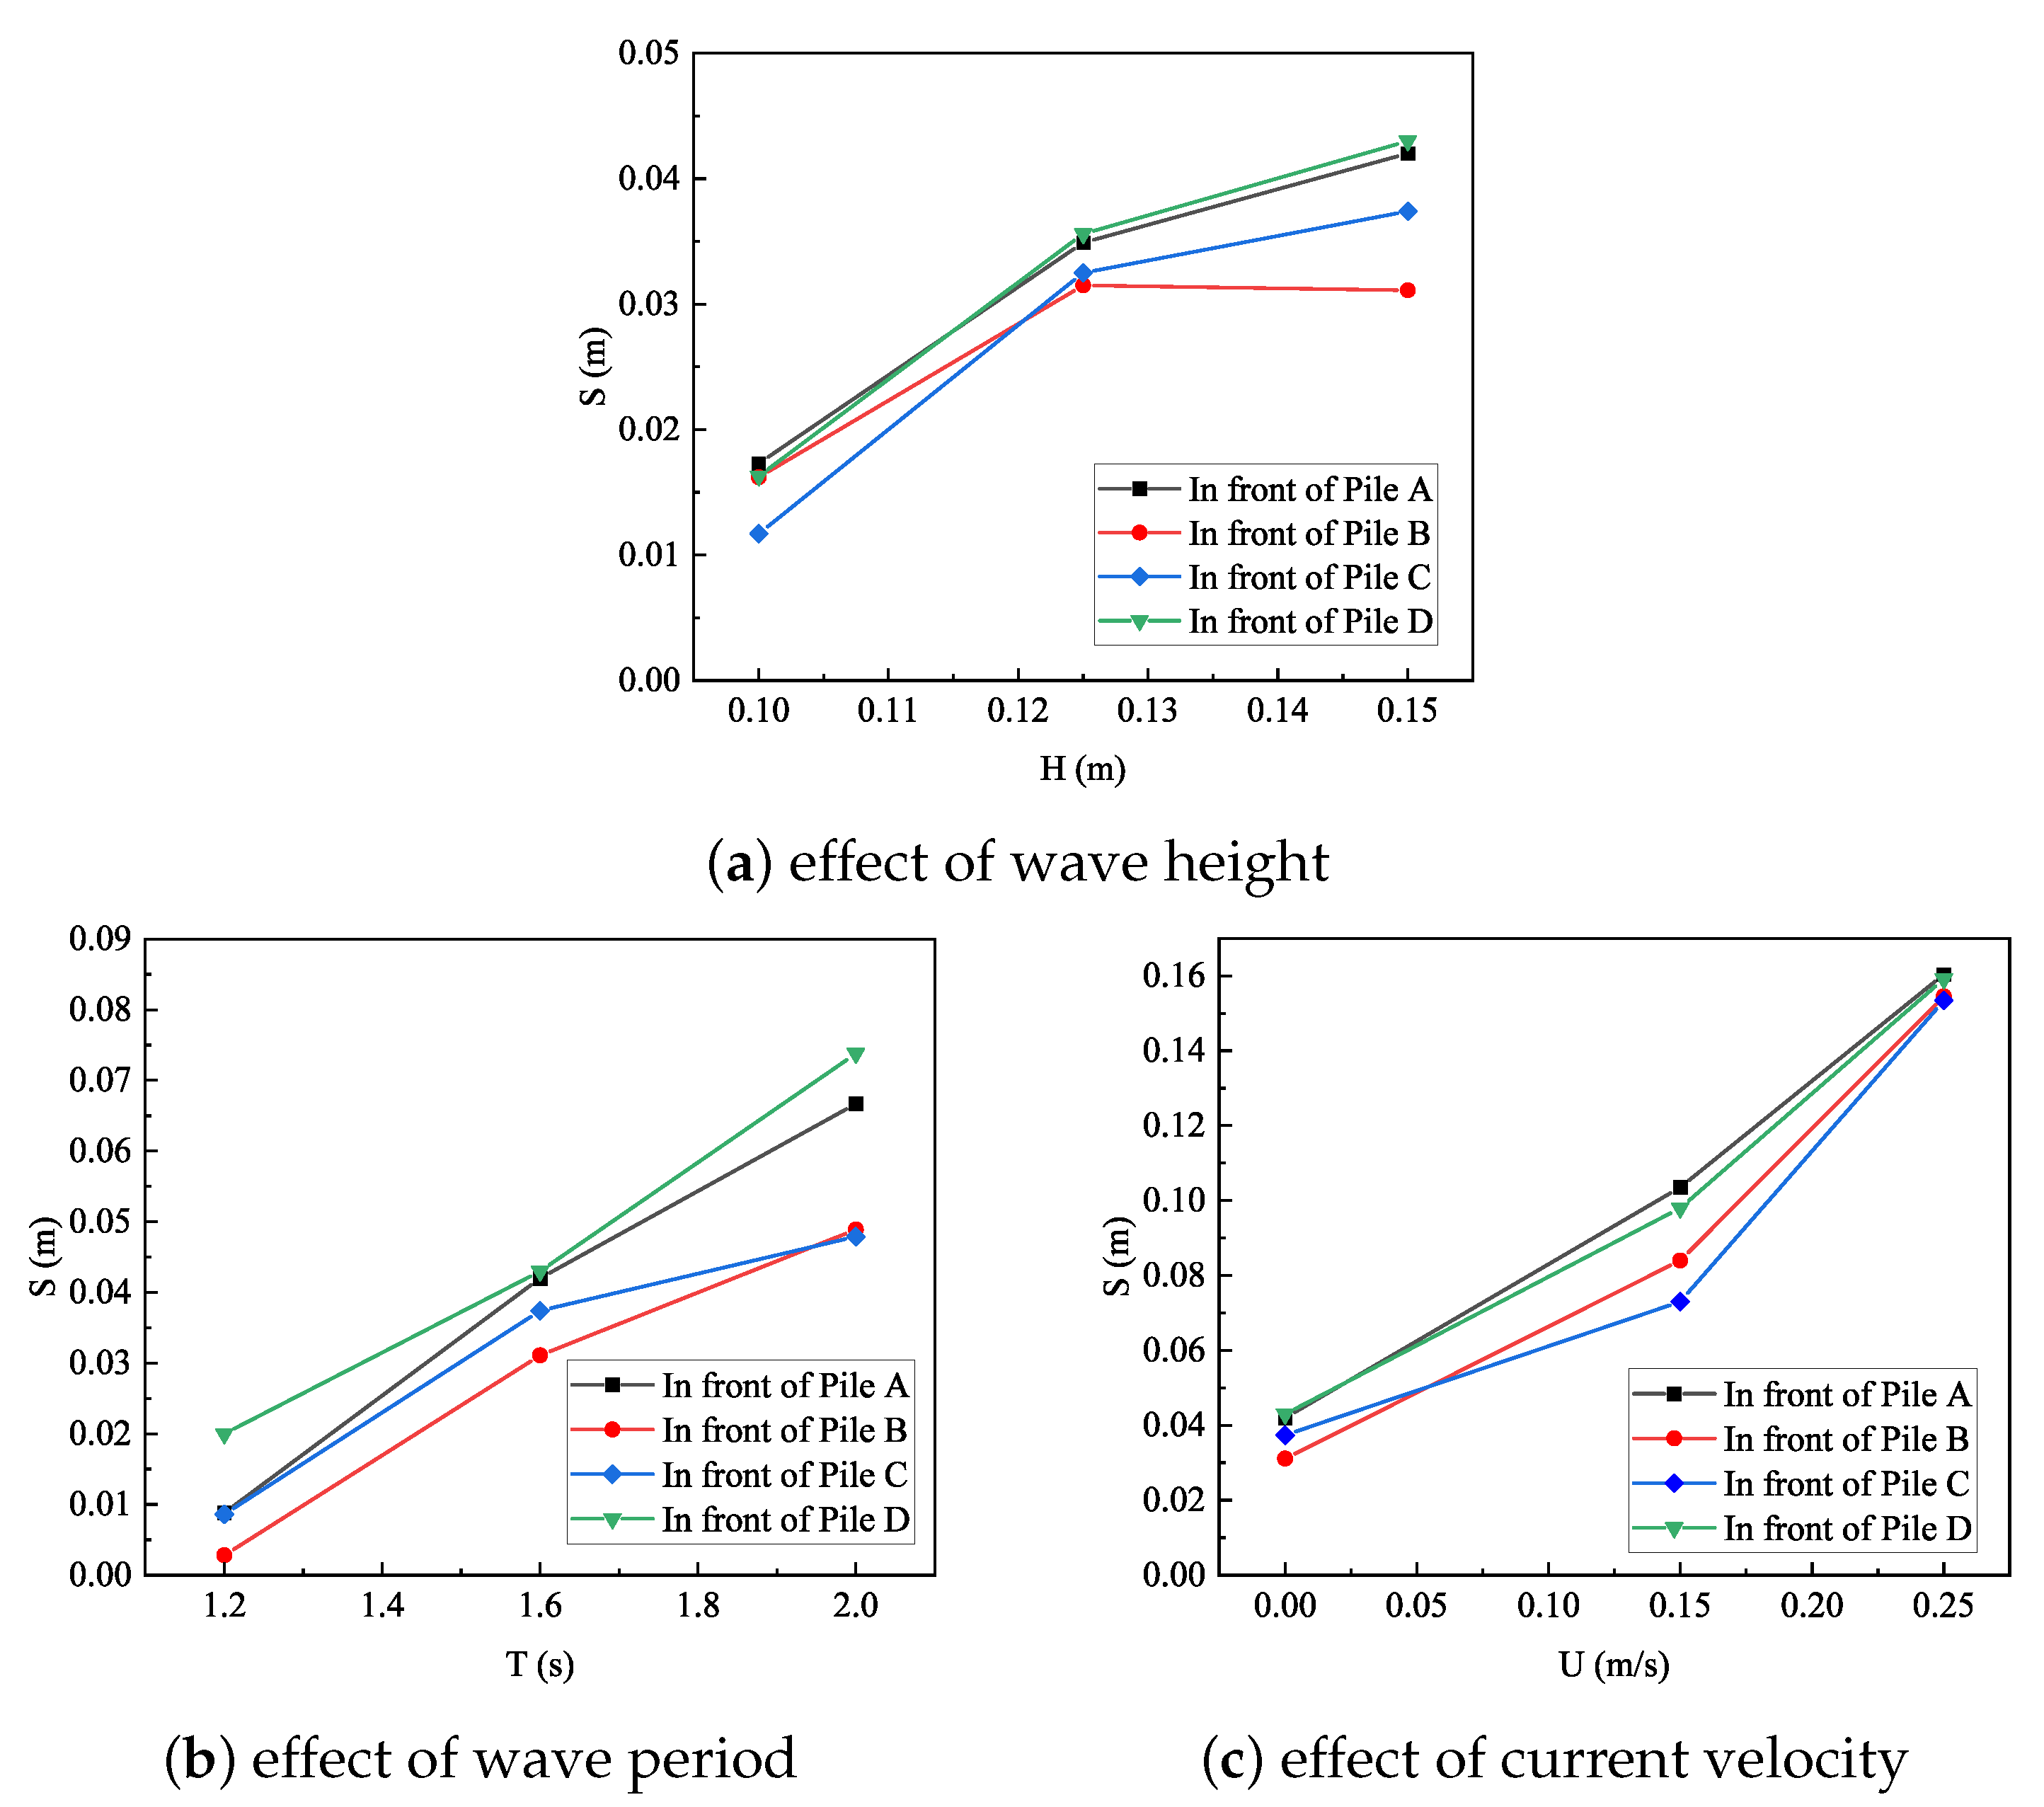
Figure 14 summarizes the parametric effects of wave height (H), wave period (T), and current velocity ( U c ) on the maximum scour depth in front of the square pile group. The scour depth (S) was measured on the face upstream of each pile (A–D) at the end of the experiments (t = 120 min). As shown in Figure 14a, an increase in wave height leads to an increase in scour depth for all four piles. When the wave height increases from H = 0.10 m to H = 0.15 m, the maximum scour depth approximately doubles, increasing from around 0.015 m to 0.04 m. This reflects the enhanced near-bed orbital velocity and oscillatory bed shear stress associated with larger wave heights, intensifying the scouring process around the pile bases. In addition, minor differences among the four piles are observed, with slightly larger scour depths typically occurring at the front row piles (i.e., A and D) due to local flow concentration by the square layout.
Figure 14b illustrates the influence of the wave period on the scour depth of the pile group. Longer wave periods produce significantly deeper scour, with the maximum depth of scour increasing from approximately 0.01–0.02 m at T = 1.2 s to 0.05–0.07 at T = 2.0 s. This might be attributed to longer-waves inducing larger orbital excursion lengths and prolonged high-velocity phases near the bed, therefore strengthening the horseshoe vortex and promoting the scouring process.
The effect of the co-directional current velocity on the scour depth around the pile group is shown in Figure 14c. The scour depth increases in an essentially monotonical manner with current velocities, reaching values of 0.14-0.16 m at U c = 0.25 m/s, which is substantially larger than those induced by waves alone. Compared with hydrodynamic parameters, the current velocity exerts the most pronounced effects on the scour depth in the vicinity of the pile group, indicating the dominant role of the steady current component in intensifying near-bed shear stress and vortex-induced local scour under combined wave and current conditions. Overall, the results show that while both wave height and wave period can affect the development of local scour depth, the presence and magnitude of the current play a dominant role in determining the maximum scour depth around the pile group under combined wave–current conditions.

3.4. Local Scour for Various Pile Group Arrangements

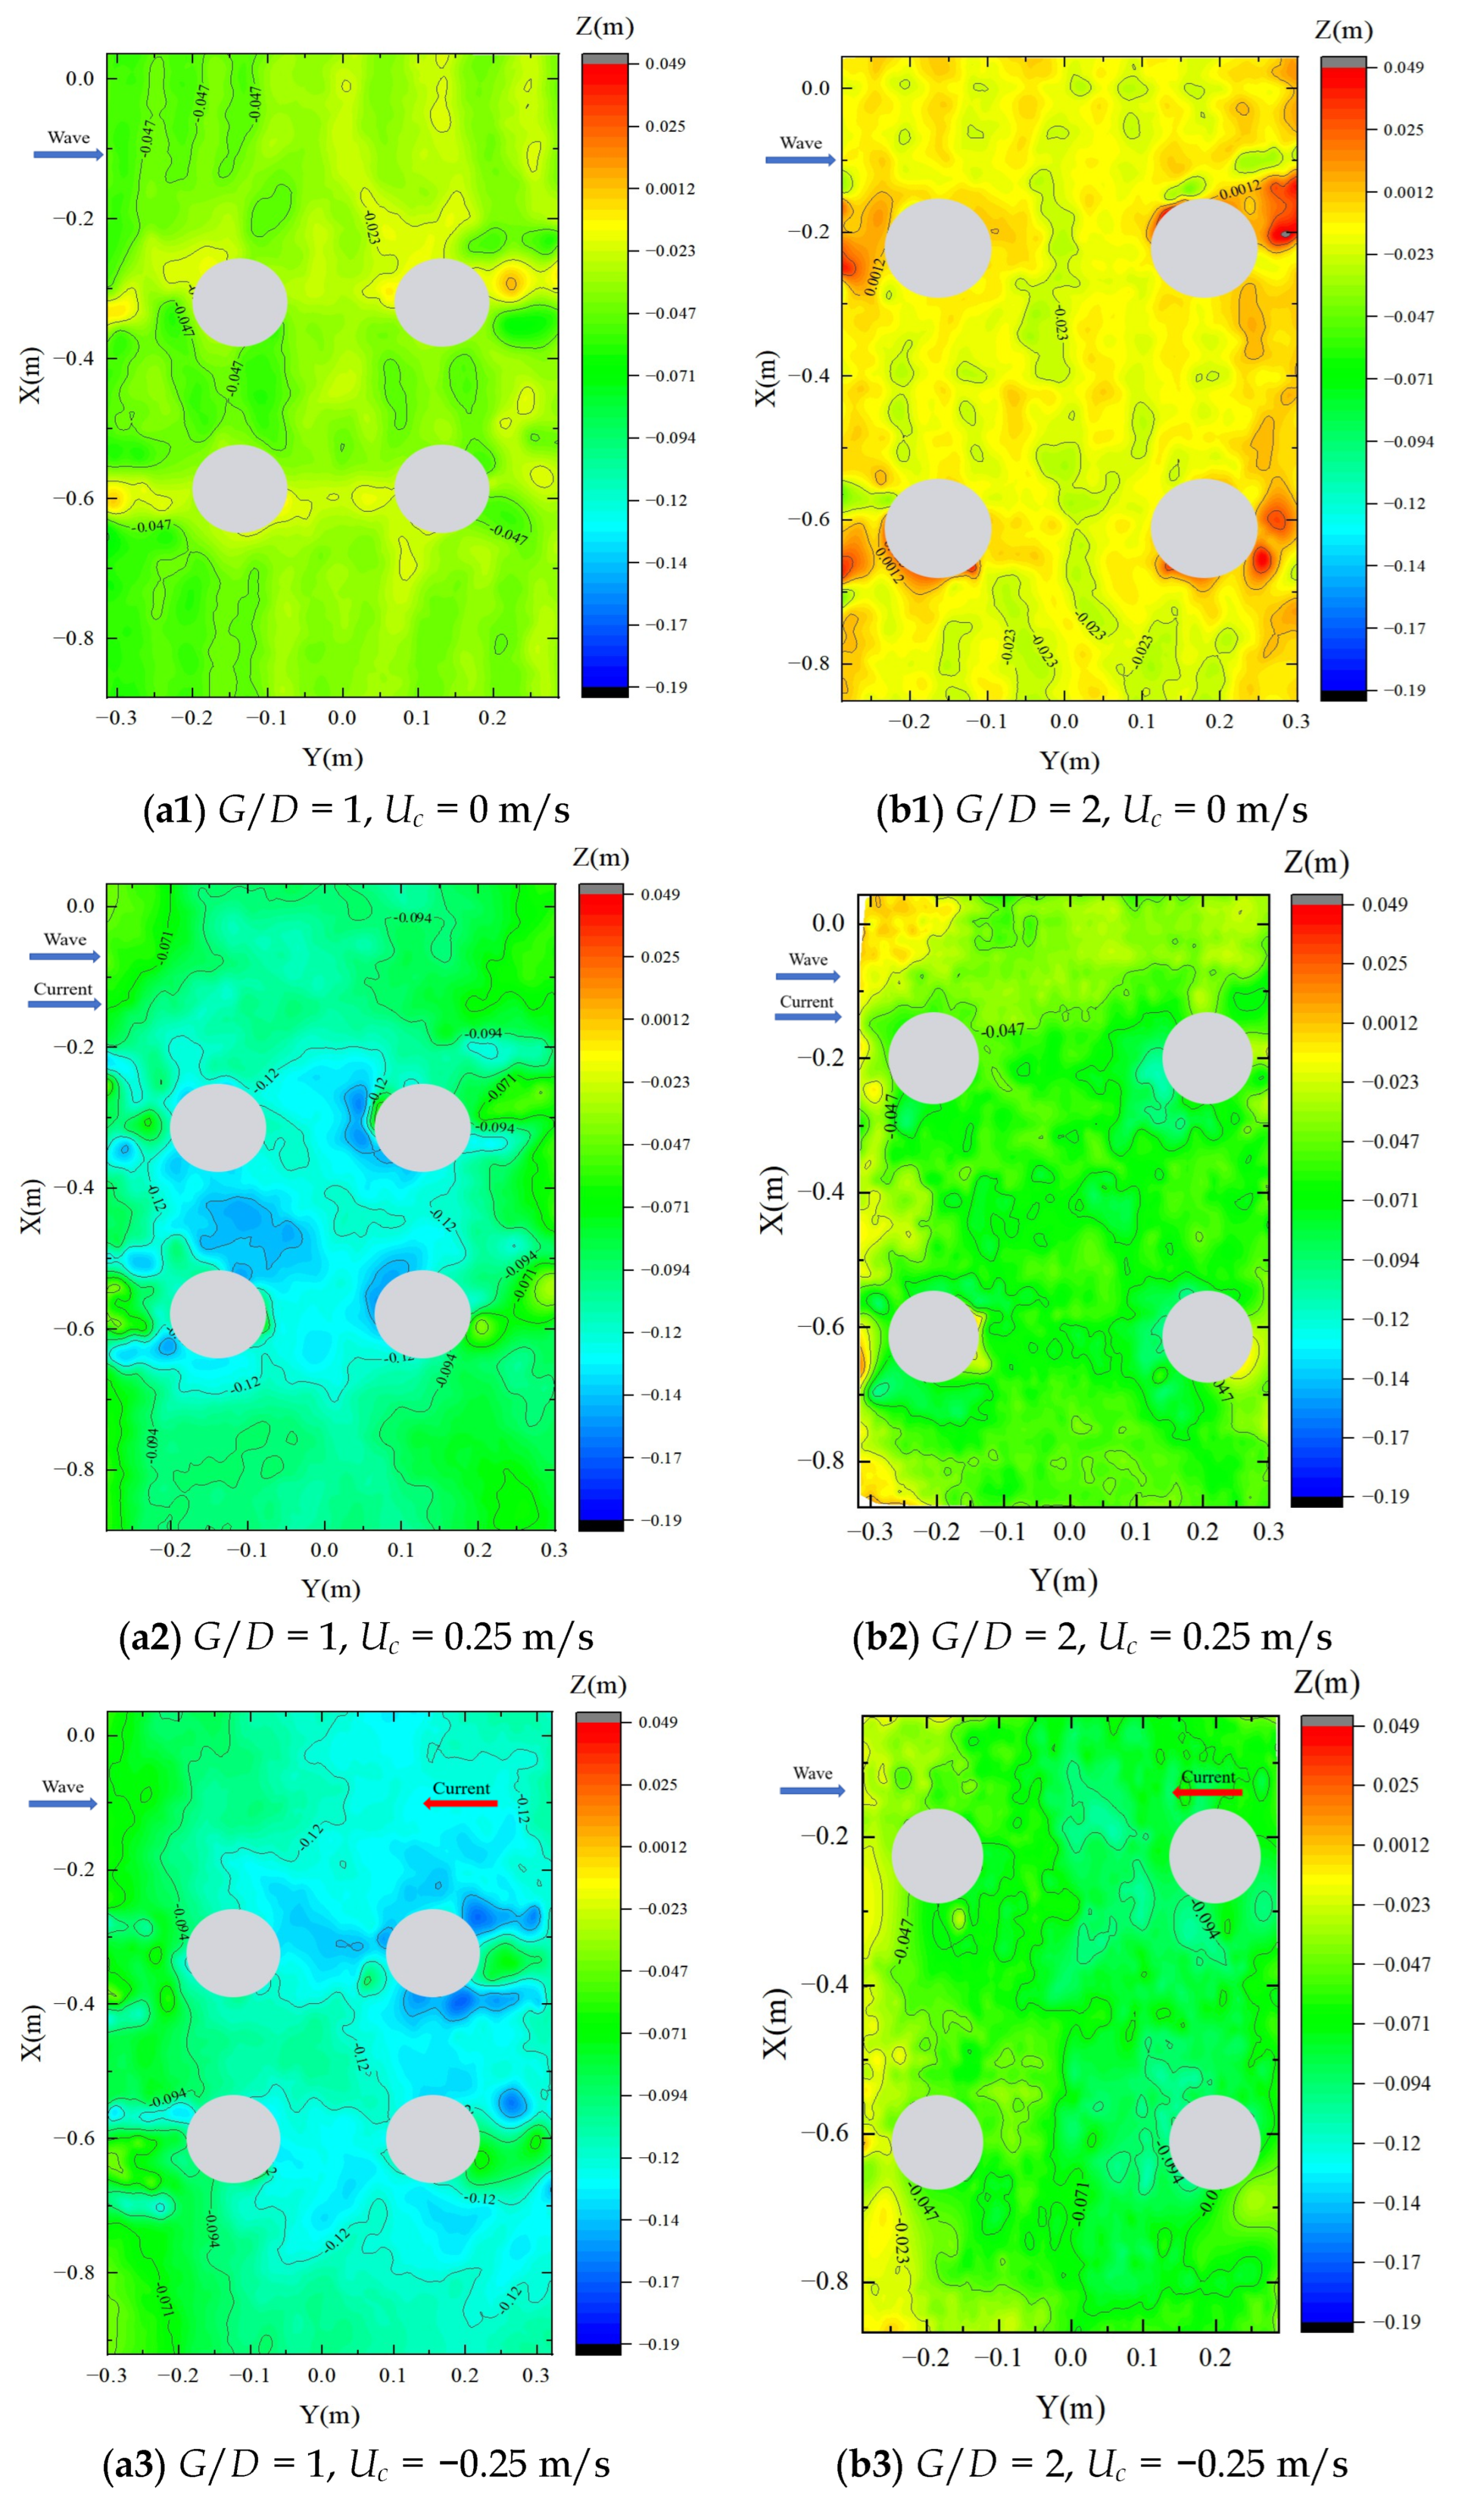
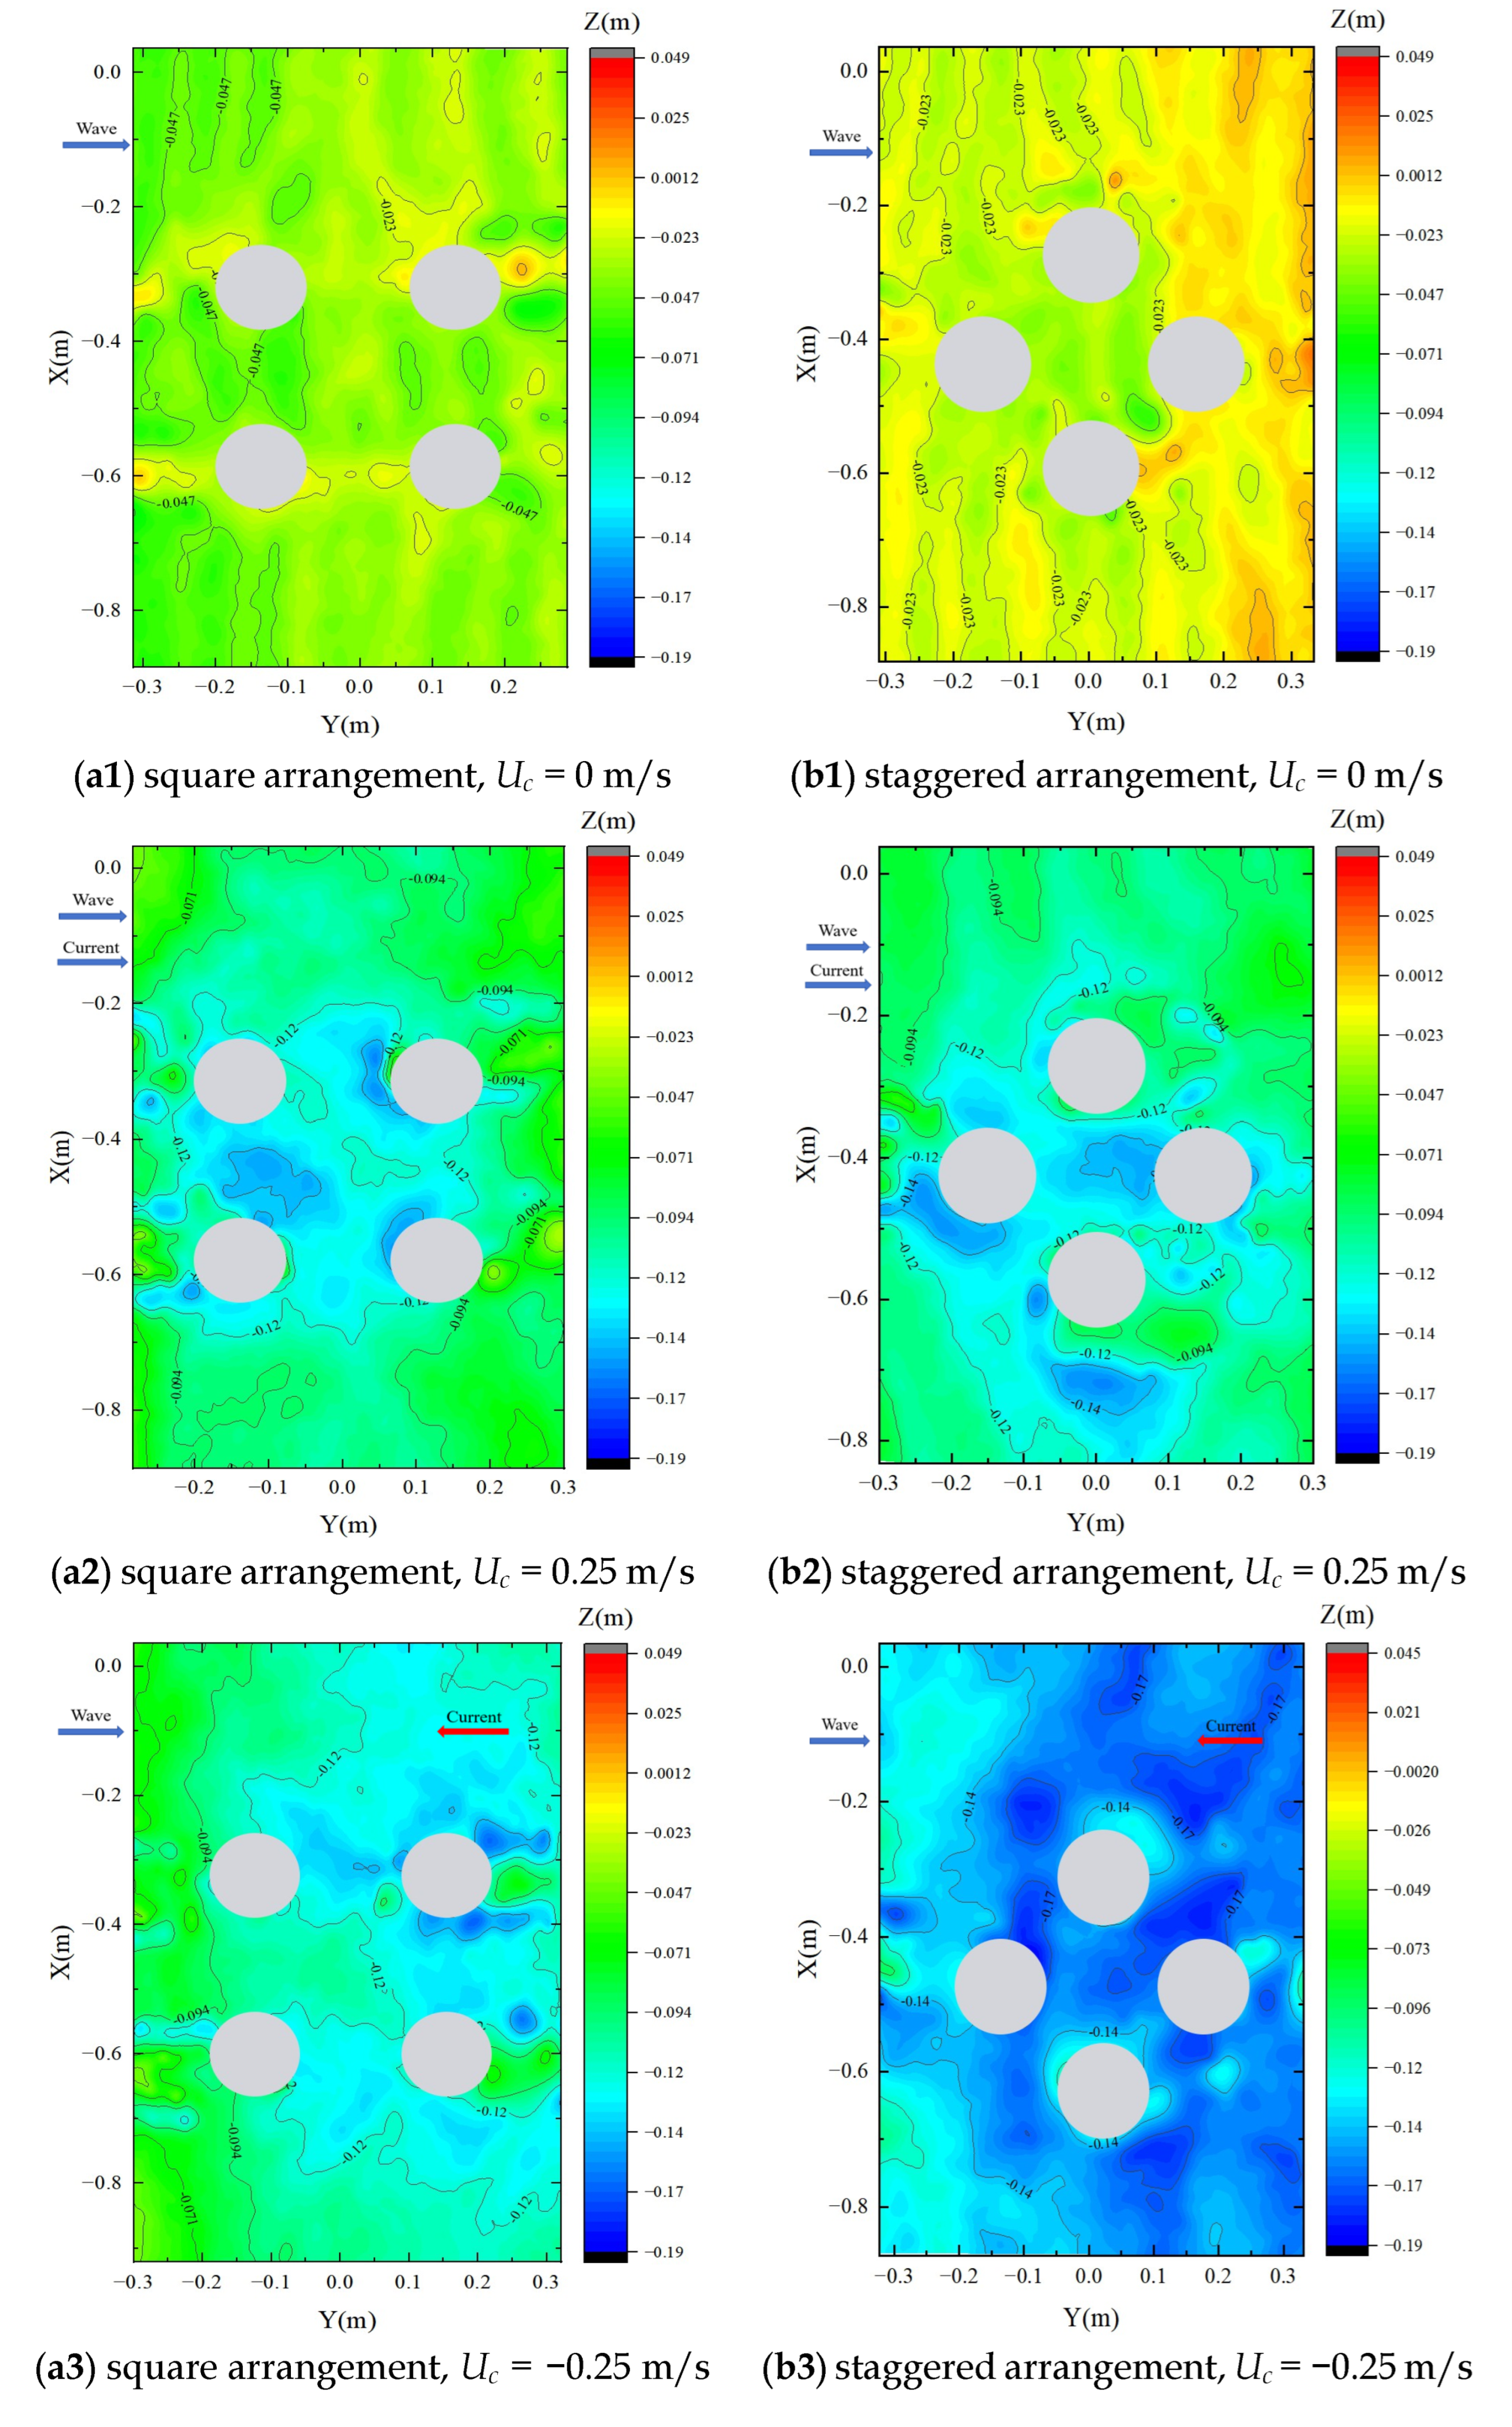
In this sub-section, the seabed scour morphologies around pile groups with different spacings and arrangements under wave-only, wave–forward current, and wave–opposing current conditions are examined. The scanning bed elevation contours shown in the following sub-section correspond to the final stage of the experiments, highlighting the cumulative effects of wave/current–pile group interactions on local scour development.
As illustrated in Figure 15, increasing the pile spacing of the square arrangement from G / D = 1 to G / D = 2 significantly alters both the intensity and spatial distribution of the local scour around the pile groups. Under wave-only conditions, the overall scour intensity remains relatively mild for both spacings; however, the presence of a steady current (both the forward current and the opposing current) dramatically amplifies the spacing effect, with the G / D = 1 configuration exhibiting substantially deeper and more continuous scour morphology compared with the G / D = 2 case. For the closer spaced pile group (i.e., G / D = 1), the scour holes around individual piles tend to merge, forming an interconnected local scouring zone within the interior of the pile array, particularly under combined wave–current loading. This behavior indicates strong hydrodynamic interaction between adjacent piles, where flow contraction and gap-induced acceleration enhance near-bed shear stress and promote sediment removal within the pile arrays. In contrast, for the wider spacing case (i.e., G / D = 2), the scour patterns are more localized around individual piles, and the interaction between adjacent scour holes is considerably weakened. The reduced hydrodynamics within the pile array leads to lower velocities in the inter-pile regions, thereby limiting scour development between piles. Quantitatively, the maximum scour depth at the end of the tests is approximately 0.16–0.19 m under combined wave–current loading for G / D = 1, whereas for the larger spacing ( G / D = 2), the corresponding maximum scour depth is reduced to about 0.09–0.10 m. This represents a reduction of roughly 30–40% in the maximum scour depth, indicating the strong effects of pile spacing on local scouring.
Figure 16 further demonstrates the influence of pile arrangements on local scour development for a fixed spacing of G / D = 1. Two pile arrangements are considered, namely the square arrangement (Figure 16a) and the staggered arrangement (Figure 16b). Compared with the square arrangement, the staggered arrangement produces a more complex and asymmetric scour pattern, especially under combined wave–current conditions. In the staggered configuration, the staggered alignment disrupts the symmetry of the flow field and enhances wake interaction between upstream and downstream piles. This results in intensified scour around downstream piles and within the central region of the array, where overlapping wake vortices and flow circulation are more pronounced. Under wave–forward current conditions, the staggered arrangement exhibits deeper and more spatially extensive scour than the square arrangement, indicating the stronger cumulative effects of horseshoe vortices and wake-induced local scour. Under wave–opposing current conditions, the staggered layout further enhances the asymmetry of the scour field, with the deepest scour shifting toward the downstream side of the array in accordance with the dominant steady current direction.
The results presented demonstrate that both pile spacing and pile arrangement exert significant, yet distinct, influences on the development of local scuffs around pile groups under combined wave–current loading. The observed differences in scour behavior among the various pile spacings and arrangements can be attributed to the acceleration of the flow, the interaction of the vortex, and the sediment transport pathways within the pile group. Small, spaced piles and staggered layouts intensify flow acceleration and promote the interaction of horseshoe vortices and wake vortices, leading to enhanced bed shear stress and more severe local scour. In contrast, increased pile spacing and more orderly arrangements reduce hydrodynamic interference between piles, resulting in weaker local scour. Therefore, several engineering implications can be drawn for the design of pile group:
1.
Increasing the pile spacing can substantially reduce the maximum scour depth and prevent the formation of interconnected scour holes within the pile array, especially when the currents coexist with waves.
2.
Although staggered arrangements may improve structural efficiency or load distribution, they tend to have larger and deeper local scour, especially around downstream piles. For cases where downstream scour is critical, a square or more ordered arrangements my be preferable to limit local scour.
3.
The direction of current is the dominant factor that strongly influences the position of maximum scour. Scour protection measurements should be tailored to current direction: the protection should be concentrated on upstream piles for co-directional currents and downstream piles for opposing currents, rather than uniformly applied to the entire pile group.

3.5. Irregular Wave-Induced Pore-Water Pressure and Local Scour Around Pile Groups

Building on regular wave experiments, this study further investigates seabed responses and local scouring characteristics around pile groups under irregular wave conditions. The JONSWAP spectrum model is adopted for wave generation in irregular wave generation conditions [43]:
S ( f ) = β J H 1 / 3 2 T p 4 f 5 exp [ 1.25 ( T p f ) 4 ] γ exp [ ( T p f 1 ) 2 / 2 σ 2 ] ,
β J = 0.06238 0.23 + 0.033 γ 0.185 ( 1.9 + γ ) 1 × [ 1.094 0.01915 ln γ ]
T p = T 1 / 3 1 0.132 ( γ + 0.2 ) 0.559 , σ = 0.07 , f f p 0.09 , f f p ,
The key parameters of this spectral model include characteristic period T p (wave period corresponding to the peak point of the spectrum), characteristic frequency f p ( f p = 1 / T p ), and peak enhancement factor γ (controlling the sharpness of the spectral peak, with a standard value range of 1.0–7.0). H 1 / 3 and T 1 / 3 are the significant wave height and significant wave period, respectively. σ is a peak shape parameter. In this experiment, γ = 3.3 is adopted. Similar to the regular wave tests, the total duration for the irregular wave test is 120 min, and the test is divided into eight consecutive runs, each lasting 900 s (around 600 waves).
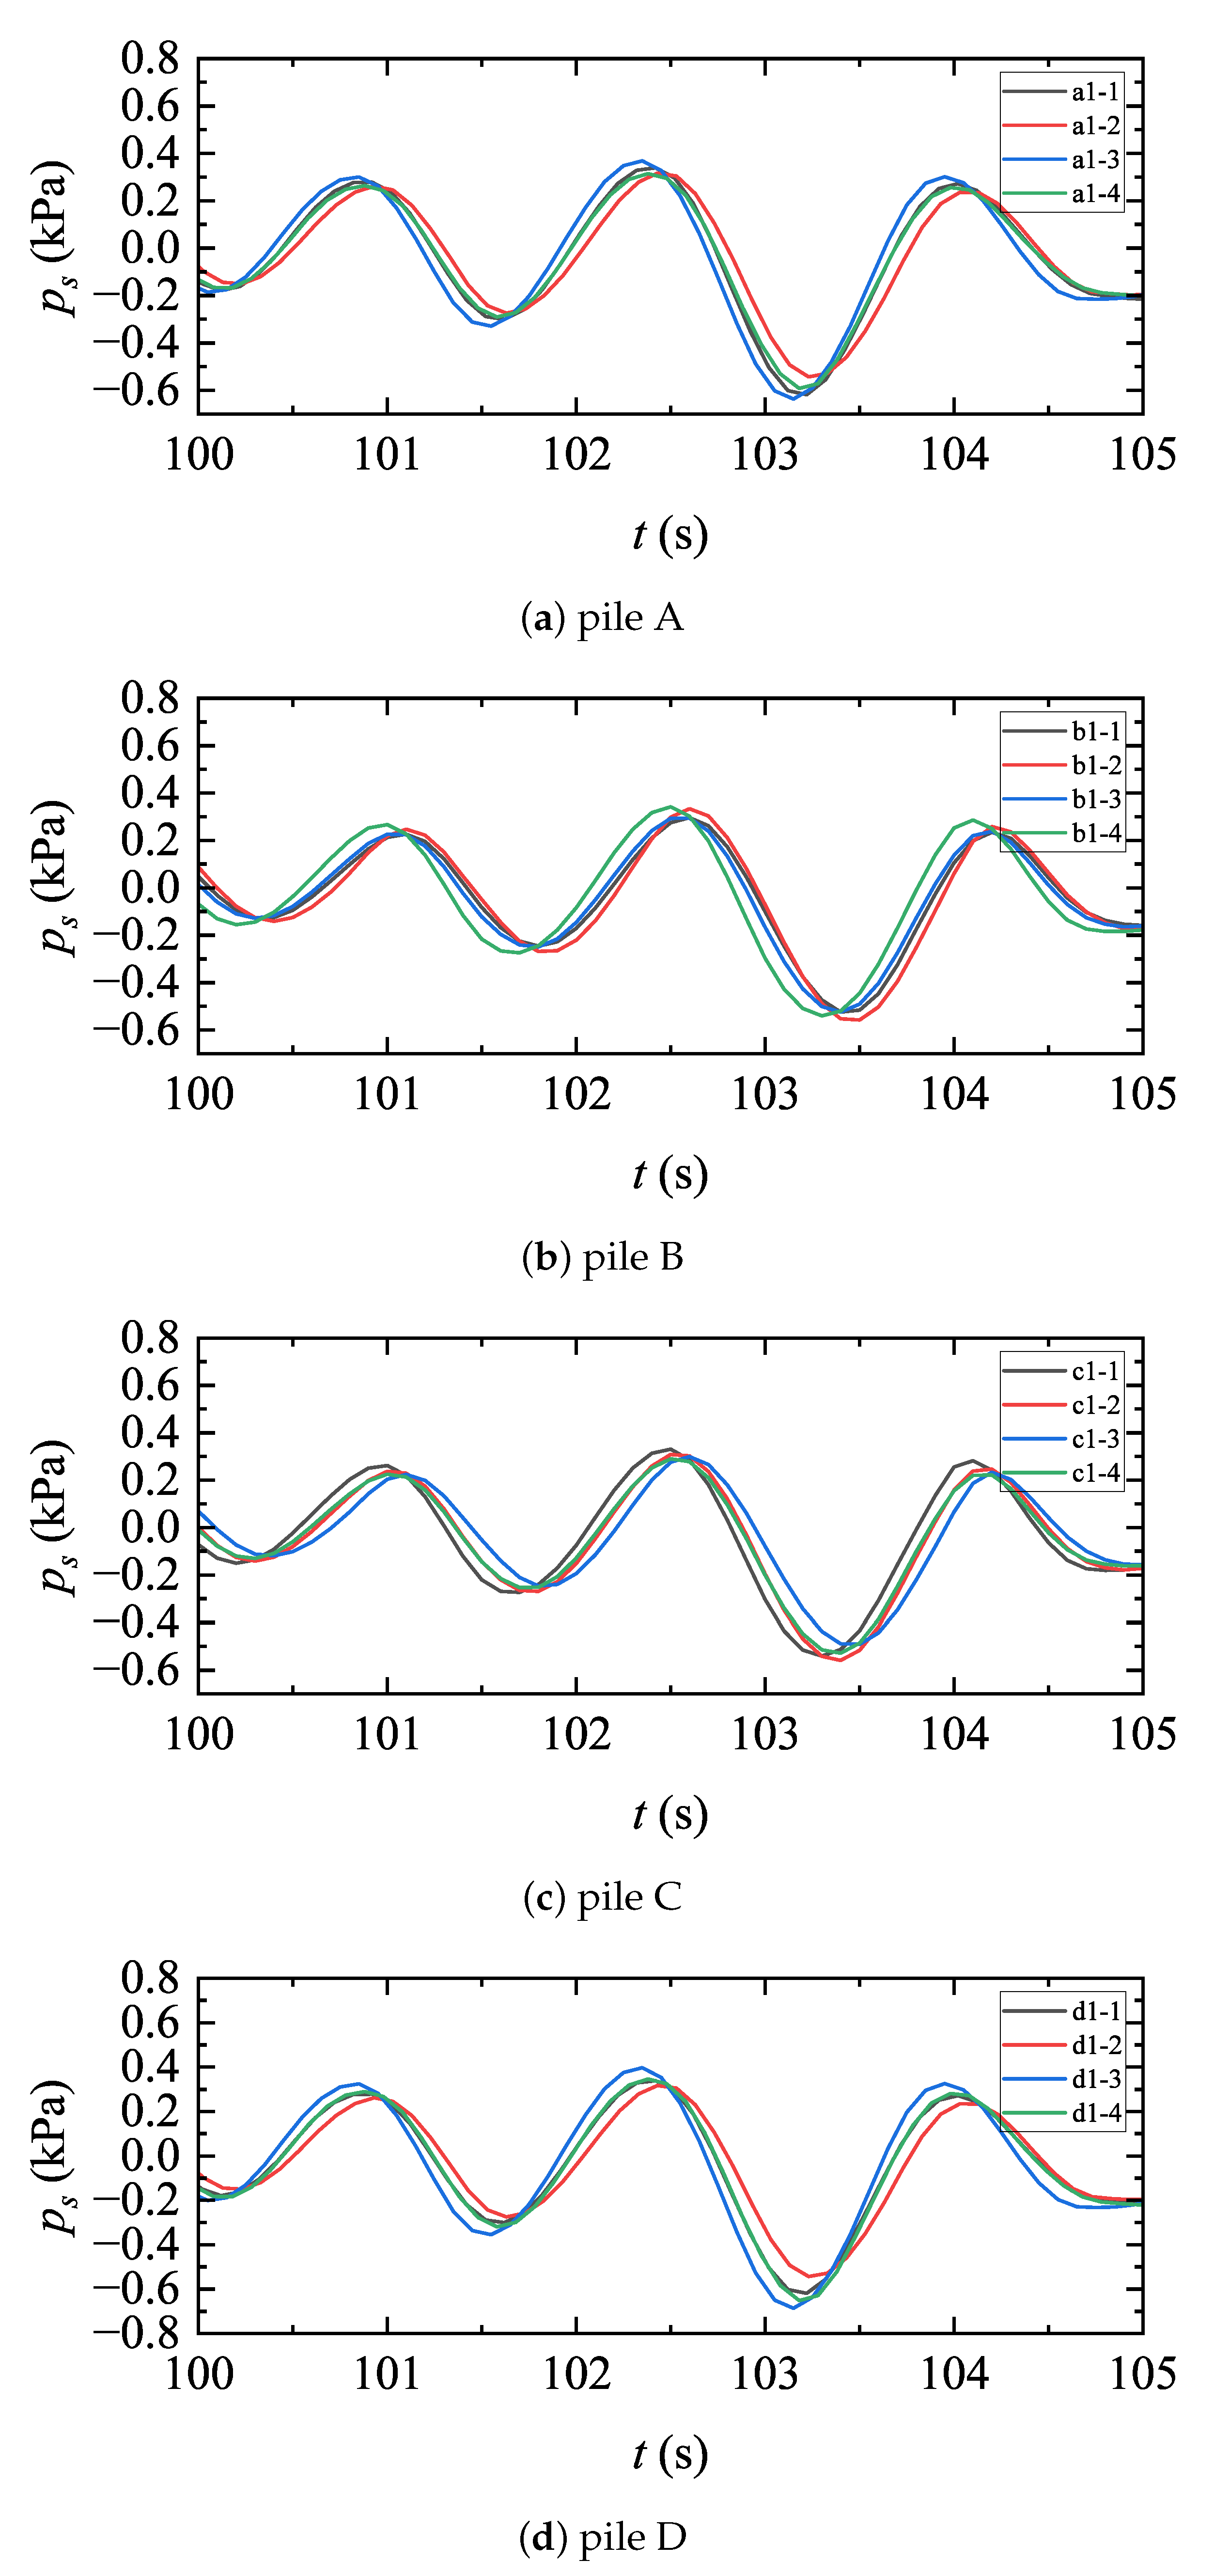
Figure 17 presents representative time series of pore-water pressure measured on pile surfaces under irregular waves generated using the JONSWAP spectrum, with H 1 / 3 = 0.15 m, T 1 / 3 = 1.6 s, and U c = 0 m/s. Compared with the nearly periodic pressure oscillations observed under regular waves, the pore-water pressure under irregular waves exhibits pronounced non-stationary and random characteristics, reflecting the stochastic nature of the incident wave field. Despite the randomness, the oscillatory pore-water pressures at different locations on the pile surfaces remain well correlated in phase. The pressure amplitudes vary from cycle to cycle, attributed to the superposition of multiple wave components within the JONSWAP spectrum. A comparison among different piles reveals moderate spatial variability in pressure magnitude, which suggests that, under irregular wave conditions without a steady current, the pore-water pressure is controlled mainly by the incident wave spectrum, and pile–pile interaction plays a secondary role. The observed pressure fluctuations are expected to induce cyclic variations in effective stress within the seabed, which may contribute to sediment loosening and accelerate the initiation and development of local scour around the pile group.
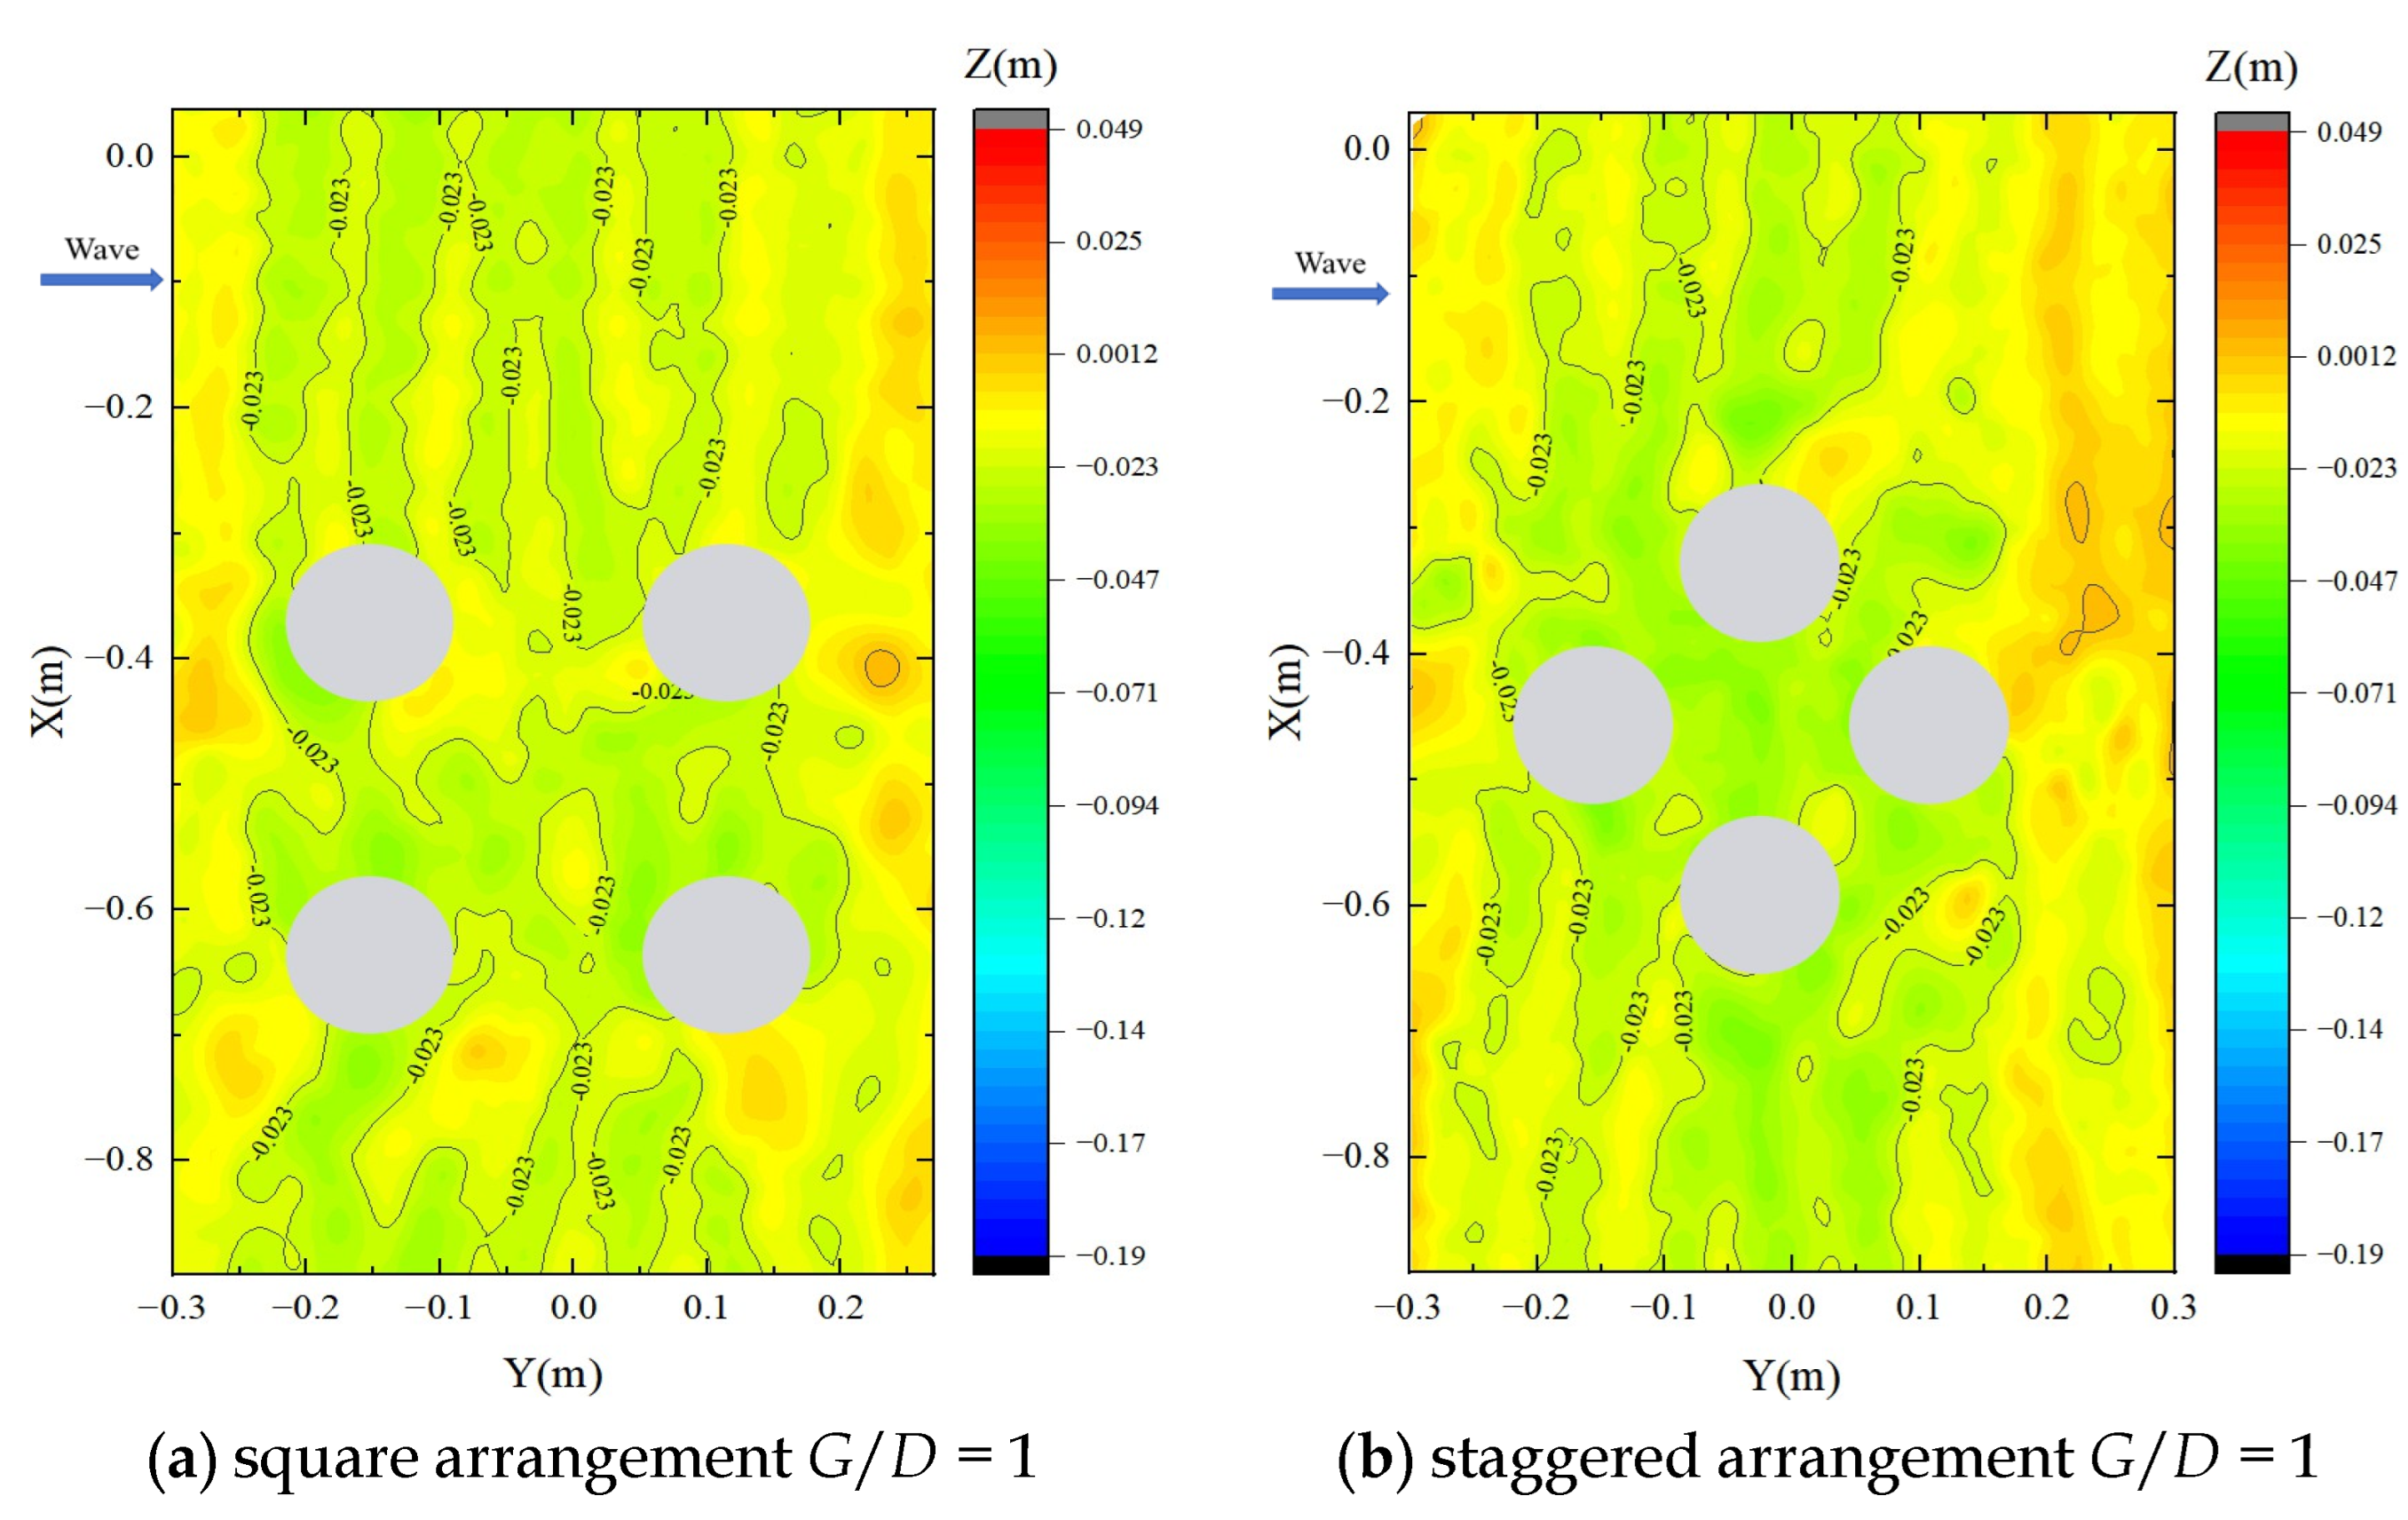
Figure 18 presents the final-stage seabed morphologies under the action of irregular waves around square and staggered pile groups, respectively. Compared with regular wave cases (Figure 16(a1,b1)), irregular waves produce more heterogeneous hydrodynamics characterized by intermittent high-energy wave groups and variable near-bed orbital velocities. As a result, the local scour patterns induced by irregular waves exhibit more spatially diffused and less symmetric characteristics, reflecting the stochastic nature of the hydrodynamics of the near-bed induced by irregular waves. This leads to shallower but more widespread scour patterns forming around the pile groups, in contrast to the more localized and deeper scour holes typically observed under regular waves with comparable representative wave parameters.
For the square arrangement (Figure 18a), shallow local scour develops primarily around the upstream faces of the piles, while the inter-pile region experiences limited local scouring. The absence of a steady current reduces flow asymmetry and weakens the intensity of horseshoe vortices, resulting in relatively moderate local scouring. Nevertheless, small scouring holes are observable around individual pile bases, suggesting that high-energy wave components within the irregular wave train can mobilize sediment. For the staggered arrangement (Figure 18b), the configuration disrupts the alignment of wave-induced orbital motions and enhances local wake interactions between piles, leading to slightly deeper and interconnected scouring areas. Although the overall intensity of the scour remains lower than that observed under combined wave–current loading, the staggered arrangement promotes a wider area of local scour compared to the square layout.

4. Conclusions

This study experimentally investigated wave/current-induced pore-water pressures and local scour around pile groups, with particular emphasis on the effects of hydrodynamic conditions (i.e., regular and irregular waves, wave/current direction), pile spacing, and pile arrangement. Based on systematic laboratory experiments and high-resolution seabed scanning, the following main conclusions are drawn:
1.
The combined wave–current loading significantly intensifies the pressures of the pore-water and local scour compared to wave-only conditions. The presence of a steady current increases the maximum scour depth by approximately 3 to 5 times, with peak values reaching 0.16–0.19 m under combined wave–current loading compared to wave loading only. This is attributed to the fact that the presence of a steady current markedly enhances near-bed shear stress and vortex strength, leading to deeper and more spatially extensive local scour. Parametric analyses also demonstrate that the presence and magnitude of the current are the dominant factors in determining the maximum scour depth around pile groups, as both wave height and wave period can enhance the development of local scour depth.
2.
The direction of the current relative to wave propagation governs the location and evolution rate of maximum scour around pile groups. Under wave–forward current conditions, the deepest scour develops primarily within the interior of the pile array, driven by flow contraction and gap-induced acceleration between piles. In contrast, under wave–opposing current conditions, the maximum scour shifts toward the downstream piles, and scour development proceeds more uniformly in time. These differences highlight the critical role of the current direction in pile group scour processes.
3.
Pile spacing is the dominant geometric parameter controlling the scouring depth under combined wave–current loading. Small-spaced piles ( G / D = 1) exhibit strong hydrodynamic interaction, resulting in an interconnected scour area and significantly larger maximum scour depths, while increasing pile spacing effectively weakens inter-pile interactions, reduces peak scour depth by approximately 30–40%, and confines scour to the vicinity of individual piles.
4.
The arrangement of the pillars primarily influences the spatial distribution of scour rather than the maximum scour depth. Compared with a square arrangement, staggered pile configurations disrupt flow symmetry and enhance wake interaction, leading to downstream-shifted scour patterns. Although the staggered arrangement slightly increases the maximum scour depth, it mainly enlarges the affected area and alters the location of local scour zones.
5.
Under irregular waves ( H 1 / 3 = 0.15 m, T 1 / 3 = 1.6 s, U c = 0 m/s), the maximum scour depth is consistently smaller than those of regular waves with equivalent height and period, while the affected area is more spatially diffuse.

Author Contributions

Z.W.: Methodology, formal analysis, investigation, data curation, visualization, writing—original draft preparation; L.C.: Conceptualization, Methodology, supervision, writing—original draft preparation; Z.L.: Conceptualization, Methodology, supervision, writing—review; M.L.: investigation, data curation, writing—review; D.L.: investigation, data curation, writing—review; D.C.: investigation, data curation, writing—review; K.S.: Conceptualization, Methodology, supervision, writing—review; D.-S.J.: Conceptualization, methodology, resources, writing—review, supervision, project administration, funding acquisition. All authors have read and agreed to the published version of this manuscript.

Funding

This research was funded by the National Natural Science Foundation of China (Grant No: 52271281), the Shandong Provincial Overseas High-Level Talent Workstation (A2025-1265), and the Shandong Provincial Key Laboratory for the Safe Construction and Operation and Maintenance of Marine Energy Engineering.

Data Availability Statement

The raw data supporting the conclusions of this article will be available upon request.

Acknowledgments

The authors are grateful for invaluable comments of three reviewers.

Conflicts of Interest

The authors declare no conflicts of interest.

References

  1. Chambel, J.; Fazeres-Ferradosa, T.; Miranda, F.; Bento, A.; Taveira-Pinto, F.; Lomonaco, P. A comprehensive review on scour and scour protections for complex bottom-fixed offshore and marine renewable energy foundations. Ocean Eng. 2024, 304, 117829. [Google Scholar] [CrossRef] [Scilit]
  2. Sumer, B.M.; Fredsøe, J. The Mechanics of Scour in the Marine Environment; World Scientific: Singapore, 2002. [Google Scholar] [CrossRef] [Scilit]
  3. Diaz, E.E.M.; Moreno, F.N.; Mohammadi, J. Investigation of common causes of bridge collapse in Colombia. Pract. Period. Struct. Des. Constr. 2009, 14, 194–200. [Google Scholar]
  4. Zhao, G. Analysis of the “9·7” Tilting Accident of Shengli Operation No. 3 Platform [in Chinese]. Mod. Occup. Saf. 2011, 7, 100–102. [Google Scholar]
  5. Wang, S.; Wang, P.; Zhai, H.; Zhang, Q.; Chen, L.; Duan, L.; Liu, Y.; Jeng, D.S. Experimental study for wave-induced pore-water pressures in a porous seabed around a mono-pile. J. Mar. Sci. Eng. 2019, 7, 237. [Google Scholar] [CrossRef] [Scilit]
  6. Yang, L.J.; Qi, W.G.; Li, Y.; Gao, F.P. Wave-current coupling effects on the variation modes of pore pressure response in a sandy seabed: Physical modeling and explicit approximations. J. Geophys. Res. Ocean. 2023, 128, e2022JC019158. [Google Scholar] [CrossRef] [Scilit]
  7. Zhang, Q.; Zhai, H.; Wang, P.; Wang, S.; Duan, L.; Chen, L.; Liu, Y.; Jeng, D.S. Experimental study on irregular wave-induced pore-water pressures in a porous seabed around a mono-pile. Appl. Ocean Res. 2020, 95, 102041. [Google Scholar] [CrossRef] [Scilit]
  8. Yu, J.H.; Gao, F.P.; Li, C.F. Response spectra for transient pore-pressure in a sandy seabed under random waves: Frequency-filtering effect. Ocean Eng. 2023, 279, 114490. [Google Scholar]
  9. Wang, M.Q.; Si, W.Q.; Go, Y.; Cui, L.; Jeng, D.S.; Sun, K.; Chen, B.; Zhao, H.Y. Experimental study of the random wave-induced hydrodynamic characteristic and soil response in a porous seabed around double piles. J. Mar. Sci. Eng. 2024, 12, 1715. [Google Scholar] [CrossRef] [Scilit]
  10. Qu, L.; An, H.; Draper, S.; Watson, P.; Zhao, M.; Harris, J.; Whitehouse, R.; Zhang, D. A review of scour impacting monopiles for offshore wind. Ocean Eng. 2024, 301, 117385. [Google Scholar] [CrossRef] [Scilit]
  11. Dey, S. Time-variation of scour in the vicinity of circular piers. Proc. Inst. Civ. Eng.-Water Marit. Energy 1999, 136, 67–75. [Google Scholar]
  12. Mia, M.F.; Nago, H. Design method of time-dependent local scour at circular bridge pier. J. Hydraul. Eng. ASCE 2003, 129, 420–427. [Google Scholar]
  13. Hong, J.H.; Goyal, M.K.; Chiew, Y.M.; Chua, L.H. Predicting time-dependent pier scour depth with support vector regression. J. Hydrol. 2012, 468, 241–248. [Google Scholar] [CrossRef] [Scilit]
  14. Zhai, H.L. Impact of seepage on local scour around bridge foundation in sandy seabed. Ph.D. Thesis, Southwest Jiao Tong University, Chengdu, China, 2023. (In Chinese) [Google Scholar]
  15. Zhai, H.L.; Jeng, D.-S. Integrated wave-seabed-scour model for local scour around a pipeline: PORO–FSSI–SCOUR–FOAM. Coast. Eng. 2024, 187, 104424. [Google Scholar] [CrossRef] [Scilit]
  16. Sumer, B.M.; Fredsøe, J.; Christensen, N. Scour around a vertical pile in waves. J. Waterw. Port Coast. Ocean. Eng. ASCE 1992, 118, 15–31. [Google Scholar] [CrossRef] [Scilit]
  17. Kobayashi, T.; Oda, K. Experimental study on developing process of local scour around a vertical cylinder. In Coastal Engineering 1994; ASCE Library: Reston, VA, USA, 1995; pp. 1284–1297. [Google Scholar]
  18. Keulegan, G.H.; Carpenter, L.H. Forces on cylinders and plates in an oscillating fluid. J. Res. Natl. Bur. Stand. 1958, 60, 423–440. [Google Scholar] [CrossRef] [Scilit]
  19. Lin, Z.; Dubravka, P.; Guo, Y.; Liao, C.; Tang, T. Near-trapping effect of wave-cylinders interaction on pore water pressure and liquefaction around a cylinder array. Ocean Eng. 2020, 218, 108947. [Google Scholar] [CrossRef] [Scilit]
  20. Wei, S.; Liang, Z.; Cui, L.; Zhai, H.; Jeng, D.S. Numerical study of seabed response and liquefaction around the jacket support offshore wind turbine foundation under the combined wave and current loading. Water Sci. Eng. 2022, 15, 78–88. [Google Scholar] [CrossRef] [Scilit]
  21. Liang, F.; Wang, C.; Huang, M.; Wang, Y. Experimental observations and evaluations of formulae for local scour at pile groups in steady currents. Mar. Georesour. Geotechnol. 2017, 35, 245–255. [Google Scholar]
  22. Ji, C.; Zhang, J.-f.; Zhang, Q.-h.; Li, M.-x.; Chen, T.-q. Experimental investigation of local scour around a new pile-group foundation for offshore wind turbines in bi-directional current. China Ocean Eng. 2018, 32, 737–745. [Google Scholar]
  23. Qi, W.G.; Li, Y.X.; Xu, K.; Gao, F.P. Physical modelling of local scour at twin piles under combined waves and current. Coast. Eng. 2019, 143, 63–75. [Google Scholar] [CrossRef] [Scilit]
  24. Corvaro, S.; Marini, F.; Mancinelli, A.; Lorenzoni, C.; Brocchini, M. Hydro-and morpho-dynamics induced by a vertical slender pile under regular and random waves. J. Waterw. Port Coast. Ocean. Eng. ASCE 2018, 144, 04018018. [Google Scholar] [CrossRef] [Scilit]
  25. Sumer, B.M.; Fredsøe, J. Scour around pile in combined waves and current. J. Hydraul. Eng. ASCE 2001, 127, 403–411. [Google Scholar]
  26. Zhao, H.; Lin, F.; Gao, Y.; Wang, Z.; Li, M.; Liu, X.; Han, S.; Jeng, D.S. Effect of clay content on the coupled seabed response and local scour around a free-spanning pipeline under combined waves and currents. Coast. Eng. 2025, 204, 104910. [Google Scholar] [CrossRef] [Scilit]
  27. Sumer, B.M.; Fredsøe, J. Wave scour around group of vertical piles. J. Waterw. Port Coast. Ocean. Eng. ASCE 1998, 124, 248–256. [Google Scholar]
  28. Amini, A.; Melville, B.W.; Ali, T.M.; Ghazali, A.H. Clear-water local scour around pile groups in shallow-water flow. J. Hydraul. Eng. ASCE 2012, 138, 177–185. [Google Scholar]
  29. Bayram, A.; Larson, M. Analysis of scour around a group of vertical piles in the field. J. Waterw. Port Coast. Ocean. Eng. ASCE 2000, 126, 215–220. [Google Scholar]
  30. Qi, W.G.; Gao, F.P. Physical modeling of local scour development around a large-diameter monopile in combined waves and current. Coast. Eng. 2014, 83, 72–81. [Google Scholar] [CrossRef] [Scilit]
  31. Wang, H.; Tang, H.; Liu, Q.; Wang, Y. Local scouring around twin bridge piers in open-channel flows. J. Hydraul. Eng. ASCE 2016, 142, 06016008. [Google Scholar]
  32. Zen, K.; Yamazaki, H. Mechanism of wave-induced liquefaction and densification in seabed. Soils Found. 1990, 30, 90–104. [Google Scholar] [CrossRef] [Scilit]
  33. Hughes, S.A. Physical Models and Laboratory Techniques in Coastal Engineering; World Scientific: Singapore, 1993. [Google Scholar]
  34. Palemón-Arcos, L.; Torres-Freyermuth, A.; Pedrozo-Acuña, A.; Salles, P. On the role of uncertainty for the study of wave–structure interaction. Coast. Eng. 2015, 106, 32–41. [Google Scholar] [CrossRef] [Scilit]
  35. Scaravaglione, G.; Melby, J.A. A comprehensive review of the primary sources of uncertainty in stone armor stability. Coast. Eng. 2026, 205, 104930. [Google Scholar] [CrossRef] [Scilit]
  36. Dean, R.; Dalrymple, R.A. Water Wave Mechanics for Engineers and Scientists; World Scientific: Singapore, 1984. [Google Scholar]
  37. Hsu, H.C.; Chen, Y.Y.; Hsu, J.R.C.; Tseng, W.J. Nonlinear water waves on uniform current in Lagrangian coordinates. J. Nonlinear Math. Phys. 2009, 16, 47–61. [Google Scholar] [CrossRef] [Scilit]
  38. Shields, A. Application of Similitude Mechanics and Research on Turbulence to Bed Load Movement; California Institute of Technology: Pasadena, CA, USA, 1937. [Google Scholar]
  39. Chien, N.; Wan, Z. Mechanics of Sediment Transport; ASCE: Reston, VA, USA, 1976. [Google Scholar]
  40. Soulsby, R. Dynamics of Marine Sands; Thomas Telford: London, UK, 1997. [Google Scholar]
  41. Soulsby, R.L.; Whitehouse, R.J.S. Threshold of sediment motion in coastal environments. In Proceedings of the Pacific Coasts and Ports’97. Proceedings; Centre for Advanced Engineering, University of Canterbury: Christchurch, New Zealand, 1997; Volume 1, pp. 149–154. [Google Scholar]
  42. Zhao, K.F.; Wang, Y.F.; Liu, P.L.-F. A guide for selecting periodic water wave theories-Le Méhauteé’s graph revisited. Coast. Eng. 2024, 188, 104432. [Google Scholar] [CrossRef] [Scilit]
  43. Goda, Y. Random Seas and Design of Marine Structures; World Scientific Press: Singapore, 2000. [Google Scholar]
Figure 1. Accident at the No. 3 Shengli operation platform in September 2010 [4].
Sustainability 18 02252 g001
Figure 2. The layout of the wave flume experiments.
Sustainability 18 02252 g002
Figure 3. The experimental set-up for the locations of (a) wave gauges, (b) wave pressure sensors and pore-water pressure sensors, and (c) the configuration of the pile groups.
Sustainability 18 02252 g003
Figure 4. The particle size distribution curve of the soil sample.
Sustainability 18 02252 g004
Figure 5. Wave conditions considered in this study [42].
Sustainability 18 02252 g005
Figure 6. Time series of the wave profile around pile groups under the action of wave and current (square arrangement and staggered arrangement, referring to Figure 3c; G / D = 1, H = 0.15 m, T = 1.6 s, U c = 0.25 m/s).
Sustainability 18 02252 g006
Figure 7. Time series of dynamic wave pressure on the surface of pile groups (square arrangement, staggered arrangement, referring to Figure 3c; G / D = 1, H = 0.15 m, T = 1.6 s, U c = 0.25 m/s).
Sustainability 18 02252 g007aSustainability 18 02252 g007b
Figure 8. Time series of pore-water pressure for various current velocities at a1-1 (square arrangement G / D = 1, referring to Figure 3c; H = 0.15 m, T = 1.6 s, U c = 0, 0.25, −0.25 m/s).
Sustainability 18 02252 g008
Figure 9. Comparisons of pore-water pressures for various current velocities at different locations on the pile surfaces (locations—upstream side: a1-1; downstream side: a1-3; lateral sides: a1-2 and a1-4; square arrangement G / D = 1, referring to Figure 3c; H = 0.15 m, T = 1.6 s, U c = 0, 0.25, −0.25 m/s).
Sustainability 18 02252 g009
Figure 10. Comparisons of the maximum pore-water pressures for various current velocities at the central point of the square pile group (i.e., E1, b1-1 is also presented for comparison; square arrangement G / D = 1, referring to Figure 3c; H = 0.15 m, T = 1.6 s, U c = 0, 0.25, −0.25 m/s).
Sustainability 18 02252 g010
Figure 11. Comparison of the spatial distribution of the maximum pore-water pressure on the surfaces of each pile for various current velocities (square arrangement G / D = 1, referring to Figure 3c; H = 0.15 m, T = 1.6 s, U c = 0, 0.25, −0.25 m/s).
Sustainability 18 02252 g011
Figure 12. The temporal evolution of the seabed morphology around the square pile group under wave and current loading (square arrangement G / D = 1, referring to Figure 3c; H = 0.15 m, T = 1.6 s, and U c = 0.25 m/s; the gray circles represent the pile group locations).
Sustainability 18 02252 g012aSustainability 18 02252 g012b
Figure 13. The development of the scour depth along the centerline within the pile array under combined wave–current conditions: (a) U c = 0.25 m/s and (b) U c = −0.25 m/s (square arrangement, G / D = 1, referring to Figure 3c; H = 0.15 m, T = 1.6 s; red dashed lines represent the locations of piles, negative Y-value indicates the upstream of the pile group, and positive Y-value indicates the downstream side).
Sustainability 18 02252 g013
Figure 14. Parametric studies on the effects of wave height (H), wave period (T), and current velocity ( U c ) on the scour depths of pile groups (square layout G / D = 1, referring to Figure 3c); (a) effects of wave height (T = 1.6 s, U c = 0 m/s); (b) effects of wave period (H = 0.15 m, U c = 0 m/s); (c) effects of current velocity (H = 0.15 m, T = 1.6 s).
Sustainability 18 02252 g014
Figure 15. The scanned final-stage seabed morphology around the square pile group with different pile spacings under wave-only, wave–forward current, and wave–opposing current conditions: (a1–a3) G / D = 1; (b1–b3) G / D = 2 (referring to Figure 3c; H = 0.15 m, T = 1.6 s, the gray circles represent the pile group locations).
Sustainability 18 02252 g015
Figure 16. The scanned final-stage seabed morphology around two different pile arrangements under wave-only, wave–forward current and wave–opposing current conditions: (a1–a3) square arrangement G / D = 1; (b1–b3) staggered arrangement G / D = 1 (referring to Figure 3c; H = 0.15 m, T = 1.6 s, the gray circles represent the pile group locations).
Sustainability 18 02252 g016
Figure 17. Time series of pore-water pressure on the surfaces of piles of the square pile group under irregular waves (square arrangement G / D = 1, referring to Figure 3c; H 1 / 3 = 0.15 m, T 1 / 3 = 1.6 s, U c = 0 m/s).
Sustainability 18 02252 g017
Figure 18. The scanned final stage of the seabed morphology around pile groups under irregular wave loading: (a) square arrangement; (b) staggered arrangement (referring to Figure 3c; G / D = 1, H 1 / 3 = 0.15 m, T 1 / 3 = 1.6 s, U c = 0 m/s, the gray circles represent the pile group locations).
Sustainability 18 02252 g018
Table 1. A comparison between this research and previous studies.
ReferenceMain ContentComparison
Sumer et al. [16]regular wave, mono-pileno irregular wave, no wave–current, no pore-water pressure, no pile group foundation
Kobayashi and Oda [17]regular wave, mono-pileno irregular wave, no wave–current, no pore-water pressure, no pile group foundation
Liang et al. [21]steady current, mono-pile, pile group foundationno wave–current, no pore-water pressure
Ji et al. [22]bidirectional current, pile group foundationno wave–current, no pore-water pressure
Qi et al. [23]wave–current, twin pilesno irregular wave, no pore-water pressure, no pile group foundation
Corvaro et al. [24]wave–current, mono-pileno irregular wave, no pore-water pressure, no pile group foundation
Sumer and Fredsøe [25]wave–current, mono-pileno pore-water pressure, no pile group foundation
Sumer and Fredsøe [27]wave–current, mono-pileno pore-water pressure, no pile group foundation
Amini et al. [28]wave–current, pile group foundationno irregular wave, no pore-water pressure
Bayram and Larson [29]wave–current, pile group foundationno irregular wave, no pore-water pressure
This studyregular and irregular wave, wave–current, pore-water pressure, pile groups
Table 2. Soil properties.
Soil PropertiesSoil ValueUnit
Median grain size ( d 50 )0.37mm
Coefficient of uniformity ( C u )1.52-
Curvature coefficient ( C c )0.96-
Dry density ( ρ d )1.50g/cm3
Maximum dry density ( ρ d   max )1.58g/cm3
Minimum dry density ( ρ d   min )1.25g/cm3
Specific gravity (s)2.65-
Void ratio (e)0.77-
Porosity (n)0.43-
Permeability coefficient ( k s )0.30cm/s
Poisson’s ratio ( μ )0.30-
Shear modulus (G)12.69MN/m2
Relative density ( D r )0.81-
Table 3. The hydrodynamic conditions of the tests.
Group No.H (m)T (s) H / L U c (m/s) U m (m/s)KC θ Re
10.11.60.033800.18542.200.114825,027.87
20.1251.60.042200.23422.780.183131,611.96
30.151.60.050600.28393.360.269238,326.90
40.151.20.07500.20711.840.143227,956.38
50.1520.038700.33034.890.364244,585.14
60.151.60.05060.150.37624.460.289738,326.90
70.151.60.05060.250.43775.190.326338,326.90
80.151.60.0506−0.250.13011.540.326338,326.90
9 *0.151.60.050600.28393.360.269238,326.90
* In the test, irregular wave loading is considered.
Disclaimer/Publisher’s Note: The statements, opinions and data contained in all publications are solely those of the individual author(s) and contributor(s) and not of MDPI and/or the editor(s). MDPI and/or the editor(s) disclaim responsibility for any injury to people or property resulting from any ideas, methods, instructions or products referred to in the content.