



Decoding Waterfront Vitality: A Space–Experience Interaction Evaluation


Abstract
1. Introduction
2. Study Area
3. Methods
3.1. Participants: Experts Panel and Visitor Group
3.1.1. Experts Panel
3.1.2. Visitor Group
3.2. Vitality Evaluation and Intuitive Representations of Vitality
3.2.1. Vitality Evaluation Framework
- (1)
- Factors and Indicators
- (2)
- Weights
3.2.2. Intuitive Representations of Vitality
3.3. Comparative Analysis
3.4. Data and Quantification
- Periodic stratified sampling: To improve the temporal representativeness of the data, prevent seasonal or unintentional biases, and guarantee the completeness and continuity of data coverage over the whole year’s time series, set a defined sample interval on a daily or weekly basis.
- Time-segmented balanced distribution: For sampling, split each day into three time segments: morning, afternoon, and evening. This improves the data’s spatial balance, removes the influence of diurnal variations, and captures the dynamic changes over several time periods.
- Multi-batch dynamic adjustment: Multiple rounds of sampling are performed within the framework of fixed cycles and time periods. Cross-validation between batches improves data stability, and sampling tactics are constantly modified based on real collection conditions, increasing data adaptability.
- Abnormal data removal and retesting: To address potential data interference caused by urban construction in some units, manual detection and removal of abnormal data in the unit and nearby site units is performed. After work is completed, retesting is performed to guarantee the integrity of the restored data and that the study conclusions are unaffected by local disturbances.
- A multi-source data integration approach is used during the evaluation process to guarantee the effectiveness and precision of impact factor quantification: instrumental measurements obtain high-precision environmental data, field surveys accurately capture micro-level characteristics, online multi-source data (with repeated sampling to supplement dynamic information) is integrated, and urban management data (including administrative records) is systematically integrated (Table 2). Each sample unit is spatially associated with quantitative data that has been imported into the ArcGIS 10.8 program. The Natural Breaks technique (Jenks Optimization) was used to classify data categories based on intra-class similarity and inter-class difference, leading to more accurate spatial clustering patterns.Table 2. The data collection path of the indicators.
Indicator Quantitative Pathway Data Collection and Integration
(Field Survey/Software/App)F1-1 Depthmap: integration and choice. ArcGIS Pro 3.4.3, Esri, Redlands, CA, USA F1-2 Kernel density analysis of public transport stations. ArcGIS Pro 3.4.3, Esri, Redlands, CA, USA F2-1 Point measurement by Secchi disk experiment method along the shoreline. Point measurement on-site F2-2 Water Exposure Index = (Visible Water Area/Total Site Area) × 100% ArcGIS Pro 3.4.3, Esri, Redlands, CA, USA F2-3 Scoring is conducted in accordance with the Standards for Urban Water Area Cleaning Operations and Quality [47] and the Suzhou Urban Environmental Sanitation Quality Standards [48]. Data from Jinji Lake Scenic Area Management Center F2-4 Image semantic analysis
Sky Openness Index = (Visible Sky Area/Total View Area) × 100%GPU-CUDA-enabled Semantic Segmentation App. v1.0, NVIDIA, Santa Clara, CA, USA F2-5 Image semantic analysis GPU-CUDA-enabled Semantic Segmentation App. v1.0 F2-6 ArcGIS kernel density analysis ArcGIS Pro 3.4.3, Esri, Redlands, CA, USA F2-7 It is measured by the density of seating facilities:
ΡC9 = total number of facilities/unit areaArcGIS Pro 3.4.3, Esri, Redlands, CA, USA F3-1 Evaluate according to the types and quantities of hydrophilic facilities. ArcGIS Pro 3.4.3, Esri, Redlands, CA, USA F3-2 Evaluate based on the quantity and quality of safety facilities. ArcGIS Pro 3.4.3, Esri, Redlands, CA, USA F4-1 The Semantic Differential Evaluation (SBE) method is used to calculate the visual aesthetic perception degree of urban skylines. Data from Jinji Lake Scenic Area Management Center
IBM SPSS Statistics 26.0.0, IBM Corporation, Armonk, NY, USAF4-2 The Semantic Differential Evaluation (SBE) method is used to calculate the aesthetic perception degree of nodes on recreational paths. IBM SPSS Statistics 26.0.0, IBM Corporation, Armonk, NY, USA F4-3 Color Impact calculates the color comfort index:
VCD = ∑ (2.787 + 0.081 Vni + 0.037 Cni − 0.00075 Hni) × Rni/3Datacolor App, Datacolor Tools SV, Lawrenceville, NJ, USA F5-1 It is measured by the path connection index:
γF5-1 = Σmi/NArcGIS Pro 3.4.3, Esri, Redlands, CA, USA F5-2 It is measured by the density of path nodes:
ρF5-2 = nodes/total path length × 100ArcGIS Pro 3.4.3, Esri, Redlands, CA, USA F6-1 Statistics on revisit intention, residence frequency ArcGIS Pro 3.4.3, Esri, Redlands, CA, USA F6-2 Calculation of facility diversity, Kernel density analysis in ArcGIS Data from Jinji Lake Scenic Area Management Center
ArcGIS Pro 3.4.3, Esri, Redlands, CA, USA

4. Results
4.1. Vitality Evaluation
4.1.1. Overall Vitality
4.1.2. Spatial Quality (SQ)
- (1)
- Accessibility (F1)
- (2)
- Spatial Coziness (F2)
- (3)
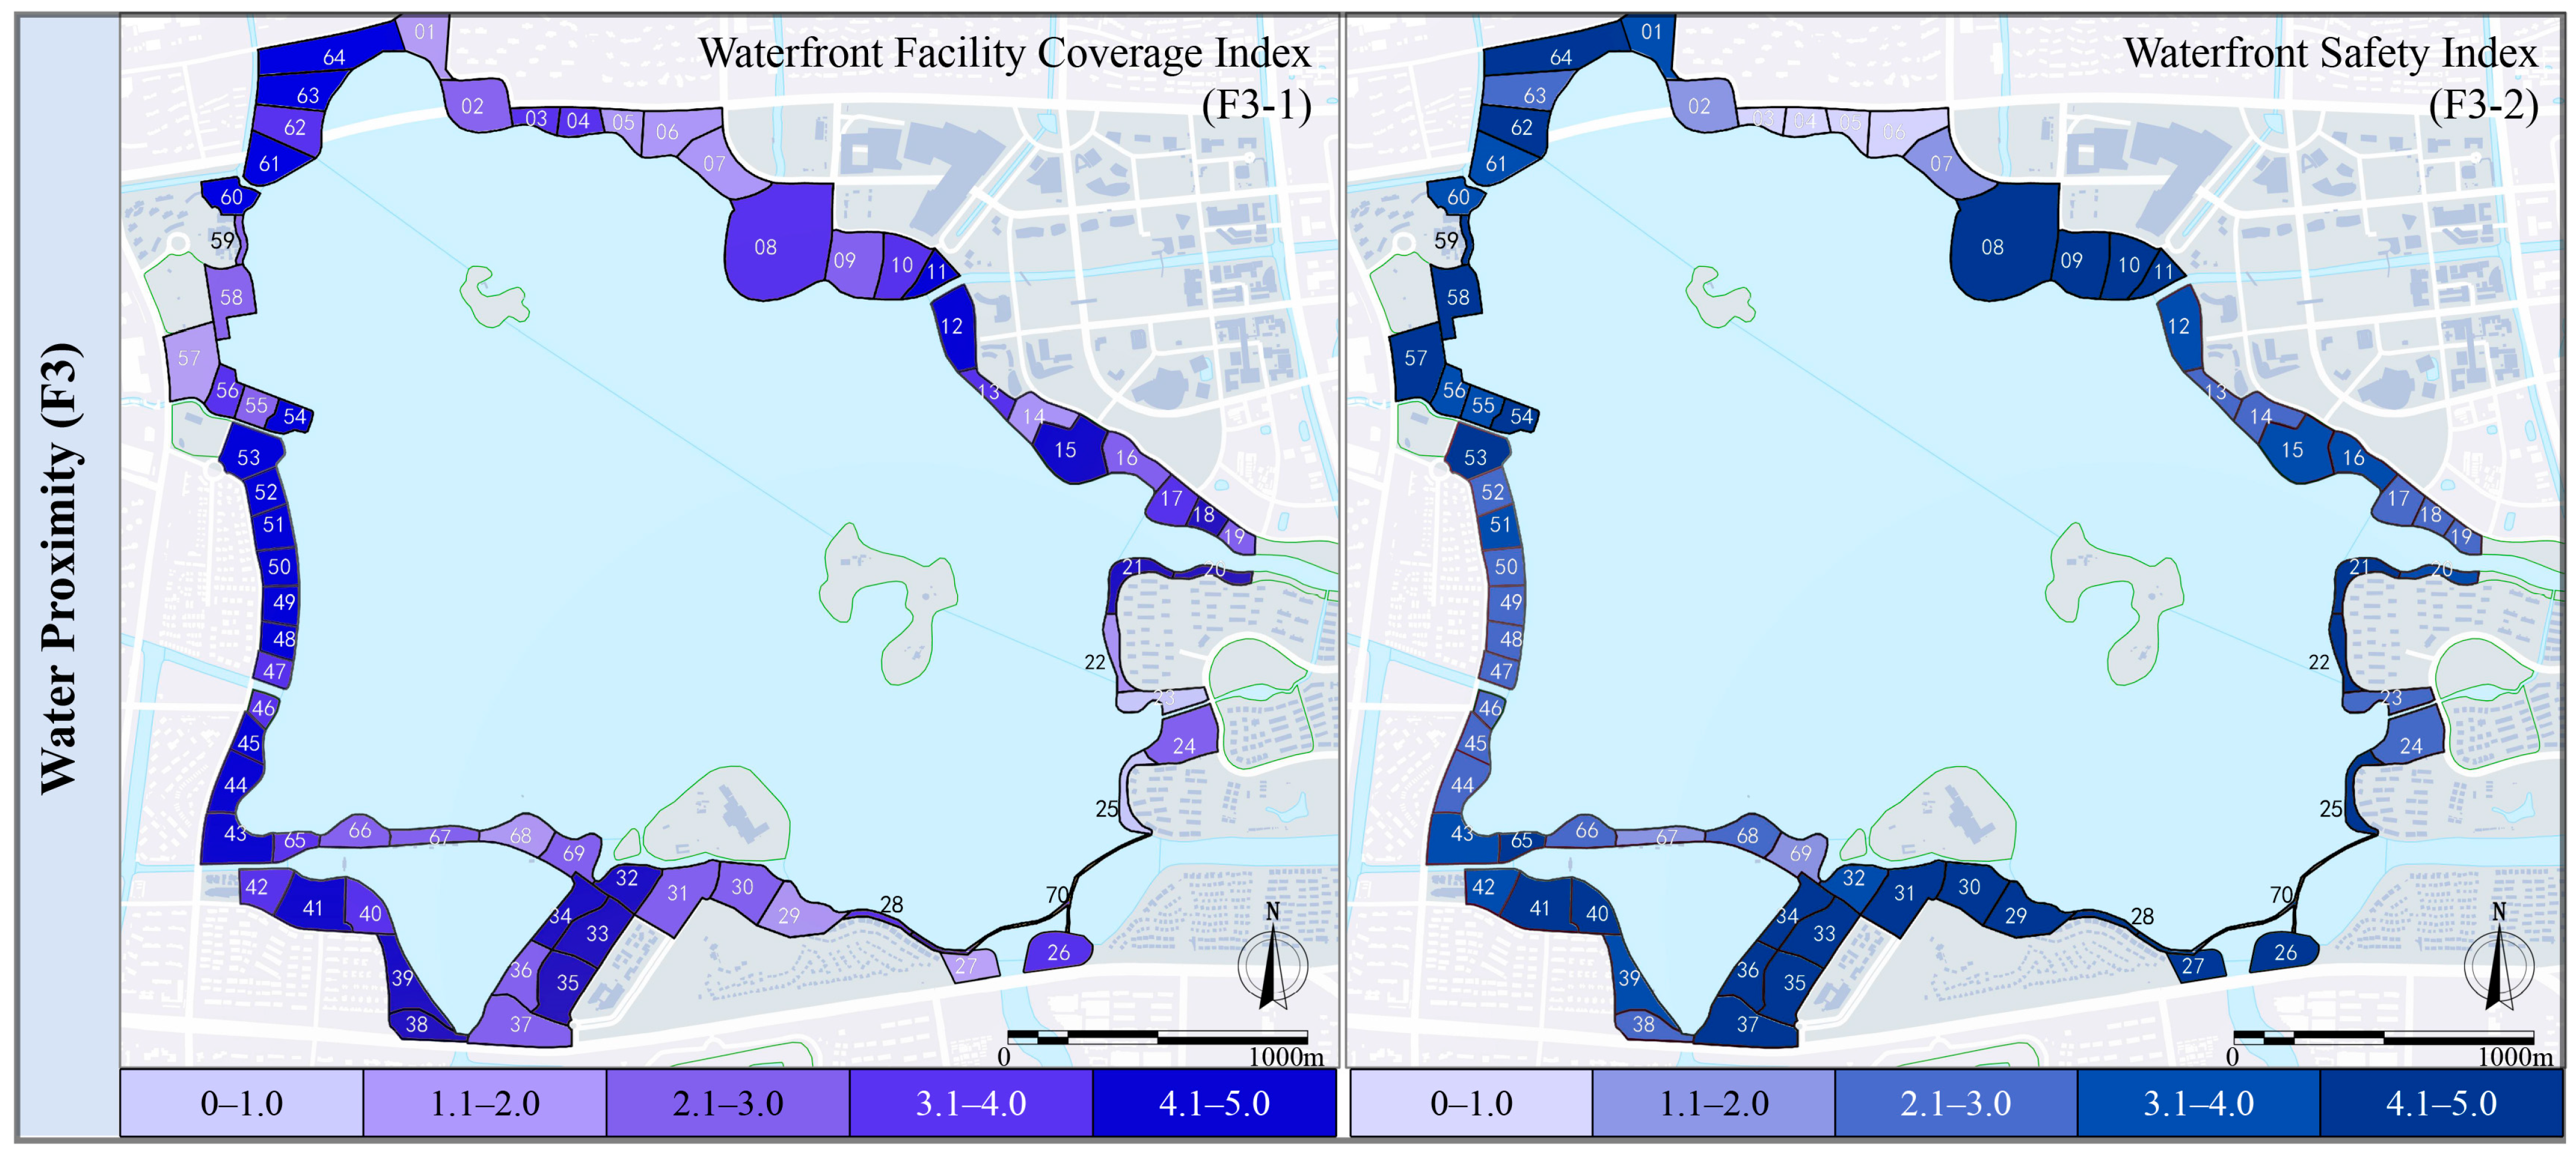
- Water Proximity (F3)
- (4)
- Visual Attraction (F4)
4.1.3. Spatial Experience (SE)
- (1)
- Path Holistic Experience (F5)
- (2)
- Node User-Friendliness (F6)
4.2. Intuitive Representations of Vitality
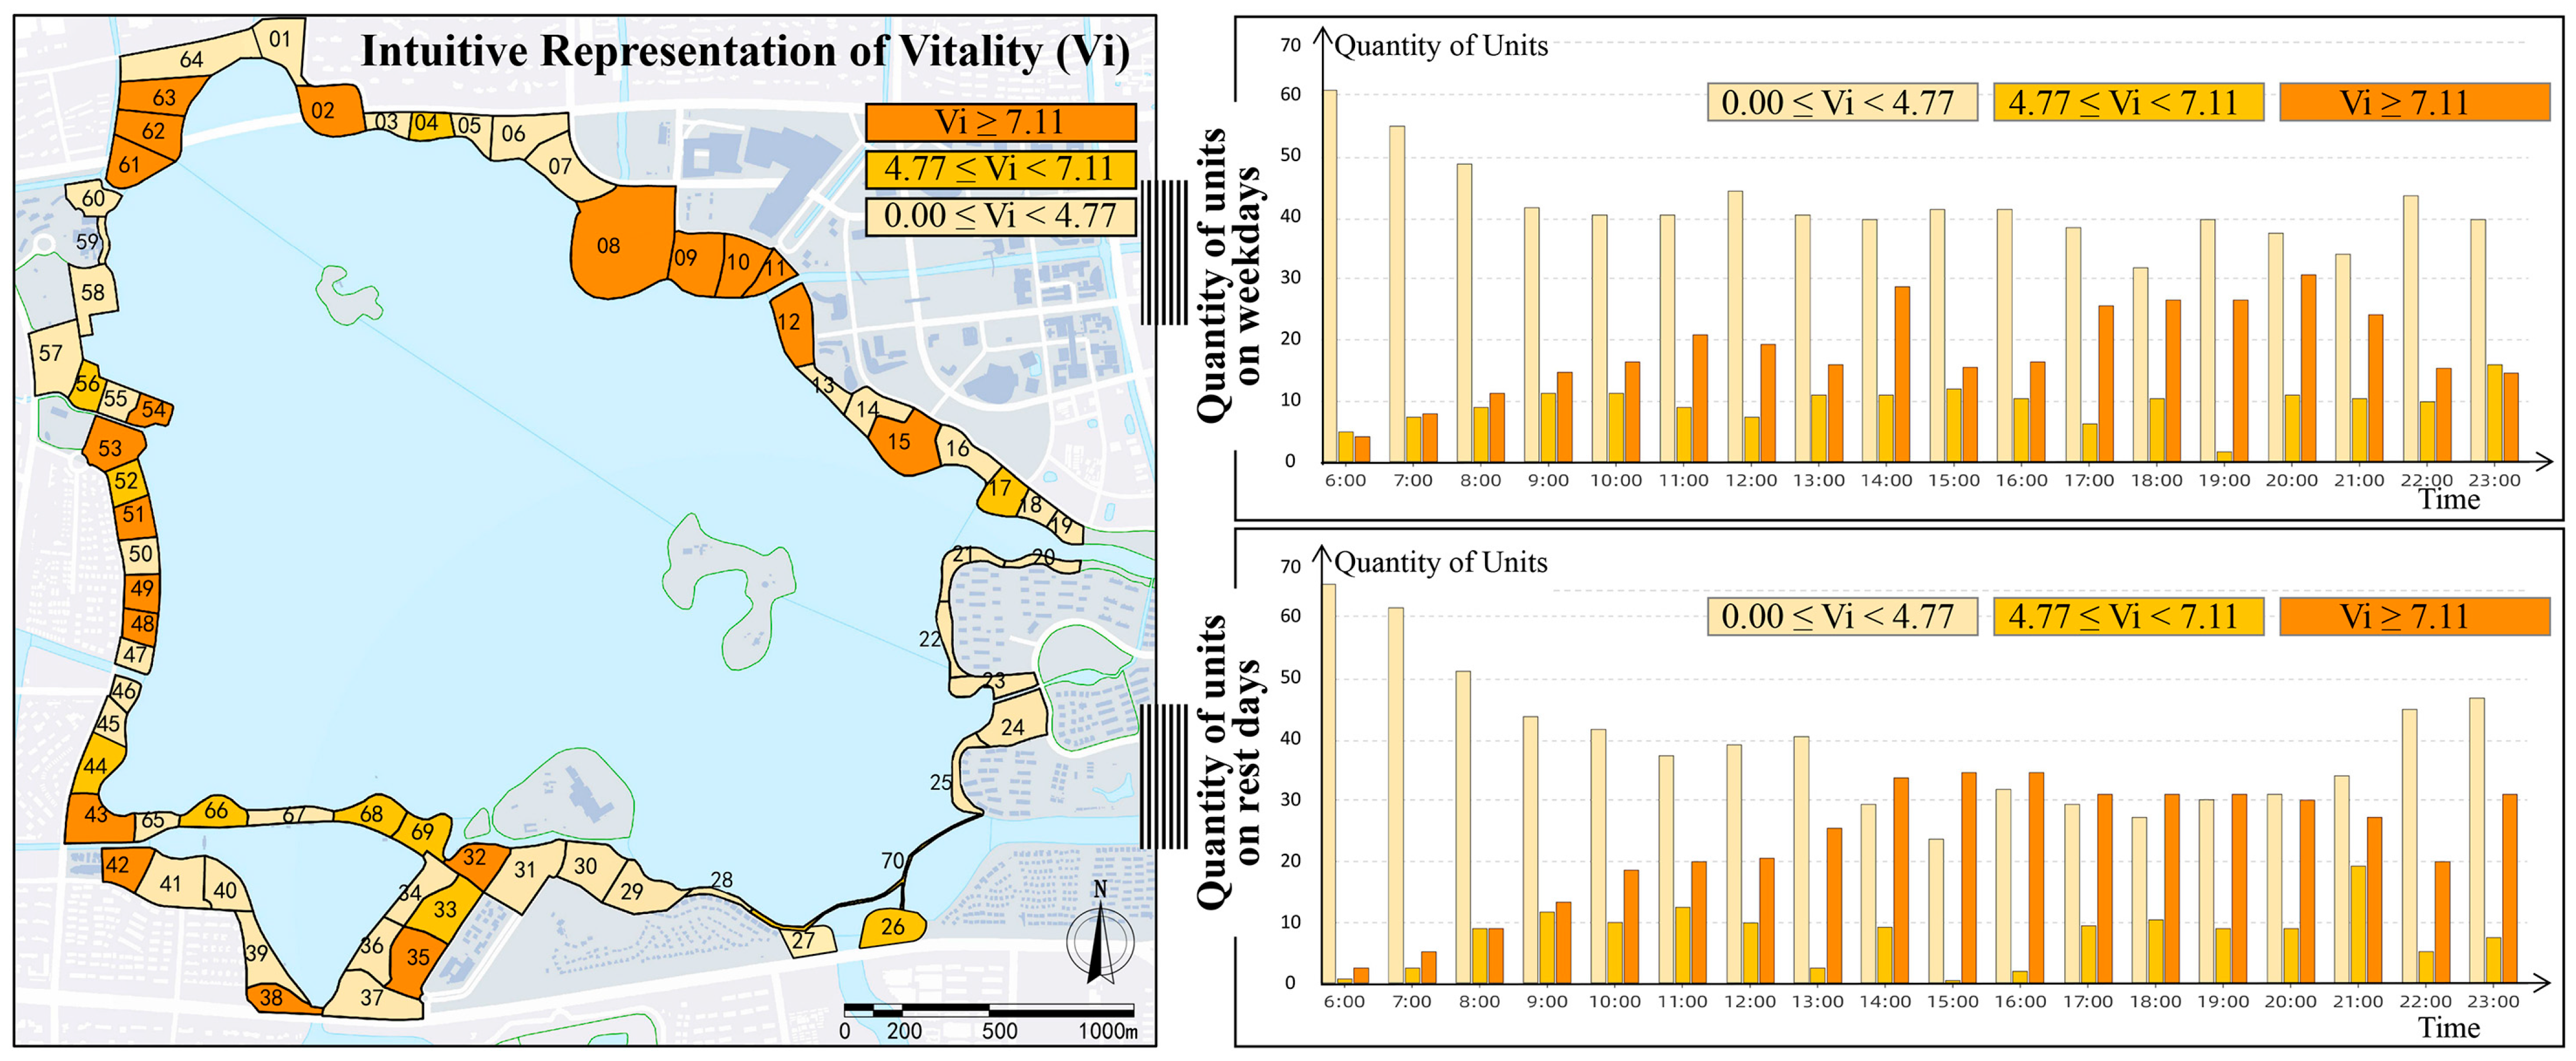
4.2.1. Gradient Overview
4.2.2. Dynamic Characteristics
4.3. Comparative Analysis
4.3.1. Comparison and Enhanced Vitality Grading
- V Gradient (1–5 levels) shows a flattened decay, with Level 3 accounting for 42%, which indicates multi-tiered radiation in spatial vitality (Figure 15).
- Vi Gradient (1–3 levels) displays a power-law distribution, with the top 20% of data points accounting for 65% of vitality values (Figure 16).

- (1)
- High-Vitality Unit Group
- High-Vitality units satisfying both conditions: 3.50 ≤ V < 4.50 and Vi ≥ 7.11
- The High-Vitality unit group consists of 18 units, with a mean vitality value VH = 3.83125, a variance of approximately 0.174, a standard deviation of approximately 0.417, a range of 1.11, and the highest degree of dispersion among the three groups.
- (2)
- Medium-Vitality Unit Group
- Medium-Vitality units including: 4.77 ≤ Vi < 7.11 and units not covered by High-Vitality units or Low-Vitality units
- The Medium-Vitality unit group consists of 29 units, with a mean vitality value of VM = 3.17625, a variance of approximately 0.163, a standard deviation of approximately 0.404, and a range of 1.12, indicating a high degree of dispersion.
- (3)
- Low-Vitality Unit Group
- Low-Vitality units satisfying both conditions: 2.00 ≤ V < 3.00 and 0.00 ≤ Vi < 4.77
- The Low-Vitality unit group consists of 23 units, with a mean vitality value VL = 2.66625, a variance of approximately 0.134, a standard deviation of approximately 0.366, and a range of 0.92, indicating a low degree of dispersion.
4.3.2. Decoding Waterfront Vitality: High-Vitality Units
- V data set: The range is approximately 0.818, the standard deviation is about 0.269, and the interquartile range (IQR) is roughly 0.513. The data set exhibits low dispersion and is concentrated in distribution.
- Vi data set: Range approximately 33.722, standard deviation approximately 9.382, interquartile range (IQR) approximately 10.563, indicating high dispersion and significant fluctuations.
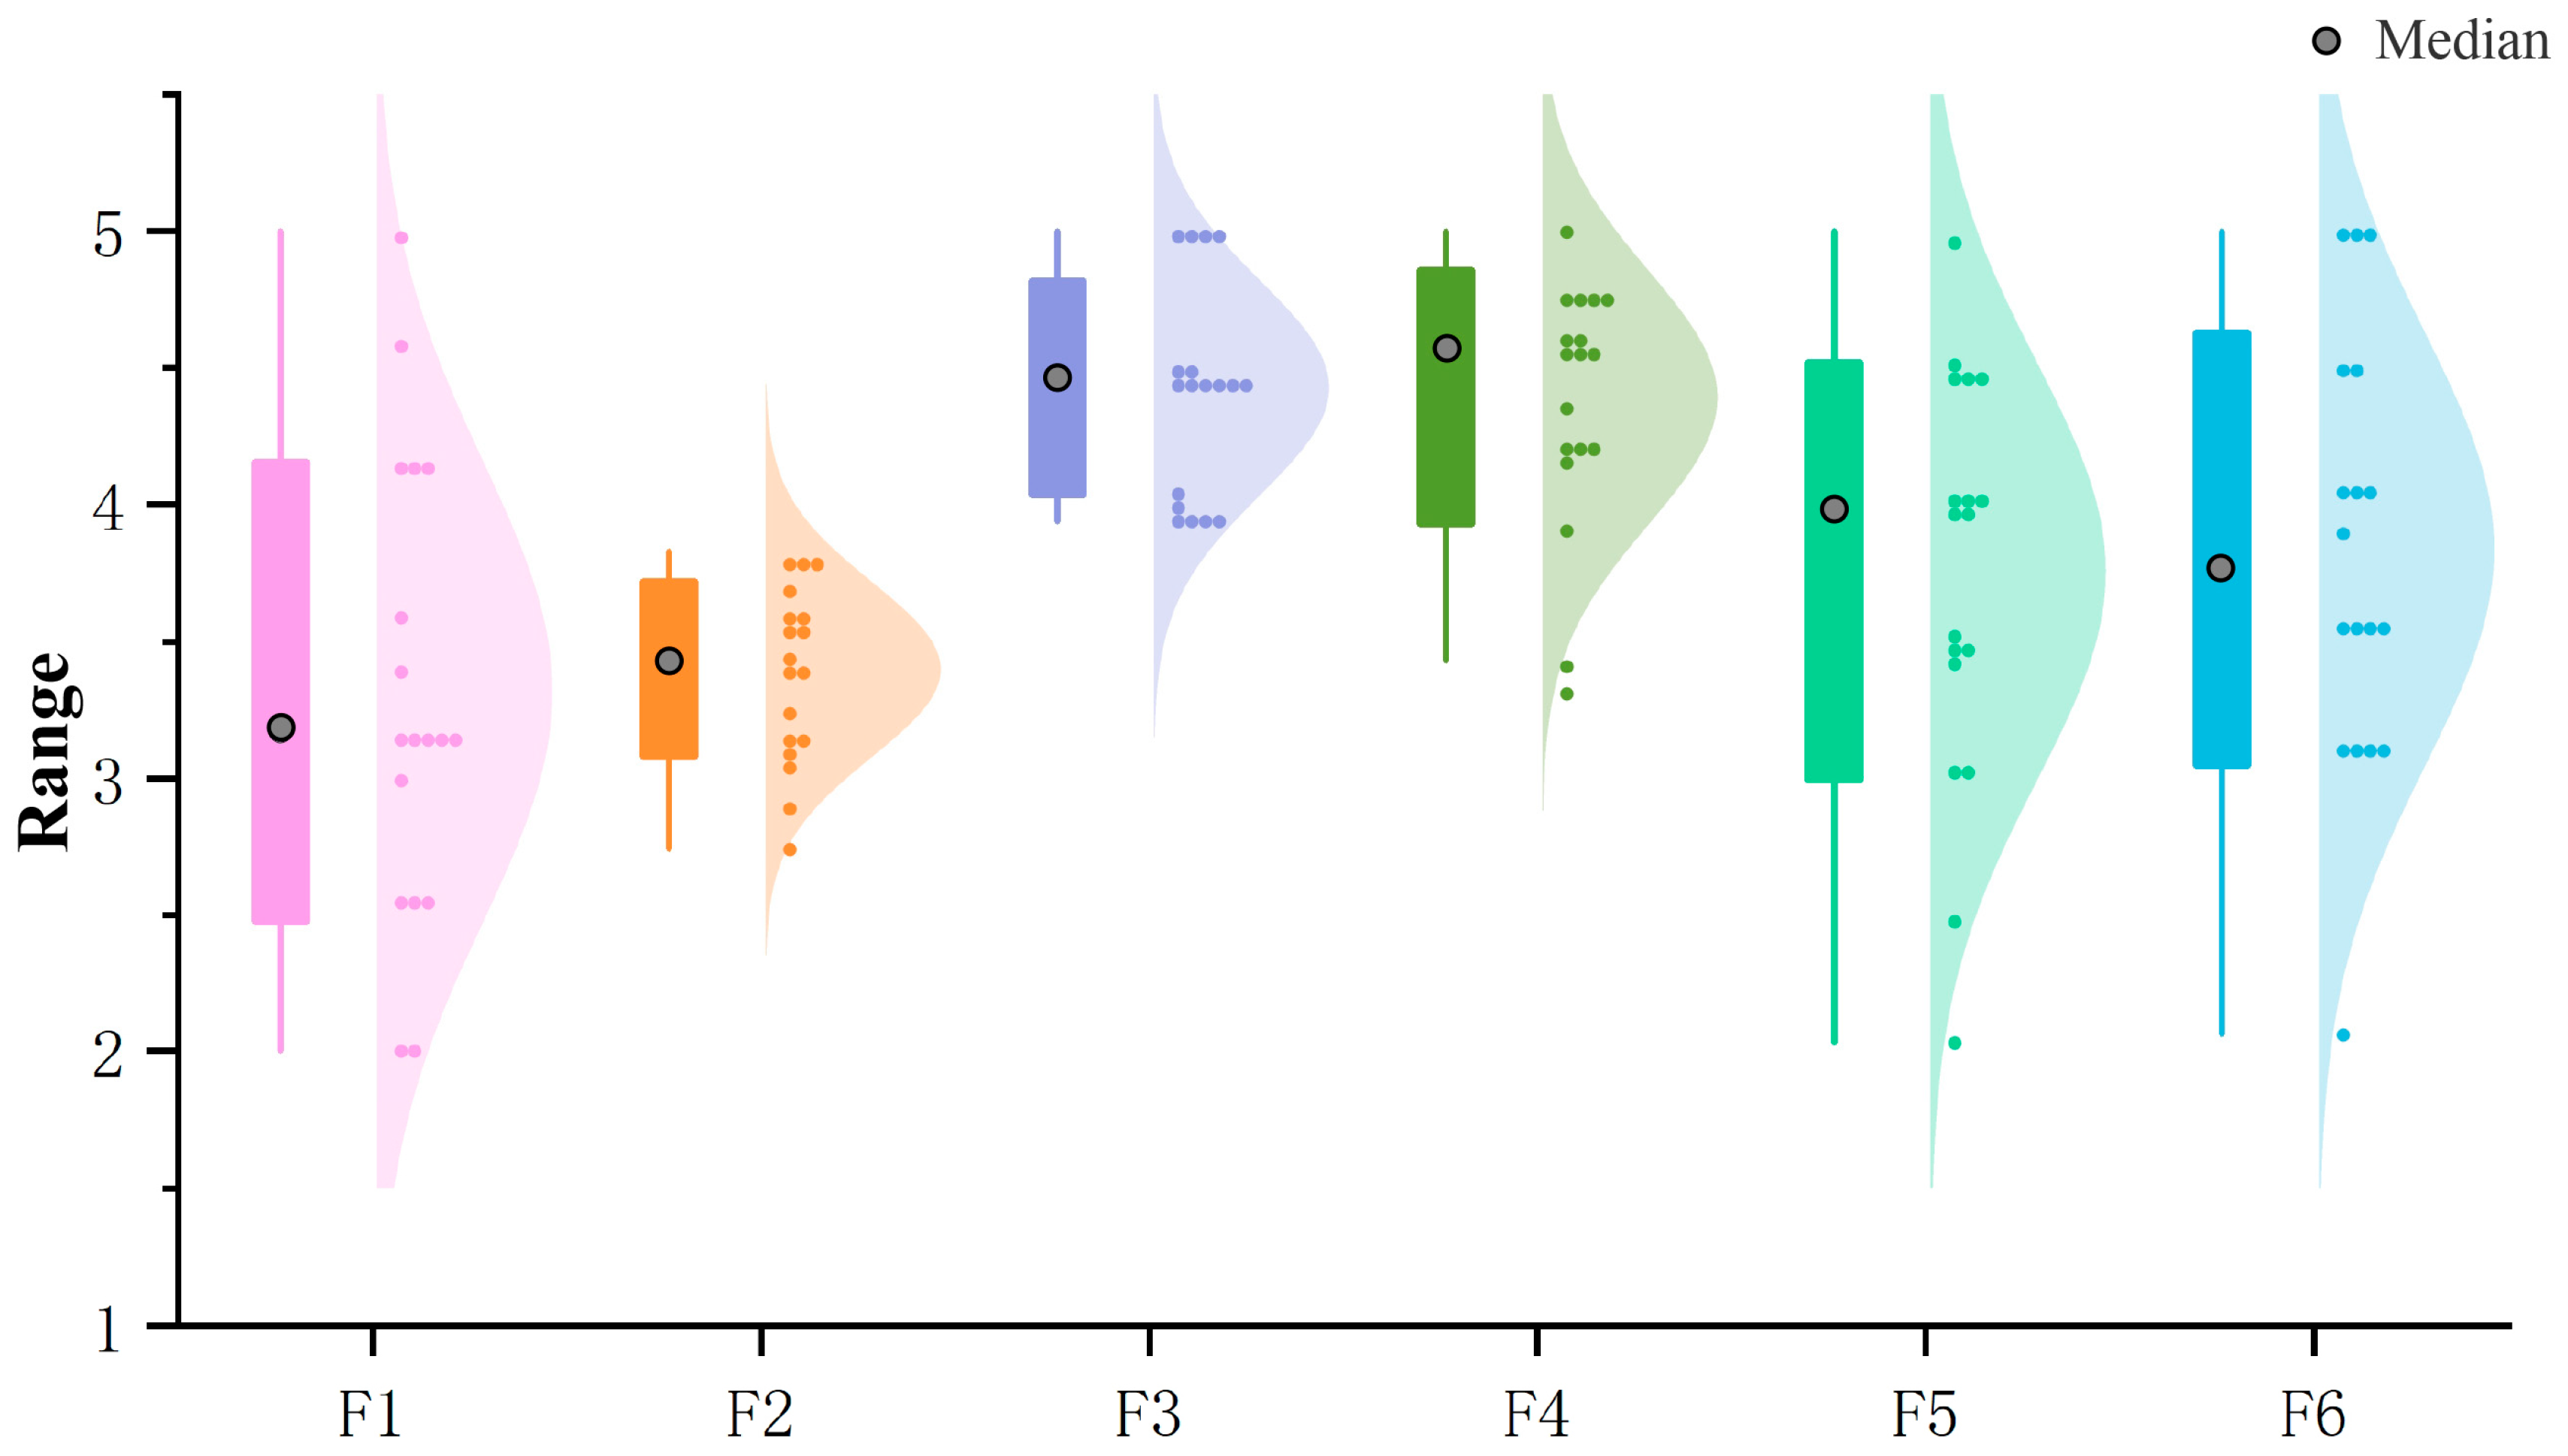
- While the median of F1 is comparatively low in the High-Vitality unit group, the medians of F3, F4, and F6 are considerably high. While F2 has a relatively moderate dispersion degree, F3 and F4 have rather big dispersion degrees. There are a few outliers in F1 that are comparatively far from the box, more outliers in F2 that are dispersed on the side of lower values, and a definite number of outliers in F3 through F6, but their distribution is more dispersed (Figure 18).
- The waterfront vitality of this group is driven by a combination of “Spatial form optimization,” “Social and humanistic interaction” and “Ecological base support.” It not only meets practical requirements, but also increases user loyalty through humanistic care and environmental integration.
- High-Vitality waterfront units are easily accessible and recognized, providing efficient public transportation and a large range of supplementary amenities, according to visitor feedback. Each unit is dominated by three spatial categories: leisure walkways, urban squares, and recreational green spaces. They have notable waterfront features that provide numerous chances for close-water activities as well as a dense urban interaction from a distance. The public is free to participate in a variety of recreational activities since there are plenty of areas that can accommodate people of all ages and a wide range of activities. Additionally, it promotes positive interactions between individuals and environments by offering visitors adequate thematic activities and items. Notably, commercial and cultural activity in commercial complexes and cultural hubs causes agglomerated High-Vitality states to spread outward. The presence of some outliers is associated with substantial commercial cultural activity.
4.3.3. Decoding Waterfront Vitality: Medium-Vitality Units
- V data set: Range approximately 1.508, standard deviation approximately 0.371, interquartile range (IQR) approximately 0.371, the degree of dispersion is low, and the data set distribution is concentrated.
- Vi data set: The range is approximately 9.167, the standard deviation is about 1.996, and the interquartile range (IQR) is roughly 2.027, with a relatively high degree of dispersion and significant fluctuations.
- F3 and F4 feature comparatively high means and medians, along with a significant amount of data dispersion and a few outliers. F2 has outliers but also a shorter box, which suggests a lesser data dispersion. F1, F5, and F6 contain comparatively symmetric data distributions and close medians and means (Figure 19).

- The waterfront vitality of this group is driven by a combination of “Social and humanistic interaction” and “Natural-Artificial transition harmony”. The vitality of these units is positively influenced by surrounding High-Vitality units and holds great potential. With appropriate guidance, it can also radiate vitality to some extent toward lower-vitality areas.
- Medium-Vitality units are frequently found near High-Vitality nodes and are significantly impacted by their radiation/spillover effect. Their vitality fluctuates between rest and work days, indicating a lack of long-term tenacity. The spatial categories of Medium-Vitality units are more complex than those of High-Vitality units, and they often comprise at least two of the three types: leisure walks, urban squares, and recreational green areas. They also feature more composite spatial attributes than Low-Vitality units. An on-site study found that Medium-Vitality units have dynamic user activity patterns and shorter dwell periods. The combination of manufactured surroundings and natural water bodies provides sufficient Spatial Coziness (F2) and Water Proximity (F3), but these units struggle to handle large-scale, extremely vibrant events due to their often limited waterfront areas and limited space capacity.
4.3.4. Decoding Waterfront Vitality: Low-Vitality Units
- V data set: Range approximately 0.948, standard deviation approximately 0.245, interquartile range (IQR) approximately 0.315, the degree of dispersion is low, and the data distribution is concentrated.
- Vi data set: The range is approximately 2.833, the standard deviation is about 0.750, and the interquartile range (IQR) is roughly 0.917, with a relatively low degree of dispersion and relatively low fluctuations.
- Overall, the median-lines and means of F3 and F4 are relatively high, the degree of data dispersion is significant, and there are some outliers. The F2 box is short, with little data dispersion, but there are some outliers. The median lines and means of F1, F5, and F6 are reasonably close, and the data distribution is fairly symmetric (Figure 20).

- The vitality is primarily driven by “ecological experiences” and the spillover effect of surrounding vitality. Some units are typically designated as leisure green spaces or eco-friendly leisure trails; however, half of the units have long been ignored in terms of management, resulting in concerns like rubbish pollution, vegetation overgrowth.
- Low-Vitality units are unable to sustain considerable activity clusters during weekdays and on weekends, and most remain dormant for extended periods of time since they are distant from commercial or cultural areas and have monotonous structures. According to visitor feedback, the lack of entertainment venues and services leaves the experience essentially blank, while paths and nodal spaces are disjointed and stiff, preventing waterfront activities from taking place. Although it serves a useful purpose as a landscape backdrop for the surrounding dynamic areas, the lack of spatial vitality has greatly decreased its overall attractiveness.
5. Discussions
5.1. Reinterpreting Waterfront Vitality Through Spatial-Experience
- Nonlinear Leap Effect: Low-Vitality locations achieve cross-regional vitality transmission through landscape support functions, and the waterfront activities display a dynamic pattern of continuity and leaps.
- Spillover and Decay Effect: Periodic “cultural-commercial activities” provide spillover vitality effects, lead to a vitality radiation zone spanning two–four geographical units, with strength decreasing with distance.
- Dynamic Coupling Mechanism: Through long-term interactions, the dynamic linkage of natural and cultural landscapes produces persistent vitality stimulating effects and strengthens place identity. The research of waterfront areas, including the Seine River in Paris and the Qinhuai River in Nanjing, has extensively validated this impact [53].
5.2. Limitations and Future Research
6. Conclusions
Author Contributions
Funding
Institutional Review Board Statement
Informed Consent Statement
Data Availability Statement
Acknowledgments
Conflicts of Interest
References
- Wang, F.; Zhao, M. The Analysis of the Vitality Measurement and Correlation Factors of Urban Water-front Space. Chin. Landsc. Archit. 2023, 39, 66–71. [Google Scholar] [CrossRef]
- Cohen, S.; Guo, D. The Sustainable City; Columbia University Press: New York, NY, USA, 2018. [Google Scholar]
- Montgomery, J. Making a city: Urbanity, vitality and urban design. J. Urban Des. 1998, 3, 93–116. [Google Scholar] [CrossRef]
- Fang, B.; Ge, Y. The Evolution of Block Patterns and the Discussion on the Appropriate Scale of Block in the Development Course of Block System. Urban Dev. Stud. 2019, 26, 34–40. Available online: https://kns.cnki.net/kcms/detail/detail.aspx?dbcode=CJFD&filename=CSFY201911006 (accessed on 27 June 2025).
- Ren, K.X.; Sun, X.H.; Cenci, J.; Zhang, J.Z. Assessment of public open space research hotspots, vitalities, and outlook using CiteSpace. J. Asian Archit. Build. Eng. 2023, 22, 3799–3817. [Google Scholar] [CrossRef]
- Zhang, X.Z.; Ren, Y.Y. Revitalization of urban industrial heritage from a perspective of spatial production theory: The case study of “Old market” project. J. Asian Archit. Build. Eng. 2024, 24, 3440–3456. [Google Scholar] [CrossRef]
- Cao, Z.; Zhen, F.; Li, Z.; Lobsang, T.; Tashi, L. Urban Temporal Vibrancy Mode and Its Influencing Factors Based on Mobile Signaling Data: A Case Study of Nanjing, China. Hum. Geogr. 2022, 37, 109–117. [Google Scholar] [CrossRef]
- Alexander, C. A New Theory of Urban Design; Center for Environmental Structure: Berkeley, CA, USA, 1987; Volume 6. [Google Scholar]
- Alexander, C. The Nature of Order: The Process of Creating Life; Taylor & Francis: Oxford, UK, 2002; pp. 102–176. [Google Scholar]
- Lynch, K.A.; Qingyi, L.; Zhaohui, C. Urban Form; Huaxia Publishing House: Beijing, China, 2001; pp. 3–28. [Google Scholar]
- Bentley, I.; McGlynn, S.; Smith, G.; Alcock, A.; Murrain, P. Responsive Environments; Routledge: Oxford, UK, 2013; pp. 132–208. [Google Scholar]
- Whyte, W.H.; Underhill, P. City: Rediscovering the Center; University of Pennsylvania Press: Philadelphia, PA, USA, 2009; pp. 132–140. [Google Scholar]
- McHarg, I.L.; Steiner, F. The Essential Ian McHarg: Writings on Design and Nature; Island Press: Washington, DC, USA, 2006. [Google Scholar]
- Samant, S.; Brears, R. Urban Waterfront Revivals of the Future. In Greening Cities; Advances in 21st Century Human Settlements; Springer: Singapore, 2017; pp. 331–356. [Google Scholar] [CrossRef]
- Liu, S.; Lai, S.Q.; Liu, C.; Jiang, L. What influenced the vitality of the waterfront open space? A case study of Huangpu River in Shanghai, China. Cities 2021, 114, 103197. [Google Scholar] [CrossRef]
- Carmona, M. Public Places Urban Spaces: The Dimensions of Urban Design, 3rd ed.; Routledge: Abingdon, UK, 2021; pp. 50–62. [Google Scholar]
- Hoyle, B. Global and Local Change on the Port-City Waterfront. Geogr. Rev. 2000, 90, 395–417. [Google Scholar] [CrossRef]
- Pafka, E.; Dovey, K.; Aschwanden, G.D. Limits of space syntax for urban design: Axiality, scale and sinuosity. Environ. Plan. B Urban Anal. City Sci. 2018, 47, 508–522. [Google Scholar] [CrossRef]
- Xia, X.; Zhang, Y.; Zhang, Y.; Rao, T. The spatial pattern and influence mechanism of urban vitality: A case study of Changsha, China. Front. Environ. Sci. 2022, 10, 942577. [Google Scholar] [CrossRef]
- Zhang, F.; Zhou, X. Structural renovation of blocks in build-up area of Jiangnan cities, taking Suzhou new district as an example. iScience 2023, 26, 108553. [Google Scholar] [CrossRef]
- Hu, M. Smart Technologies and Design for Healthy Built Environments; Springer: Berlin/Heidelberg, Germany, 2021. [Google Scholar]
- Simons, S.; Kinjawadekar, A.; Kinjawadekar, T.A. Assessing the impacts of ecological framework of Indian riverfront revitalization projects. Environ. Dev. Sustain. 2024, 26, 27553–27583. [Google Scholar] [CrossRef]
- Ji, X.; Fu, Y.; Shi, J.; Liu, H. Measurement and influencing factors of urban waterfront street vitality from the perspectives of behavior and perception. Environ. Res. Commun. 2025, 7, 015041. [Google Scholar] [CrossRef]
- Li, X.; Kozlowski, M.; Ismail, S.B.; Salih, S.A. Multidimensional Evaluation of Crowd Activity Performance in Leisure Urban Spaces Using Network Big Data: A Case Study from Nanjing, China. J. Urban Plan. Dev. 2025, 151, 05025014. [Google Scholar] [CrossRef]
- Zhang, F.; Zhou, X. Strategies and Tectics of Integrating Water with City in the Urbanization of Jiangnan Region. In Proceedings of the 2017 UIA World Architects Congress, Seoul, Republic of Korea, 3–9 September 2017; Volume 9, pp. 3–10. [Google Scholar]
- Jin, A.; Ge, Y.; Zhang, S. Spatial Characteristics of Multidimensional Urban Vitality and Its Impact Mechanisms by the Built Environment. Land 2024, 13, 991. [Google Scholar] [CrossRef]
- Yuan, Q.; Li, H.; Leng, H. Influence of Waterfront Environments on the Psychological Health of Older Adults during Winters: A Case Study based on Harbin. S. Archit. 2023, 6, 96–106. [Google Scholar] [CrossRef]
- Zhou, X.; Dong, Z.; Zhang, F. Comparative Analysis of TAG (Three-Dimensional Architectural Greening) Scenic Beauty Quantitative Techniques Based on Visual Perception. Buildings 2025, 15, 1450. [Google Scholar] [CrossRef]
- Liu, S.; Zhang, L.; Long, Y.; Long, Y.; Xu, M. A New Urban Vitality Analysis and Evaluation Framework Based on Human Activity Modeling Using Multi-Source Big Data. ISPRS Int. J. Geo-Inf. 2020, 9, 617. [Google Scholar] [CrossRef]
- Wei, H.; Pan, K. Mechanism of Influencing Factors on Recreation Space Selection Behavior of Urban Waterfront Recreationalists: A Case Study of Qinhuai River in Nanjing. Manag. Adm. 2023, 7, 164–169. [Google Scholar] [CrossRef]
- Chen, M.; Cai, Y.; Guo, S.; Sun, R.; Song, Y.; Shen, X. Evaluating implied urban nature vitality in San Francisco: An interdisciplinary approach combining census data, street view images, and social media analysis. Urban For. Urban Green. 2024, 95, 128289. [Google Scholar] [CrossRef]
- Zhang, Z.; Zhang, Y.; Tian, H.; Xiao, R. Urban Vitality and its Influencing Factors: Comparative Analysis Based on Taxi Trajectory Data. IEEE J. Sel. Top. Appl. Earth Obs. Remote Sens. 2022, 15, 5102–5114. [Google Scholar] [CrossRef]
- Cao, Y.; Lee, S. Analysis of Urban Vitality and Its Determinant Factors Using POI Bigdata in Seoul, Korea. J. Korea Plan. Assoc. 2021, 56, 87–102. [Google Scholar] [CrossRef]
- Zhou, Z.; Yang, F.; Li, J.; Li, J.; Zou, Z. Identification of Critical Areas of Openness–Vitality Intensity Imbalance in Waterfront Spaces and Prioritization of Interventions: A Case Study of Xiangjiang River in Changsha, China. Land 2024, 13, 686. [Google Scholar] [CrossRef]
- Zhang, P.; He, Q.; Mohd Nasir, N.B. Landscape Preference Study of Urban Waterfront Ecological Space under Public Participation. Landsc. Urban Hortic. 2024, 6, 73–78. [Google Scholar] [CrossRef]
- Xie, J.; Tu, W. Reinterpretation of the Dynamics of Urban Renewal Based on Multiple Rent Gaps: Taking Langyuan Vintage and Tianzifang as Examples. Urban Plan. Forum 2023, 1, 74–79. [Google Scholar] [CrossRef]
- Zhou, H. Evaluation Research on Waterfront Greenway Based on Pedestrian Friendly Concept—A Case Study of Luopu Park in Luoyang City. Master’s Thesis, Henan University of Science and Technology, Luoyang, China, 2023. [Google Scholar]
- Tan, D.M.; Rao, J.Y. Analysis on influencing factors of urban waterfront space vitality in Shenzhen. J. Geo-Inf. Sci. 2023, 25, 809–822. [Google Scholar] [CrossRef]
- He, L. Research on Identification and Reconstruction of Lost Space in Yinchuan City. Master’s Thesis, Ningxia University, Yinchuan, China, 2024. [Google Scholar]
- SIPAC (Suzhou Industrial Park Administration Committee). Suzhou Industrial Park Annals. Available online: https://www.sipac.gov.cn/szdaglzx/yqfzszgyyqz/list.shtml (accessed on 30 April 2025).
- SIPAC (Suzhou Industrial Park Administration Committee). Overall Plan of Suzhou Industrial Park (2012–2030). Available online: https://www.sipac.gov.cn/szghjswyh/ztgh/202003/0c430df700fa46be86677ce30ac899dd.shtml (accessed on 2 March 2021).
- Zhang, F.; Liu, Q.; Zhou, X. Vitality Evaluation of Public Spaces in Historical and Cultural Blocks Based on Multi-Source Data, a Case Study of Suzhou Changmen. Sustainability 2022, 14, 14040. [Google Scholar] [CrossRef]
- Lv, F.; Wang, S. Space Vitality Measurement and its Influencing Factors of The Core Section of Huangpu Riverfront Area from both Online and Offline Perspectives. Planners 2023, 39, 123–130. [Google Scholar] [CrossRef]
- Yuan, J. Evaluation and Analysis of Urban Waterfront Space Vitality Based on SEC Principle. Art Des. 2021, 4, 102. [Google Scholar] [CrossRef]
- Yan, C.; Cai, X.; Wu, Y.; Tang, X.; Zhou, Y.; Yang, Q.; Li, F.; Lan, S.; Lin, L. How Do Urban Waterfront Landscape Characteristics Influence People’s Emotional Benefits? Mediating Effects of Water-Friendly Environmental Preferences. Forests 2024, 15, 25. [Google Scholar] [CrossRef]
- Ye, Y.; Xiang, Y.; Qiu, H. Benefit Evaluation and Coupling Mechanism of Recreation Space in Lake Parks Based on AHP-FCE Model. Chin. Landsc. Archit. 2024, 40, 71–76. [Google Scholar] [CrossRef]
- CJJ/T174-2013; Standards for Urban Water Area Cleaning Operations and Quality. Ministry of Housing and Urban-Rural Development of the People’s Republic of China: Beijing, China, 2013.
- Suzhou Municipal People’s Congress Standing Committee. Announcement No. 16 of the Standing Committee of the 17th Suzhou Municipal People’s Congress; Suzhou Urban Environmental Sanitation Quality Standards; Suzhou Municipal People’s Congress Standing Committee: Suzhou, China, 2023.
- Qiang, D.; McKenzie, G. Mobility Vitality in Active and Micro-Mobility Modes: Measuring Urban Vitality Through Spatiotemporal Similarity. AGILE GISci. Ser. 2025, 6, 9. [Google Scholar] [CrossRef]
- Marriott, K.; Tower, J.; McDonald, K. Community Leisure and Recreation Planning; Routledge: London, UK, 2020. [Google Scholar] [CrossRef]
- Zeng, C.; Dai, T.; Wang, F.; Wu, J. Assessing urban spatial vitality in post-port areas: A multimodal data analysis of Shanghai, Liverpool, and Marseille. Humanit. Soc. Sci. Commun. 2025, 12, 1195. [Google Scholar] [CrossRef]
- Fan, L.; Lai, Y.; Hu, Z.; Zheng, W.; Zhou, T. Association between Public Space and Resident Outdoor Activity Behavior in Urban Areas Surrounding Lakes. Sci. Rep. 2025, 15, 44871. [Google Scholar] [CrossRef]
- Ding, J.; Luo, L.; Shen, X.; Xu, Y. Influence of Built Environment and User Experience on the Waterfront Vitality of Historical Urban Areas: A Case Study of the Qinhuai River in Nanjing, China. Front. Archit. Res. 2023, 12, 820–836. [Google Scholar] [CrossRef]
- Fan, Y.; Kuang, D.; Tu, W.; Ye, Y. Which Spatial Elements Influence Waterfront Space Vitality the Most? A Comparative Tracking Study of the Maozhou River Renewal Project in Shenzhen, China. Land 2023, 12, 1260. [Google Scholar] [CrossRef]
- Üzümcüoğlu, D.; Polay, M. Enhancing urban waterfront development: A groundbreaking framework for fostering creativity. GeoJournal 2023, 88, 6091–6104. [Google Scholar] [CrossRef]
- Zhou, X.; Lu, S.; Zhang, F. Coupling Relationship of Urban Space and Waterfront Space in Suzhou New District and Its Optimization Strategy. J. Chin. Urban For. 2023, 21, 50–57. [Google Scholar] [CrossRef]
- Vadekar, G. Urban Waterfront Cities and Tourism; Educohack Press: San Francisco, CA, USA, 2025; pp. 50–71. [Google Scholar]






| Category | Factor | Indicator | |||
|---|---|---|---|---|---|
| Item | Weight | Item | Weight | Item | Weight |
| Spatial Quality (SQ) | 0.543 | Accessibility F1 | 0.204 | Attainability F1-1 | 0.587 |
| Traffic Convenience F1-2 | 0.413 | ||||
| Spatial Coziness F2 | 0.363 | Water Clarity Index F2-1 | 0.201 | ||
| Water Exposure Index F2-2 | 0.133 | ||||
| Waterfront Cleanliness Index F2-3 | 0.183 | ||||
| Sky Openness Index F2-4 | 0.088 | ||||
| Green View Index F2-5 | 0.122 | ||||
| Amenity Density Index F2-6 | 0.113 | ||||
| Recreational Facility Density F2-7 | 0.161 | ||||
| Water Proximity F3 | 0.210 | Waterfront Facility Coverage Index F3-1 | 0.529 | ||
| Waterfront Safety Index F3-2 | 0.471 | ||||
| Visual Attraction F4 | 0.223 | Waterfront Aesthetic Index F4-1 | 0.429 | ||
| Recreation Space Aesthetic Index F4-2 | 0.364 | ||||
| Recreation Space Color Comfort Index F4-3 | 0.207 | ||||
| Spatial Experience (SE) | 0.457 | Path Holistic Experience F5 | 0.459 | Continuity F5-1 | 0.515 |
| Trail Richness F5-2 | 0.485 | ||||
| Node User-Friendliness F6 | 0.541 | Activity Support F6-1 | 0.530 | ||
| Facility Friendliness F6-2 | 0.470 | ||||
Disclaimer/Publisher’s Note: The statements, opinions and data contained in all publications are solely those of the individual author(s) and contributor(s) and not of MDPI and/or the editor(s). MDPI and/or the editor(s) disclaim responsibility for any injury to people or property resulting from any ideas, methods, instructions or products referred to in the content. |
© 2026 by the authors. Licensee MDPI, Basel, Switzerland. This article is an open access article distributed under the terms and conditions of the Creative Commons Attribution (CC BY) license.
Share and Cite
Zhang, F.; Zhou, J.; Wu, J.; Zhou, X.; Yang, Z.; Wang, X.; Wu, Z. Decoding Waterfront Vitality: A Space–Experience Interaction Evaluation. Sustainability 2026, 18, 2131. https://doi.org/10.3390/su18042131
Zhang F, Zhou J, Wu J, Zhou X, Yang Z, Wang X, Wu Z. Decoding Waterfront Vitality: A Space–Experience Interaction Evaluation. Sustainability. 2026; 18(4):2131. https://doi.org/10.3390/su18042131
Chicago/Turabian StyleZhang, Fang, Jun Zhou, Jie Wu, Xi Zhou, Ziqi Yang, Xu Wang, and Zhide Wu. 2026. "Decoding Waterfront Vitality: A Space–Experience Interaction Evaluation" Sustainability 18, no. 4: 2131. https://doi.org/10.3390/su18042131
APA StyleZhang, F., Zhou, J., Wu, J., Zhou, X., Yang, Z., Wang, X., & Wu, Z. (2026). Decoding Waterfront Vitality: A Space–Experience Interaction Evaluation. Sustainability, 18(4), 2131. https://doi.org/10.3390/su18042131



