Article

Multistation VAR-Based Analysis of Precipitation, Temperature, and Lake Level Interactions in the Lake Van Basin, Türkiye

by
Murat Pınarlık
1,* and
Ebru Burcu Yardımcı Bozdoğan
2
1
Department of Civil Engineering, Faculty of Technology, Gazi University, Teknikokullar, Yenimahalle, 06500 Ankara, Türkiye
2
Department of Economics, Faculty of Economics and Administrative Science, Başkent University, Bağlıca Campus, 06790 Ankara, Türkiye
*
Author to whom correspondence should be addressed.
Sustainability 2026, 18(4), 2130; https://doi.org/10.3390/su18042130
Submission received: 14 January 2026 / Revised: 16 February 2026 / Accepted: 19 February 2026 / Published: 21 February 2026

Abstract

Closed-basin lakes are highly sensitive to climatic variability, yet for the Lake Van Basin (Türkiye), the dynamic and spatially heterogeneous linkages among atmospheric drivers and lake-level changes (particularly their lag structure and predictive directionality) remain insufficiently quantified in a unified multivariate setting. This study examines how temperature and precipitation jointly influence hydrological behavior in the Lake Van Basin using a multi-station Vector Autoregression (VAR) framework. By integrating long-term observations from multiple meteorological stations, the analysis explicitly captures the spatial heterogeneity that characterizes this complex endorheic system and provides a consistent basis for comparing station-specific dynamics. The results show strong persistence in lake-level dynamics across specifications, with lagged lake-level coefficients of 0.2595 to 0.3685 (p < 0.01), indicating a buffered endorheic response. Temperature exhibits a highly consistent seasonal dependence across stations, reflected by a uniformly negative and significant four-month temperature lag in the temperature equations (−0.34 to −0.42, p < 0.01). Granger-causality tests further indicate robust bidirectional coupling between temperature and precipitation in all station specifications (p < 0.01 and typically p ≤ 0.05), while climate-to-lake-level linkages remain spatially heterogeneous but are statistically supported across both Tatvan-based and Gevas-based specifications (Tatvan-Tatvan: p < 0.01 for both climate variables; Tatvan-Ahlat: temperature p = 0.000; Gevas-Van, Gevas-Ercis, and Gevas-Muradiye: temperature p = 0.000 and precipitation p = 0.013, 0.008, and 0.015, respectively). Distinct station-level patterns further demonstrate that topographical differences modulate the strength and direction of climate–hydrology linkages across the basin. By providing a coherent, causally consistent understanding of these interactions and explicitly incorporating season-specific VAR and Granger-causality evidence, this study offers a transferable methodological framework for analyzing climate-sensitive lake systems and highlights the need to incorporate temperature-driven processes into water-management and climate-adaptation strategies in endorheic basins.

1. Introduction

Global climate variability has substantially altered the hydrological cycle, leading to significant variations in temperature, precipitation, and surface water storage across different regions of the world. Rising air temperatures intensify evaporation and modify atmospheric moisture dynamics, thereby influencing precipitation regimes and runoff generation [1]. These climatic changes have directly affected the water balance of lakes and reservoirs, especially in closed and semi-closed basins that are highly sensitive to hydroclimatic fluctuations. Satellite-based observations have revealed widespread declines in global freshwater availability and pronounced spatio-temporal variability in lake water storage in response to climatic forcing [2]. Such hydroclimatic responses are closely linked to background temperature–precipitation interactions, which determine the direction and magnitude of water level changes [3]. Understanding these coupled processes is crucial for assessing the impacts of climate variability on regional water resources and for developing sustainable management strategies in vulnerable hydrological systems.
Türkiye, located in a climatically sensitive transition zone between the Eastern Mediterranean and continental Asia, has experienced marked hydroclimatic variability in recent decades. Nationwide analyses indicate increasing temperature trends and decreasing precipitation in many regions, leading to intensified drought frequency and severity, particularly in central and eastern parts of the country [4,5]. These shifts have resulted in significant fluctuations in lake water levels, especially within closed-basin lake systems that respond rapidly to climatic anomalies. Recent research on major Turkish lakes demonstrates that combined climatic stressors, in some cases supported by anthropogenic water withdrawals, have driven notable shoreline retreats and hydrological imbalance, as evidenced in Lake Eğirdir [6]. In the case of Lake Van, one of the world’s largest alkaline lakes, meteorological forcing has been shown to exert a delayed yet pronounced influence on lake-level behaviour, with precipitation and temperature emerging as key drivers of its hydrological variability [7]. Collectively, these findings underscore that climate-induced changes in precipitation and temperature regimes play a dominant role in shaping lake hydrology across Türkiye, particularly within endorheic systems where adaptive capacity is limited.
Lake Van occupies a prominent position within this context. The lake has a surface area of approximately 3602 km2, an average depth of 171 m, a maximum depth of 451 m, and a mean elevation of about 1648 m above sea level. The Lake Van Basin exhibits distinct continental climate characteristics, with long, cold winters and short, dry summers. These pronounced seasonal contrasts and the limited precipitation regime provide a suitable natural setting for investigating long-term temperature and precipitation trends. Moreover, the closed hydrological structure of the basin allows climatic signals to be more clearly expressed in lake-level variability and surrounding hydroclimatic conditions [8].
Recent advances in hydroclimatic research have focused on quantifying the dynamic interactions among precipitation, temperature, and hydrological variables such as runoff and water level using multivariate time series approaches. Traditional empirical correlations have been replaced by statistically grounded frameworks such as the Vector Autoregression (VAR) model, which effectively captures lagged dependencies and mutual feedback between hydro-meteorological parameters [9,10]. The integration of Granger causality, Impulse Response Functions (IRF), and Variance Decomposition (VD) within the VAR framework enables identification of both short- and long-term causal mechanisms governing hydrological variability.
Building on these developments, Dong et al. [11] employed a combined R/S–VAR approach to reveal bidirectional feedbacks between precipitation, evaporation, and dry-season streamflow, demonstrating that precipitation and sunshine variability exerted both immediate and delayed impacts on river discharge in southern China. In Türkiye, Terzi and Ergin [12] compared autoregressive and data-driven methods (AR, GEP, ANN, ANFIS) for monthly flow forecasting in the Kızılırmak River, showing that low-order autoregressive models remain robust under limited data conditions. Similarly, Aydın et al. [13] analyzed recent Lake Van level changes by combining water balance estimation with LSTM and NAR neural models, identifying a three-month lagged response between precipitation and lake-level variation and highlighting the role of tectonic disturbances.
In the meteorological domain, Abdallah et al. [14] demonstrated that a VAR-based framework can outperform physical models (e.g., ARPEGE) for short-term weather prediction by explaining interdependencies among precipitation, temperature, humidity, and wind parameters. Ouma et al. [15] integrated land-use and climate factors within VAR, RFR, and MLP-ANN structures to predict dam water levels, concluding that the hybrid VAR-ANN model achieved the best balance between interpretability and accuracy. Likewise, Nugroho et al. [16] applied a multivariate VAR (6) model for precipitation forecasting and isohyet mapping in Indonesia, achieving a mean absolute percentage error below 10% and underscoring the method’s spatial applicability. Expanding to basin-scale assessments, Jiang et al. [17] used a VAR–ECM framework to quantify the relative contributions of land-use change and climate variability to available water resources in the Yiluo River Basin, finding that anthropogenic land-use effects accounted for over 90% of total variation with a one-year lag.
Collectively, these studies demonstrate that VAR-based modeling provides a physically interpretable, data-efficient, and causally consistent toolset for examining hydro-climatic linkages across spatial and temporal scales. Comparative assessments have further shown that VAR frameworks can rival or even surpass nonlinear machine-learning models such as LSTM in transparency and causality inference, particularly under multi-scale climatic variability [18]. In this context, these advancements highlight a methodological evolution from single-variable trend analyses toward integrated, feedback-aware systems that link atmospheric forcing with hydrological response, offering a robust platform for diagnosing and predicting climate-driven water-level fluctuations in complex lake and river basins.
Unlike most previous hydroclimatic studies that rely on single-station or single-variable analyses, the present research introduces a multistation VAR-based framework to examine the lagged and bidirectional relationships among precipitation, temperature, and lake level across the Lake Van Basin. This integrated design enables spatially consistent interpretation of hydroclimatic variability within a closed, topographically diverse basin, where local feedbacks between climatic inputs and lake storage are highly nonlinear. The main objective of this study is to quantify the temporal dependencies and causal directions among these variables over a long-term period and to determine how their interactions differ across the northern, southern, eastern, and western sectors of the basin.
Methodologically, this study advances beyond conventional correlation or trend analyses by employing Vector Autoregression (VAR) modeling coupled with Granger causality testing, enabling the empirical identification of both directional influence and lag structures among hydroclimatic variables. This framework provides a physically coherent and spatially explicit representation of how regional climate variability governs lake-level dynamics in endorheic systems. The VAR approach was selected due to its ability to examine dynamic interdependencies without imposing strong a priori assumptions on causal direction, while offering greater interpretability than black-box machine learning methods. In this respect, the study represents the first systematic application of a multistation VAR framework to a major Turkish lake basin, establishing a quantitative foundation for future hydroclimatic forecasting and water balance modeling in closed continental environments.
Autoregressive (AR) models and their common extensions (e.g., ARMA and ARIMA) have long been used in hydrological time-series analysis (e.g., [19,20,21,22,23,24]). Nevertheless, hydrological variability is typically driven by interacting climatic controls, and purely univariate formulations may fail to represent coupled dynamics. Vector autoregressive (VAR) models provide a multivariate framework to capture the joint evolution and cross-dependencies among hydrological variables and their climatic covariates, and their predictive value has been demonstrated in multiple hydrological applications [25,26,27,28]. In this study, the innovative element is not VAR per se, but its systematic use together with Granger-type Wald tests to quantify directional predictability across station pairs and seasons within a unified modelling framework. By estimating the full system, the approach accounts for shared persistence and cross-variable interdependencies, which helps mitigate interpretive uncertainty relative to separate univariate analyses. This yields decision-relevant outputs by making lag structures, statistically supported predictive linkages, and their seasonal/spatial variability directly comparable. Importantly, an additional innovative component is the explicit seasonal stratification within the VAR-Granger framework, which allows lag structures and predictive hydroclimatic linkages to be estimated separately for each season; this reduces aggregation-induced uncertainty and yields season-specific information that a single non-seasonal specification would mask. Consistently, Halicki and Niedzielski [29] show that VAR-based multi-station forecasting can achieve strong short-lead predictive skill, particularly when missing data and outliers are handled explicitly.
This study goes beyond merely reaffirming the evaporation–precipitation balance framework established in the literature by quantitatively demonstrating how lake level responses vary across stations and seasons. In particular, the season in which temperature and precipitation exert a more dominant influence on lake levels, as well as the number of periods after which these effects materialize, are reported through the estimated lag structures. In this way, the study presents the seasonal asymmetry and spatial heterogeneity of hydroclimatic drivers in closed-basin lakes within an interpretable framework for decision-makers.
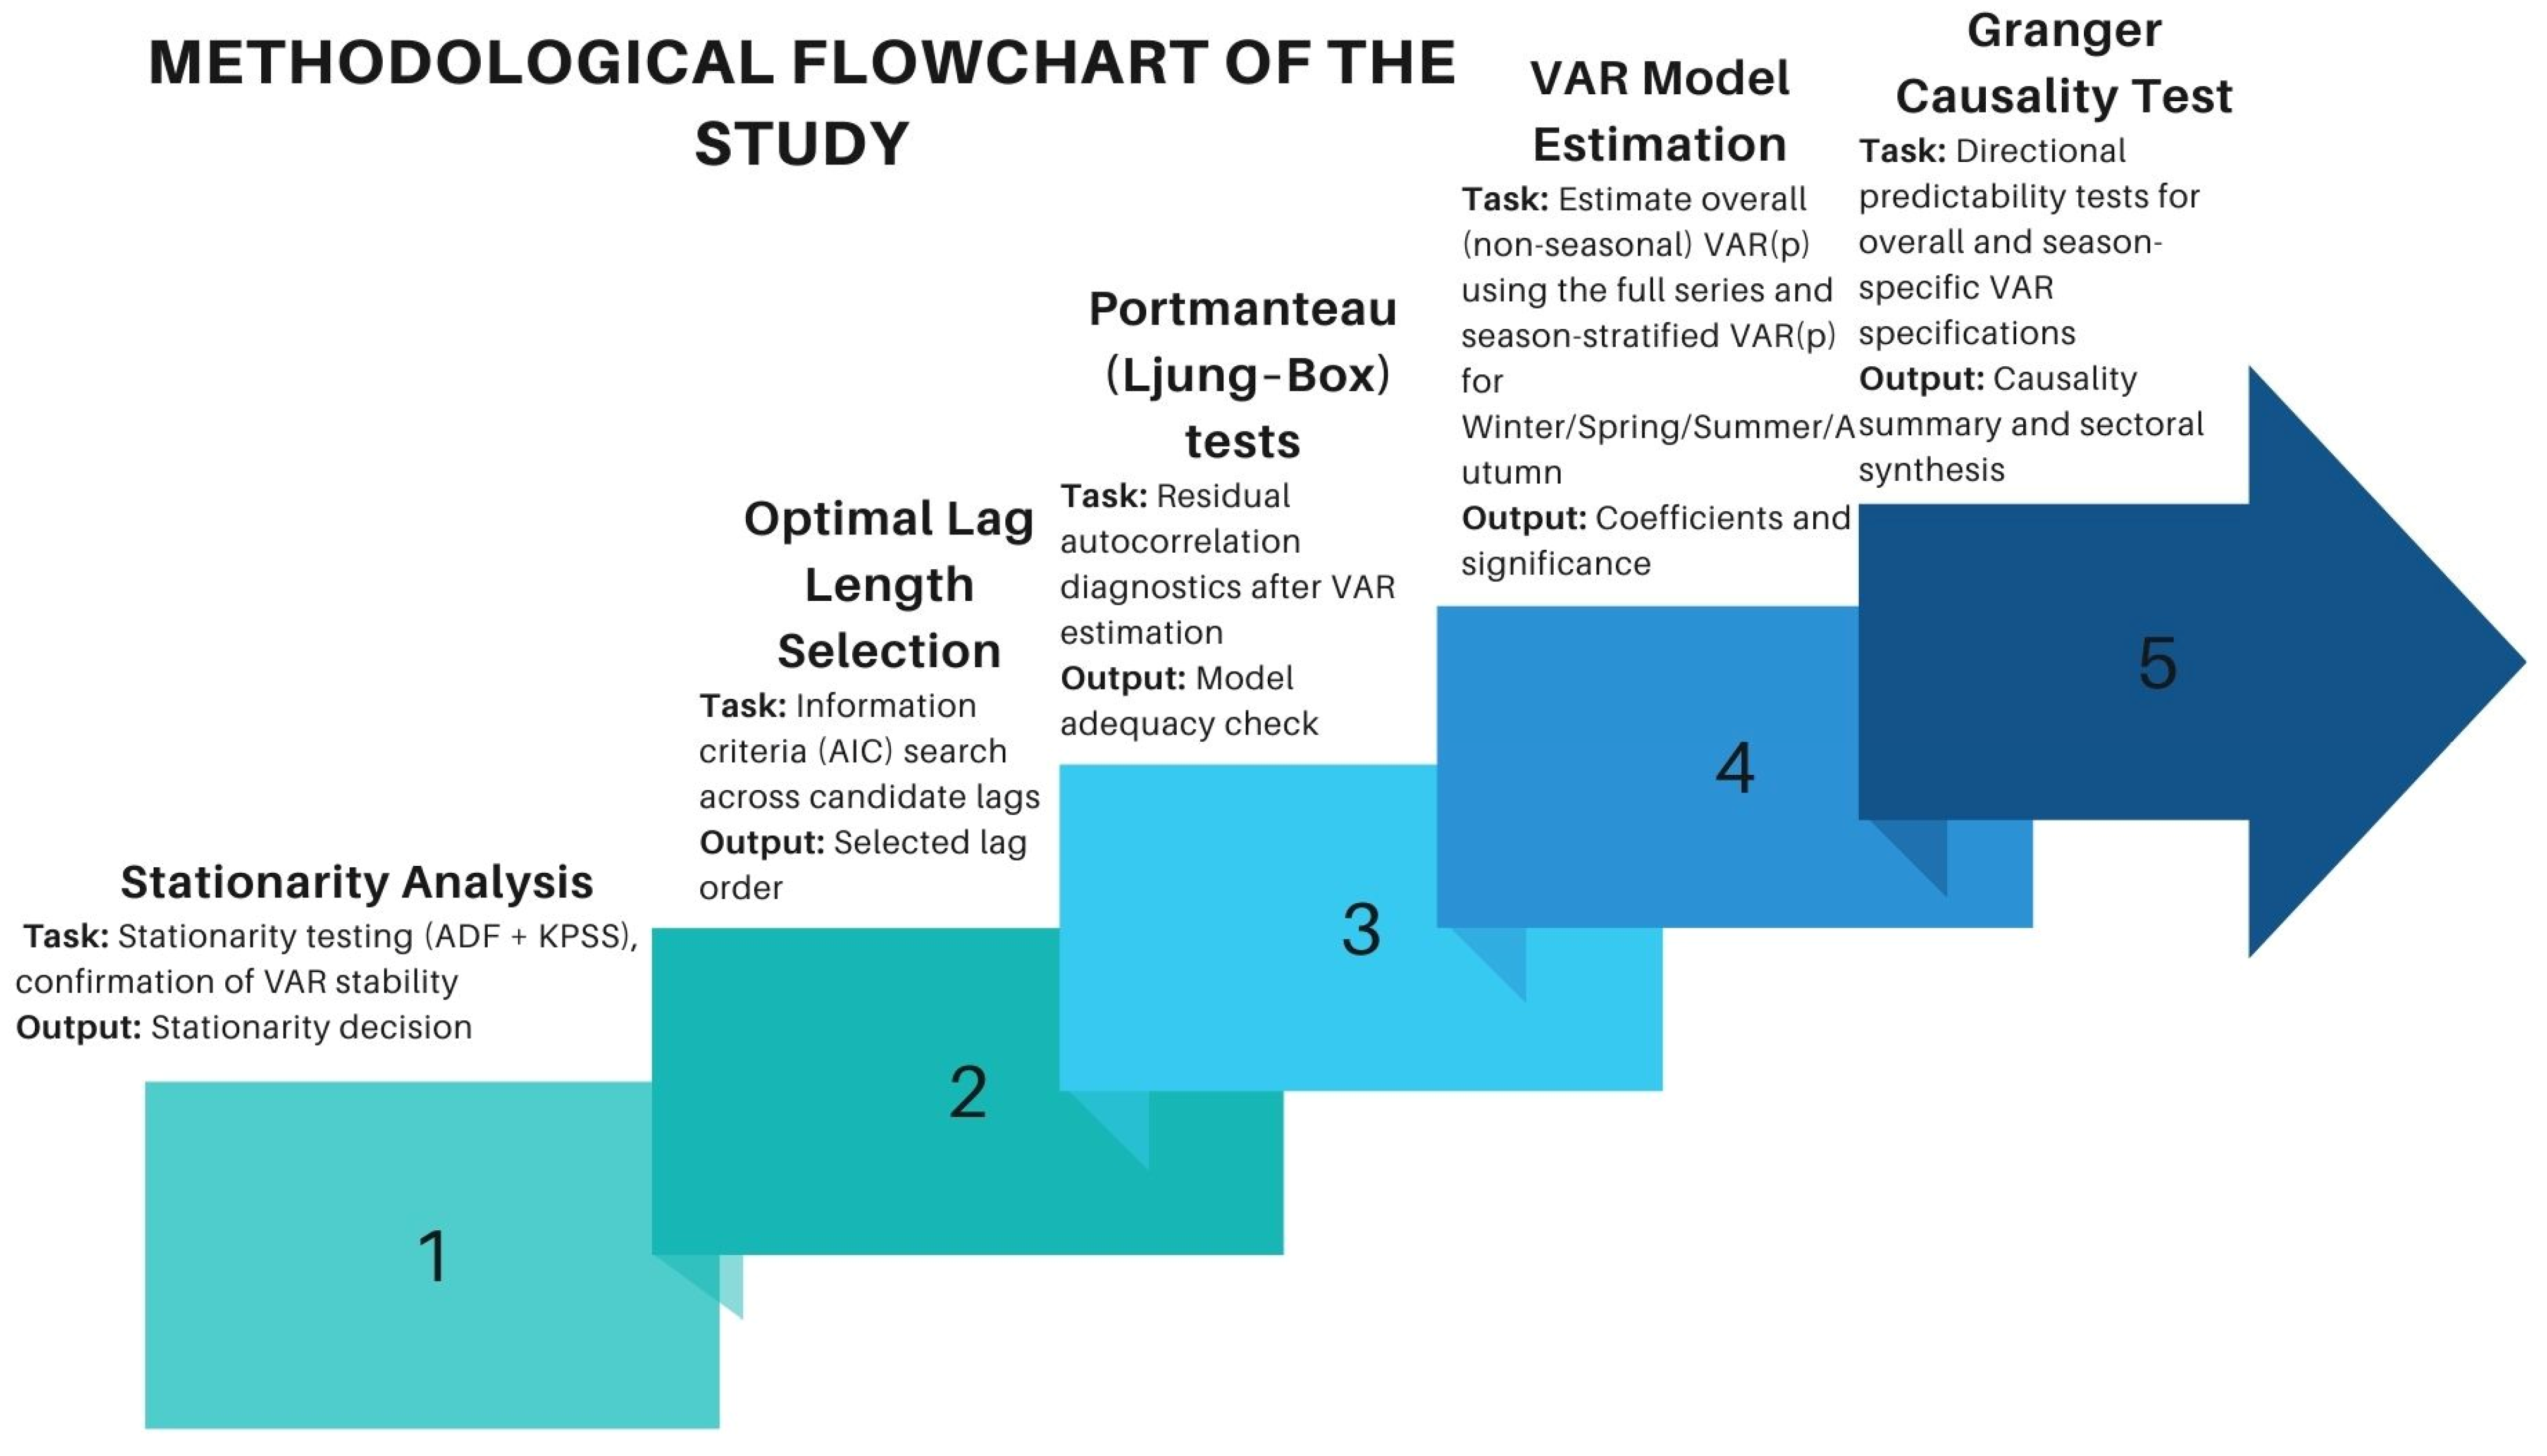
The modelling procedure was carried out in four main stages. First, under the Model Specification phase, precipitation, temperature, and lake-level variables were incorporated into a multivariate Vector Autoregression (VAR) framework to analyze their dynamic interrelations. In the Unit Root Test stage, the Augmented Dickey–Fuller (ADF) test was applied to verify the stationarity of each time series. Next, the Lag Length Selection was performed using the Akaike Information Criterion (AIC) to identify the optimal lag order that best represents the temporal structure of the data. The portmanteau (Ljung–Box) was applied to the VAR residuals evaluate the presence of autocorrelation. Finally, in the Granger Causality Test stage, the causal direction and significance of the relationships among variables were statistically assessed. This systematic workflow ensures a coherent evaluation of the temporal and causal dependencies within the Lake Van Basin.

2. Materials and Methods

2.1. Study Area and Data

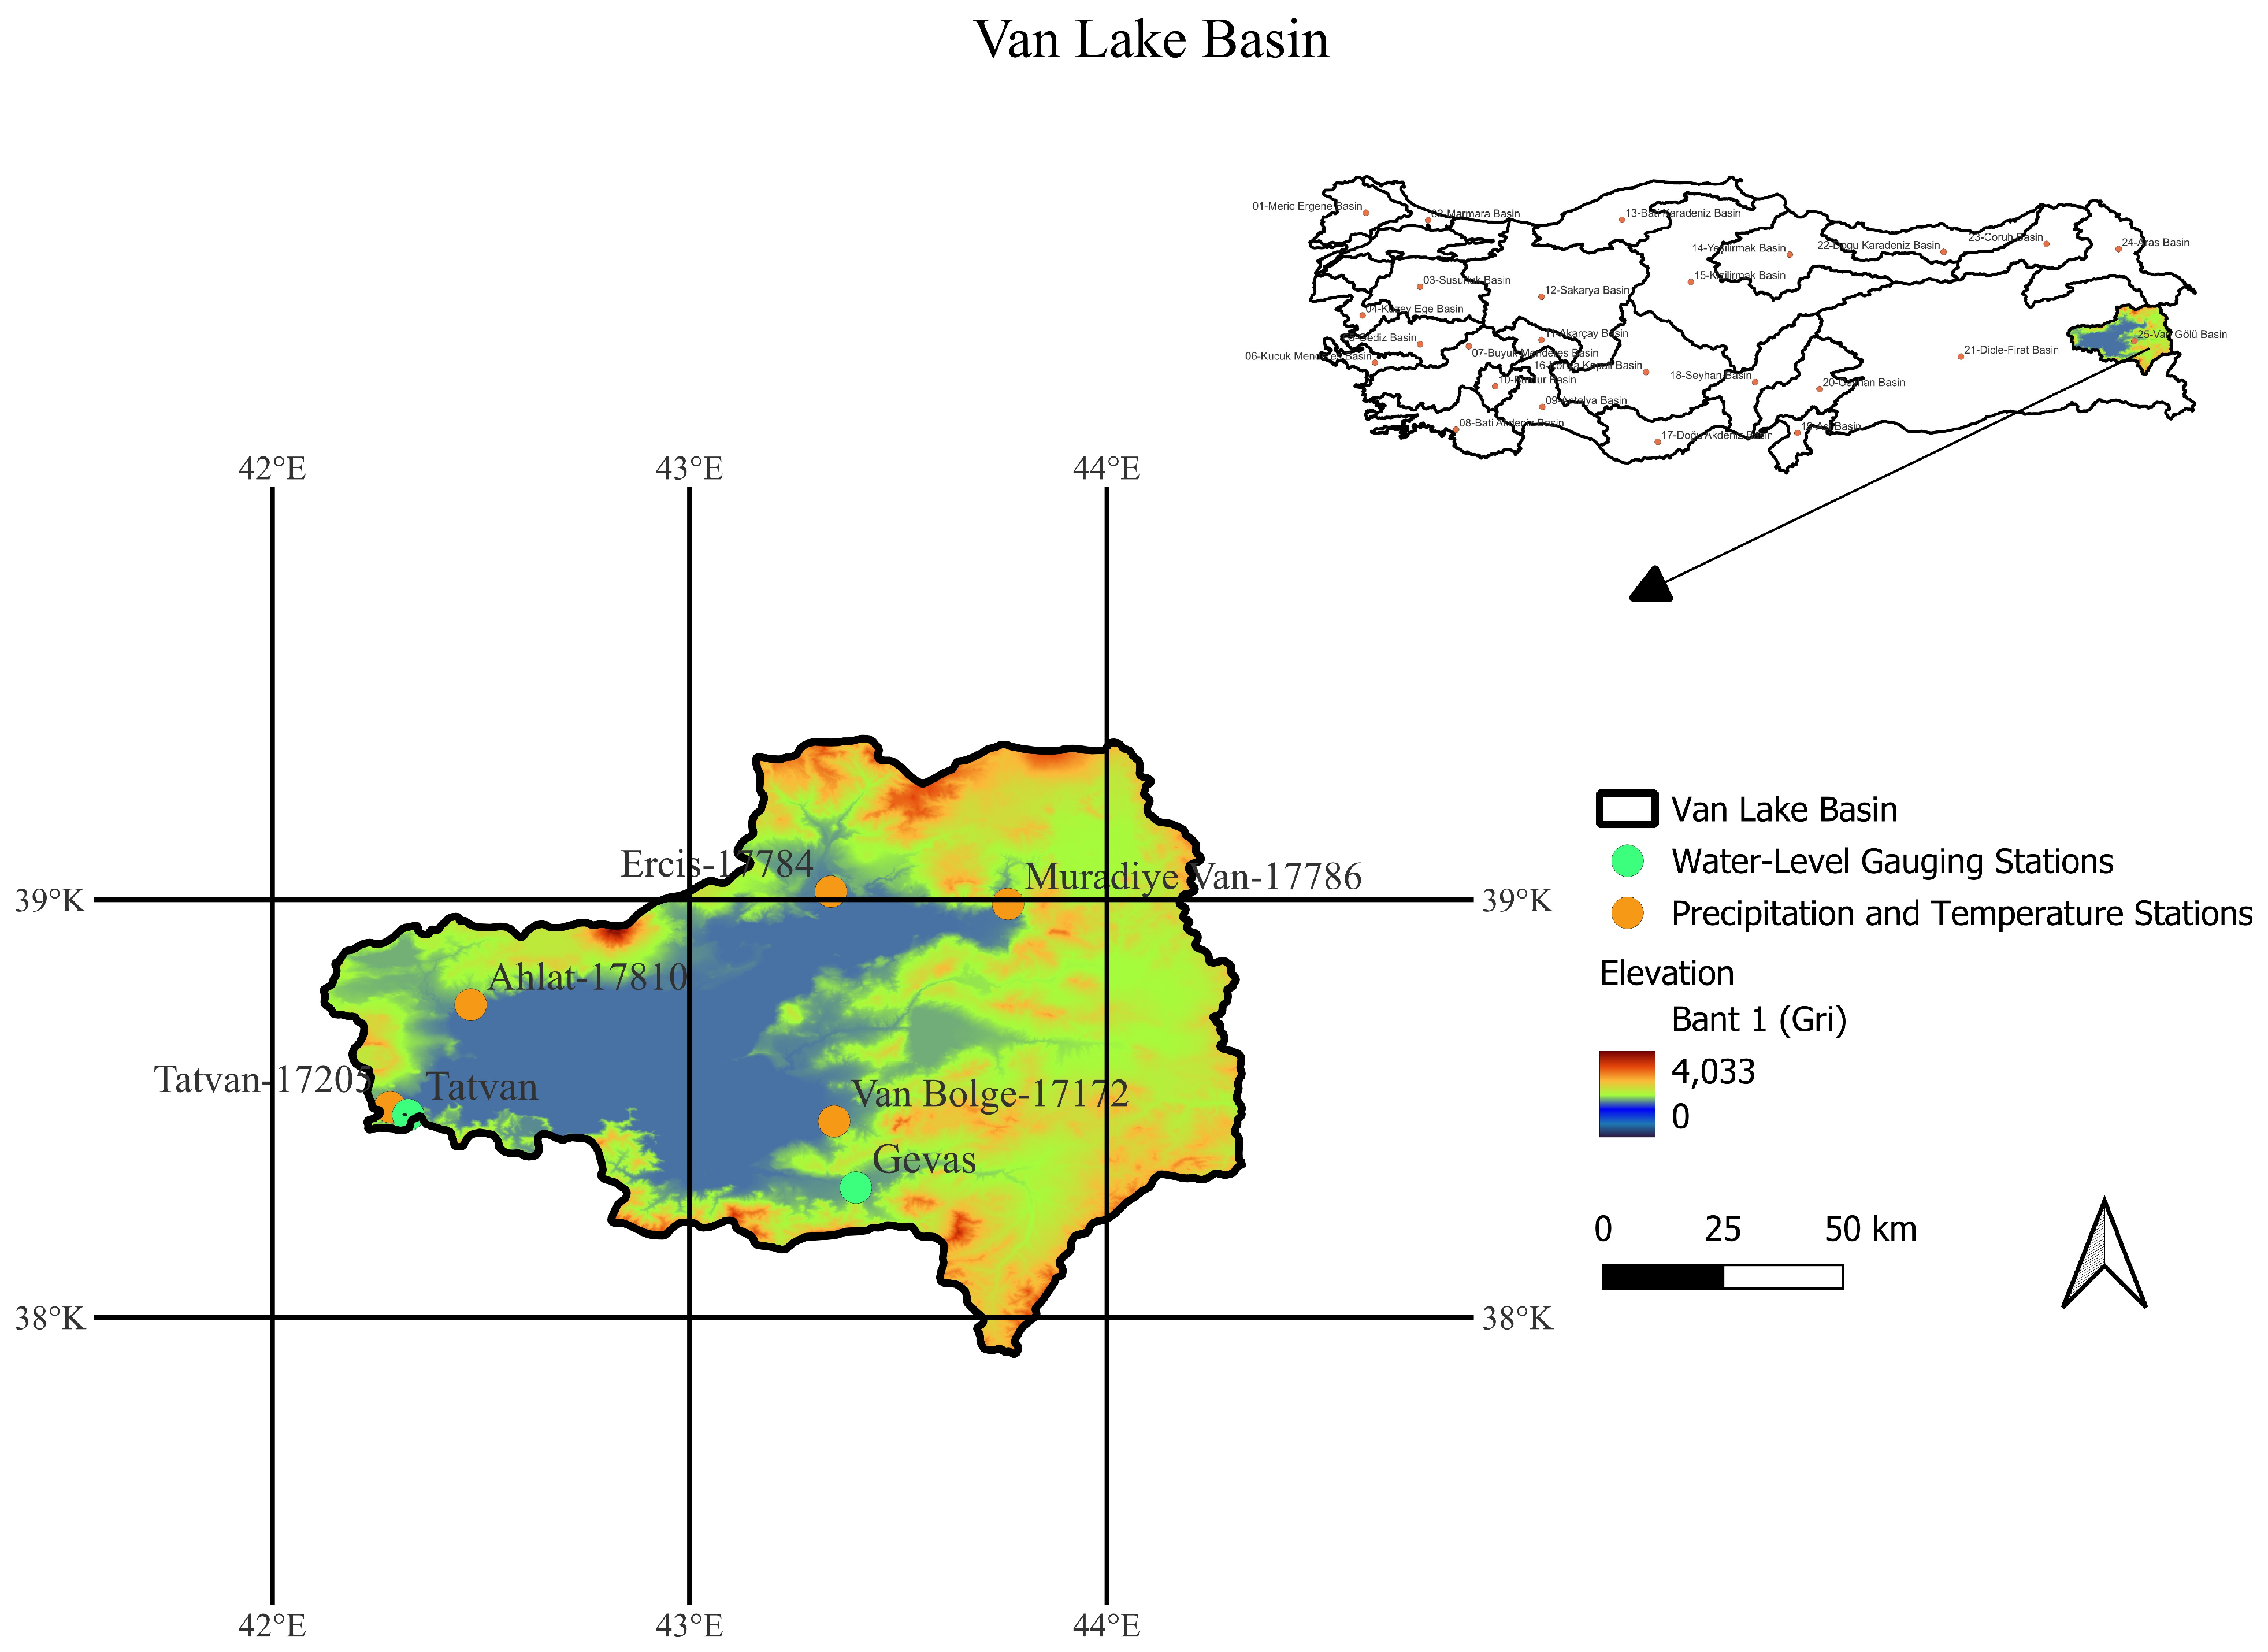
The study area is selected as Lake Van, one of the world’s largest alkaline lakes and the largest lake in Türkiye. The lake is located within the Lake Van Closed Basin, and detailed hydro-geographical and hydrological characteristics of both the lake and its basin are presented in Table 1. In addition, the spatial locations of the lake and the meteorological stations used for temperature, precipitation, and lake-level measurements in this study are shown in Figure 1.
The stations are positioned to represent the topographic/climatic gradient in the basin: west-northwest (Tatvan, Ahlat), north (Erciş), northeast (Muradiye) and south-southeast (Gevaş/Van) sub-regions.
The study uses five stations (Tatvan, Ahlat, Erciş, Muradiye, Van Region) that represent distinct sub-settings within the Lake Van Basin. Tatvan 1640 m above sea level and Ahlat 1710 m form a coastal/northwestern subgroup: they are located at comparable distances from the shoreline, differ by approximately 70 m in elevation, and Ahlat lies about 30 km north of Tatvan (straight-line distance). Erciş is situated roughly 70 km northeast of Ahlat and more inland relative to the lake, representing a northern–northeastern transition where shoreline influence is weaker. Muradiye lies about 35 km east of Erciş at ~1700 m above sea level and, despite a similar elevation, is positioned further inland within a corridor bounded by surrounding hills reaching ~2000–2200 m; this physiographic configuration can modulate the spatial distribution and transmission of meteorological inputs. The Van Region station is located approximately 70 km south of Muradiye and close to the lake shore, representing a southern coastal setting. Geographic and physical location information for the stations is given in Table 2.
Following the general hydro geographical characteristics summarized in Table 2, the meteorological dataset used for the VAR analysis is introduced in Table 3. These long-term observations represent the principal climatic inputs driving the hydroclimatic behavior of the Lake Van Basin. The analysis covers the period from 1965 to 2022 for the Tatvan-Tatvan Station, from 1959 to 2022 for the Tatvan-Ahlat Station, and from 2002 to 2022 for the Gevaş-Van, Gevaş-Erciş, and Gevaş-Muradiye Stations, ensuring a comprehensive assessment of long-term hydrological and climatic variations.
Model 1 and Model 2 refer to two distinct lake–meteorology matching structures used in the analysis. In Model 1, the Tatvan lake-level series is paired with meteorological inputs from the Tatvan station, whereas in Model 2, the same lake-level series is matched with climatic variables obtained from the Ahlat station. Presenting both model structures allows the study to evaluate the robustness of lake-climate interactions across different spatial observation points within the basin.
The descriptive statistics (see Table 3) indicate that monthly total precipitation ranges from 0 to 269 mm across the meteorological stations. Mean precipitation is highest at Tatvan (64.7 mm), while lower mean values are observed in Erciş (33.3 mm) and the Van region (33.2 mm); Muradiye (39.4 mm) and Ahlat (38.8 mm) lie in between. Mean air temperature ranges from 8.8 °C in Erciş to 10.4 °C in the Van region, with the remaining stations exhibiting intermediate averages (about 9.3 to 9.7 °C). Regarding lake levels, the Tatvan-based series display relatively modest variability, with observed ranges of 1647.0 to 1650.5 m (model 1) and 1647.9 to 1650.5 m (model 2), consistent with the buffering capacity of a closed basin lake. In the sample, the Gevaş lake level record also exhibits limited dispersion (min = 1648.13 m; max = 1649.99 m; mean = 1649.35 m; SD = 0.38).
In this study, the primary rationale for using only air temperature and total precipitation as climatic drivers is that, in closed-basin lakes, the water balance is determined to a first order by two components: (i) atmosphere-driven water inputs (precipitation) and (ii) atmosphere-driven water losses (evaporative processes). Precipitation is the most direct indicator representing net water input at the basin scale, whereas temperature (particularly in semi-arid closed basins) functions as a key proxy variable that governs the lake level’s lagged response, as it is among the strongest determinants of evaporative demand. While acknowledging that other atmospheric variables such as wind speed, relative humidity, evaporation, and radiation may also affect lake level, obtaining long-run, cross-station comparable, and uninterrupted time series for these variables is often constrained. Moreover, the fact that these variables can exhibit a high degree of co-movement with temperature may increase the number of parameters in a multivariate VAR framework, thereby reducing sample efficiency and potentially weakening model stability. For these reasons, the study aimed to consistently characterize the lagged dynamics and directional predictive linkages of the lake level–precipitation–temperature system by focusing on two core climate indicators with the highest data continuity at the basin scale. Nevertheless, in future work, to the extent that data availability permits, incorporating wind, relative humidity, and energy-balance-based evaporation indicators (e.g., Penman-Monteith) into the model would contribute to a more detailed decomposition of lake–atmosphere interactions.

2.2. Model Specification: VAR (Vector Auto Regression)

The methodological flowchart of the study outlines the sequential procedures used to examine the dynamic interactions among lake levels, temperature, and precipitation (Figure 2). The workflow begins with data collection from station-specific sample periods, followed by stationarity testing, optimal lag length selection, autocorrelation diagnostics, and VAR model estimation, and concludes with Granger causality analysis to identify the directional relationships among the variables.
The Vector Autoregression (VAR) model is employed in this study due to its ability to capture the dynamic interdependencies among multiple time series variables without imposing strong a priori restrictions on the structure of the system [31,32]. Unlike single-equation models, VAR accommodates the possibility that each variable may be both influenced by and influence the others, allowing for a comprehensive analysis of feedback effects. This property is particularly valuable for hydrological and climatic data, where variables such as lake level, precipitation, and temperature are inherently interrelated and evolve simultaneously over time.
By contrast, while univariate ARIMA-type models can represent the lake-level series’ internal dynamics strongly, explaining the effects of precipitation and temperature on lake level and the feedback mechanisms among variables within the same system requires separate equations and additional assumptions; this may limit the ability to derive holistic inferences regarding the lag structure and direction of relationships. Machine-learning-based approaches, although potentially advantageous in terms of forecasting performance, often entail limitations owing to their “black-box” nature in many applications (in explicitly representing lagged dynamics, ensuring interpretability of inter-variable linkages, and formulating testable hypotheses (e.g., directional predictive relationships). The VAR framework, by enabling the selection of lag length via information criteria and the testing of directional predictive linkages through tools such as Granger causality, provides a methodological basis that is well suited to the study’s objective of evaluating climate–hydrology interactions in a manner that is both comparable and statistically verifiable.
Since the precipitation and temperature series exhibit a pronounced annual cycle (seasonality), the analysis is conducted at two complementary levels. In the main analysis, the variables are modeled at a monthly frequency within the VAR and Granger causality framework; in addition, to test whether seasonality masks dynamic relationships, the data are disaggregated into meteorological seasons (winter: December-January-February; spring: March–April–May; summer: June–July–August; autumn: September–October–November), seasonal summary series are constructed, and separate VAR/Granger tests are applied for each season. This seasonal disaggregation is considered a robustness check aimed at both controlling for the effects of strong periodic structure from a statistical perspective and enhancing physical interpretability.
VAR is a statistical approach used to examine the mutual dependencies and evolving interactions among several time series variables [32,33].
Precipitation equation:
R t =   c r +   A { r r , 1 }   R { t   1 } +     A { r t , 1 } T { t   1 } +   A { r l , 1 } L { t   1 } +   e { r t }
Temperature equation:
T t =   c t +   A { t r , 1 }   R { t   1 } +     A { t t , 1 } T { t   1 } +     A { t l , 1 } L { t   1 } +   e { t t }
Lake level equation:
L t =   c l +   A { l r , 1 }   R { t   1 } +     A { l t , 1 } T { t   1 } +     A { l l , 1 } L { t   1 } +   e { l t }
The VAR model can alternatively be expressed using a matrix representation, as illustrated below.
R T T T L T = C r C t C l + A r r , 1 A r t , 1 A r l , 1 A t r , 1 A t t , 1 A t l , 1 A l r , 1 A l t , 1 A l l , 1 R t 1 T t 1 L t 1 + e r t e t t e l t
The expressions in the equation are as follows:
Rt represents the precipitation variable at time t;
Tt represents the temperature variable at time t;
L t represents the lake level variable at time t;
C r , C t , and C l   are the constant terms in the respective equations.
A { r r , 1 }   ,   A { r t , 1 } , and A { r l , 1 } are the coefficients of the lagged precipitation (R), lagged temperature (T), and lagged lake level (L) terms in the lake level equation.
A{tr,1}, A{tt,1}, and A { t l , 1 }   are the coefficients of the lagged precipitation (R), lagged temperature (T), and lagged lake level (L) terms in the lake level equation.
A{lr,1}, A{lt,1}, and   +   A { l l , 1 }   are the coefficients of the lagged precipitation (R), lagged temperature (T), and lagged lake level (L) terms in the lake level equation.
e { r t }   , e { t t } and e { l t } are the error terms in the respective equations.

2.3. Unit Root Test

Testing for unit roots is a necessary preliminary step to ensure that the variables used in the VAR model are stationary. Stationarity prevents spurious relationships and allows the dynamic interactions among temperature, precipitation, and lake level to be interpreted reliably. Thus, the Augmented Dickey–Fuller (ADF) test is applied to examine the presence of a unit root. Given a time series y t , the ADF model used for this purpose is defined as follows:
Δ y t = μ + a t + δ y t 1 + Σ i = 1 n β Δ y t 1 + e t
The expressions in the equation are as follows:
Δ y t is the first difference of yt ( y t y t 1 );
t is the time or trend variable;
e t is a white noise;
n is the maximum lag length;
μ, δ and β are the parameters to be estimated.
According to the stationarity test hypothesis, if the null hypothesis is not rejected, it is assumed that the series contains a unit root, and the data must be differenced before conducting regression analysis. However, if the null hypothesis is rejected, the series is considered stationary and can be used without differencing.
Because ADF tests can have limited power in short samples and are anchored on a unit-root null (Table 4), we additionally applied the KPSS test, which has the opposite null hypothesis (stationarity), as a complementary check. KPSS results are reported in Table 5 and discussed in Section 2.6. Taken together, the ADF and KPSS evidence supports treating the seasonal series as stationary in levels for VAR estimation.

2.4. Lag Length Selection

Selecting an appropriate lag length is essential for accurately capturing the temporal structure of the system. The AIC provides an optimal balance between model fit and parsimony, ensuring that the VAR model reflects the true dynamics of the hydroclimatic variables. Therefore, in this study, the Akaike Information Criterion (AIC) is employed to determine the optimal lag length (p). The statistical formulation of the AIC is as follows:
A I C ( P ) = In   | Σ ( P ) | + l n T T   p k 2
where Σ = “estimated covariance matrix”; T = “number of observations”; p = “optimal lag length of the VAR model”; k = “Number of the autoregressive parameters estimated in a VAR(p) model”.
After considering VAR models with a specific lag, the AIC indicated that lag 4 was the optimal lag for the analysis.

2.5. Granger Causality Test

The Granger causality test is applied to identify the directional influences among the variables and to determine whether changes in one variable contain useful predictive information about another. Thus, incorporating Granger causality helps clarify the temporal ordering of climate–hydrology interactions and strengthens the interpretation of the VAR model results. Therefore, the Granger causality test, introduced by [34], is employed to assess whether one time series can improve the prediction of another. Specifically, a series X t is considered to Granger-cause Y t if statistical evidence typically obtained through a sequence of F-tests on the lagged values of X t (alongside the lagged values of Y t ) indicates that X t contains significant predictive information regarding the future values of Y t [35].
While the Granger causality framework is frequently used in hydroclimatic time-series analysis to identify directional lead–lag relations, it represents predictive (temporal) causality rather than structural causation. In this study, we interpret Granger causality as evidence that past values of one variable provide incremental information for forecasting another variable, conditional on the variable’s own history and the remaining variables in the VAR system. This interpretation is physically consistent with delayed hydrologic responses of lake levels to climatic forcing and with potential feedbacks within an endorheic basin system.
The Granger causality test:
X t = j = 1 n a i Y t j + i = 1 n β j X t i + j = 1 n γ j Z t k + u 1 t
Y t = i = 1 n λ i Y t i + j = 1 n δ j X t j + k = 1 n ϕ j Z t k + u 2 t
Z t = k = 1 n ψ i Y t k + j = 1 n κ j X t j + i = 1 n θ j Z t i + u 3 t
X t , Y t and Z t represent precipitation, temperature, and lake level at time t, respectively.
X t i , j , and Z t k are the lagged values of precipitation, temperature, and lake level.
a i , β j , γ j , λ i , δ j , ϕ j , ψ i , κ j , and θ j are the regression coefficients for the respective equations.
u 1 t , u 2 t , and u 3 t are the disturbance terms, assumed to be uncorrelated.

2.6. Model Prerequisites and Diagnostics

Unit Root/Stationarity Tests

Table 4 presents the results of the ADF tests. For all variables, the test statistics are more negative than the 5% critical values, and the corresponding p-values confirm statistical significance. These findings indicate that each series is stationary in its level form, allowing the VAR model to be estimated without differencing and ensuring that the dynamic relationships identified in the analysis are not driven by unit-root behavior.
ADF and KPSS provide complementary evidence because they test stationarity from opposite directions: ADF takes a unit root as the null, whereas KPSS takes stationarity as the null. Reading them jointly reduces the risk of test-specific errors and yields a more reliable classification of the stochastic properties of the series.
The KPSS outcomes (Table 5) indicate that most variables are stationary at the 5% level under both the level-stationary and trend-stationary specifications. For instance, Lake Level Gevas remains below the 5% critical values in both versions (KPSS-level = 0.317 < 0.463; KPSS-trend = 0.125 < 0.146). The same pattern holds for Total Precipitation Van Region (0.206 < 0.463; 0.112 < 0.146) and for the temperature series (Average Temperature Van Region: 0.150 < 0.463; 0.019 < 0.146; Average Temperature Ercis: 0.313 < 0.463; 0.019 < 0.146; Average Temperature Muradiye: 0.130 < 0.463; 0.026 < 0.146). This aligns with the ADF results, where the unit-root null is rejected across the same set of variables, implying that the baseline dynamics are not driven by stochastic non-stationarity.
Two precipitation series display a more nuanced structure. Total Precipitation Ercis and Total Precipitation Muradiye reject level stationarity under KPSS but do not reject trend stationarity (Ercis: 0.476 > 0.463 while 0.027 < 0.146; Muradiye: 0.993 > 0.463 while 0.058 < 0.146). This configuration is consistent with a trend-stationary interpretation: fluctuations are mean-reverting once deterministic components are accounted for, rather than following a random walk. In such cases, allowing for deterministic terms (e.g., intercept and/or trend, depending on specification) is sufficient to reconcile the stationarity diagnostics without implying unit-root behavior.
A small subset of variables rejects both level and trend stationarity in KPSS, most notably Lake Level Tatvan (1.650 > 0.463; 0.440 > 0.146) and Total Precipitation Ahlat (0.794 > 0.463; 0.723 > 0.146). These outcomes are plausible in long hydro-climatic series with strong persistence and low-frequency variation, where KPSS is known to be sensitive to structural changes and gradual shifts. Importantly, ADF still rejects the unit-root null for these series in the reported results, so the overall evidence does not point to stochastic unit roots as a dominant feature. Taken together, the ADF–KPSS combination supports a broadly stationary data environment, while also indicating that a limited number of variables may benefit from deterministic controls and robustness checks that accommodate trend-like or low-frequency movements.

2.7. Autocorrelation Diagnostics

The portmanteau (Ljung–Box) tests applied to the equation-specific residuals indicate that the lake-level and precipitation equations do not exhibit significant serial correlation, implying that the corresponding VAR residuals behave as white noise (see Appendix A). The temperatures for all equations show some remaining autocorrelation, which is expected given the strong seasonal structure of monthly temperature data. Overall, the diagnostic results suggest that the selected lag structure adequately captures the main dynamics of the hydroclimatic system, and the presence of mild residual dependence in the temperature equation does not affect the validity of the VAR-based inferences.

3. Results

3.1. Time-Series Overview of Lake Level and Climate Variables

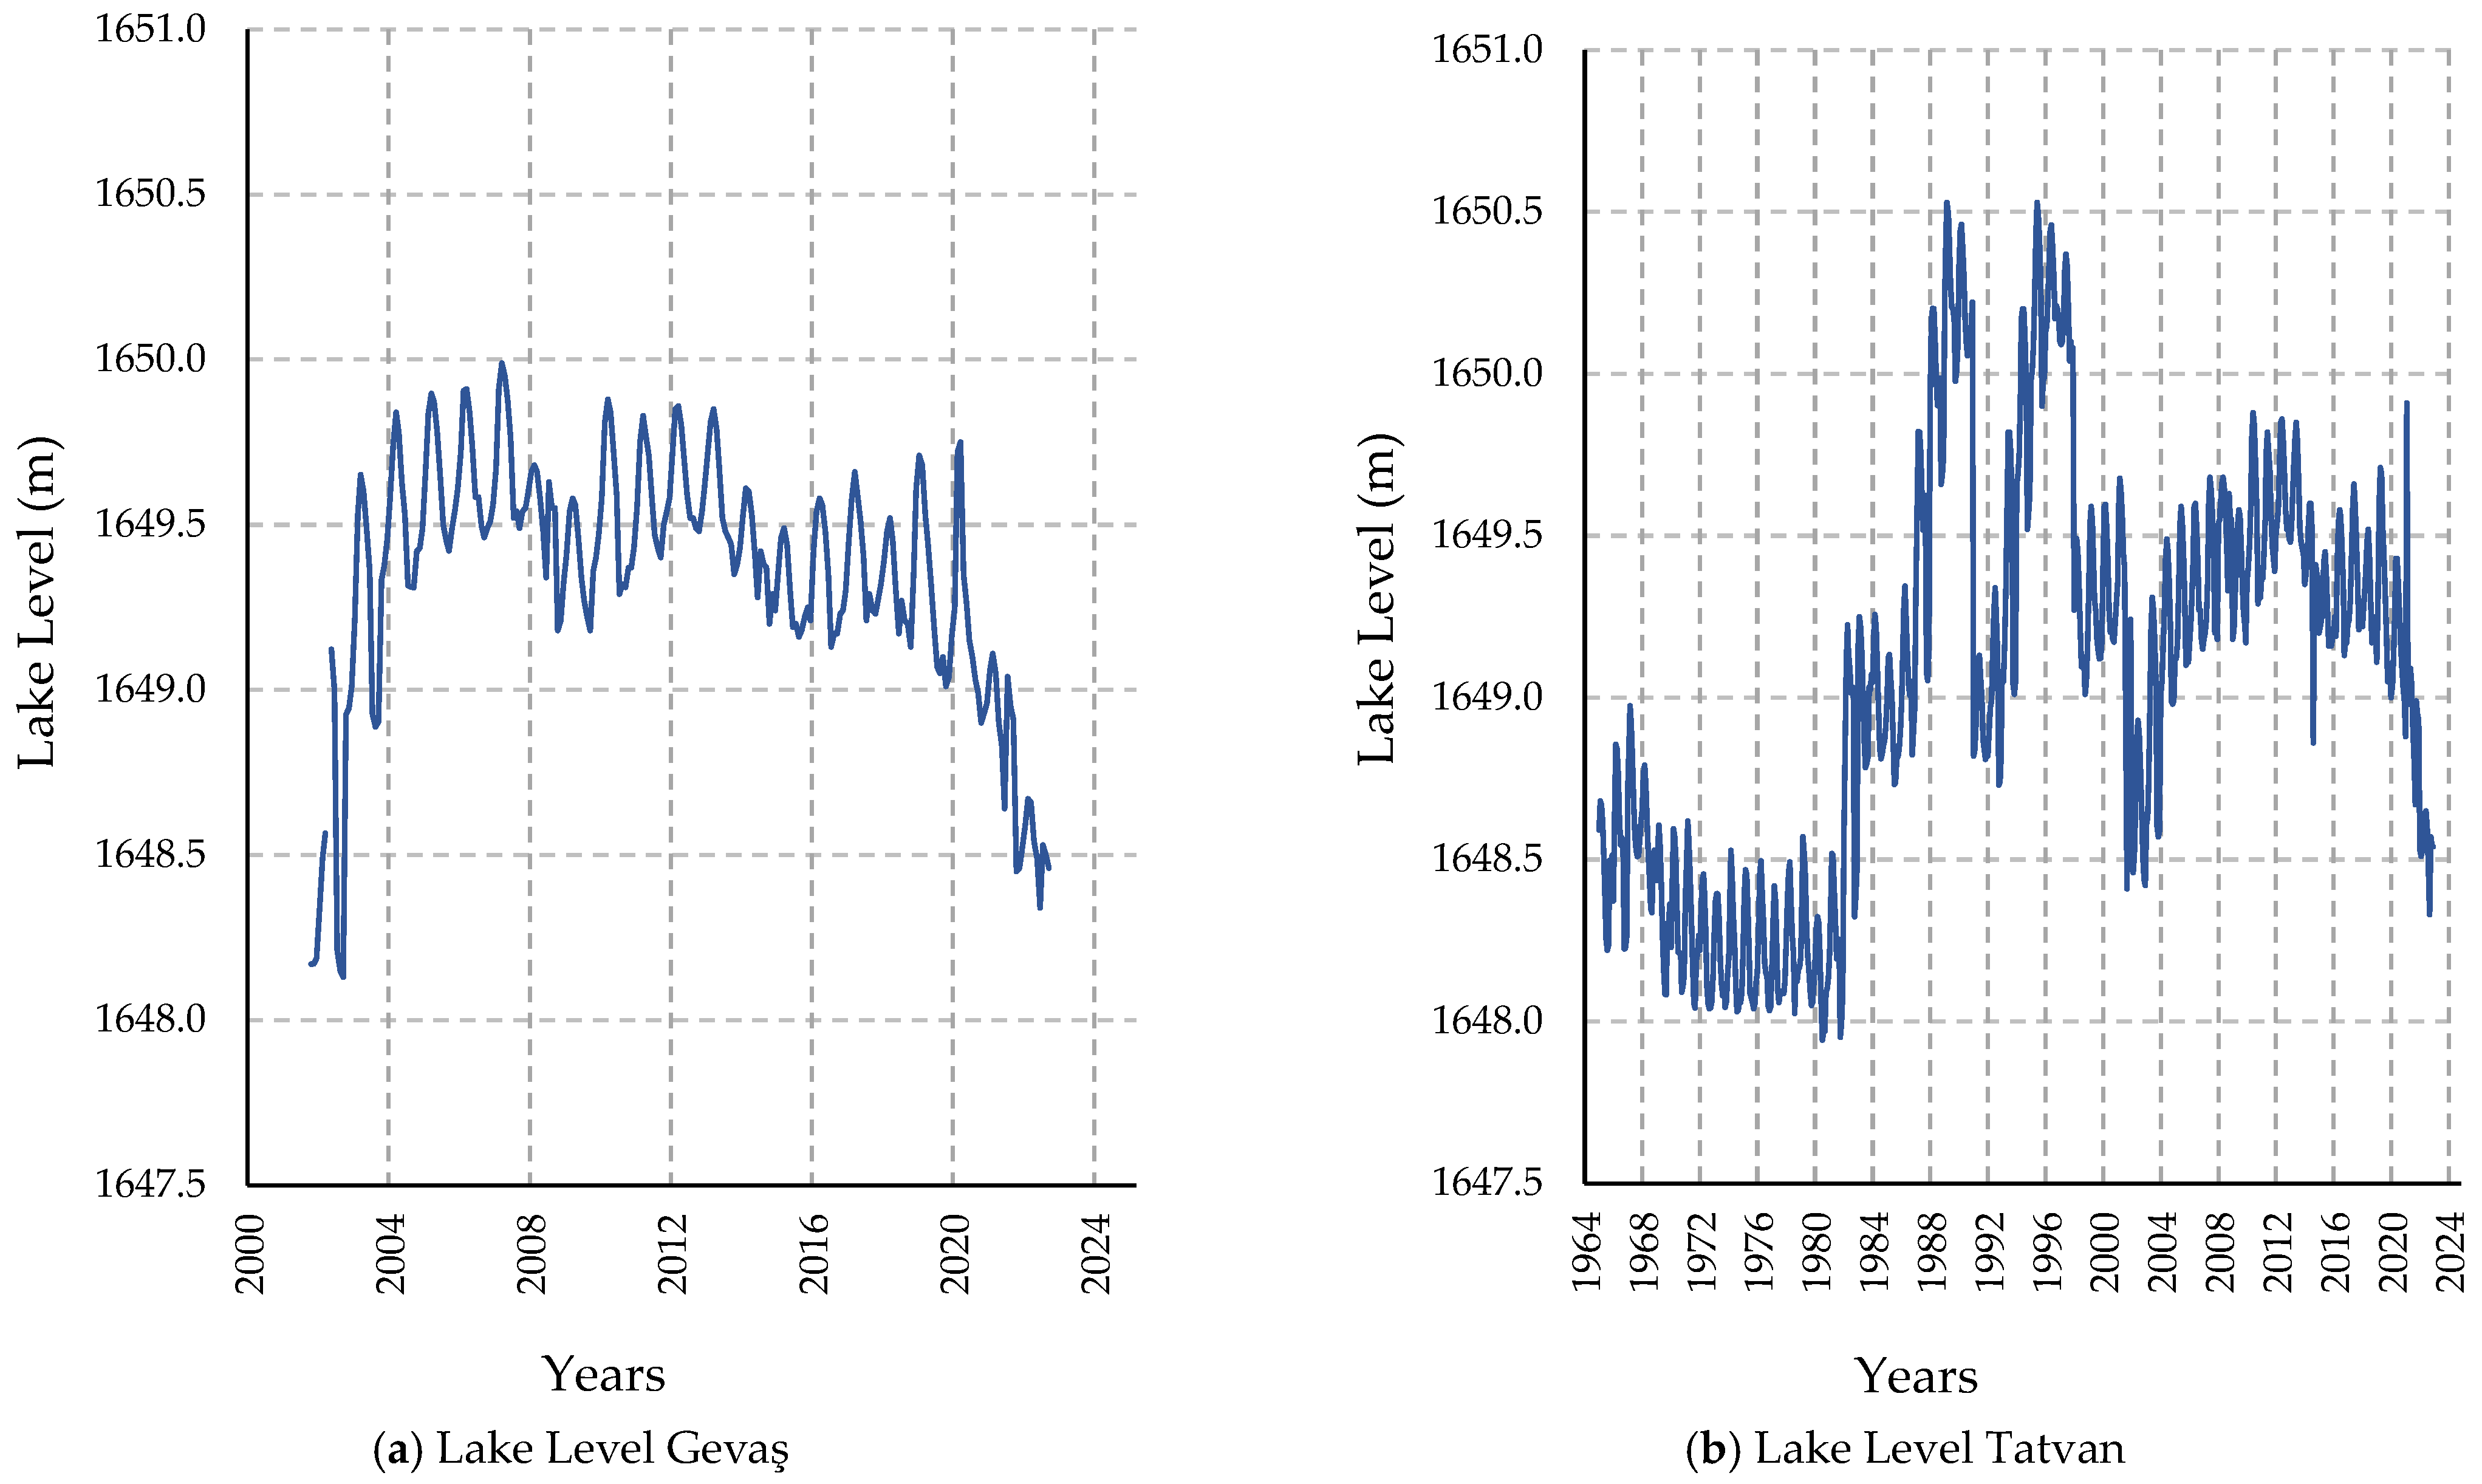
The time series in Figure 3 simultaneously reveal short-run behaviors that differ across stations and a common transition pattern observed in both series around the early 2000s. First, cross-station differences are evident in the coverage period of the series and in their short-run variance structure: because the Tatvan record spans a longer period (1965 to 2022), it reflects the long-run trajectory of lake level and the overall amplitude of seasonal oscillations more consistently, whereas the Gevas record focuses on the 2002 to 2022 period and exhibits sharper, higher-frequency fluctuations, particularly during transition episodes. This pattern is consistent with the notion that, along nearshore sections, hydrodynamic effects such as wind-driven set-up and seiche activity, together with local morphology, can more visibly modulate short-run lake levels. At the same time, the key shared finding across the two series is the emergence of a pronounced decline and heightened fluctuations around the early 2000s, followed by a comparatively stable trajectory within a narrower band. In closed-basin lakes, such a pattern is typically explained by cumulative shifts in water-balance components, including precipitation and runoff conditions governing inflows and temperature-driven evaporative demand governing losses, generating a threshold-like response that can force a faster adjustment in level despite the lake’s large storage capacity. That is, while short-run meteorological volatility is often buffered, periods in which multi-year hydroclimatic conditions shift jointly can produce a more pronounced transitional response in lake level. Accordingly, the synchronous fluctuations observed at both stations around the early 2000s in Figure 3 indicate a lagged yet distinct adjustment response to basin-scale hydroclimatic conditions, whereas cross-station differences in amplitude and roughness are more plausibly attributable to local hydrodynamics and differences in measurement representativeness.
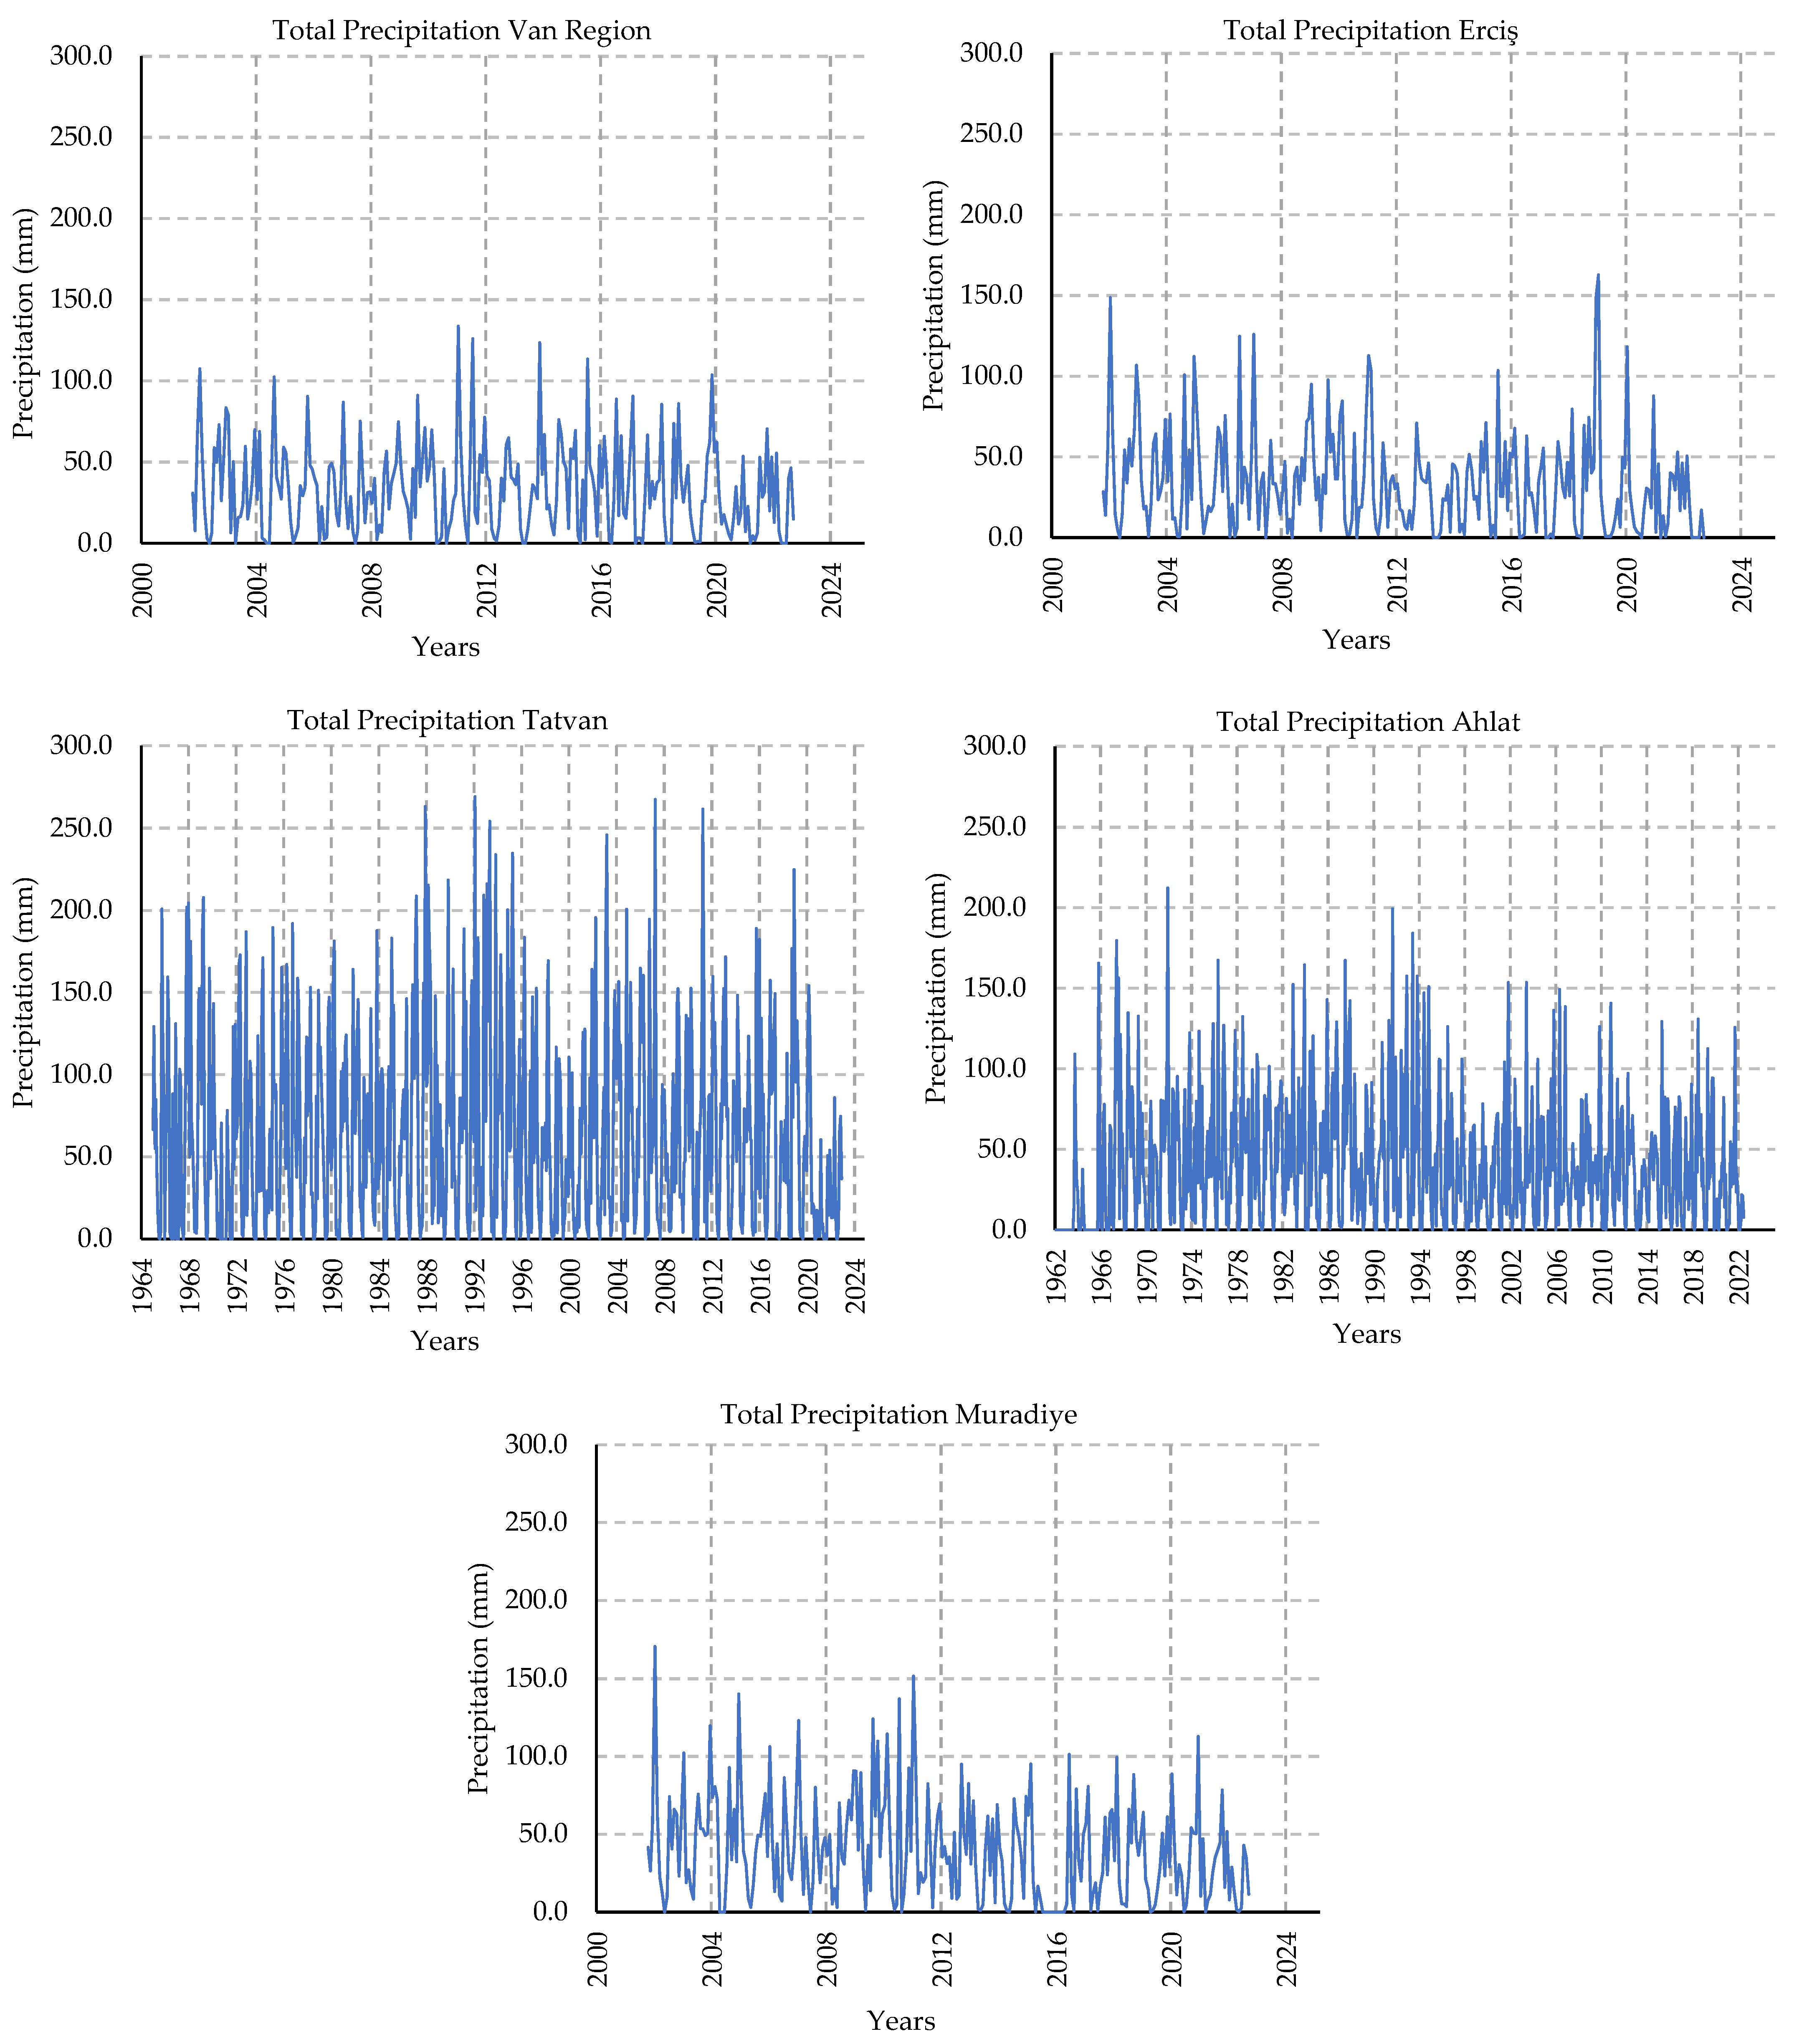
Figure 4 illustrates the temporal variation in the monthly total precipitation in the Van Region, Erciş, Muradiye, Tatvan, and Ahlat. The graph reveals that precipitation in all regions exhibits a clear seasonal pattern. Peaks in precipitation levels are observed during specific months each year, suggesting that, in line with the region’s climatic characteristics, precipitation is predominantly concentrated in the spring and autumn months.
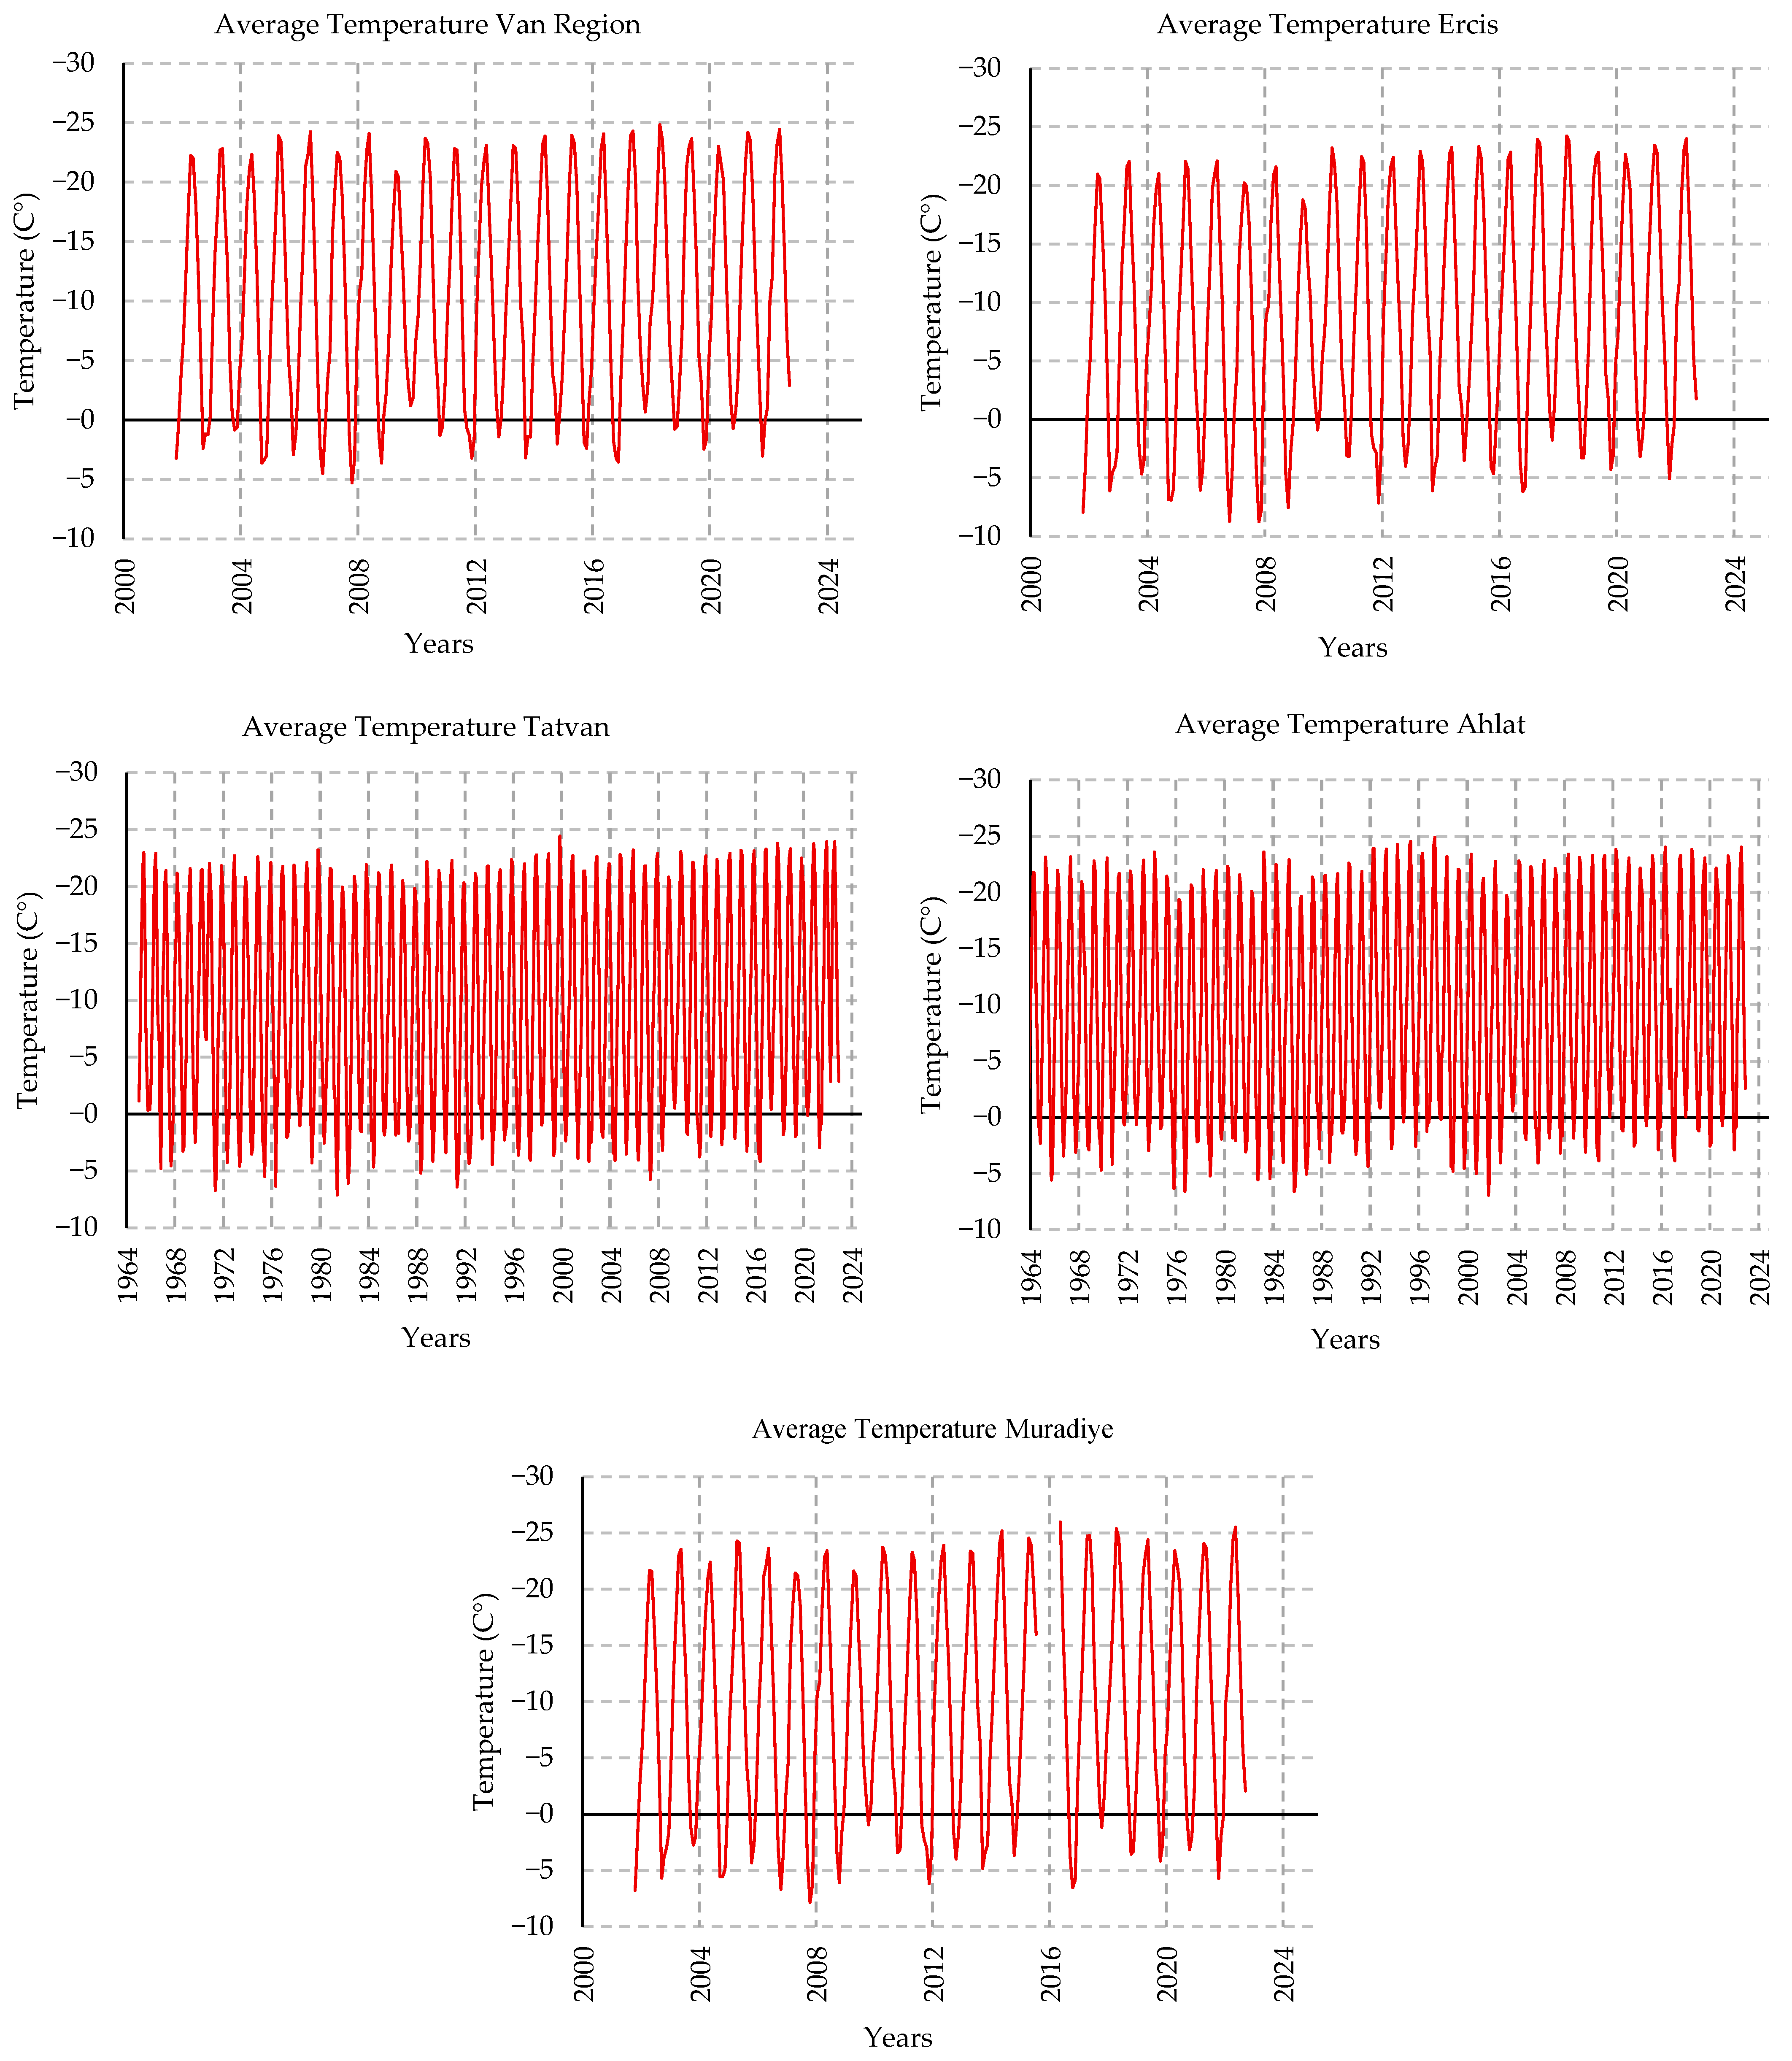
Figure 5 reveals that the average temperature series of the Van region exhibits a strong seasonal pattern. The regularly recurring annual temperature cycle is characterized by high temperatures (20–25 °C) in the summer months and low temperatures (−5–9 °C) in the winter months. Over time, there is no evident upward or downward trend in the overall temperature levels, indicating that the series displays a stationary seasonal structure.

3.2. Results of VAR Analysis

A separate VAR model was estimated for each station in order to account for the pronounced spatial heterogeneity of hydroclimatic conditions within the Lake Van Basin. Precipitation and temperature patterns differ markedly across the northern, southern, eastern, and western subregions due to variations in elevation, topography, and air-mass exposure. Pooling these series into a single multistation model would implicitly impose homogeneity on the lag structure and dynamic responses of the variables, potentially masking location-specific interactions that are essential for understanding the basin’s hydrological behavior. By constructing station-level VAR models, the analysis preserves the unique temporal characteristics and causal pathways of each site, thereby producing more reliable, interpretable, and physically consistent estimates of climate–lake interactions. This modelling strategy is widely recommended in the hydrological time-series literature when spatial variability is non-negligible, as it minimizes aggregation bias and enhances the robustness of the empirical findings.
Consolidated VAR estimates (see Table 6) provide a single framework that reveals the dimensions along which the lake level, precipitation, and temperature interaction converges across stations and where it diverges. Across all specifications, the most consistent determinant in the lake-level equation is the lagged value of lake level itself: the coefficient on the fourth lag of lake level is positive and statistically significant in every station. This finding indicates that Lake Van’s level exhibits pronounced persistence in the short to medium run and that the impact of shocks decays gradually over time. In addition, while precipitation effects at the reported lag are generally weak, the temperature effects on lake level are more visible and station-dependent. Specifically, temperature is statistically significant in the Tatvan-Ahlat specification (temperature (4) = −0.0061, p < 0.05) and is also consistently significant across the Gevas-based specifications at the reported lag (Gevas-Van: −0.0105, p < 0.01; Gevas-Ercis: −0.00849, p < 0.01; Gevas-Muradiye: −0.00837, p < 0.01). Because the coefficients reported in the consolidated table correspond to a specific lag, an insignificant coefficient should not be interpreted as the absence of relationships at all lags; rather, it should be read as indicating that the relevant effect may emerge at other lags or through the joint effect of multiple lags.
A station-based comparison shows that the Tatvan-focused specifications (Tatvan-Tatvan and Tatvan-Ahlat) stand out as structures in which lake-level persistence is most pronounced. In both Tatvan models, lake-level dynamics are strongly carried by their own lags, while the direct effects of meteorological variables on lake level appear limited at the reported lag order. Nevertheless, in the precipitation and temperature equations, the Tatvan-based models indicate that the meteorological variables’ own dynamics (in particular, the lagged components of temperature) are significant, and that some cross-effects (precipitation-temperature interactions) can arise for specific station pairs. This pattern implies that meteorological series are strongly driven by seasonality and atmospheric regimes at the station scale, whereas lake level exhibits a more integrated and lagged response structure.
When the three Gevas-based specifications (Gevas-Van Regional, Gevas-Ercis, Gevas-Muradiye) are assessed jointly, lake-level persistence is preserved across all models and remains quantitatively strong: the fourth lag of lake level is positive and highly significant in the lake-level equation in each Gevas-based specification (Gevas-Van: 0.3648, p < 0.01; Gevas-Ercis: 0.3685, p < 0.01; Gevas-Muradiye: 0.3598, p < 0.01). In the same equation, precipitation at the reported lag is not statistically significant across the three Gevas-based models, whereas temperature at the reported lag is consistently negative and statistically significant. This pattern implies that, over the 2002 to 2022 sample, short-run lake-level variation is dominated by internal persistence and a temperature-linked adjustment at the reported lag, while precipitation effects at that single lag are less directly visible.
Cross-station heterogeneity is more pronounced in the meteorological equations. In the precipitation equations, evidence for persistence at the reported lag is not uniform across stations: precipitation’s own fourth lag is weakly significant only in the Gevas-Van Regional specification (precipitation (4) = −0.1177, p < 0.10), while it is not significant in the Gevas-Ercis and Gevas-Muradiye specifications. In the temperature equations, by contrast, the fourth lag of temperature is negative and highly significant across all Gevas-based models (temperature (4) = −0.3904 to −0.4156, p < 0.01), indicating a similar temporal dependence structure in temperature across stations. This divergence is consistent with precipitation being more sensitive to local factors and measurement representativeness, whereas temperature moves more synchronously with broader atmospheric conditions.
The differentiation of climate–hydrology correlations between stations across the basin is consistent with the topography differentiating the spatial distribution of precipitation and hydrological transmission and storage processes in different sub-basins. The Lake Van Closed Basin has a distinct elevation range (approximately 1600 to 3500 m), and this orographic structure reflects the heterogeneity of the precipitation regime even in station averages (e.g., Tatvan monthly average precipitation ≈ 64.7 mm, Van Region ≈ 32.3 mm, Ercis ≈ 32.2 mm, Muradiye ≈ 39.6 mm). This spatial difference is also reflected in the dynamic results: in the Tatvan-Ahlat specification, temperature predicts lake level at the reported lag (temperature (4) = −0.0061, p < 0.05), while precipitation does not significantly predict lake level at that lag. In contrast, for the Gevas-based north and east specifications (Van Regional, Ercis, Muradiye), precipitation does not significantly predict lake level at the reported lag, whereas temperature does so consistently with a negative sign (approximately −0.008 to −0.011, p < 0.01). This pattern supports the interpretation that lake level is shaped not by precipitation signals from a single station at a single lag, but rather by basin-scale integrated processes governed by topography, storage (including snow accumulation and groundwater recharge), and closed-basin water budget integration. Consistently, the positive and highly significant lagged lake level coefficient in the lake level equations across all specifications (0.2595 to 0.3685, p < 0.01) supports the idea that lake level exhibits a distinct buffering character and that the response to climate inputs emerges through a lagged adaptation process modulated by basin structure.
That precipitation contributes to lake-level fluctuations with a measurable lag stems from the fact that closed-basin hydrology does not translate water inputs into an instantaneous level response. The precipitation signal is first retained within the basin and partitioned into infiltration and surface-runoff components; it is then conveyed to the lake through the drainage network and or groundwater recharge, ultimately entering the lake’s volume and level balance. These processes (particularly in semi-arid closed basins) generate temporal dispersion due to intermediate reservoirs such as soil moisture and groundwater storage, producing a gradual adjustment in lake level rather than an immediate short-run jump. Moreover, the lake’s large volume and the basin’s storage capacity can strengthen the system’s buffering character in response to meteorological inputs, thereby delaying the transmission of the climate signal to lake level. In this context, the fact that the effect of precipitation on lake level appears statistically weak at the single reported lag in the Gevas-based specifications points to the role of lag dispersion and basin integration, rather than implying that precipitation is irrelevant for lake dynamics.
Overall, the consolidated results indicate that (i) lake level possesses a strong internal dynamic and persistence component, (ii) capturing the effect of meteorological variables on lake level directly at a single lag may not be feasible for every station, and (iii) the relationships among meteorological variables (precipitation-temperature) may exhibit cross-station heterogeneity. Within this framework, seemingly weak linkages can be explained not by the absence of a relationship, but by processes such as scale mismatch (station measurement versus basin integral), storage and buffering mechanisms, and differences in the lag structure through which effects materialize.
The unique contribution of this study is to numerically reveal both common dynamics and spatial divergence by reporting multi-station data from the Lake Van Basin in a single consolidated framework under a 4-month lag structure selected with AIC (Table 6). In the lake level equations, the fourth lag of lake level ranges from 0.2595 to 0.3685 and is significant across all station pairings (p < 0.01), indicating substantial inertia and memory in the lake level. In contrast, the most consistent pattern in the meteorological equations is the internal dynamics of the temperature series: the fourth lag of temperature is statistically significant across stations, with coefficients spanning from −0.3446 (Tatvan-Tatvan) to around −0.3904 to −0.4156 in the Gevas-based temperature equations (p < 0.01), which provides a quantitative indicator of strong seasonality-based continuity across the basin. Inter-station heterogeneity is particularly evident in cross-effects and precipitation persistence: precipitation’s own fourth lag is significant in Tatvan-Tatvan (−0.0860, p < 0.05) and is weakly significant in Gevas-Van (−0.1177, p < 0.10), whereas it is not significant in the Gevas-Ercis and Gevas-Muradiye precipitation equations. Likewise, a precipitation-temperature linkage is statistically visible in the Tatvan-Tatvan precipitation equation (temperature (4) = −0.0031, p < 0.05). These quantitative thresholds indicate that lake level in a closed basin carries strong internal dynamics as a basin-integrated state variable, while the interrelationships among meteorological variables and their persistence can vary with station representativeness and topographic controls.
A spatial synthesis across stations indicates that hydroclimatic patterns cluster by physiographic setting. Inland stations located farther from the shoreline (Erciş and Muradiye) exhibit more similar precipitation and temperature regimes, whereas near-shore stations (Tatvan, Gevaş, and Ahlat) show broadly comparable climatic trends (Figure 4 and Figure 5). This grouping is partly reflected in the dynamic results: the lagged effects and the coupling between meteorological variables appear more consistent across the inland pair (Erciş–Muradiye), while near-shore stations display greater heterogeneity in the estimated linkages (Table 6).
Notably, despite both being near the lake, Tatvan and Ahlat yield different inference, suggesting that their approximately 70 m elevation difference may contribute to locally distinct climate–hydrology responses (Table 6). Finally, the Gevaş–Van Region specification should be interpreted with caution in strict cross-model comparisons because the lake-level series is measured at Gevaş and the Van Region station is located about 100 km away. Nevertheless, the temperature-precipitation relationship in the Van Region differs from the inland stations, plausibly reflecting its more southerly position and proximity to the lake (Table 6).

3.3. Results of Granger Causality Tests

The Granger causality test is applied to identify the directional predictive relationships among precipitation, temperature, and lake level in the Lake Van Basin. Thus, the approach determined whether past values of one variable contain statistically significant information that helps forecast another, thereby clarifying the temporal ordering of climate–hydrology interactions within the VAR framework.
The Granger causality tests reported in Table 7, Table 8, Table 9, Table 10 and Table 11 summarize directional predictive linkages among variables by testing the joint significance of lagged terms, rather than focusing on the sign and magnitude of VAR coefficients at individual lags. A comparative reading across stations indicates that linkages between meteorological variables are more consistent than those between lake level and meteorological variables. Indeed, across all station specifications, a strong Granger relationship is observed from mean temperature to total precipitation (p < 0.01), and the relationship from total precipitation to mean temperature is also significant in all stations (at least p < 0.05). This bidirectional pattern suggests that temperature and precipitation series are jointly driven by seasonality and large-scale atmospheric regimes; thus, Granger “causality” here should be interpreted not as a claim of physical causation, but as evidence that the lagged information in the series mutually carries predictive power.
For lake level, the results show that the predictive influence of meteorological variables on lake level is heterogeneous across stations, but is not uniformly weak in the Gevas-based models. In the Tatvan-Tatvan specification, both precipitation and temperature significantly predict lake level (p < 0.01). In the Tatvan-Ahlat specification, temperature significantly predicts lake level (p = 0.000), whereas precipitation does not (p = 0.490). The Granger results indicate that, in the Gevas-based specifications, meteorological variables also have statistically significant predictive content for lake level. Specifically, for Gevas-Van Regional, both precipitation (p = 0.013) and temperature (p = 0.000) Granger-cause lake level; similarly, for Gevas-Ercis, precipitation (p = 0.008) and temperature (p = 0.000) significantly predict lake level; and for Gevas-Muradiye, precipitation (p = 0.015) and temperature (p = 0.000) also predict lake level. This pattern suggests that, at the system level, climate variables contain meaningful lagged information for lake-level movements even in the north, northeast, and south-southeastern sectors, although the strength and manifestation of these linkages may still vary by station pairing and by how well a given station represents basin-scale water-balance conditions.
When these findings are jointly interpreted in terms of basin sectors, the predictive linkages from climatic variables to lake level appear most pronounced and consistently significant in both the western-northwestern sector (Tatvan-Tatvan: p < 0.01 for both climate variables; Tatvan-Ahlat: p = 0.000 for temperature and p = 0.490 for precipitation) and, according to the estimates, also in the Gevas-based sectors. In the south-southeastern (Gevas/Van), northern (Ercis), and northeastern (Muradiye) specifications, precipitation and temperature now show statistically significant Granger predictability for lake level (p values reported above), while the relationship between the meteorological variables remains robust across all sectors.
Relationships from lake level to meteorological variables are generally limited, especially for precipitation. Lake level does not predict precipitation in the Gevas-Van Regional, Gevas-Ercis, or Gevas-Muradiye models (p = 0.886, p = 0.982, and p = 0.308, respectively). For temperature, lake level predicting temperature is statistically visible in the Tatvan-Ahlat specification (p = 0.011), whereas it is not statistically significant in Gevas-Van Regional (p = 0.295). In the Gevas-Ercis and Gevas-Muradiye temperature equations, joint significance can arise when lagged meteorological terms are considered together, yet individual lake-level terms remain statistically weak, implying that apparent feedback from lake level to temperature is not systematic across stations and should be interpreted cautiously. Although such findings may be viewed as potential signals of lake-atmosphere interaction, the nature of Granger tests requires that results not be interpreted as direct physical causality; instead, they should be treated within the framework of seasonality-driven co-movement, common climatic drivers, and scale differences.
In sum, the main contribution of Table 7, Table 8, Table 9, Table 10 and Table 11 is to show that predictive relationships among meteorological variables are strong and consistent across stations, and that meteorological variables also exhibit statistically significant predictive content for lake level in multiple station pairings, including the Gevas-based specifications. At the same time, feedback from lake level to meteorological variables, particularly to precipitation, is generally not supported, reinforcing the interpretation that lake level primarily reflects a basin-integrated response to climate forcing rather than acting as a driver of station-level meteorological dynamics.
In this study, defining temperature as the “primary regulator of hydroclimatic variability” is grounded in three complementary strands of evidence. First, the Granger-causality findings indicate that temperature carries highly consistent predictive power over precipitation dynamics across stations: in all five station-specific VAR specifications examined, tests of temperature predicting precipitation are significant at the 1% level (p < 0.01). By contrast, while the relationship whereby precipitation predicts temperature is also observed across specifications, it emerges at comparatively weaker significance thresholds, typically holding at least at conventional levels (often p ≤ 0.05). This asymmetry suggests that temperature contains relatively stronger information content within the hydroclimatic system and that a substantial share of precipitation variability is transmitted through common atmospheric regimes and seasonality that co-move with temperature. Second, although climate-lake-level linkages are heterogeneous across stations, the evidence indicates that temperature’s predictive content for lake level is not confined to a single station pair. In the Tatvan-based setting, temperature predicts lake level in the Tatvan-Ahlat specification (p = 0.000), while in the Gevas-based specifications, both temperature and precipitation significantly predict lake level (Gevas-Van: p = 0.000 for temperature and p = 0.013 for precipitation; Gevas-Ercis: p = 0.000 for temperature and p = 0.008 for precipitation; Gevas-Muradiye: p = 0.000 for temperature and p = 0.015 for precipitation). Third, because evaporation often constitutes the dominant component of water loss in closed-basin lakes, temperature under semi-arid conditions can act as a strong proxy for evaporative demand, thereby governing the lake’s lagged and buffered response. Indeed, the fact that the fourth lag of lake level is strong and significant in all models (with coefficients ranging from 0.2595 to 0.3685 and p < 0.01 across all station specifications, Table 7) indicates pronounced inertia and buffering in the system; this, in turn, supports an interpretation more consistent with temperature shaping the water balance cumulatively via evaporative demand rather than with a direct and instantaneous translation of meteorological effects into lake-level changes.
When the VAR and Granger-causality results are considered jointly, temperature is found to carry stronger and more consistent predictive information for short-run precipitation dynamics. In Table 7, Table 8, Table 9, Table 10 and Table 11, the Granger tests for temperature predicting precipitation are significant at high levels across all station specifications (p < 0.01), indicating that temperature provides a dominant climatic signal in accounting for short-term movements in the precipitation series. By contrast, while precipitation predicting temperature is also statistically supported across specifications, it generally appears at comparatively weaker thresholds than the temperature-to-precipitation direction. This finding provides threshold-based quantitative evidence for the decisive role of temperature in short-run precipitation dynamics. The VAR coefficient estimates (Table 7) are consistent with this conclusion; in particular, the statistical significance of lagged temperature terms in the precipitation equation in certain station-specific models indicates that the lagged influence of temperature on precipitation can be directly captured within the model (for example, in Tatvan-Tatvan, temperature in the precipitation equation is significant; Table 7).
With respect to lake level, the lagged response finding is inferred from two complementary indicators. First, in the lake-level equations, the fourth lag of lake level is positive and strongly significant across all specifications (0.2595–0.3685, p < 0.01), demonstrating pronounced persistence and implying that the response to climatic inputs unfolds over time through a distributed dynamic adjustment. Second, predictive linkages from meteorological variables to lake level are present across multiple station pairings in the Granger results. While Tatvan-Tatvan shows that both precipitation and temperature predict lake level at p < 0.01 (Table 7, Table 8, Table 9, Table 10 and Table 11), the Gevas-based specifications also indicate statistically significant climate-to-lake-level predictability, with both precipitation and temperature Granger-causing lake level in Gevas-Van (p = 0.013 and p = 0.000), Gevas-Ercis (p = 0.008 and p = 0.000), and Gevas-Muradiye (p = 0.015 and p = 0.000). These results suggest that the lake level’s response to meteorological conditions is not direct and instantaneous; rather, it materializes in a cumulative and lagged manner within the lag horizon employed in the VAR and is reinforced by the lake’s strong internal persistence. Accordingly, while temperature’s role in short-run precipitation dynamics is consistently visible in the Granger results at a high significance threshold, the lagged response in lake level is supported through both the strong persistence parameter and the statistically significant predictive content of climate variables for lake level across key station pairings.
The identified lag structures and causal directions are generally consistent with previous research conducted in the Lake Van Basin and other semi-arid lake systems. In [14] reported that evaporation-driven fluctuations dominate the recent lake-level decline in the region, which supports the present findings that temperature acts as a leading variable in the system. Likewise, in [26], the authors described the high climatic sensitivity of Lake Van’s water balance, consistent with the observed temperature–precipitation coupling found in this study. These consistencies strengthen the reliability of the current results and demonstrate agreement with both local and regional hydroclimatic assessments.
The consistency between the VAR model coefficients and the Granger causality directions confirms that the dynamic interactions are robust. For example, where the VAR model showed a positive lagged coefficient between temperature and precipitation, the Granger test also indicated that temperature “Granger-causes” precipitation at a statistically significant level. Similarly, in stations where the VAR model revealed a negative lagged influence of temperature on lake level, the Granger test supported the same directional causality. This convergence of evidence between the two analytical approaches enhances confidence in the temporal and physical coherence of the identified relationships.

3.4. Seasonal Stratification of Hydrological and Climatic Variables

To account for potential seasonal effects in hydrological and climatic dynamics, the analysis adopts a seasonal stratification approach. The monthly observations are grouped into four meteorological seasons, and seasonal mean values are computed for lake level, total precipitation, and average temperature. This approach allows for a clearer assessment of intra-annual variability and reduces short-term fluctuations that may obscure underlying seasonal patterns. By examining seasonal averages, this aims to provide a more interpretable comparison of hydrological responses to climatic conditions across different periods of the year.
Across seasons (Table 12, Table 13, Table 14 and Table 15), the consolidated VAR coefficients point to strong lake-level inertia, with precipitation and temperature effects that are clearly seasonal and location-specific. In autumn, the Gevas-based systems display the tightest cross-variable coupling. In Gevas Van (p = 4), lake level shows pronounced mean reversion at the selected lag (Lake (p = 4) = −0.3607), while temperature enters positively (1.1971) and precipitation negatively (−23.4886). At the same time, precipitation is strongly mean-reverting (Rain (p = 4) = −1.1339) and increases with both lake level (0.0065) and temperature (0.0552). In Gevas Ercis (p = 4), lake level again mean-reverts (Lake (p = 4) = −0.2657) and reacts strongly to precipitation (−31.9045) and temperature (2.4634), while precipitation remains strongly mean-reverting (Rain (p = 4) = −1.1033) and rises with lake level (0.0047) and temperature (0.0454). In Gevas Muradiye (p = 4), lake level also mean-reverts (Lake (p = 4) = −0.3694), and the temperature block shows a negative persistence term (Temp (p = 4) = −0.6279) alongside a positive lake-to-temperature channel (Lake (p = 4) = 0.0689). Overall, autumn implies a fast-adjusting lake system with large, statistically meaningful hydro-climatic transmission, especially for the Gevas Van and Gevas Ercis specifications.
By contrast, winter and spring emphasize persistence and more selective transmission channels. In winter Gevas Van (p = 4), lake level is strongly persistent (Lake (p = 4) = 0.5049) and increases with precipitation (Rain (p = 4) = 0.0131), whereas temperature reduces lake level sharply (Temp (p = 4) = −0.1564). Winter precipitation dynamics also reflect strong feedback, with Lake (p = 4) = −37.8125 and Temp (p = 4) = 9.5989 in the precipitation equation. In winter Tatvan Tatvan (p = 2), precipitation contributes positively to lake level at lag 2 (Rain(t-2) = 0.0042), while temperature effects on lake level are comparatively weak. In winter Tatvan Ahlat (p = 1), lake level remains highly inertial (Lake(t-1) = 0.8078) and precipitation is largely self-driven (Rain(t-1) = 0.3749). In spring, persistence still dominates: spring Tatvan Tatvan (p = 1) yields Lake(t-1) = 0.8010 with a positive precipitation effect (Rain(t-1) = 0.0030), and spring Tatvan Ahlat (p = 1) similarly gives Lake(t-1) = 0.7987. For the Gevas block, spring Gevas Van (p = 4) again shows strong mean reversion (Lake (p = 4) = −0.6457) together with a negative precipitation effect on lake level (Rain (p = 4) = −0.0133) and a strong lake-to-precipitation channel (Lake (p = 4) = 116.6333 in the precipitation equation). Finally, using the more stable spring Gevas Muradiye (p = 1) specification, lake level is strongly persistent (Lake(t-1) = 0.5909), precipitation raises lake level (Rain(t-1) = 0.00648), and temperature lowers it (Temp(t-1) = −0.0719). In sum, the coefficients suggest that autumn concentrates the strongest lake-climate interactions, whereas winter and spring are dominated by inertia with fewer, but still meaningful, transmission paths.
Overall, the season-by-season estimates indicate that both lag structures and predictive hydroclimatic linkages vary systematically across the year, implying that a single non-seasonal specification would mask important intra-annual heterogeneity. This seasonal stratification therefore provides a statistically transparent and physically plausible basis for treating seasonality explicitly in the VAR–Granger framework.

4. Discussion

Results from the VAR and Granger causality analyses indicate that the hydroclimatic dynamics of the Lake Van Basin are characterized by strong temperature–precipitation interactions rather than a direct precipitation–lake-level coupling. Temperature was frequently identified as a leading variable in the statistical relationship with precipitation across most stations; however, this pattern reflects climate-driven co-variability rather than a direct physical control. In the semi-arid continental climate of the basin, increased temperature is associated with enhanced evapotranspiration and modifications in atmospheric circulation, which together influence effective precipitation and contribute to hydrological imbalance.
Granger causality tests indicate the presence of a statistical lead–lag relationship and contemporaneous co-variability between temperature and precipitation at the monthly scale. This finding should not be interpreted as evidence of physical causality; rather, it reflects the statistical imprint of seasonal energy balance and large-scale atmospheric circulation processes that simultaneously influence both variables. Accordingly, the results of this study do not suggest that temperature determines precipitation. Instead, they indicate that temperature and precipitation co-vary within the framework of regional climate dynamics, including seasonal radiation balance, cloud cover, and large-scale atmospheric circulation systems.
Lake-level changes, although moderate in amplitude (on the order of 2–3 m), were shown to respond to climatic forcing through delayed feedback. The observed lag of approximately one to two months between precipitation and lake-level rise, together with the negative response to temperature, underscores the central role of evaporation and delayed inflow in controlling the lake’s water balance. Such lagged hydrological responses are typical of closed-basin systems where storage adjustments occur gradually and are highly sensitive to thermal conditions.
Spatially, the basin exhibits clear climatic heterogeneity. The western sectors, represented by Tatvan and Ahlat, reveal a stronger lake-level sensitivity to temperature variations, suggesting greater exposure to evaporation-driven processes. Conversely, the northern and eastern stations (Erciş and Muradiye) display more pronounced temperature–precipitation coupling, likely reflecting orographic effects and differential air-mass exposure. These spatial contrasts indicate that basin topography modulates local hydroclimatic behavior and must be considered when assessing regional water balance.
These patterns are consistent with broader findings from other closed and semi-closed basins in the region. Studies on Lake Van’s hydrochemical evolution confirm distinct sub-basin climatic contrasts similar to those observed here [36]. In ref. [13] also demonstrated that Lake Van’s water balance is increasingly sensitive to temperature variability, emphasizing the dominant role of thermal forcing in recent decades. Comparable results were reported for neighbouring systems such as Lake Urmia, where temperature fluctuations were shown to control hydro-meteorological feedback [37]. Similarly, [38] applied a VAR framework to the Salt Lake Basin in Iran and confirmed that evaporation exhibits a lagged dependence on temperature, reinforcing the robustness of the causal mechanism identified in the present study. Comparable hydroclimatic patterns have been reported for other large endorheic lake systems. In particular, recent studies on the Aral Sea demonstrate that lake-level and surface-area variations are strongly governed by temperature-driven evaporation, whereas the contribution of precipitation is spatially heterogeneous and often delayed [39,40]. These findings emphasize the dominant role of thermal processes in controlling water balance dynamics in closed-basin environments. In this context, the temperature dominance and lagged hydrological responses identified for Lake Van are consistent with those observed in similar endorheic systems across Central Asia, pointing to common hydroclimatic control mechanisms in semi-arid continental basins.
In this study, evaporation was not included as an explicit variable in the VAR analysis due to the limited availability of long-term and spatially continuous evaporation observations. However, in closed-basin systems such as Lake Van, evaporation is widely recognized as the dominant control on lake-level variability. Previous studies have shown that evaporation over Lake Van is primarily governed by temperature-driven net radiation and heat storage processes, with annual evaporation rates exceeding 1400 mm [41]. Accordingly, the negative relationship observed between temperature and lake level in this study is physically consistent with an evaporation-controlled water balance. In this context, temperature should be interpreted as a proxy variable representing evaporation-related processes rather than implying a direct causal mechanism.
Overall, the results of this research demonstrate that the hydroclimatic regime of the Lake Van Basin is governed by temperature-driven feedbacks with clear spatial and temporal variability. As regional warming continues, the evaporation–precipitation imbalance is expected to intensify, amplifying the vulnerability of this endorheic system to hydrological stress. Therefore, incorporating temperature-dependent parameters into water balance modeling and climate adaptation strategies is essential for sustainable lake management in semi-arid, closed-basin environments.
The methodological novelty of this study lies in the comparative application of station-level VAR models to investigate the dynamic interactions among temperature, precipitation, and lake level. Rather than relying on basin-averaged relationships, this approach enables the identification of spatial heterogeneity in hydroclimatic linkages within a single endorheic basin. The observed station-dependent differences in dominant drivers and lagged responses demonstrate that hydrological behavior in closed basin systems is inherently non-uniform. In this respect, the proposed framework offers a transferable and data-efficient methodology that can be applied to other endorheic basins with similar climatic and hydrological characteristics, particularly in regions where long-term observations are available but integrated process-based modeling is limited.
The VAR-based analysis provides important implications for water management and climate adaptation in the Lake Van Basin. The identification of statistically significant lead–lag relationships highlight that hydroclimatic responses in this closed basin system are not instantaneous but occur with measurable delays. In particular, the delayed response of lake level to precipitation and its strong sensitivity to temperature-driven evaporation suggest that monitoring and management strategies should account for thermal stress and lagged hydrological feedback. These findings support the use of temperature and precipitation as early indicators for anticipating lake-level changes, which may contribute to improved early-warning systems and more adaptive water management planning under ongoing climate change.
In this context, the conceptual contribution of the study is to demonstrate that lake level variations cannot be explained by a single “general” climate dynamic; rather, they exhibit different dominant drivers and distinct response lags depending on the season and the station. The seasonal Granger causality results indicate that in some periods precipitation affects lake levels with shorter lags, whereas in other periods temperature-related processes (such as increased evaporation and the timing of snowmelt) become more influential. This differentiation strengthens the rationale for adaptive strategies in sustainable water management such as season-specific operating rules, early warning thresholds, and demand management (particularly irrigation planning and drought preparedness) instead of a “one-size-fits-all” operational approach.
This study is subject to several methodological limitations that should be considered when interpreting the results. First, the VAR and Granger causality analyses identify statistical dependencies and lead–lag relationships rather than direct physical causality. The analyses were conducted at a monthly temporal scale, and the effects of seasonality and large-scale atmospheric processes were therefore addressed indirectly. In addition, key hydroclimatic variables such as evaporation, wind speed, and humidity could not be explicitly included in the models due to data limitations. While the station-level approach enables the exploration of spatial heterogeneity, caution is required when extrapolating the findings to the entire basin. Despite these limitations, the adopted framework provides a coherent and data-efficient approach for examining the temporal and spatial structure of hydroclimatic interactions in endorheic lake systems.
The findings of this study suggest that water management and climate adaptation policies in the Lake Van Basin should explicitly account for temperature-driven risks and delayed hydrological responses. In particular, the strong sensitivity of evaporation to increasing temperature and the lagged response of lake level to precipitation highlight the importance of anticipatory rather than purely reactive management approaches. In this context, the integrated consideration of lake level observations together with temperature and precipitation variability may support improved monitoring and early warning efforts. In Türkiye, the production and monitoring of lake level, temperature, and precipitation data by the State Hydraulic Works and the Turkish State Meteorological Service provide an institutional data framework that facilitates such integrated assessments. From a sustainability perspective, recognizing temperature-driven and lagged hydrological responses is critical for developing adaptive lake management strategies in closed-basin systems under ongoing climate change.

5. Conclusions

This study quantified the dynamic relationships between temperature, precipitation, and lake-level variations in the Lake Van Basin using a multistation Vector Autoregressive (VAR) and Granger causality framework. Results reveal that temperature plays the dominant role in controlling hydroclimatic variability, driving both precipitation anomalies and delayed lake-level responses through evaporation-induced feedbacks. The one- to two-month lag between precipitation and lake-level change emphasizes the basin’s limited buffering capacity and the thermal sensitivity of its endorheic hydrological system.
In quantitative terms, the estimated VAR coefficients demonstrate that temperature accounts for a substantial share of short-term hydroclimatic variability in the basin. Across stations, temperature shocks explain approximately 35–50% of the forecast variance in precipitation within a two- to four-month horizon, while precipitation shocks contribute only marginally (below 10%) to subsequent temperature variability. Lake-level responses show a 1–2-month lag following precipitation inputs, with an observed 2–3 m amplitude range over the long-term record, confirming the slow but measurable hydrological adjustment of the closed basin. The negative temperature–lake-level coefficients, ranging between –0.29 and –0.62 across stations, quantitatively reflect the dominant evaporative forcing. These numerical outcomes collectively verify that thermal controls exert a stronger influence on the basin’s hydrology than direct precipitation inputs, consistent with the endorheic nature of Lake Van.
By integrating long-term multi-station data into a unified causal model, this study provides a robust and spatially consistent framework for understanding climate–hydrology linkages in semi-arid closed basins. The approach contributes a transferable methodology that can be applied to other temperature-sensitive basins for predictive and management purposes. The contribution is a unified seasonally stratified VAR–Granger framework that makes directional predictability and lag structures comparable across station pairs. Estimating the full multivariate system reduces uncertainty relative to separate univariate models by capturing shared persistence and cross-dependencies, yielding more decision-relevant, season-specific insights. This is consistent with evidence that VAR-based multi-station forecasting can provide strong short-lead skill when data quality is handled carefully.
The results generate two concrete outputs for sustainability-oriented management: (i) by identifying season-specific dominant drivers and lag structures, operationally usable “critical periods” for lake level forecasting can be defined; and (ii) by accounting for inter-station heterogeneity, differentiated adaptation measures can be developed according to coastal areas, agricultural water demand, and ecosystem sensitivity. Accordingly, the study provides direct evidence in support of an adaptive management framework that can enhance water security and ecosystem continuity in closed-basin lakes under climate variability.
Future research should extend the proposed framework by integrating VAR-based analyses with impulse response functions (IRFs) and forecast error variance decomposition (FEVD) to better quantify the dynamic responses and relative contributions of hydroclimatic drivers. In addition, coupling statistical approaches with physically based hydrological models, evaporation estimates, and remote-sensing observations would allow nonlinear processes and anthropogenic influences to be more explicitly represented. Such integrated methodologies would enable a more comprehensive understanding of temperature-driven evaporation effects, lagged precipitation responses, and their combined impact on lake-level variability. Strengthening interdisciplinary and data-integrative approaches is particularly important for enhancing climate resilience and supporting sustainable water management strategies in vulnerable endorheic systems such as the Lake Van Basin.

Author Contributions

Conceptualization, M.P.; Methodology, E.B.Y.B.; Software, E.B.Y.B.; Formal analysis, E.B.Y.B.; Data curation, M.P.; Writing—original draft, M.P. and E.B.Y.B.; Writing—review & editing, M.P.; Supervision, M.P. All authors have read and agreed to the published version of the manuscript.

Funding

This research received no external funding.

Institutional Review Board Statement

Not applicable.

Informed Consent Statement

Not applicable.

Data Availability Statement

The data are not publicly available due to institutional data usage policies of the Turkish State Meteorological Service (MGM).

Conflicts of Interest

The authors declare no conflicts of interest.

Appendix A

Table A1. Portmanteau (Ljung–Box) Test for Tatvan-Tatvan Equation.
Tatvan-Tavan Equation (Residual)Q Statisticdfp-ValueSerial Correlation
Lake Level Tatvan (e_LL)5.178540.2695No
Average Temperature Tatvan (e_Temp)24.809740.0001Yes
Total Precipitation Tatvan (e_Rain)1.029340.9053No
Table A2. Portmanteau (Ljung–Box) Test for Tatvan-Ahlat Equation.
Tatvan-Ahlat Equation (Residual)Q Statisticdfp-ValueSerial Correlation
Lake Level Tatvan (e_LL)4.511140.3412No
Average Temperature Ahlat (e_Temp)61.092140Yes
Total Precipitation Ahlat (e_Rain)4.455140.3479No
Table A3. Portmanteau (Ljung–Box) Test for Gevaş-Van Equation.
Gevaş-Van Equation (Residual)Q Statisticdfp-ValueSerial Correlation
Lake Level Gevaş (e_LL)1.10640.8933No
Average Temperature Van (e_Temp)24.579940.0001Yes
Total Precipitation Van (e_Rain)0.88340.927No
Table A4. Portmanteau (Ljung–Box) Test for Gevaş-Erciş Equation.
Gevaş-Erciş Equation (Residual)Q Statisticdfp-ValueSerial Correlation
Lake Level Gevaş (e_LL)1.032140.9049No
Average Temperature Erciş (e_Temp)33.776240Yes
Total Precipitation Erciş (e_Rain)0.954740.9166No
Table A5. Portmanteau (Ljung–Box) Test for Gevaş-Muradiye Equation.
Gevaş-Muradiye Equation (Residual)Q Statisticdfp-ValueSerial Correlation
Lake Level Gevaş (e_LL)1.407140.843No
Average Temperature Muradiye (e_Temp)35.721440Yes
Total Precipitation Muradiye (e_Rain)0.835640.9336No
Table A6. Granger Causality Results for Winter Season.
ModelEquation (Dependent Variable)ExcludedChi-sqdfProb > Chi-sq
Gevas-Van Region (lags 4)Average Lake Level GevasAverage Temperature Van569.4540
Gevas-Van Region (lags 4)Average Lake Level GevasAverage Precipitation Van347.140
Gevas-Van Region (lags 4)Average Lake Level GevasALL639.3180
Gevas-Van Region (lags 4)Average Temperature VanAverage Lake Level Gevas37.63640
Gevas-Van Region (lags 4)Average Temperature VanAverage Precipitation Van27.77540
Gevas-Van Region (lags 4)Average Temperature VanALL66.2380
Gevas-Van Region (lags 4)Average Precipitation VanAverage Lake Level Gevas166.6440
Gevas-Van Region (lags 4)Average Precipitation VanAverage Temperature Van134.8540
Gevas-Van Region (lags 4)Average Precipitation VanALL247.2380
Gevas-Ercis (lags 4)Average Lake Level GevasAverage Temperature Ercis172.0640
Gevas-Ercis (lags 4)Average Lake Level GevasAverage Precipitation Ercis93.56340
Gevas-Ercis (lags 4)Average Lake Level GevasALL199.1280
Gevas-Ercis (lags 4)Average Temperature ErcisAverage Lake Level Gevas12.56940.014
Gevas-Ercis (lags 4)Average Temperature ErcisAverage Precipitation Ercis0.9722740.914
Gevas-Ercis (lags 4)Average Temperature ErcisALL16.06580.041
Gevas-Ercis (lags 4)Average Precipitation ErcisAverage Lake Level Gevas33.1340
Gevas-Ercis (lags 4)Average Precipitation ErcisAverage Temperature Ercis31.84940
Gevas-Ercis (lags 4)Average Precipitation ErcisALL68.34180
Gevas-Muradiye (lags 4)Average Lake Level GevasAverage Temperature Muradiye39.45840
Gevas-Muradiye (lags 4)Average Lake Level GevasAverage Precipitation Muradiye18.58440.001
Gevas-Muradiye (lags 4)Average Lake Level GevasALL48.04380
Gevas-Muradiye (lags 4)Average Temperature MuradiyeAverage Lake Level Gevas12.22140.016
Gevas-Muradiye (lags 4)Average Temperature MuradiyeAverage Precipitation Muradiye1.400340.844
Gevas-Muradiye (lags 4)Average Temperature MuradiyeALL16.82780.032
Gevas-Muradiye (lags 4)Average Precipitation MuradiyeAverage Lake Level Gevas37.70540
Gevas-Muradiye (lags 4)Average Precipitation MuradiyeAverage Temperature Muradiye47.37740
Gevas-Muradiye (lags 4)Average Precipitation MuradiyeALL81.4880
Tatvan-Tatvan (lags 2)Average Lake Level TatvanAverage Precipitation Tatvan10.80720.004
Tatvan-Tatvan (lags 2)Average Lake Level TatvanAverage Temperature Tatvan1.616220.446
Tatvan-Tatvan (lags 2)Average Lake Level TatvanALL12.33240.015
Tatvan-Tatvan (lags 2)Average Precipitation TatvanAverage Lake Level Tatvan1.808220.405
Tatvan-Tatvan (lags 2)Average Precipitation TatvanAverage Temperature Tatvan0.0238720.988
Tatvan-Tatvan (lags 2)Average Precipitation TatvanALL1.827740.767
Tatvan-Tatvan (lags 2)Average Temperature TatvanAverage Lake Level Tatvan2.516920.284
Tatvan-Tatvan (lags 2)Average Temperature TatvanAverage Precipitation Tatvan6.78220.034
Tatvan-Tatvan (lags 2)Average Temperature TatvanALL8.883240.064
Tatvan-Ahlat (lags 1)Average Lake Level TatvanAverage Precipitation Ahlat0.0419810.838
Tatvan-Ahlat (lags 1)Average Lake Level TatvanAverage Temperature Ahlat1.215410.27
Tatvan-Ahlat (lags 1)Average Lake Level TatvanALL1.234720.539
Tatvan-Ahlat (lags 1)Average Precipitation AhlatAverage Lake Level Tatvan2.108110.147
Tatvan-Ahlat (lags 1)Average Precipitation AhlatAverage Temperature Ahlat1.134510.287
Tatvan-Ahlat (lags 1)Average Precipitation AhlatALL2.83420.242
Tatvan-Ahlat (lags 1)Average Temperature AhlatAverage Lake Level Tatvan2.878310.09
Tatvan-Ahlat (lags 1)Average Temperature AhlatAverage Precipitation Ahlat0.4045210.525
Tatvan-Ahlat (lags 1)Average Temperature AhlatALL2.917320.233
Table A7. Granger Causality Results for Spring Season.
ModelEquation (Dependent Variable)ExcludedChi-sqdfProb > Chi-sq
Gevas-Van Region (lags 4)Average Lake Level GevasAverage Temperature Van7.650540.105
Gevas-Van Region (lags 4)Average Lake Level GevasAverage Precipitation Van75.51540
Gevas-Van Region (lags 4)Average Lake Level GevasALL85.5680
Gevas-Van Region (lags 4)Average Temperature VanAverage Lake Level Gevas12.27830.006
Gevas-Van Region (lags 4)Average Temperature VanAverage Precipitation Van86.33740
Gevas-Van Region (lags 4)Average Temperature VanALL109.2770
Gevas-Van Region (lags 4)Average Precipitation VanAverage Lake Level Gevas414.1930
Gevas-Van Region (lags 4)Average Precipitation VanAverage Temperature Van266.7940
Gevas-Van Region (lags 4)Average Precipitation VanALL683.2370
Gevas-Ercis (lags 4)Average Lake Level GevasAverage Temperature Ercis193.9940
Gevas-Ercis (lags 4)Average Lake Level GevasAverage Precipitation Ercis43.74840
Gevas-Ercis (lags 4)Average Lake Level GevasALL245.9480
Gevas-Ercis (lags 4)Average Temperature ErcisAverage Lake Level Gevas1.30 × 10740
Gevas-Ercis (lags 4)Average Temperature ErcisAverage Precipitation Ercis10.42140.034
Gevas-Ercis (lags 4)Average Temperature ErcisALL3.40 × 10780
Gevas-Ercis (lags 4)Average Precipitation ErcisAverage Lake Level Gevas1.90 × 10740
Gevas-Ercis (lags 4)Average Precipitation ErcisAverage Temperature Ercis16.34840.003
Gevas-Ercis (lags 4)Average Precipitation ErcisALL9.90 × 10780
Gevas-Muradiye (lags 1)Average Lake Level GevasAverage Temperature Muradiye4.715610.03
Gevas-Muradiye (lags 1)Average Lake Level GevasAverage Precipitation Muradiye5.832710.016
Gevas-Muradiye (lags 1)Average Lake Level GevasALL16.96320
Gevas-Muradiye (lags 1)Average Temperature MuradiyeAverage Lake Level Gevas2.528910.112
Gevas-Muradiye (lags 1)Average Temperature MuradiyeAverage Precipitation Muradiye1.709410.191
Gevas-Muradiye (lags 1)Average Temperature MuradiyeALL5.580120.061
Gevas-Muradiye (lags 1)Average Precipitation MuradiyeAverage Lake Level Gevas0.6899710.406
Gevas-Muradiye (lags 1)Average Precipitation MuradiyeAverage Temperature Muradiye1.482710.223
Gevas-Muradiye (lags 1)Average Precipitation MuradiyeALL2.120.35
Tatvan-Tatvan (lags 1)Average Lake Level TatvanAverage Precipitation Tatvan7.138810.008
Tatvan-Tatvan (lags 1)Average Lake Level TatvanAverage Temperature Tatvan0.6144210.433
Tatvan-Tatvan (lags 1)Average Lake Level TatvanALL8.468920.014
Tatvan-Tatvan (lags 1)Average Precipitation TatvanAverage Lake Level Tatvan0.0542310.816
Tatvan-Tatvan (lags 1)Average Precipitation TatvanAverage Temperature Tatvan2.240910.134
Tatvan-Tatvan (lags 1)Average Precipitation TatvanALL2.647220.266
Tatvan-Tatvan (lags 1)Average Temperature TatvanAverage Lake Level Tatvan0.0751810.784
Tatvan-Tatvan (lags 1)Average Temperature TatvanAverage Precipitation Tatvan0.0119810.913
Tatvan-Tatvan (lags 1)Average Temperature TatvanALL0.0925820.955
Tatvan-Ahlat (lags 1)Average Lake Level TatvanAverage Precipitation Ahlat1.452410.228
Tatvan-Ahlat (lags 1)Average Lake Level TatvanAverage Temperature Ahlat1.14610.284
Tatvan-Ahlat (lags 1)Average Lake Level TatvanALL2.933420.231
Tatvan-Ahlat (lags 1)Average Precipitation AhlatAverage Lake Level Tatvan1.500810.221
Tatvan-Ahlat (lags 1)Average Precipitation AhlatAverage Temperature Ahlat1.35510.244
Tatvan-Ahlat (lags 1)Average Precipitation AhlatALL2.983520.225
Tatvan-Ahlat (lags 1)Average Temperature AhlatAverage Lake Level Tatvan0.7265210.394
Tatvan-Ahlat (lags 1)Average Temperature AhlatAverage Precipitation Ahlat0.0016310.968
Tatvan-Ahlat (lags 1)Average Temperature AhlatALL0.8235420.662
Table A8. Granger Causality Results for Summer Season.
ModelEquation (Dependent Variable)ExcludedChi-sqdfProb > Chi-sq
Gevas-Van Region (lags 4)Average Lake Level GevasAverage Temperature Van16.79240.002
Gevas-Van Region (lags 4)Average Lake Level GevasAverage Precipitation Van35.57540
Gevas-Van Region (lags 4)Average Lake Level GevasALL6580
Gevas-Van Region (lags 4)Average Temperature VanAverage Lake Level Gevas16.70740.002
Gevas-Van Region (lags 4)Average Temperature VanAverage Precipitation Van10.61640.031
Gevas-Van Region (lags 4)Average Temperature VanALL37.76880
Gevas-Van Region (lags 4)Average Precipitation VanAverage Lake Level Gevas28.00940
Gevas-Van Region (lags 4)Average Precipitation VanAverage Temperature Van23.96140
Gevas-Van Region (lags 4)Average Precipitation VanALL47.15480
Gevas-Ercis (lags 4)Average Lake Level GevasAverage Temperature Ercis134.4740
Gevas-Ercis (lags 4)Average Lake Level GevasAverage Precipitation Ercis173.7740
Gevas-Ercis (lags 4)Average Lake Level GevasALL300.680
Gevas-Ercis (lags 4)Average Temperature ErcisAverage Lake Level Gevas20.46640
Gevas-Ercis (lags 4)Average Temperature ErcisAverage Precipitation Ercis23.66440
Gevas-Ercis (lags 4)Average Temperature ErcisALL51.52580
Gevas-Ercis (lags 4)Average Precipitation ErcisAverage Lake Level Gevas26.61640
Gevas-Ercis (lags 4)Average Precipitation ErcisAverage Temperature Ercis30.07940
Gevas-Ercis (lags 4)Average Precipitation ErcisALL54.88280
Gevas-Muradiye (lags 1)Average Lake Level GevasAverage Temperature Muradiye0.4866910.485
Gevas-Muradiye (lags 1)Average Lake Level GevasAverage Precipitation Muradiye0.1018310.75
Gevas-Muradiye (lags 1)Average Lake Level GevasALL1.770420.413
Gevas-Muradiye (lags 1)Average Temperature MuradiyeAverage Lake Level Gevas1.764910.184
Gevas-Muradiye (lags 1)Average Temperature MuradiyeAverage Precipitation Muradiye0.3456710.557
Gevas-Muradiye (lags 1)Average Temperature MuradiyeALL1.76720.413
Gevas-Muradiye (lags 1)Average Precipitation MuradiyeAverage Lake Level Gevas1.163410.281
Gevas-Muradiye (lags 1)Average Precipitation MuradiyeAverage Temperature Muradiye1.729610.188
Gevas-Muradiye (lags 1)Average Precipitation MuradiyeALL2.287320.319
Tatvan-Tatvan (lags 3)Average Lake Level TatvanAverage Precipitation Tatvan16.2930.001
Tatvan-Tatvan (lags 3)Average Lake Level TatvanAverage Temperature Tatvan10.16830.017
Tatvan-Tatvan (lags 3)Average Lake Level TatvanALL21.62160.001
Tatvan-Tatvan (lags 3)Average Precipitation TatvanAverage Lake Level Tatvan5.974730.113
Tatvan-Tatvan (lags 3)Average Precipitation TatvanAverage Temperature Tatvan4.738130.192
Tatvan-Tatvan (lags 3)Average Precipitation TatvanALL10.00260.125
Tatvan-Tatvan (lags 3)Average Temperature TatvanAverage Lake Level Tatvan2.318930.509
Tatvan-Tatvan (lags 3)Average Temperature TatvanAverage Precipitation Tatvan10.23230.017
Tatvan-Tatvan (lags 3)Average Temperature TatvanALL12.99660.043
Tatvan-Ahlat (lags 1)Average Lake Level TatvanAverage Precipitation Ahlat0.2178810.641
Tatvan-Ahlat (lags 1)Average Lake Level TatvanAverage Temperature Ahlat1.980510.159
Tatvan-Ahlat (lags 1)Average Lake Level TatvanALL2.578620.275
Tatvan-Ahlat (lags 1)Average Precipitation AhlatAverage Lake Level Tatvan0.1409710.707
Tatvan-Ahlat (lags 1)Average Precipitation AhlatAverage Temperature Ahlat2.164210.141
Tatvan-Ahlat (lags 1)Average Precipitation AhlatALL2.245420.325
Tatvan-Ahlat (lags 1)Average Temperature AhlatAverage Lake Level Tatvan5.835610.016
Tatvan-Ahlat (lags 1)Average Temperature AhlatAverage Precipitation Ahlat0.0419510.838
Tatvan-Ahlat (lags 1)Average Temperature AhlatALL5.837720.054
Table A9. Granger Causality Results for Autumn Season.
ModelEquation (Dependent Variable)ExcludedChi-sqdfProb > Chi-sq
Gevas-Van Region (lags 4)Average Lake Level GevasAverage Temperature Van 1025.140
Gevas-Van Region (lags 4)Average Lake Level GevasAverage Precipitation Van52240
Gevas-Van Region (lags 4)Average Lake Level GevasALL1055.580
Gevas-Van Region (lags 4)Average Temperature Van Average Lake Level Gevas3.70 × 10530
Gevas-Van Region (lags 4)Average Temperature Van Average Precipitation Van61.04940
Gevas-Van Region (lags 4)Average Temperature Van ALL9.80 × 10570
Gevas-Van Region (lags 4)Average Precipitation VanAverage Lake Level Gevas2.90 × 10730
Gevas-Van Region (lags 4)Average Precipitation VanAverage Temperature Van 876.7240
Gevas-Van Region (lags 4)Average Precipitation VanALL2.20 × 10970
Gevas-Ercis (lags 4)Average Lake Level GevasAverage Temperature Ercis7.677340.104
Gevas-Ercis (lags 4)Average Lake Level GevasAverage Precipitation Ercis20.39240
Gevas-Ercis (lags 4)Average Lake Level GevasALL27.27780.001
Gevas-Ercis (lags 4)Average Temperature ErcisAverage Lake Level Gevas3.30 × 10630
Gevas-Ercis (lags 4)Average Temperature ErcisAverage Precipitation Ercis13.25940.01
Gevas-Ercis (lags 4)Average Temperature ErcisALL1.10 × 10770
Gevas-Ercis (lags 4)Average Precipitation ErcisAverage Lake Level Gevas1.90 × 10630
Gevas-Ercis (lags 4)Average Precipitation ErcisAverage Temperature Ercis28.94240
Gevas-Ercis (lags 4)Average Precipitation ErcisALL6.80 × 10770
Gevas-Muradiye (lags 4)Average Lake Level GevasAverage Temperature Muradiye141.9540
Gevas-Muradiye (lags 4)Average Lake Level GevasAverage Precipitation Muradiye166.9540
Gevas-Muradiye (lags 4)Average Lake Level GevasALL173.2880
Gevas-Muradiye (lags 4)Average Temperature MuradiyeAverage Lake Level Gevas5.934930.115
Gevas-Muradiye (lags 4)Average Temperature MuradiyeAverage Precipitation Muradiye2.483140.648
Gevas-Muradiye (lags 4)Average Temperature MuradiyeALL20.39870.005
Gevas-Muradiye (lags 4)Average Precipitation MuradiyeAverage Lake Level Gevas0.9457830.814
Gevas-Muradiye (lags 4)Average Precipitation MuradiyeAverage Temperature Muradiye4.527240.339
Gevas-Muradiye (lags 4)Average Precipitation MuradiyeALL6.202770.516
Tatvan-Tatvan (lags 1)Average Lake Level TatvanAverage Temperature Tatvan3.023710.082
Tatvan-Tatvan (lags 1)Average Lake Level TatvanAverage Precipitation Tatvan7.892210.005
Tatvan-Tatvan (lags 1)Average Lake Level TatvanALL8.791420.012
Tatvan-Tatvan (lags 1)Average Temperature TatvanAverage Lake Level Tatvan0.0048610.944
Tatvan-Tatvan (lags 1)Average Temperature TatvanAverage Precipitation Tatvan0.864810.352
Tatvan-Tatvan (lags 1)Average Temperature TatvanALL0.8889120.641
Tatvan-Tatvan (lags 1)Average Precipitation TatvanAverage Lake Level Tatvan0.1545210.694
Tatvan-Tatvan (lags 1)Average Precipitation TatvanAverage Temperature Tatvan0.5901910.442
Tatvan-Tatvan (lags 1)Average Precipitation TatvanALL1.069820.586
Tatvan-Ahlat (lags 1)Average Lake Level TatvanAverage Temperature Ahlat0.9496610.33
Tatvan-Ahlat (lags 1)Average Lake Level TatvanAverage Precipitation Ahlat0.4055310.524
Tatvan-Ahlat (lags 1)Average Lake Level TatvanALL1.646420.439
Tatvan-Ahlat (lags 1)Average Temperature AhlatAverage Lake Level Tatvan0.7736310.379
Tatvan-Ahlat (lags 1)Average Temperature AhlatAverage Precipitation Ahlat1.151710.283
Tatvan-Ahlat (lags 1)Average Temperature AhlatALL2.211920.331
Tatvan-Ahlat (lags 1)Average Precipitation AhlatAverage Lake Level Tatvan3.332310.068
Tatvan-Ahlat (lags 1)Average Precipitation AhlatAverage Temperature Ahlat0.4623610.497
Tatvan-Ahlat (lags 1)Average Precipitation AhlatALL3.547720.17

References

  1. IPCC. Climate Change 2021: The Physical Science Basis; Cambridge University Press: Cambridge, UK, 2021; Available online: https://www.ipcc.ch/report/ar6/wg1/downloads/report/IPCC_AR6_WGI_FrontMatter.pdf (accessed on 21 December 2025).
  2. Qiao, B.; Liping, Z.; Ruimin, Y. Temporal-spatial differences in lake water storage changes and their links to climate change throughout the Tibetan Plateau. Remote Sens. Environ. 2019, 222, 232–243. [Google Scholar] [CrossRef] [Scilit]
  3. Kraemer, B.M.; Seimon, A.; Adrian, R.; McIntyre, P.B. Worldwide lake level trends and responses to background climate variation. Hydrol. Earth Syst. Sci. 2020, 24, 2593–2608. [Google Scholar] [CrossRef] [Scilit]
  4. Serkendiz, H.; Tatli, H.; Kılıç, A.; Çetin, M.; Sungur, A. Analysis of drought intensity, frequency and trends using the spei in Turkey. Theor. Appl. Climatol. 2024, 155, 2997–3012. [Google Scholar] [CrossRef] [Scilit]
  5. Khorrami, B.; Gündüz, O. Detection and analysis of drought over Turkey with remote sensing and model-based drought indices. Geocarto Int. 2022, 37, 12171–12193. [Google Scholar] [CrossRef] [Scilit]
  6. Yayla, O.; Akpınar, H.; Bilgin, T.; Atayeter, Y.; Korkmaz, O. An evaluation of the long-term changes in the shoreline of Lake Eğirdir in relation to climate and anthropogenic factors. J. Geogr. 2025, 50, 65–78. [Google Scholar] [CrossRef] [Scilit]
  7. Meydan, A.F.; Akkol, S.; Doğan, O.N. Implications from the meteorological data effects on water level fluctuations of the Lake Van (Eastern Anatolia/Türkiye). Mar. Sci. Technol. Bull. 2022, 11, 299–308. [Google Scholar] [CrossRef] [Scilit]
  8. Republic of Türkiye, Van Governorship. Van Province 2023 Environmental Status Report; Provincial Directorate of Environment, Urbanization and Climate Change, Department of EIA and Environmental Permits: Van, Türkiye, 2024.
  9. Hartini, S.; Hadi, M.P.; Sudibyakto, S.; Poniman, A. Application of vector auto regression model for precipitation-river discharge analysis. Forum Geogr. 2015, 29, 1–10. [Google Scholar] [CrossRef] [Scilit]
  10. Ramli, I.; Rusdiana, S.; Basri, H.; Munawar, A.A.; Vazelia. Predicted Precipitation and Discharge Using VAR in Water Resources Management. IOP Conf. Ser. Earth Environ. Sci. 2019, 273, 012009. [Google Scholar] [CrossRef] [Scilit]
  11. Dong, X.; Li, X.; Liu, Y. Rescaled range/vector autoregressive-based changing characteristics of dry season streamflow in the Yujiang River Basin, Southern China. Stoch. Environ. Res. Risk Assess. 2025, 39, 403–421. [Google Scholar] [CrossRef] [Scilit]
  12. Terzi, Ö.; Ergin, G. Forecasting of monthly river flow with autoregressive modeling and data-driven techniques. Neural Comput. Appl. 2014, 25, 179–188. [Google Scholar] [CrossRef] [Scilit]
  13. Aydın, M.C.; Gelberi, G.; Ulu, A.E. Investigation of recent level changes in Lake Van using water balance, LSTM and ANN approaches. Appl. Water Sci. 2024, 14, 41. [Google Scholar] [CrossRef] [Scilit]
  14. Abdallah, W.; Abdallah, N.; Marion, J.-M.; Oueidat, M.; Chauvet, P. A vector autoregressive methodology for short-term weather forecasting: Tests for Lebanon. SN Appl. Sci. 2020, 2, 1555. [Google Scholar] [CrossRef] [Scilit]
  15. Ouma, Y.O.; Moalafhi, D.B.; Anderson, G.; Nkwae, B.; Odirile, P.; Parida, B.P.; Qi, J. Dam water level prediction using vector autoregression, random forest regression and MLP-ANN models based on land-use and climate factors. Sustainability 2022, 14, 14934. [Google Scholar] [CrossRef] [Scilit]
  16. Nugroho, A.; Subanar, S.; Hartati, S.; Mustofa, K. Vector Autoregression (VAR) Model for Precipitation Forecast and Isohyet Mapping in Semarang–Central Java–Indonesia. Int. J. Adv. Comput. Sci. Appl. 2014, 5, 44–49. [Google Scholar] [CrossRef] [Scilit]
  17. Jiang, M.; Wu, Z.; Guo, X.; Wang, H.; Zhou, Y. Study on the contribution of land use and climate change to available water resources in basins based on vector autoregression (VAR) model. Water 2023, 15, 2130. [Google Scholar] [CrossRef] [Scilit]
  18. Kaur, H.; Alam, M.A.; Mariyam, S.; Alankar, B.; Chauhan, R.; Adnan, R.M.; Kisi, O. Predicting Water Availability Using VAR/VECM/LSTM Models. Climate 2021, 9, 144. [Google Scholar] [CrossRef] [Scilit]
  19. Abudu, S.; Cui, C.L.; King, J.P.; Abudukadeer, K. Comparison of performance of statistical models in forecasting monthly streamflow of Kizil River, China. Water Sci. Eng. 2010, 3, 269–281. [Google Scholar]
  20. Galavi, H.; Mirzaei, M.; Shul, L.T.; Valizadeh, N. Klang River-Level forecasting using ARIMA and ANFIS models. J. Am. Water Works Assoc. 2013, 105, E496–E506. [Google Scholar] [CrossRef] [Scilit]
  21. Nigam, R.; Nigam, S.; Mittal, S.K. Stochastic modelling of rainfall and runoff phenomenon: A time series approach review. Int. J. Hydrol. Sci. Technol. 2014, 4, 81. [Google Scholar] [CrossRef] [Scilit]
  22. Sun, Y.; Niu, J.; Sivakumar, B. A comparative study of models for short-term streamflow forecasting with emphasis on wavelet-based approach. Stoch. Environ. Res. Risk Assess. 2019, 33, 1875–1891. [Google Scholar] [CrossRef] [Scilit]
  23. Aghelpour, P.; Varshavian, V. Evaluation of stochastic and artificial intelligence models in modeling and predicting of river daily flow time series. Stoch. Environ. Res. Risk Assess. 2020, 34, 33–50. [Google Scholar] [CrossRef] [Scilit]
  24. Pan, M.; Zhou, H.; Cao, J.; Liu, Y.; Hao, J.; Li, S.; Chen, C.H. Water level prediction model based on GRU and CNN. IEEE Access 2020, 8, 60090–60100. [Google Scholar] [CrossRef] [Scilit]
  25. Niedzielski, T. A data-based regional scale autoregressive rainfall-runoff model: A study from the Odra River. Stoch. Environ. Res. Risk Assess. 2007, 21, 649–664. [Google Scholar] [CrossRef] [Scilit]
  26. Niedzielski, T. Empirical hydrologic predictions for southwestern Poland and their relation to enso teleconnections. Artif. Satell. 2010, 45, 11–26. [Google Scholar] [CrossRef] [Scilit]
  27. Niedzielski, T.; Miziński, B. Real-time hydrograph modelling in the upper Nysa Kłodzka river basin (SW Poland): A two-model hydrologic ensemble prediction approach. Stoch. Environ. Res. Risk Assess. 2017, 31, 1555–1576. [Google Scholar] [CrossRef] [Scilit]
  28. Zhao, J.; Mu, X.; Gao, P. Dynamic response of runoff to soil and water conservation measures and precipitation based on VAR model. Hydrol. Res. 2019, 50, 837–848. [Google Scholar] [CrossRef] [Scilit]
  29. Halicki, M.; Niedzielski, T. A new approach for hydrograph data interpolation and outlier removal for vector autoregressive modelling: A case study from the Odra/Oder River. Stoch. Environ. Res. Risk Assess. 2024, 38, 2781–2796. [Google Scholar] [CrossRef] [Scilit]
  30. Republic of Türkiye, Ministry of Agriculture and Forestry. 2025, Lake Van Basin. Available online: https://www.tarimorman.gov.tr/SYGM/Sayfalar/Detay.aspx?SayfaId=142 (accessed on 21 December 2025).
  31. Sims, C.A. Macro Economics and Reality. Econometrica 1980, 48, 1–48. [Google Scholar] [CrossRef] [Scilit]
  32. Hamilton, J.D. Time Series Analysis; Princeton University Press: Princeton, NJ, USA, 1994; Available online: http://103.203.175.90:81/fdScript/RootOfEBooks/E%20Book%20collection%20-%202023%20-%20E/CSE%20ITAIDSML/Time%20Series%20Analysis%20-%20James%20D%20Hamilton.pdf (accessed on 21 December 2025).
  33. Musa, Y.; Ahmad, I.; Maijamaa, B. Application of vector autoregression (var) on modelling and forecasting average monthly precipitation and temperature. Lloyd Bus. Rev. 2024, 3, 1–23. [Google Scholar] [CrossRef] [Scilit]
  34. Granger, C.W. Investigating causal relations by econometric models and cross-spectral methods. Econom. J. Econom. Soc. 1969, 37, 424–438. [Google Scholar] [CrossRef] [Scilit]
  35. Gelper, S.; Croux, C. Multivariate out-of-sample tests for Granger causality. Comput. Stat. Data Anal. 2007, 51, 3319–3329. [Google Scholar] [CrossRef] [Scilit]
  36. Reimer, A.; Landmann, G.; Kempe, S. Lake Van, Eastern Anatolia, Hydrochemistry and History. Aquat. Geochem. 2009, 15, 195–222. [Google Scholar] [CrossRef] [Scilit]
  37. Vaheddoost, B.; Fathian, F.; Gul, E.; Safari, M.J.S. Studying the changes in the hydro-meteorological components of water budget in Lake Urmia. Water Resour. Res. 2022, 58, e2022WR032030. [Google Scholar] [CrossRef] [Scilit]
  38. Shahidi, A.; Ramezani, Y.; Nazeri-Tahroudi, M.; Mohammadi, S. Application of vector autoregressive models to estimate pan evaporation values at the Salt Lake Basin, Iran. Időjárás. Q. J. Hung. Meteorol. Serv. 2020, 124, 463–482. [Google Scholar] [CrossRef] [Scilit]
  39. Berdimbetov, T.; Pushpawela, B.; Murzintcev, N.; Nietullaeva, S.; Gafforov, K.; Tureniyazova, A.; Madetov, D. Unraveling the Intricate Links between the Dwindling Aral Sea and Climate Variability during 2002–2017. Climate 2024, 12, 105. [Google Scholar] [CrossRef] [Scilit]
  40. Kirillin, G.B.; Shatwell, T.; Izhitskiy, S.A. Consequences of the Aral Sea restoration for its present physical state: Temperature, mixing, and oxygen regime. Hydrol. Earth Syst. Sci. 2025, 29, 3569–3588. [Google Scholar] [CrossRef] [Scilit]
  41. Aydin, H.; Karakuş, H. Estimation of evaporation for Lake Van. Environ Earth Sci. 2016, 75, 1275. [Google Scholar] [CrossRef] [Scilit]
Figure 1. Lake Van Closed Basin.
Sustainability 18 02130 g001
Figure 2. Methodological Flowchart.
Sustainability 18 02130 g002
Figure 3. Lake levels for (a) Gevaş and (b) Tatvan.
Sustainability 18 02130 g003
Figure 4. Total Precipitation for Van Region, Erciş, Muradiye, Tatvan, and Ahlat.
Sustainability 18 02130 g004
Figure 5. Average Temperatures for Van Region, Erciş, Muradiye, Tatvan, and Ahlat.
Sustainability 18 02130 g005
Table 1. General Information on Lake Van and Its Closed Basin [13,30].
ParameterLake VanLake Van Closed Basin
Geographical locationEastern Anatolia Region, Türkiye (38°30′ N–43°00′ E)Located entirely within Eastern Anatolia; bordered by Bitlis, Van, and Ağrı provinces
TypeEndorheic (closed) soda lakeEndorheic drainage basin
Geological originTectonic depression bounded by normal and strike-slip faults; volcanism (Mt. Süphan & Nemrut)Composed of volcanic, alluvial and lacustrine formations
Elevation~1648 m1600–3500 m
Surface area3550–3620 km2 (mean ≈ 3580 km2)≈17,893 km2
Table 2. Spatial grouping and physiographic context of stations.
StationProposed Spatial GroupElevation (m)Relative Position in BasinProximity to Lake ShoreTopographic Setting (Qualitative)Notes (Distance and Relation)
TatvanWestern, northwestern coastal1640W/NW sectorNearCoastal settingTatvan-Ahlat: ~70 m elevation difference; similar shoreline distance
AhlatWestern, northwestern coastal1710W/NW sectorNearCoastal setting~30 km north of Tatvan (straight-line); similar shoreline distance
ErcişNorthern to northeastern inland transition1690N/NE sectorMore inlandInland setting~70 km NE of Ahlat; more inland relative to shore
MuradiyeNortheastern inland, topographically constrained1700NE sectorMore inlandValley/corridor bounded by hills~35 km east of Erciş; flanked by hills reaching ~2000 to 2200 m
Van RegionSouthern coastal1660S sectorNearCoastal setting~70 km south of Muradiye; close to shore
Table 3. Descriptive statistics of meteorological stations.
VariableObservationMeanStd. Dev.MinMax
Lake Level Gevaş (m)2511649.3470.37845861648.131649.99
Lake Level Tatvan (model 1 with Tatvan) (m)7681648.9530.72950421647.0251650.53
Lake Level Tatvan (model 2 with Ahlat) (m)6961649.0670.63357921647.9431650.53
Total Precipitation Van Region (mm)25233.2488127.700080133.7
Total Precipitation Erciş (mm)25233.3361130.801410162.8
Total Precipitation Muradiye (mm)25239.3849233.341190170.8
Total Precipitation Tatvan (mm)69664.6974159.629320269
Total Precipitation Ahlat (mm)76838.8335939.900690212.4
Average Temperature Van Region (°C)25210.4454310.44543−5.28709724.84194
Average Temperature Erciş (°C)2528.8038029.499898−8.7419354.23548
Average Temperature Muradiye (°C)2439.7192549.792584−7.83548425.98
Average Temperature Tatvan (°C)6969.3401778.863817−7.1214294.46452
Average Temperature Ahlat (°C)7689.4475148.849199−6.9387124.93226
Table 4. ADF Unit Root Test.
VariablesTest Statistic Z(t)Critical Value (5%)p-ValueStationary State
Lake Level Tatvan−3.063−2.860.0294Stable
Total Precipitation Tatvan−12.761−2.860Stable
Average Temperature Tatvan−23.036−2.860Stable
Total Precipitation Ahlat−10.55−2.860Stable
Average Temperature Ahlat−26.106−2.860Stable
Lake Level Van Gevaş−3.6−2.8810.0058Stable
Total Precipitation Van Region−7.98−2.880Stable
Total Precipitation Erciş−7.41−2.880Stable
Total Precipitation Muradiye−7.16−2.880Stable
Average Temperature Van Region−16.602−2.880Stable
Average Temperature Erciş−16.538−2.880Stable
Average Temperature Muradiye−16.904−2.8810Stable
Table 5. KPSS Stationarity Test Results.
VariableKPSS Level (No Trend) BandwidthKPSS Level Stat5% CritLevel Stationary?KPSS Trend BandwidthKPSS Trend Stat5% CritTrend Stationary?Overall (At 5%)
Lake Level Van (Gevas)130.3170.463Fail to reject110.1250.146Fail to rejectStationary (level & trend)
Total Precipitation Van Region70.2060.463Fail to reject90.1120.146Fail to rejectStationary (level & trend)
Total Precipitation Ercis30.4760.463Reject30.02690.146Fail to rejectNot level-stationary; trend-stationary
Total Precipitation Muradiye80.9930.463Reject60.05810.146Fail to rejectNot level-stationary; trend-stationary
Average Temperature Van Region80.150.463Fail to reject80.01920.146Fail to rejectStationary (level & trend)
Average Temperature Ercis80.3130.463Fail to reject80.01860.146Fail to rejectStationary (level & trend)
Average Temperature Muradiye80.130.463Fail to reject80.02630.146Fail to rejectStationary (level & trend)
Lake Level Tatvan181.650.463Reject180.440.146RejectNon-stationary (not level, not trend)
Total Precipitation Tatvan90.2530.463Fail to reject100.1810.146RejectLevel-stationary; not trend-stationary
Average Temperature Tatvan10.1660.463Fail to reject20.03290.146Fail to rejectStationary (level & trend)
Total Precipitation Ahlat90.7940.463Reject80.7230.146RejectNon-stationary (not level, not trend)
Average Temperature Ahlat00.1740.463Fail to reject00.05440.146Fail to rejectStationary (level & trend)
Table 6. Consolidated VAR Model Estimation at 4 lags across stations.
VariablesTatvan–TatvanTatvan–AhlatGevaş–VanGevaş–ErcişGevaş–Muradiye
Lake Level TatvanTotal Precipitation TatvanAverage Temperature TatvanLake Level TatvanTotal Precipitation AhlatAverage Temperature AhlatLake Level GevaşTotal Precipitation Van RegionAverage Temperature Van RegionLake Level GevaşTotal Precipitation ErcişAverage Temperature ErcişLake Level GevaşTotal Precipitation MuradiyeAverage Temperature Muradiye
Lake Level (4)0.2594841 ***
(0.0366309)
−3.9387
(12.6089)
0.7579
(0.5054)
0.2843 ***
(0.0346)
0.00007
(0.1527)
−0.0061 **
(0.0025)
0.3648 ***
(0.0552)
−13.3905
(13.6179)
−0.5574
(1.0325)
0.3685 ***
(0.0553)
1.3469 (14.9132)−0.7060
(1.2338)
0.3598 ***
(0.0560)
−15.8535
(15.7654)
0.2666
(1.2256)
Total Precipitation (4)0.0001
(0.0001)
−0.0860 **
(0.0386)
−0.0031 **
(0.0015)
−3.0894
(8.1538)
0.0224
(0.0360)
0.1669
(0.5835)
−0.0000493
(0.0002745)
−0.1177 * (0.06776)0.0000240
(0.005137)
−0.0000726
(0.00025)
−0.01830
(0.06652)
−0.000487
(0.0055)
−0.00001
(0.0002)
−0.08956
(0.06704)
0.003743
(0.005212)
Average Temperature (4)0.0029
(0.0026)
−2.0503 **
(0.8828)
−0.3446 ***
(0.0354)
−0.6164
(0.4771)
0.0019
(0.2106)
−0.3681 ***
(0.0341)
−0.01054 ***
(0.003282)
0.01422 (0.8101)−0.3904 *** (0.06142)−0.008488 ***
(0.0027)
1.0326
(0.7168)
−0.4156 ***
(0.05931)
−0.008371 ***
(0.002857)
1.0387
(0.8039)
−0.4114 ***
(0.06250)
Note: Standard deviations are in parentheses. *** p < 0.01, ** p < 0.05, * p < 0.10. “(4)” denotes VAR(p = 4). (4) = 4 represents the lagged terms of the relevant variable in the lagged model.
Table 7. Granger Causality Test for Tatvan-Tatvan Station.
Dependent variable: Lake Level Tatvan
ExcludedChi-sqdfp-value
Total Precipitation Tatvan26.11140
Average Temperature Tatvan26.57440
ALL85.31580
Dependent variable: Total Precipitation Tatvan
ExcludedChi-sqdfp-value
Lake Level Tatvan2.97240.563
Average Temperature Tatvan77.0140
ALL86.0980
Dependent variable: Average Temperature Tatvan
ExcludedChi-sqdfp-value
Lake Level Tatvan3.59140.464
Total Precipitation Tatvan37.82840
ALL50.06880
Table 8. Granger Causality Test for Tatvan-Ahlat Station.
Dependent variable: Lake Level Tatvan
ExcludedChi-sqdfp-value
Total Precipitation Tatvan26.11140
Average Temperature Tatvan26.57440
ALL85.31580
Dependent variable: Total Precipitation Tatvan
ExcludedChi-sqdfp-value
Lake Level Tatvan2.97240.563
Average Temperature Tatvan77.0140
ALL86.0980
Dependent variable: Average Temperature Tatvan
ExcludedChi-sqdfp-value
Lake Level Tatvan3.59140.464
Total Precipitation Tatvan37.82840
ALL50.06880
Table 9. Granger Causality Test for Gevaş-Van Region Station.
Dependent variable: Lake Level Gevas
ExcludedChi-sqdfp-value
Total Precipitation Van12.65640.013
Average Temperature Gevas55.7640
ALL114.5280
Dependent variable: Total Precipitation Van
ExcludedChi-sqdfp-value
Lake Level Gevas1.153740.886
Average Temperature Gevas40.35540
ALL45.14480
Dependent variable: Average Temperature Gevas
ExcludedChi-sqdfp-value
Lake Level Gevas4.922540.295
Total Precipitation Van14.05540.007
ALL23.7680.003
Table 10. Granger Causality Test for Gevaş-Erciş Station.
Dependent variable: Lake Level Gevaş
ExcludedChi-sqdfp-value
Total Precipitation Ercis13.92640.008
Average Temperature Erciş60.05640
ALL119.1180
Dependent variable: Total Precipitation Erciş
ExcludedChi-sqdfp-value
Lake Level Gevas0.4088440.982
Average Temperature Erciş41.19640
ALL46.1480
Dependent variable: Average Temperature Erciş
ExcludedChi-sqdfp-value
Lake Level Gevas8.598540.072
Total Precipitation Erciş6.715340.152
ALL19.10480.014
Table 11. Granger Causality Test for Gevaş-Muradiye Station.
Dependent variable: Lake Level Gevas
ExcludedChi-sqdfp-value
Total Precipitation Muradiye12.37140.015
Average Temperature Muradiye43.21140
ALL110.0980
Dependent variable: Total Precipitation Muradiye
ExcludedChi-sqdfp-value
Lake Level Gevas4.803840.308
Average Temperature Muradiye61.45640
ALL63.99480
Dependent variable: Average Temperature Muradiye
ExcludedChi-sqdfp-value
Lake Level Gevas6.329340.176
Total Precipitation Muradiye8.1240.087
ALL16.05680.042
Table 12. Winter Season: Seasonal VAR Estimations.
VariablesTatvan–Tatvan (p = 2)Tatvan–Ahlat (p = 1)Gevaş–Van (p = 4)Gevaş–Erciş (p = 4)Gevaş–Muradiye (p = 4)
Lake Level TatvanAverage Precipitation TatvanAverage Temperature TatvanLake Level TatvanAverage Precipitation AhlatAverage Temperature AhlatLake Level GevaşAverage Precipitation van RegionAverage Temperature van RegionLake Level GevaşAverage Precipitation ErcişAverage Temperature ErcişLake Level GevaşAverage Precipitation MuradiyeAverage Temperature Muradiye
Average Lake Level −0.1226 (0.1242)16.5877 (12.3358)0.7074
(0.4473)
0.8078 *** (0.0632)5.9064
(4.0680)
−0.5552 * (0.3272)0.5049 *** (0.0578)−37.8125 *** (7.8253)1.9783
(1.4655)
0.0811 (0.0640)20.8317 *** (6.7342)4.6955 *** (1.7761)0.1576 (0.1193)41.3590 *** (8.0624)3.2470 ** (1.5780)
Average Temperature0.0369 (0.0302)−0.2505
(3.0055)
0.1760
(0.1090)
0.0194 (0.0176)−1.2066
(1.1328)
0.7328 *** (0.0911)−0.1564 *** (0.0071)9.5989 *** (0.9601)0.4057 ** (0.1798)−0.0908 *** (0.0075)−1.5002 * (0.7943)0.2885
(0.2095)
−0.0792 *** (0.0162)−5.2442 *** (1.0981)0.0813
(0.2149)
Average Precipitation0.0042 *** (0.0014)−0.0975
(0.1399)
0.0096 *
(0.0051)
0.0004 (0.0018)0.3749 *** (0.1129)0.0058
(0.0091)
0.0131 *** (0.0008)−0.1644
(0.1110)
−0.0008
(0.0208)
0.0030 ** (0.0014)0.1020
(0.1444)
−0.0141
(0.0381)
0.0025 (0.0020)0.0138
(0.1354)
−0.0021 (0.0265)
Note: Entries report estimated VAR coefficients; standard errors are shown in parentheses. The lag order for each station-pair is given in the column headers as p (Tatvan–Tatvan: p = 2; Tatvan–Ahlat: p = 1; Gevaş–Van: p = 4; Gevaş–Erciş: p = 4; Gevaş–Muradiye: p = 4). ***, **, and * denote statistical significance at the 1%, 5%, and 10% levels, respectively.
Table 13. Spring Season: Seasonal VAR Estimations.
VariablesTatvan–Tatvan (p = 1)Tatvan–Ahlat (p = 1)Gevaş–Van (p = 4)Gevaş–Erciş (p = 4)Gevaş–Muradiye (p = 1)
Lake Level TatvanAverage Precipitation TatvanAverage Temperature TatvanLake Level TatvanAverage Precipitation AhlatAverage Temperature AhlatLake Level GevaşAverage Precipitation van RegionAverage Temperature van RegionLake Level GevaşAverage Precipitation ErcişAverage Temperature ErcişLake Level GevaşAverage Precipitation MuradiyeAverage Temperature Muradiye
Average Lake Level0.8010 *** (0.0703)1.9423
(8.3400)
0.2011
(0.7334)
0.7987 *** (0.0600)6.2429
(5.0959)
−0.4062
(0.4765)
−0.6457 *** (0.1346)116.6333 *** (5.8251)−0.0261
(0.4935)
0.4695 *** (0.1286)37.1297 (26.4351)1.9499
(1.5383)
0.5909 *** (0.1289)10.4440 (12.5734)1.3417
(0.8437)
Average Temperature−0.0056 (0.0071)−1.2640
(0.8443)
0.7881 *** (0.0743)0.0117 (0.0110)1.0833
(0.9306)
0.8329 *** (0.0870)−0.0827 (0.0588)−15.6466 *** (2.5451)−0.0935
(0.2156)
−0.1921 *** (0.0255)−13.3997 ** (5.2373)0.1539
(0.3048)
−0.0719 ** (0.0331)−3.9343
(3.2310)
−0.1869
(0.2168)
Average Precipitation0.0030 *** (0.0011)−0.0249
(0.1340)
0.0013
(0.0118)
0.0016 (0.0014)0.3206 *** (0.1153)−0.0004
(0.0108)
−0.0133 ** (0.0057)0.4737 *
(0.2467)
0.0304
(0.0209)
0.0008 (0.0017)0.7032 ** (0.3404)0.0222
(0.0198)
0.0065 ** (0.0027)0.0014
(0.2619)
−0.0230
(0.0176)
Note: Entries report estimated VAR coefficients; standard errors are shown in parentheses. The lag order for each station-pair is indicated in the column headers as p (Tatvan–Tatvan: p = 1; Tatvan–Ahlat: p = 1; Gevaş–Van: p = 4; Gevaş–Erciş: p = 4; Gevaş–Muradiye: p = 1). ***, **, and * denote statistical significance at the 1%, 5%, and 10% levels, respectively.
Table 14. Summer Season: Seasonal VAR Estimations.
VariablesTatvan–Tatvan (p = 3)Tatvan–Ahlat (p = 1)Gevaş–Van (p = 4)Gevaş–Erciş (p = 4)Gevaş–Muradiye (p = 4)
Lake Level TatvanAverage Precipitation TatvanAverage Temperature TatvanLake Level TatvanAverage Precipitation AhlatAverage Temperature AhlatLake Level GevaşAverage Precipitation van RegionAverage Temperature van RegionLake Level GevaşAverage Precipitation ErcişAverage Temperature ErcişLake Level GevaşAverage Precipitation MuradiyeAverage Temperature Muradiye
Average Lake Level0.0348 (0.1193)−4.0764
(2.5734)
1.3862
(1.2627)
0.8701 *** (0.0482)0.4770
(1.2705)
0.7306 ** (0.3024)−0.5821 ***
(0.2165)
−4.8534
(6.4823)
1.3229
(1.1743)
−0.8693 *** (0.0944)−2.5462
(6.0020)
2.1689 *
(1.1653)
−0.2721 * (0.1571)3.6875
(6.8181)
−0.4491
(0.7921)
Average Temperature−0.0308 ** (0.0146)0.3211
(0.3151)
−0.0248
(0.1546)
−0.0170 (0.0121)−0.4684
(0.3184)
0.7873 *** (0.0758)0.1239 **
(0.0577)
5.3618 ***
(1.7287)
−0.5423 *
(0.3132)
0.0376 (0.0255)0.1206
(1.6210)
−0.2843
(0.3147)
0.0141 (0.0471)1.9069
(2.0420)
−0.6135 *** (0.2372)
Average Precipitation−0.0227 *** (0.0060)−0.2685 ** (0.1290)−0.1303 ** (0.0633)0.0022 (0.0048)0.0465
(0.1253)
−0.0061
(0.0298)
0.0238 ***
(0.0061)
−0.0255
(0.1830)
−0.0199
(0.0332)
0.0087 * (0.0050)−0.4249
(0.3167)
−0.0057
(0.0615)
−0.0100 (0.0066)−0.9550 *** (0.2874)0.0629 *
(0.0334)
Note: Entries report estimated VAR coefficients; standard errors are shown in parentheses. The lag order for each station-pair is indicated in the column headers as p (Tatvan–Tatvan: p = 3; Tatvan–Ahlat: p = 1; Gevaş–Van: p = 4; Gevaş–Erciş: p = 4; Gevaş–Muradiye: p = 4). ***, **, and * denote statistical significance at the 1%, 5%, and 10% levels, respectively.
Table 15. Autumn Season: Seasonal VAR Estimations.
VariablesTatvan–Tatvan (p = 1)Tatvan–Ahlat (p = 2)Gevaş–Van (p = 4)Gevaş–Erciş (p = 4)Gevaş–Muradiye (p = 4)
Lake Level TatvanAverage Precipitation TatvanAverage Temperature TatvanLake Level TatvanAverage Precipitation AhlatAverage Temperature AhlatLake Level GevaşAverage Precipitation van RegionAverage Temperature van RegionLake Level GevaşAverage Precipitation ErcişAverage Temperature ErcişLake Level GevaşAverage Precipitation MuradiyeAverage Temperature Muradiye
Average Lake Level0.8472 ***
(0.0613)
−2.4480
(6.2274)
0.0388
(0.5573)
0.1119
(0.1251)
−1.8369
(1.1583)
−0.0084
(0.0161)
−0.3607 ***
(0.0351)
−23.4886 ***
(5.3272)
1.1971 ***
(0.3266)
−0.2657 ***
(0.0723)
−31.9045 ***
(8.0843)
2.4634 ***
(0.5473)
−0.3694 ***
(0.0380)
3.4201
(12.6921)
1.3884
(1.3077)
Average Temperature0.0134 *
(0.0077)
−0.6023
(0.7840)
0.8116 ***
(0.0702)
1.8285 **
(0.9012)
7.5269
(8.3467)
−0.2998 **
(0.1163)
0.2118 ***
(0.0155)
−26.3879 ***
(2.3544)
0.5994 ***
(0.1444)
0.0318
(0.0230)
−7.1597 ***
(2.5732)
0.0679
(0.1742)
0.0689 ***
(0.0091)
−2.1052
(3.0429)
−0.6279 **
(0.3135)
Average Precipitation0.0037 ***
(0.0013)
0.0572
(0.1340)
0.0112
(0.0120)
−0.0038
(0.0128)
0.1836
(0.1188)
−0.0005
(0.0017)
0.0065 ***
(0.0009)
−1.1339 ***
(0.1362)
0.0552 ***
(0.0083)
0.0047 **
(0.0019)
−1.1033 ***
(0.2179)
0.0454 ***
(0.0148)
0.0077 ***
(0.0012)
−0.1284
(0.3967)
−0.0552
(0.0409)
Note: Entries report estimated VAR coefficients; standard errors are shown in parentheses. The lag order for each station-pair is indicated in the column headers as p (Tatvan–Tatvan: p = 1; Tatvan–Ahlat: p = 2; Gevaş–Van: p = 4; Gevaş–Erciş: p = 4; Gevaş–Muradiye: p = 4). ***, **, and * denote statistical significance at the 1%, 5%, and 10% levels, respectively.
Disclaimer/Publisher’s Note: The statements, opinions and data contained in all publications are solely those of the individual author(s) and contributor(s) and not of MDPI and/or the editor(s). MDPI and/or the editor(s) disclaim responsibility for any injury to people or property resulting from any ideas, methods, instructions or products referred to in the content.