Article

Artificial Intelligence Empowering New Quality Productive Forces of Enterprises: A Perspective on Supply Chain Resilience

by
Huan Shu
and
Chaofeng Li
*
Business School, Hohai University, Naijing 211100, China
*
Author to whom correspondence should be addressed.
Sustainability 2026, 18(4), 2062; https://doi.org/10.3390/su18042062
Submission received: 10 January 2026 / Revised: 30 January 2026 / Accepted: 5 February 2026 / Published: 18 February 2026

Abstract

Developing new quality productive forces represents a core strategy for steering China’s path to modernization and shaping new competitive advantages for the nation. As a leading technology in the new round of technological revolution and industrial transformation, artificial intelligence (AI) serves as a key engine for fostering new quality productive forces. Utilizing panel data from China’s A-share listed manufacturing firms (2012–2024), this study employs the penetration rate of industrial robots to proxy for AI development levels and the entropy method to measure new quality productive forces. From the perspective of supply chain resilience, ordinary least squares (OLS) and instrumental variable (IV) methods are employed to examine the impact of AI on enterprise new quality productive forces and its underlying mechanisms. The findings indicate that AI significantly enhances corporate new quality productive forces, a conclusion that remains robust after addressing potential endogeneity and conducting robustness checks. Mediation analysis reveals that AI reinforces corporate supply chain resilience by improving supply chain efficiency and strengthening supply chain discourse power, which in turn drives the enhancement of corporate new quality productive forces. Heterogeneity analysis indicates that the impact of AI on corporate new quality productive forces is heterogeneous, with particularly pronounced effects observed in firms with higher innovation levels, state-owned enterprises, and firms located in western China. This study contributes new evidence from a supply chain resilience perspective to understand the micro-level pathways through which AI empowers new quality productive forces, and offers targeted policy and managerial recommendations to foster the sustainable development of the manufacturing sector.

1. Introduction

In September 2023, during an inspection in Heilongjiang Province, General Secretary Xi Jinping introduced the concept of “new quality productive forces,” which has since garnered extensive discussion within academic circles [1]. He further emphasized that industrial chains should be structured around the development of new quality productive forces to enhance the resilience and security of industrial and supply chains [2]. This emphasis arises because, in the VUCA era characterized by impediments to globalization, the resilience of industrial and supply chains has become a focal point of strategic competition among major powers. Against this backdrop, China’s call to “accelerate the development of new quality productive forces” aims to foster innovation-driven, digitally empowered, green, and low-carbon advanced productivity. This is to be achieved through revolutionary technological breakthroughs, innovative allocation of production factors, and deep industrial transformation and upgrading. Achieving this strategic goal depends not only on individual breakthroughs in cutting-edge technologies but also on systematic capabilities that can efficiently translate such technologies into industrial competitive advantages. One of the core components of this systemic capability is the supply chain, often termed the “blood circulation system” of a modern economy.
Meanwhile, the widespread adoption of AI has introduced novel production methods, processes, and models in manufacturing firms. It accelerates the transformation of production factors into productive capabilities, serving as a new engine for developing new quality productive forces. From an innovation empowerment perspective, AI provides intelligent tools for manufacturing processes, fostering a new development paradigm characterized by bidirectional penetration [3]. In terms of efficiency empowerment, advanced AI algorithms optimize the allocation of both internal and external resources, thereby reducing operational costs [4]. Furthermore, by enabling the intelligent transformation of production processes and models, AI facilitates refined management practices [5]. From an information empowerment perspective, AI’s exceptional data analytics capabilities not only support managerial decision-making through deep mining of internal information but also enhance service precision and customer satisfaction by analyzing vast amounts of market and consumer data [6,7].
The advancement of AI is primarily reflected in two aspects: the enhancement of digital infrastructure and innovation in big data technologies [8]. Specifically, robust digital infrastructure helps eliminate information silos, improves the coordination efficiency of logistics, capital flow, and information flow within corporate supply chains, and strengthens firms’ bargaining power and overall competitiveness [9]. Additionally, digital infrastructure drives the diversification of supply chain structures. Facilities such as digital network platforms and big data hubs promote the clustering of upstream and downstream industries and facilitate data exchange [10]. This enables firms to swiftly and flexibly access higher-quality and more diverse customers and suppliers, thereby effectively enhancing risk resilience. Furthermore, AI provides firms with substantial market information and data support, empowering the refinement of supply chain management and the intelligence of risk control. Technologies such as the Internet of Things and big data analytics enable real-time monitoring of supply chain operations, dynamic tracking of logistics and inventory changes, and improved accuracy in demand forecasting [11]. These measures optimize production capacity efficiency while enabling early warnings of potential supply chain disruptions, thereby significantly strengthening supply chain resilience.
Traditional productivity research has primarily focused on either the upgrading of individual production factors—labor, means of labor, and objects of labor—or the partial optimization of production organization [12]. In contrast, the “new quality” of new quality productive forces represents a leap in total factor productivity and a fundamental transformation of the development model. However, this holistic and systematic transition cannot be realized on the basis of fragile, rigid, and vulnerable supply chains. It necessarily requires a supply chain endowed with a new quality—resilience. Supply chain resilience refers to the ability of a supply chain to prevent, absorb, adapt to, and quickly recover from internal and external disturbances—such as geopolitical conflicts, natural disasters, technological disruptions, and drastic demand shifts—returning to its original function or an improved state [13]. Resilience encompasses not only the foundational capacity to withstand shocks but also the ability to thrive amid change. Therefore, it is essential to examine the impact of AI on the new quality productive forces of manufacturing firms from the perspective of supply chain resilience and to analyze its underlying mechanisms in depth. Such research can provide evidence-based support for policymakers to optimize policy design and offer theoretical guidance for manufacturing firms to promote the development of new quality productive forces [14].
At the macro-regional level, scholars have examined the impact of artificial intelligence (AI) on economic high-quality development, population aging, and industrial chain resilience [15,16,17]. At the micro-enterprise level, scholars primarily utilize corporate annual reports to measure AI development levels, exploring its impact on ESG performance and financial allocation [18,19]. They find that AI can promote enterprise imports through financing effects and skill-upgrading effects [20]. Some scholars have also investigated the impact of AI on enterprise productivity or new quality productive forces, identifying mediating mechanisms such as technological innovation, resource allocation, and managerial cognition [21,22,23]. Li and Branstetter (2024) found that AI policies can enhance enterprise productivity [24]. Shen Kunrong et al. (2023) demonstrated that AI policies promote productivity through informatization, human capital, and capital channels [25]. Ouyang Jiawen and Mei Guo (2023) showed that AI significantly improves enterprise operating income and total factor productivity via “saving” and “enhancing” technologies [26]. Most existing studies on the impact of AI on new quality productive forces construct an AI evaluation index system through text analysis of corporate documents, calculate index weights using the entropy method, and then measure enterprise AI levels [27]. A few studies utilize industrial robot penetration rates to measure enterprise AI development levels and subsequently examine its impact on new quality productive forces. As a physical input indicator, the penetration rate of industrial robots offers a more objective, practical, and economically meaningful measure of AI application levels in manufacturing firms compared to data derived from text analysis methods.
The possible contributions of this study are threefold. First, based on panel data from China’s A-share listed manufacturing firms (2012–2024), it empirically examines the impact of artificial intelligence (AI) on new quality productive forces, thereby addressing the key question of how AI enables such development. Second, it reveals the mediating role of supply chain resilience in the relationship between AI development and new quality productive forces, offering a new theoretical and empirical perspective for future research. Third, it further investigates the heterogeneous effects of AI on new quality productive forces across firms with varying levels of innovation, different ownership types, and from different regions. This analysis provides more granular empirical evidence and refined decision-making insights for both policymakers and corporate managers.

2. Literature Review and Research Hypothesis

2.1. Artificial Intelligence and Enterprise New Quality Productive Forces

New quality productive forces emphasize qualitative advancements in laborers, means of labor, and objects of labor, along with their optimal integration. This evolution relies on breakthroughs in cutting-edge science and technology, which give rise to new business formats and models, thereby achieving dual leaps in labor productivity and resource utilization efficiency [28]. Schumpeter’s theory of innovation, integrated with endogenous growth theory, posits that technological progress drives economic growth through the mechanism of “creative destruction” [29]. Simultaneously, the resource-based view posits that a firm’s sustained competitive advantage stems from possessing core resources that are rare, valuable, difficult to imitate, and effectively configured [30]. As a key productive factor encompassing data, algorithms, and knowledge, AI constitutes a core technology of the new industrial revolution. It fosters an environment of creative destruction, enabling manufacturing firms to break free from traditional constraints on production relations and productivity levels. By enabling novel forms of production relations and productivity, AI drives the advancement of new quality productive forces in manufacturing firms. Furthermore, dynamic capability theory emphasizes that firms achieve adaptive capacity in dynamic environments by integrating, building, and reconfiguring both internal and external resources. From this perspective, AI itself can be conceptualized as a form of dynamic capability for firms. First, the application of AI enhances employees’ knowledge, skills, and innovative capabilities, thereby transforming human capital into a crucial non-quantifiable production factor [31]. Second, AI aids firms in optimizing resource utilization and reducing waste, enabling a more efficient allocation of labor resources [32]. Third, AI expands the scope of labor objects from tangible materials to intangible forms such as data and information. Thus, AI empowers workers to better transform and even create new objects of labor [33]. Specifically, the deep integration of AI with manufacturing can prompt manufacturing firms to actively pursue intelligent R&D, adopt intelligent technologies and equipment, and realize qualitative, efficiency, and dynamic transformations in their production processes. These advancements contribute to productivity growth and high-quality development [34]. Furthermore, the novelty and complexity of AI technology compel firms to recruit highly skilled workers, thereby accelerating the alignment of the workforce with the requirements of new quality productive forces [35]. Therefore, the following hypothesis is proposed:
Hypothesis 1.
Artificial intelligence is positively associated with the new quality productive forces of manufacturing enterprises.

2.2. The Intermediary Role of Supply Chain Resilience

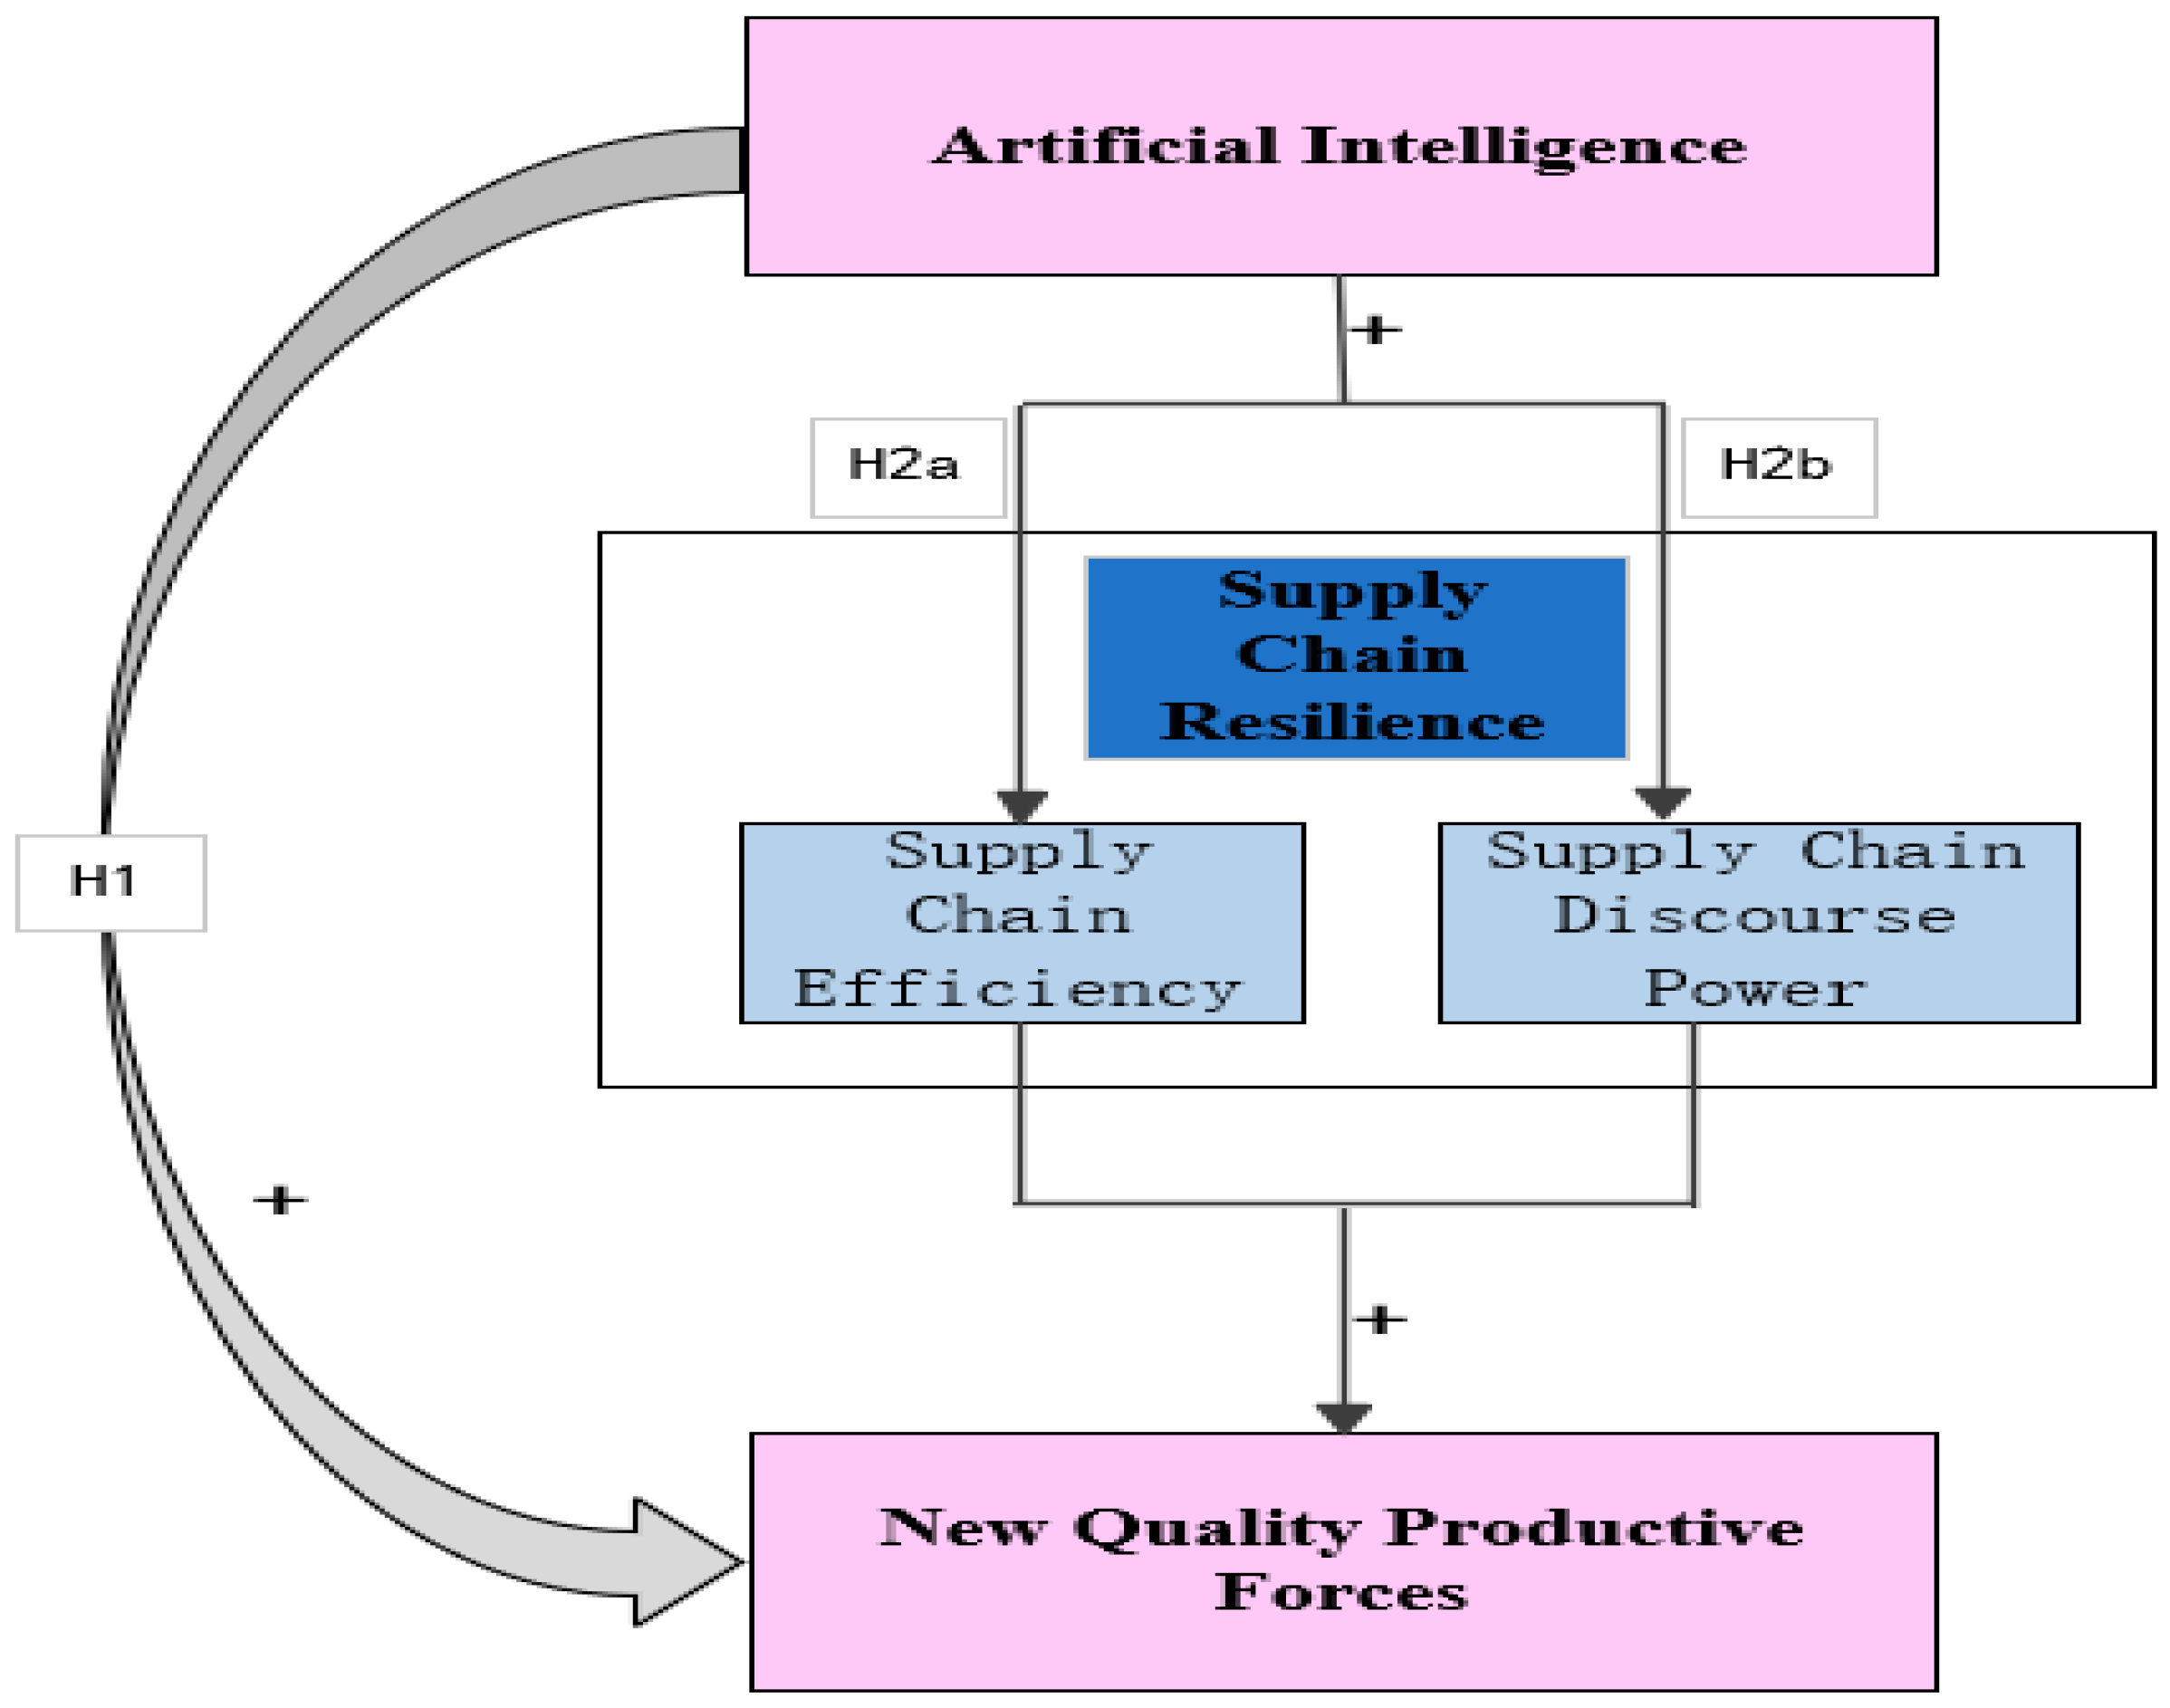
Supply chain resilience emphasizes the ability of the system to maintain stability and recover swiftly from both internal and external disruptions. AI can enhance supply chain resilience through two primary mechanisms, thereby fostering the development of new quality productive forces. The conceptual framework of these mechanisms is illustrated in Figure 1.
Supply chain efficiency pertains to the overall operational effectiveness of the supply chain system. Its improvement hinges primarily on mitigating information asymmetry and reducing transaction costs [36]. Process reengineering theory advocates re-examining business processes from a fresh management perspective, with the goal of radically redesigning the enterprise value chain to achieve a highly efficient and quality-driven system. In the AI era, intelligent technologies provide more powerful tools and methodologies for implementing process reengineering. On the one hand, integrating artificial intelligence technologies—such as demand forecasting algorithms, intelligent warehousing and logistics systems, and route optimization—into enterprise supply chain management can significantly reduce inventory costs, shorten delivery cycles, improve resource allocation accuracy, and enhance overall supply chain operational efficiency. This enhanced efficiency leads to lower operational costs and greater market responsiveness, directly contributing to the “high-efficiency” attribute of new quality productive forces [37]. Additionally, AI technology facilitates information integration and sharing among upstream and downstream supply chain partners. This helps mitigate the bullwhip effect, which is typically caused by information delays and opacity in traditional supply chains. Consequently, all supply chain participants gain access to real-time data. This enhanced information flow strengthens firms’ responsiveness to dynamic market conditions and promotes the integrated development of new quality productive forces [38,39]. Based on the above discussion, the following hypotheses are proposed:
Hypothesis 2a.
Artificial intelligence enhances enterprise new quality productive forces indirectly by improving supply chain efficiency.
Supply chain discourse power denotes the influence and control a firm exerts within its supply chain. This power is primarily manifested in the degree of dependence on customers or suppliers, bargaining power of upstream and downstream enterprises, flexibility of replacing supply chain partners, ability to formulate commercial credit terms and competitiveness in supply chain [40]. The theory of information asymmetry posits that in a market environment characterized by vast amounts of information and data, it is challenging for all participants to accurately and comprehensively access all relevant information. Consequently, firms that master a greater share of information are more likely to secure economic profits. Enterprises with advanced AI technologies often dominate information flows and logistics, positioning themselves as “chain masters” or critical nodes within the supply chain. This dominance enhances their bargaining power (i.e., discourse power) with both upstream suppliers and downstream customers, simultaneously reducing dependence on any single partner. Furthermore, the enhanced information transparency and analytical capabilities provided by AI enable firms to switch supply chain partners more flexibly during transactions, mitigate the risk of supply chain disruption, and negotiate commercial credit terms with greater precision and prudence [14]. These factors collectively strengthen a firm’s supply chain discourse power. On the one hand, enhanced supply chain discourse power allows firms to integrate high-quality resources more effectively, aligning with their strategic plans and market demands. This provides stable and efficient factor inputs, thereby supporting the “high-quality” development of new quality productive forces. On the other hand, it enables firms to perceive market dynamics more rapidly, avoid risks, and adjust procurement, production, inventory, and distribution strategies in a timely manner. This agility significantly reduces operational disruptions and efficiency losses, ultimately enhancing enterprise new quality productive forces [41]. Based on this, the following assumptions are proposed:
Hypothesis 2b.
Artificial intelligence enhances enterprise new quality productive forces indirectly by strengthening supply chain discourse power.

3. Study Design

3.1. Sample Source

This study employs a panel dataset consisting of A-share manufacturing listed companies in Shanghai and Shenzhen from 2012 to 2024, investigating the impact of artificial intelligence (AI) development on new quality productive forces over this 13-year sample. The sample is screened according to the following procedures: (1) ST and *ST companies are excluded; (2) observations with missing data are removed; (3) all continuous variables are winsorized at the 1st and 99th percentiles to reduce the impact of outliers. After applying these screening criteria, the final sample comprises 7952 firm-year observations. The data are obtained from the International Federation of Robotics (IFR) database and the CSMAR database.

3.2. Variable Design

3.2.1. Independent Variable

Considering that 2011 marks a pivotal year for industrial robot development in China and accounting for data availability, this study employs data from Chinese listed manufacturing firms spanning the period 2012 to 2024 for empirical analysis. Following Acemoglu and Restrepo [42] and Wang Yongqin and Dong Wen [43], robot penetration at the firm level for Chinese listed manufacturers is adopted as a proxy for the level of artificial intelligence development. The specific measurement procedure comprises the following steps:
The industry-level robot penetration, denoted as P R i t C H , is calculated as specified in Equation (1).
P R i t C H = M R i t C H L i , t = 2012 C H
Let M R i t C H denote the installed stock of industrial robots in Chinese industry i in year t. Let L I , t = 2012 C H represent the number of employees in Chinese industry i in the base year 2012. The penetration density of industrial robots, denoted as P R i t C H , is then defined as the ratio of the first two, representing the number of industrial robots per 10,000 employees in Chinese industry i in year t.
The firm-level industrial robot penetration index, denoted as A I j i t , is constructed as specified in Equation (2).
A I j i t = P W P j i , t = 2102 M a n u P W P t = 2012 × M R i t C H L i , t = 2012 C H
P W P j i , t = 2102 M a n u P W P t = 2012 represents the ratio of the proportion of production workers in firm j of Chinese manufacturing industry i in 2012 to the median proportion of production workers across all manufacturing firms in the same year. Using this ratio as a weight, the industrial robot penetration rate is disaggregated from the industry level to the firm level [44].

3.2.2. Instrumental Variable

Using American industry-level data, the instrumental variable A I _ U S j i t is constructed as specified in Equation (3).
A I _ U S j i t = P W P j i , t = 2102 M a n u P W P t = 2012 × M R i t U S L i , t = 1990 U S
Let M R i t U S represent the newly installed stock of industrial robots in American industry i in year t, and let L i , t = 1990 U S be the number of employees in American industry i in the base year 1990. The penetration rate of industrial robots in American industry i in year t is then calculated as M R i t U S L i , t = 1990 U S . This measure is selected as an instrumental variable at the enterprise level for China’s manufacturing industry to address potential endogeneity. The selection is justified by two key arguments. First, the state of industrial robot adoption in the United States in 1990 closely approximates the technological environment faced by China around 2012, thereby satisfying the relevance condition. Second, the penetration rate of industrial robots in the U.S. is plausibly exogenous to firm-specific, local factors in China, satisfying the exclusion restriction.

3.2.3. Dependent Variable

Gao Fan (2023) posits that productivity is derived from three fundamental elements: laborers, means of labor, and objects of labor [45]. Similarly, Pu Qingping and Xiang (2024) [46] characterize new quality productive forces as encompassing higher-quality labor, new media-based means of labor, and wider-ranging objects of labor. This conceptualization reflects an advanced stage of productivity distinguished by qualitative improvements across these three dimensions. In summary, academic literature broadly concurs that new quality productive forces consist of three core components: new laborers, new objects of labor, and new means of labor. This tripartite framework serves as a crucial theoretical foundation for studying the evolution of new quality productive forces. Building upon the studies of Li Xinru et al. and Zhang Xiue et al., and integrating the core concepts of “innovation” and “high quality” embedded within the tripartite framework of new quality productive forces, this study develops a comprehensive evaluation index system for enterprise new quality productive forces, as detailed in Table 1 [47,48]. Subsequently, the entropy method is employed to calculate indicator weights, thereby obtaining a composite measure for “new quality productive forces”. According to the research of Wang et al. [49], the calculation steps of the entropy method are as follows:
To eliminate the impact of differences in measurement units among various indicators on the study, it is necessary to remove dimensionality. Furthermore, prior to dimensionality removal, positive and negative indicators must be distinguished. Positive indicators are those for which larger values correspond to better evaluations, while negative indicators are those for which larger values correspond to poorer evaluations. All indicators selected in this paper are positive indicators, and the standardization process is as follows:
Y i j = X i j m i n X j m a x X j m i n X j
Calculate the proportion of indicator values:
w i j = Y i j i = 1 m Y i j
Calculate the entropy value of index j:
E j = 1 ln m i = 1 m w ij ln w i j
Calculate the coefficient of difference for each indicator:
D j = 1 E j
Calculate the weight of indicators:
φ j = D j i = 1 m D j
Calculate comprehensive index:
Z i = i = 1 m φ j × Y i j
Among them, i represents the subsystem, j represents the indicator, and X i j denotes the raw observed value of indicator j in subsystem i. Let m a x X j and m i n X j respectively denote the maximum and minimum values of indicator X i j across all years. Y i j represents the standardized value of each indicator, and w i j is the proportion of indicator values. E j is the entropy value of index j, and D j is the coefficient of difference for each indicator. φ j is the weight of each indicator, and Z i denotes the comprehensive index for individual i. Meanwhile, m represents the number of evaluation years.

3.2.4. Mediating Variable

Feng (2015) defines supply chain efficiency as the efficient coordination and operation of all links in supply chain management, reflected in the smooth circulation of products and services [50]. Following Zhang Shushan (2023) [51], this study employs inventory turnover days to measure supply chain efficiency. This metric is preferred over turnover rate because it more directly reflects the inventory “buffering” or “covering” time, aligning closely with the conceptual definition of supply chain efficiency. To mitigate the influence of extreme values, the natural logarithm of one plus inventory turnover days is used in the analysis.
Zhang Pengyang (2024) conceptualizes supply chain discourse power as the degree of control and influence a firm exerts over other participants in the supply chain, manifested through control over resources, information, and processes, as well as influence on partners and business decisions [52]. Supply chain concentration is an effective proxy for a firm’s ability to lead and control commercial activities within its supply chain. Firms with lower supply chain concentration typically possess greater discourse power. This is attributed to their diversified network of suppliers and customers, which reduces dependence on any single partner, increases bargaining flexibility, and lowers switching costs [53]. Accordingly, supply chain concentration is selected as the metric to measure supply chain discourse power. Specifically, following Mars et al. (2023) [54], supply chain discourse power is measured as the average of two ratios: the proportion of purchases from the top five suppliers and the proportion of sales to the top five customers.
Both of these component ratios are inverse indicators; a higher value signifies lower supply chain concentration and thus greater discourse power.

3.2.5. Control Variables

To mitigate the potential bias arising from omitted variables, the following control variables are selected based on corporate governance considerations: leverage ratio (Lev), growth rate (Growth), return on equity (Roe), share proportion of the largest shareholder (Top1), combination of two jobs (Dual), firm age (Age), nature of the property right (Own), and firm size (Size). All variable definitions are detailed in Table 2.

3.3. Modeling

To examine the direct impact of the development level of artificial intelligence on the new quality productive forces of enterprises, the following ordinary least squares (OLS) regression model (10) is specified:
N q p i t = α 0 + α 1 A I i t + α 2 C o n t r o l s i t + μ i + θ t + ε i t
In the model, N q p i t serves as the dependent variable, reflecting the development level of new quality productive forces. A I i t denotes the independent variable, representing the level of artificial intelligence development. C o n t r o l s i t represents a set of control variables. The subscripts i and t index individual firms and years, respectively. And, firm and year fixed effects are denoted by μ i and θ t respectively, while ε i t captures the idiosyncratic error component.
To further investigate the mechanism through which enterprise artificial intelligence (AI) affects new quality productive forces, mediation effect models (11) and (12) are constructed based on model (10).
M i t = β 0 + β 1 A I i t + β 2 C o n t r o l s i t + μ i + θ t + ε i t
N q p i t = γ 0 + γ 1 A I i t + γ 2 M i t + γ 3 C o n t r o l s i t + μ i + θ t + ε i t
M i t is an intermediary variable, which represents supply chain efficiency (Sce) and supply chain discourse power (Scc) respectively.

4. Empirical Analysis

4.1. Descriptive Statistic

Descriptive statistics are shown in Table 3. The maximum value of new quality productive forces (Nqp) is 38.01, while the minimum is 1.271, substantially lower than the mean of 12.63. This indicates large differences in the level of Nqp among listed manufacturing firms in China at this stage. The range of the AI is 8.117, with a mean of 2.967. This suggests an uneven distribution of AI development levels across the sample of listed manufacturing firms in China. In addition, correlation analysis results show that there is a significant correlation between the dependent variable and the independent variable, and the VIF values of all variables range from 1.02 to 1.51, well below the common threshold of 10. This indicates that multicollinearity is unlikely to pose a serious issue in this study.

4.2. Baseline Regression Analysis

Based on Hypothesis 1, an ordinary least squares (OLS) regression model was developed and estimated using Stata 18. The corresponding results are reported in Table 4.
Table 4 reports the regression results analyzing the relationship between the level of AI development (AI) and new quality productive forces (Nqp) among listed manufacturing firms in China. The results in column (1) indicate that the level of AI development has a statistically significant positive impact on enterprise new quality productive forces at the 1% level. After adding control variables in column (2), the coefficient for AI development remains positive and statistically significant, confirming the robustness of the initial finding. This supports Hypothesis 1. The increasing adoption of AI facilitates more efficient resource allocation and enhances information integration within manufacturing firms. It further contributes to the reshaping of the three key productivity factors—leading to more innovative workers, intelligent means of labor, and digital objects of labor—thereby promoting the development of new quality productive forces.

4.3. Endogenetic Test

4.3.1. Instrumental Variable Method

Considering that there may be a causal relationship between the development level of artificial intelligence and the new quality productivity of enterprises, an instrumental variable (IV) approach is employed. Following Liu Hongwei and Tan Min (2025) [44], the penetration degree of American industrial robots (denoted as AI_US) is selected as the instrumental variable for the AI development level. This variable is argued to satisfy the key conditions of correlation and exclusivity at the same time. The results of the two-stage least squares (2SLS) regression are presented in Table 5.
First-Stage Results: The coefficient on the instrumental variable AI_US is 1.187 and statistically significant at the 1% level. Therefore, the null hypothesis of a weak instrumental variable can be explicitly rejected. Meanwhile, the correlation between the instrumental variable AI_US and the endogenous variable AI satisfies the first condition of instrumental variable validity. Moreover, the first-stage F-statistic is 2812.11, significantly exceeding both the conventional rule-of-thumb threshold of 10 and the more rigorous Stock-Yogo critical value of 16.38 at the 10% maximal IV size. This offers robust evidence against the existence of weak instruments.
2SLS Estimation Results: After accounting for endogeneity, the estimated coefficient for AI is 0.378, which remains both positive and statistically significant at the 1% level. This 2SLS estimate is slightly lower than the corresponding OLS coefficient of 0.410 in the baseline model, indicating a potential upward bias in the OLS result, likely due to measurement error or the exclusion of unobservable factors that are positively associated with AI.
To sum up, after addressing endogeneity via the instrumental variable AI_US, the core conclusion of this paper that “AI significantly promotes new quality productivity” remains robust. The slightly lower 2SLS coefficient further suggests that the OLS estimate in the benchmark model may have been upwardly biased. This robustness check strengthens the reliability of the study’s main conclusion.

4.3.2. Propensity Score Matching

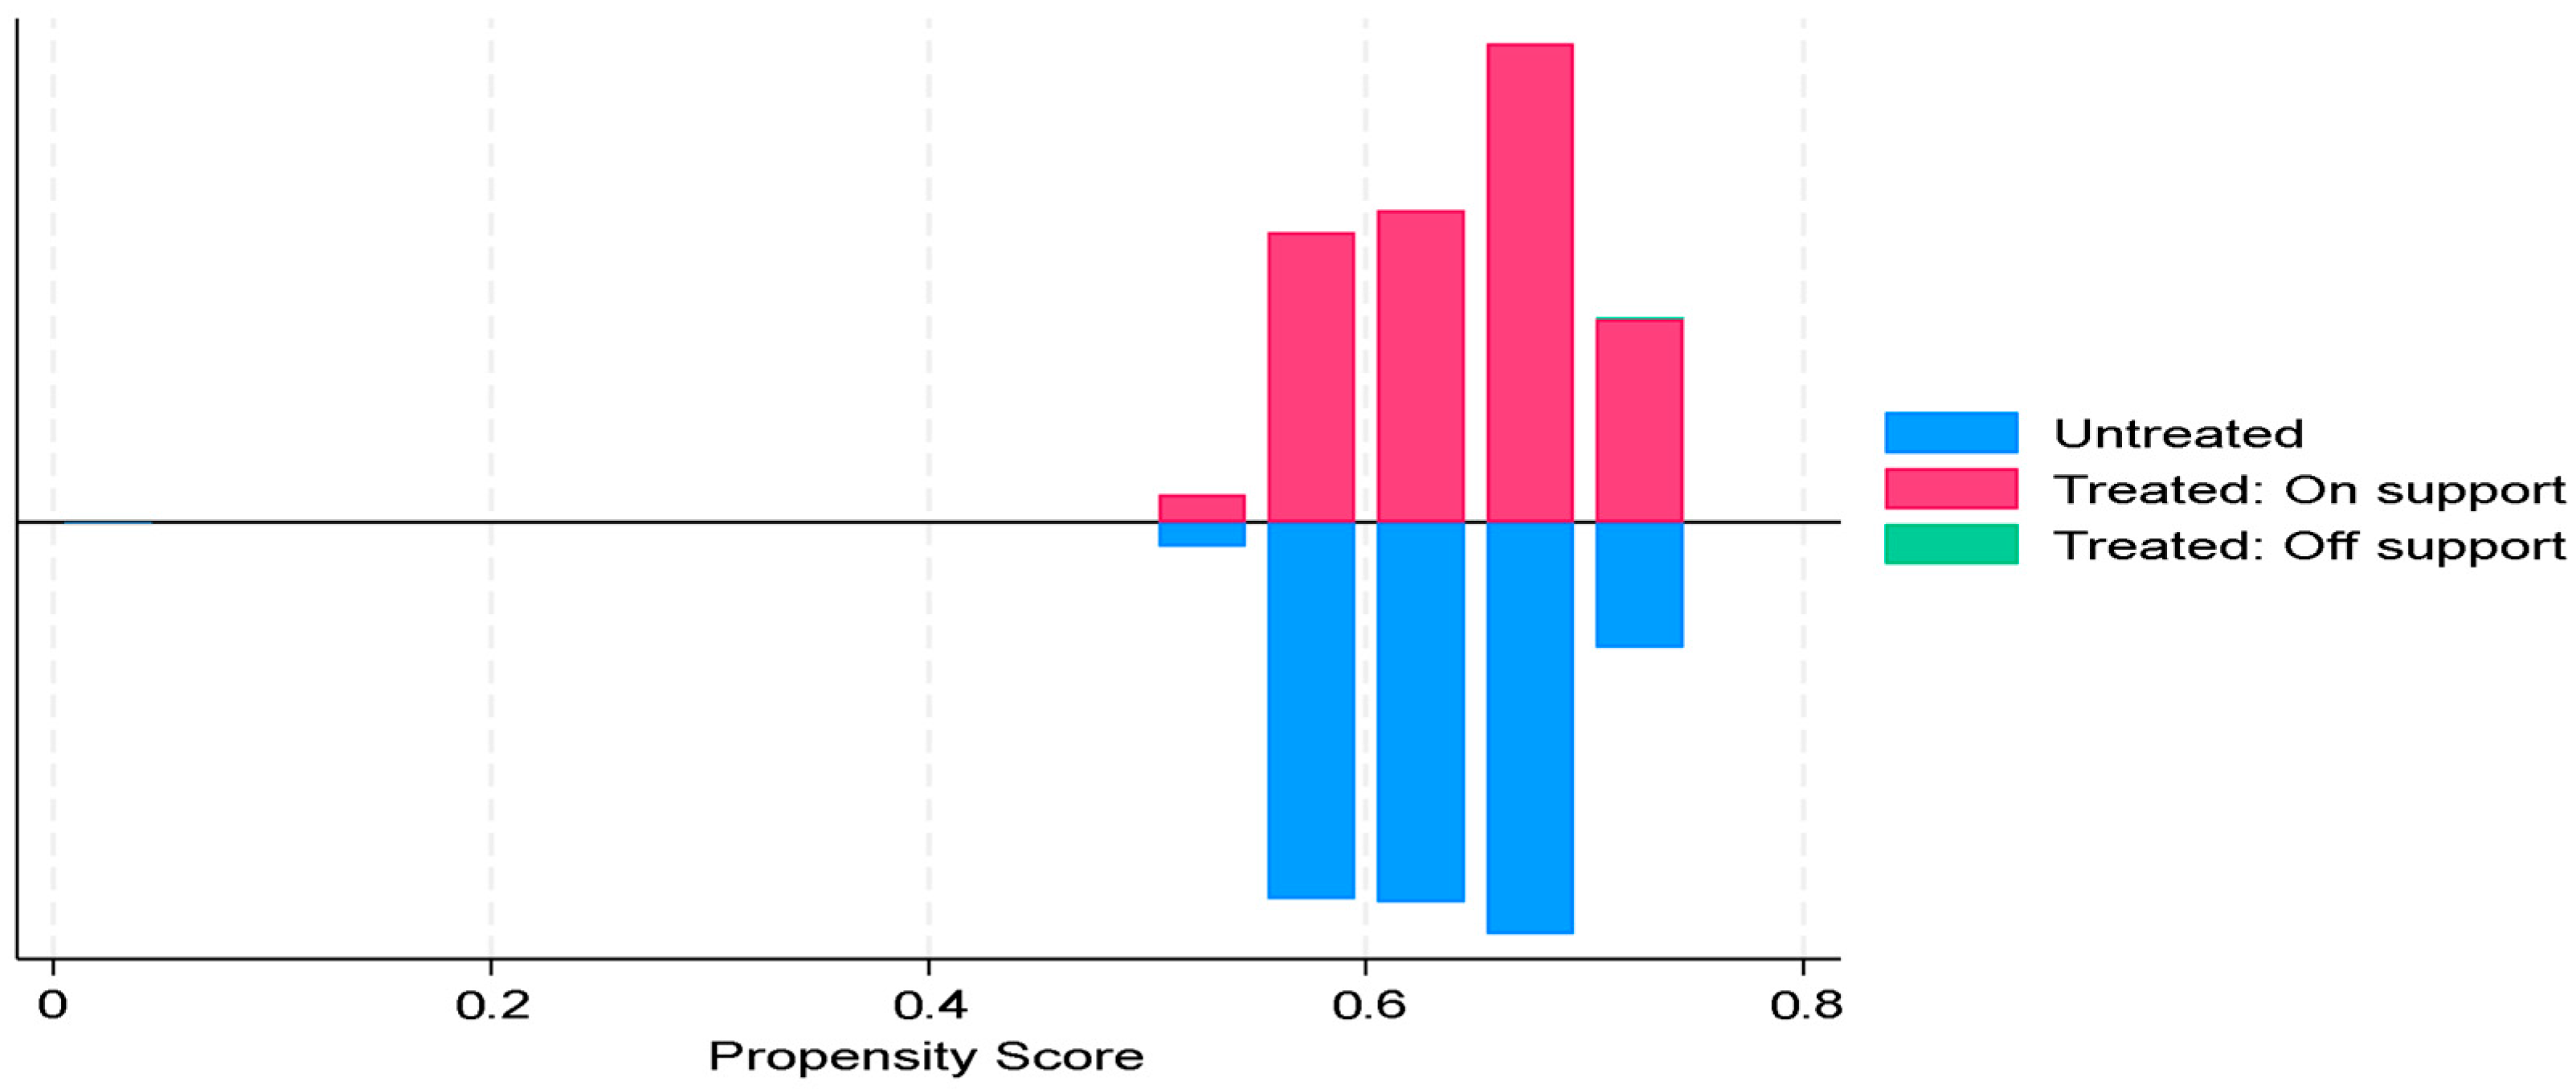
In the first step, the samples were divided into a high AI group and a low AI group based on the median of the AI index. In the second step, using the control variables as covariates, Logit model was used to estimate the propensity score. And the control group samples most similar to the treatment group were identified through 1:1 nearest neighbor matching. Figure 2 illustrates the trend of the propensity scores before and after matching for both groups. Given the parallel trends observed in both groups, it can be inferred that the systematic differences between the treatment and control groups are minimal. In the third step, OLS regression is performed using the matched control group and the original experimental group. As reported in Table 5, the coefficient for AI remains positive and statistically significant at the 1% level. This result corroborates the robustness of the benchmark estimation.

4.4. Robustness Tests

4.4.1. Alternative Sample

To mitigate the potential confounding effects of the COVID-19 pandemic on the manufacturing sector, the sample period is restricted to 2012–2019. The corresponding regression results are presented in column (1) of Table 6.
In addition, in order to control for the potential impact at the city level where the enterprises are located, the observed values from the four municipalities in China are excluded. As shown in column (2) of Table 6, the positive association between AI and new quality productive forces retains statistical significance after removing these observations, confirming the robustness of the main finding.

4.4.2. Alternative Dependent Variable

Given that enhancements in total factor productivity (TFP) are frequently regarded as a reflection of new quality productive forces, this study adopts the OP method to compute the TFP of the sample firms, consistent with the methodology employed by Liu Hongwei (2025) [44]. The corresponding regression results are presented in column (3) of Table 6. After replacing the dependent variable with TFP_OP, the coefficient for AI remains positive and statistically significant at the 1% level. This finding is consistent with the benchmark regression results. Thus, Hypothesis 1 is again supported. At the same time, the measure of new quality productive forces obtained through the OP method demonstrates a stronger association with the level of AI development.
Furthermore, since the measure of new quality productive forces in the benchmark regression is constructed as an indicator system based on the dimensions of “new labor, new means of labor, and new objects of labor,” potential measurement errors may influence the results. Therefore, drawing on the research of Song Jia et al. [55,56], this paper reconstructs an alternative indicator system to measure the level of new quality productive forces (denoted as Npro). As detailed in Table 7, all selected indicators are positive. The regression results using this alternative measure are reported in column (4) of Table 6. With the alternative dependent variable (Npro), the coefficient for AI remains positive and statistically significant at the 1% level, providing further support for Hypothesis 1.

5. Intermediary Mechanism Test

Table 8 displays regression results concerning supply chain efficiency in columns (1) and (2). Column (1) reveals a negative and statistically significant coefficient for the artificial intelligence development level at the 1% significance level, indicating that AI advancement contributes to improved supply chain efficiency within enterprises. This enhancement can be attributed to the widespread adoption of AI in manufacturing, which reduces transaction costs and improves information transparency, thereby improving supply chain efficiency. Column (2) shows that after controlling for AI, the coefficient for supply chain efficiency is negative and statistically significant at the 10% level. This suggests that higher supply chain efficiency is associated with improved enterprise new quality productive forces. In summary, these results indicate that the adoption of AI in manufacturing enterprises can enhance new quality productive forces through improvements in supply chain efficiency, thereby supporting Hypothesis H2a. This suggests that efficient supply chain operations enable firms to better absorb external shocks and optimize resource allocation, which in turn facilitates the advancement of new quality productive forces.
Columns (3) and (4) of Table 8 present the regression results pertaining to supply chain discourse power. Column (3) indicates a negative and statistically significant coefficient for the AI development level at the 1% significance level. This result implies that artificial intelligence development strengthens an enterprise’s supply chain discourse power. This outcome is primarily driven by artificial intelligence development, which significantly alleviates information asymmetry between upstream and downstream manufacturing firms and enhances information sharing. As a result, enterprises achieve accelerated response capabilities and strengthened bargaining power in dynamic market conditions, alongside a reduced reliance on individual customers or suppliers. These improvements collectively enhance the discourse power of otherwise disadvantaged enterprises within the supply chain. Column (4) reveals that, after accounting for the level of artificial intelligence development, the coefficient for supply chain bargaining power remains negative and statistically significant at the 1% level. This indicates that enhanced supply chain discourse power is associated with the development of enterprise new quality productive forces. In summary, these results suggest that AI in manufacturing enterprises contributes to the development of new quality productive forces by strengthening supply chain discourse power, thereby providing empirical support for Hypothesis H2b. Therefore, by strengthening supply chain discourse power, AI can empower a broader range of enterprises to lead industrial transformation and upgrading. This process releases innovation potential, ultimately enhancing enterprise new quality productive forces.

6. Heterogeneity Analysis

6.1. Enterprise Innovation Level

The innovation level of enterprises is quantified by taking the natural logarithm of one plus the total number of patents granted. Using this metric, the sample is stratified into high-innovation (above the sample mean) and low-innovation (below the sample mean) subgroups, followed by separate regression analyses for each category. The estimation results in columns (1) and (2) of Table 9 indicate that while AI promotes new quality productive forces in both groups, its effect is significantly stronger for firms in the high-innovation group compared to those in the low-innovation group.
Further analysis suggests that high-innovation enterprises can allocate and utilize resource elements more efficiently, thereby facilitating the development of new quality productive forces. Furthermore, the management structures of high-innovation firms tend to be more flexible, which facilitates cross-departmental data collaboration and resource sharing. This efficient allocation and sharing of data elements enable their effective transformation into new quality productive forces, thereby driving productivity improvements.

6.2. Nature of Enterprise Property Rights

Compared to state-owned enterprises, non-state-owned enterprises face inherent disadvantages in risk-taking capacity, resource acquisition, and market competition. To examine potential differences in the impact of AI on new quality productive forces based on firm ownership, this paper divides all samples into two sub-samples: state-owned enterprises and non-state-owned enterprises. The test results shown in columns (3) and (4) of Table 9 indicate that the effect of AI development on new quality productive forces is more significant for state-owned enterprises than for non-state-owned enterprises.
Further analysis suggests that state-owned enterprises typically possess greater capital strength. This facilitates their engagement in high-investment, long-cycle, and high-risk scientific and technological innovation projects. In contrast, non-state-owned enterprises face significant constraints in resource acquisition, technology investment, and the depth of application. Their lower tolerance for the failure of intelligent innovation projects further limits the positive impact of AI on their new quality productive forces.

6.3. Regional Characteristics of Enterprise

A substantial body of literature indicates that artificial intelligence can significantly improve the level of regional new quality productive forces and exhibits positive spatial spillover effects. However, regional development imbalances remain pronounced [57,58]. Therefore, it can be inferred that artificial intelligence may also exacerbate existing regional development disparities while promoting new quality productive forces of enterprises. Following the regional classification criteria proposed by Li Yang (2024) and Wang Jijia (2025), the sample is categorized into three distinct subsamples—eastern, central, and western regions—for separate regression analysis [59,60]. The results presented in columns (2), (3), and (4) of Table 10 show that the effect of AI on enterprise new quality productive forces follows a descending order: strongest in the western region, followed by the eastern region, and weakest in the central region.
To further analyze the underlying reasons, supported by digital infrastructure such as information technology and big data, western China has in recent years benefited from robust policy support and investment-driven initiatives. This has enabled the region to leverage catch-up effects and late-mover advantages. The economically developed eastern region maintains an absolute lead in innovation. However, it exhibits limited marginal gains from AI, attributable to strong technological path dependence, high sunk costs, and institutional inertia in its ongoing intelligent transformation. Meanwhile, the central region, geographically situated between the east and the west, faces bidirectional siphon effects and developmental pressure from both sides. Furthermore, it lacks comparative advantages in terms of policy support and investment intensity specifically for AI development. This lack of relative advantage consequently results in a less pronounced effect on the enhancement of new quality productive forces.

7. Research Findings and Policy Recommendations

7.1. Research Findings

Utilizing panel data from A-share manufacturing firms listed in Shanghai and Shenzhen (2012–2024), this study examines the impact of AI on enterprise new quality productive forces. The main findings are as follows: (1) Artificial intelligence significantly enhances new quality productive forces of enterprises. This finding remains robust after addressing potential endogeneity and conducting robustness tests. (2) Mechanism analysis indicates that AI fosters supply chain resilience primarily by improving supply chain efficiency and strengthening supply chain discourse power. Furthermore, this enhanced resilience contributes to the improvement of new quality productive forces of enterprises. (3) Heterogeneity analysis reveals that the effect of AI on new quality productive forces varies significantly across firms with different levels of innovation, ownership types (state-owned vs. non-state-owned), and geographical locations. Specifically, the productivity-enhancing effect of AI is more pronounced for firms with high innovation levels and for state-owned enterprises. Regarding regional heterogeneity, the positive impact of AI on new quality productive forces is strongest for firms in the western region, followed by those in the eastern region, and weakest for those in the central region.

7.2. Policy Suggestion

(1)
To accelerate the development of new quality productive forces, the government should focus on top-level design and fostering an enabling intelligent ecosystem.
Given that AI has reached a stage of large-scale application and industrial integration globally, accelerating the intelligent transformation of China’s manufacturing sector is imperative. First, the government should expedite the implementation of a specialized “AI + Manufacturing” action plan. This includes establishing a supportive financial system and preferential tax policies to incentivize manufacturing firms to enhance their AI development and application. Second, efforts should be made to improve data infrastructure and factor supply guarantees. Proactively strengthening the foundational supply of intelligent computing power is crucial to lowering the costs associated with AI development for enterprises. Third, forward-looking governance must be strengthened by constructing a corresponding institutional framework. This involves proactively researching and promulgating policies—including data element circulation rules, algorithm audit and ethics guidelines, anti-monopoly regulations for the platform economy, and labor protection measures for new forms of employment—to steer the AI-driven development of new quality productive forces towards fairness, inclusiveness, and safety.
(2)
Enterprises should actively advance their AI-driven transformation to foster the development of new quality productive forces.
Manufacturing firms should proactively leverage intelligent technologies and supportive policies to facilitate their transformation and upgrading. First, enterprises should define clear goals and roadmaps for intelligent transformation. This involves strengthening investment in AI technology research and development (R&D), which includes the development or procurement of advanced intelligent equipment, systems, and platforms. Second, it is crucial to cultivate and recruit “digital talent.” Developing a workforce of interdisciplinary professionals who understand both industry-specific technologies and pain points as well as AI technology is essential for ensuring a smooth, intelligent transformation. Third, enterprises should actively pursue in-depth collaboration with research institutions and universities. Such partnerships can jointly advance the R&D and application of AI technologies, thereby accelerating the incubation and commercialization of new technologies. Last but not least, enterprises should fully utilize AI technologies to enhance their supply chain resilience. For instance, firms could establish secure data-sharing platforms for core production data, thereby integrating data chains and eliminating information silos within the supply chain. Alternatively, developing a shared data platform with core functions like dynamic risk early-warning and intelligent matching of alternative suppliers would strengthen the emergency management capabilities of the supply chain.
(3)
Governments should formulate and implement differentiated intelligent transformation policies tailored to local conditions to ensure targeted and precise interventions.
As heterogeneity analysis indicates, the impact of AI on enterprises’ new quality productive forces varies significantly across dimensions including innovation capacity, ownership structure, and geographical location. Consequently, promoting differentiated AI development models is essential for achieving balanced and coordinated progress across all enterprise types and regions. Policy design should therefore not only support firms with a solid foundation for transformation (e.g., those with high innovation levels, state-owned enterprises, and firms in the western region) but also appropriately tilt towards enterprises with relatively weak intelligent infrastructure. Firstly, priority should be given to supporting enterprises with low to medium innovation scale through the establishment of industry-wide public service platforms for intelligent transformation. These platforms should provide comprehensive, full-process support encompassing funding, talent, and technology. Second, emphasis should be placed on assisting non-state-owned enterprises in lowering their intelligent transformation costs by implementing macroeconomic policies such as fiscal subsidies and tax incentives. Additionally, state-owned enterprises should be encouraged to collaborate with and provide support to non-state-owned enterprises. Third, special policy attention should be directed toward fostering the intelligent development of firms in the central region. This entails increasing investment and policy support for the region, while also promoting cross-regional exchanges and cooperation to facilitate the transfer of successful transformation experiences from the western and eastern region.

Author Contributions

Conceptualization, H.S.; Methodology, H.S.; Formal analysis, C.L.; Investigation, C.L.; Data curation, C.L.; Writing—original draft, C.L.; Writing—review and editing, C.L.; Supervision, H.S. All authors have read and agreed to the published version of the manuscript.

Funding

This research received no external funding.

Institutional Review Board Statement

Not applicable.

Informed Consent Statement

Not applicable.

Data Availability Statement

The data presented in this study are available on request from the corresponding author due to the incomplete completion of the research group’s related studies.

Conflicts of Interest

The authors declare no conflicts of interest.

References

  1. Wang, Q.; Ma, L. Mechanisms and pathways of industrial transformation in resource-based cities driven by new quality factors. J. Nat. Resour. 2026, 41, 308–326. [Google Scholar] [CrossRef]
  2. Wang, X.; Huang, Q. Promoting High-Quality Development by Focusing on Developing New Productive Forces. People’s Daily, 3 December 2024. [Google Scholar]
  3. Zhang, G.; Wang, X.; Xie, J.; Hu, Q. A mechanistic study of enterprise digital intelligence transformation, innovation resilience, and firm performance. Systems 2024, 12, 186. [Google Scholar] [CrossRef]
  4. Wang, D.; Shao, X. Research on the impact of digital transformation on the production efficiency of manufacturing enterprises: Institution-based analysis of the threshold effect. Int. Rev. Econ. Financ. 2024, 91, 883–897. [Google Scholar] [CrossRef]
  5. Wan, J.; Li, X.; Dai, H.N.; Kusiak, A.; Martinez-Garcia, M.; Li, D. Artificial-intelligence-driven customized manufacturing factory: Key technologies, applications, and challenges. Proc. IEEE 2020, 109, 377–398. [Google Scholar] [CrossRef]
  6. Dou, R.; Zhuang, G.; Liu, X.; Hou, Y.; Sun, J. Potential of AI for service performance of manufacturers: Analytical and empirical insights. Adv. Eng. Inform. 2024, 60, 102383. [Google Scholar] [CrossRef]
  7. Manser Payne, E.H.; Dahl, A.J.; Peltier, J. Digital servitization value co-creation framework for AI services: A research agenda for digital transformation in financial service ecosystems. J. Res. Interact. Mark. 2021, 15, 200–222. [Google Scholar] [CrossRef]
  8. An, Q.; Wang, Y.; Yang, M.; Liu, F. Big Data Development and Corporate Supply Chain Resilience: Quasi-Natural Experiment Based on the National Big Data Comprehensive Pilot Zone. J. Manag. 2025, 38, 101–113. [Google Scholar]
  9. Feng, Y.; Dai, J.; Zhang, L. Digital infrastructure and income disparities: A quasi-natural experiment based on the “Broadband China” strategy. Int. Rev. Econ. Financ. 2025, 102, 104350. [Google Scholar] [CrossRef]
  10. Mageto, J. Big data analytics in sustainable supply chain management: A focus on manufacturing supply chains. Sustainability 2021, 13, 7101. [Google Scholar] [CrossRef]
  11. Belhadi, A.; Mani, V.; Kamble, S.S.; Khan, S.A.R.; Verma, S. Artificial intelligence-driven innovation for enhancing supply chain resilience and performance under the effect of supply chain dynamism: An empirical investigation. Ann. Oper. Res. 2024, 333, 627–652. [Google Scholar] [CrossRef]
  12. Liu, D.; Wang, X.; Wang, S.; Shi, Y. New Quality Productivity Empowers Enterprise Resilience: An Analysis Framework Based on New Production Relations and Production Factors. Collect. Essays Financ. Econ. 2025, 41, 15–25. [Google Scholar]
  13. Tao, F.; Wang, X.; Xu, Y.; Zhu, P. Digital Transformation, Resilience of Industrial Chain and Supply Chain, and Enterprise Productivity. China Ind. Econ. 2023, 118–136. [Google Scholar]
  14. Wang, Y.; Hu, H. Empowering New Quality Productivity of Enterprises through Digital Transformation in the Process of Chinese Path to Modernization: From the Perspective of Supply Chain Resilience. J. Hohai Univ. Philos. Soc. Sci. 2024, 26, 139–150. [Google Scholar]
  15. Gao, Z.; Tian, F.; Han, Y. Theoretical Mechanism and Empirical Analysis of the Impact of Artificial Intelligence on the High-quality Development of China’s Regional Economy: Taking Industrial Robots as an Example. Sci. Technol. Manag. Res. 2023, 43, 182–192. [Google Scholar]
  16. Song, J. From “suitable for old age” to “intelligent wealth”: “U-shaped” effect and appropriate boundary of common wealth enabled by artificial intelligence. Contemp. Econ. Manag. 2026, 48, 75–84. [Google Scholar]
  17. Jia, W.; Jiang, Z. A study on the impact of artificial intelligence applications on industry chain resilience: A digital innovation ecosystem-driven perspective. Sci. Res. Manag. 2025, 46, 23–32. [Google Scholar]
  18. Xu, J.; Shen, H.; Zhou, X. Artificial Intelligence Development and Corporate ESG Performance. World Econ. Stud. 2024, 120–134+137. [Google Scholar]
  19. Feng, W. Artificial Intelligence and Corporate Financial Asset Allocation: Empirical Evidences from the National AI Innovation and Application Pioneer Zone. Contemp. Financ. Econ. 2024, 4, 141–152. [Google Scholar]
  20. Xin, D.; Qiu, Y. Research on the Influence of Artificial Intelligence on Import Expansion: Evidence from the Firm-level Data in China. World Econ. Stud. 2023, 15, 11–25+135. [Google Scholar]
  21. Ye, Y.; Ma, W.; Wu, X.; Zhao, J. The Impact of AI-Industrial Technology Convergence on Product Innovation Performance in Manufacturing Firms. China Ind. Econ. 2025, 150–168. [Google Scholar]
  22. Zhai, K.; Liu, X. Artificial Intelligence, Resource Allocation Efficiency and Regional Coordinated Development: An Empirical Analysis based on Dynamic Spatial Panel Data from Prefecture-Level Cities in the Yangtze River Delta. J. Tech. Econ. Manag. 2025, 39–46. [Google Scholar]
  23. Wang, M.; Li, Y.; Wang, J. Artificial Intelligence Applications, Executive Cognition, and Corporate ESG Performance. J. Beijing Technol. Bus. Univ. Soc. Sci. 2025, 40, 46–58. [Google Scholar]
  24. Liu, H.; Ren, J. Intelligent manufacturing policy, ESG performance, and total factor productivity: Evidence from China. PLoS ONE 2025, 20, e0311369. [Google Scholar] [CrossRef]
  25. Shen, K.; Qiao, G.; Lin, J. Intelligent Manufacturing Policy and High-Quality Development of Chinese Enterprises. J. Quant. Technol. Econ. 2024, 41, 5–25. [Google Scholar]
  26. Ouyang, J.; Mei, G.; He, J.; Ji, K. Artificial Intelligence Empowering High-Quality Enterprise Development. Contemp. Financ. Econ. 2025, 1–22. [Google Scholar]
  27. Liu, X.; Xu, W. How Artificial Intelligence Level Affects Urban Entrepreneurship Activity: An Empirical Test from 283 Prefecture-level Cities in China. China Bus. Mark. 2026, 1–15. [Google Scholar]
  28. Zhou, W.; Xu, L. Further Discussion on New Quality Productive Forces: Misunderstandings, Formation Conditions, and Implementation Paths. Reform 2024, 3, 26–37. [Google Scholar]
  29. Aghion, P.; Howitt, P. A Model of Growth Through Creative Destruction. Econometrica 1992, 60, 323–351. [Google Scholar] [CrossRef]
  30. Barney, J. Firm Resources and Sustained Competitive Advantage. J. Manag. 1991, 17, 99–120. [Google Scholar] [CrossRef]
  31. Ren, M.; Chen, N.; Qiu, H. Human-machine collaborative decision-making: An evolutionary roadmap based on cognitive intelligence. Int. J. Soc. Robot. 2023, 15, 1101–1114. [Google Scholar]
  32. Truong, Y.; Papagiannidis, S. Artificial intelligence as an enabler for innovation: A review and future research agenda. Technol. Forecast. Soc. Change 2022, 183, 121852. [Google Scholar] [CrossRef]
  33. Zhang, C.; Lu, Y. Study on artificial intelligence: The state of the art and future prospects. J. Ind. Inf. Integr. 2021, 23, 100224. [Google Scholar] [CrossRef]
  34. Xu, H.; Wang, J. Artificial Intelligence and New-quality Productive Force in Manufacturing Enterprises: Based on Double Machine Learning Model. Soft Sci. 2025, 39, 26–33. [Google Scholar]
  35. Ning, N.; Hui, N. Artificial Intelligence Driving the Development of New Quality Productive Forces in Manufacturing Industry: Based on the Total Factor Productivity Perspective. Inq. Into Econ. Issues 2025, 1–22. [Google Scholar]
  36. Li, Q.; Liu, L.; Shao, J. The Effects of Digital Transformation and Supply Chain Integration on Firm Performance: The Moderating Role of Entrepreneurship. Bus. Manag. J. 2021, 43, 5–23. [Google Scholar]
  37. Shao, X.; Xi, K. Does Artificial Intelligence Promoted New Quality Productivity Cohort Effects? Front. Sci. Technol. Eng. Manag. 2025, 1–12. [Google Scholar]
  38. Research Group of Institute of Industrial Economics, China Academy of Social Sciences. Research on the Path of Upgrading the Modernization of Industrial Chain and Supply Chain. China Ind. Econ. 2021, 80–97. [Google Scholar]
  39. Sun, Y.; Liu, X.; Song, J.; Chen, J. A Study on the Mechanism of New Quality Productivity of Digital Enabling Enterprises. Foreign Econ. Manag. 2025, 1–16. [Google Scholar]
  40. Huang, X.; Jia, M.; Wang, Y. Discourse Power in Industrial Chain and the Financial Investment of Non-financial Enterprises Based on the Perspective of Industry Chain of Commercial Credit Level. Account. Res. 2022, 5, 118–130. [Google Scholar]
  41. Li, Y.; Peng, D.; Su, Y. Data Elements, Supply Chain Resilience and New Quality Productivity of Enterprises. Enterp. Econ. 2025, 44, 17–28. [Google Scholar]
  42. Acemoglu, D.; Restrepo, P. Robots and Jobs: Evidence from US Labor Markets. J. Political Econ. 2020, 128, 2188–2244. [Google Scholar] [CrossRef]
  43. Wang, Y.Q.; Dong, W. How the Rise of Robots Has Affected China’s Labor Market: Evidence from China’s Listed Manufacturing Firms. Econ. Res. J. 2020, 55, 159–175. [Google Scholar]
  44. Liu, H.; Tan, M. Research on the influence of artificial intelligence on the new quality productive forces of the NEV industry. Sci. Res. Manag. 2025, 46, 33–44. [Google Scholar]
  45. Gao, F. The Logic, Multi-dimensional Connotation and Current Significance of “New Quality Productivity”. China Rev. Political Econ. 2023, 14, 127–145. [Google Scholar]
  46. Pu, Q.; Xiang, W. New Quality Productivity and Its Utilizations—New Driving Force for Chinese Modernization. J. Xinjiang Norm. Univ. Philos. Soc. Sci. 2024, 45, 77–85. [Google Scholar]
  47. Li, X.; Tian, Z.; Chang, B. New Quality Productive Forces, Resource Utilization and Organizational Resilience of Enterprises. West Forum 2024, 34, 35–49. [Google Scholar]
  48. Zhang, X.; Wang, W.; Yu, Y. Research on the influence of digital intelligence transformation on the new quality productivity of enterprises. Stud. Sci. Sci. 2025, 43, 943–954. [Google Scholar]
  49. Wang, J.; Zhu, J.; Luo, X. Research on the Measurement of China’s Digital Economy Development and the Characteristics. J. Quant. Technol. Econ. 2021, 38, 26–42. [Google Scholar]
  50. Feng, M.; Li, C.; McVay, S.E.; Skaife, H. Does Ineffective Internal Control over Financial Reporting affect a Firm’s Operations? Evidence from Firms’ Inventory Management. Soc. Sci. Electron. Publ. 2015, 90, 529–557. [Google Scholar] [CrossRef]
  51. Zhang, S.; Zhang, P.; Gu, C. Enterprise Digital Transformation and Supply Chain Efficiency. Stat. Decis. 2023, 39, 169–173. [Google Scholar]
  52. Zhang, P.; Xiao, Y.; Liu, H.; Yue, Y. The Asymmetric Effect of Digital Transformation on Supply Chain Output Fluctuation: A Study Based on Supply Chain Bargaining Power. J. World Econ. 2024, 47, 123–152. [Google Scholar]
  53. Yang, Z.; Liu, J. Can Supply Chain Finance Attract Green Investors? Based on the Perspective of Resource Orchestration. East China Econ. Manag. 2025, 39, 106–117. [Google Scholar]
  54. Li, Y.; Wu, Y.; Tian, X. Corporate ESG performance and discourse power in supply chain. J. Financ. Econ. 2023, 49, 153–168. [Google Scholar]
  55. Song, J.; Zhang, J.; Pan, Y. Research on the Impact of ESG Development on New Quality Productive Forces of Enterprises—Empirical Evidence from Chinese A-share Listed Companies. Contemp. Econ. Manag. 2024, 46, 1–11. [Google Scholar]
  56. Liu, L.; Liu, L.; Liu, K.; Zhang, X. A Test of the Effect of New Quality Productivity on Firms’ Energy Efficiency. J. Manag. 2025, 38, 16–28. [Google Scholar]
  57. Chen, Y.; Wang, S. Spatial Agglomeration Structure of Digital Economy Drives Common Prosperity—Based on the Mechanism of Regional Innovation and Industrial Structure Upgrading. Inq. Into Econ. Issues 2024, 176–190. [Google Scholar]
  58. Yu, H.; Wang, J.; Xu, J.; Ding, B. Does digital economy agglomeration promote green economy efficiency? A spatial spillover and spatial heterogeneity perspective. Environ. Dev. Sustain. 2025, 27, 7379–7406. [Google Scholar] [CrossRef]
  59. Li, Y.; Chen, H.; Tian, M. Statistical Measurement and Spatiotemporal Evolution Characteristics of New Quality Productive Force Level. Stat. Decis. 2024, 40, 11–17. [Google Scholar]
  60. Wang, J.; Qi, J.; Wang, H. The Spatiotemporal Patterns and Driving Factors of Artificial Intelligence Development under the Background of New Quality Productive Forces. Reg. Econ. Rev. 2025, 46–65. [Google Scholar]
Figure 1. The mechanism of new quality productive forces in AI-enabled manufacturing industry.
Sustainability 18 02062 g001
Figure 2. Propensity score figure.
Sustainability 18 02062 g002
Table 1. Evaluation index system of new quality productive forces of enterprises (three elements).
Primary IndicatorSecondary
Indicator
Tertiary
Indicator
Computing MethodWeight/%
New-quality
labor
Staff qualityR&D personnel ratio(Number of R&D personnel/Number of employees) × 10012.985
Proportion of highly educated people(Number of graduate students or above/Number of employees) × 1008.855
Management qualityGreen cognition of executivesLn (Keywords frequency of green development in annual report + 1)6.320
Overseas background of managementThe value of the overseas background of the executives is 1, otherwise it is 0.6.617
New-quality subject of laborEcological environmentEnvironmental governance scoreThe E index of the ESG rating of CSI is assigned to 1~9 in 9 levels respectively.7.929
Future developmentProportion of fixed assets(Fixed assets/Total assets) ×1002.732
Capital accumulation rate(Growth of owner’s equity in the current year/Owner’s equity at the beginning of the year) × 1001.124
New-quality means of laborScientific and technological labor dataInnovation levelLn (Number of patents granted + 1)21.810
Digital labor dataDegree of digitalizationLn (Digitized keyword frequency in annual report + 1)4.620
Proportion of intangible assets(Intangible assets/Total assets) × 1004.100
Green labor materialsGreen technology levelLn (Number of green patents granted + 1)9.960
Proportion of green patents(Number of green patents granted/Number of patents granted) × 10012.950
Table 2. Variable definition table.
Variable TypeVariable NameVariable CodeVariable Definition
Dependent
Variable
New quality productive forcesNqpEntropy method calculation
Independent VariableArtificial IntelligenceAIPenetration of industrial robots in China
Mediating
Variable
Supply chain efficiencySceLn (365/inventory turnover rate)
Supply chain discourse powerSccThe average value of the sum of the purchasing proportion of the top five suppliers and the sales proportion of the top five customers.
Control
Variables
Leverage ratioLevTotal liabilities/Total assets
Operating income growth rateGrowth(Operating income of this year-operating income of last year)/operating income of last year
Return on equityRoeNet profit/average net assets
Ownership concentrationTop1Share proportion of the largest shareholder
Combination of two jobsDualIf the general manager and the chairman are the same person, the value is 1, otherwise the value is 0.
Firm ageAgeFiscal year-year of establishment
Nature of the property rightOwnState-owned enterprises take 1, otherwise take 0.
Firm sizeSizeLn (total assets)
Table 3. Descriptive statistics.
VariableObservation MeanStandard DeviationMedianMinimumMaximum
Nqp7952 12.6307.20312.0501.27138.010
AI79522.9671.9193.1360.0008.117
Sce79520.3050.1800.2790.0003.278
Scc79524.6440.8284.624−4.8209.844
Lev 79520.4040.1980.3950.0080.996
Growth79520.2214.3270.079−1.445429.000
Roe79520.0490.2040.060−8.3932.379
Top179520.2140.4100.0000.0001.000
Dual79520.3220.1440.2990.0180.900
Age795212.9107.63613.0001.00033.000
Own79520.3210.4670.0000.0001.000
Size795222.2211.24022.06517.97126.910
Table 4. Benchmark regression results.
VariantNqp
(1)(2)
AI0.453 ***0.410 ***
(10.740)(9.430)
Lev 5.576 ***
(12.350)
Growth 0.011
(0.660)
Roe 2.473 ***
(6.090)
Dual −0.088
(−0.410)
Top1 −3.633 ***
(−6.270)
Age −0.050 ***
(−3.770)
Own 0.434 *
(2.210)
Size 2.364 ***
(32.04)
_cons11.760 ***11.170 ***
(78.980)(34.810)
Observations79527952
R-squared0.0140.149
Note: The values in brackets are t values; *** p < 0.01, * p < 0.1.
Table 5. Regression results of endogenesis test.
VariantInstrumental Variable MethodPropensity Score Matching
First StageSecond Stage2SLSNqp
AI_US1.187 ***
(142.320)
Lev0.202 **−0.400 6.140 ***
(2.921)(−0.89) (11.984)
Growth−0.001 **0.007 −0.224 ***
(−3.130)(1.550) (−2.977)
Roe−0.111 *2.486 *** 4.623 ***
(−2.250)(3.908) (7.688)
Dual−0.144 ***0.0225 −0.064
(−5.046)(0.11) (−0.296)
Top1−1.070 ***−5.667 *** −4.366 ***
(−12.369)(−10.09) (−6.953)
Age0.050 ***−0.147 *** −0.058 ***
(27.755)(−11.55) (−4.026)
Own−0.326 ***0.180 0.638 ***
(−11.749)(0.93) (2.808)
Size0.0042.388 *** 2.362 ***
(0.340)(31.38) (32.020)
AI_hat 0.143 ***
(2.890)
AI 0.378 ***0.438 ***
(7.424)(9.326)
_cons0.421 ***11.324 ***11.983 ***11.057 ***
(9.527)(34.820)(71.960)(31.989)
Observations7952795279526792
R-squared0.7280.1460.0140.144
F2812.1129.80055.100
Note: The values in brackets are t values; *** p < 0.01, ** p < 0.05, * p < 0.1.
Table 6. Robustness test results.
VariantNqpReplacement of Dependent
Variable
(1) Removal of Abnormal Years(2) Removal of Abnormal Cities(3) TFP_OP(4) Npro
AI0.209 ***0.535 ***0.035 ***0.004 ***
(3.52)(11.370)(8.480)(9.432)
Lev−1.366 *5.791 ***1.507 ***0.056 ***
(−2.23)(11.910)(35.450)(12.354)
Growth0.0101−0.183 *0.0030.001
(0.66)(−2.00)(1.72)(1.158)
Roe−0.8922.854 ***1.001 ***0.025 ***
(−1.32)(6.690)(26.160)(6.088)
Dual−0.210−0.045−0.044 *−0.009
(−0.84)(−0.19)(−2.15)(−4.050)
Top1−5.358 ***−3.006 ***0.739 ***−0.036 ***
(−7.68)(−4.780)(13.530)(−6.268)
Age−0.160 ***−0.058 ***0.033 ***−0.0005 ***
(−8.68)(−4.110)(26.370)(−3.769)
Own−0.04710.405−0.0120.004 **
(−0.19)(1.930)(−0.640)(2.209)
Size2.429 ***2.283 ***0.437 ***0.0236 ***
(23.60)(28.13)(79.14)(32.04)
_cons11.670 ***10.460 ***5.388 ***0.112 ***
(29.240)(30.070)(178.300)(34.809)
Observations4868688779487952
R-squared0.1290.1460.6280.149
Note: The values in brackets are t values; *** p < 0.01, ** p < 0.05, * p < 0.1.
Table 7. Evaluation index system of new quality productive forces of enterprises (two elements).
Primary IndicatorSecondary
Indicator
Tertiary
Indicator
Computing MethodWeight/%
Labor forcesLiving laborSalary proportion of R&D personnelR&D expenses-salary/Operating income28
R&D personnel ratioNumber of R&D personnel/Number of employees4
Proportion of highly educated peopleNumber of undergraduate or above/Number of employees3
Materialized labor Proportion of fixed assetsFixed assets/Total assets2
Proportion of manufacturing expenses(Subtotal of cash outflow from operating activities + Depreciation of fixed assets + Amortization of intangible assets +Impairment reserve − Cash paid for goods and services − Paid to employees and wages paid for employees)/(Subtotal of cash outflow from operating activities + Depreciation of fixed assets + Amortization of intangible assets + Impairment reserve)1
Production toolsHard
technology
R&D depreciation and amortization ratioR&D expenses − Depreciation and amortization/Operating income27
R&D rental fee ratioR&D expenses- rental expenses/Operating income2
Proportion of direct investment in R&DR&D expenses-direct investment/Operating income28
Soft
technology
Proportion of intangible assetsIntangible assets/Total assets3
turnover of total assetsOperating income/Average total assets1
Reciprocal equity multiplierOwner’s equity/Total assets1
Table 8. Inspection results of intermediary mechanism.
Variant (1)(2)(3)(4)
SceNqpSccNqp
AI−0.0280 ***0.405 ***−0.006 ***0.421 ***
(−5.828)(9.303)(−5.769)(9.674)
Lev−0.709 ***5.455 ***−0.030 ***5.520 ***
(−14.226)(11.936)(−2.746)(12.236)
Growth−0.007 ***0.0100.0007 *0.012
(−4.065)(0.581)(1.924)(0.744)
Roe−0.334 ***2.416 ***−0.059 ***2.359 ***
(−7.438)(5.927)(−6.141)(5.799)
Dual0.067 ***−0.077−0.0004−0.089
(2.769)(−0.353)(−0.069)(−0.411)
Top1−0.288 ***−3.682 ***−0.057 ***−3.737 ***
(−4.494)(−6.346)(−4.127)(−6.447)
Age−0.011 ***−0.052 ***−0.0001−0.050 ***
(−7.146)(−3.891)(−0.350)(−3.791)
Own0.0260.439 **0.0050.448 **
(1.184)(2.231)(0.973)(2.279)
Size−0.009952.363 ***−0.0225 ***2.363 ***
(−1.15)(32.02)(−12.20)(31.72)
Sce −0.171 *
(−1.680)
Scc −1.910 ***
(−4.048)
_cons5.250 ***12.063 ***0.309 ***11.757 ***
(148.204)(19.381)(40.525)(33.393)
Observations7952795279527952
R-squared0.0630.1490.0310.149
Note: The values in brackets are t values; *** p < 0.01, ** p < 0.05, * p < 0.1.
Table 9. Test results of the influence of enterprise innovation level and property right nature on artificial intelligence empowering new quality productive forces.
VariantNqp
(1) High-Innovation
Enterprise
(2) Low-Innovation Enterprise(3) State-Owned
Enterprise
(4) Non-State-Owned Enterprises
AI0.297 ***0.115 *0.502 ***0.164 ***
(5.190)(2.200)(7.000)(3.300)
Lev8.160 ***1.622 **−3.023 ***1.290 *
(11.820)(3.200)(−3.960)(2.170)
Growth0.0057−0.0440.009−0.146
(0.340)(−0.520)(0.600)(−1.520)
Roe5.905 ***0.248−2.426 **0.281
(6.650)(0.640)(−2.870)(0.630)
Dual−0.03330.219−1.103−0.008
(−0.100)(0.880)(−0.980)(−0.040)
Top1−6.291 ***−1.890 **−9.732 ***−3.184 ***
(−7.660)(−2.730)(−11.010)(−4.570)
Age0.038−0.029−0.164 ***−0.150 ***
(1.840)(−1.950)(−7.680)(−9.200)
Own0.219−0.172
(0.760)(−0.750)
Size2.673 ***1.222 ***2.995 ***1.912 ***
(23.49)(13.52)(26.80)(19.36)
_cons12.510 ***10.160 ***10.870 ***11.390 ***
(26.240)(27.680)(16.750)(29.810)
Observations3872408029994953
R-squared0.1890.0530.2410.099
Note: The values in brackets are t values; *** p < 0.01, ** p < 0.05, * p < 0.1.
Table 10. Test results of the influence of regional characteristics on the productivity of artificial intelligence empowerment new quality.
Variant(1)(2)(3)(4)
NqpEastern RegionCentral RegionWest Region
AI0.410 ***0.414 ***0.235 **0.522 ***
(9.432)(7.794)(2.438)(4.159)
Lev5.576 ***4.956 ***7.908 ***6.751 ***
(12.354)(8.704)(7.541)(6.196)
Growth0.0110.011−0.186−0.096
(0.658)(0.657)(−0.739)(−0.626)
Roe2.473 ***4.258 ***2.0851.752 ***
(6.088)(5.834)(1.552)(3.312)
Dual−0.088−0.082−0.112−2.132 ***
(−0.405)(−0.327)(−0.199)(−2.915)
Top1−3.633 ***−5.039 ***0.972−3.884 ***
(−6.268)(−6.996)(0.726)(−2.703)
Age−0.050 ***−0.055 ***0.027−0.077 **
(−3.769)(−3.201)(0.930)(−2.405)
Own0.434 **0.880 ***−0.4900.402
(2.209)(3.394)(−1.137)(0.906)
Size2.364 ***2.365 ***2.334 ***2.356 ***
(32.040)(24.190)(13.180)(15.370)
_cons11.167 ***12.093 ***7.914 ***10.087 ***
(34.809)(30.301)(11.365)(11.692)
Observations7952520415021246
R-squared0.1490.1400.1520.209
Note: The values in brackets are t values; *** p < 0.01, ** p < 0.05.
Disclaimer/Publisher’s Note: The statements, opinions and data contained in all publications are solely those of the individual author(s) and contributor(s) and not of MDPI and/or the editor(s). MDPI and/or the editor(s) disclaim responsibility for any injury to people or property resulting from any ideas, methods, instructions or products referred to in the content.