Article

Experimental Study on the Impact of Driving Mode, Traffic, and Road Infrastructure on the Energy Consumption of Road Transport †

by
Rafael Henrique de Oliveira
1,*,
Laura Nascimento Mazzoni
2,
Kamilla Vasconcelos Savasini
2,
Flávio Guilherme Vaz de Almeida Filho
2 and
Linda Lee Ho
2
1
School of Technology, University of Campinas, Limeira 13484-332, Brazil
2
Polytechnic School, University of São Paulo, São Paulo 05508-080, Brazil
*
Author to whom correspondence should be addressed.
This article is an extended and improved version of the paper entitled “Experimental Study on the Impact of Driving Mode, Traffic, and Road Infrastructure on the Energy Consumption of Road Transport”, presented at the 20th Conference on Sustainable Development of Energy, Water and Environment Systems (SDEWES 2025), Dubrovnik, Croatia, 5–10 October 2025.
Sustainability 2026, 18(4), 2052; https://doi.org/10.3390/su18042052
Submission received: 3 January 2026 / Revised: 5 February 2026 / Accepted: 9 February 2026 / Published: 17 February 2026

Abstract

The vehicular energy consumption, primarily determined by the vehicle’s characteristics, exhibits significant variations influenced by driving behavior, traffic, and road attributes, with repercussions for emissions. This paper presents experimental results from real-traffic runs to characterize the relationship between fuel consumption and these factors. Data on consumption, performance, and kinematics of a light-duty vehicle were obtained using low-cost devices, including an On-Board Diagnostics (OBD) scanner, a unit integrating an Inertial Measurement Unit (IMU) and a Global Positioning System (GPS) receiver. The data allowed distinguishing consumption patterns between two distinct scenarios: a collector road stretch with deteriorated pavement and an express road stretch with lower surface roughness. Relevant association was identified between fuel consumption and factors such as discrete pavement anomalies and variables related to driving and traffic. Moderate correlations were observed with slope, and weaker ones with pavement roughness. Regarding the regression analysis, results identified acceleration and engine speed as the primary operational determinants of fuel consumption, with road grade emerging as the dominant geometric constraint across all scenarios. The results reveal relevant associations between fuel consumption and road, driving, and traffic-related factors while simultaneously demonstrating a robust and replicable experimental methodology based on commercially available sensing devices for real-traffic energy and emission assessments.

1. Introduction

Climate change associated with anthropogenic greenhouse gas (GHG) emissions represents one of the greatest contemporary challenges, driving global efforts to reduce carbon emissions. On a global scale, it is estimated that the transport sector relies on fossil fuels for over 90% of its energy demand and accounts for approximately one-quarter of global carbon dioxide emissions related to energy production [1]. The significant contribution of road transport to CO2 emissions has stimulated actions toward the energy transition in this sector and other systemic changes such as integrated transformations across urban form (compact cities), infrastructure (public/active transit), technology (digitalization and mobility as a service), policy (regulation and incentives), and behavior (cultural shifts resulting in modal shifts), measures with higher mitigation potential [2,3]. However, given the well-known challenges associated with technological transitions, studies on potential energy efficiency gains in dominant systems and technologies have gained interest. On this matter, assessments of energy demand increase due to variations in road transport conditions and their resulting impacts on transport costs and carbon emissions have become prominent. Drawing upon the findings of previous studies [4,5,6] and further analytical considerations, the main factors influencing the specific energy demand (i.e., besides the travelled distance) in road transportation can be classified into the following categories:
  • Vehicle-related factors: vehicle mass, aerodynamic and rolling resistance geometry, engine type, tire characteristics (including type, condition, and pressure), maintenance status, and fuel type.
  • Operational factors: traffic conditions (such as level of service, congestion, presence of conflict points) and traffic control elements (such as signals, signs, and speed limits).
  • Infrastructure-related factors: roadway geometry (alignment, grades, curves) and pavement surface conditions (texture, roughness, and irregularities), which are associated with rolling resistance (due to pavement-vehicle interaction) and grade resistance variations along a trip.
  • Meteorological factors: weather conditions, including temperature, precipitation, and wind, which affect vehicle dynamics and energy consumption.
  • Driving behavior: mainly reflected in speed profiles, which capture drivers’ responses to operational, infrastructure-related and environmental factors.
Assuming constant vehicle technologies and fuel types, instantaneous vehicular energy consumption varies primarily as a function of driving behavior, traffic conditions, and road infrastructure characteristics, with direct implications for environmental impacts. Unlike meteorological factors, these variables can be actively managed through mitigation strategies such as eco-driving [7], eco-routing [8], energy-efficient geometric road design [9], and pavement management systems that explicitly consider use-phase greenhouse gas emissions [10].
To quantify the complex interactions between the aforementioned factors and vehicular energy efficiency, and to support the practical implementation of these mitigation strategies, mathematical modeling serves as an essential tool. The literature typically categorizes these models based on their spatiotemporal resolution and data granularity. Macroscopic models, such as COPERT, HDM-4, and MOVES (in default inventory mode), rely on aggregate network parameters—primarily average speed and link length—to estimate emissions at a regional level [11,12,13,14]. While effective for broad policy evaluations, these approaches lack the granularity to capture transient driving dynamics caused by local infrastructure constraints, such as specific grade variations or pavement roughness.
Consequently, research has shifted toward microscopic models, which calculate instantaneous energy demand based on second-by-second vehicle operation. Traditional microscopic approaches, like CMEM and VT-Micro, often rely on standard driving cycles or dynamometer simulations [15,16,17]. However, these controlled environments may not fully reflect the stochastic nature of real-world driving behavior under varying infrastructure conditions. To address this, recent studies have adopted data-driven microscopic frameworks utilizing Real-World Driving Data (RWD) collected via On-Board Diagnostics (OBD) and GPS [18,19]. These methods allow for the precise assessment of how vehicle dynamics (speed, acceleration, VSP) respond to immediate environmental contexts. Despite this progress, fully integrated analyses remain rare. Most existing studies using RWD often focus on traffic dynamics while simplifying infrastructure variables, frequently neglecting the simultaneous impact of road roughness and detailed topography [20,21]. Therefore, there is a critical need for microscopic frameworks that leverage high-frequency field data to simultaneously model the combined influence of traffic, driver behavior, and detailed road geometry and pavement roughness.
The present study aims to experimentally characterize the influence of driving behavior, traffic conditions, and road infrastructure attributes on instantaneous vehicular fuel consumption. For this data gathering, the research explores a low-cost sensor-based approach, i.e., consumer-grade devices that are affordable, widely available, and sufficiently accurate for large-scale deployment in various mobility scenarios. By integrating an OBD scanner and an IMU-GPS unit, the powertrains’ performance parameters are monitored concurrently with the speed profile and other kinematic data associated with traffic, driving behavior, and vehicle–infrastructure interaction. The impact of the factors considered on fuel consumption is quantified through stratified multivariate regression for clearly distinct scenarios in terms of traffic conditions, road grade, and pavement roughness.
The quantitative results provide empirical evidence of the relative contributions of each evaluated factor. Unlike theoretical models, these findings offer experimental insights into how road infrastructure, traffic conditions, and driving behavior potentially interact under real-world conditions, providing a more nuanced and integrated understanding of energy demand in complex urban environments. Moreover, a key methodological contribution lies in demonstrating how low-cost sensor data can effectively be used to assess energy inefficiencies, offering broader accessibility and scalability compared to traditional high-end sensing systems, desirable factors in the comprehensive, high-resolution data collection required for the proper advancement of this research field. Considering further implications of this work, the results and the proposed method aim to support future strategies for eco-driving, eco-routing, and GHG-conscious road design and pavement maintenance, bridging the gap between empirical data and effective sustainable transport policies.

2. Background

Studies reveal that driving behavior (degree of aggressiveness) and traffic conditions (road service level and conflicts) shape vehicle speed profiles, acceleration patterns, and engine speed (revolutions per minute)—variables that exert significant influence on instantaneous fuel consumption [6]. Research shows that irregular speed profiles, resulting from either aggressive driving or traffic disruptions, can increase energy consumption by up to 40% compared to smoother driving patterns [22,23,24,25]. Expanding on these findings, Hussain et al. [26] argue that the specific relationship between driving behavior and consumption is fundamentally non-linear due to the temporal dependencies of speed profiles and the disproportionate response of Mass Air Flow to throttle dynamics during aggressive maneuvers. Complementing this, Wang et al. [27] applied a “Stimulus–Organism–Response” framework to demonstrate how external stimuli, such as adverse traffic or weather, interact with drivers’ internal states to precipitate these erratic, energy-intensive maneuvers.
From an infrastructure perspective, geometric characteristics (gradient and horizontal alignment) and pavement properties (texture, roughness, and deflections) determine motion resistance and consequently the energy required for vehicle displacement. Motion resistance includes rolling resistance (tire–pavement interaction affected by texture, roughness, and deflections), inertial resistance (including rotational inertia in curves), and gravitational resistance on inclined segments [28]. Among the infrastructure factors, road gradient exerts the strongest influence on fuel consumption, with variations up to 100% between hilly and flat terrains [29,30,31,32]. However, this contribution varies significantly depending on topographic features and their interaction with traffic and driving behavior in real-world scenarios.
Pavement condition represents another key energy consumption factor. The operational phase of road pavements (i.e., when in service and interacting with vehicles) represents the largest contribution to emissions in the pavement life cycle when considering high-traffic road sections [33,34]. Pavement characteristics such as structural response, texture and irregularities impact rolling resistance and consequently fuel consumption and corresponding emissions [35,36]. Specifically, a Transportation Research Board (TRB) report empirically identified that fuel consumption in passenger cars can increase up to 13% on pavements with poor functional performance (comparison between sections with an average IRI of 6 m/km compared to a reference section with an average IRI of 1 m/km, on flat terrain) [37]. Other studies have provided complementary contributions in characterizing the impact of irregularities on fuel consumption [38,39] as well as the resulting impact on emissions, whether through modeling [36,40] or direct measurements [41]. Furthermore, recent studies indicate that both road gradient [42] and roughness factors [43] are critical for Electric Vehicles (EVs), directly impacting battery range and regeneration efficiency. While topography governs potential energy recovery, pavement roughness significantly increases rolling resistance and energy dissipation [44].
These micro-scale findings above-mentioned regarding the three factors under analysis can be related to some key mitigation practices: (a) eco-driving strategies to optimize driver behavior for fuel efficiency [6]; (b) eco-routing to identify energy- and environmentally-efficient routes considering infrastructure and traffic variables [23]; (c) environmentally-targeted pavement maintenance, evaluating net benefits between emissions avoided through improved road conditions versus those generated by maintenance activities [44,45].
Although recent studies have endeavored to integrate these operational contexts to support such mitigation strategies, methodological constraints regarding data availability and granularity persist. For instance, Boggio-Marzet et al. [46] successfully combined traffic conditions, driving behavior, and road types to analyze fuel consumption patterns. However, their approach relies on categorical classifications for infrastructure (e.g., classifying roads merely as ‘urban’ or ‘highway’) rather than continuous, physically measured geometric and pavement variables. Similarly, while Zhang et al. [47] and Shang et al. [48] encompassed a broad range of environmental and operational factors using large-scale datasets, these studies often depended on mesoscopic models or aggregated data that smoothed out the specific, high-frequency interactions between vehicle dynamics and discrete pavement anomalies found in real-world driving.
Despite advances in this field of research, the literature reveals persistent gaps associated with common methodological limitations such as (a) predominant use of energy consumption models (e.g., VT-Micro, CMEM, or HDM-4) rather than field-based data-driven investigations; (b) lack of integrated understanding of factor interactions and their direct and indirect impacts on energy performance in a micro-scale; and (c) testing in scenarios with limited representativeness (controlled or single-condition tests). A comprehensive characterization of each factor’s influence would require the analysis of extensive, diverse real-traffic tests (without variable control) to ensure statistical representativeness and enable context-specific analysis. In this regard, this paper presents an initial contribution by describing the application of a proposed accessible and scalable sensing architecture applied to this monitoring activity.

3. Materials and Methods

3.1. Evaluated Road Stretches

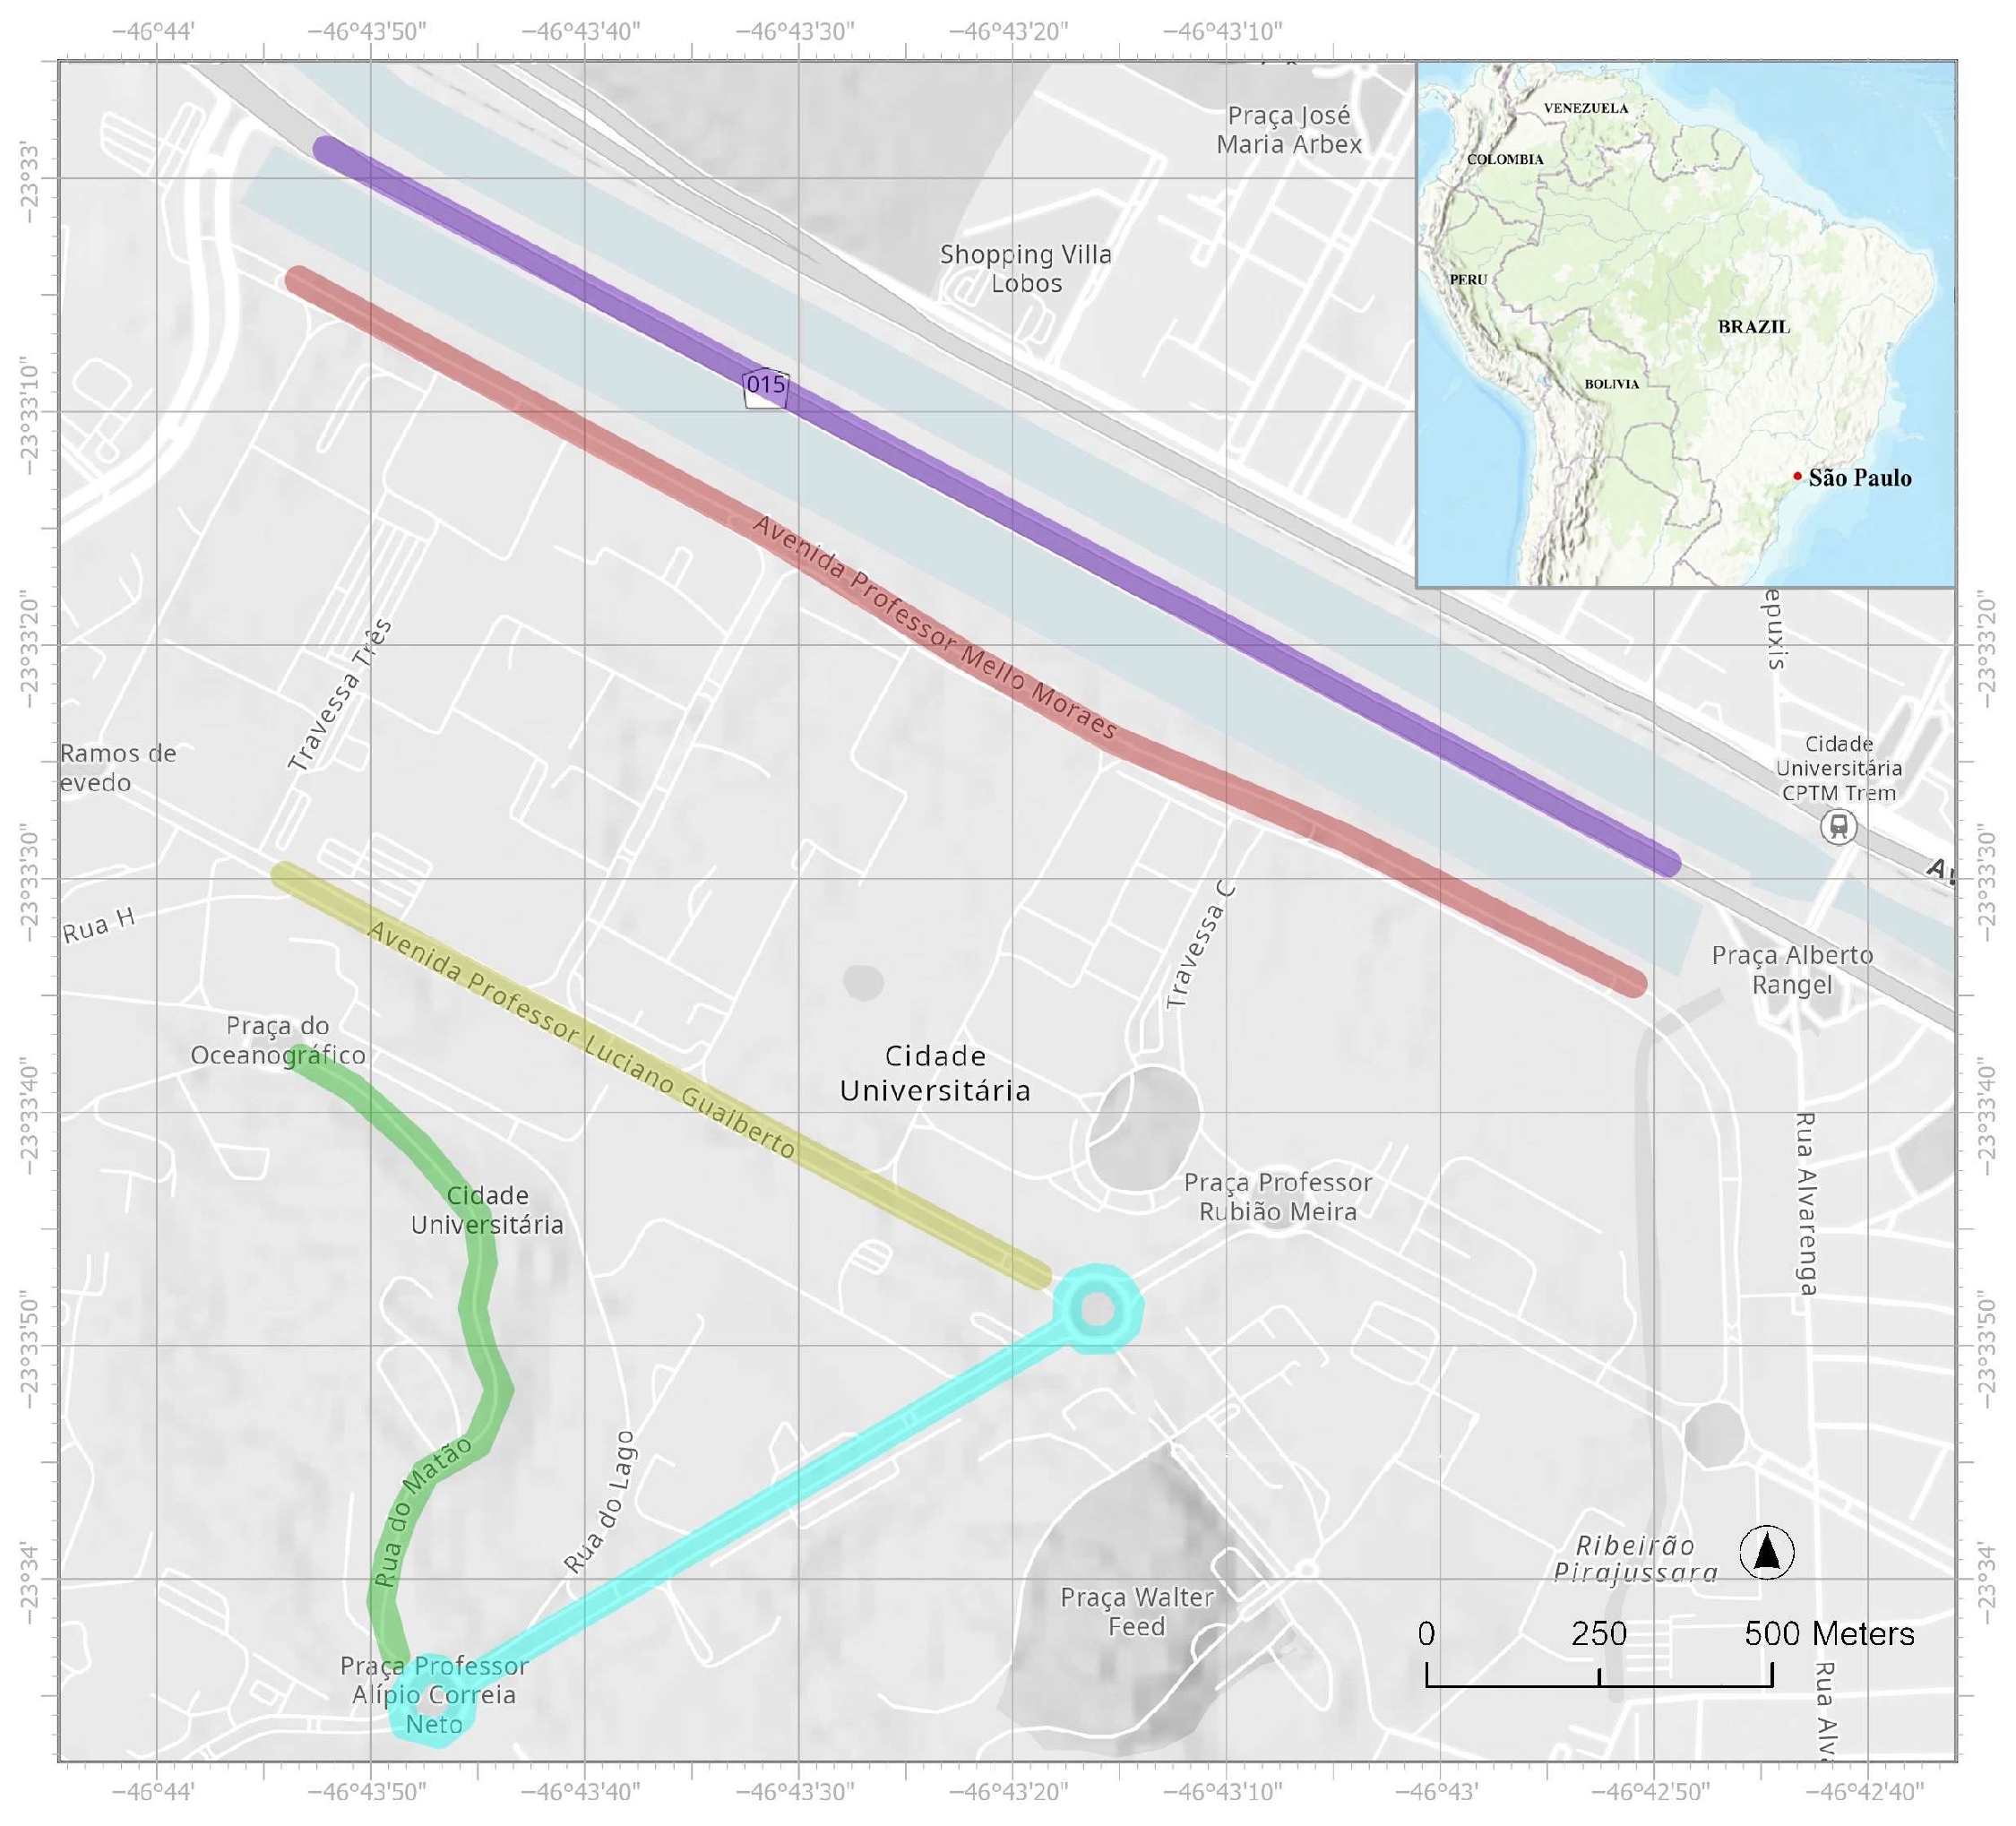
Data were collected on the five road stretches presented in Figure 1 and Table 1. Hereafter, this article will refer to the road stretches using the “Descriptive” denomination. The qualitative descriptions presented in Table 1 are not based on an absolute classification system; rather, they serve as a comparative framework among the segments. In this regard, the sections were selected due to their quite distinct characteristics in terms of pavement, geometry and hierarchy. Moreover, all of the roads considered are paved with asphalt. Driving was performed in real-world conditions by an experienced driver (over 10 years of licensing) familiar with the route, instructed to adhere to a moderate driving style, maintaining consistent behavioral conditions throughout the tests. Regarding meteorological conditions, the tests were conducted under stable conditions, with an ambient temperature of approximately 22 °C, absence of precipitation and weak winds. During the analyzed period, hourly mean wind speeds ranged from 0.7 to 1.5 m/s (period average of approximately 1.0 m/s), and maximum gusts reached 1.8 m/s (classified as weak winds), as recorded by a meteorological station located adjacent to the study roadways and operated by the São Paulo City Emergency Management Center, Butantã/USP station.
Data collection was strategically scheduled during the afternoon off-peak period (inter-peak hours). This temporal window was selected to capture representative traffic interactions without the occurrence of flow breakdown or complete stops (gridlock). Consequently, the recorded speed profiles reflect dynamic traffic density effects rather than static congestion, ensuring that kinematic variations—especially on the Express Road—remained within a continuous flow regime.
For stretches 1 and 2, data were collected in three different passes in two traffic lanes: three passes on Lane A, the second rightmost traffic lane, and three passes on Lane B, the adjacent right lane. For stretches 3, 4, and 5, the rightmost traffic lane was consistently used. Two passes were conducted in a counterclockwise direction (considering the circuit formed by these three stretches,) and two other passes were conducted in a clockwise direction. The vehicle used in the surveys was a Fiat Argo HGT, 2017 model (Table 2) with a 1.8 L engine, 6-speed automatic transmission, fueled with E27 gasoline (with 27% ethanol).

3.2. Instrumentation and Measured Variables

The test vehicle was instrumented with the devices described in the following sections. This configuration prioritized consumer-grade, low-cost sensors to demonstrate the feasibility of affordable large-scale data collection while maintaining sufficient accuracy for the proposed evaluation.

3.2.1. Vibration Measurement Device and Inertial Measurements

The device dedicated to vehicle vibration measurement and georeferencing is based on a Raspberry Pi Zero W, which integrates the Inertial Measurement Unit (IMU) MPU9250 (TDK InvenSense, San Jose, CA, USA, with triaxial accelerometer, gyroscope, magnetometer, and pressure sensor) and the standalone u-Blox NEO-6M GPS receiver module (u-Blox AG, Thalwil, Switzerland), with accuracy comparable to standard navigation receivers. This device was developed by part of the research team and detailed in previous works regarding rail [52] and road [53] applications. For road use, despite suspension system influences, previous tests showed strong correlation between the International Roughness Index (IRI) and the root-mean-square (RMS) of vertical accelerations [53]. The IMU outputs data at 83 Hz for triaxial acceleration (g), triaxial angular velocity (°/s), triaxial magnetic field measurement (µT), pressure (hPa), and barometric height (m) from the barometric formula. The GPS module provides 1-Hz updates for WGS84 geodetic coordinates (latitude/longitude in decimal degrees, geometric height in meters), UTC time, and velocity (m/s).
Accelerations were processed to remove gravity components in the three axes, decomposed from the sensor tilt angles relative to the local horizontal plane (roll and pitch) estimated by a Kalman filter. Furthermore, a bandpass filter (5th order Butterworth) between 0.8 and 40 Hz was applied to accelerations and angular velocities to remove, respectively, systematic deviations due to geometry and high-frequency vibrations from vehicle systems. At any rate, the selected sections were approximately straight and without altimetric variation, thus exhibiting only minor changes in geometry.
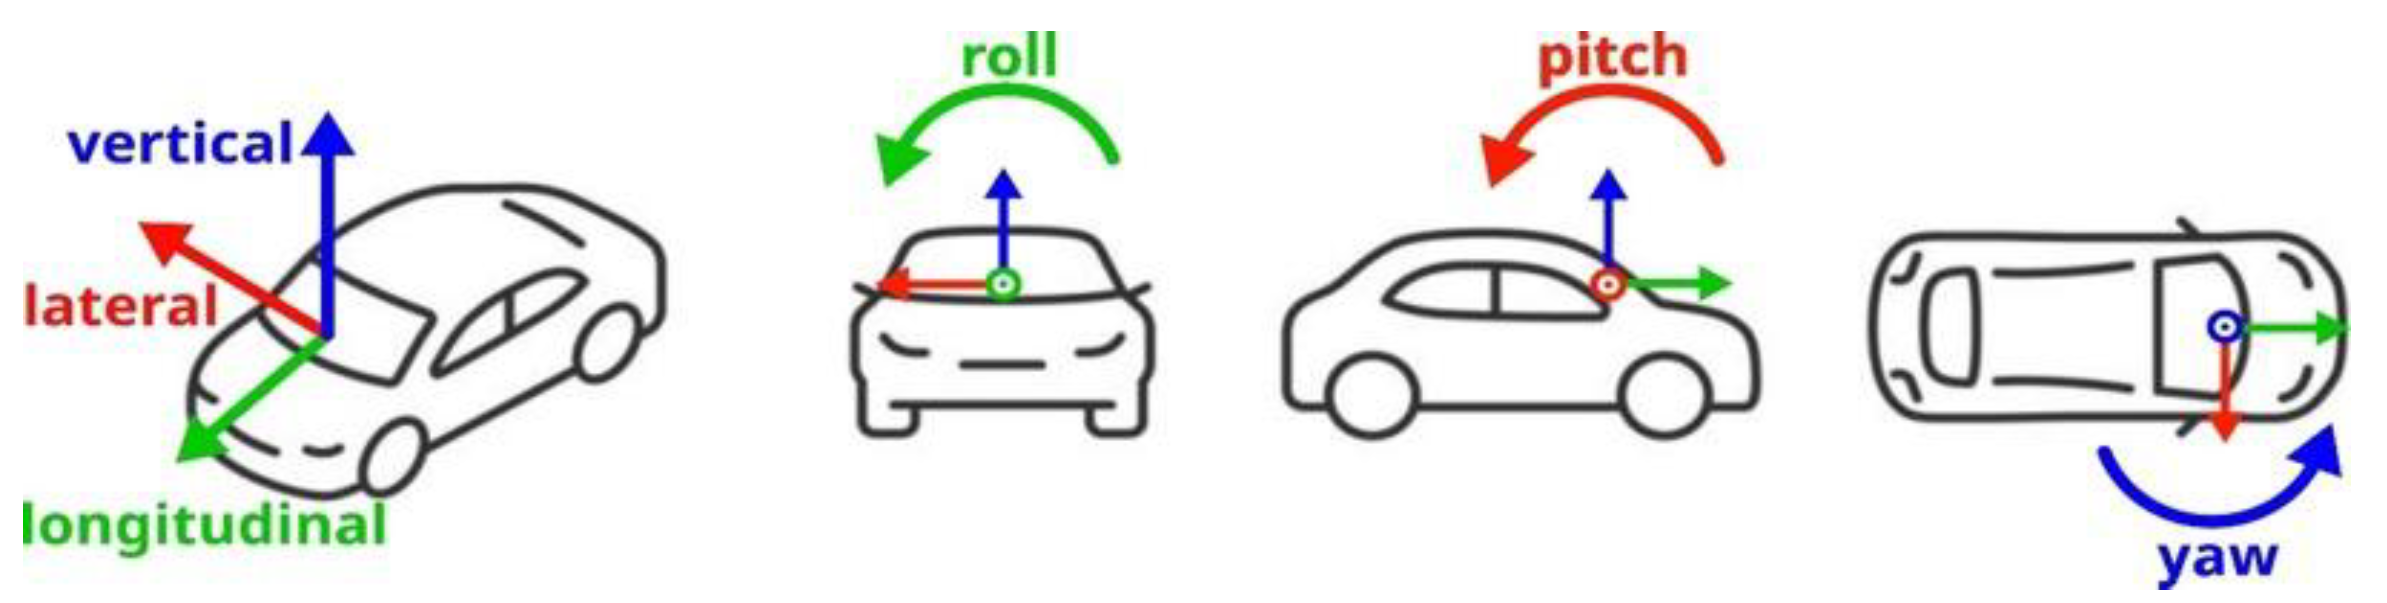
Key relationships between inertial measurements (Figure 2) and the target features can be described:
  • Vertical acceleration: pavement surface texture, irregularities, and discrete anomalies (e.g., speed bumps and potholes);
  • Lateral acceleration: vehicle maneuvers;
  • Longitudinal acceleration: vehicle acceleration and deceleration;
  • Roll rate: irregularities and asymmetric discrete anomalies (e.g., potholes);
  • Pitch rate: irregularities and symmetric discrete anomalies (e.g., speed bumps);
  • Yaw rate: vehicle maneuvers.
Figure 2. Axes orientation for the considered sensor installation.
Sustainability 18 02052 g002
The geometric characterization of road segments in this study relied on two parameters: road grade and horizontal deflection. Besides the inertial quantities, the barometric height was processed with a 1500-sample moving-average filter to reduce noise and adopted to calculate the road grade (Δh/d, where h is barometric altitude and d is GPS-calculated path horizontal distance between two h samples). Based on the GPS coordinates, the deflection of the trajectory was also calculated for each 100-m stretch. This was defined as the difference between the azimuth at the beginning and at the end of each stretch. This value was treated as an indicator associated with the curvature of the travelled stretches.

3.2.2. On-Board Diagnostics (OBD) Scanner

On-Board Diagnostics (OBD) refers to a system integrated into the Electronic Control Unit (ECU) of vehicles that monitors the performance of engine components [54]. OBD-I was initially implemented as a manufacturer-specific implementation in the 80s in response to emerging Californian emissions regulations, which established a precedent for electronic emissions monitoring. Dealing with the lack of standardization and incompleteness regarding emission related components that OBD must monitor, OBD-II was codified and became mandatory for all light-duty vehicles sold in the United States beginning in 1996. This system introduced a set of standardized Diagnostic Trouble Codes (DTCs), the early fault detection, the universal connector (SAE J1962), and continuous monitoring of key emission control systems such as oxygen sensors, catalytic converters, and evaporative controls. Moreover, the Controller Area Network (CAN) communication protocol has been widely adopted since the early 2000s, gradually replacing previous protocols as part of a global effort toward standardization. These improvements, aligned with broader environmental sustainability policies, enabled efficient inspection and maintenance programs across various countries, significantly contributing to reductions in vehicle-based air pollution.
This research employed the consumer-grade, very low-cost (about five dollars) OBD-II scanner ELM327 (Shenzhen Lonauto Technology Co., Ltd., Shenzhen, Guangdong, China), a microcontroller-based interface that enables wireless communication between a vehicle’s OBD system and a mobile device via Bluetooth. For impact analysis on fuel consumption, this research considered only the instantaneous fuel consumption measured over time (Liters per hour). This value reflects the engine load and is typically calculated based on the fuel injector pulse width, which indicates the amount of fuel being delivered per combustion cycle. On the other hand, the normalized fuel consumption by distance (e.g., in L/100 km), which is also outputted by the OBD and is calculated from the instantaneous consumption and the vehicle speed, can distort the perception of fuel use across segments with significantly different average speeds. This normalized approach mixes energetic effects with kinematic effects, making it difficult to isolate the absolute contribution of external factors—such as road surface, traffic flow, or driving behavior—to fuel consumption.
The other propulsion-related parameters gathered through the OBD system and considered for the proposed analysis are engine speed (RPM), vehicle speed, and acceleration. These variables were retrieved using standardized Parameter IDs (PIDs), which are part of the OBD-II protocol and allow real-time access to vehicle operational data. The analysis of additional parameters, particularly those related to emission control systems, was beyond the scope of this study. Moreover, the instantaneous power provided by OBD will not be used, as it is already calculated from fuel consumption, which would lead to redundancy and autocorrelation when correlated with consumption. It is also important to note that the OBD data does not follow a fixed sampling rate, as the acquisition depends on the data stream provided by the vehicle’s onboard computer. For the selected parameters, the effective sampling frequency varied between approximately 1 and 2 Hz.

3.3. Data Processing and Statistical Analysis

The relevant parameters were computed for 100-m road sections. For inertial measurements, the root-mean-square (RMS) was calculated as an indicator of vibration in the corresponding directions. For the other performance parameters (fuel consumption, engine speed (RPM), vehicle speed, and acceleration, as well as the road geometry parameters) the mean value within each 100-m section was considered.
Initially, the Pearson correlation coefficient was computed between instantaneous fuel consumption and the set of explanatory variables (variables representing the evaluated influencing factors) considering data from six trips over the test segments. The use of Pearson’s correlation is appropriate in this context as a first exploratory step to quantify the linear relationships between variables and to identify potential patterns or dependencies [55].
However, considering the interdependency among kinematic variables in real-traffic conditions (e.g., speed and acceleration), a Multiple Linear Regression (MLR) [56] analysis was subsequently performed. This approach aimed to quantify the relative contribution (standardized coefficients) of each factor to fuel consumption and verify the issue of multicollinearity through the Variance Inflation Factor (VIF) analysis. It is important to highlight that regarding traffic conditions, while specific traffic volume counts were not available, the influence of congestion was intrinsically captured by the vehicle’s kinematic profile (speed variations and idling periods) recorded by the sensors. Therefore, the regression model considers the “traffic factor” through its direct impact on the vehicle’s physics.
While acknowledging the simplifying assumptions of this linear framework, it fulfills the study’s scope by establishing a foundational validation of the proposed sensing architecture; more complex non-linear models, particularly those based on Machine Learning, are envisioned for future stages contingent upon the availability of larger-scale datasets.

4. Results and Discussion

4.1. Descriptive Data Analysis

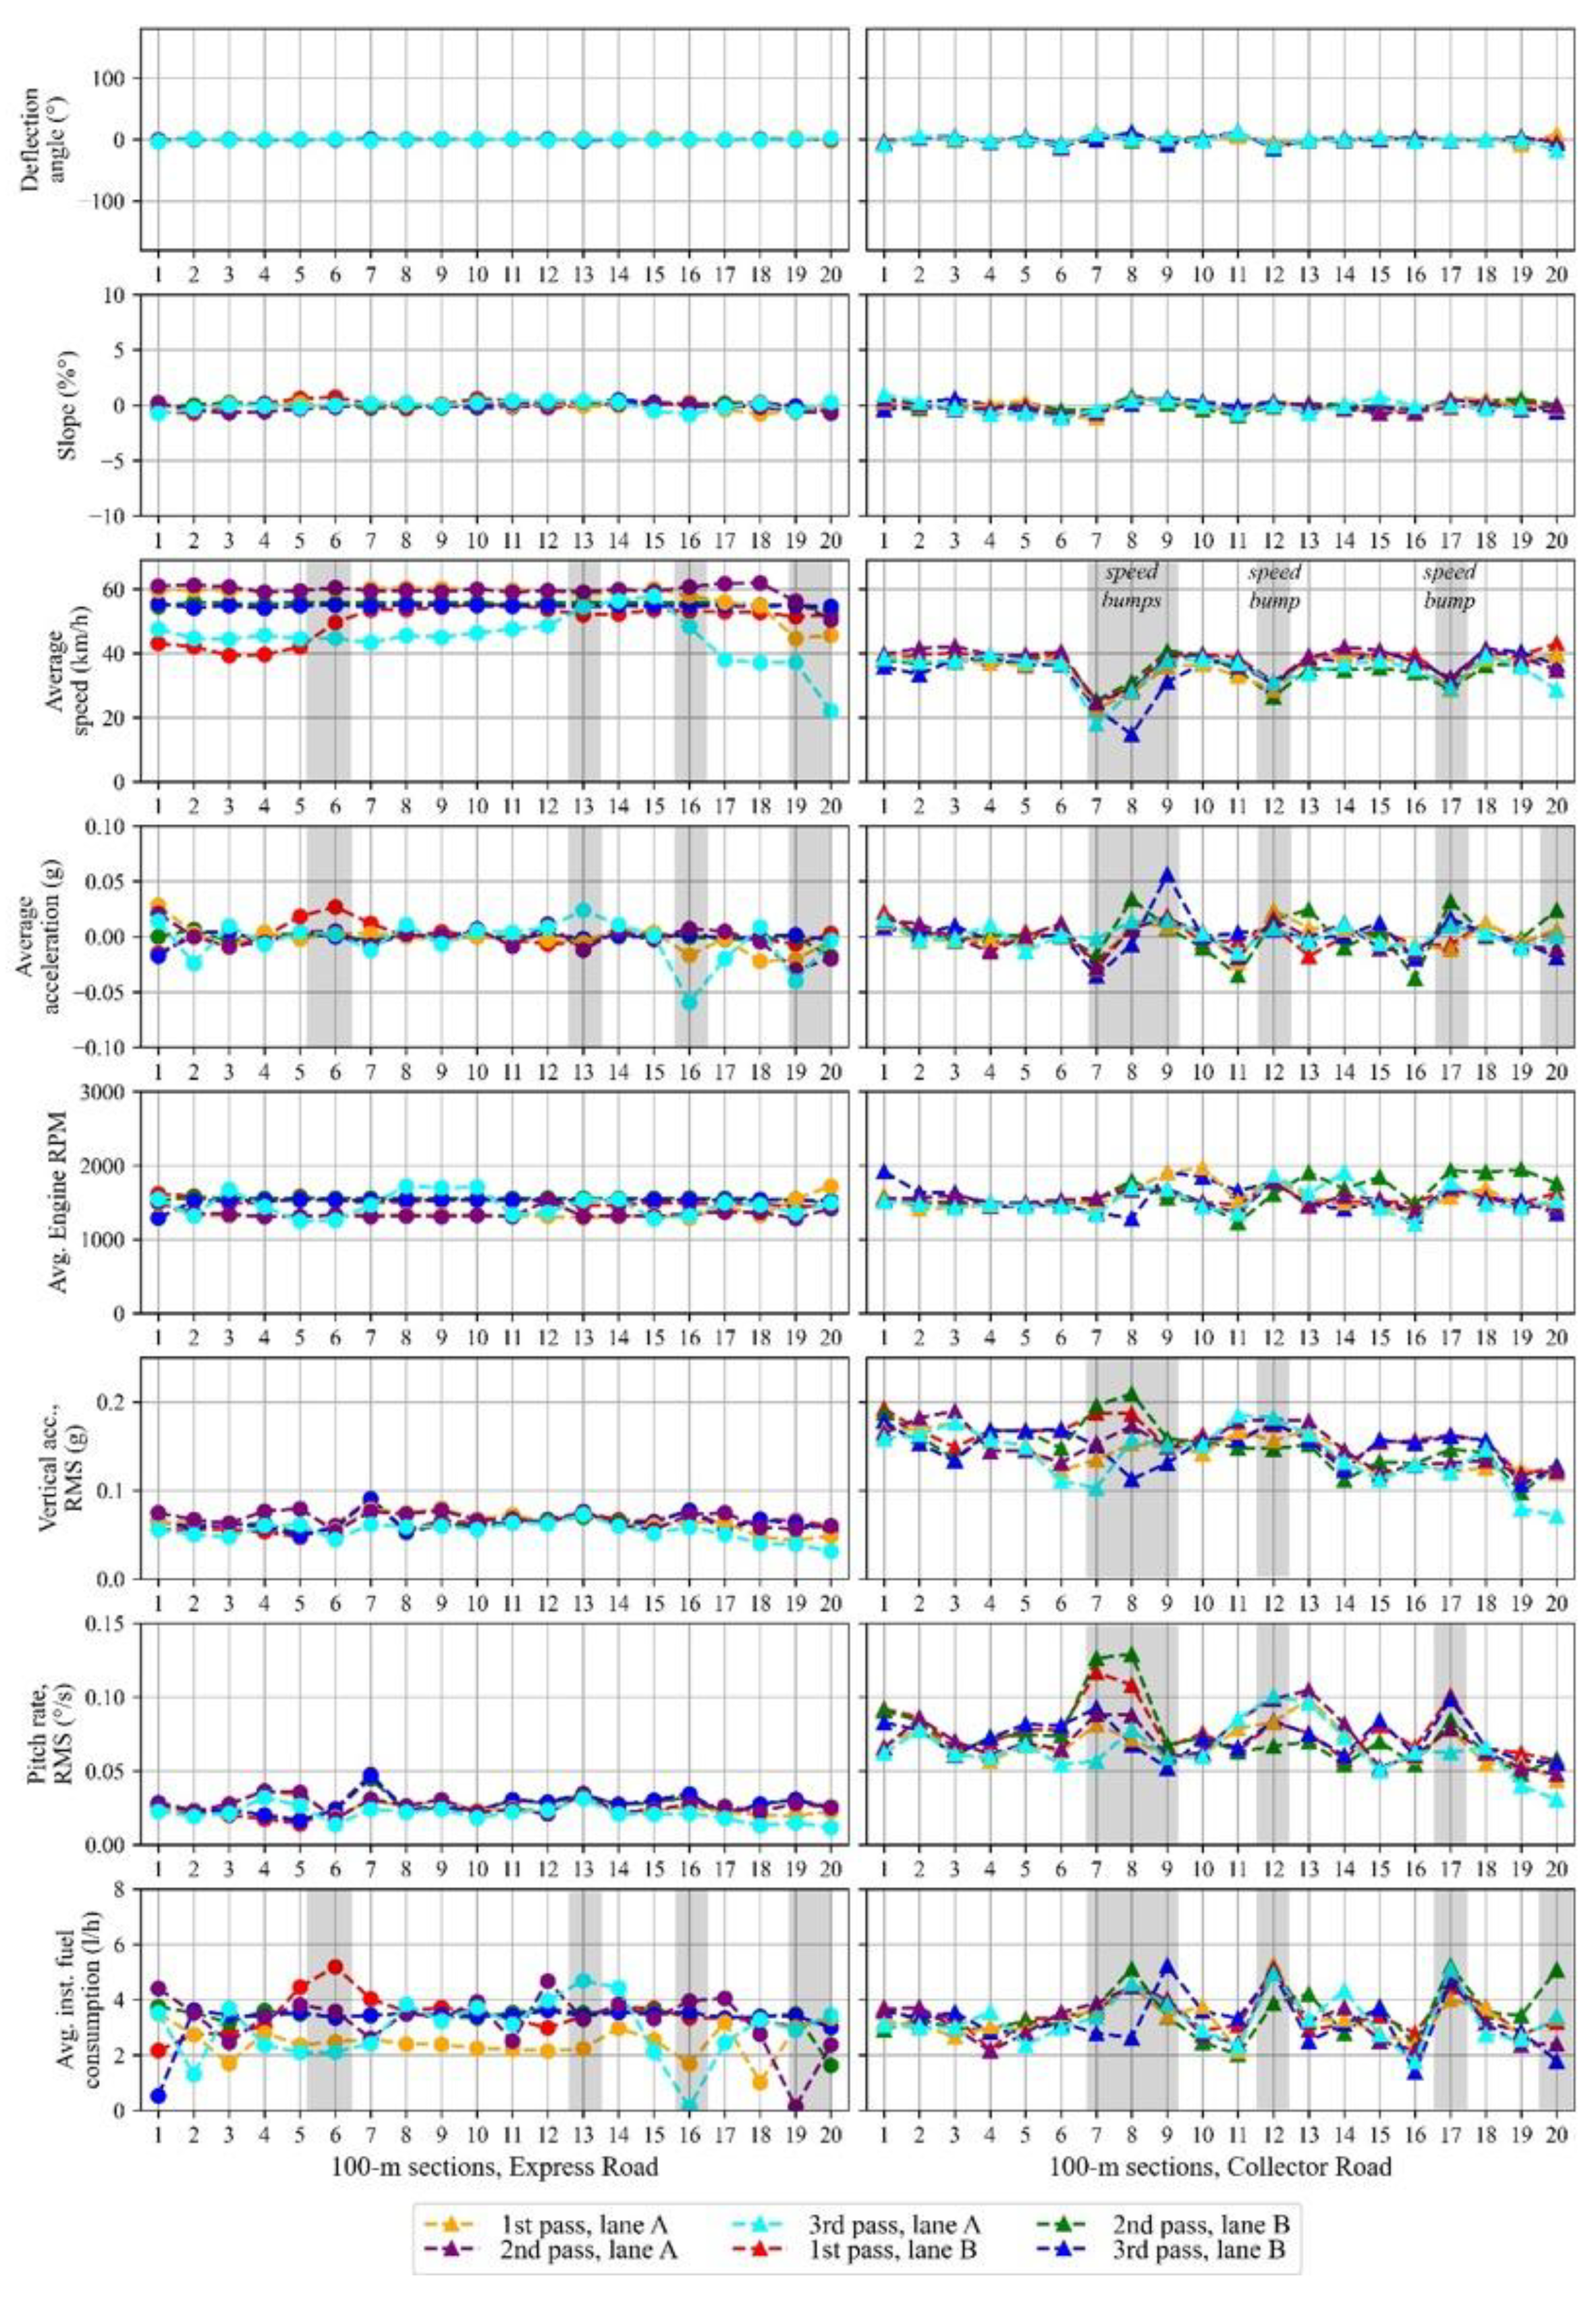
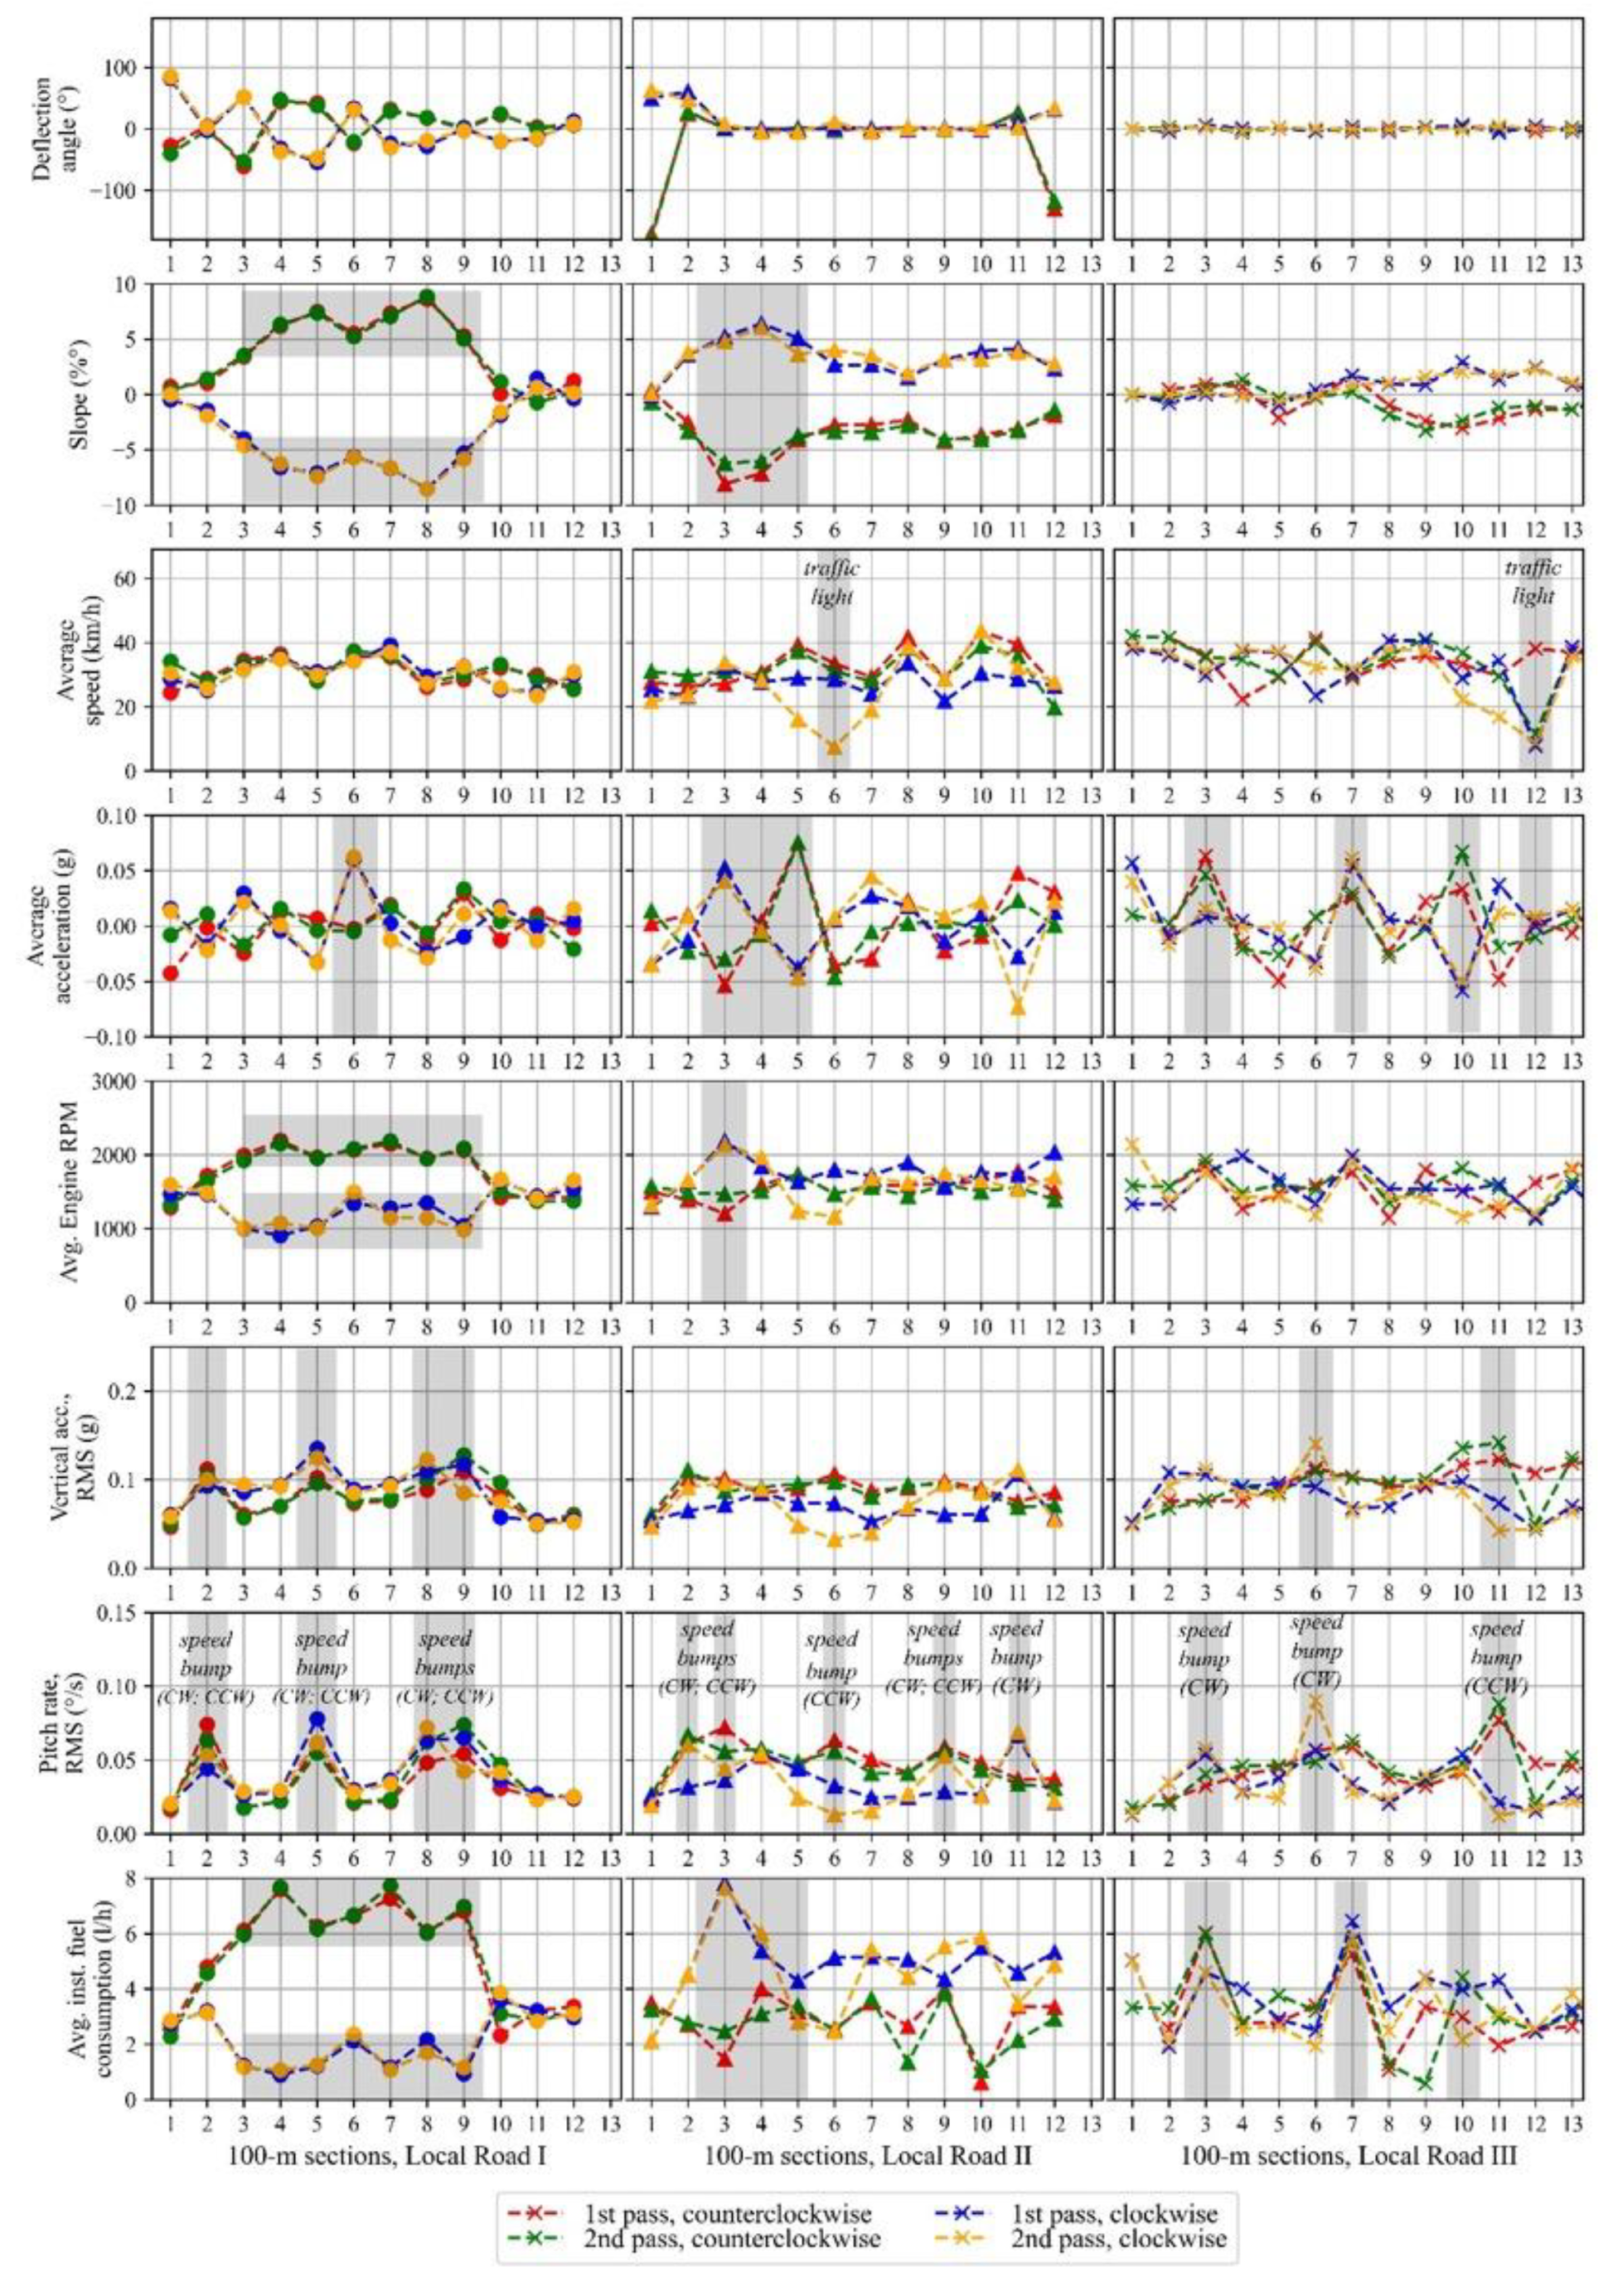
Figure 3 illustrates the variation of some of the most relevant parameters associated with the six passes (three per lane) on Express and Collector Roads. In complement, Figure 4 presents the same results for the four passes on the Local Roads (I, II, and III). For analysis purposes, the evaluated sections were divided into 100-m segments, numbered from 1 for each stretch. Moreover, to ensure comparability across stretches, a uniform vertical scale was used for all graphs corresponding to the same variable. The following are presented: (i) road grade (considering the vehicle direction in each pass); (ii) horizontal deflection (also considering the vehicle direction); (iii) speeds (average per section); (iv) average vehicle acceleration; (v) RMS of vertical acceleration as a vibration indicator in this direction and indirect indicator of pavement quality; (vi) RMS of pitch rate (rotational vibration around the lateral axis) and indirect indicator of pavement quality; and (vii) average instantaneous fuel consumption. For clarity and conciseness, the aspects associated with the influence of traffic and driving mode were evaluated through vehicle speed and accelerations, with the values obtained from the IMU related to these characteristics being disregarded. These showed lower correlations than speed and accelerations but could be used in future studies aiming to detail and separate the influences of traffic and driving mode. Furthermore, the indirect evaluation of the pavement will be restricted to the values of vertical linear vibration and pitch rate, as the correlations found for roll rate were lower.
In general terms, the results concerning road geometry and pavement quality derived from these low-cost sensors exhibited consistency across multiple passes and aligned with the expected behavior based on the known characteristics of the surveyed roads. The differences between the road segments in terms of sinuosity and grade are consistently represented from these measurements, with the Local Road I segment exhibiting the most extreme behavior (higher absolute slopes and deflections) in both aspects (despite the high deflection observed in the roundabout sections of Local Road II). Furthermore, the higher pavement roughness on the Collector Road is reflected in greater vibration regarding vertical linear acceleration and pitch rate compared to the other segments.
As a result of the hierarchical distinction between the evaluated sections, higher (around 60 km/h) and more stable speeds were observed in the Express Road passes. Another distinction between sections occurred in the linear and rotational vibration measurements, with differences in magnitude similar to those expected regarding the known differences in pavement roughness. It should be noted that the lower speeds on Collector Road should theoretically reduce vibrations given that vehicle vibration energy typically scales with squared speed, which reinforces the significant difference in pavement quality between sections. In the graphs, the shaded areas indicate the presence of notable peaks and valleys in the analyzed variables, which coincide with variations in fuel consumption. On the Express Road, although the speed profile was more uniform compared to the other stretches, higher values of acceleration and deceleration resulted in corresponding peaks and troughs in fuel consumption. On the Collector Road, speed bumps were associated with acceleration and deceleration events (as expected, given their traffic-calming function), as well as with peaks in vertical and pitch vibrations, which were also reflected in the corresponding fluctuations in fuel consumption.
Regarding the specific characteristics of Local Roads I, II, and III (Figure 4), it is worth noting the presence of traffic lights on Roads II and III, as well as speed bumps distributed along Roads I, II, and III. In Roads II and III, which consist of dual carriageways, the position of the speed bumps differs between the clockwise (label CW) and counterclockwise (label CCW) directions. This distinction is indicated in the figure labels, where the presence of speed bumps is marked separately for each direction of travel. Additionally, for Local Road II (which features a high frequency of speed bumps) only those that clearly corresponded to peaks in the analyzed variables were identified and labelled in the figure.
On Local Road I, the shaded region (sections 3 to 9) showed a consistent increase in slope for the counterclockwise passes, which resulted in a sustained high level of engine effort, evident from the elevated engine RPM and average acceleration. This increased demand correlates directly with a broad high plateau in fuel consumption, suggesting that the uphill gradient significantly affects energy use. This pattern reverses during the clockwise passes, where the same hachured segment corresponds to a broad low plateau in fuel consumption, reflecting the downhill movement and reduced engine demand.
Similar patterns were observed for the uphill/downhill interval of Local Road II. Additionally, the shaded region corresponding to the presence of multiple speed bumps and traffic lights is reflected in multiple peaks in the inertial quantities and vehicle acceleration. More pronounced oscillations in average fuel consumption were also observed, with relative peaks (or increases compared to previous consumption) due to the impact of these traffic-calming devices on ride dynamics and the effect of traffic-control lights on vehicle displacement. On Local Road III, the hachured areas also aligned with speed bumps, and once again, spikes in pitch and vertical vibrations were recorded alongside abrupt changes in acceleration. The effect of the traffic light was also observed in the speed profile, as well as the corresponding accelerations and decelerations. These variations, especially those associated with the speed bumps, were linked to local maxima in fuel consumption, further reinforcing the relationship, whether direct or indirect, between surface-induced disturbances and fuel usage.

4.2. Correlation Assessment

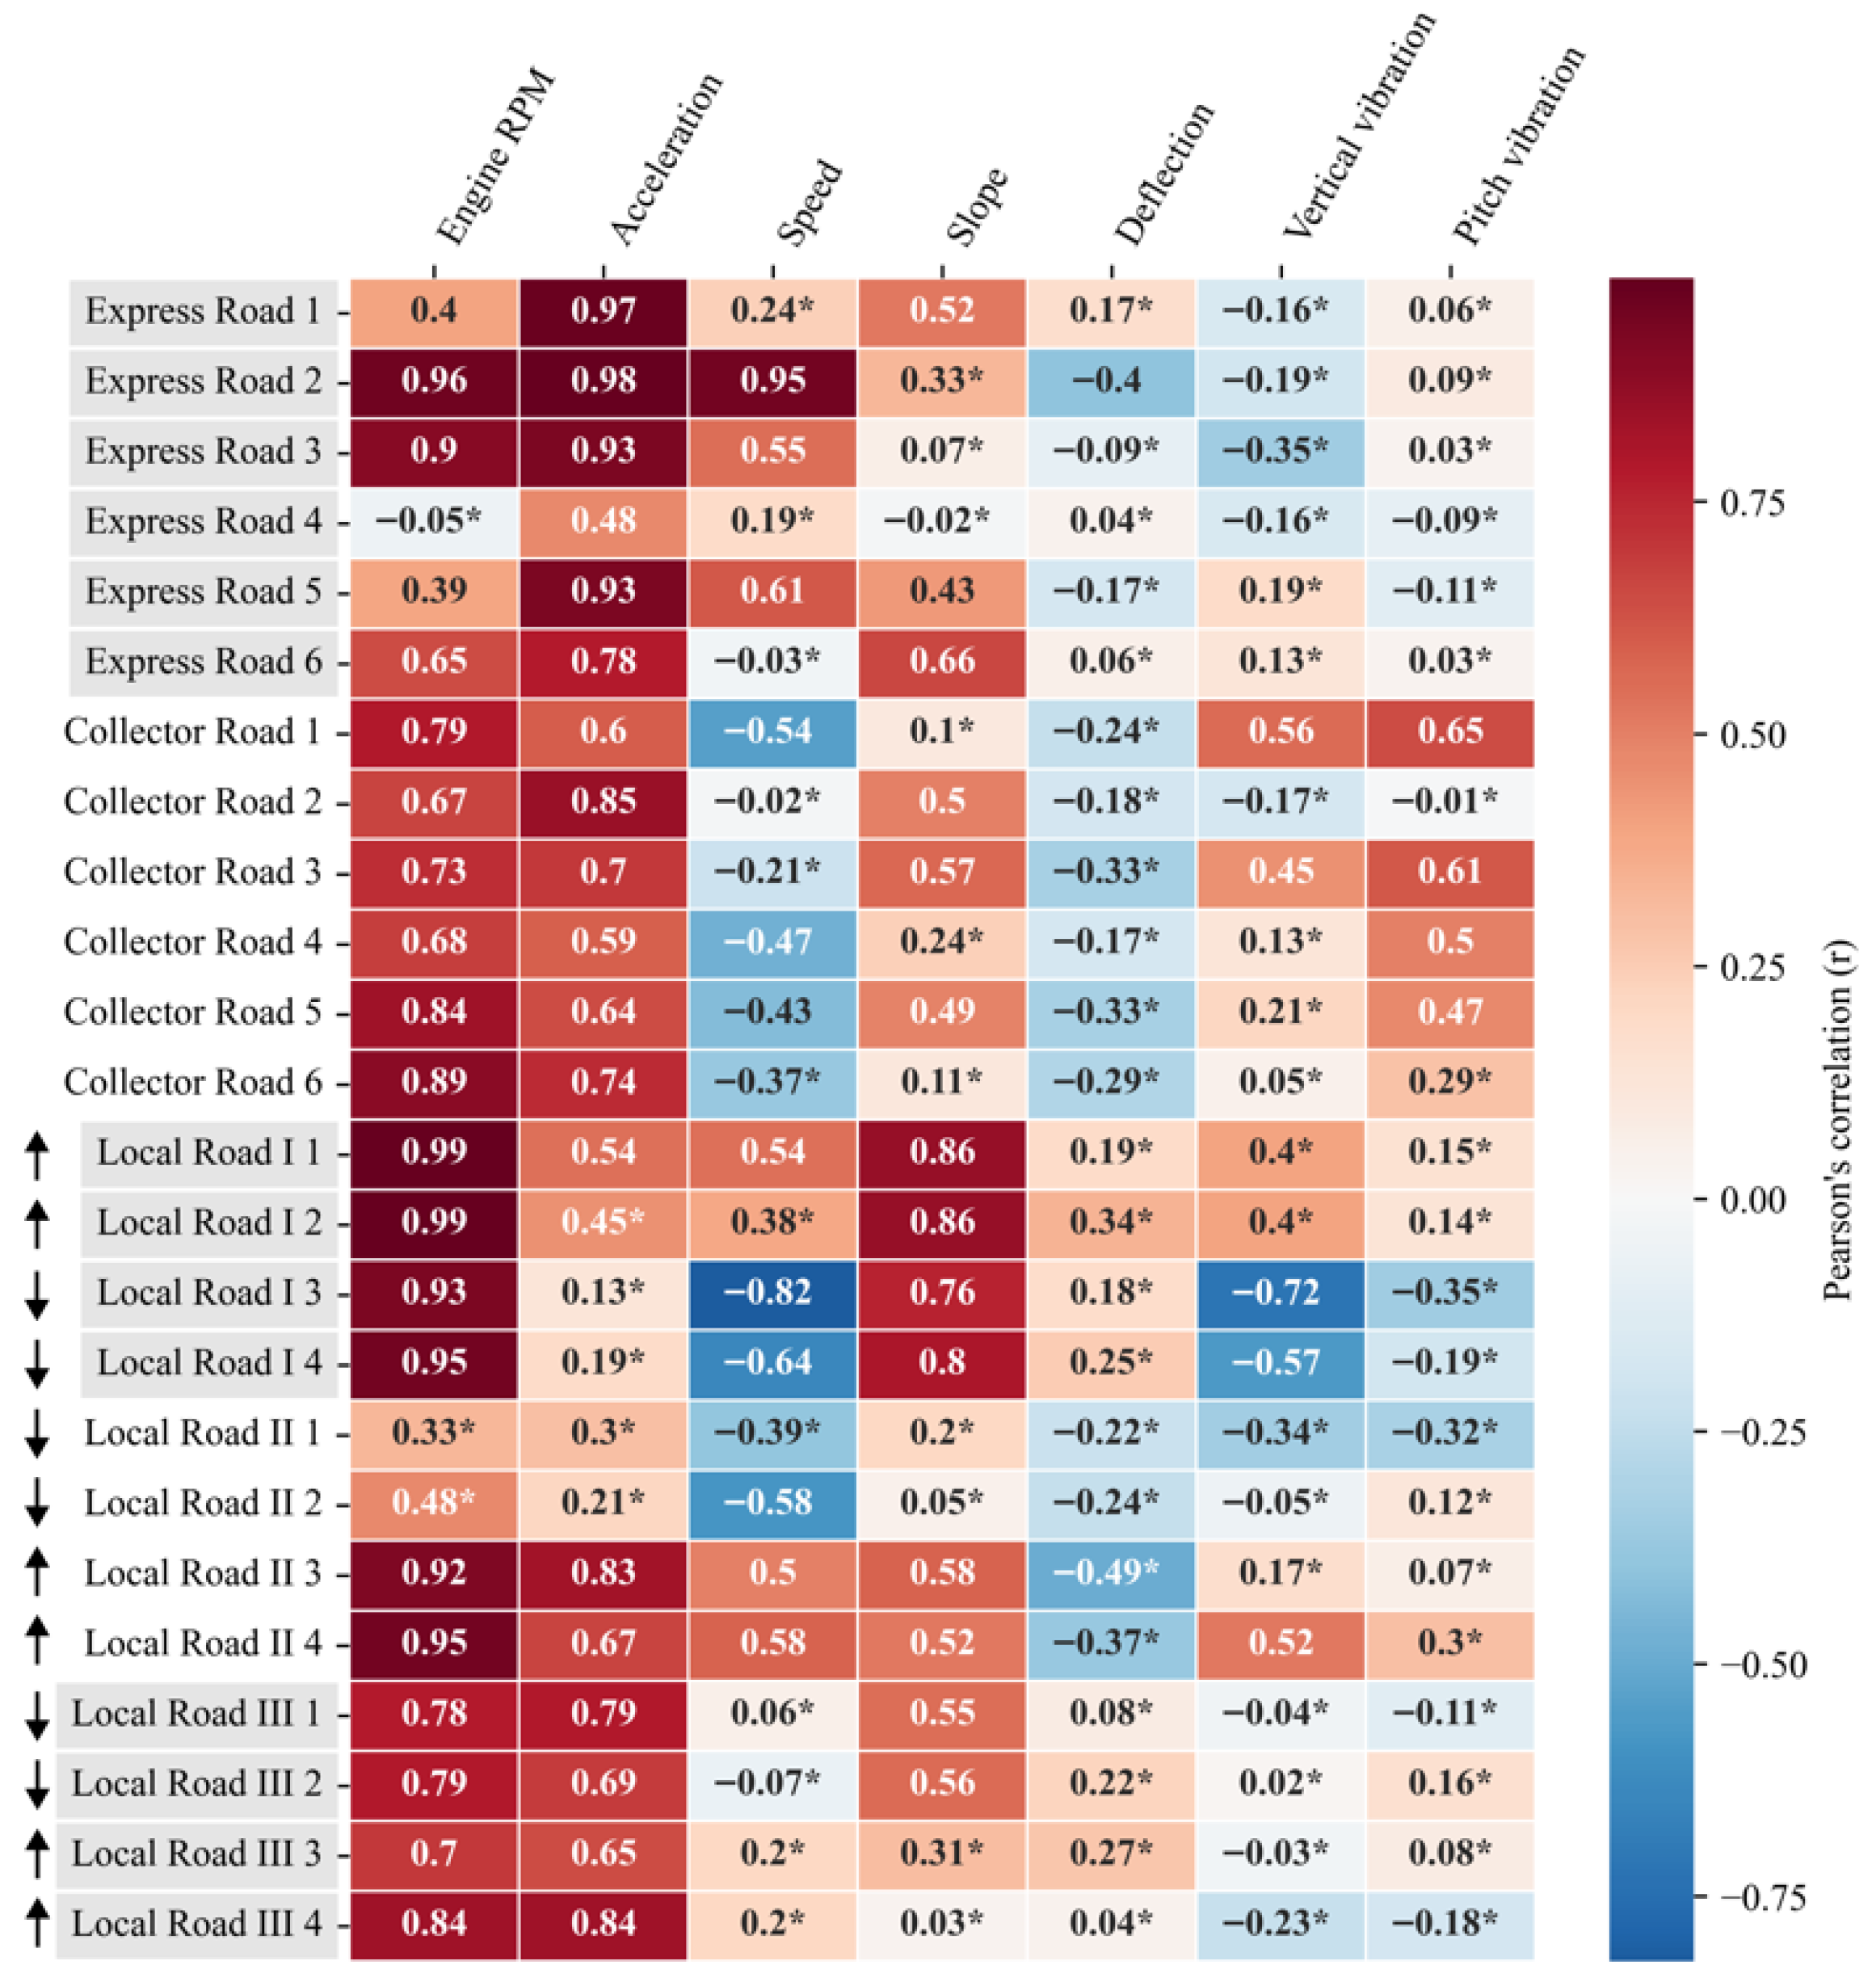
Figure 5 presents the Pearson’s correlation coefficients between instantaneous fuel consumption (l/h) and the selected variables across all test stretches and passes. The uphill and downhill passes are indicated with arrows for the Local Roads. In general, the analysis revealed marked contrasts between road categories, particularly in terms of the magnitude and consistency of correlations with propulsion-related variables and inertial quantities. As expected, strong and consistent correlations were observed with engine RPM and vehicle acceleration, reaffirming their direct influence on fuel demand, especially under high-load conditions. Speed exhibited context-dependent behavior, which appears to have resulted from the combined influence of road geometry (including slope and deflection) and pavement surface conditions (such as roughness and speed bumps) on the resulting speed profile, frequently yielding patterns that diverged from the expected direct effects of these infrastructure-related features. Road slopes also showed moderate to strong correlations in several passes, notably on Local Road I (characterized by greater elevation variation) and Express Road 6 (despite being predominantly flat). These findings indicate the sensitivity of fuel consumption even to mild slopes, potentially amplified by associated acceleration demands. Regarding inertial quantities, vertical vibration and pitch rate displayed more significant correlations on more degraded pavements. This may imply either an indirect relationship, arising from disturbances that influence driving dynamics, or a direct relationship, wherein increased vibration leads to higher energy consumption. Subsequent analysis focused on the specific characteristics observed within each road class, as outlined in the following paragraphs.
On the Express Road, fuel consumption exhibited consistently strong correlations with both engine RPM (r = 0.39 to 0.96 regardless of one non-significative correlation) and vehicle acceleration (r = 0.48 to 0.98). These strong associations may reflect the typical conditions of express, high-capacity corridors, where fuel demand is mainly governed by vehicle powertrain dynamics. Interestingly, speed also showed high correlations in several passes (e.g., r = 0.95 in the third pass), reinforcing the role of sustained velocities in shaping fuel profiles under uninterrupted traffic flow. In other words, a more regular speed profile is obtained and the positive correlation between RPM and speed (and, consequently, with fuel consumption) within a gear range regulates this phenomenon. Inertial variables such as vertical vibration and pitch rate, however, exhibited generally weak correlations (insignificant), indicating limited surface-induced impact on fuel variability in these smoother and more homogeneous roads.
In contrast, on the Collector Road, a wider range of correlation values, particularly with inertial measurements, was observed. While RPM and acceleration still dominated correlations (RPM r = 0.64 to 0.89; acceleration r = 0.63 to 0.84), inertial variables became more prominent: for the first pass, for instance, pitch vibration reached r = 0.63, and vertical vibration rose to r = 0.57. This suggests that besides traffic and conduction aspects, the pavement disturbances increasingly influence fuel consumption, especially in contexts with a highly distressed pavement surface. This influence can be direct (surface-related higher rolling resistance) or indirect (due to more frequent speed variations). Speed, in turn, displayed mixed and often negative correlations (e.g., r = −0.56 on pass 1), possibly reflecting braking events due to pavement roughness and anomalies (speed bumps).
On Local Road I, which is characterized by limited traffic interference and a curvy alignment and a variable longitudinal profile, high correlations were observed with engine RPM and slope (r values up to 0.99 and 0.86, respectively), along with moderate associations (negative and positive) with vertical vibration, underscoring the dominant impact of gradient on vehicle performance. In contrast, Local Road II, frequently interrupted by traffic lights and speed bumps, exhibited strong correlations with RPM and acceleration in specific passes (e.g., RPM r = 0.95 in pass 4), although the overall variability was greater due to these recurrent disturbances to traffic flow. In both roads, uphill passes showed a strong positive correlation with speed, while downhill passes exhibited a strong negative correlation. Given the similarity of speed profiles in both directions, this contrast further highlights the role of engine load: maintaining speed on inclines demands greater fuel input, whereas similar speeds can be sustained on declines with minimal engine effort.
Finally, Local Road III, marked by multiple low-speed constraints (such as speed bumps and traffic lights), exhibited consistently strong correlations with propulsion-related variables (acceleration and RPM > 0.65 in all passes) and no significant correlation with inertial variables. Given that all local roads exhibited similar levels of pavement degradation and frequency of speed bumps, and that the observed correlations between vibration and fuel consumption were at times contrasting, including some negative values, it can be inferred that the direct influence of pavement roughness on fuel consumption is limited. Moreover, this effect is likely overshadowed by the dominant factors such as road gradient, vehicle speed patterns, and engine load.
In summary, the results confirm that propulsion-related variables and road grade dominated fuel consumption patterns across all contexts. However, the relative influence of inertial variables becomes more significant on roads where surface irregularities and speed interruptions interact with driving dynamics. These findings support the hypothesis of a combined direct and indirect influence of infrastructure and operational conditions on vehicular energy demand.

4.3. Multiple Linear Regression Modeling

To quantify the relative influence of kinematic, topographic, and pavement factors on fuel consumption, Multiple Linear Regression (MLR) models were developed for both the global dataset and specific stratified scenarios. Table 3 presents the standardized coefficients (β), which allow for a direct comparison of variable importance, alongside the Adjusted R2 values that serve as indicators of model performance across different regimes. In this table, the “Local (Uphill)” and “Local (Downhill)” columns aggregate all local road segments based on slope direction to isolate the gravitational dominance, whereas the “Local Road I” column is presented separately to explicitly evaluate the impact of high sinuosity.
The VIF was computed to assess multicollinearity among predictors in the Global Model. All variables exhibited VIF values below the critical threshold of 10, confirming that the regression coefficients were not compromised by redundant correlations. It was noted that the relatively high values observed for vertical and pitch vibrations (7.6 and 8.5) reflect the inherent mechanical coupling of the vehicle suspension, where surface irregularities simultaneously trigger both translational and rotational responses.
The variation in the Adjusted R2 values, ranging from 0.66 to 0.92, offers significant insight into the physical nature of fuel consumption in different environments. The highest explanatory power (R2 = 0.92) was observed in the Uphill scenario. This indicates that when the vehicle operates under high load to overcome gravity, the relationship between power demand and consumption is highly linear and predictable. Conversely, the Express Road scenario yielded the lowest value (R2 = 0.66), suggesting that in high-speed, free-flow conditions, consumption is influenced by unmodeled complex factors, such as aerodynamic non-linearities and subtle throttle transients, which are less effectively captured by a simple linear framework compared to the dominant gravitational forces in uphill segments.
Regarding traffic dynamics, the breakdown of results reveals that the influence of kinematic variables is strictly context-dependent. In the Express Road scenario, the variable Speed was statistically non-significant (β = 0.137, p > 0.10), whereas Acceleration proved to be a major determinant (β = 0.637). This counter-intuitive finding suggests that on urban expressways, fuel consumption variability is driven less by the absolute cruising speed—which remains relatively constant—and more by the flow instability and micro-accelerations imposed by traffic interactions. In contrast, on the Collector Road, the weights of acceleration and speed are more balanced, reflecting the mixed nature of this traffic regime.
The impact of topography provided the strongest physical validation for the proposed sensing architecture. In the uphill scenario, consumption was heavily dominated by road slope (β = 0.375) and Engine RPM (β = 0.540), with vehicle speed becoming non-significant, confirming that maintaining motion against gravity imposes a constant fuel penalty regardless of minor speed variations. More notably, the downhill scenario successfully captured the interaction between driving strategy and engine management: Speed presented a significant negative coefficient (β = −0.363). This inverse relationship validates the detection of the Deceleration Fuel Cut-Off (DFCO) phenomenon, where higher speeds maintained by inertia allow the ECU to cut fuel injection, whereas lower speeds—often associated with braking maneuvers—prevent the activation of this efficiency mechanism.
Finally, the pavement–vehicle interaction metrics—vertical and pitch vibration—demonstrated distinct roles, despite both being indicators of road surface quality. Theoretically, road irregularities induce both vertical excitation and pitch oscillation, contributing to energy dissipation. However, the regression results revealed a dichotomy driven by vehicle dynamics and driver behavior. The pitch vibration maintained a positive correlation in the Global Model (β = 0.472), acting as a robust proxy for surface unevenness. Unlike vertical acceleration, pitch oscillation dynamics are less sensitive to immediate speed reductions, representing a persistent mechanical energy drain (damping of body pitch) that remains significant even at moderate speeds. Conversely, vertical vibration presented a negative coefficient (β = 0.415). Since vertical acceleration magnitude is highly dependent on vehicle speed, this negative sign may capture the indirect behavioral response: on deteriorated surfaces (high theoretical RMS), drivers instinctively reduce speed and throttle demand to preserve comfort. This behavioral adaptation overrides the mechanical rolling resistance penalty, leading to the observed inverse relationship where rougher roads are associated with lower fuel consumption due to the induced conservative driving mode.
Nevertheless, a global analysis considering pavement metrics may induce misleading conclusions, as the route with the best pavement quality (Express Road) is inherently the one with the highest speed and steady flow. Thus, it becomes interesting to evaluate the coefficients between scenarios to decouple the mechanical impact of the surface from the operational regime. In this stratified view, the pitch rate presented a significant positive correlation in the Global, Express, and Collector models, acting as a robust mechanical metric in higher-energy regimes. However, in the Local Road scenarios, this variable lost statistical significance due to the dominance of the gradient resistance.
Conversely, the vertical acceleration coefficients revealed a distinct behavioral gradient that correlated with the baseline quality of each route. On the Express Road (best quality), the strong negative coefficient (β = −0.329) points to a sharp throttle reduction in response to sporadic irregularities, which represent high-risk anomalies at highway speeds. In contrast, on the Collector Road (worst quality) and Local Roads (intermediate quality), the significantly weaker coefficients (β approx. −0.10) suggest a saturation effect: since drivers already adopt a continuously conservative driving mode on these deteriorated surfaces, the marginal impact of specific roughness features on fuel consumption is diminished compared to the acute adjustments triggered on the otherwise smooth expressway. In the individual analysis of Local Road I, the observed higher beta coefficient suggests a stronger influence from speed bumps, likely due to the absence of traffic lights and the lower traffic volume on this stretch.
Finally, even in the most sinuous segment, deflection remained statistically non-significant as the intense gravitational load imposed by steep grades physically overshadows the secondary energy dissipation caused by lateral maneuvers.
While acknowledging the simplifying assumptions of the linear framework used in this section, the results fulfill the study’s scope by establishing a foundational validation of the low-cost sensing architecture. The consistency of the signs and magnitudes of the coefficients across different regimes demonstrates that the sensors correctly capture the physical forcing functions acting on the vehicle.
Nevertheless, the regression analysis results align with and extend the established findings in the literature. The observed dominance of acceleration over speed in the Express Road scenario mirrors the traffic-flow instability effects reported by Boggio-Marzet et al. [46], confirming that micro-maneuvers outweigh cruising speed in energy demand. Furthermore, the structural necessity of separating models by road hierarchy validates the stratification approach advocated by Shang et al. [48]. However, this study advances beyond these precedents—and the machine learning frameworks of Zhang et al. [47]—by demonstrating that a linear model can achieve high explanatory power (R2 approx. 0.92) through the integration of inertial metrics and a near comprehensive consideration of context variables.
It is recognized that the relationship between these variables and fuel consumption is inherently non-linear and complex. However, the high R2 values obtained (up to 0.92) suggest that for the purpose of identifying key influencing factors and validating sensor responsiveness, the MLR approach is sufficient. More complex modeling techniques, such as Machine Learning or neural networks, are envisioned for future stages of this research, contingent upon the acquisition of larger-scale datasets that would allow for the generalization of these findings beyond the specific vehicle and route tested herein.

5. Conclusions

This study proposed real-traffic data collection to quantify the scenario’s contribution to fuel consumption. The results confirm that vehicular instantaneous energy consumption, although primarily determined by the vehicle’s characteristics, is substantially modulated by driving behavior, traffic conditions, and road infrastructure attributes, all of which influence the resulting environmental impact.
The results from five roads—distinct in terms of hierarchy, geometry, and pavement condition—highlighted the significant role of driving profile and traffic-related factors, such as speed (including acceleration) and engine RPM, in determining fuel consumption. Strong correlations were observed between acceleration and RPM across different passes, underscoring their importance in vehicular energy demand. Among the other variables, road slope emerged as a key factor modulating fuel consumption. In addition to the expected strong correlations in sections with more noticeable gradients, the relationship between fuel consumption and slope remained significant in most passes, even in predominantly flat segments of the route. This indicates that even slight elevation changes, such as minor inclines or declines, can have a measurable impact on vehicle energy demand by influencing both gradient resistance and driving behavior.
In addition to slope, discrete pavement anomalies such as speed bumps also exerted a substantial impact on fuel consumption. These features influenced energy use directly, through abrupt vertical displacements, and indirectly, by forcing deceleration and subsequent acceleration as vehicles approached and exited these traffic calming elements. A similar indirect modulation was observed in the presence of traffic signals, which induced speed pattern adjustments that led to variations in fuel demand. When considering continuous pavement roughness (indirectly evaluated through inertial measurements), measurable effects were observed only on the Collector Road segment, a more degraded section where roll vibration showed a strong correlation with fuel consumption (reaching r = 0.63 for first pass). The multivariate analysis also confirmed the inherent mechanical coupling of the suspension system, where vertical and pitch vibrations exhibited elevated multicollinearity. While statistically acceptable, this physical redundancy indicates that a single surface irregularity simultaneously triggers complex dynamic responses. These findings highlight the need for more extensive data collection to better distinguish and quantify the direct and indirect effects of the infrastructure elements on vehicle energy demand.
Beyond its empirical results, this study contributes with a methodological approach that can inform future research in eco-driving, eco-routing, the integration of environmental performance into pavement management practices and into road geometry projects. In real-traffic data collection, where full control over driving and contextual variables is not feasible, extensive repetition and abundant data gathering are essential to disentangle the direct and indirect effects of traffic, driver behavior, and infrastructure characteristics on fuel consumption. Therefore, less expensive and simpler data acquisition methods become mandatory. The use of the proposed consumer-grade sensors, including basic IMU/GPS modules and OBD scanners, under the proposed data processing proved effective in capturing high-resolution data on vehicle dynamics and infrastructure features under actual operating conditions. The elevated consistency observed across multiple passes over the same stretch in terms of infrastructure-related features, along with the confirmation of the expected high correlation coefficients for acceleration and engine speed, demonstrates the feasibility of using such tools for the continuous monitoring of fuel consumption sensitivity to microscale variations in road and traffic conditions.
Together, these findings establish the proposed low-cost sensing framework not merely as an affordable alternative, but as a strategic tool for high-resolution energy efficiency screening across urban networks. By bridging the gap between raw vehicle telemetry and actionable environmental metrics, this approach enables the systematic identification of consumption hotspots, providing a scalable foundation for integrating energy performance indicators into large-scale mobility management and road design policies.
Despite the consistency of the findings, certain limitations regarding this experimental survey and the proposed framework should be noted. Although the accuracy of the consumer-grade sensors has been validated in prior controlled tests by the authors, their reliability under actual operating conditions is subject to intermittent malfunctions or signal dropouts. These operational instabilities required rigorous data cleaning and filtering to ensure dataset integrity. The experiment was also subject to intermittent variables, such as tire air pressure fluctuations and localized atmospheric shifts, notwithstanding the observed stability of general environmental conditions during the runs. While these effects are marginal compared to the dominant factors (road gradient, traffic dynamics, and driving mode), they define the precision boundaries of the current experimental dataset. Crucially, the regression coefficients derived in this study are strictly intrinsic to the specific vehicle and scenarios evaluated, lacking statistical representativeness for heterogeneous fleets or broader contexts. However, the cost-effectiveness of the proposed framework is precisely what renders the future assessment of a diversity of vehicles and operational domains viable, potentially overcoming these limitations.
Based on these methodological findings, which enable the profuse reproduction of tests under real-world conditions and across diverse scenarios, the next research steps will encompass a broader range of conditions. These include variations in meteorological factors, diverse driving environments (including urban and interurban settings), different levels of pavement degradation, and geometric configurations (accounting for variations in sinuosity and grade). Moreover, it is essential to incorporate a range of driving profiles (including conservative, moderate, and aggressive styles) as well as diverse vehicle characteristics to achieve a comprehensive and nuanced understanding of the factors influencing energy consumption in road transport. Specifically, future applications of this framework to electric vehicles are expected to reveal distinct energy profiles, particularly regarding the potential for energy recovery on favorable slope and the amplified sensitivity of battery range to the increased rolling resistance caused by pavement roughness. Such comprehensive understanding will serve as a foundation for developing targeted approaches for more sustainable, data-driven strategies in mobility and infrastructure management.

Author Contributions

Conceptualization, R.H.d.O., L.N.M., K.V.S. and F.G.V.d.A.F.; methodology, R.H.d.O., L.N.M., K.V.S. and F.G.V.d.A.F.; software, R.H.d.O.; formal analysis, R.H.d.O., L.N.M., K.V.S., F.G.V.d.A.F., and L.L.H.; investigation, R.H.d.O. and L.N.M.; data curation, R.H.d.O.; writing—original draft preparation, R.H.d.O.; writing—review and editing, R.H.d.O., L.N.M., K.V.S., F.G.V.d.A.F., and L.L.H.; visualization, R.H.d.O.; funding acquisition, R.H.d.O., L.N.M., K.V.S. and F.G.V.d.A.F. All authors have read and agreed to the published version of the manuscript.

Funding

This research was partially supported by the Amigos da Poli Endowment Fund under project number 2024-013 (Call 1/2024) and by the New Faculty Incentive Program (PIND) from the University of Campinas (UNICAMP), grant number 2627/25.

Institutional Review Board Statement

Not applicable.

Informed Consent Statement

Not applicable.

Data Availability Statement

The datasets presented in this article are not publicly available because they are part of an ongoing study. Requests to access the datasets should be directed to the corresponding author.

Conflicts of Interest

The authors declare no conflicts of interest.

References

  1. IEA. World Energy Outlook 2024; International Energy Agency: Paris, France, 2024. [Google Scholar]
  2. Axsen, J.; Plötz, P.; Wolinetz, M. Crafting strong, integrated policy mixes for deep CO2 mitigation in road transport. Nat. Clim. Change 2020, 10, 809–818. [Google Scholar] [CrossRef]
  3. Jaramillo, P.; Kahn Ribeiro, S.; Newman, P.; Dhar, S.; Diemuodeke, O.E.; Kajino, T.; Lee, D.S.; Nugroho, S.B.; Ou, X.; Strømman, A.H.; et al. Transport. In Climate Change 2022—Mitigation of Climate Change; IPCC, Ed.; Cambridge University Press: Cambridge, UK, 2022; pp. 1049–1160. [Google Scholar] [CrossRef]
  4. Oliveira, R.H.; Mazzoni, L.N.; Savasini, K.V.; Almeida Filho, F.G.V.; Ho, L.L. Experimental Study on the Impact of Driving Mode, Traffic, and Road Infrastructure on the Energy Consumption of Road Transport. In Proceedings of the 20th Conference on Sustainable Development of Energy, Water and Environment Systems (SDEWES), Dubrovnik, Croatia, 5–10 October 2025. [Google Scholar]
  5. Van Dam, T.J.; Harvey, J.T.; Muench, S.T.; Smith, K.D.; Snyder, M.B.; Al-Qadi, I.L.; Ozer, H.; Meijer, J.; Ram, P.; Roesler, J.R.; et al. Towards Sustainable Pavement Systems: A Reference Document; U.S. Department of Transportation: Washington, DC, USA, 2015. [Google Scholar]
  6. Xu, N.; Li, X.; Liu, Q.; Zhao, D. An overview of eco-driving theory, capability evaluation, and training applications. Sensors 2021, 21, 6547. [Google Scholar] [CrossRef]
  7. Huang, Y.; Ng, E.C.Y.; Zhou, J.L.; Surawski, N.C.; Chan, E.F.C.; Hong, G. Eco-driving technology for sustainable road transport: A review. Renew. Sustain. Energy Rev. 2018, 93, 596–609. [Google Scholar] [CrossRef]
  8. You, G. Sustainable vehicle routing problem on real-time roads: The restrictive inheritance-based heuristic algorithm. Sustain. Cities Soc. 2022, 82, 103887. [Google Scholar] [CrossRef]
  9. Bosurgi, G.; Marra, S.; Pellegrino, O.; Sollazzo, G. Reducing CO2 emissions by improving road design: A driving simulator study. Transport 2025, 40, 23228. [Google Scholar] [CrossRef]
  10. Chong, D.; Wang, Y. Impacts of flexible pavement design and management decisions on life cycle energy consumption and carbon footprint. Int. J. Life Cycle Assess. 2017, 22, 952–971. [Google Scholar] [CrossRef]
  11. Shah, R.; Nezamuddin, N.; Levin, M. Supply-side network effects on mobile-source emissions. Transp. Policy 2020, 98, 21–34. [Google Scholar] [CrossRef]
  12. Xu, Z.; Kang, Y.; Cao, Y.; Li, Z. Deep amended COPERT model for regional vehicle emission prediction. Sci. China Inf. Sci. 2020, 63, 140314. [Google Scholar] [CrossRef]
  13. Kovács, A.; Leelőssy, Á.; Tettamanti, T.; Esztergár-Kiss, D.; Mészáros, R.; Lagzi, I. Coupling traffic originated urban air pollution estimation with an atmospheric chemistry model. Urban Clim. 2021, 37, 100838. [Google Scholar] [CrossRef]
  14. Nariendra, P.W.; Lestiani, M. Calibration of HDM-4 Model for Fuel Consumption in Heavy-Duty Trucks: Integration of Telematics, Engine Speed, and Aerodynamics. Automot. Exp. 2025, 8, 109–121. [Google Scholar] [CrossRef]
  15. Zhong, H.; Chen, K.; Liu, C.; Zhu, M.; Ke, R. Models for predicting vehicle emissions: A comprehensive review. Sci. Total Environ. 2024, 908, 168188. [Google Scholar] [CrossRef]
  16. Mądzieł, M. Vehicle emission models and traffic simulators: A review. Energies 2023, 16, 3799. [Google Scholar] [CrossRef]
  17. Gebisa, A.; Gebresenbet, G.; Gopal, R.; Nallamothu, R.B. Driving cycles for estimating vehicle emission levels and energy consumption. Future Transp. 2021, 1, 586–610. [Google Scholar] [CrossRef]
  18. Chang, Y.; Yang, W.; Zhao, D. Energy Efficiency and Emission Testing for Connected and Automated Vehicles Using Real-World Driving Data. arXiv 2018, arXiv:1805.07643. [Google Scholar] [CrossRef]
  19. Rivera-Campoverde, N.D.; Arenas-Ramírez, B.; Muñoz Sanz, J.L.; Jiménez, E. GPS Data and Machine Learning Tools, a Practical and Cost-Effective Combination for Estimating Light Vehicle Emissions. Sensors 2024, 24, 2304. [Google Scholar] [CrossRef] [PubMed]
  20. Xu, H.; Zhang, L.; Chang, H.; Han, J.; Wu, D.; Gong, X.; Fu, M. Measuring the route topography impact on real driving emissions based on neural network models. Environ. Res. 2023, 231, 116072. [Google Scholar] [CrossRef] [PubMed]
  21. Tang, G.; Liu, D.; Liu, J.; Deng, X. Research on the correlation mechanism between complex slopes of mountain city roads and the real driving emission of heavy-duty diesel vehicles. Sustainability 2025, 17, 554. [Google Scholar] [CrossRef]
  22. Cieślik, W.; Szwajca, F.; Golimowski, J. The possibility of energy consumption reduction using the ECO driving mode based on the RDC test. Combust. Engines 2020, 182, 25–31. [Google Scholar] [CrossRef]
  23. Fahmin, A.; Zhang, S.; Cheema, M.A.; Toosi, A.N.; Rakha, H.A. Improving Eco-Friendly Routing Considering Detailed Mobility Profiles, Driving Behavior, and Vehicle Type; Lecture Notes in Computer Science; Springer: Cham, Switzerland, 2022; Volume 13459, pp. 128–140. [Google Scholar] [CrossRef]
  24. Fontaras, G.; Zacharof, N.G.; Ciuffo, B. Fuel consumption and CO2 emissions from passenger cars in Europe—Laboratory versus real-world emissions. Prog. Energy Combust. Sci. 2017, 60, 97–131. [Google Scholar] [CrossRef]
  25. Goyal, Y.; Meena, S.; Singh, S.K.; Kulshrestha, M. Real-time emissions of gaseous pollutants from vehicles under heterogeneous traffic conditions. Sci. J. Silesian Univ. Technol. Transp. 2023, 118, 55–75. [Google Scholar] [CrossRef]
  26. Hussain, A.; Chen, S.; Shaikh, S.; Ullah, I.; Ong, G.P. Exploring the non-linear relationship between driving behavior and vehicle fuel consumption using long short-term memory. Int. J. Sustain. Transp. 2025, 19, 1073–1090. [Google Scholar] [CrossRef]
  27. Wang, Z.-F.; Guo, Y.-Q.; Wei, F.-L.; Guo, D.; Li, Q.-Y.; Pirov, J. Grounded theory-based analysis of factors influencing driving behavior. Traffic Inj. Prev. 2025, 1–9. [Google Scholar] [CrossRef]
  28. Michelin. The Tyre—Rolling Resistance and Fuel Savings; Société de Technologie Michelin: Clermont-Ferrand, France, 2003. [Google Scholar]
  29. Costagliola, M.A.; Costabile, M.; Prati, M.V. Impact of road grade on real driving emissions from two Euro 5 diesel vehicles. Appl. Energy 2018, 231, 586–593. [Google Scholar] [CrossRef]
  30. Liu, H.; Rodgers, M.O.; Guensler, R. The impact of road grade on vehicle acceleration behavior, PM2.5 emissions, and dispersion modeling. Transp. Res. Part D Transp. Environ. 2019, 75, 297–319. [Google Scholar] [CrossRef]
  31. Meng, X.; Pang, K.; Di, B.; Li, W.; Wang, Y.; Zhang, J.; Xu, Y. Road grade estimation for vehicle emissions modeling using electronic atmospheric pressure sensors. Front. Environ. Sci. 2023, 10, 1051858. [Google Scholar] [CrossRef]
  32. Xie, B.; Li, T.; Liu, T.; Chen, H.; Li, H.; Li, Y. Exploring high-emission driving behaviors of heavy-duty diesel vehicles based on engine principles under different road grade levels. Sci. Total Environ. 2024, 951, 173017. [Google Scholar] [CrossRef] [PubMed]
  33. Huang, Y.; Bird, R.; Bell, M. A comparative study of the emissions by road maintenance works and the disrupted traffic using life cycle assessment and micro-simulation. Transp. Res. Part D Transp. Environ. 2009, 14, 197–204. [Google Scholar] [CrossRef]
  34. Trupia, L.; Parry, T.; Neves, L.C.; Lo Presti, D. Rolling resistance contribution to a road pavement life cycle carbon footprint analysis. Int. J. Life Cycle Assess. 2017, 22, 972–985. [Google Scholar] [CrossRef]
  35. Harvey, J.T.; Meijer, J.; Ozer, H.; Al-Qadi, I.; Saboori, A.; Kendall, A. Pavement Life Cycle Assessment Framework; FHWA-HIF-16-014; Federal Highway Administration: Washington, DC, USA, 2016. [Google Scholar]
  36. Wang, H.; Al-Saadi, I.; Lu, P.; Jasim, A. Quantifying greenhouse gas emissions of asphalt pavement preservation at construction and use stages using life-cycle assessment. Int. J. Sustain. Transp. 2020, 14, 25–34. [Google Scholar] [CrossRef]
  37. Chatti, K.; Zaabar, I. Estimating the Effects of Pavement Condition on Vehicle Operating Costs; NCHRP Report 720; National Academies Press: Washington, DC, USA, 2012. [Google Scholar]
  38. El Khoury, J.; Akle, B.; Katicha, S.; Ghaddar, A.; Daou, M. A microscale evaluation of pavement roughness effects for asset management. Int. J. Pavement Eng. 2014, 15, 323–333. [Google Scholar] [CrossRef]
  39. Greene, S.; Akbarian, M.; Ulm, F.-J.; Gregory, J. Pavement Roughness and Fuel Consumption; Concrete Sustainability Hub; Massachusetts Institute of Technology: Cambridge, MA, USA, 2013. [Google Scholar]
  40. Nobre Junior, E.F.; Arantes, A.E.; Azevedo, P.O. Effects of international roughness index on vehicle emissions. Int. J. Veh. Syst. Model. Test. 2021, 15, 41–52. [Google Scholar] [CrossRef]
  41. Oliveira, V.C.; Bertoncini, B.V.; Branco, V.T.F.C. Avaliação da relação entre emissão de poluentes veiculares e superfícies rodoviárias. In Proceedings of the 36th Congress of Research and Teaching in Transport, Fortaleza, Brazil, 8–12 November, 2022. [Google Scholar]
  42. Skar, A.; Vestergaard, A.; Pour, S.M.; Pettinari, M. Internet-of-Things (IoT) Platform for Road Energy Efficiency Monitoring. Sensors 2023, 23, 2756. [Google Scholar] [CrossRef]
  43. Singh, A.; Khan, A.A.R.; Cardenas, J.J.; Al-Qadi, I.L. Effect of road roughness on E-truck energy consumption. Int. J. Pavement Eng. 2025, 26, 2528982. [Google Scholar] [CrossRef]
  44. Achebe, J.; Saari, R.; Mukherjee, U.; Tighe, S.; Penlidis, A. Informing Sustainable Pavement Maintenance Policy with Environmental Cost; Lecture Notes in Civil Engineering; Springer: Cham, Switzerland, 2024; Volume 522, pp. 583–593. [Google Scholar] [CrossRef]
  45. Poor, N.; Braham, A. Road use contributions to energy consumption and greenhouse gas emissions for two flexible pavement maintenance strategies. J. Test. Eval. 2022, 51, 2210–2229. [Google Scholar] [CrossRef]
  46. Boggio-Marzet, A.; Monzon, A.; Rodriguez-Alloza, A.M.; Wang, Y. Combined Influence of Traffic Conditions, Driving Behavior, and Type of Road on Fuel Consumption: Real Driving Data from Madrid Area. Int. J. Sustain. Transp. 2021, 16, 301–313. [Google Scholar] [CrossRef]
  47. Zhang, Y.; Fan, P.; Lu, H.; Song, G. Fuel Consumption of Hybrid Electric Vehicles Under Real-World Road and Temperature Conditions. Transp. Res. Part D Transp. Environ. 2025, 142, 104691. [Google Scholar] [CrossRef]
  48. Shang, R.; Zhang, Y.; Shen, Z.-J.M.; Zhang, Y. Analyzing the Effects of Road Type and Rainy Weather on Fuel Consumption and Emissions: A Mesoscopic Model Based on Big Traffic Data. IEEE Access 2021, 9, 62303–62315. [Google Scholar] [CrossRef]
  49. Revista Carro. Fiat Argo HGT 1.8 Automatic—Technical Specifications. Available online: https://revistacarro.com.br/carros/hgt-1-8-aut/ (accessed on 2 February 2026).
  50. HeyCar Brasil. Complete Technical Datasheet: Fiat Argo HGT 1.8 AT. Available online: https://www.heycar.com.br/ficha-tecnica/ficha-tecnica-completa-do-fiat-argo-hgt-1-8-at-2018 (accessed on 2 February 2026).
  51. INMETRO. Brazilian Vehicle Labeling Program (PBE Veicular): Passenger Cars—2019. Available online: https://www.gov.br/inmetro/pt-br/assuntos/avaliacao-da-conformidade/programa-brasileiro-de-etiquetagem/tabelas-de-eficiencia-energetica/veiculos-automotivos-pbe-veicular/veiculos-leves-2019/@@download/file/veiculos_leves_2019.pdf (accessed on 2 February 2026).
  52. de Oliveira, R.H.; Loprencipe, G.; de Almeida Filho, F.G.V.; Pissardini, R.D.S. Experimental investigation on the use of multiple very low-cost inertial-based devices for comfort assessment and rail track monitoring. Measurement 2022, 199, 111575. [Google Scholar] [CrossRef]
  53. Loprencipe, G.; de Almeida Filho, F.G.V.; de Oliveira, R.H.; Bruno, S. Validation of a low-cost pavement monitoring inertial-based system for urban road networks. Sensors 2021, 21, 2870. [Google Scholar] [CrossRef]
  54. U.S. Environmental Protection Agency (EPA). On-Board Diagnostic (OBD) Regulations and Requirements: Questions and Answers. EPA-420-F-03-042; U.S. Environmental Protection Agency: Washington, DC, USA, 2003.
  55. Kutner, M.H.; Nachtsheim, C.J.; Neter, J.; Li, W. Applied Linear Statistical Models, 5th ed.; McGraw-Hill: New York, NY, USA, 2005. [Google Scholar]
  56. Montgomery, D.C.; Peck, E.A.; Vining, G.G. Introduction to Linear Regression Analysis, 6th ed.; Wiley: Hoboken, NJ, USA, 2021. [Google Scholar]
Figure 1. Evaluated road sections: Collector Road (red), Express Road (purple), Local Road I (green), Local Road II (cyan), and Local Road III (yellow).
Sustainability 18 02052 g001
Figure 3. Road geometry, vehicle dynamics, and operating parameters over 100-m sections along the Express and Collector Roads.
Sustainability 18 02052 g003
Figure 4. Road geometry, vehicle dynamics, and operating parameters over 100-m sections along the Local Roads (I, II, and II).
Sustainability 18 02052 g004
Figure 5. Correlation between instantaneous fuel consumption and the considered variables. * p-value > 0.10, indicating no statistically significant correlation.
Sustainability 18 02052 g005
Table 1. Evaluated road section descriptions.
Stretch IDStretch DescriptiveRoad NameApprox. Length (km)São Paulo’s Traffic Engineering Company (CET/SP) ClassificationSpeed Limit (km/h)Elevation Profile VariationSinuosityPavement RoughnessPresence of Traffic LightsPresence of Speed Bumps
1Collector RoadProf. Mello Moraes Avenue2.1Collector40InsignificantStraightHighNoYes
2Express RoadEng. Billings Avenue2.1Express70InsignificantStraightLowNoNo
3Local Road IMatão Street1.2Local40HighModerateLow to moderateNoYes
4Local Road IIProf. Lineu Prestes Avenue1.2Local40Moderate to highStraight, with roundabouts at its extremitiesLow to moderateYesYes
5Local Road IIIProf. Luciano Gualberto Avenue1.3Local40ModerateStraightLow to moderateYesYes
Table 2. Experimental vehicle specifications.
CategoryParameterSpecificationRef.
VehicleModelFiat Argo HGT (2017)[49]
EngineEngine codeE.torQ 1.8 16V EVO VIS[49]
EngineDisplacement1747 cm3[49]
EngineFuel systemIndirect electronic multipoint injection[49]
EngineMax. power (gasoline)135 HP @ 5750 rpm[49]
EngineMax. torque (gasoline)18.8 kgfm @ 3750 rpm[49]
TransmissionType6-speed automatic transmission (torque converter)[50]
DynamicsMass (Curb)~1279 kg
Fuel consumptionUrban (gasoline, E27)9.1 km·L−1[51]
Fuel consumptionHighway (gasoline, E27)12.8 km·L−1[51]
EmissionsCO2 emissions (combined cycle)119 g·km−1[51]
Table 3. Standardized regression coefficients (β) and model statistics for global and stratified scenarios.
VariableScenario
VIF (Global)Global ModelExpress RoadCollector RoadLocal (Uphill)Local (Downhill)Local Road I
Intercept128.80.0000.000 *−0.000−0.000−0.000 *−0.000
Speed, β1.4−0.006 *0.137−0.3020.082 *−0.363−0.028 *
Acceleration, β1.40.3120.6370.5720.2450.268−0.041 *
Engine RPM, β2.00.4400.2200.3540.5400.6530.798
Slope, β1.50.3760.125−0.014 *0.3750.2010.238
Deflection, β1.20.032 *−0.046 *0.032 *0.017 *−0.021 *−0.026 *
Vertical vibration, β 7.6−0.415−0.329−0.109 *−0.094 *−0.013 *0.231
Pitch vibration, β8.50.4720.2660.2200.104 *0.175 *−0.165
R2-0.760.660.800.920.770.97
Observations-377126100767548
* p-value > 0.10, indicating no statistically significant result.
Disclaimer/Publisher’s Note: The statements, opinions and data contained in all publications are solely those of the individual author(s) and contributor(s) and not of MDPI and/or the editor(s). MDPI and/or the editor(s) disclaim responsibility for any injury to people or property resulting from any ideas, methods, instructions or products referred to in the content.