Article

Post-Expansion Carbon Price Forecasting in China’s Emissions Trading Scheme Based on VMD–SVR Model

1
School of Ecology and Environment, Renmin University of China, 59 Zhongguancun Street, Beijing 100872, China
2
School of Economics and Management, Anhui University of Science and Technology, 168 Taifeng Road, Huainan 232001, China
*
Author to whom correspondence should be addressed.
Sustainability 2026, 18(4), 2028; https://doi.org/10.3390/su18042028
Submission received: 22 December 2025 / Revised: 2 February 2026 / Accepted: 4 February 2026 / Published: 16 February 2026

Abstract

The planned inclusion of the steel and electrolytic aluminum sectors into China’s Carbon Emission Allowance (CEA) market—initially limited to thermal power since 2021—will expand its coverage to approximately 70% of national carbon emissions, significantly influencing carbon pricing. This study employs a Variational Mode Decomposition–Support Vector Regression (VMD-SVR) model to forecast carbon price fluctuations under three post-expansion scenarios. The results indicate that, in addition to quota allocations, factors such as sectoral emission scales, the CSI 300 Power Index, and the Shanghai Energy Price Index substantially affect price trends. While market expansion induces a short-term price increase, it also stabilizes prices by reducing volatility. Furthermore, different quota allocation methods yield distinct outcomes: equal allocation facilitates a smoother market transition, whereas benchmarking provides stronger incentives for emissions reductions.

1. Introduction

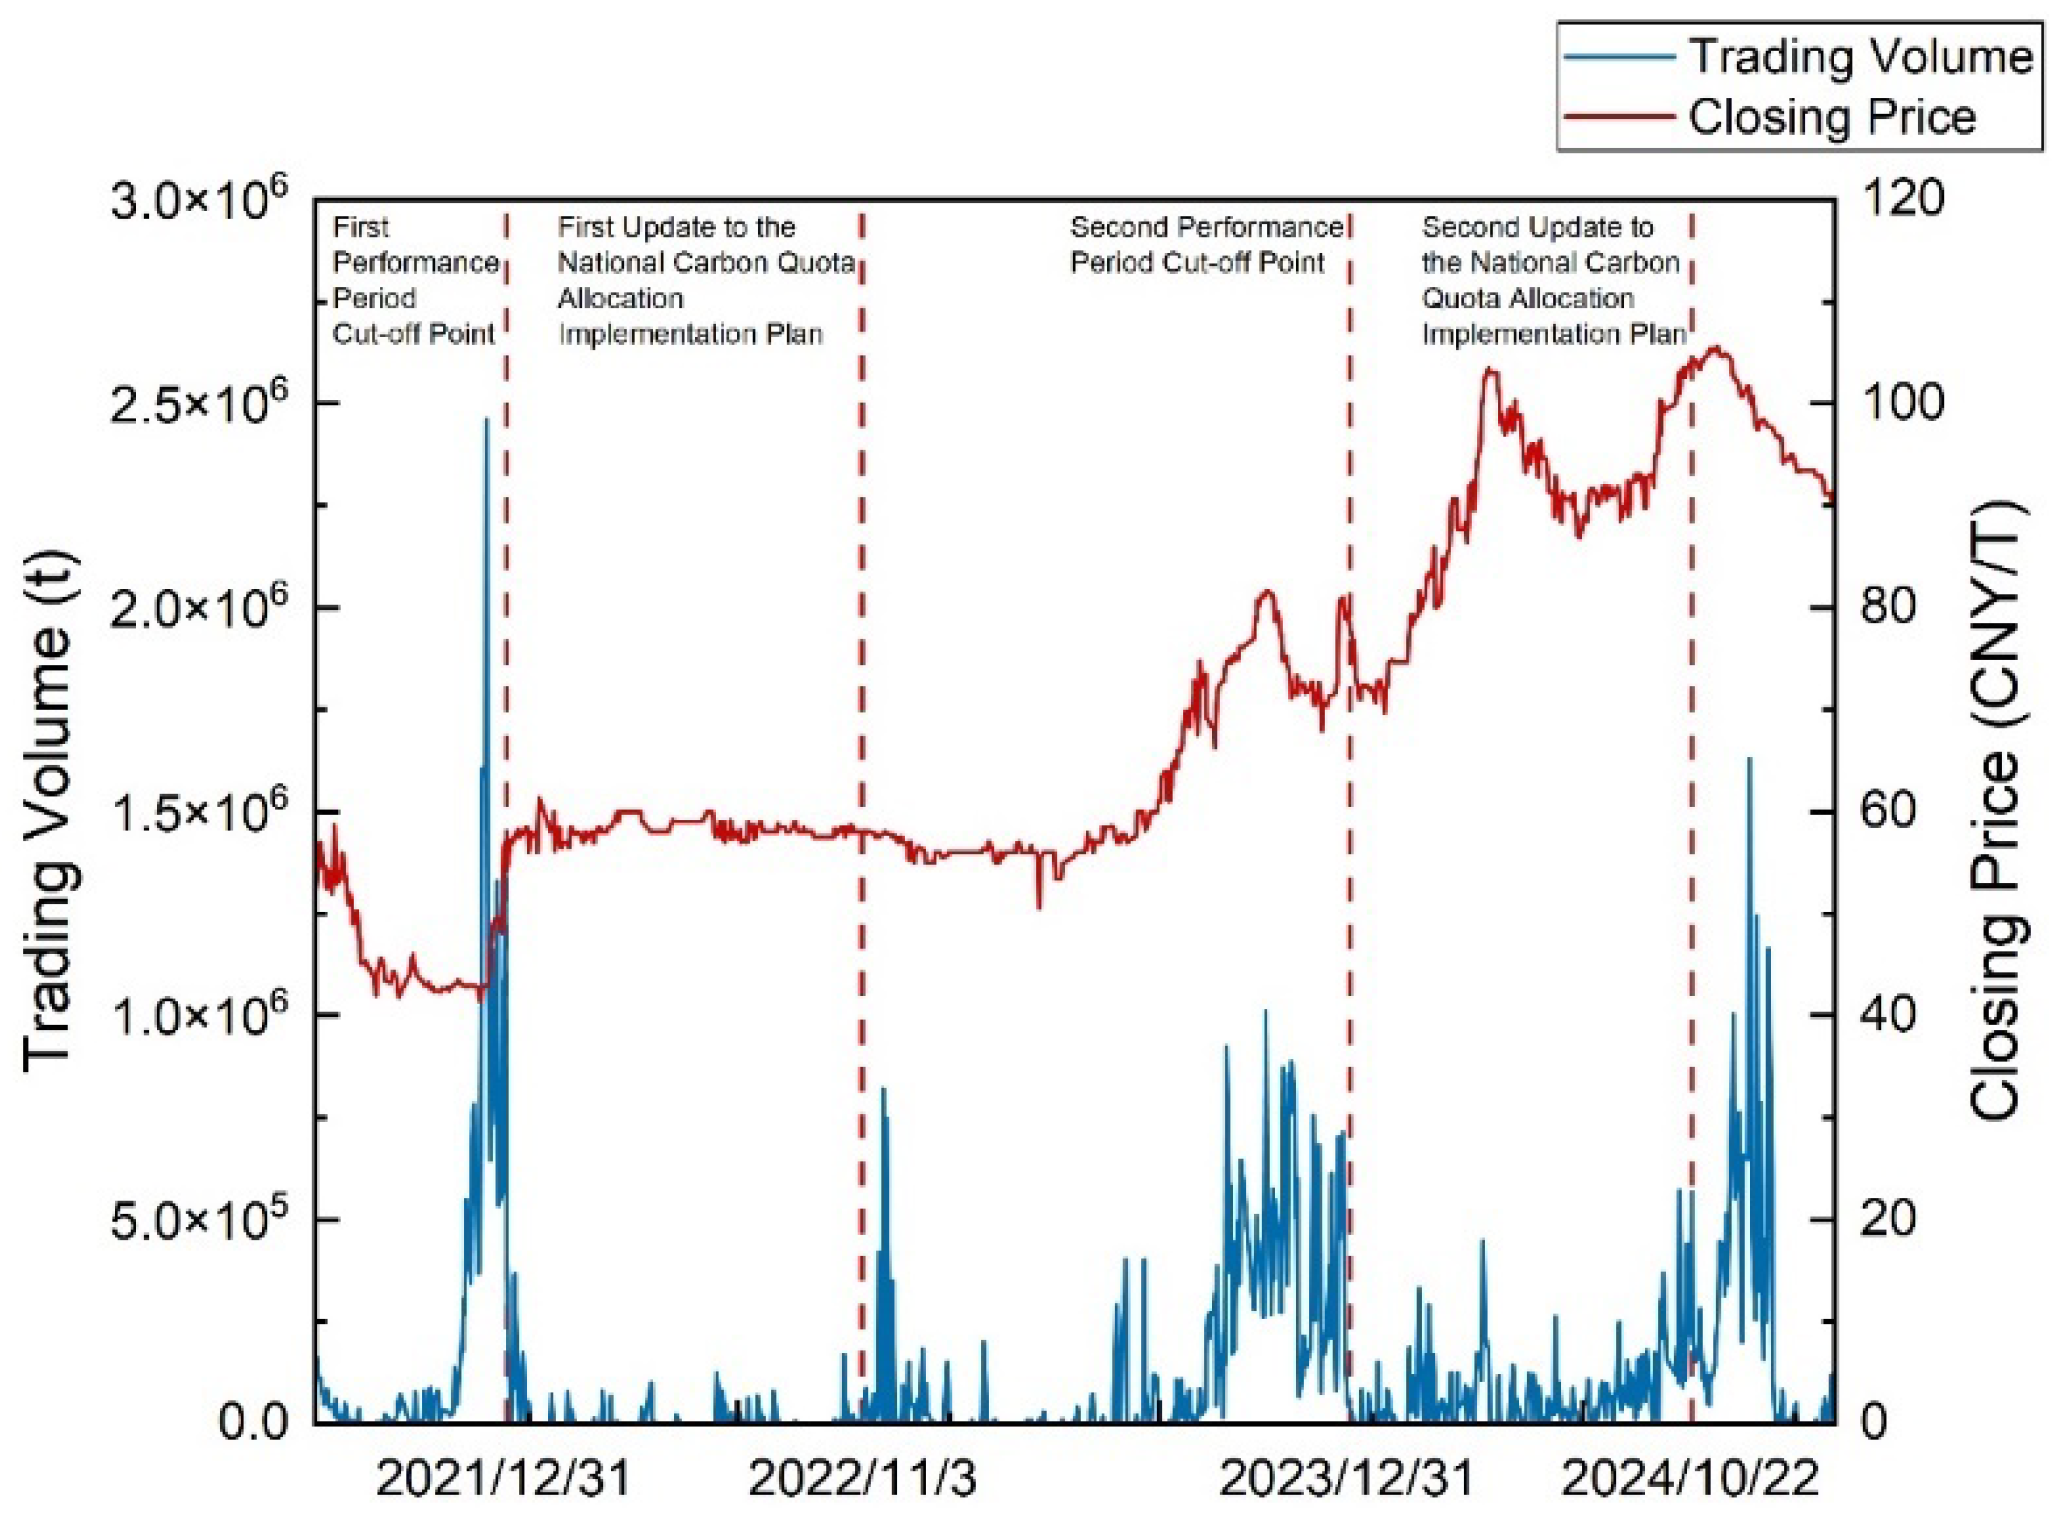
China’s “dual carbon” goals (carbon peaking and carbon neutrality) have positioned its national Carbon Emission Allowance (CEA) market as a pivotal mechanism for achieving cost-effective emissions reduction. Since its launch in July 2021, initially covering the thermal power sector (approximately 40% of national emissions), the market has demonstrated significant price volatility, influenced by factors such as quota allocation policies, energy prices, and macroeconomic trends. As illustrated in Figure 1, the carbon price surged to 60 CNY/ton in 2021 and exceeded 100 CNY/ton in 2024, following quota tightening, highlighting the market’s dynamic nature.
The planned expansion to include high-emission sectors like steel (≈15% of national emissions) and aluminum smelting (≈4.5%) will increase market coverage to around 70% of national emissions, fundamentally altering its supply–demand dynamics. This expansion presents critical challenges for carbon price forecasting, as traditional econometric models often struggle to capture the nonlinear, non-stationary characteristics of carbon price series under such structural shifts. Against this backdrop, this study is motivated by three key questions: (1) How will the inclusion of steel and aluminum smelting industries impact carbon price volatility and trends? (2) What are the differential effects of equal allocation versus benchmark allocation methods on post-expansion price formation? (3) Can a hybrid forecasting model effectively predict carbon prices under these structural changes?
To address these questions, this study develops a novel hybrid model integrating Variational Mode Decomposition (VMD) and Support Vector Regression (SVR) to simulate post-expansion carbon price dynamics. Our analysis contributes to the literature by providing one of the first ex ante assessments of carbon price trends under sectoral expansion, offering a comparative evaluation of allocation methods, and demonstrating the efficacy of a advanced forecasting framework tailored for evolving market structures. The remainder of this paper is structured as follows. Section 2 reviews the relevant literature on carbon price drivers and forecasting methods. Section 3 details variable selection and data processing. Section 4 introduces the VMD-SVR model, and Section 5 presents scenario-based forecasts for steel and aluminum smelting industry inclusion. Finally, Section 6 discusses findings, implications, and limitations.

2. Literature Review

A substantial body of literature has investigated the dynamics of carbon markets, which can be broadly synthesized into three interconnected streams: the fundamental drivers of carbon prices, the impact and efficiency of market mechanisms, and the methodologies for carbon price forecasting. A critical synthesis of these areas reveals distinct gaps that this study aims to address.

2.1. Fundamental Drivers of Carbon Prices

Research consistently identifies a core set of factors influencing carbon price formation. The foundational mechanism is understood as the interplay between government-determined quota supply and corporate demand [1,2,3,4,5]. The progressive tightening of the total quota supply, a key policy tool for national carbon mitigation, directly creates allowance scarcity, thereby driving up carbon market prices [6,7]. Beyond quota policies, energy prices act as a significant mediator; rising prices of crude oil and coal can incentivize fuel switching or demand reduction, lowering allowance demand, while lower natural gas prices may encourage a shift away from dirtier fossils, similarly depressing carbon prices [8,9,10]. Furthermore, macroeconomic trends serve as a long-term driver, where economic expansion boosts energy and production demand, improves stock market performance [11], and exerts upward pressure on carbon prices, with the opposite effect during downturns [12,13,14]. International linkages, particularly through mature systems like the EU ETS, can also indirectly influence domestic carbon pricing via trade, investment, and policy learning channels [10,15,16,17,18].
However, a significant gap persists in the existing literature [19]. While these drivers are well-documented for established, single-sector markets (e.g., [20,21,22,23]), there is a notable lack of empirical analysis examining how the relative importance and dynamic interactions of these factors might evolve following a significant market expansion. The existing body of work provides limited insight into whether the inclusion of major new sectors like steel and aluminum would alter the established hierarchy of price drivers or introduce new transmission channels.

2.2. Market Expansion and Mechanism Efficiency

The potential benefits of expanding carbon market coverage are a second key research stream. Studies suggest that broadening China’s national market to include multiple high-emission sectors could significantly enhance cost-effectiveness and achieve substantial reductions in carbon intensity [24]. A central debate within this stream concerns the optimal balance between market mechanisms and government oversight. Research indicates that complementarity exists between government quota control and market-based pricing in optimizing emission reduction efficiency [25,26]. This stands in contrast to earlier regional pilot markets, which sometimes relied excessively on administrative intervention rather than market mechanisms, a approach that could undermine market confidence and participation [27,28].
Despite this understanding, a critical research gap remains unexplored. The literature offers insufficient comparative analysis of how different allowance allocation methods (e.g., equal allocation versus benchmark allocation) would perform in a post-expansion multi-sector market context. Specifically, there is a lack of quantitative forecasting that contrasts the trade-offs between market transition smoothness and emission reduction incentives under these different allocation scenarios for newly incorporated industries. Furthermore, the efficiency of the carbon market itself can influence corporate innovation decisions [26], which is an important aspect of its long-term impact.

2.3. Forecasting Methodologies

For decomposing complex time series signals, Variational Mode Decomposition (VMD) has been established as an effective method [29]. Its application has extended to various fields, including geophysics [30] and signal denoising [31]. The third research stream focuses on carbon price forecasting techniques, which are broadly categorized into traditional econometric models and machine learning approaches. Conventional models like ARIMA [32], VAR [33,34], and GARCH [35] offer strong economic interpretability but often underperform in capturing the nonlinear [13,36,37,38], non-stationary characteristics of carbon price series [39,40,41,42,43]. In contrast, machine learning techniques such as Support Vector Regression (SVR) [44,45] and Long Short-Term Memory (LSTM) networks [46] generally demonstrate superior predictive accuracy [41,47,48], albeit sometimes at the cost of model interpretability [39,45,47,48,49,50,51,52,53,54].
A clear methodological gap is evident here. While advanced forecasting models like SVR and LSTM have been applied to historical data, their application has largely been retrospective. There is a scarcity of research that leverages these sophisticated data-driven approaches to conduct ex ante scenario analysis and forecasting specifically tailored to the unprecedented event of a major carbon market expansion. Hybrid models that combine the strengths of different approaches have shown promising results [43,53,54]. Recent studies continue to develop more sophisticated frameworks [54]. The predictive power of hybrid models (e.g., VMD-SVR) has not been fully harnessed to simulate the price impacts of integrating new industrial sectors under different policy designs [29,30,31].
In summary, by synthesizing the literature, this review identifies three critical gaps: (1) an insufficient understanding of how carbon price drivers transform post expansion; (2) a lack of comparative, scenario-based analysis of allocation methods in a multi-sector market; and (3) the underutilization of advanced hybrid forecasting models for predictive policy simulation. This study is designed to address these gaps directly.

3. Model Specification and Data Analysis

3.1. Sample Selection

The formal operation of China’s national carbon emissions trading market signifies the establishment of a unified national carbon trading system, representing a typical and influential case. However, due to its relatively short operational history of approximately three years, data availability remains limited. Consequently, this study employs the daily closing prices of the national carbon market from its inception on 19 July 2021 to 31 December 2024 as the research dataset. All data, sourced from the National Carbon Market Information Network, consist of daily closing prices. The selection of key influencing factors is a critical step. Methods like Lasso regression and its variants are commonly employed for this purpose [49,55]. Table 1 demonstrates all the representative variables and data sources that are used in this study.
The formation and fluctuation of carbon market prices are influenced by a multitude of factors, which this study categorizes into five primary groups: industrial production, energy markets, domestic economic conditions, international carbon prices, and commodity markets.
  • Industrial Production Factors
As the inaugural sector covered by the national carbon market, the power industry’s activities significantly influence carbon price dynamics. This study selects three feature variables to capture this influence: sectoral carbon emissions, total carbon allowances, and the CSI 300 Power Index. Carbon emissions affect prices through demand-side mechanisms, where the “technology lock-in effect” can amplify price increases driven by allowance scarcity. Total carbon allowances, a core supply-side indicator, exert upward pressure on prices in the short term as they tighten, while in the long term they incentivize emission reductions that may eventually lower prices. The CSI 300 Power Index, reflecting the profitability and technological progression of the power sector, indirectly captures the feedback effects of carbon prices on production and the impact of sectoral abatement behavior on carbon pricing. Together, these variables provide a multidimensional perspective on the interaction between the power industry and the carbon market.
2.
Energy Price Factors
Fossil fuel prices influence corporate energy demand structures, thereby affecting carbon emission intensity. Price increases for fuels like coal and oil can reduce fossil fuel demand or trigger substitution towards cleaner alternatives, decreasing allowance demand and suppressing carbon prices. The CSI New Energy Index reflects the development of the renewable energy sector. Its increase signifies a stronger substitution effect away from fossil fuels, prompting high-carbon industries to adjust their energy mix and reduce emissions, thereby lowering allowance demand and carbon prices. Conversely, the Shanghai Energy Index represents the performance of traditional energy industries. Its rise indicates growing energy demand, which increases emissions and allowance demand from carbon-covered sectors, exacerbating supply–demand imbalances under the aggregate quota and driving up carbon prices. Therefore, this paper selects the daily closing prices of INE crude oil, the China Coal Price Index (CCPI), LNG natural gas prices, the CSI New Energy Index, and the Shanghai Energy Index as feature variables.
3.
Domestic Economic Conditions
Macroeconomic indicators such as economic growth and industrial activity are closely linked to sectoral carbon emissions, influencing the supply–demand balance and transaction prices in the carbon market. The CSI 300 Index, a benchmark for the A-share market, reflects the nation’s overall economic health. An increase in this index typically signals economic expansion, active industrial production, and rising energy demand, which in turn elevate carbon prices. Rising carbon prices also increase costs for high-carbon industries, creating a countervailing downward pressure on the index. The CSI Industrial Index reflects the performance of the industrial sector. Its increase indicates expanded industrial activity, particularly in energy-intensive industries like steel and cement, which boosts energy consumption, emissions, and consequently the demand for allowances and carbon prices. Simultaneously, the technological advances and efficiency improvements driven by higher carbon prices can, over time, reduce emissions and moderate allowance demand, establishing a feedback loop. These two indices thus capture the causal pathways linking macroeconomic and sectoral conditions to carbon market prices. Therefore, this paper selects the CSI 300 Index and the CSI Industrial Index as characteristic variables for domestic economic development and industrial activity, respectively.
4.
International Carbon Prices
The international carbon market, most notably the mature EU Emissions Trading System (EU ETS), may indirectly influence China’s carbon pricing through various channels. In designing its own quota allocation framework, the Chinese government may reference methods and benchmarks from established markets, which could affect domestic supply–demand dynamics and the resulting carbon prices. Therefore, this study selects the settlement price of EU Allowances (EUA) as the characteristic variable for international carbon prices.
5.
Commodity Markets
Most fossil fuels (e.g., coal, oil, natural gas) and products from high-carbon industries (e.g., steel, aluminum, glass) are key commodities. Increases in commodity prices stimulate production demand, potentially leading to emissions that exceed original quota allocations, thereby influencing carbon market prices. Consequently, carbon prices are closely linked to commodity market trends. This study selects the closing prices of the South China Commodity Index and the S&P GSCI Commodity Total Return Index as relevant feature variables.

3.2. Variable Screening and Analysis

The Pearson correlation coefficient was employed to quantify the linear relationship between variables. Lasso regression served as an enhanced feature selection technique, which introduces an L1 regularization term to shrink the coefficients of less relevant variables toward zero, thereby achieving effective dimensionality reduction [49,55]. Initially, Pearson correlation coefficients were calculated between carbon market prices and all candidate influencing factors. Subsequently, Lasso regression was applied to these results to identify the most critical and effective predictors.
The coefficients of variables retained at the selected λ value in the Lasso regression, along with their corresponding Pearson correlation coefficients, are presented in Table 2. Among the retained variables, carbon emissions from the power industry, carbon quotas for the power sector, the CSI 300 Power Index, the CSI 300 Index, and the closing price of the South China Commodity Index exhibited a positive association with national carbon market prices. In contrast, the China Coal Price Index, Shanghai Energy Price, LNG natural gas price, and the EU Emissions Allowance (EUA) futures settlement price showed a negative relationship with carbon prices. Four candidate variables—the INE crude oil price, CSI New Energy Index, CSI Industrial Index, and S&P GSCI Commodity Total Return Index closing price—were excluded by the Lasso procedure. Furthermore, Pearson correlation analysis indicated that the CSI New Energy Index and CSI Industrial Index demonstrated multicollinearity with other variables, confirming that Lasso regression effectively mitigated multicollinearity while performing dimensionality reduction.

3.3. Establishment and Testing of the VAR Model

To mitigate the influence of differing measurement units, all variables were standardized prior to analysis.
  • Stationarity Test
Augmented Dickey–Fuller (ADF) unit root tests were performed on the data to assess their suitability for Vector Autoregression (VAR) modeling. The results are summarized in the table below. The ADF tests indicated that the log-transformed series for all variables except the EU Emissions Allowance futures settlement price were non-stationary (p > 0.05). However, their first-differenced series were all stationary, with p-values of zero and ADF test statistics exceeding the critical values at the 1%, 5%, and 10% significance levels. Consequently, the first-differenced data were used for subsequent VAR regression.
2.
Lag Order Selection
Selecting an appropriate lag order enhances a model’s explanatory power and regression efficacy. The optimal lag order for the VAR model was determined by minimizing five information criteria: the Likelihood Ratio (LR), Final Prediction Error (FPE), Akaike Information Criterion (AIC), Schwarz Criterion (SC), and Hannan-Quinn Criterion (HQ). As shown in Table 2, Table 3 and Table 4, an optimal lag order of 3 was selected for model establishment.
3.
Model Stability Test
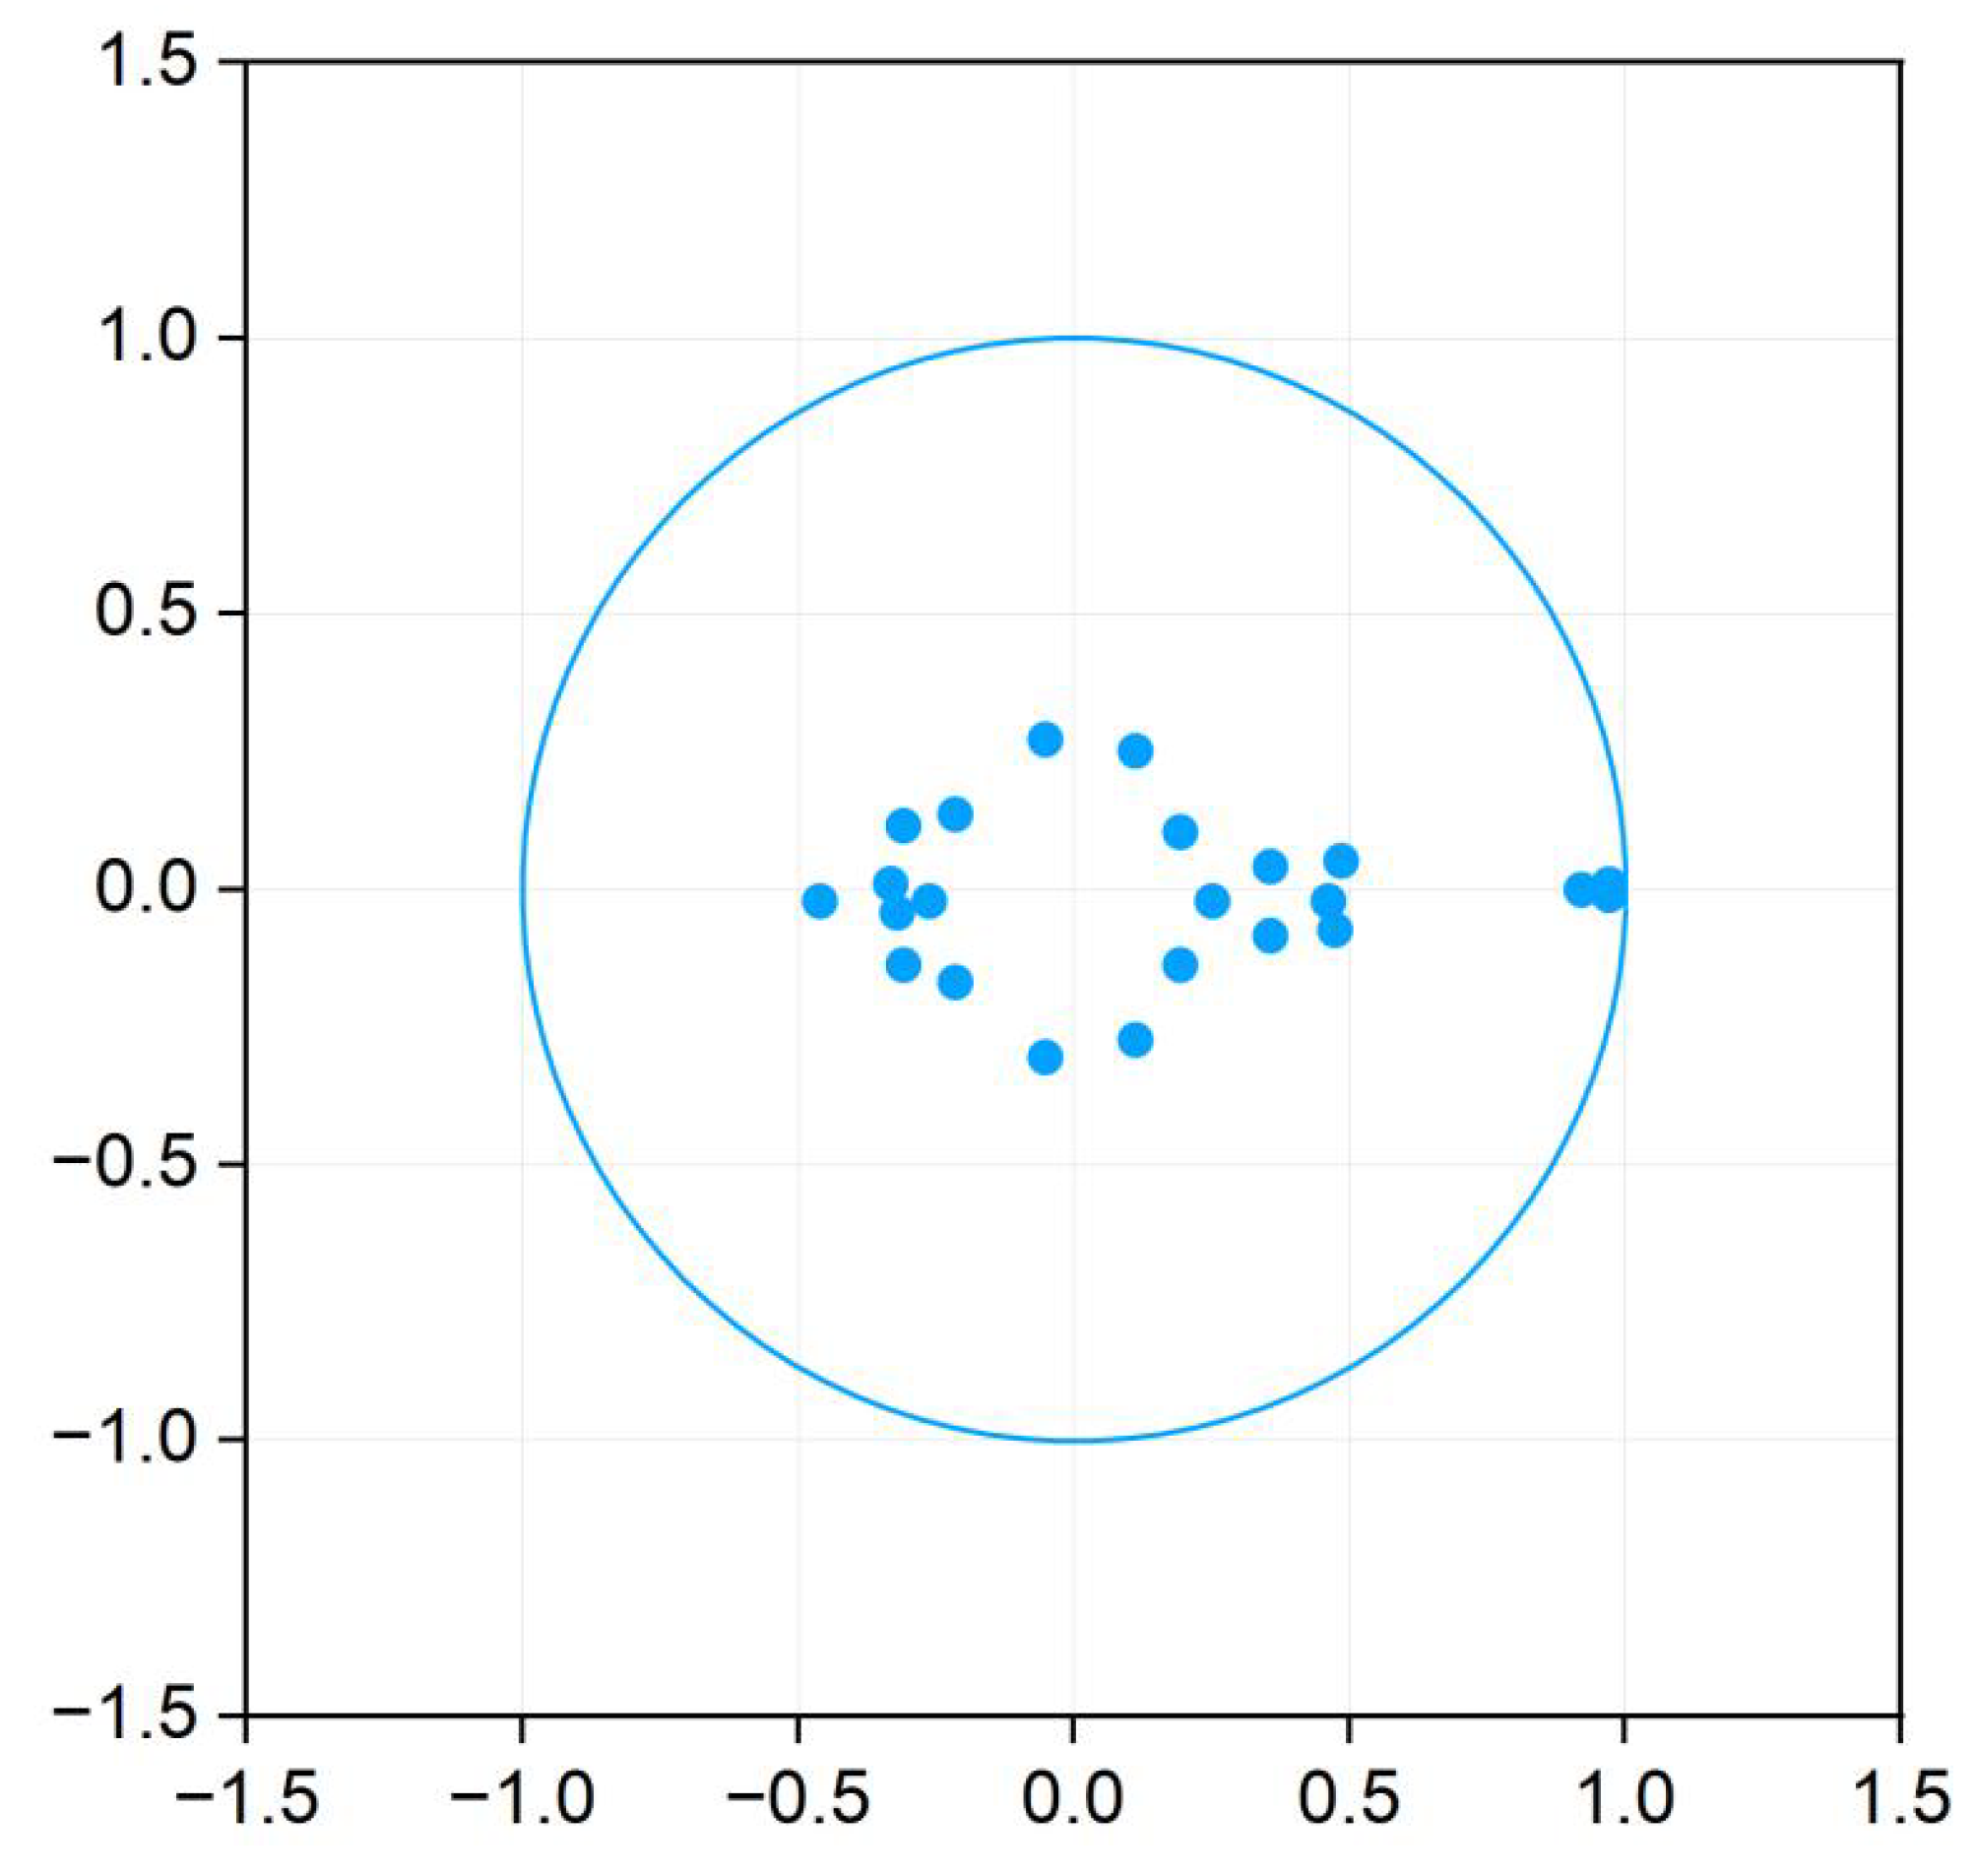
The stability of the estimated VAR model was evaluated using the autoregressive (AR) root table and corresponding graph. The results of the unit circle analysis are presented in Figure 2. All inverse roots of the characteristic polynomial lie within the unit circle, with the majority of eigenvalues having a modulus less than 0.5. This confirms that the VAR model is stable and suitable for subsequent impulse response analysis and variance decomposition.
4.
Impulse Response Analysis
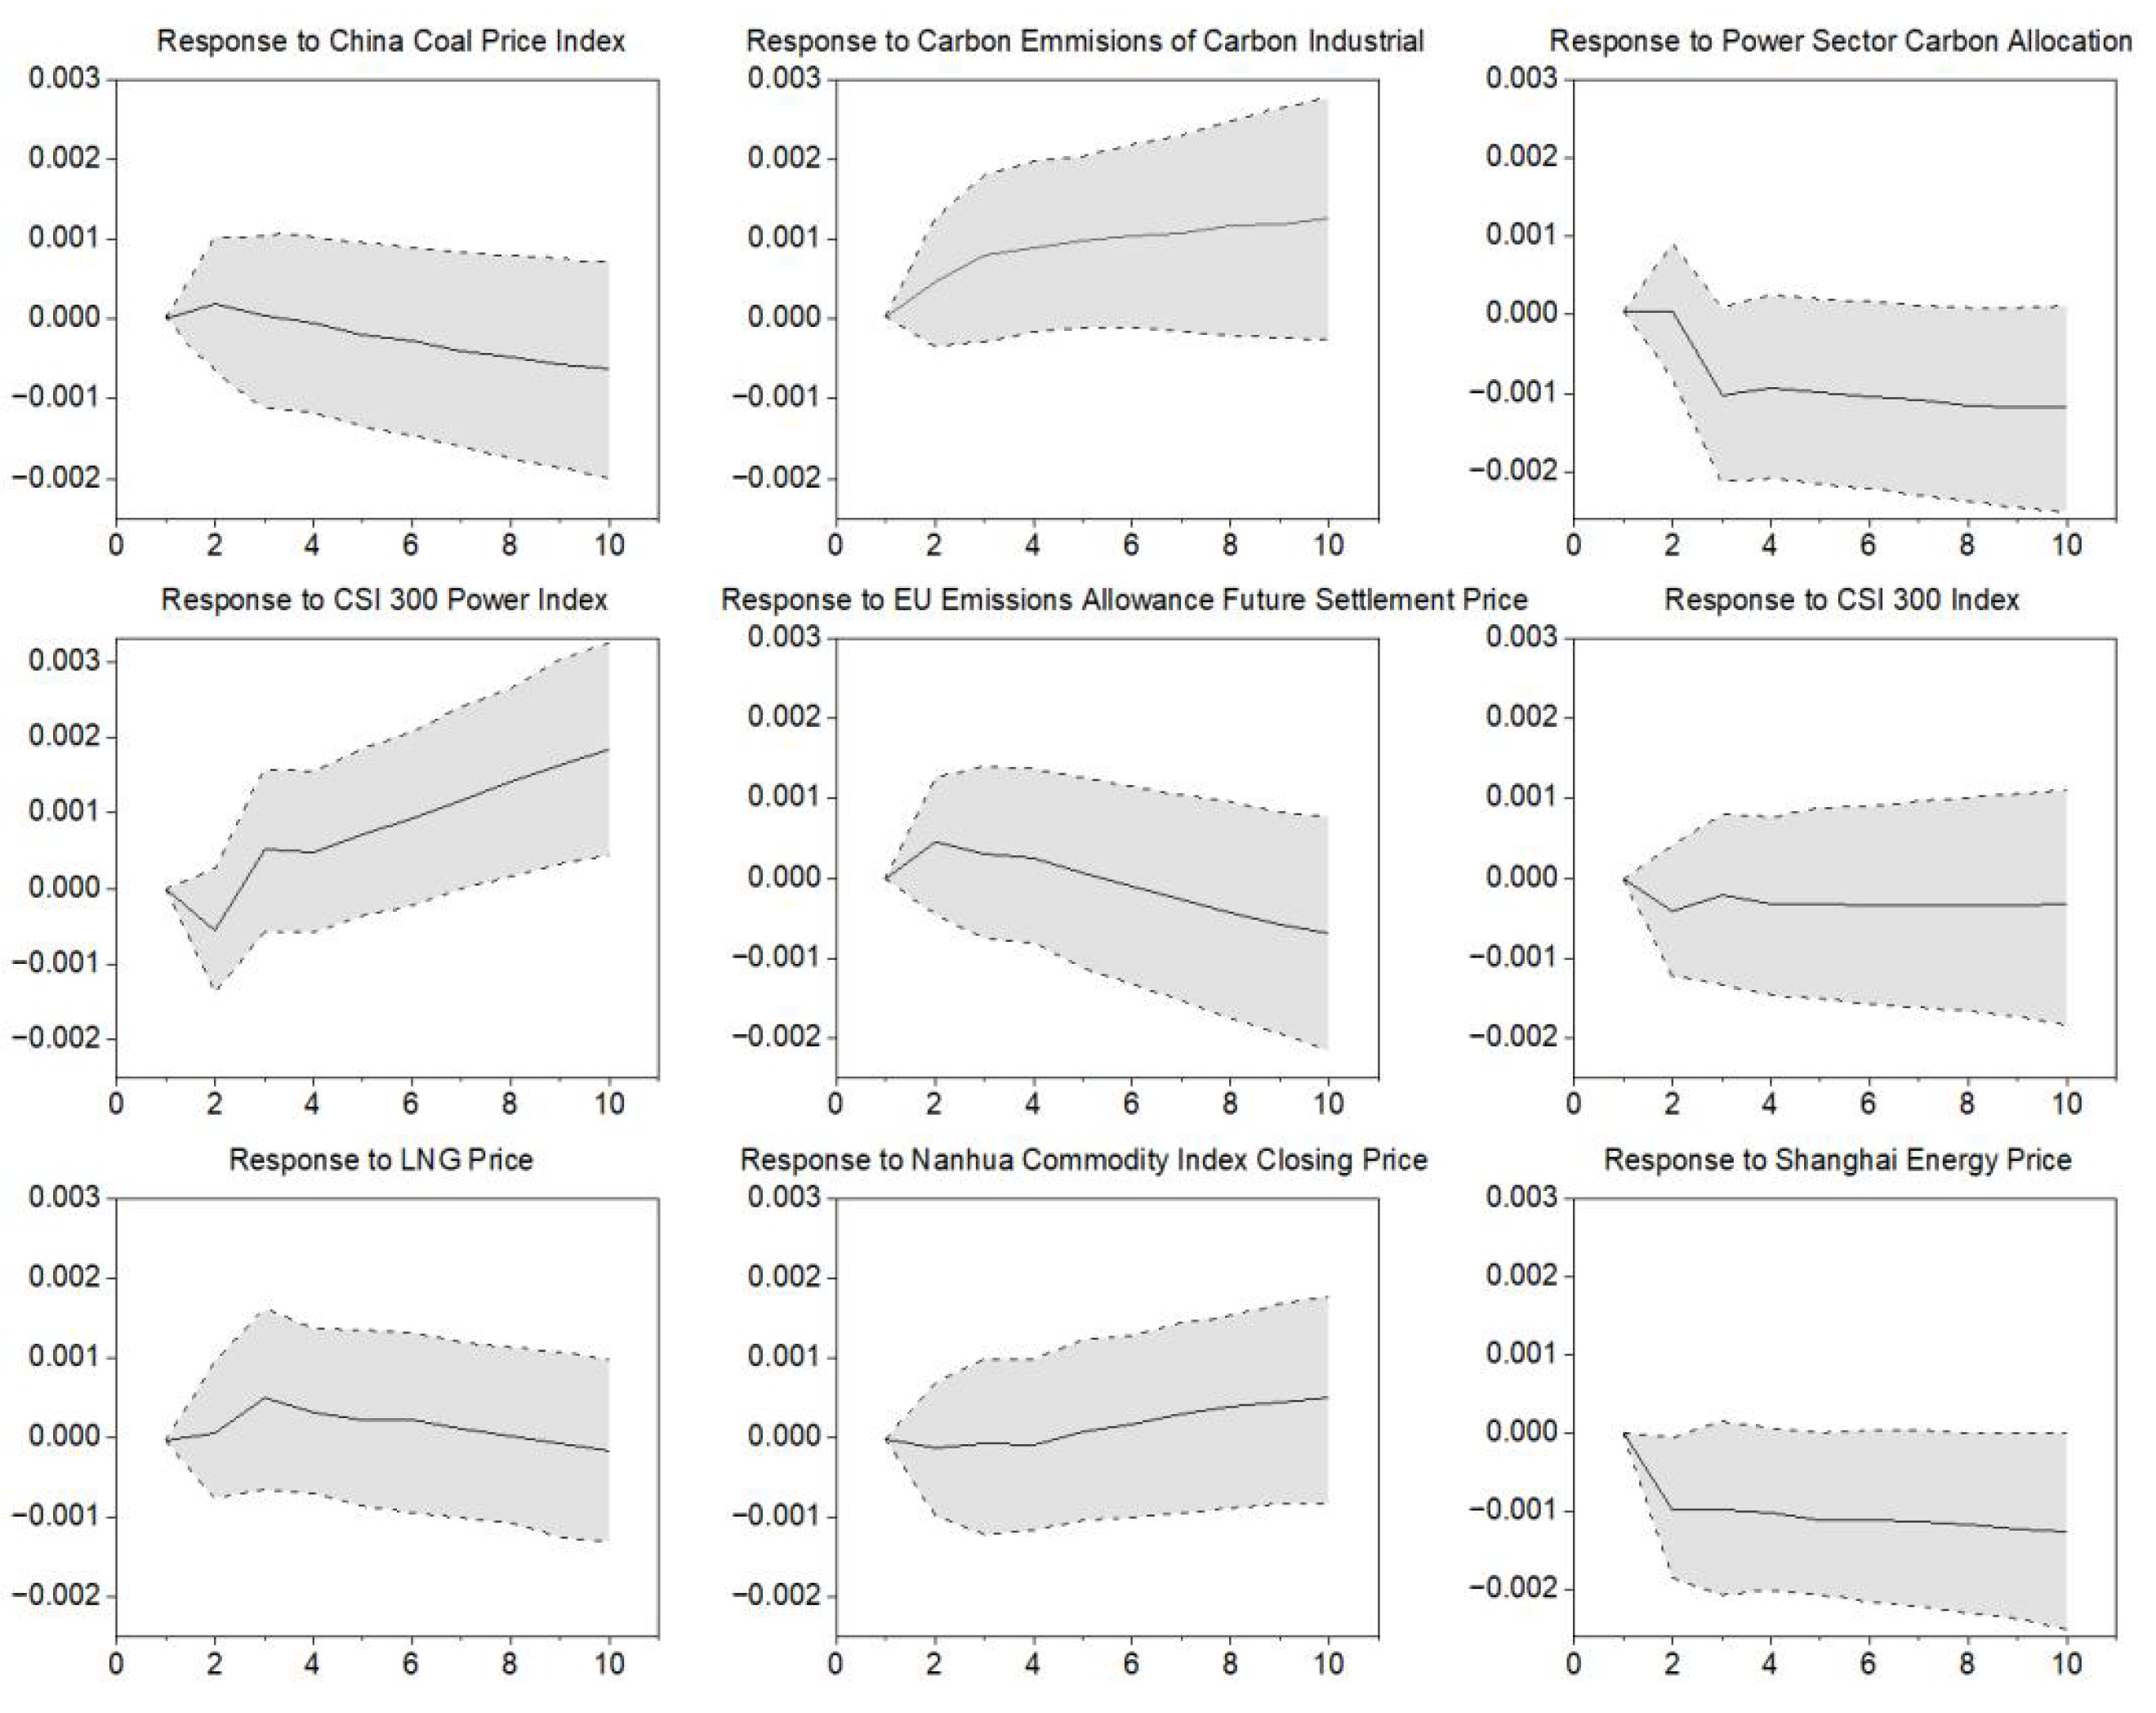
Establishing impulse response functions allows for a clearer and more intuitive analysis of the dynamic impact of different variables on carbon emission trading prices. The response of carbon prices to shocks from various indicators at different lag periods is shown in Figure 3.
Regarding the duration of effects, factors exhibiting a more persistent influence on national carbon prices include power sector carbon emissions, power sector carbon allowances, the CSI 300 Power Index, and the China Coal Price Index. In contrast, the effects of shocks from the CSI 300 Index and the South China Commodity Index closing price diminish and approach zero within the 10-period horizon, indicating their relatively transient impact. These temporal patterns suggest that the influence of different factors on future carbon prices varies between short- and long-term timescales.
Regarding the direction of effects, power sector carbon emissions exert a sustained positive impulse on carbon prices, underscoring their long-term role as a fundamental driver. Conversely, power sector carbon allowances, the CSI 300 Index, and the Shanghai Energy Price Index exert stable negative impulses, reflecting the constraining effects of quota policy, macroeconomic conditions, and energy prices on carbon pricing.
Among these, the CSI 300 Power Index demonstrates the largest cumulative positive impact. Its effect is initially negative in the first three periods but turns significantly positive from the fourth period onward, with the magnitude continuing to increase. Power sector carbon emissions show the most sustained positive impulse, while power sector carbon allowances and the Shanghai Energy Price exhibit the most persistent negative impulses, with both effects amplifying over time. The South China Commodity Index and the CSI 300 Index have comparatively minor influences on carbon price dynamics.
5.
Variance Decomposition Analysis
Variance decomposition within the VAR framework was conducted to quantify the contribution of each influencing factor to fluctuations in carbon prices. The results are presented in Table 5 and Table 6. The historical price of the national carbon market itself remains the dominant explanatory factor for its own variance, although its contribution decreases from 100% in the first period to 96.96% by the tenth period. Correspondingly, the combined contribution of all external factors increases to 3.04% by period 10.
Based on the forecast for the 10th period, the relative contributions of external factors to carbon price variance, in descending order, are: the CSI 300 Power Index, Shanghai Energy Price, Power Sector Carbon Allowances, Power Sector Carbon Emissions, EU Emissions Allowance Futures Settlement Price, China Coal Price Index, CSI 300 Index, South China Commodity Index Closing Price, and LNG Natural Gas Price. The CSI 300 Power Index, Shanghai Energy Price, Power Sector Carbon Allowances, and Power Sector Carbon Emissions contribute more significantly, with their influence beginning in the second period and growing steadily. In contrast, LNG natural gas price contributes the least, accounting for only 0.037% of the forecast error variance in the 10th period.
In summary, the integrated results from impulse response analysis and variance decomposition indicate that power sector carbon emissions, power sector carbon allowances, the CSI 300 Index, and the Shanghai Energy Price Index exert significant and meaningful influences on national carbon market prices.

4. Carbon Price Prediction Based on the VMD-SVR Model

4.1. Variational Modal Decomposition and Support Vector Regression

The fundamental objective of Variational Mode Decomposition (VMD) is to decompose a complex multicomponent signal into several mode functions with specific center frequencies and limited bandwidths. Its core principle involves the application of variational optimization to identify multiple intrinsic mode functions under constraints on frequency and bandwidth. The procedure comprises four key steps: (1) construction of the original signal representation, (2) imposition of frequency and bandwidth constraints, (3) iterative updating of mode functions via variational optimization, and (4) determination of the optimal decomposition through convergence.
Support Vector Regression (SVR) extends the principles of support vector machines to regression tasks, offering particular advantages in handling limited-sample contexts. The model employs kernel functions to map data into a high-dimensional feature space, thereby capturing nonlinear patterns. For time series forecasting, its implementation generally follows: (1) formulation of an objective function with ε-insensitive loss, (2) introduction of constraints for structural risk minimization, (3) solution of the Lagrangian dual problem, and (4) selection of a suitable kernel function, such as the radial basis function.

4.2. Construction of the VMD-SVR Hybrid Model

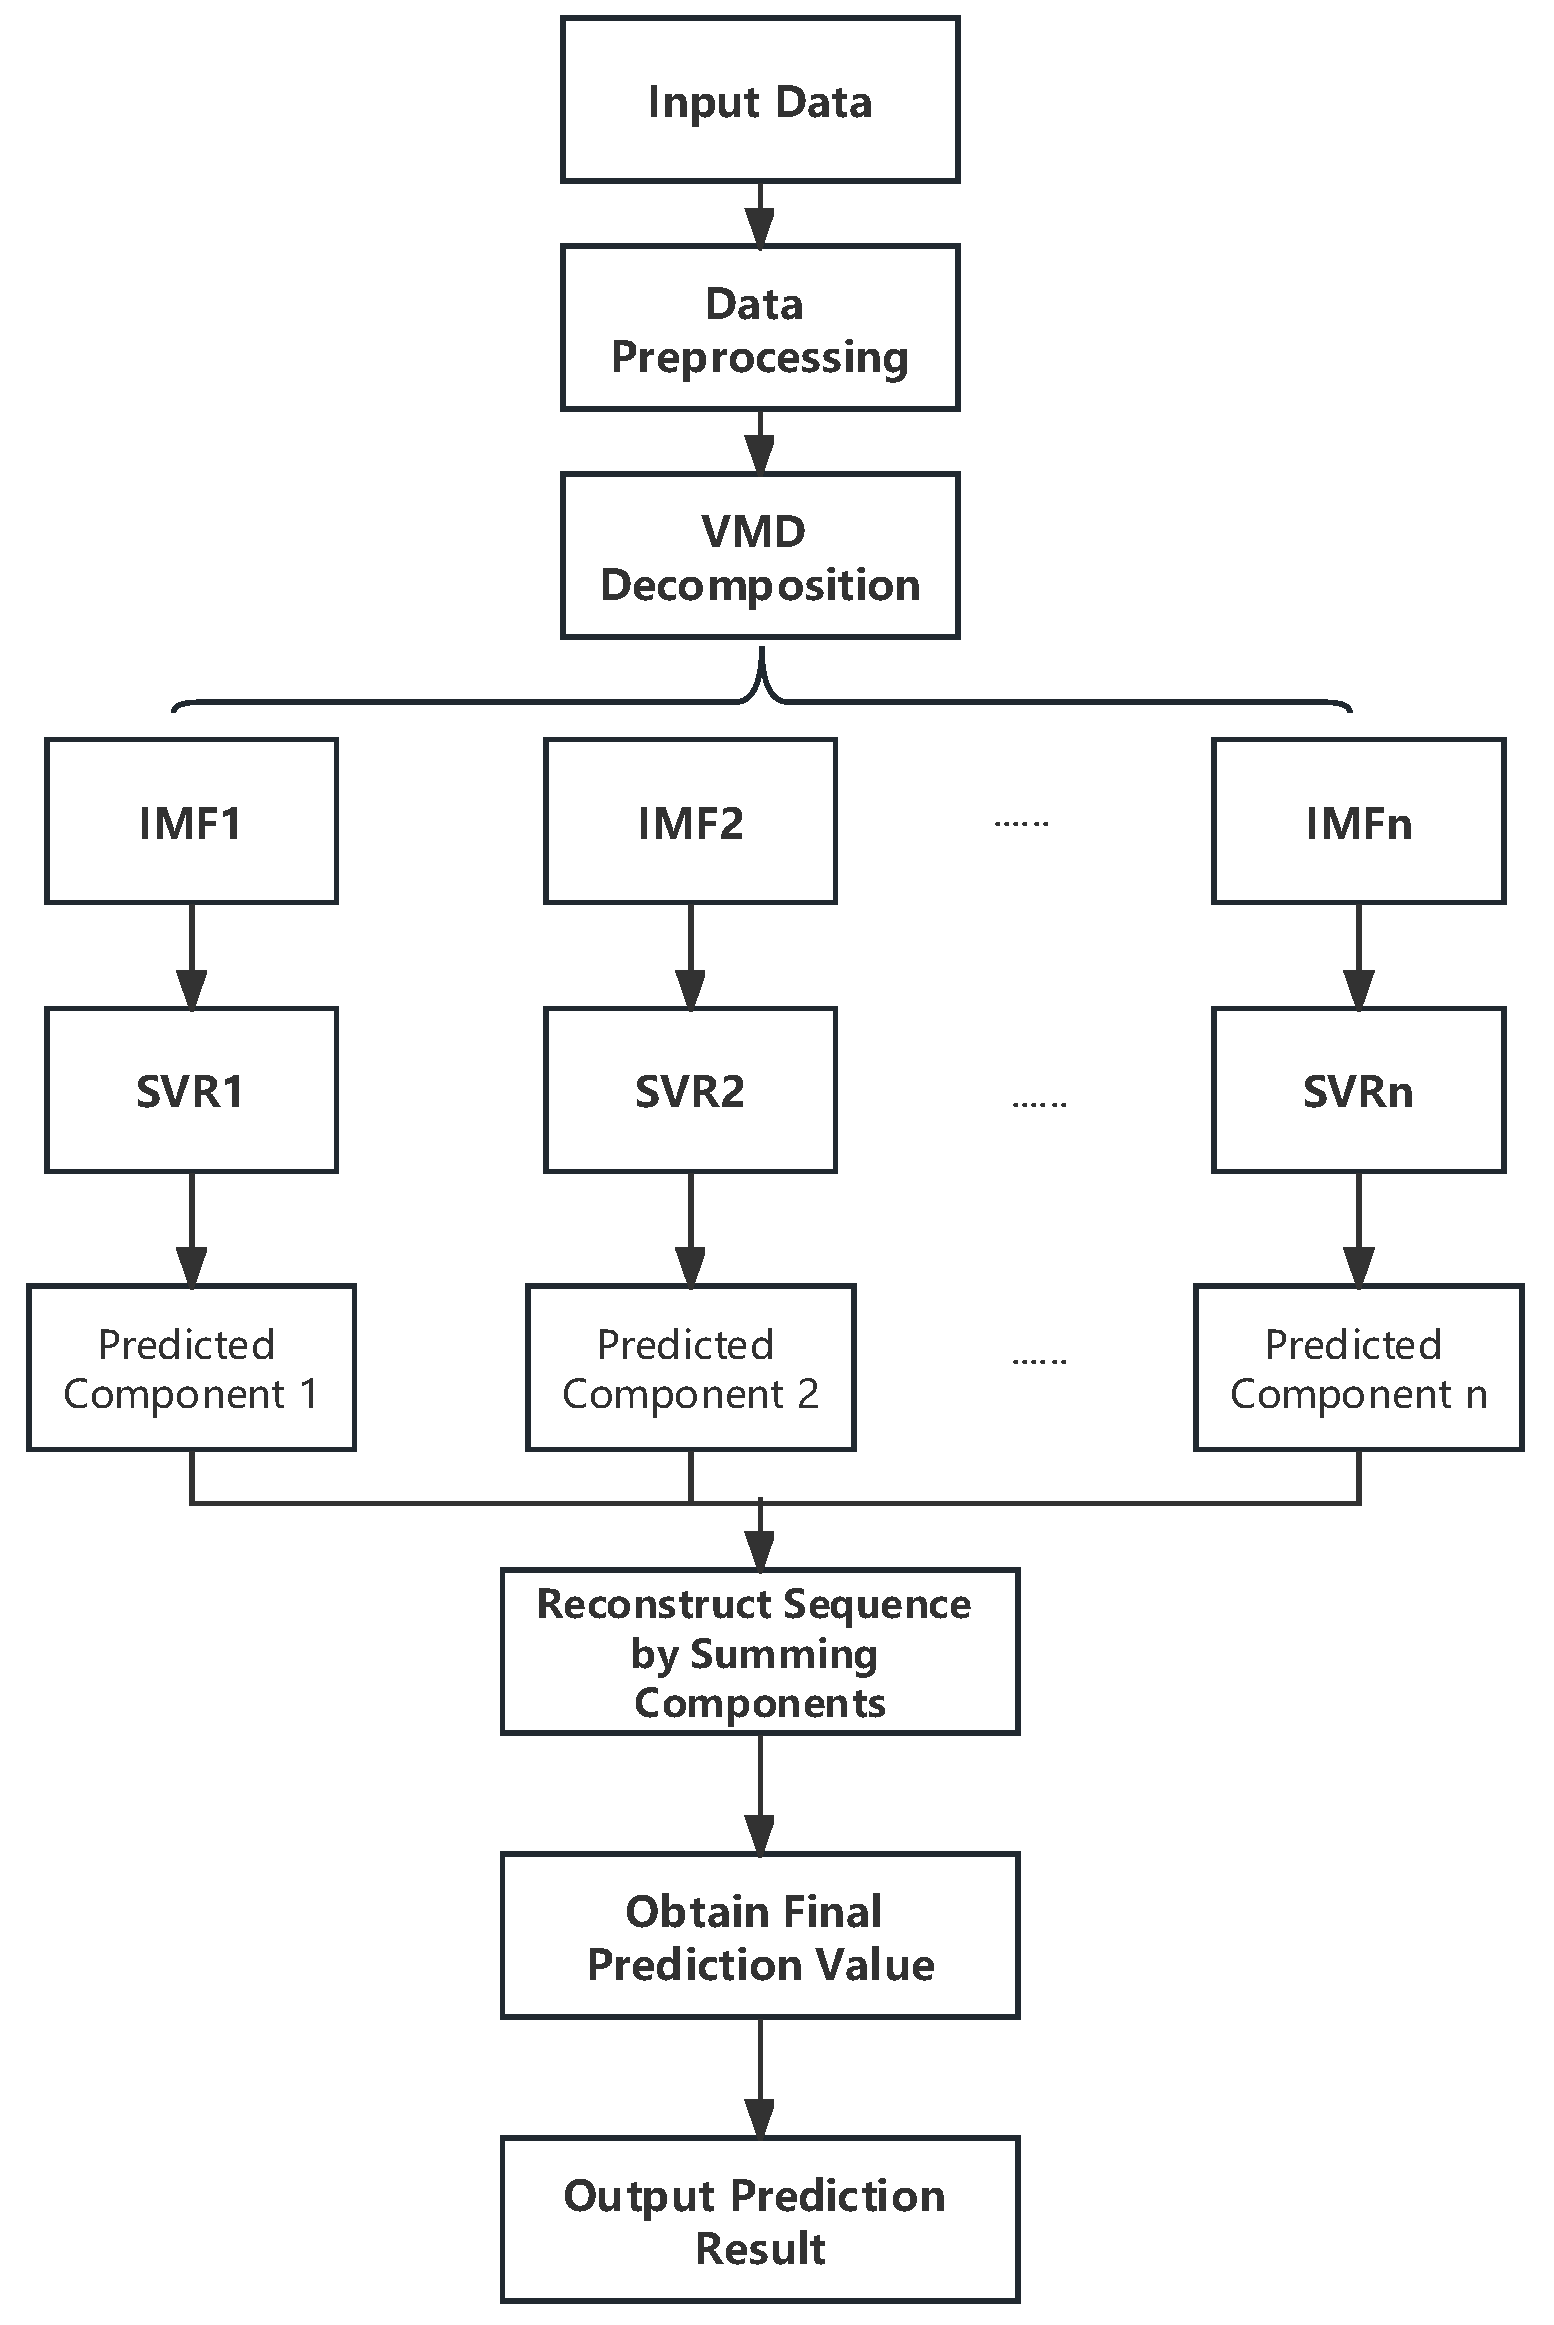
Building on the theoretical foundations and empirical performance of the Variational Mode Decomposition (VMD) algorithm and the Support Vector Regression (SVR) model, this study integrates the decomposition technique with machine learning to construct a hybrid VMD-SVR forecasting framework [29,30,31,53,54]. As shown in Figure 4, the target variable (carbon price) and the selected feature variables are first processed using the VMD algorithm, decomposing the original series into several intrinsic mode components. Each of these decomposed sub-sequences, along with the corresponding feature variables (one target and ten predictors), is then used as input to the SVR model for individual training and prediction.

4.3. VMD-SVR Empirical Analysis and Results

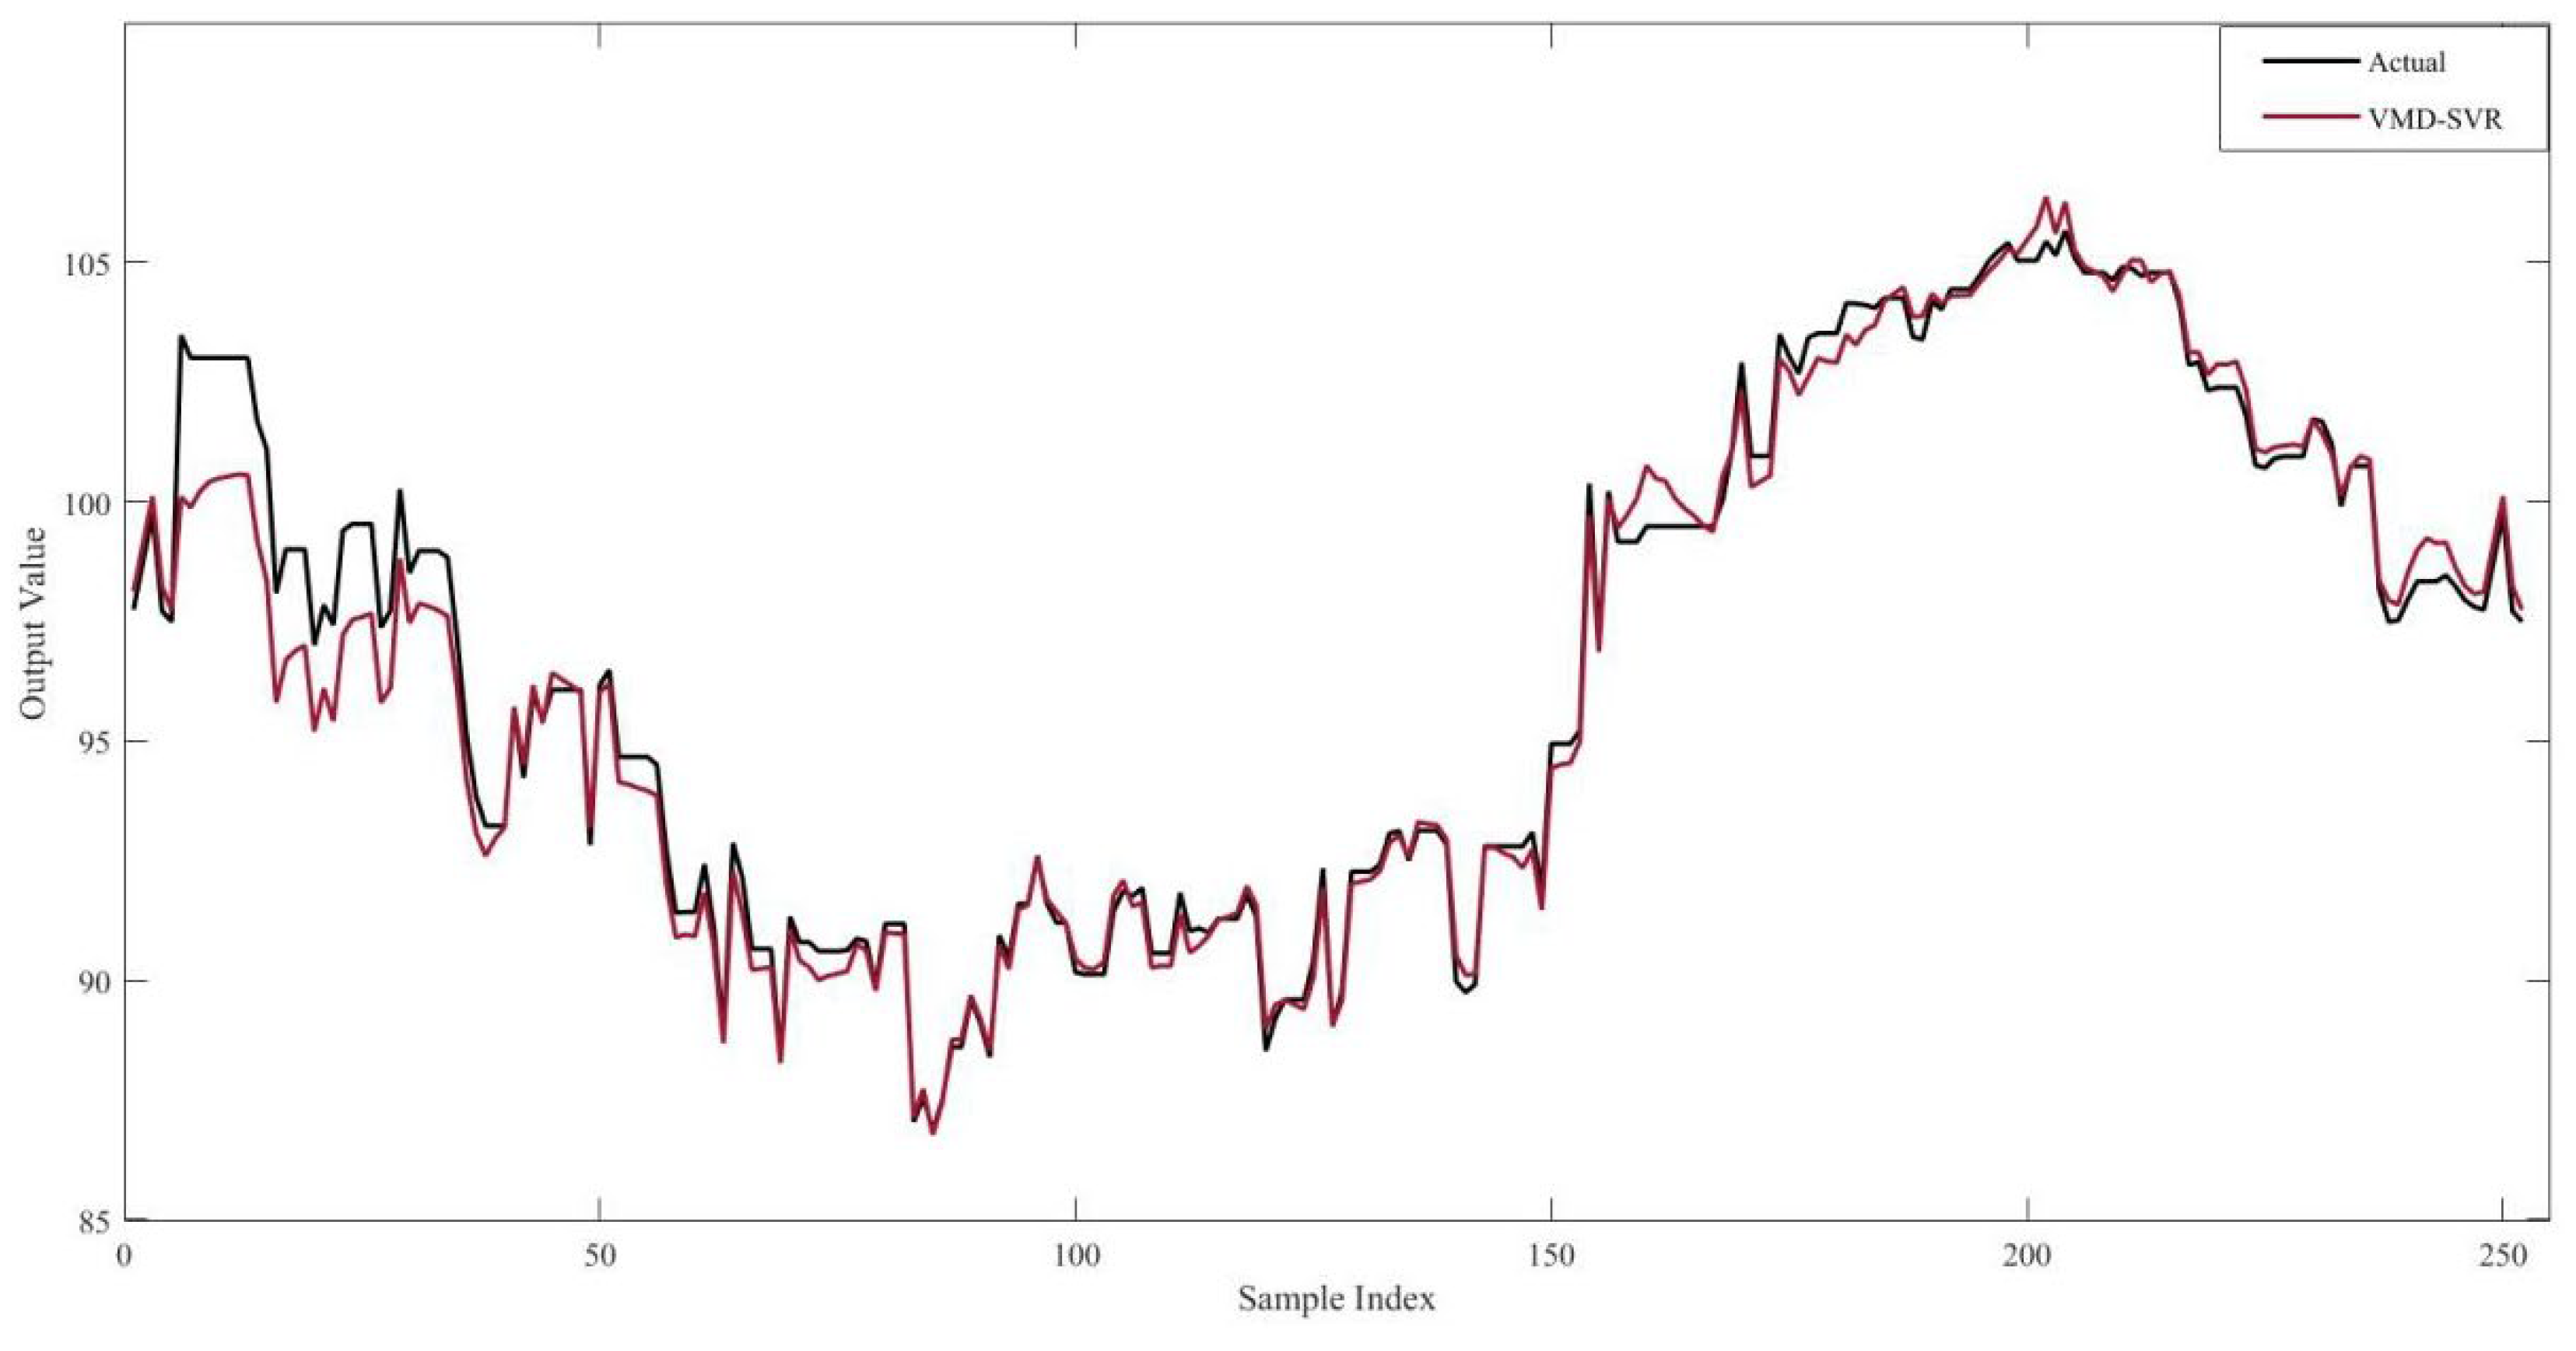
Following the VMD of national carbon market prices and their influencing factors, the resulting components were used as inputs to the SVR prediction model. The model achieved an excellent fit on the training set, with error metrics of RMSE = 0.43375, MAE = 0.3462, and MAPE = 0.5265%, along with an R2 value of 0.9993. A comparison between predicted and actual values in the test set is shown in Figure 5, with corresponding error metrics provided in Table 7.
In Figure 5, the predicted values are represented by the solid red line, while the actual values are shown as the solid black line. Overall, the predicted values closely follow the trend of actual carbon prices, indicating that the VMD–SVR model performs effectively in capturing both the fluctuations and general dynamics of the national carbon market.
As summarized in Table 7, the VMD–SVR model demonstrates strong predictive performance across all error metrics, confirming its utility in forecasting national carbon market prices. Specifically, the low values of MSE, RMSE, MAE, and MAPE reflect small prediction errors and high model accuracy.

5. Forecasting Carbon Price Trends Following Carbon Market Expansion

Given the imminent expansion of China’s Carbon Emission Allowance (CEA) market, this study designs three comparative scenarios to project carbon price trends, examining how allowance allocation methods and the inclusion of additional sectors influence market dynamics under a unified national framework: (1) Baseline Scenario: In 2025, the national carbon market continues to cover only the power sector, following historical trends. All influencing factors retain their original trajectories, with specific parameters calibrated according to the average daily growth rate observed in the previous year (2024). (2) Equal Allocation Scenario: Building on the baseline, newly included industries receive carbon allowances equivalent to their actual emissions. (3) Benchmark Allocation Scenario: Also extending from the baseline, carbon allowances for newly added industries are allocated based on sector-specific benchmark values.
By comparing outcomes across these scenarios, this study aims to assess the impact of both allowance allocation mechanisms and sectoral composition on carbon price trends following the expansion of the national carbon market.

5.1. Steel Industry Enters the National Carbon Market

The steel industry contributes approximately 15% of China’s national carbon emissions. In line with the scenario framework established above:
  • Under the Baseline Scenario, where the steel industry remains outside the national carbon market in 2025, no industry-specific carbon quotas or emissions calculations are required.
  • Under the Equal Allocation Scenario, where the steel industry enters the market, its allocated carbon allowances are set equal to its actual carbon emissions.
  • Under the Benchmark Allocation Scenario, the steel industry receives pre-allocated quotas determined according to the industry benchmark method, referencing the Guangdong Province 2023 Annual Emission Allowance Calculation Method for Controlled Enterprises.
The specific variables and methodologies are outlined below:
  • Steel Industry Carbon Emissions
This study estimates carbon emissions for the steel industry through the following steps: First, considering that the national carbon market does not yet encompass the entire sector and given the industry’s dispersed market concentration, production data for large and medium-sized enterprises (1 January–31 December 2024) sourced from the CEIC database serves as the basis. Second, in line with the World Steel Association’s official projection of a 1.7% year-on-year decline in Chinese crude steel output for 2024, this study assumes the same rate of reduction continues into 2025. Finally, applying the global average carbon dioxide emission intensity for steel production in 2023 (1.92 tCO2 per tonne of crude steel), as reported in the Sustainability Indicators Report 2024, annual carbon emissions for the steel industry in 2025 are calculated (units: MtCO2). Missing values are addressed using linear interpolation.
2.
Pre-allocated Carbon Quotas for the Steel Industry
Should the steel industry enter the national carbon market, trading entities would expand from the power sector alone to include both power and steel firms. Transactions would accordingly shift from intra-sectoral to cross-sectoral trading. Given the partial coverage of the national market and the industry’s dispersed structure, this study considers large and medium-sized steel enterprises as the representative trading entities. Their estimated pre-allocated quotas are used to approximate the total quota supply for the steel sector.
Drawing on the Guangdong Province 2023 Annual Emission Allowance Calculation Method for Controlled Emission Enterprises and the Guidelines for Greenhouse Gas Emission Calculation and Reporting for the Steel Industry (Draft for Public Comment), the allocation principle follows the industry benchmark approach. The quota scope covers carbon emissions from six key production processes—coking, lime burning, pelletizing, sintering, iron making, and steel making—along with emissions from fossil fuels consumed in power generation facilities, where applicable. The specific allocation formula is as follows:
E T o t a l = E P r o c e s s + E C o f i r e d
E P r o c e s s = i = 1 n ( P i B i )
E C o f i r i n g = i = 1 n ( F C i N V C i C C i O F i 44 12 )
where E represents the total carbon emission quota allocated to the steel industry; E P r o c e s s denotes carbon emissions from primary production processes; and E C o f i r e d refers to carbon emissions from fossil fuel-fired power generation facilities in which the annual average share of heat from co-fired self-produced secondary energy exceeds 10%. P i is the production output of the i-th process product, and B i is the corresponding benchmark value. F C i indicates the consumption of the i-th fossil fuel in power generation, N V C i its net calorific value, C C i its carbon content per unit of calorific value, and O F i its oxidation factor.
The benchmark values B i are sourced from the Guangdong Province 2023 Annual Emission Allowance Calculation Method for Controlled Emission Enterprises. The parameters N V C i , C C i , and O F i , along with the calculation framework for F C i , are derived from the Guidelines for the Calculation and Reporting of Greenhouse Gas Emissions from Enterprises (Steel Industry) (Draft for Public Comment). Production data for each process product (coke, quicklime, pig iron, electric furnace crude steel, converter crude steel) and fossil fuel consumption data for qualifying power generation facilities (coal, crude oil, gasoline, kerosene, diesel, natural gas) were obtained from the CEIC database, covering the period from 1 January 2024 to 31 December 2024 at daily frequency. Missing values were addressed through linear interpolation.
According to the Steel Industry Economic Operation Report, crude steel output of large and medium-sized enterprises in 2024 was 101.9 million tonnes, while total industry output reached 110.8 million tonnes. Thus, production and fuel use data for these enterprises account for approximately 91.97% of the industry total. The verified carbon quota for large and medium-sized steel enterprises in 2024 was therefore estimated by scaling the calculated quota results by this proportion.
The pre-allocated carbon quota for the steel industry reflects its expected quota upon entering the national carbon market. Following the pre-allocation mechanism described in the 2023 and 2024 National Carbon Emission Trading Quota Total and Allocation Plan for the Power Generation Industry, the pre-allocated quota is set at 70% of the prior year’s verified emissions. Applying this ratio yields the pre-allocated carbon quota for the steel industry in 2025 (units: MtCO2), with daily frequency across the period 1 January 2025 to 31 December 2025. Missing values were again handled via linear interpolation.
Based on the three scenarios outlined previously, Table 8. summarizes the corresponding variable selections for the steel industry’s entry into the national carbon market.
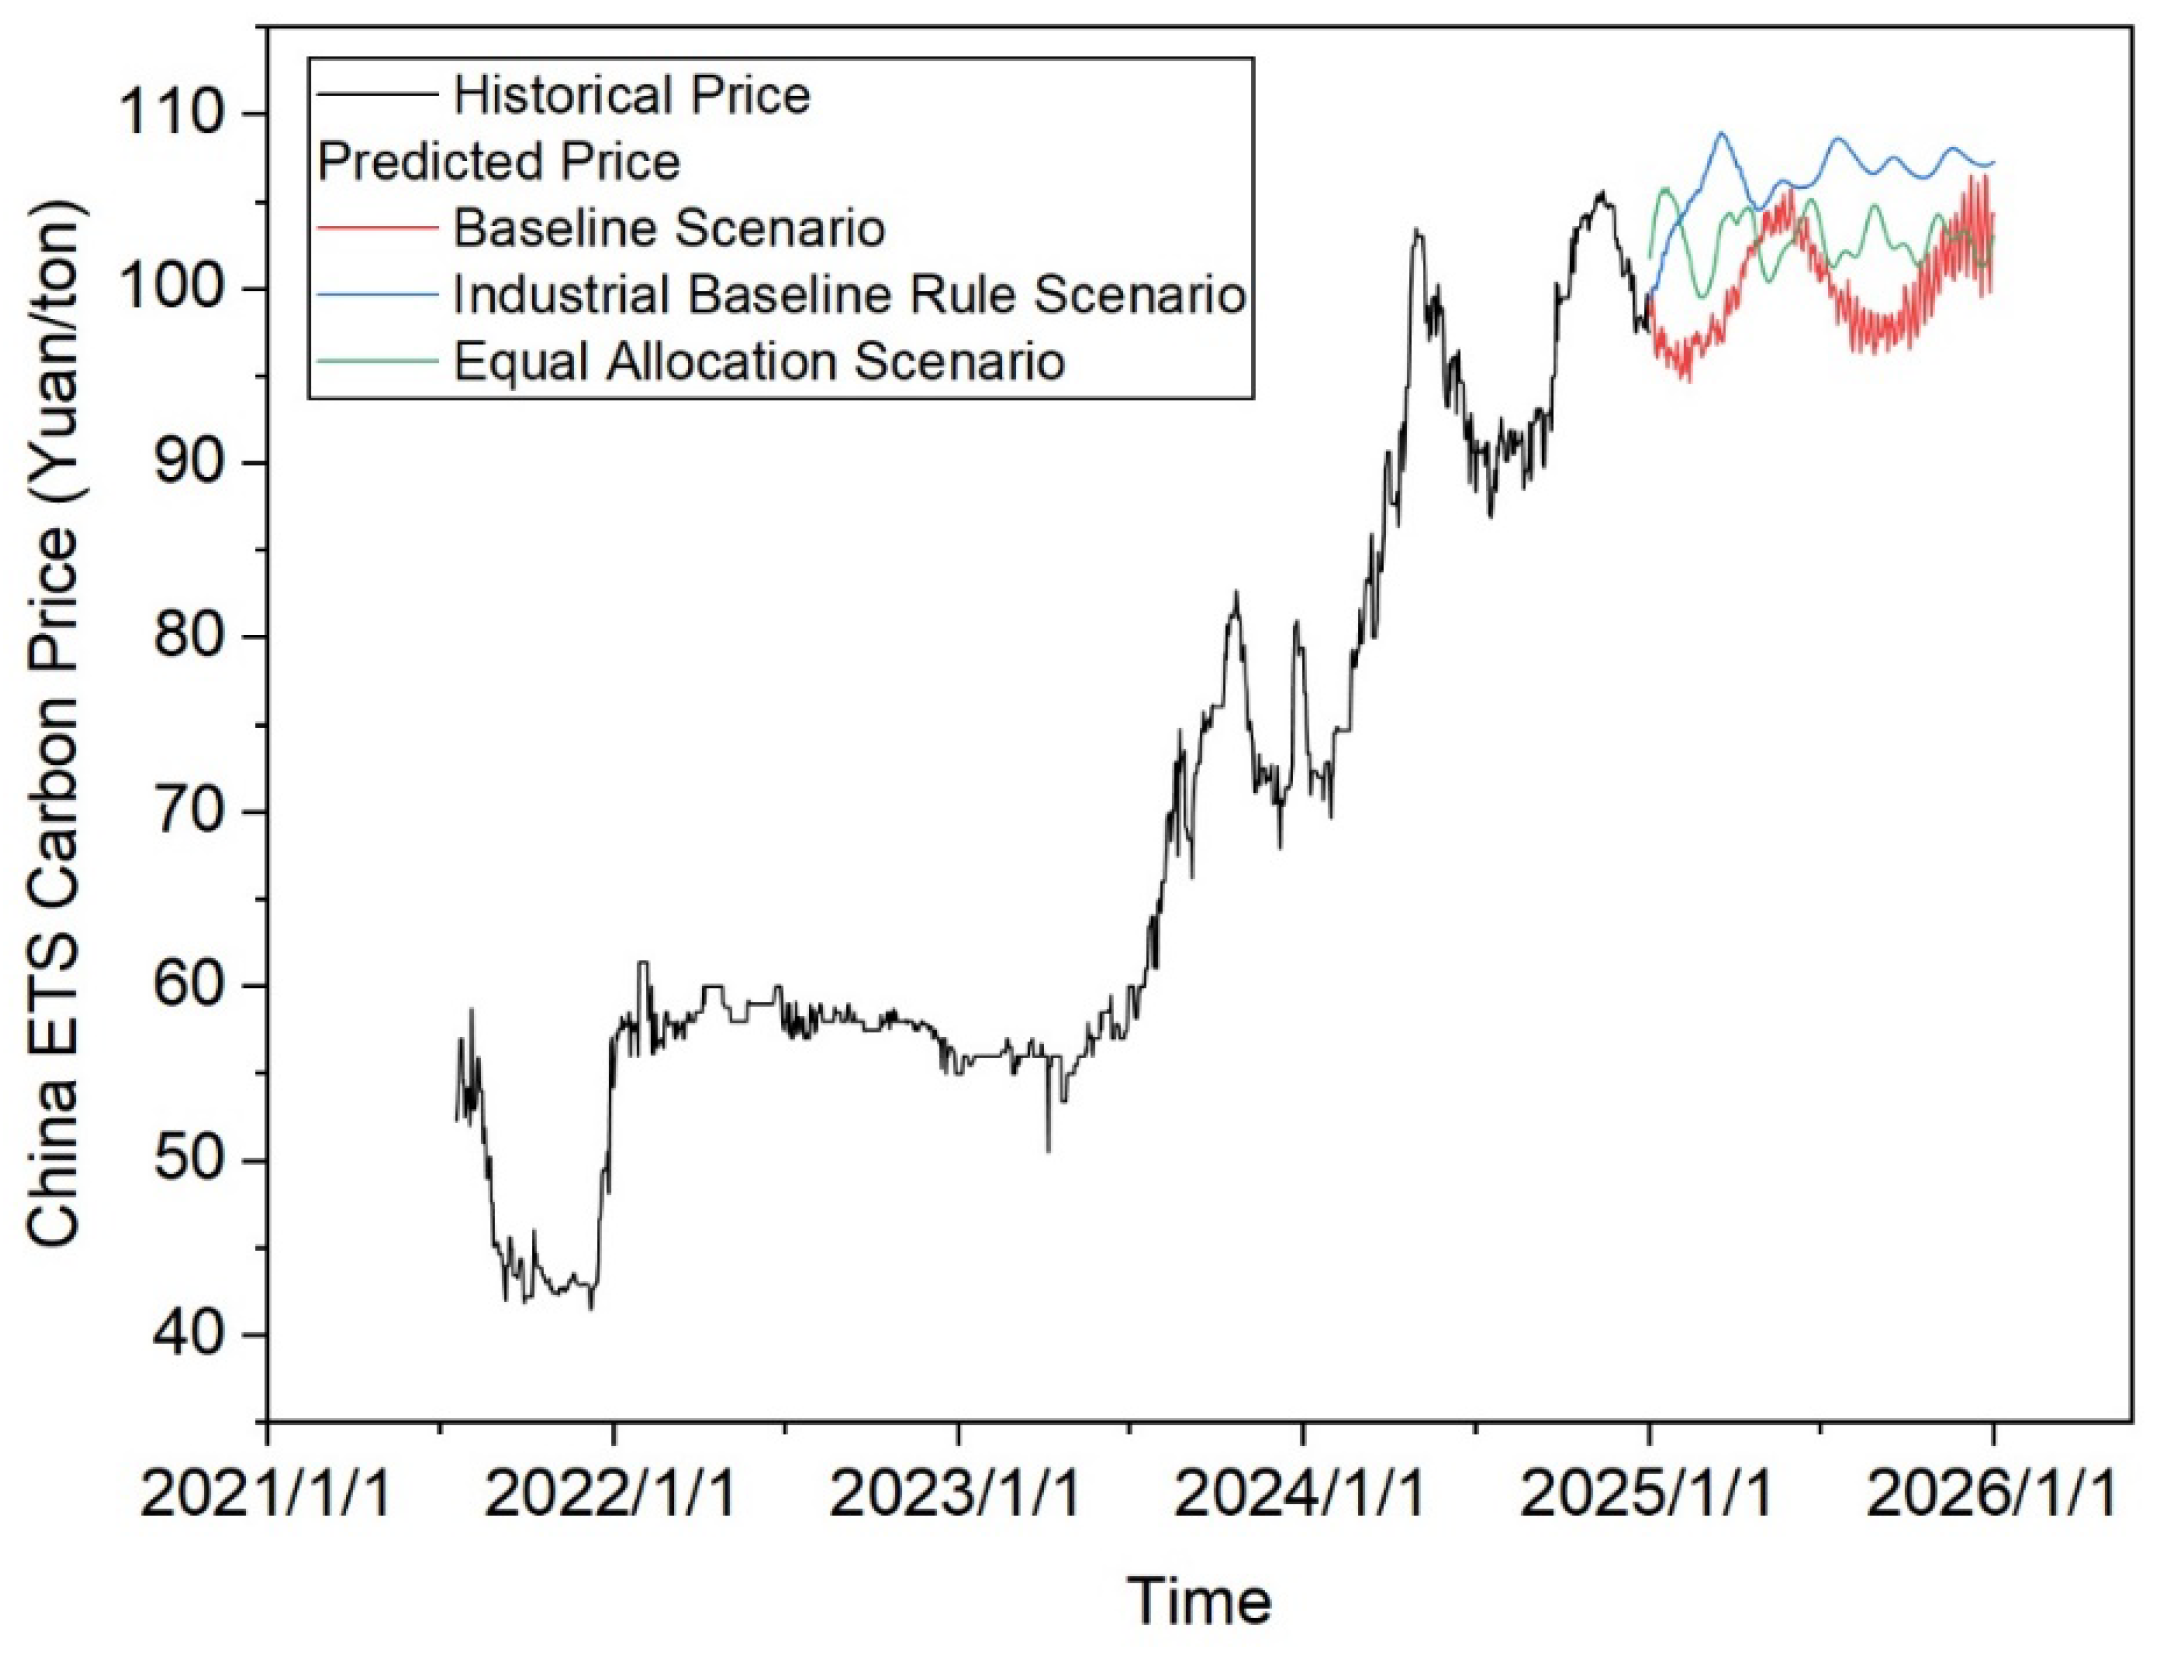
Based on the VMD-SVR model, this study forecasts carbon price trends following the integration of the steel industry into the national carbon market. As shown in Figure 6, the solid black line depicts the historical national carbon price from 19 July 2021 to 31 December 2024. The green dashed line represents the forecast under the equal allocation scenario, while the red solid line corresponds to the prediction under the benchmark-based allocation scenario.

5.2. Aluminum Smelting Industry Enters National Carbon Market

As a key sector scheduled for inclusion in the national carbon market, the aluminum smelting industry contributes approximately 4.5% of the country’s total carbon emissions. Under the previously defined scenario framework:
  • Baseline Scenario: The aluminum smelting industry remains outside the national carbon market in 2025, and thus no industry-specific carbon quotas or emissions are calculated.
  • Equal Allocation Scenario: Following entry into the market in 2025, the industry receives carbon allowances equal to its actual carbon emissions.
  • Benchmark Allocation Scenario: Pre-allocated carbon allowances are determined according to the industry benchmark method, based on the Guangdong Province 2023 Annual Emission Allowance Calculation Method for Controlled Enterprises.
The variables and methodological steps are specified below.
  • Carbon Emissions from the Aluminum Smelting Industry
This study estimates carbon emissions from aluminum smelting through the following procedure: First, given the industry’s low market concentration and high competitiveness, daily aluminum liquid production data for 2024 are sourced from the CEIC database. These data cover large-scale industrial enterprises, defined as those with annual primary business revenue exceeding RMB 20 million, in line with National Bureau of Statistics criteria. Second, in accordance with the Guidelines for the Calculation and Reporting of Greenhouse Gas Emissions from Enterprises: Aluminum Smelting Industry, only emissions directly associated with the smelting process are considered—specifically, emissions from energy used as raw materials and those resulting from anode effects. The corresponding calculation formulas are as follows:
E T o t a l = E R a w M a t e r i a l + E A n o d e E f f e c t
E R a w M a t e r i a l = P × N C A n o d e × ( 1 S A n o d e A A n o d e ) × 44 12
E A n o d e E f f e c t = P × E F C F 4 × G W P C F 4 × 10 3 + P × E F C 2 F 6 × G W P C 2 F 6 × 10 3
where P is the aluminum liquid production volume, selected from the daily aluminum liquid production data of large-scale industrial enterprises (with annual main business revenue of 20 million yuan or more) recorded in the CEIC database. N C A n o d e is the net anode consumption per tonne of aluminum, with a default value of 0.398 tC anode/tAl. S and A represent the average Sulphur content and average ash content of the anode, respectively, with default values of 2% and 0.4%. E F C F 4 and E F C 2 F 6 are the emission factors for CF4 and C2F6 from the anode effect, with default values of 0.02 kg CF4/t Al and 0.0011 kg C2F6/t Al. G W P C F 4 and G W P C 2 F 6 are the global warming potentials of CF4 and C2F6, with default values of 6630 and 11,100, respectively. The time range is from 1 January 2024 to 31 December 2024, with a time frequency of daily. Missing values are handled using linear interpolation.
2.
Carbon Allowances for the Aluminum Smelting Industry
Carbon quotas for the aluminum smelting industry are estimated through the following steps: First, drawing on the Implementation Plan for the Allocation of Carbon Emission Quotas for Chongqing Municipality in 2023, this study applies the industry benchmark method to calculate the verified carbon quota for the aluminum smelting sector in 2024 (see Formula (7)). Second, to reflect the quota position after market entry, the pre-allocated carbon quota for 2025 is derived by adopting the pre-allocation mechanism described in the 2023 and 2024 National Carbon Emission Trading Quota Total and Allocation Plan for the Power Generation Industry, whereby the pre-allocated amount is set at 70% of the previous year’s verified emissions. The resulting pre-allocated quota for the aluminum smelting industry in 2025 is expressed in MtCO2. Daily data spanning 1 January 2025 to 31 December 2025 are used, with missing values addressed via linear interpolation.
E = P × B
where E is the total carbon dioxide emission quota for aluminum smelting enterprises, P is the aluminum liquid production volume, and the daily aluminum liquid production data for industrial enterprises with an annual main business revenue of 20 million yuan or more, as recorded in the CEIC database, are selected. B is the carbon dioxide emission baseline value, taken from the baseline value of 8.06 tCO2/t of molten aluminum specified in the “Implementation Plan for the Allocation of Carbon Emission Quotas for the 2023 Fiscal Year in Chongqing City.” The data time range is from 1 January 2025 to 31 December 2025, with a time frequency of daily, and missing values are handled using linear interpolation.
Based on the three scenarios defined above, Table 9 presents the selected variables for the aluminum smelting industry entering the national carbon market.
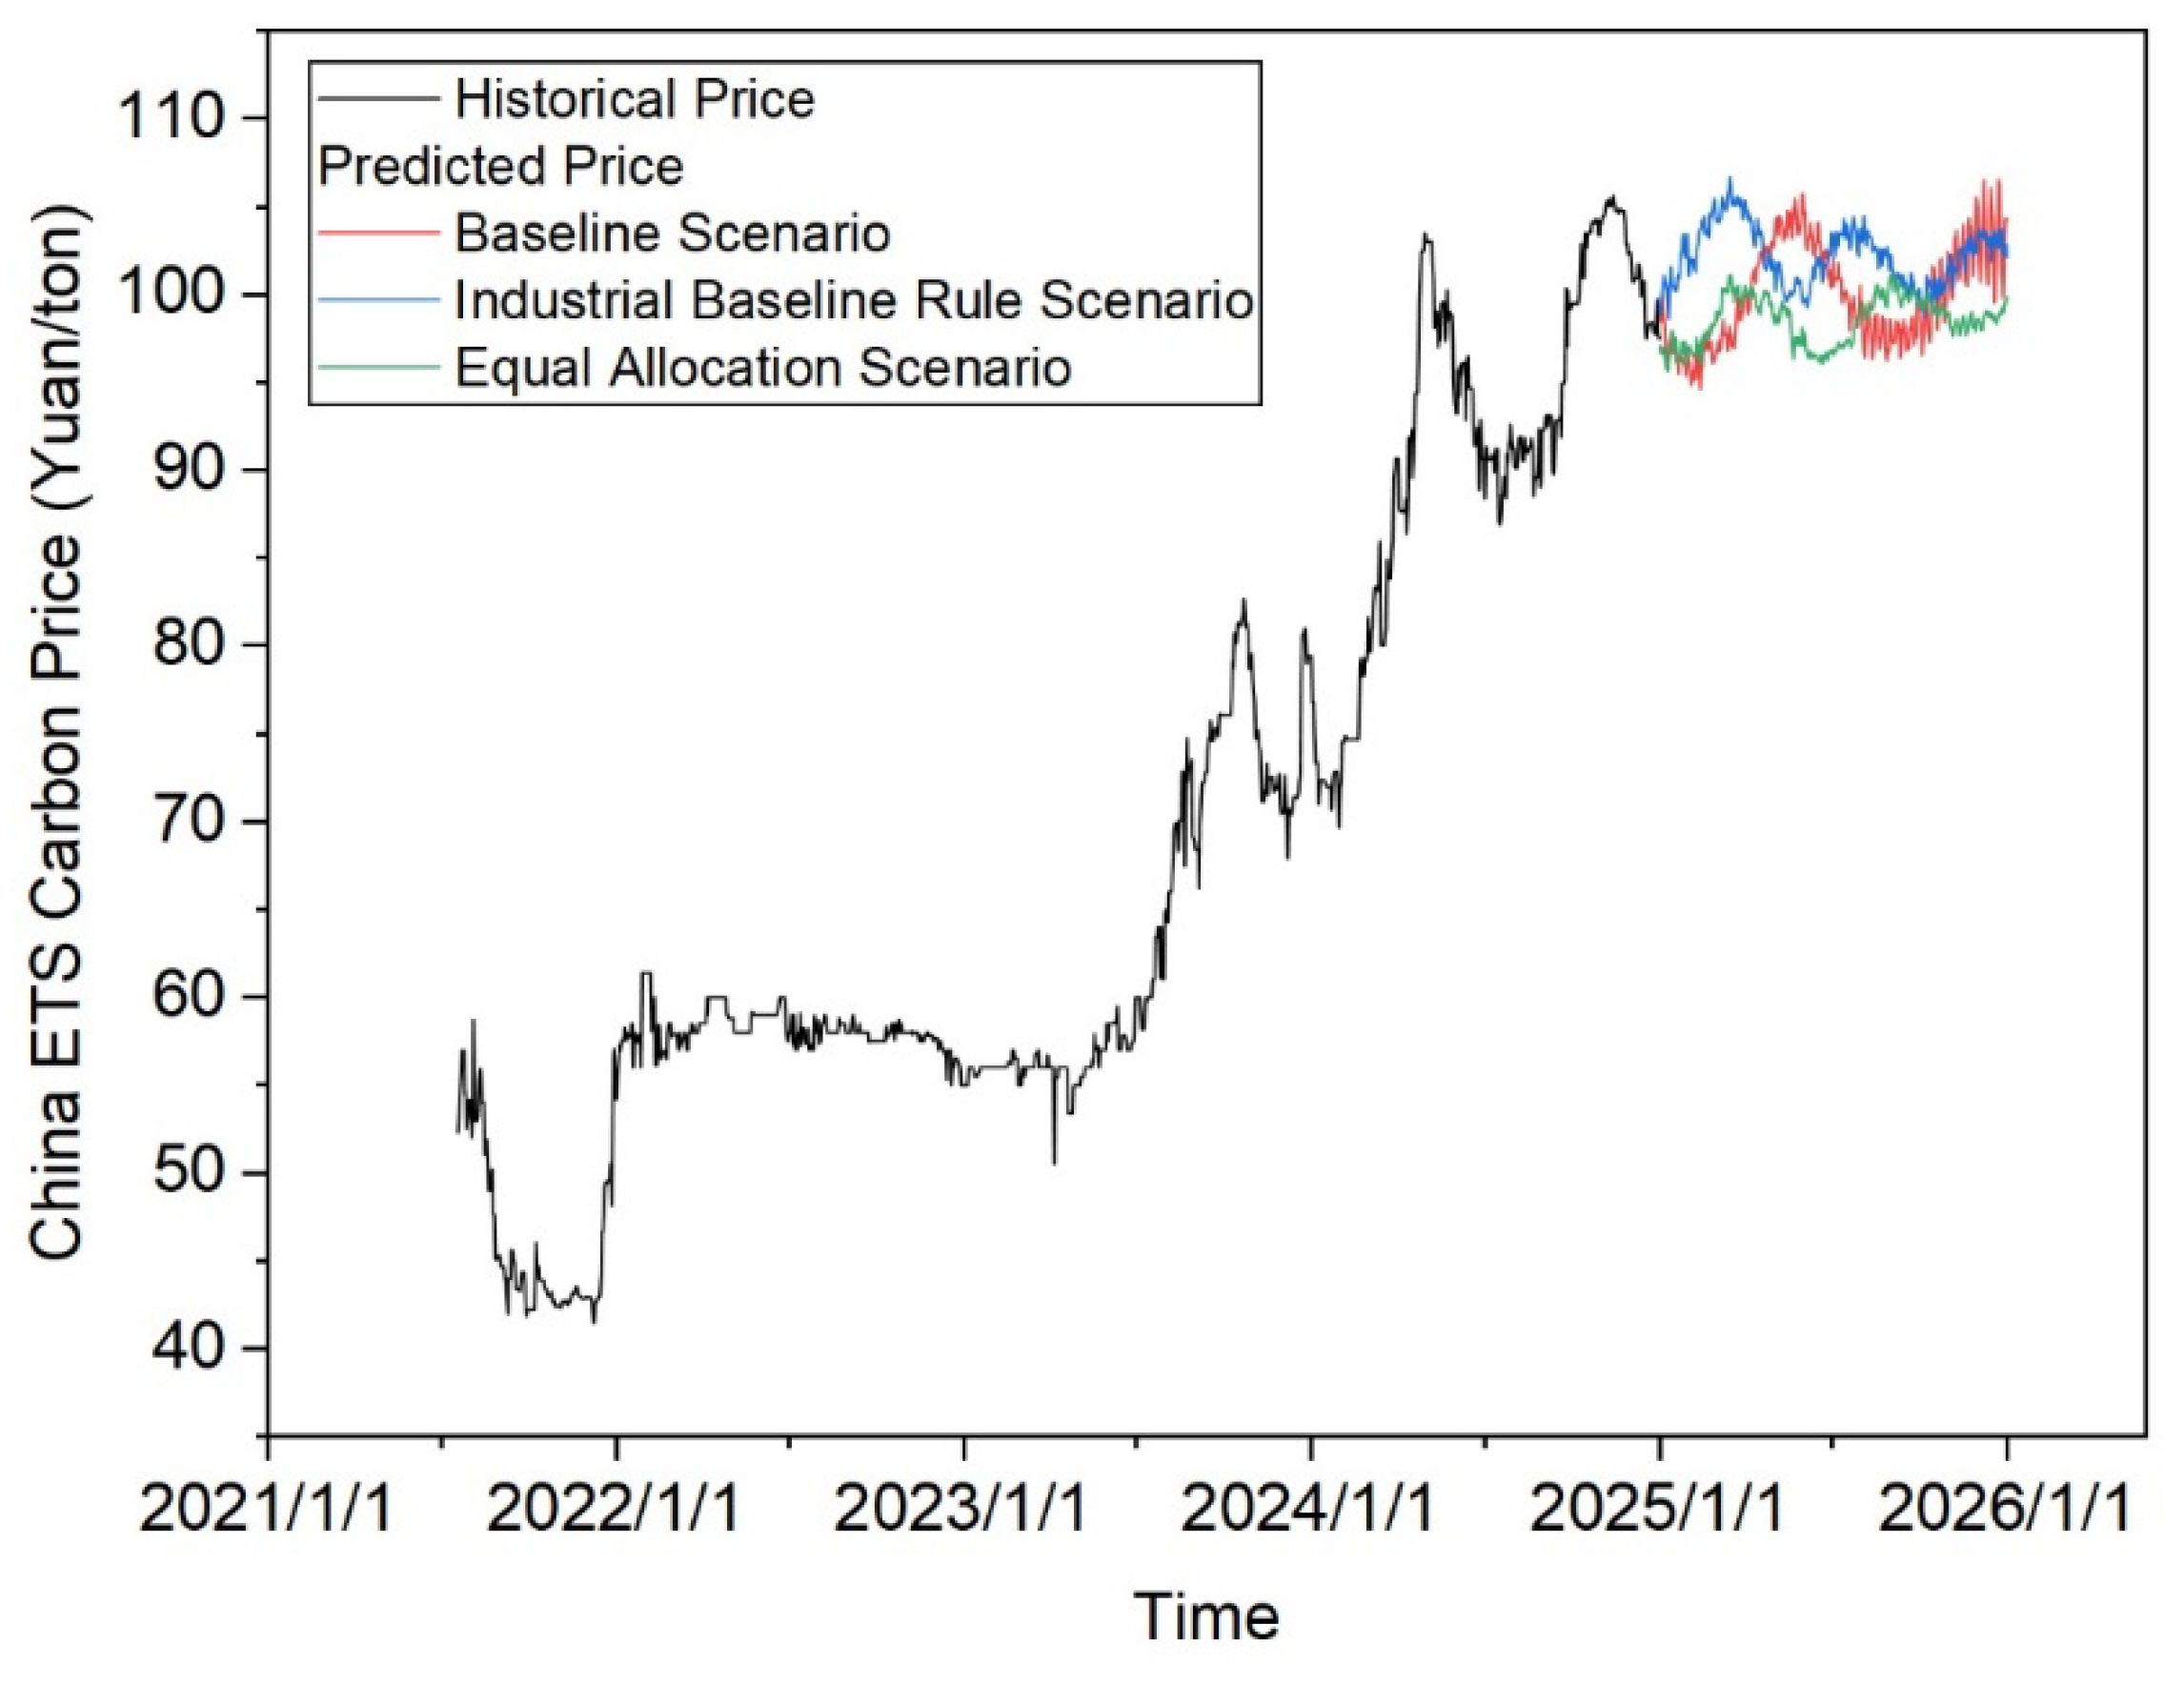
As shown in Figure 7, the solid blue line represents the projected carbon price under the baseline scenario from 1 January to 31 December 2025. The green and red lines correspond to the price forecasts under the equal allocation and benchmark-based allocation scenarios, respectively. These comparative projections illustrate how different allowance allocation mechanisms would influence carbon price fluctuations following market expansion.

6. Discussion and Conclusions

6.1. Management Implications

Based on the empirical findings of this study, several critical management implications can be derived for businesses, carbon market participants, and policymakers to navigate the post-expansion carbon market effectively.
  • For Enterprises (Especially in the Steel and Aluminum Smelting Industries):
    • Strategic Carbon Asset Management: Enterprises must recognize that market expansion, particularly under the benchmark allocation method, will lead to a long-term, moderate increase in carbon costs. High-emission industries like steel and aluminum should integrate carbon costs into their core strategic planning. Increased investment in energy-saving, emission-reduction technologies, and clean energy transition is imperative. Proactive carbon asset management and market participation are essential to hedge against compliance risks. The findings (as illustrated in Figure 6 and Figure 7) indicate that the benchmark method provides stronger abatement incentives; thus, companies should prepare for stricter quota allocation by optimizing production processes and enhancing carbon efficiency ahead of time.
    • Leveraging Predictive Tools: Firms can adopt forecasting methodologies similar to the VMD-SVR model employed in this study (whose workflow is depicted in Figure 4) to develop internal carbon price prediction mechanisms. This would enable more precise anticipation of market trends and optimize decisions regarding the buying and selling of allowances.
For Carbon Market Participants (Traders, Financial Institutions):
2.
Enhanced Risk Management and Product Innovation: Market expansion is projected to improve liquidity and dampen price volatility (e.g., the absence of a sharp year-end price spike after the steel industry’s inclusion in Figure 6), which reduces market speculation risks. Trading institutions should focus on new opportunities arising from cross-sectoral trading. The stabilized price signals can support the design of a richer set of financial derivatives, such as carbon futures and options, to provide risk management tools for compliance entities [56].
3.
For Policymakers:
  • Optimizing Allowance Allocation: To balance market stability with emission reduction incentives, policymakers should prioritize the benchmark allocation method. The research demonstrates that, compared to equal allocation, the benchmark method leads to a short-term price increase followed by faster convergence to long-term stability (Figure 6), while more effectively incentivizing corporate emissions reduction.
  • Strengthening Market Monitoring and Stability Mechanisms: While advancing market expansion, policymakers should concurrently improve market stability reserves (MSR) or similar mechanisms to manage potential initial price fluctuations. Furthermore, enhanced monitoring of key influencing factors identified in this study—such as power sector carbon emissions (EC) and the CSI 300 Power Index (ELEC), which show significant and persistent impacts in the impulse response analysis (Figure 3) and variance decomposition (Table 5 and Table 6)—is crucial for evidence-based market regulation and precise policy adjustment.

6.2. Findings and Conclusions

Using the daily closing prices of China’s national carbon market from 19 July 2021 to 31 December 2024, this study identified key supply- and demand-side factors influencing carbon prices, constructed an analytical model to assess the impact of market expansion, and forecasted post-expansion carbon prices for the steel and aluminum smelting industries. The main conclusions are as follows, with comparative analysis against existing literature:
  • High volatility in a power-sector-only market: If the national carbon market remains limited to the power sector, carbon prices are projected to exhibit significant volatility with an overall upward trend, peaking at 106.53 yuan/ton in December 2025. This aligns with Tang et al. (2020) [24], who noted that a single-sector market amplifies price fluctuations due to limited participation. However, whereas Tang et al. focused on cost-effectiveness, this study emphasizes the risk of non-compliant behaviors like allowance hoarding, highlighting a micro-institutional gap in existing research.
  • Stabilization effect of steel industry inclusion: Under the equal allocation scenario, carbon prices remain stable near end-2024 levels, with a brief January 2025 peak (105.77 yuan/ton). Benchmark allocation induces a short-term increase (March 2025 peak) followed by stabilization. This echoes Wei (2024) [25], who found that market expansion enhances “volume–price synergy.” However, Wei emphasized government–market coordination, while this study reveals that benchmark allocation’s stronger abatement incentives—akin to Lin and Huang (2022) [27]’s critique of administrative intervention—drive more sustainable stability.
  • Similar dynamics for aluminum smelting industry: The aluminum smelting industry’s entry mirrors the steel sector’s price trends, with benchmark allocation yielding better outcomes. This consistency with steel contrasts with Wang and Lin (2012) [7], who highlighted industry-specific marginal abatement costs. Our results suggest that allocation methods outweigh sectoral differences in driving short-term price convergence, a nuance less explored in prior work.
  • Cross-sector trading enhances liquidity: Both industries facilitate cross-sectoral carbon trading, improving market liquidity and price convergence. This supports Yu et al. (2024) [28]’s advocacy for market stability mechanisms but goes further by quantifying how equal allocation eases transition whereas benchmarking strengthens abatement incentives—a trade-off underexplored in liquidity studies.
  • Superior forecasting via VMD-SVR: The VMD-SVR model accurately predicts that expansion mitigates volatility, with steel’s larger emission scale having greater impact. While machine learning models like SVR and LSTM are known for superior accuracy [48,49], this study innovates by applying VMD-SVR to post-expansion scenarios, demonstrating its utility in policy simulation beyond traditional time series forecasting.
In summary, this research corroborates existing findings on expansion benefits (e.g., volatility reduction) but advances the literature by dissecting allocation mechanisms’ differential impacts, highlighting cross-sector liquidity effects, and validating VMD-SVR for policy-scale forecasting. These insights urge policymakers to prioritize benchmark allocation and monitor sectoral emission scales for balanced stability and abatement goals.
Despite these contributions, this study has certain limitations that suggest valuable directions for future research. A primary limitation stems from data availability; as China’s national carbon market was only launched in 2021, the relatively short time series of historical data may constrain the long-term predictive accuracy of the model. Furthermore, the scenario forecasts are based on specific assumptions, such as a continued annual decline of 1.7% in crude steel output, which may be affected by unforeseen macroeconomic shifts or industrial policy changes. The model also does not fully account for the potential impact of extreme external shocks, such as international conflicts or sudden major policy adjustments, on carbon price volatility. Future studies could extend the data time frame as the market matures, incorporate a broader range of high-emission sectors (e.g., cement and chemicals) into the analysis, and develop models that are more resilient to external shocks and policy uncertainties. Additionally, exploring the dynamic feedback mechanisms between carbon prices, technological innovation, and corporate investment decisions would provide deeper insights into the long-term evolution of the carbon market.

Author Contributions

Conceptualization, Y.L.; Methodology, Y.F. and L.C.; Investigation, Y.L.; Data curation, Y.F. and C.Z.; Writing—original draft, J.W.; Writing—review & editing, L.C. All authors have read and agreed to the published version of the manuscript.

Funding

This research received no external funding.

Institutional Review Board Statement

Not applicable.

Informed Consent Statement

Not applicable.

Data Availability Statement

The original contributions presented in this study are included in the article. Further inquiries can be directed to the corresponding author.

Conflicts of Interest

The authors declare no conflict of interest.

References

  1. Bai, Q.; Dong, J.; Tian, Y.C. Research on Volatility Characteristics and Influencing Factors of China’s Carbon Emission Trading Prices. Stat. Decis. 2022, 38, 161–165. (In Chinese) [Google Scholar]
  2. Ji, C.J.; Li, X.Y.; Hu, Y.J.; Wang, X.Y.; Tang, B.J. Research on carbon price in emissions trading scheme: A bibliometric analysis. Nat. Hazards J. Int. Soc. Prev. Mitig. Nat. Hazards 2019, 99, 1381–1396. [Google Scholar] [CrossRef] [Scilit]
  3. Shi, C.; Zeng, Q.; Zhi, J.; Na, X.; Cheng, S. A study on the response of carbon emission rights price to energy price macro economy and weather conditions. Environ. Sci. Pollut. Res. 2023, 30, 33833–33848. [Google Scholar] [CrossRef] [Scilit] [PubMed]
  4. Wang, Z.H.; Hu, G. An Empirical Analysis of the Factors Affecting the Carbon Price in China. J. Ind. Technol. Econ. 2018, 37, 128–136. (In Chinese) [Google Scholar]
  5. Xie, S. Research on the influencing factors of CEA prices in the national carbon market. Mark. Wkly. 2025, 38, 6–9. (In Chinese) [Google Scholar]
  6. Brink, C.; Vollebergh, H.R.J.; Werf, E.V.D. Carbon pricing in the EU: Evaluation of different EU ETS reform options. Energy Policy 2016, 97, 603–617. [Google Scholar] [CrossRef] [Scilit]
  7. Wang, Y.L.; Lin, J. A Study on the Pricing Mechanism of China’s Carbon Emissions Trading System. Price Theory Pract. 2012, 332, 87–88. (In Chinese) [Google Scholar]
  8. Hintermann, B. Allowance price drivers in the first phase of the EU ETS. J. Environ. Econ. Manag. 2010, 59, 43–56. [Google Scholar] [CrossRef] [Scilit]
  9. Wang, W.X.; Bo, L. A study of the Impacting Factors Related to EUCA Price. J. Yunnan Norm. Univ. Humanit. Soc. Sci. Ed. 2013, 45, 135–143. (In Chinese) [Google Scholar]
  10. Yan, Z.; Yu, Z.; Gu, X. Research on Conduction Mechanism between Carbon Price and Coal Future Price in China. Econ. Probl. 2022, 6, 67–74. (In Chinese) [Google Scholar]
  11. Zhang, F.; Xia, Y. Carbon price prediction models based on online news information analytics. Financ. Res. Lett. 2022, 46, 102809. [Google Scholar] [CrossRef] [Scilit]
  12. Chevallier, J. A model of carbon price interactions with macroeconomic and energy dynamics. Energy Econ. 2011, 33, 1295–1312. [Google Scholar] [CrossRef] [Scilit]
  13. She, S.; Xie, B. Green technology innovation, economic growth, and carbon emission intensity: An empirical analysis based on panel vector autoregressive model. Coal Econ. Res. 2025, 45, 134–141. (In Chinese) [Google Scholar]
  14. Wen, F.; Zhao, H.; Zhao, L.; Yin, H. What drives carbon price dynamics in China? Int. Rev. Financ. Anal. 2022, 79, 101999. [Google Scholar] [CrossRef] [Scilit]
  15. Guo, D. Turning Carbon into Gold: The Energy Decentralization Characteristics of Carbon Finance and the Spillover Effect of Monetary Policy. Rev. Econ. Res. 2022, 3001, 82–102. (In Chinese) [Google Scholar]
  16. Wang, X.P.; Wang, X.P. Research on the Dependence Structure and Risk Spillover Effect Between EU and Domestic Carbon Trading Market. J. Ind. Technol. Econ. 2021, 40, 72–81. (In Chinese) [Google Scholar]
  17. Wang, Y.P.; Qiang, F.; Chang, C.P. The integration of carbon price between European and Chinese markets: What are the implications? Int. J. Environ. Res. 2021, 15, 667–680. [Google Scholar] [CrossRef] [Scilit]
  18. Xu, C.; Chen, Z.; Zhu, W.; Zhi, J.; Yu, Y.; Shi, C. Time-frequency spillover and early warning of climate risk in international energy markets and carbon markets: From the perspective of complex network and Machine Learning. Energy 2025, 318, 134857. [Google Scholar] [CrossRef] [Scilit]
  19. Yue, Z.; Ruonan, Z.; Xiaona, C. Empirical Analysis of Influencing Factors of Carbon Emission Trading Prices Under the Low-Carbon Context. J. Green. Sci. Technol. 2025, 27, 268–273+280. (In Chinese) [Google Scholar]
  20. Gao, C.; Li, D.; Wang, X.; Guo, S. Research on regional carbon emission trading price prediction using intelligent machine learning method—Based on the analysis of Hubei province carbon market. Price Theory Pract. 2022, 454, 89–93. (In Chinese) [Google Scholar]
  21. Peng, W.; Chen, S. Analysis and Forecast of Carbon Trading Price in China’s Carbon Emission Pilots Market. J. Technol. Econ. 2020, 39, 102–110. [Google Scholar]
  22. Qu, G.; Guo, C.; Cui, J. Influencing factors and formation mechanism of carbon emission rights prices in Shanghai, China. Sustainability 2024, 16, 9081. [Google Scholar] [CrossRef] [Scilit]
  23. Xia, R. Research on the Fluctuation of Carbon Emission Trading Price and Its Influencing Factors in China—Also Analyzes the Law of Sudden Price Change and Daily Price Fluctuation Near the Performance Date. Price Theory Pract. 2022, 11, 129–132+210. [Google Scholar]
  24. Tang, B.-J.; Ji, C.-J.; Hu, Y.-J.; Tan, J.-X.; Wang, X.-Y. Optimal carbon allowance price in China’s carbon emission trading system: Perspective from the multi-sectoral marginal abatement cost. J. Clean. Prod. 2020, 253, 119945. [Google Scholar] [CrossRef] [Scilit]
  25. Wei, Y.; Wang, X.; Chen, W.; Tang, B. The Carbon Mitigation “Time-Space-Efficiency-Benefit” (TSEB) Coordination Theory: III. Effic. Coord. J. Beijing Inst. Technol. Soc. Sci. Ed. 2024, 26, 30–38. (In Chinese) [Google Scholar]
  26. Zhu, R.; Long, L.; Gong, Y. Emission Trading System, Carbon Market Efficiency, and Corporate Innovations. Int. J. Environ. Res. Public Health 2022, 19, 9683. [Google Scholar] [CrossRef] [Scilit]
  27. Lin, B.; Huang, C. Analysis of emission reduction effects of carbon trading: Market mechanism or government intervention? Sustain. Prod. Consum. 2022, 33, 28–37. [Google Scholar] [CrossRef] [Scilit]
  28. Yu, R.; Weng, Y.; Zhang, X. Market Stability Mechanisms in China’s National Carbon Market: Lessons from International Practices. Environ. Prot. 2024, 52, 68–73. (In Chinese) [Google Scholar]
  29. Dragomiretskiy, K.; Zosso, D. Variational mode decomposition. IEEE Trans. Signal Process 2014, 62, 531–544. [Google Scholar] [CrossRef] [Scilit]
  30. Lin, P.; Zhao, J.; Peng, S.; Cui, X. Diffraction separation by variational mode decomposition. Geophys. Prospect. 2021, 69, 1070–1085. [Google Scholar] [CrossRef] [Scilit]
  31. Yu, S.; Ma, J. Complex variational mode decomposition for slop–preserving denoising. IEEE Trans. Geosci. Remote Sens. 2018, 56, 586–597. [Google Scholar] [CrossRef] [Scilit]
  32. Xu, Y.; Lin, T.; Du, P. A hybrid coal prediction model based on grey Markov optimised by GWO—A case study of Hebei province in China. Expert Syst. Appl. 2023, 235, 121194. [Google Scholar] [CrossRef] [Scilit]
  33. Huang, H.; Wang, X.; Liu, L. A review on urban pluvial floods: Characteristics, mechanisms, data, and research methods. Prog. Geogr. 2021, 40, 1048–1059. (In Chinese) [Google Scholar] [CrossRef] [Scilit]
  34. Huang, Y.; Dai, X.; Wang, Q.; Zhou, D. A hybrid model for carbon price forecasting using GARCH and long short-term memory network. Appl. Energy 2021, 285, 116485. [Google Scholar] [CrossRef] [Scilit]
  35. Tong, M.; Qin, F.; Duan, H. A novel optimised grey model and its application in forecasting CO2 emissions. Energy Rep. 2022, 8, 14643–14657. [Google Scholar] [CrossRef] [Scilit]
  36. Hu, Z.; Chang, W.; Jang, Y.; Jo, Y.; Jung, J. Dynamic interactions of COVID-19 incidences, mobility, and social distancing policies in seoul: A VAR model approach. Sci. Rep. 2025, 15, 24288. [Google Scholar] [CrossRef] [Scilit]
  37. Schultheiss, C.; Ulmer, M.; Bühlmann, P. Ancestor regression in structural vector autoregressive models. J. Causal Inference 2025, 13, 20240011. [Google Scholar] [CrossRef] [Scilit]
  38. Yang, J. Coordinated Development of New Urbanization with Agricultural Scaling and Specialization: A Discussion Based on the PVAR Method. J. Financ. Econ. 2017, 4, 65–76. [Google Scholar]
  39. Chen, X.; Xiao, C.; Liu, Y. Research on Carbon Trading Price Drivers Based on Explainable Deep Learning. Syst. Eng. Theory Pract. 2025. ahead of print (In Chinese) [Google Scholar] [CrossRef]
  40. Du, Z.; Liu, F. Impacts on the Price of Regional Carbon Emissions Based on GA-BP-MIV Model. Price Theory Pract. 2018, 408, 42–45. (In Chinese) [Google Scholar]
  41. Han, M.; Ding, L.; Zhao, X.; Kang, W.L. Forecasting carbon prices in the Shenzhen market, China: The role of mixed-frequency factors. Energy 2019, 171, 69–76. [Google Scholar] [CrossRef] [Scilit]
  42. Pang, T.; Tan, K.; Fan, C. Carbon price forecasting with quantile regression and feature selection. In Proceedings of the 2023 7th International Symposium on Computer Science and Intelligent Control (ISCSIC), Nanjing, China, 27–29 October 2023; pp. 362–367. [Google Scholar]
  43. Qin, C.; Ding, S.; Zhang, H. Regional Carbon Market Trading Price Prediction by Using ARIMA-LSTM. China For. Econ. 2025, 192, 37–48. [Google Scholar]
  44. Fan, L.; Dong, H.; Duan, H. A Decomposition Ensemble Model with Sliding Time Window for Forecasting Carbon Market Prices. China J. Manag. Sci. 2023, 31, 277–286. (In Chinese) [Google Scholar]
  45. Yan, J.; Jin, J.; Chen, F.; Yu, G.; Yin, H.; Wang, W. Urban flash flood forecast using support vector machine and numerical simulation. J. Hydroinform. 2018, 20, 221–231. [Google Scholar] [CrossRef] [Scilit]
  46. Hao, J.; Feng, Q.; Lu, J.; Sun, X. A bi-level ensemble learning approach to complex time series forecasting: Taking exchange rates as an example. J. Forecast. 2023, 42, 1385–1406. [Google Scholar] [CrossRef] [Scilit]
  47. Chen, Y.; Zhu, Y.; Wang, J.; Li, M. A Hybrid Model for Carbon Price Forecasting Based on Secondary Decomposition and Weight Optimization. Mathematics 2025, 13, 2323. [Google Scholar] [CrossRef] [Scilit]
  48. Wei, Y.; Zhang, J.; Chen, X. Forecasting China’s Carbon Trading Price in a DMS and DMA Framework—Evidence from the Hubei Carbon Market. Syst. Eng. 2022, 40, 1–16. (In Chinese) [Google Scholar]
  49. Li, H. Statistical Learning Methods; Tsinghua University Press: Beijing, China, 2012; pp. 95–134, (In Chinese with English Abstract). [Google Scholar]
  50. Li, M.F.; Hu, H.; Zhao, L.T. Key factors affecting carbon prices from a time-varying perspective. Environ. Sci. Pollut. Res. 2022, 29, 65144–65160. [Google Scholar] [CrossRef] [Scilit]
  51. Li, Y.; Yang, R.; Wang, X.; Zhu, J.; Song, N. Carbon Price Combination Forecasting Model Based on Lasso Regression and Optimal Integration. Sustainability 2023, 15, 9354. [Google Scholar] [CrossRef] [Scilit]
  52. Wang, B.; Wang, Z.; Yao, Z. Enhancing carbon price point-interval multi-step-ahead prediction using a hybrid framework of autoformer and extreme learning machine with multi-factors. Expert Syst. Appl. 2025, 270, 126467. [Google Scholar] [CrossRef] [Scilit]
  53. Yang, Y.; Li, S.; Liu, H.; Guo, J. Carbon Dioxide Emission Forecasting Using BiLSTM Network Based on Variational Mode Decomposition and Improved Black-Winged Kite Algorithm. Mathematics 2025, 13, 1895. [Google Scholar] [CrossRef] [Scilit]
  54. Zeng, L.; Hu, H.; Tang, H.; Zhang, X.; Zhang, D. Carbon emission price point-interval forecasting based on multivariate variational mode decomposition and attention-LSTM model. Appl. Soft Comput. 2024, 157, 111543. [Google Scholar] [CrossRef] [Scilit]
  55. Guo, W. Factors Impacting on the Price of China’s Regional Carbon Emissions Based on Adaptive Lasso Method. China Popul. Resour. Environ. 2015, 25, 305–310. (In Chinese) [Google Scholar]
  56. Wei, P.; Zhou, J.; Ren, X.; Huynh, L.D.T. Financialisation of the European Union Emissions Trading System and its influencing factors inquantiles. Int. J. Financ. Econ. 2025, 30, 925–940. [Google Scholar] [CrossRef] [Scilit]
Figure 1. Price trends of China’s Carbon Emission Allowances (CEAs) from 2021 to 2024.
Sustainability 18 02028 g001
Figure 2. Inverse Roots of AR Characteristic Polynomial.
Sustainability 18 02028 g002
Figure 3. Pulse Response Analysis Diagram.
Sustainability 18 02028 g003
Figure 4. Flowchart of the Hybrid VMD-SVR Prediction Model.
Sustainability 18 02028 g004
Figure 5. Comparison of the VMD-SVR Test Set.
Sustainability 18 02028 g005
Figure 6. Scenario Forecast for the Steel Industry Entering the National Carbon Market Based on the VMD-SVR Model.
Sustainability 18 02028 g006
Figure 7. Scenario Forecast for the Aluminum Smelting Industry Entering the National Carbon Market Based on the VMD-SVR Model.
Sustainability 18 02028 g007
Table 1. Represents the variables and data sources.
CategoryVariable NameIndicator SelectionIdentification SymbolSource
Target VariableNational Carbon Market PriceNational Carbon Market Daily Closing PriceCEANational Carbon Market Information Network
Feature variablesIndustry Production FactorsCarbon emissions of the power industryECGlobal Carbon Database
CEIC Database
Wind Database
Carbon Allowances in the Power SectorECQ
Shanghai–Shenzhen 300 Power IndexELEC
Energy Price FactorsINE Crude Oil PriceINEWind Database
China Coal Price IndexCCPIWind Database
LNG Natural Gas PriceLNGWind Database
China Securities New Energy IndexNEWind Database
Shanghai Energy IndexSZNYWind Database
Domestic economic factorsShanghai–Shenzhen 300 IndexHS300Wind Database
China Securities Industry IndexZDWind Database
International Carbon PriceEU Carbon Emission Allowance Futures Settlement PriceEUAWind Database
Commodity MarketNanhua Commodity Index Closing PriceNHCIWind Database
S&P GSCI Commodity Total Return Index closing priceGSCIWind Database
Table 2. Chinese Carbon Market Prices and Their Influencing Factors: Lasso Variable Selection Results.
No.VariableIndicator SelectionPearson Correlation CoefficientLasso Regression CoefficientConclusion
1ECCarbon emissions in the power industry0.8040.14Retained
2ECQElectricity Industry Carbon Allowance0.8380.132Reserved
3ELECShanghai–Shenzhen 300 Power Index0.8610.502Hold
4CCPIChina Coal Price Index−0.499−0.431Retained
5INEINE Crude Oil Price0.1330.000Excluded
6LNGLNG natural gas price−0.492−0.027Hold
7NEChina Securities New Energy Index0.8540.000Excluded
8SZNYShanghai Energy Price0.748−0.246Hold
9HS300Shanghai–Shenzhen 300 Index0.5080.199Hold
10ZDChina Securities Industry Index−0.6840.000Excluded
11EUAEU carbon emission allowance futures settlement price−0.329−0.190Hold
12NHCINanhua Commodity Index closing price0.7710.571Hold
13GSCIS&P GSCI All-Country World Index closing price0.4890.000Excluded
Table 3. Results of Data Stationarity Tests.
ADF Statistic1% Critical Value5% Critical Value10% Critical Valuep-ValueTest Results
CEA−0.0452−3.4355−2.8638−2.56790.9546Unstable
EC−0.4936−3.4356−2.8638−2.56800.8932Unstable
ECQ−1.0349−3.4355−2.8638−2.56790.7403Unstable
ELEC−1.7824−3.4355−2.8638−2.56790.3892Unstable
CCPI−2.2365−3.4356−2.8639−2.56800.1932Unstable
LNG−1.7269−3.4356−2.8639−2.56800.4173Unstable
SZNY−2.6444−3.4355−2.8638−2.56790.0841Unstable
HS300−2.0905−3.4355−2.86389−2.56800.2483Unstable
NHCI−2.2861−3.4355−2.8638−2.56790.1764Unstable
EUA−3.0544−3.4355−2.8638−2.56800.0301Stationary
Table 4. Optimal lag order results.
LagLogLLRFPEAICSCHQ
07029.915NA6.38 × 10−18−11.21392−11.17293−11.19851
132,257.8850,012.632.36 × 10−35−51.35445−50.90351 *−51.18494
232,567.19608.23271.69 × 10−35−51.6888−50.82792−51.36519 *
332,691.6242.66341.62 × 10−35 *−51.72780 *−50.45697−51.25009
432,740.7495.061841.76 × 10−35−51.64655−49.96578−51.01474
532,792.3498.997241.90 × 10−35−51.56923−49.47852−50.78333
632,839.6990.076882.07 × 10−35−51.48512−48.98446−50.54512
732,901.7116.99612.20 × 10−35−51.42444−48.51384−50.33034
832,996.33177.02022.22 × 10−35−51.41587−48.09532−50.16766
933,061.88121.56622.35 × 10−35−51.36083−47.63034−49.95853
1033,141.62146.6167 *2.43 × 10−35−51.32847−47.18804−49.77207
Note: The optimal lag order referred to in the text/tables is determined based on the five information criteria: the Likelihood Ratio (LR), Final Prediction Error (FPE), Akaike Information Criterion (AIC), Schwarz Criterion (SC), and Hannan-Quinn (HQ) criterion. The order selected is the one recommended by the majority of these criteria. Asterisks (*) denote that the optimal lag order is recommended by LR, FPE, AIC, SC, or HQ criterion.
Table 5. National Carbon Market Price Variance Decomposition Results.
PeriodS.E.CEAD.CCPID.ECD.ECQD.ELEC
10.01510000
20.020199.52200.00580.05230.00040.0826
30.023599.03400.00430.14990.19670.1040
40.026598.76490.00370.23360.28110.1147
50.029298.52670.00770.29990.35220.1559
60.031598.27300.01520.36190.41830.2224
70.033797.98990.02740.41870.47980.3201
80.035897.67670.04350.47310.53770.4417
90.037697.33090.06340.52530.59210.5873
100.039496.95630.08630.57590.64350.7533
Table 6. National Carbon Market Price Variance Decomposition Results.
PeriodD.EUAD.HS300D.LNGD.NHCID.SZNY
100000
20.04170.04030.00280.00430.2480
30.04820.04140.05060.00530.3657
40.04900.05250.06030.00510.4350
50.04090.05760.05880.00490.4955
60.03560.06270.05460.00640.5499
70.03710.06610.04910.01110.6008
80.04640.06930.04380.01880.6492
90.06440.07210.03960.02950.6954
100.09030.07490.03720.04300.7393
Table 7. Error Metrics for the VMD-SVR Prediction Set.
Error MetricsMSERMSEMAEMAPER2
VMD-SVR0.4310.65660.45870.470.9848
Table 8. Representative Variables and Data Sources for Predicting the Entry of the Steel Industry into the National Carbon Market.
CategoryVariable NameIndicator SelectionIdentification SymbolSource
Target VariableNational Carbon Market PriceNational Carbon Market Daily Closing PriceCEANational Carbon Market Information Network
Feature variablesIndustry Production FactorsCarbon emissions of the power industryECGlobal Carbon Database
Electricity industry carbon allowancesECQGlobal Carbon Database
CEIC Database
Shanghai–Shenzhen 300 Power IndexELECWind Database
Energy Price FactorsSteel Industry Carbon EmissionsSCCEIC Database
Steel industry carbon quotasSCQCEIC Database
China Coal Price IndexCCPIWind Database
LNG Natural Gas PriceLNGWind Database
Table 9. Representative Variables and Data Sources for the Aluminum Smelting Industry’s Entry into the National Carbon Market.
CategoryVariable NameIndicator SelectionIdentification SymbolSource
Target VariableNational Carbon Market PriceNational Carbon Market Daily Closing PriceCEANational Carbon Market Information Network
Feature variablesIndustry Production FactorsCarbon emissions of the power industryECGlobal Carbon Database
Electricity industry carbon allowancesECQGlobal Carbon Database
CEIC Database
Shanghai–Shenzhen 300 Power IndexELECWind Database
Energy Price FactorsAluminum Smelting Industry Carbon EmissionsALCCEIC Database
Carbon emissions in the aluminum smelting industryALCQCEIC Database
China Coal Price IndexCCPIWind Database
LNG Natural Gas PriceLNGWind Database
Shanghai Energy IndexSZNYWind Database
Domestic economic factorsShanghai–Shenzhen 300 IndexHS300Wind Database
International carbon pricesEU Carbon Emission Allowance Futures Settlement PriceEUAWind Database
Commodity MarketNanhua Commodity Index Closing PriceNHCIWind Database
Disclaimer/Publisher’s Note: The statements, opinions and data contained in all publications are solely those of the individual author(s) and contributor(s) and not of MDPI and/or the editor(s). MDPI and/or the editor(s) disclaim responsibility for any injury to people or property resulting from any ideas, methods, instructions or products referred to in the content.