Post-Expansion Carbon Price Forecasting in China’s Emissions Trading Scheme Based on VMD–SVR Model

Abstract
1. Introduction
2. Literature Review
2.1. Fundamental Drivers of Carbon Prices
2.2. Market Expansion and Mechanism Efficiency
2.3. Forecasting Methodologies
3. Model Specification and Data Analysis
3.1. Sample Selection
- Industrial Production Factors
- 2.
- Energy Price Factors
- 3.
- Domestic Economic Conditions
- 4.
- International Carbon Prices
- 5.
- Commodity Markets
3.2. Variable Screening and Analysis
3.3. Establishment and Testing of the VAR Model
- Stationarity Test
- 2.
- Lag Order Selection
- 3.
- Model Stability Test
- 4.
- Impulse Response Analysis
- 5.
- Variance Decomposition Analysis
4. Carbon Price Prediction Based on the VMD-SVR Model
4.1. Variational Modal Decomposition and Support Vector Regression
4.2. Construction of the VMD-SVR Hybrid Model
4.3. VMD-SVR Empirical Analysis and Results
5. Forecasting Carbon Price Trends Following Carbon Market Expansion
5.1. Steel Industry Enters the National Carbon Market
- Under the Baseline Scenario, where the steel industry remains outside the national carbon market in 2025, no industry-specific carbon quotas or emissions calculations are required.
- Under the Equal Allocation Scenario, where the steel industry enters the market, its allocated carbon allowances are set equal to its actual carbon emissions.
- Under the Benchmark Allocation Scenario, the steel industry receives pre-allocated quotas determined according to the industry benchmark method, referencing the Guangdong Province 2023 Annual Emission Allowance Calculation Method for Controlled Enterprises.
- Steel Industry Carbon Emissions
- 2.
- Pre-allocated Carbon Quotas for the Steel Industry
5.2. Aluminum Smelting Industry Enters National Carbon Market
- Baseline Scenario: The aluminum smelting industry remains outside the national carbon market in 2025, and thus no industry-specific carbon quotas or emissions are calculated.
- Equal Allocation Scenario: Following entry into the market in 2025, the industry receives carbon allowances equal to its actual carbon emissions.
- Benchmark Allocation Scenario: Pre-allocated carbon allowances are determined according to the industry benchmark method, based on the Guangdong Province 2023 Annual Emission Allowance Calculation Method for Controlled Enterprises.
- Carbon Emissions from the Aluminum Smelting Industry
- 2.
- Carbon Allowances for the Aluminum Smelting Industry
6. Discussion and Conclusions
6.1. Management Implications
- For Enterprises (Especially in the Steel and Aluminum Smelting Industries):
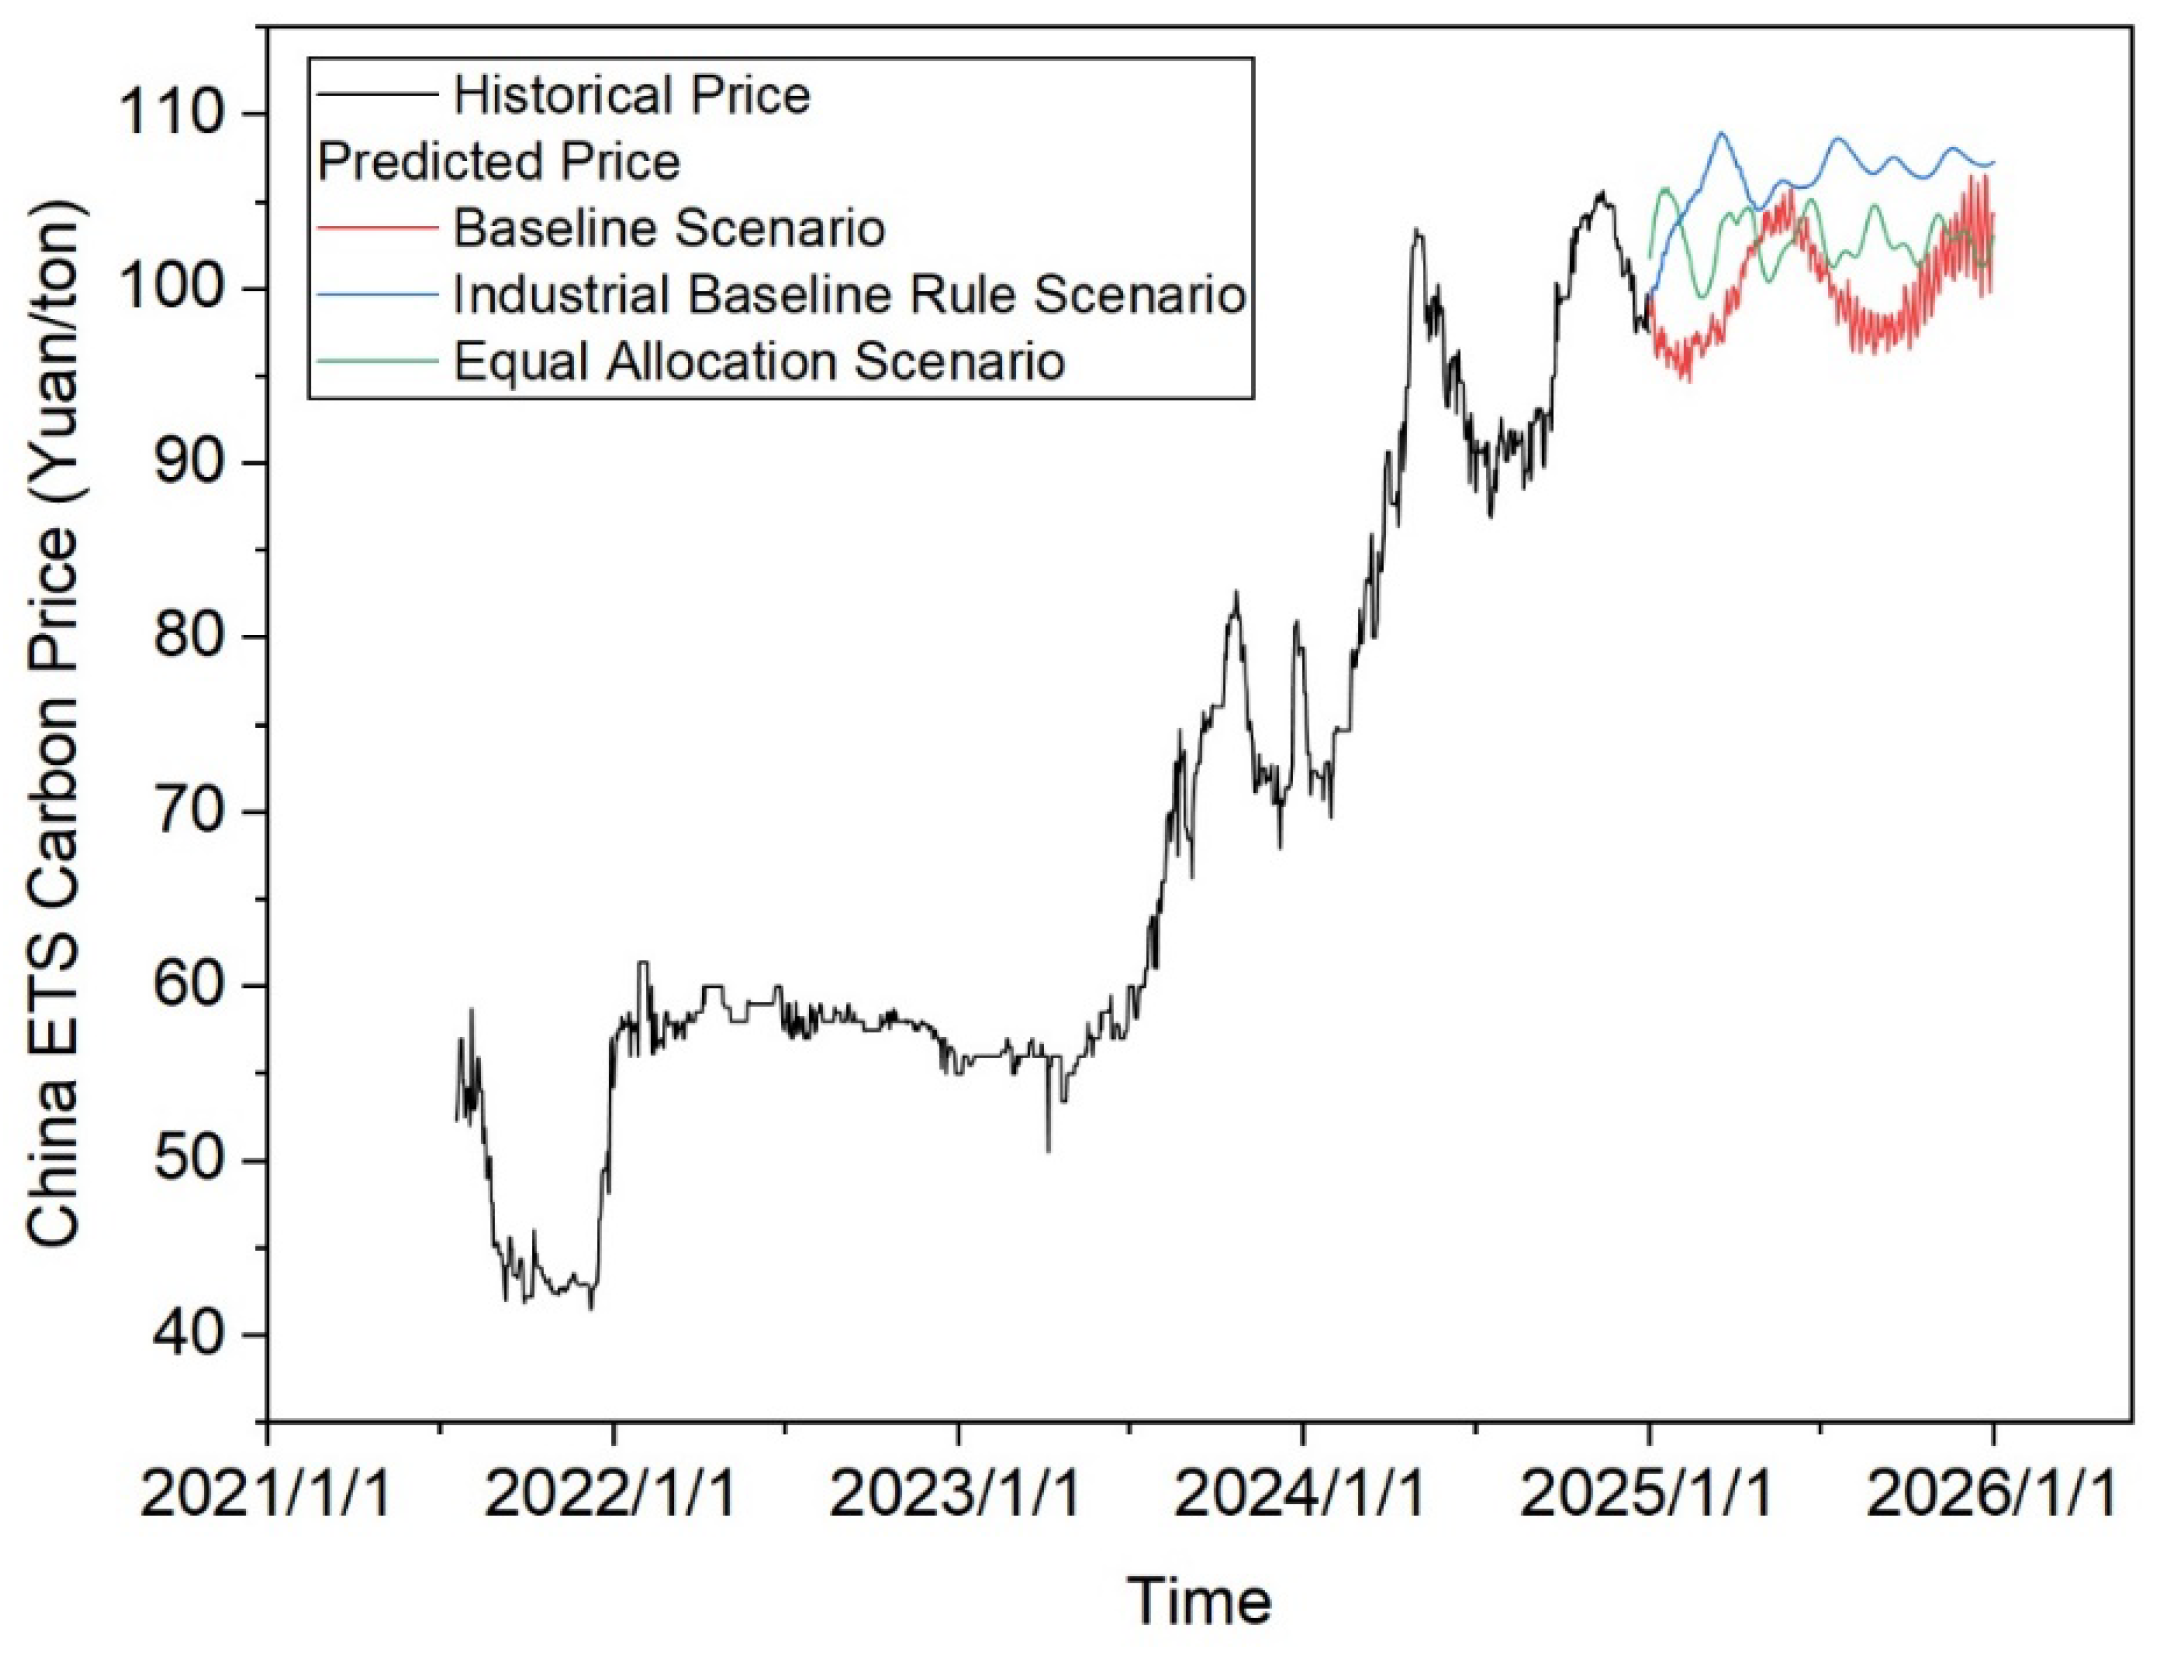
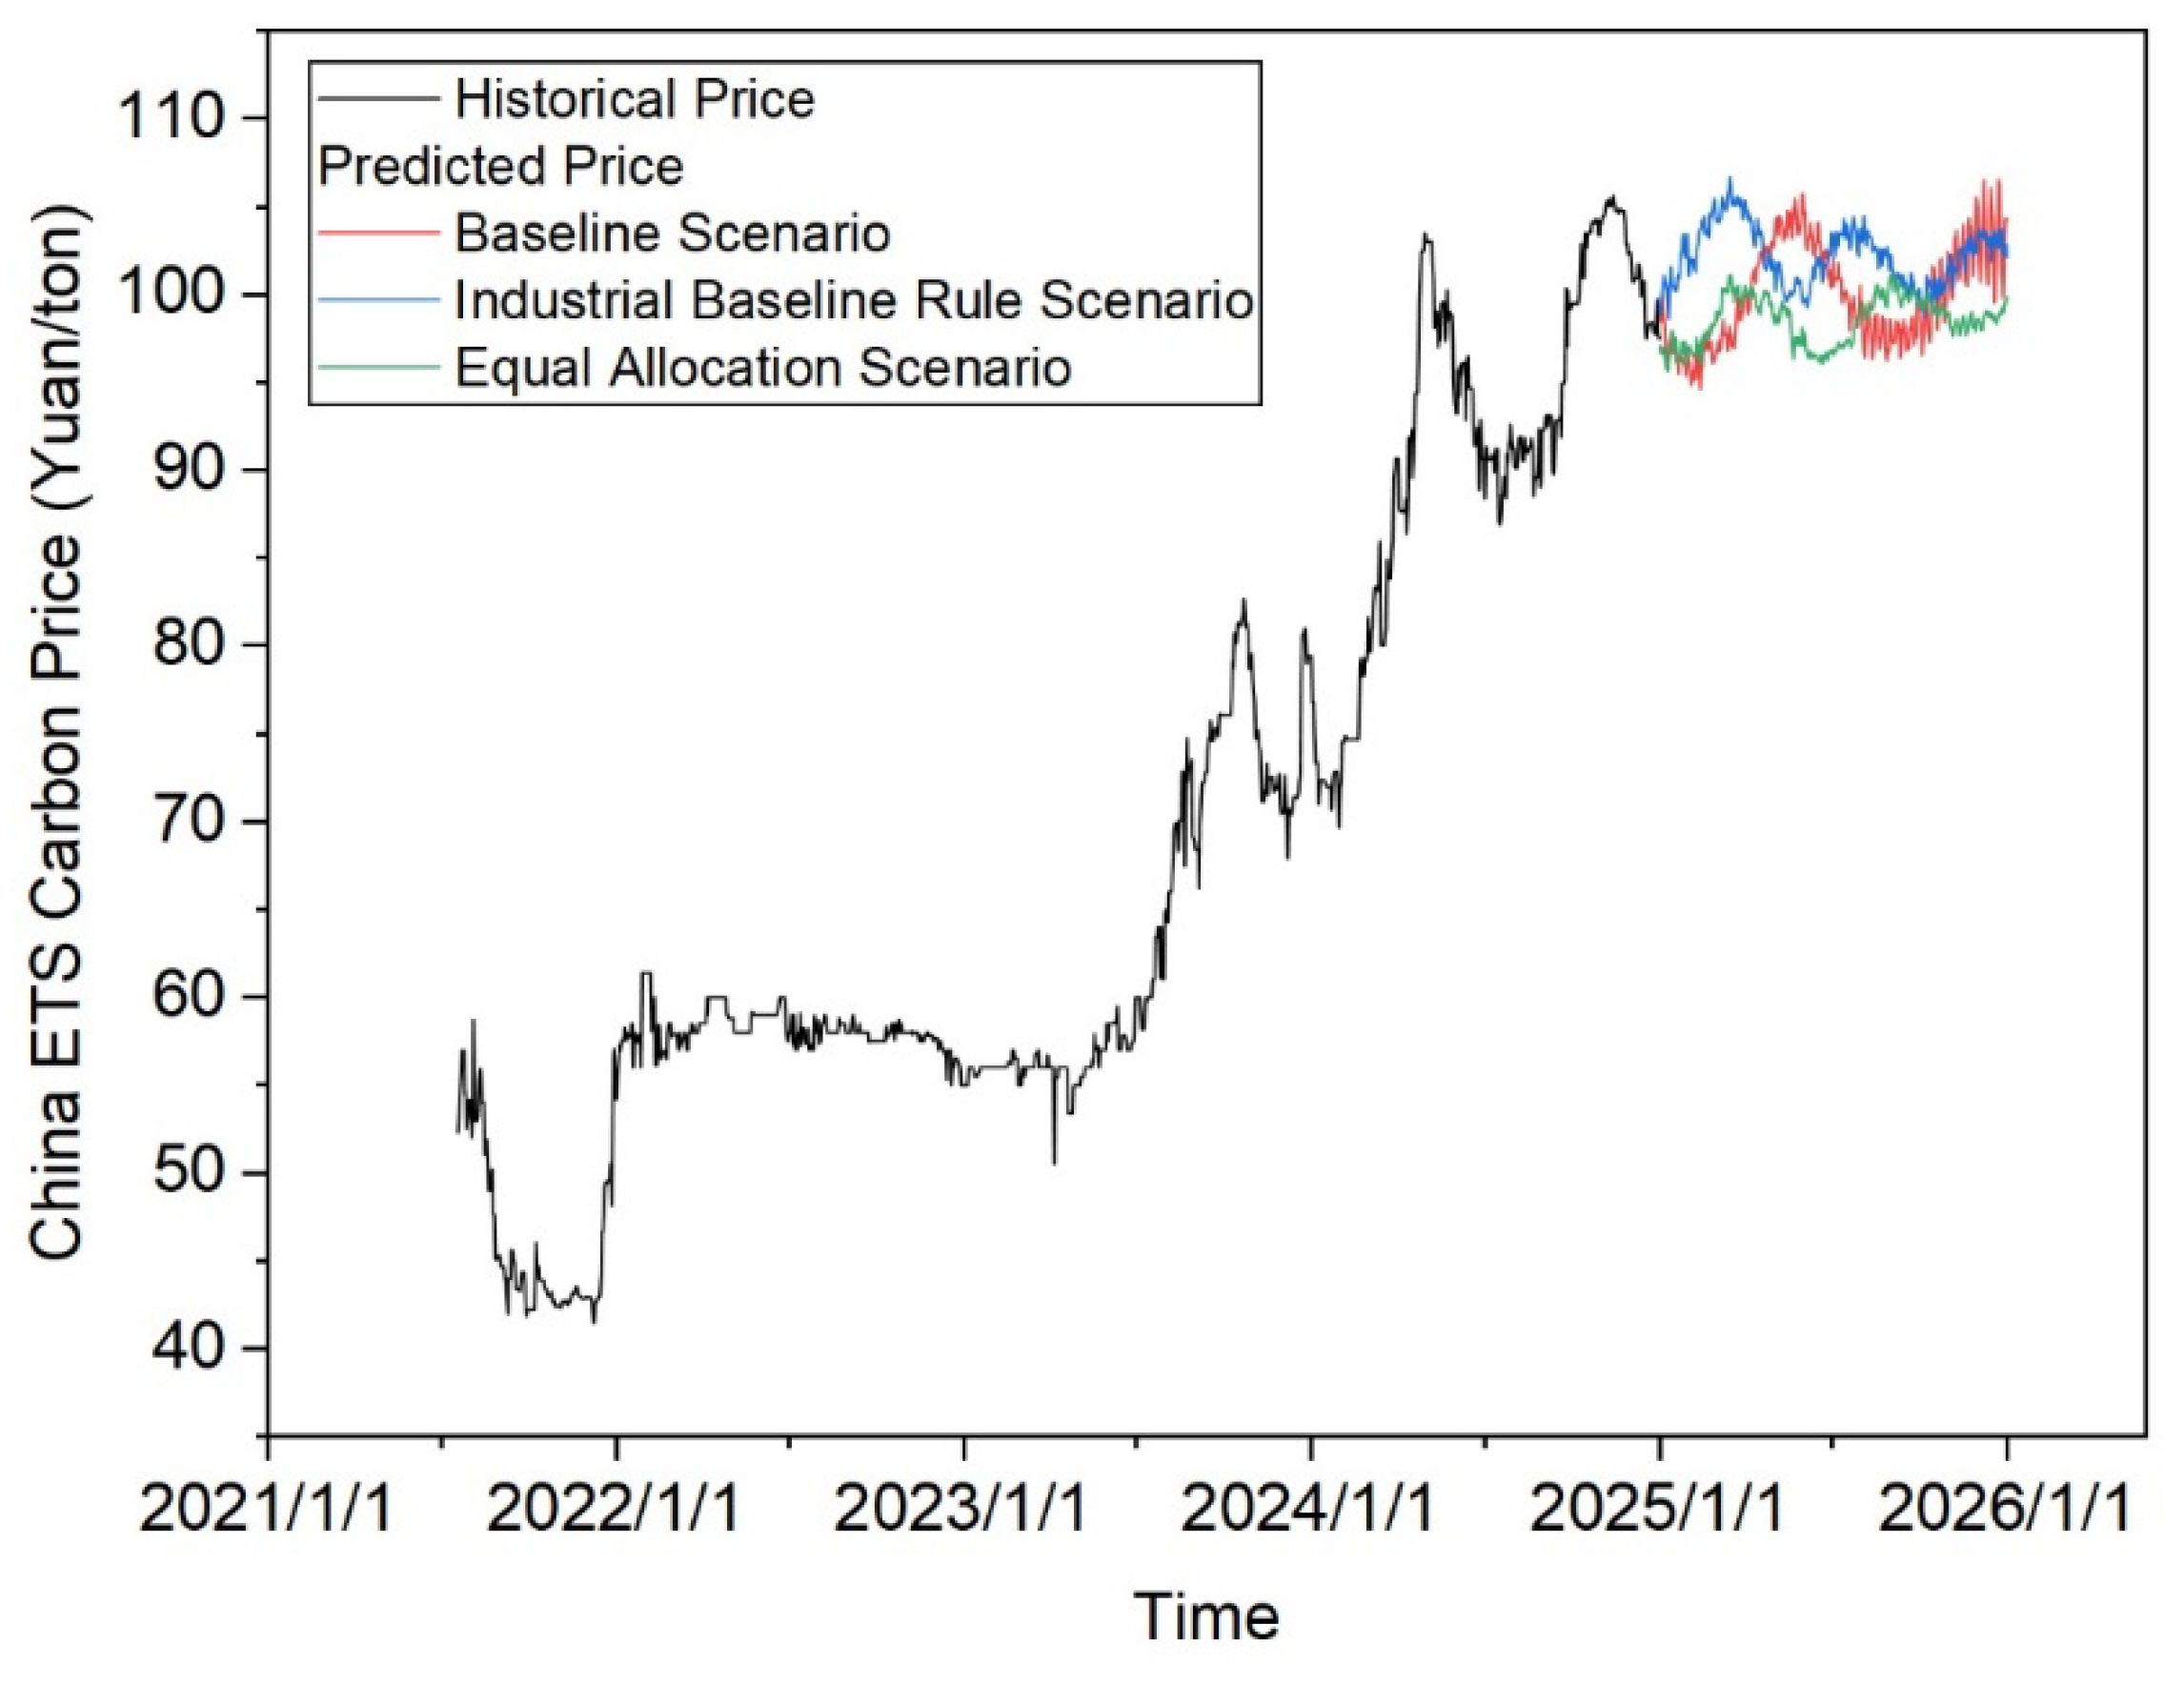
- Strategic Carbon Asset Management: Enterprises must recognize that market expansion, particularly under the benchmark allocation method, will lead to a long-term, moderate increase in carbon costs. High-emission industries like steel and aluminum should integrate carbon costs into their core strategic planning. Increased investment in energy-saving, emission-reduction technologies, and clean energy transition is imperative. Proactive carbon asset management and market participation are essential to hedge against compliance risks. The findings (as illustrated in Figure 6 and Figure 7) indicate that the benchmark method provides stronger abatement incentives; thus, companies should prepare for stricter quota allocation by optimizing production processes and enhancing carbon efficiency ahead of time.
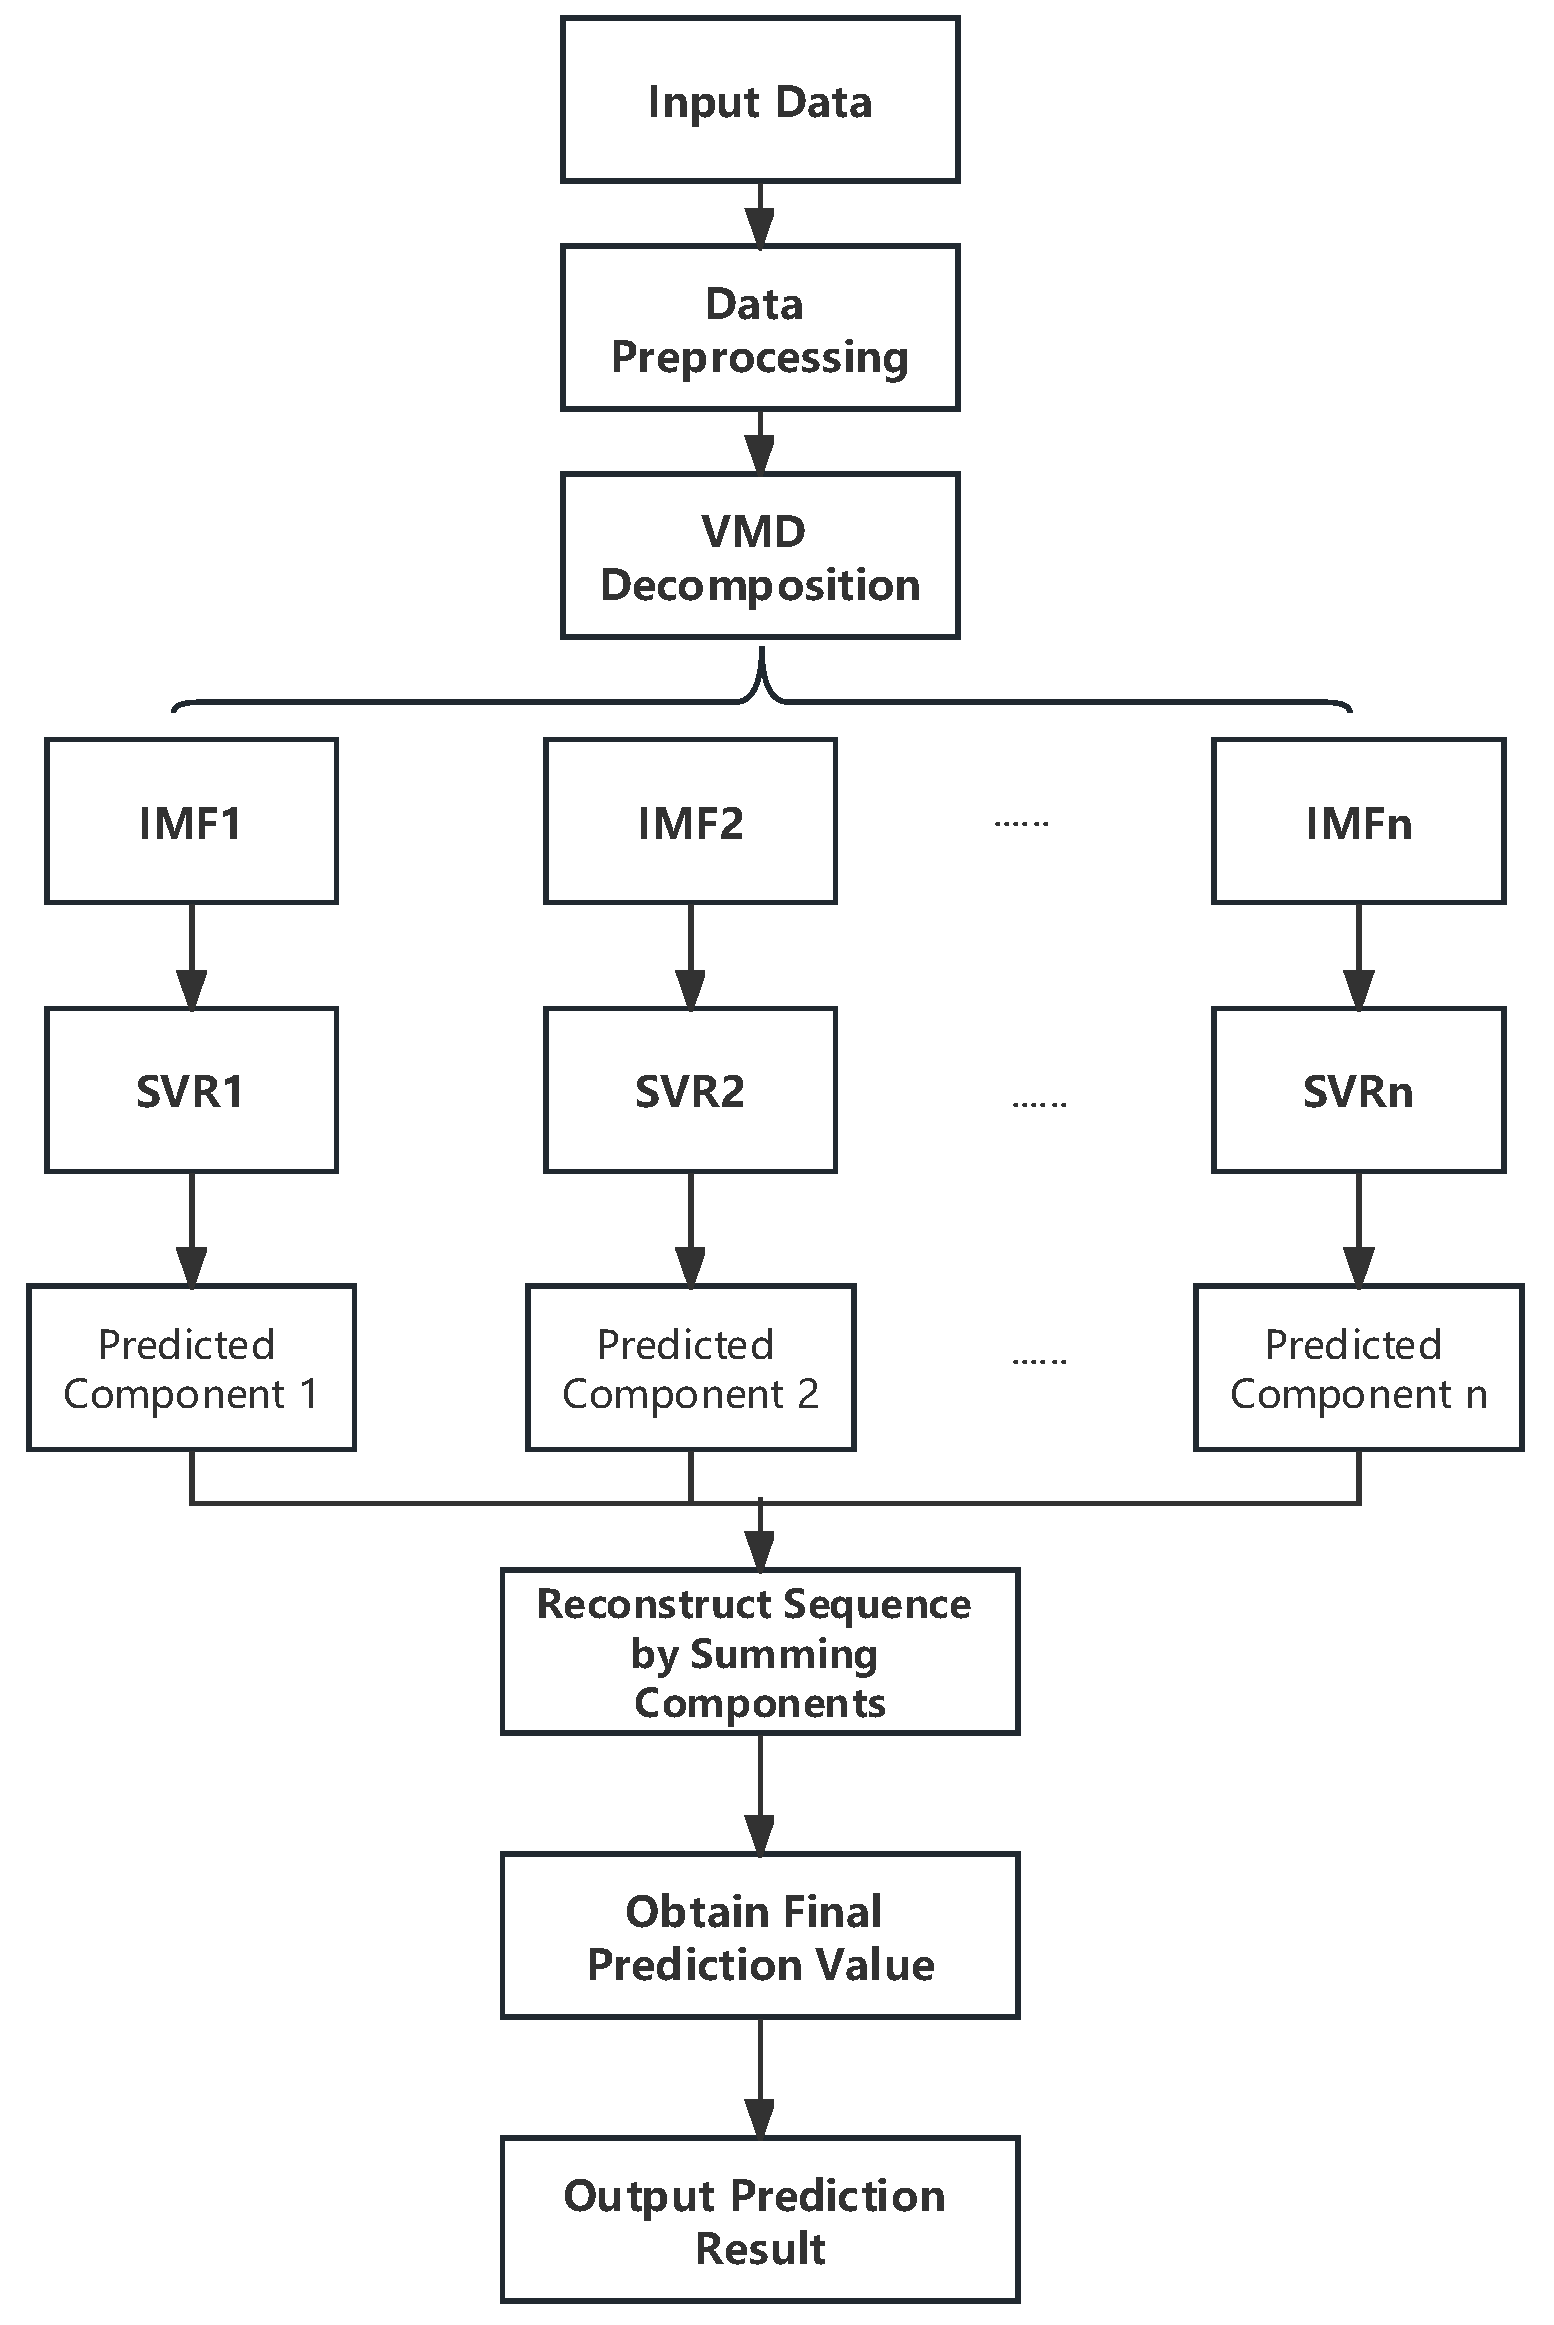
- Leveraging Predictive Tools: Firms can adopt forecasting methodologies similar to the VMD-SVR model employed in this study (whose workflow is depicted in Figure 4) to develop internal carbon price prediction mechanisms. This would enable more precise anticipation of market trends and optimize decisions regarding the buying and selling of allowances.
- 2.
- Enhanced Risk Management and Product Innovation: Market expansion is projected to improve liquidity and dampen price volatility (e.g., the absence of a sharp year-end price spike after the steel industry’s inclusion in Figure 6), which reduces market speculation risks. Trading institutions should focus on new opportunities arising from cross-sectoral trading. The stabilized price signals can support the design of a richer set of financial derivatives, such as carbon futures and options, to provide risk management tools for compliance entities [56].
- 3.
- For Policymakers:
- Optimizing Allowance Allocation: To balance market stability with emission reduction incentives, policymakers should prioritize the benchmark allocation method. The research demonstrates that, compared to equal allocation, the benchmark method leads to a short-term price increase followed by faster convergence to long-term stability (Figure 6), while more effectively incentivizing corporate emissions reduction.
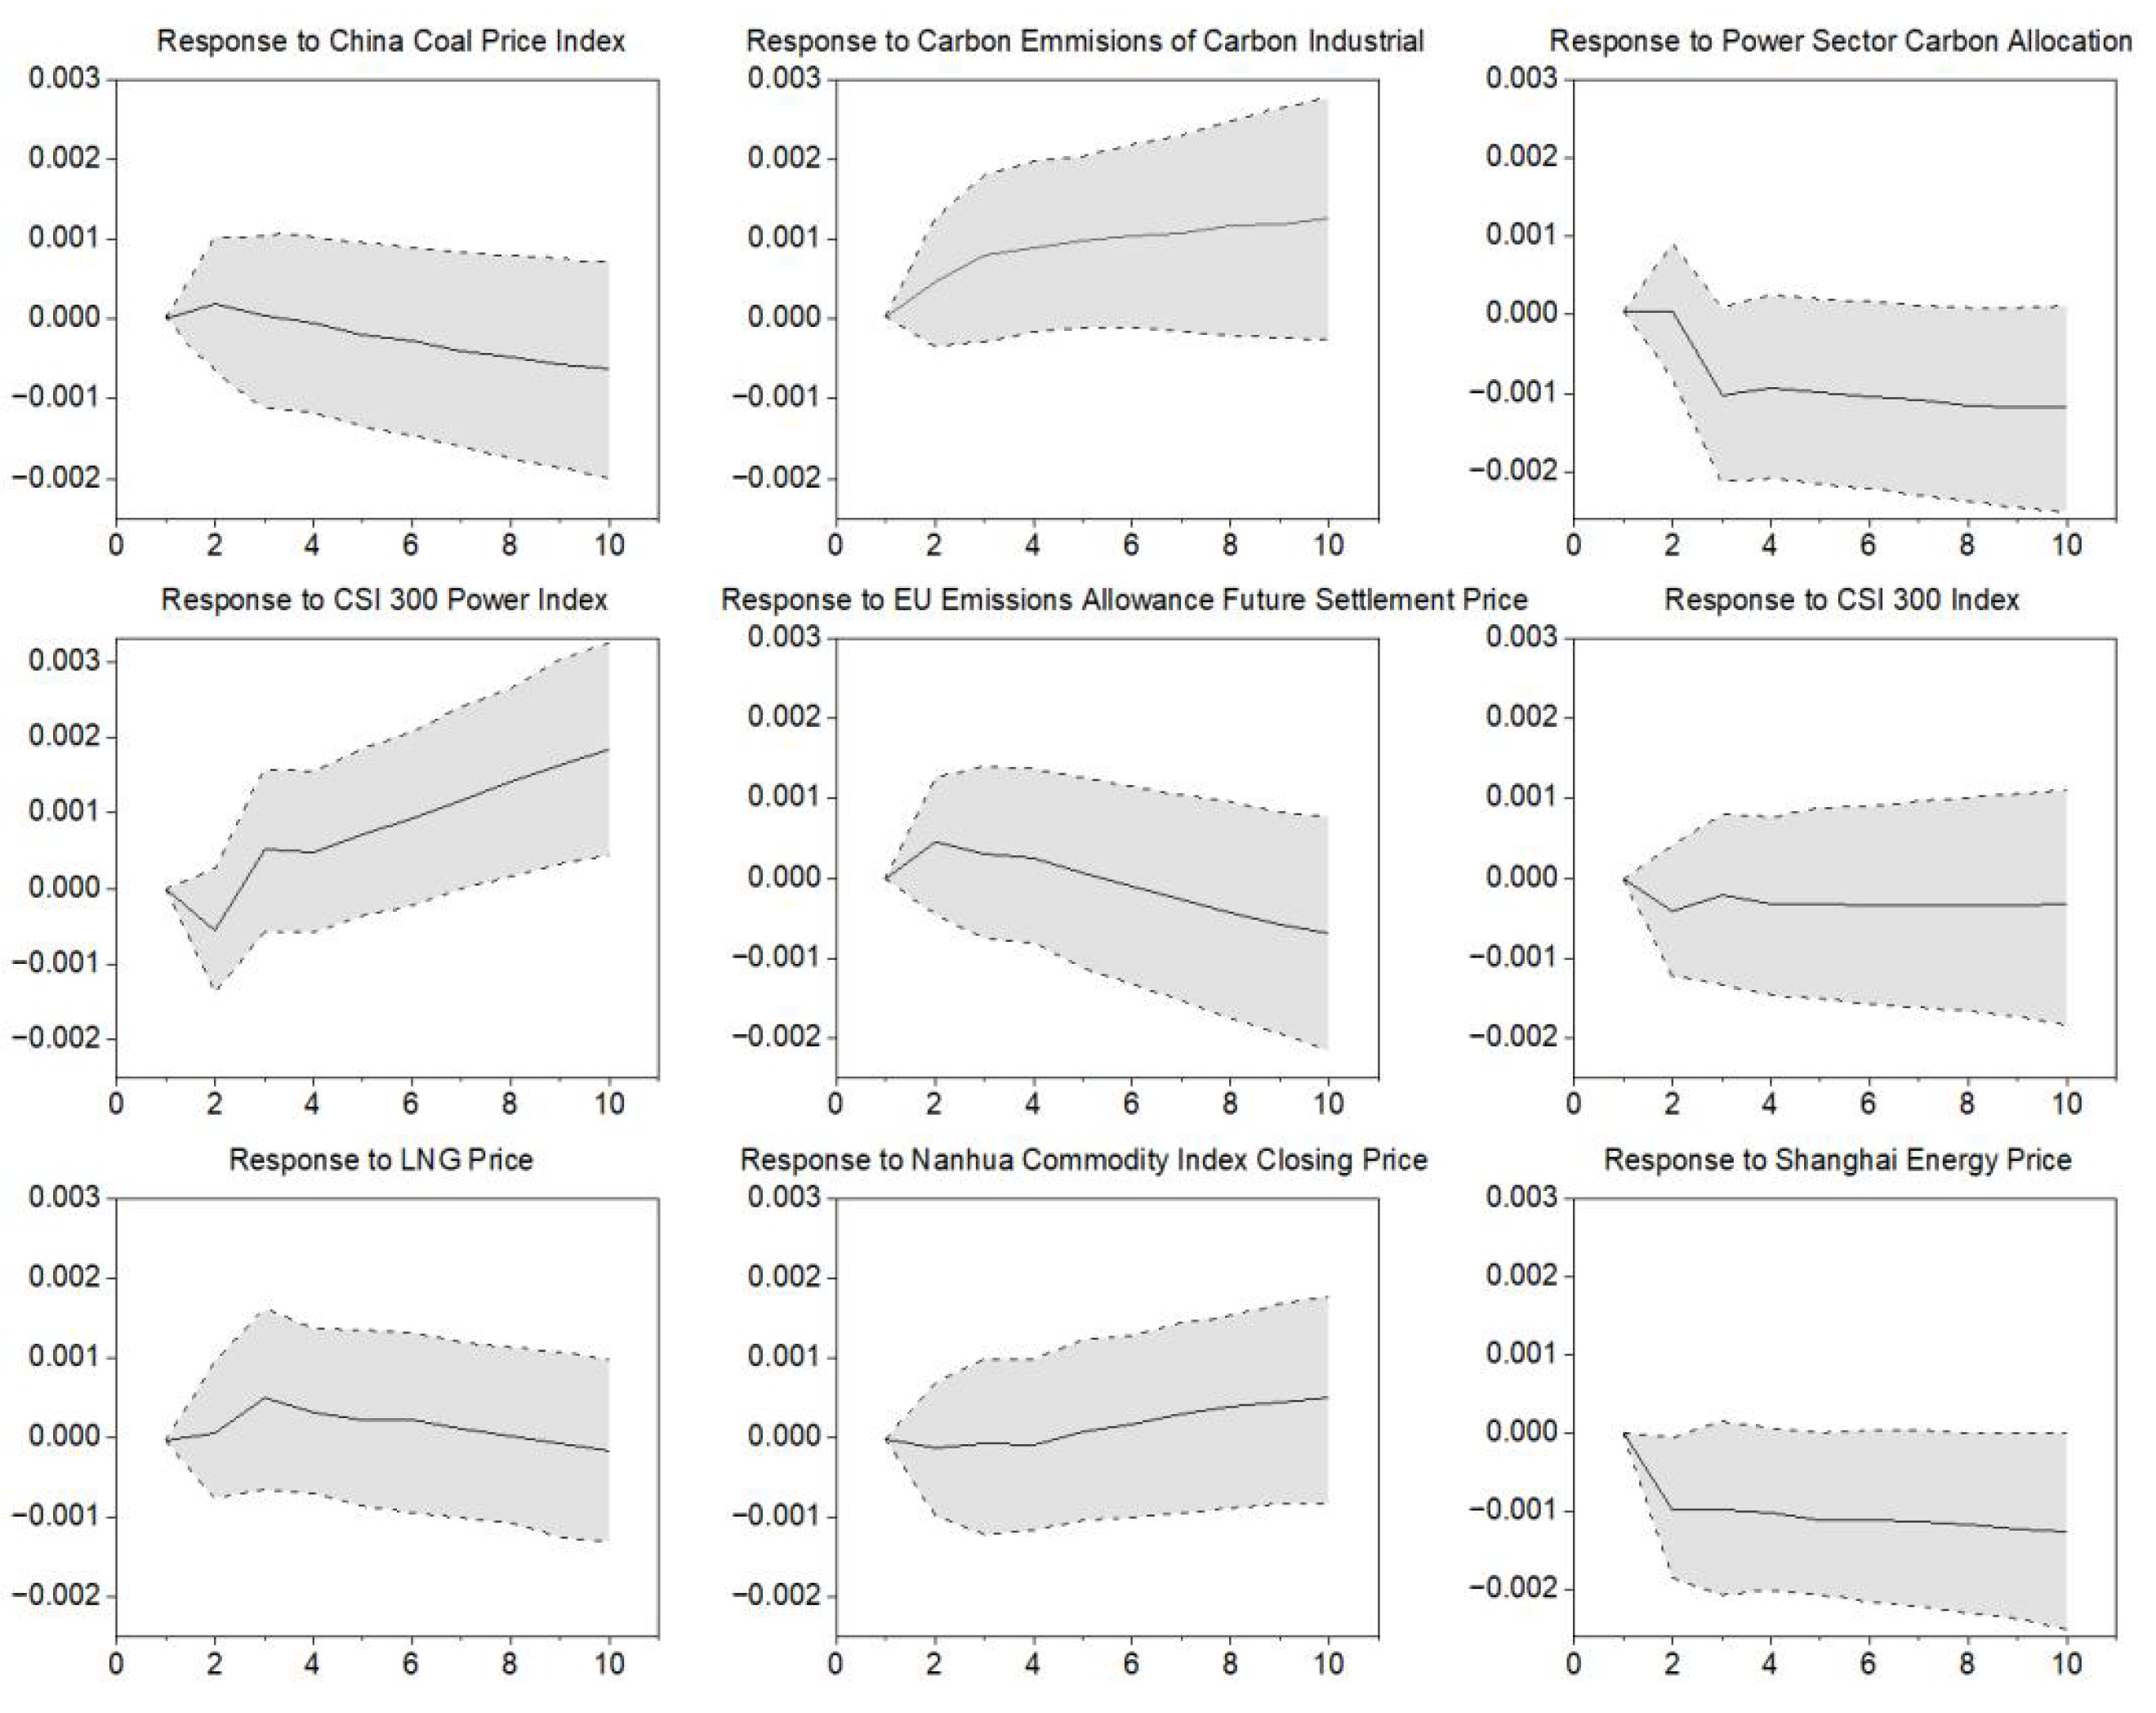
- Strengthening Market Monitoring and Stability Mechanisms: While advancing market expansion, policymakers should concurrently improve market stability reserves (MSR) or similar mechanisms to manage potential initial price fluctuations. Furthermore, enhanced monitoring of key influencing factors identified in this study—such as power sector carbon emissions (EC) and the CSI 300 Power Index (ELEC), which show significant and persistent impacts in the impulse response analysis (Figure 3) and variance decomposition (Table 5 and Table 6)—is crucial for evidence-based market regulation and precise policy adjustment.
6.2. Findings and Conclusions
- High volatility in a power-sector-only market: If the national carbon market remains limited to the power sector, carbon prices are projected to exhibit significant volatility with an overall upward trend, peaking at 106.53 yuan/ton in December 2025. This aligns with Tang et al. (2020) [24], who noted that a single-sector market amplifies price fluctuations due to limited participation. However, whereas Tang et al. focused on cost-effectiveness, this study emphasizes the risk of non-compliant behaviors like allowance hoarding, highlighting a micro-institutional gap in existing research.
- Stabilization effect of steel industry inclusion: Under the equal allocation scenario, carbon prices remain stable near end-2024 levels, with a brief January 2025 peak (105.77 yuan/ton). Benchmark allocation induces a short-term increase (March 2025 peak) followed by stabilization. This echoes Wei (2024) [25], who found that market expansion enhances “volume–price synergy.” However, Wei emphasized government–market coordination, while this study reveals that benchmark allocation’s stronger abatement incentives—akin to Lin and Huang (2022) [27]’s critique of administrative intervention—drive more sustainable stability.
- Similar dynamics for aluminum smelting industry: The aluminum smelting industry’s entry mirrors the steel sector’s price trends, with benchmark allocation yielding better outcomes. This consistency with steel contrasts with Wang and Lin (2012) [7], who highlighted industry-specific marginal abatement costs. Our results suggest that allocation methods outweigh sectoral differences in driving short-term price convergence, a nuance less explored in prior work.
- Cross-sector trading enhances liquidity: Both industries facilitate cross-sectoral carbon trading, improving market liquidity and price convergence. This supports Yu et al. (2024) [28]’s advocacy for market stability mechanisms but goes further by quantifying how equal allocation eases transition whereas benchmarking strengthens abatement incentives—a trade-off underexplored in liquidity studies.
- Superior forecasting via VMD-SVR: The VMD-SVR model accurately predicts that expansion mitigates volatility, with steel’s larger emission scale having greater impact. While machine learning models like SVR and LSTM are known for superior accuracy [48,49], this study innovates by applying VMD-SVR to post-expansion scenarios, demonstrating its utility in policy simulation beyond traditional time series forecasting.
Author Contributions
Funding
Institutional Review Board Statement
Informed Consent Statement
Data Availability Statement
Conflicts of Interest
References
- Bai, Q.; Dong, J.; Tian, Y.C. Research on Volatility Characteristics and Influencing Factors of China’s Carbon Emission Trading Prices. Stat. Decis. 2022, 38, 161–165. (In Chinese) [Google Scholar]
- Ji, C.J.; Li, X.Y.; Hu, Y.J.; Wang, X.Y.; Tang, B.J. Research on carbon price in emissions trading scheme: A bibliometric analysis. Nat. Hazards J. Int. Soc. Prev. Mitig. Nat. Hazards 2019, 99, 1381–1396. [Google Scholar] [CrossRef] [Scilit]
- Shi, C.; Zeng, Q.; Zhi, J.; Na, X.; Cheng, S. A study on the response of carbon emission rights price to energy price macro economy and weather conditions. Environ. Sci. Pollut. Res. 2023, 30, 33833–33848. [Google Scholar] [CrossRef] [Scilit] [PubMed]
- Wang, Z.H.; Hu, G. An Empirical Analysis of the Factors Affecting the Carbon Price in China. J. Ind. Technol. Econ. 2018, 37, 128–136. (In Chinese) [Google Scholar]
- Xie, S. Research on the influencing factors of CEA prices in the national carbon market. Mark. Wkly. 2025, 38, 6–9. (In Chinese) [Google Scholar]
- Brink, C.; Vollebergh, H.R.J.; Werf, E.V.D. Carbon pricing in the EU: Evaluation of different EU ETS reform options. Energy Policy 2016, 97, 603–617. [Google Scholar] [CrossRef] [Scilit]
- Wang, Y.L.; Lin, J. A Study on the Pricing Mechanism of China’s Carbon Emissions Trading System. Price Theory Pract. 2012, 332, 87–88. (In Chinese) [Google Scholar]
- Hintermann, B. Allowance price drivers in the first phase of the EU ETS. J. Environ. Econ. Manag. 2010, 59, 43–56. [Google Scholar] [CrossRef] [Scilit]
- Wang, W.X.; Bo, L. A study of the Impacting Factors Related to EUCA Price. J. Yunnan Norm. Univ. Humanit. Soc. Sci. Ed. 2013, 45, 135–143. (In Chinese) [Google Scholar]
- Yan, Z.; Yu, Z.; Gu, X. Research on Conduction Mechanism between Carbon Price and Coal Future Price in China. Econ. Probl. 2022, 6, 67–74. (In Chinese) [Google Scholar]
- Zhang, F.; Xia, Y. Carbon price prediction models based on online news information analytics. Financ. Res. Lett. 2022, 46, 102809. [Google Scholar] [CrossRef] [Scilit]
- Chevallier, J. A model of carbon price interactions with macroeconomic and energy dynamics. Energy Econ. 2011, 33, 1295–1312. [Google Scholar] [CrossRef] [Scilit]
- She, S.; Xie, B. Green technology innovation, economic growth, and carbon emission intensity: An empirical analysis based on panel vector autoregressive model. Coal Econ. Res. 2025, 45, 134–141. (In Chinese) [Google Scholar]
- Wen, F.; Zhao, H.; Zhao, L.; Yin, H. What drives carbon price dynamics in China? Int. Rev. Financ. Anal. 2022, 79, 101999. [Google Scholar] [CrossRef] [Scilit]
- Guo, D. Turning Carbon into Gold: The Energy Decentralization Characteristics of Carbon Finance and the Spillover Effect of Monetary Policy. Rev. Econ. Res. 2022, 3001, 82–102. (In Chinese) [Google Scholar]
- Wang, X.P.; Wang, X.P. Research on the Dependence Structure and Risk Spillover Effect Between EU and Domestic Carbon Trading Market. J. Ind. Technol. Econ. 2021, 40, 72–81. (In Chinese) [Google Scholar]
- Wang, Y.P.; Qiang, F.; Chang, C.P. The integration of carbon price between European and Chinese markets: What are the implications? Int. J. Environ. Res. 2021, 15, 667–680. [Google Scholar] [CrossRef] [Scilit]
- Xu, C.; Chen, Z.; Zhu, W.; Zhi, J.; Yu, Y.; Shi, C. Time-frequency spillover and early warning of climate risk in international energy markets and carbon markets: From the perspective of complex network and Machine Learning. Energy 2025, 318, 134857. [Google Scholar] [CrossRef] [Scilit]
- Yue, Z.; Ruonan, Z.; Xiaona, C. Empirical Analysis of Influencing Factors of Carbon Emission Trading Prices Under the Low-Carbon Context. J. Green. Sci. Technol. 2025, 27, 268–273+280. (In Chinese) [Google Scholar]
- Gao, C.; Li, D.; Wang, X.; Guo, S. Research on regional carbon emission trading price prediction using intelligent machine learning method—Based on the analysis of Hubei province carbon market. Price Theory Pract. 2022, 454, 89–93. (In Chinese) [Google Scholar]
- Peng, W.; Chen, S. Analysis and Forecast of Carbon Trading Price in China’s Carbon Emission Pilots Market. J. Technol. Econ. 2020, 39, 102–110. [Google Scholar]
- Qu, G.; Guo, C.; Cui, J. Influencing factors and formation mechanism of carbon emission rights prices in Shanghai, China. Sustainability 2024, 16, 9081. [Google Scholar] [CrossRef] [Scilit]
- Xia, R. Research on the Fluctuation of Carbon Emission Trading Price and Its Influencing Factors in China—Also Analyzes the Law of Sudden Price Change and Daily Price Fluctuation Near the Performance Date. Price Theory Pract. 2022, 11, 129–132+210. [Google Scholar]
- Tang, B.-J.; Ji, C.-J.; Hu, Y.-J.; Tan, J.-X.; Wang, X.-Y. Optimal carbon allowance price in China’s carbon emission trading system: Perspective from the multi-sectoral marginal abatement cost. J. Clean. Prod. 2020, 253, 119945. [Google Scholar] [CrossRef] [Scilit]
- Wei, Y.; Wang, X.; Chen, W.; Tang, B. The Carbon Mitigation “Time-Space-Efficiency-Benefit” (TSEB) Coordination Theory: III. Effic. Coord. J. Beijing Inst. Technol. Soc. Sci. Ed. 2024, 26, 30–38. (In Chinese) [Google Scholar]
- Zhu, R.; Long, L.; Gong, Y. Emission Trading System, Carbon Market Efficiency, and Corporate Innovations. Int. J. Environ. Res. Public Health 2022, 19, 9683. [Google Scholar] [CrossRef] [Scilit]
- Lin, B.; Huang, C. Analysis of emission reduction effects of carbon trading: Market mechanism or government intervention? Sustain. Prod. Consum. 2022, 33, 28–37. [Google Scholar] [CrossRef] [Scilit]
- Yu, R.; Weng, Y.; Zhang, X. Market Stability Mechanisms in China’s National Carbon Market: Lessons from International Practices. Environ. Prot. 2024, 52, 68–73. (In Chinese) [Google Scholar]
- Dragomiretskiy, K.; Zosso, D. Variational mode decomposition. IEEE Trans. Signal Process 2014, 62, 531–544. [Google Scholar] [CrossRef] [Scilit]
- Lin, P.; Zhao, J.; Peng, S.; Cui, X. Diffraction separation by variational mode decomposition. Geophys. Prospect. 2021, 69, 1070–1085. [Google Scholar] [CrossRef] [Scilit]
- Yu, S.; Ma, J. Complex variational mode decomposition for slop–preserving denoising. IEEE Trans. Geosci. Remote Sens. 2018, 56, 586–597. [Google Scholar] [CrossRef] [Scilit]
- Xu, Y.; Lin, T.; Du, P. A hybrid coal prediction model based on grey Markov optimised by GWO—A case study of Hebei province in China. Expert Syst. Appl. 2023, 235, 121194. [Google Scholar] [CrossRef] [Scilit]
- Huang, H.; Wang, X.; Liu, L. A review on urban pluvial floods: Characteristics, mechanisms, data, and research methods. Prog. Geogr. 2021, 40, 1048–1059. (In Chinese) [Google Scholar] [CrossRef] [Scilit]
- Huang, Y.; Dai, X.; Wang, Q.; Zhou, D. A hybrid model for carbon price forecasting using GARCH and long short-term memory network. Appl. Energy 2021, 285, 116485. [Google Scholar] [CrossRef] [Scilit]
- Tong, M.; Qin, F.; Duan, H. A novel optimised grey model and its application in forecasting CO2 emissions. Energy Rep. 2022, 8, 14643–14657. [Google Scholar] [CrossRef] [Scilit]
- Hu, Z.; Chang, W.; Jang, Y.; Jo, Y.; Jung, J. Dynamic interactions of COVID-19 incidences, mobility, and social distancing policies in seoul: A VAR model approach. Sci. Rep. 2025, 15, 24288. [Google Scholar] [CrossRef] [Scilit]
- Schultheiss, C.; Ulmer, M.; Bühlmann, P. Ancestor regression in structural vector autoregressive models. J. Causal Inference 2025, 13, 20240011. [Google Scholar] [CrossRef] [Scilit]
- Yang, J. Coordinated Development of New Urbanization with Agricultural Scaling and Specialization: A Discussion Based on the PVAR Method. J. Financ. Econ. 2017, 4, 65–76. [Google Scholar]
- Chen, X.; Xiao, C.; Liu, Y. Research on Carbon Trading Price Drivers Based on Explainable Deep Learning. Syst. Eng. Theory Pract. 2025. ahead of print (In Chinese) [Google Scholar] [CrossRef]
- Du, Z.; Liu, F. Impacts on the Price of Regional Carbon Emissions Based on GA-BP-MIV Model. Price Theory Pract. 2018, 408, 42–45. (In Chinese) [Google Scholar]
- Han, M.; Ding, L.; Zhao, X.; Kang, W.L. Forecasting carbon prices in the Shenzhen market, China: The role of mixed-frequency factors. Energy 2019, 171, 69–76. [Google Scholar] [CrossRef] [Scilit]
- Pang, T.; Tan, K.; Fan, C. Carbon price forecasting with quantile regression and feature selection. In Proceedings of the 2023 7th International Symposium on Computer Science and Intelligent Control (ISCSIC), Nanjing, China, 27–29 October 2023; pp. 362–367. [Google Scholar]
- Qin, C.; Ding, S.; Zhang, H. Regional Carbon Market Trading Price Prediction by Using ARIMA-LSTM. China For. Econ. 2025, 192, 37–48. [Google Scholar]
- Fan, L.; Dong, H.; Duan, H. A Decomposition Ensemble Model with Sliding Time Window for Forecasting Carbon Market Prices. China J. Manag. Sci. 2023, 31, 277–286. (In Chinese) [Google Scholar]
- Yan, J.; Jin, J.; Chen, F.; Yu, G.; Yin, H.; Wang, W. Urban flash flood forecast using support vector machine and numerical simulation. J. Hydroinform. 2018, 20, 221–231. [Google Scholar] [CrossRef] [Scilit]
- Hao, J.; Feng, Q.; Lu, J.; Sun, X. A bi-level ensemble learning approach to complex time series forecasting: Taking exchange rates as an example. J. Forecast. 2023, 42, 1385–1406. [Google Scholar] [CrossRef] [Scilit]
- Chen, Y.; Zhu, Y.; Wang, J.; Li, M. A Hybrid Model for Carbon Price Forecasting Based on Secondary Decomposition and Weight Optimization. Mathematics 2025, 13, 2323. [Google Scholar] [CrossRef] [Scilit]
- Wei, Y.; Zhang, J.; Chen, X. Forecasting China’s Carbon Trading Price in a DMS and DMA Framework—Evidence from the Hubei Carbon Market. Syst. Eng. 2022, 40, 1–16. (In Chinese) [Google Scholar]
- Li, H. Statistical Learning Methods; Tsinghua University Press: Beijing, China, 2012; pp. 95–134, (In Chinese with English Abstract). [Google Scholar]
- Li, M.F.; Hu, H.; Zhao, L.T. Key factors affecting carbon prices from a time-varying perspective. Environ. Sci. Pollut. Res. 2022, 29, 65144–65160. [Google Scholar] [CrossRef] [Scilit]
- Li, Y.; Yang, R.; Wang, X.; Zhu, J.; Song, N. Carbon Price Combination Forecasting Model Based on Lasso Regression and Optimal Integration. Sustainability 2023, 15, 9354. [Google Scholar] [CrossRef] [Scilit]
- Wang, B.; Wang, Z.; Yao, Z. Enhancing carbon price point-interval multi-step-ahead prediction using a hybrid framework of autoformer and extreme learning machine with multi-factors. Expert Syst. Appl. 2025, 270, 126467. [Google Scholar] [CrossRef] [Scilit]
- Yang, Y.; Li, S.; Liu, H.; Guo, J. Carbon Dioxide Emission Forecasting Using BiLSTM Network Based on Variational Mode Decomposition and Improved Black-Winged Kite Algorithm. Mathematics 2025, 13, 1895. [Google Scholar] [CrossRef] [Scilit]
- Zeng, L.; Hu, H.; Tang, H.; Zhang, X.; Zhang, D. Carbon emission price point-interval forecasting based on multivariate variational mode decomposition and attention-LSTM model. Appl. Soft Comput. 2024, 157, 111543. [Google Scholar] [CrossRef] [Scilit]
- Guo, W. Factors Impacting on the Price of China’s Regional Carbon Emissions Based on Adaptive Lasso Method. China Popul. Resour. Environ. 2015, 25, 305–310. (In Chinese) [Google Scholar]
- Wei, P.; Zhou, J.; Ren, X.; Huynh, L.D.T. Financialisation of the European Union Emissions Trading System and its influencing factors inquantiles. Int. J. Financ. Econ. 2025, 30, 925–940. [Google Scholar] [CrossRef] [Scilit]



| Category | Variable Name | Indicator Selection | Identification Symbol | Source |
|---|---|---|---|---|
| Target Variable | National Carbon Market Price | National Carbon Market Daily Closing Price | CEA | National Carbon Market Information Network |
| Feature variables | Industry Production Factors | Carbon emissions of the power industry | EC | Global Carbon Database CEIC Database Wind Database |
| Carbon Allowances in the Power Sector | ECQ | |||
| Shanghai–Shenzhen 300 Power Index | ELEC | |||
| Energy Price Factors | INE Crude Oil Price | INE | Wind Database | |
| China Coal Price Index | CCPI | Wind Database | ||
| LNG Natural Gas Price | LNG | Wind Database | ||
| China Securities New Energy Index | NE | Wind Database | ||
| Shanghai Energy Index | SZNY | Wind Database | ||
| Domestic economic factors | Shanghai–Shenzhen 300 Index | HS300 | Wind Database | |
| China Securities Industry Index | ZD | Wind Database | ||
| International Carbon Price | EU Carbon Emission Allowance Futures Settlement Price | EUA | Wind Database | |
| Commodity Market | Nanhua Commodity Index Closing Price | NHCI | Wind Database | |
| S&P GSCI Commodity Total Return Index closing price | GSCI | Wind Database |
| No. | Variable | Indicator Selection | Pearson Correlation Coefficient | Lasso Regression Coefficient | Conclusion |
|---|---|---|---|---|---|
| 1 | EC | Carbon emissions in the power industry | 0.804 | 0.14 | Retained |
| 2 | ECQ | Electricity Industry Carbon Allowance | 0.838 | 0.132 | Reserved |
| 3 | ELEC | Shanghai–Shenzhen 300 Power Index | 0.861 | 0.502 | Hold |
| 4 | CCPI | China Coal Price Index | −0.499 | −0.431 | Retained |
| 5 | INE | INE Crude Oil Price | 0.133 | 0.000 | Excluded |
| 6 | LNG | LNG natural gas price | −0.492 | −0.027 | Hold |
| 7 | NE | China Securities New Energy Index | 0.854 | 0.000 | Excluded |
| 8 | SZNY | Shanghai Energy Price | 0.748 | −0.246 | Hold |
| 9 | HS300 | Shanghai–Shenzhen 300 Index | 0.508 | 0.199 | Hold |
| 10 | ZD | China Securities Industry Index | −0.684 | 0.000 | Excluded |
| 11 | EUA | EU carbon emission allowance futures settlement price | −0.329 | −0.190 | Hold |
| 12 | NHCI | Nanhua Commodity Index closing price | 0.771 | 0.571 | Hold |
| 13 | GSCI | S&P GSCI All-Country World Index closing price | 0.489 | 0.000 | Excluded |
| ADF Statistic | 1% Critical Value | 5% Critical Value | 10% Critical Value | p-Value | Test Results | |
|---|---|---|---|---|---|---|
| CEA | −0.0452 | −3.4355 | −2.8638 | −2.5679 | 0.9546 | Unstable |
| EC | −0.4936 | −3.4356 | −2.8638 | −2.5680 | 0.8932 | Unstable |
| ECQ | −1.0349 | −3.4355 | −2.8638 | −2.5679 | 0.7403 | Unstable |
| ELEC | −1.7824 | −3.4355 | −2.8638 | −2.5679 | 0.3892 | Unstable |
| CCPI | −2.2365 | −3.4356 | −2.8639 | −2.5680 | 0.1932 | Unstable |
| LNG | −1.7269 | −3.4356 | −2.8639 | −2.5680 | 0.4173 | Unstable |
| SZNY | −2.6444 | −3.4355 | −2.8638 | −2.5679 | 0.0841 | Unstable |
| HS300 | −2.0905 | −3.4355 | −2.86389 | −2.5680 | 0.2483 | Unstable |
| NHCI | −2.2861 | −3.4355 | −2.8638 | −2.5679 | 0.1764 | Unstable |
| EUA | −3.0544 | −3.4355 | −2.8638 | −2.5680 | 0.0301 | Stationary |
| Lag | LogL | LR | FPE | AIC | SC | HQ |
|---|---|---|---|---|---|---|
| 0 | 7029.915 | NA | 6.38 × 10⁻¹⁸ | −11.21392 | −11.17293 | −11.19851 |
| 1 | 32,257.88 | 50,012.63 | 2.36 × 10⁻³⁵ | −51.35445 | −50.90351 * | −51.18494 |
| 2 | 32,567.19 | 608.2327 | 1.69 × 10⁻³⁵ | −51.6888 | −50.82792 | −51.36519 * |
| 3 | 32,691.6 | 242.6634 | 1.62 × 10⁻³⁵ * | −51.72780 * | −50.45697 | −51.25009 |
| 4 | 32,740.74 | 95.06184 | 1.76 × 10⁻³⁵ | −51.64655 | −49.96578 | −51.01474 |
| 5 | 32,792.34 | 98.99724 | 1.90 × 10⁻³⁵ | −51.56923 | −49.47852 | −50.78333 |
| 6 | 32,839.69 | 90.07688 | 2.07 × 10⁻³⁵ | −51.48512 | −48.98446 | −50.54512 |
| 7 | 32,901.7 | 116.9961 | 2.20 × 10⁻³⁵ | −51.42444 | −48.51384 | −50.33034 |
| 8 | 32,996.33 | 177.0202 | 2.22 × 10⁻³⁵ | −51.41587 | −48.09532 | −50.16766 |
| 9 | 33,061.88 | 121.5662 | 2.35 × 10⁻³⁵ | −51.36083 | −47.63034 | −49.95853 |
| 10 | 33,141.62 | 146.6167 * | 2.43 × 10⁻³⁵ | −51.32847 | −47.18804 | −49.77207 |
| Period | S.E. | CEA | D.CCPI | D.EC | D.ECQ | D.ELEC |
|---|---|---|---|---|---|---|
| 1 | 0.015 | 1 | 0 | 0 | 0 | 0 |
| 2 | 0.0201 | 99.5220 | 0.0058 | 0.0523 | 0.0004 | 0.0826 |
| 3 | 0.0235 | 99.0340 | 0.0043 | 0.1499 | 0.1967 | 0.1040 |
| 4 | 0.0265 | 98.7649 | 0.0037 | 0.2336 | 0.2811 | 0.1147 |
| 5 | 0.0292 | 98.5267 | 0.0077 | 0.2999 | 0.3522 | 0.1559 |
| 6 | 0.0315 | 98.2730 | 0.0152 | 0.3619 | 0.4183 | 0.2224 |
| 7 | 0.0337 | 97.9899 | 0.0274 | 0.4187 | 0.4798 | 0.3201 |
| 8 | 0.0358 | 97.6767 | 0.0435 | 0.4731 | 0.5377 | 0.4417 |
| 9 | 0.0376 | 97.3309 | 0.0634 | 0.5253 | 0.5921 | 0.5873 |
| 10 | 0.0394 | 96.9563 | 0.0863 | 0.5759 | 0.6435 | 0.7533 |
| Period | D.EUA | D.HS300 | D.LNG | D.NHCI | D.SZNY |
|---|---|---|---|---|---|
| 1 | 0 | 0 | 0 | 0 | 0 |
| 2 | 0.0417 | 0.0403 | 0.0028 | 0.0043 | 0.2480 |
| 3 | 0.0482 | 0.0414 | 0.0506 | 0.0053 | 0.3657 |
| 4 | 0.0490 | 0.0525 | 0.0603 | 0.0051 | 0.4350 |
| 5 | 0.0409 | 0.0576 | 0.0588 | 0.0049 | 0.4955 |
| 6 | 0.0356 | 0.0627 | 0.0546 | 0.0064 | 0.5499 |
| 7 | 0.0371 | 0.0661 | 0.0491 | 0.0111 | 0.6008 |
| 8 | 0.0464 | 0.0693 | 0.0438 | 0.0188 | 0.6492 |
| 9 | 0.0644 | 0.0721 | 0.0396 | 0.0295 | 0.6954 |
| 10 | 0.0903 | 0.0749 | 0.0372 | 0.0430 | 0.7393 |
| Error Metrics | MSE | RMSE | MAE | MAPE | R2 |
|---|---|---|---|---|---|
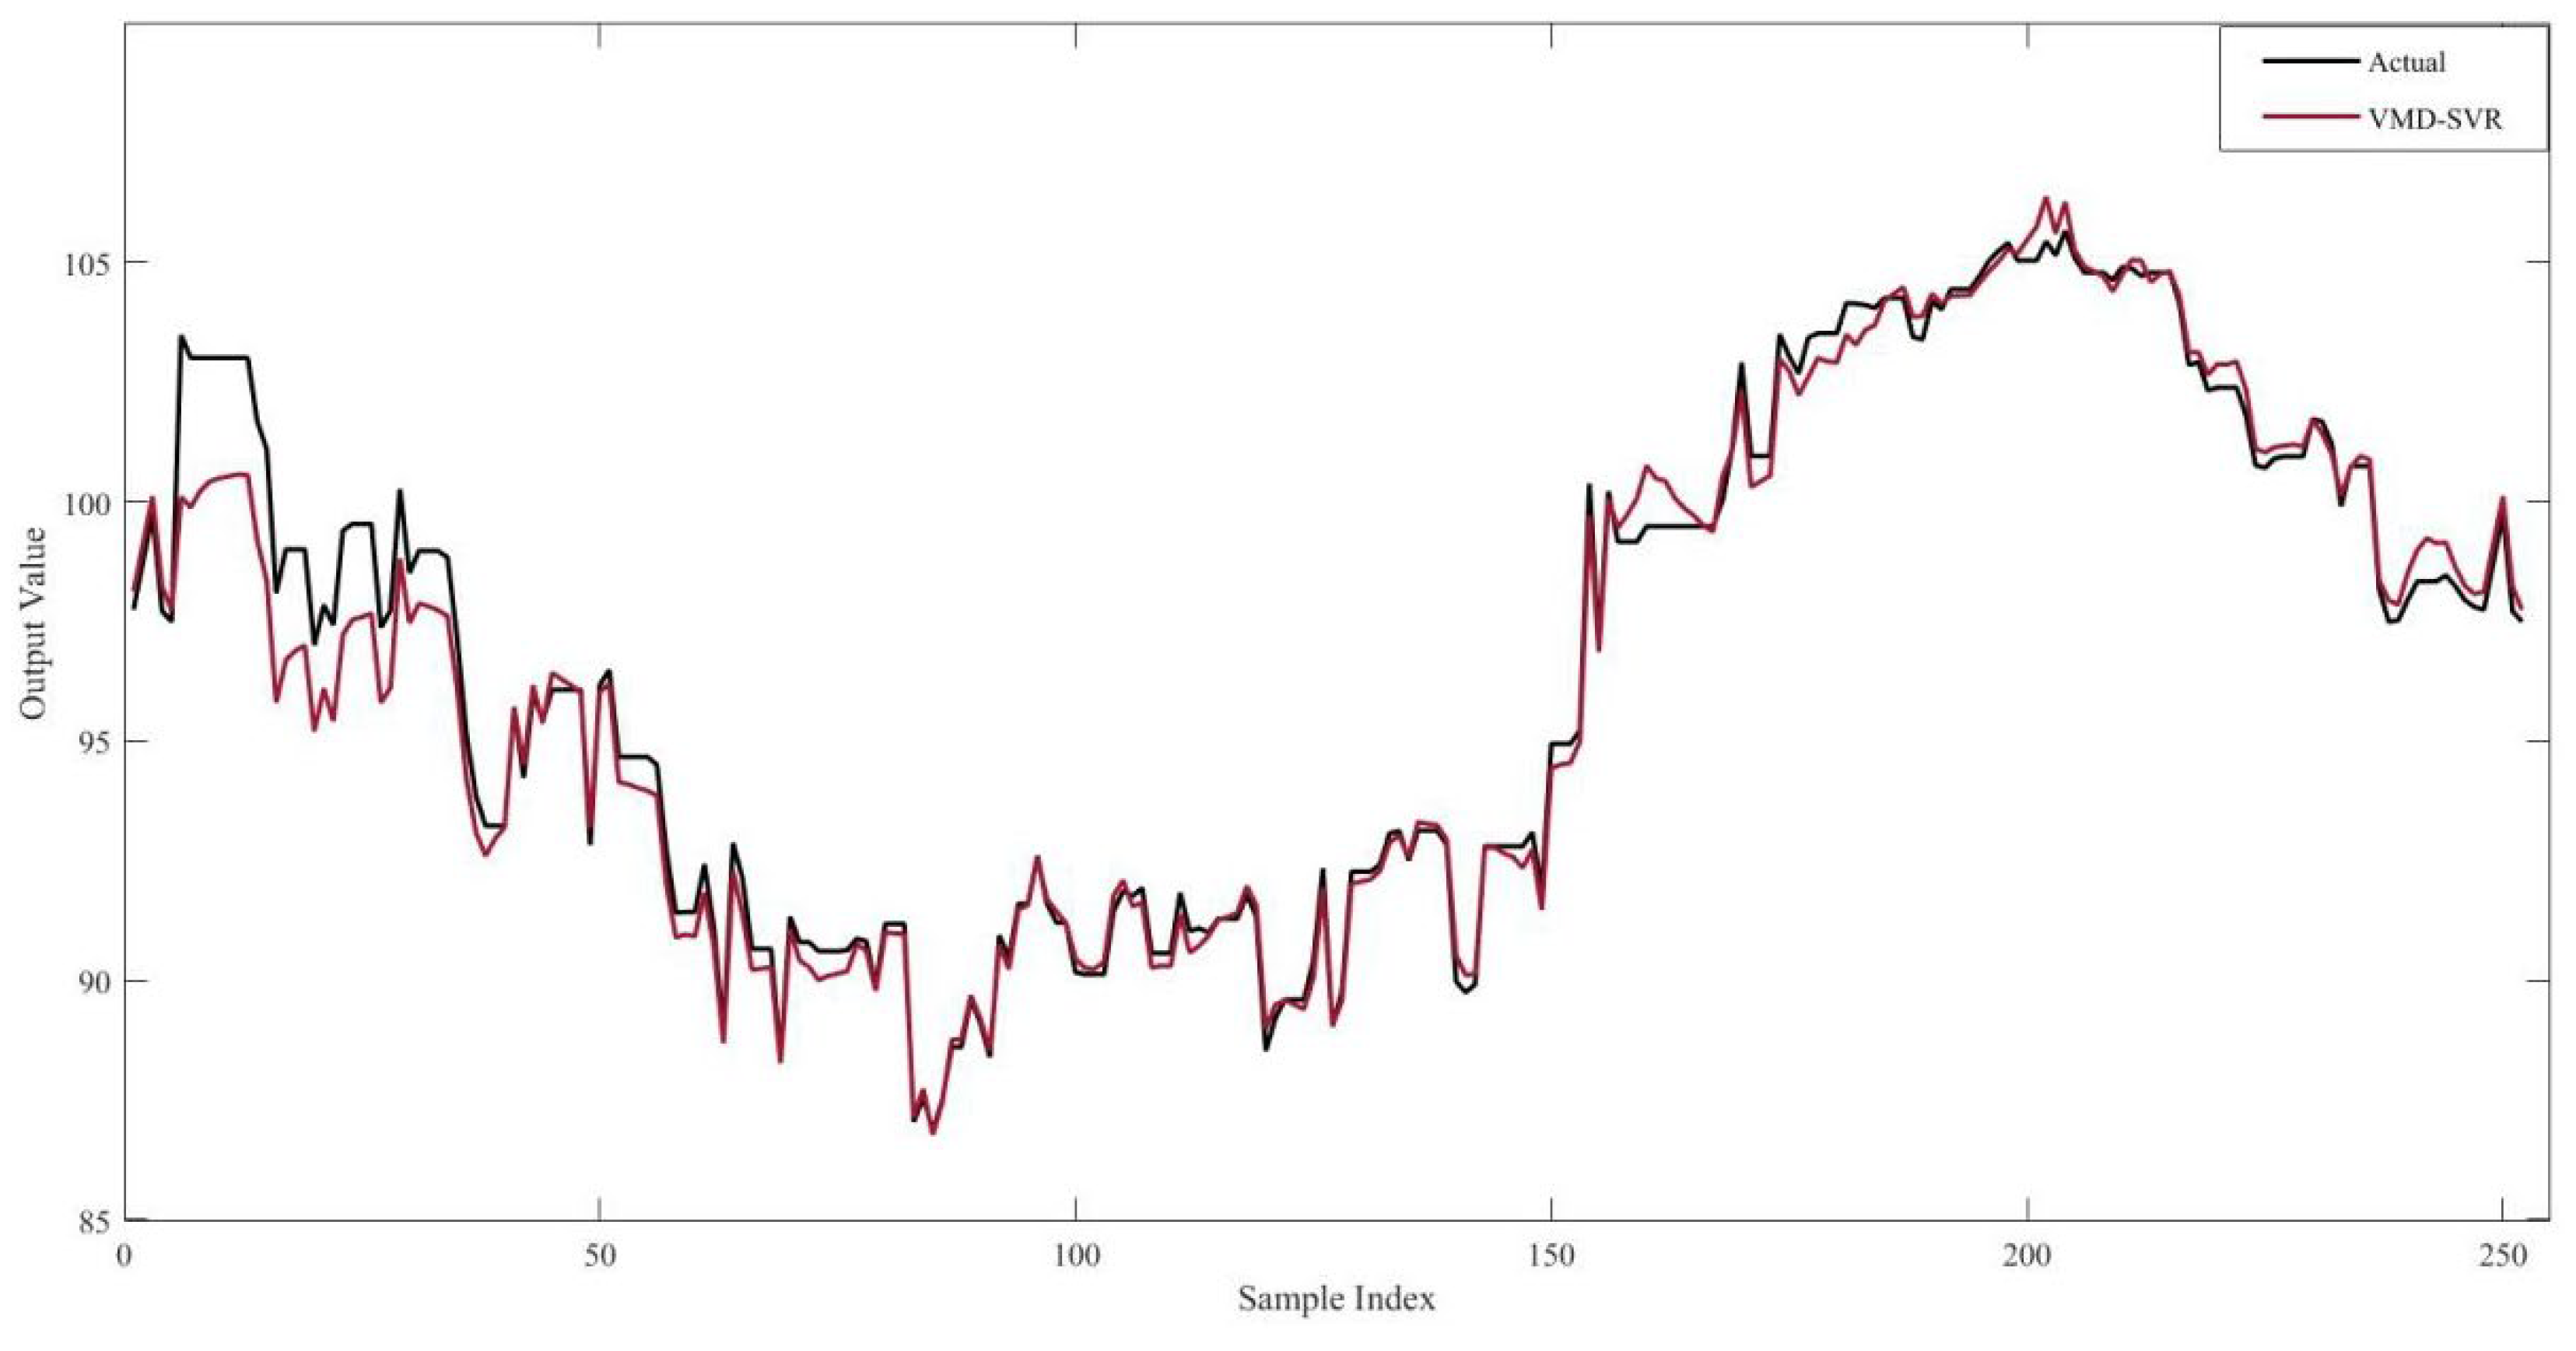
| VMD-SVR | 0.431 | 0.6566 | 0.4587 | 0.47 | 0.9848 |
| Category | Variable Name | Indicator Selection | Identification Symbol | Source |
|---|---|---|---|---|
| Target Variable | National Carbon Market Price | National Carbon Market Daily Closing Price | CEA | National Carbon Market Information Network |
| Feature variables | Industry Production Factors | Carbon emissions of the power industry | EC | Global Carbon Database |
| Electricity industry carbon allowances | ECQ | Global Carbon Database CEIC Database | ||
| Shanghai–Shenzhen 300 Power Index | ELEC | Wind Database | ||
| Energy Price Factors | Steel Industry Carbon Emissions | SC | CEIC Database | |
| Steel industry carbon quotas | SCQ | CEIC Database | ||
| China Coal Price Index | CCPI | Wind Database | ||
| LNG Natural Gas Price | LNG | Wind Database |
| Category | Variable Name | Indicator Selection | Identification Symbol | Source |
|---|---|---|---|---|
| Target Variable | National Carbon Market Price | National Carbon Market Daily Closing Price | CEA | National Carbon Market Information Network |
| Feature variables | Industry Production Factors | Carbon emissions of the power industry | EC | Global Carbon Database |
| Electricity industry carbon allowances | ECQ | Global Carbon Database CEIC Database | ||
| Shanghai–Shenzhen 300 Power Index | ELEC | Wind Database | ||
| Energy Price Factors | Aluminum Smelting Industry Carbon Emissions | ALC | CEIC Database | |
| Carbon emissions in the aluminum smelting industry | ALCQ | CEIC Database | ||
| China Coal Price Index | CCPI | Wind Database | ||
| LNG Natural Gas Price | LNG | Wind Database | ||
| Shanghai Energy Index | SZNY | Wind Database | ||
| Domestic economic factors | Shanghai–Shenzhen 300 Index | HS300 | Wind Database | |
| International carbon prices | EU Carbon Emission Allowance Futures Settlement Price | EUA | Wind Database | |
| Commodity Market | Nanhua Commodity Index Closing Price | NHCI | Wind Database |
Disclaimer/Publisher’s Note: The statements, opinions and data contained in all publications are solely those of the individual author(s) and contributor(s) and not of MDPI and/or the editor(s). MDPI and/or the editor(s) disclaim responsibility for any injury to people or property resulting from any ideas, methods, instructions or products referred to in the content. |
© 2026 by the authors. Licensee MDPI, Basel, Switzerland. This article is an open access article distributed under the terms and conditions of the Creative Commons Attribution (CC BY) license.
Share and Cite
Fang, Y.; Li, Y.; Chang, L.; Wang, J.; Zhou, C. Post-Expansion Carbon Price Forecasting in China’s Emissions Trading Scheme Based on VMD–SVR Model. Sustainability 2026, 18, 2028. https://doi.org/10.3390/su18042028
Fang Y, Li Y, Chang L, Wang J, Zhou C. Post-Expansion Carbon Price Forecasting in China’s Emissions Trading Scheme Based on VMD–SVR Model. Sustainability. 2026; 18(4):2028. https://doi.org/10.3390/su18042028
Chicago/Turabian StyleFang, Yuehan, Yan Li, Lei Chang, Jianhe Wang, and Chuanyu Zhou. 2026. "Post-Expansion Carbon Price Forecasting in China’s Emissions Trading Scheme Based on VMD–SVR Model" Sustainability 18, no. 4: 2028. https://doi.org/10.3390/su18042028
APA StyleFang, Y., Li, Y., Chang, L., Wang, J., & Zhou, C. (2026). Post-Expansion Carbon Price Forecasting in China’s Emissions Trading Scheme Based on VMD–SVR Model. Sustainability, 18(4), 2028. https://doi.org/10.3390/su18042028