1. Introduction
The global economy faces the dual challenge of maintaining trade competitiveness while addressing environmental degradation. Since the 2016 Paris Agreement, over 130 countries have committed to carbon neutrality targets, fundamentally reshaping international trade patterns. The European Union’s Carbon Border Adjustment Mechanism (CBAM) and escalating green trade barriers have created unprecedented pressure on exporters in developing economies. These developments highlight a critical question: how can emerging economies upgrade their export technological complexity while pursuing environmental sustainability?
China’s experience offers valuable insights into this dilemma. As the world’s largest goods trading nation, China has witnessed remarkable export growth accompanied by serious environmental costs. Carbon emissions increased over 16-fold between 1970 and 2023 (Global Carbon Project, 2023), and exports remain concentrated in labor-intensive and resource-intensive products, occupying lower positions in global value chains [
1]. Developed nations achieved export sophistication before facing stringent environmental constraints. In contrast, developing economies must pursue both objectives simultaneously under compressed timeframes, rendering traditional pollution-intensive pathways untenable.
Financial systems play a crucial role in shaping both environmental outcomes and trade patterns through capital allocation mechanisms [
2]. Recognizing this, China established a systematic green finance framework in 2016, marking the world’s first government-led comprehensive green finance system. By 2023, China’s green credit balance reached
$4.24 trillion, making it the world’s largest green credit market. In 2017, five provincial-level green finance reform and innovation pilot zones were established to explore effective pathways for supporting regional economic transformation.
Despite this rapid institutional development, the relationship between green finance and export technological upgrading remains theoretically ambiguous and empirically unresolved. Green finance imposes financing constraints on polluting industries, potentially hindering traditional exporters [
3], while simultaneously supporting green technology innovation and industrial transformation that may facilitate export upgrading [
4]. The existing research has focused predominantly on national or provincial levels [
5,
6], overlooking city-level dynamics where both green finance policies and export activities are actually implemented. The mechanisms through which green finance influences export technological complexity require systematic investigation.
This study addresses these gaps by examining how green finance affects urban export technological complexity using comprehensive city-level panel data from 287 Chinese cities over 2011 to 2024. We focus on technological complexity rather than simple export volumes because complexity better captures the knowledge content and value creation embodied in exports [
7,
8]. The analysis makes several contributions to the literature. We construct a comprehensive green finance indicator system encompassing green credit, green bonds, green investment, and green insurance, providing a more complete assessment than prior studies focusing on single instruments [
9]. Employing multiple analytical approaches including difference-in-differences and system GMM, we establish robust causal evidence addressing endogeneity concerns. We further uncover and empirically validate two distinct transmission channels through which green finance operates: green innovation enhancement and industrial structure upgrading. Our heterogeneity analyses reveal that effects vary significantly across regions and city types, offering practical guidance for differentiated policy design.
The results demonstrate that green finance significantly enhances urban export technological complexity, with a one-standard-deviation increase associated with approximately 16% higher complexity. This effect operates through fostering green technological innovation and accelerating industrial structure upgrading toward knowledge-intensive sectors. Notably, western regions and lower-tier cities experience stronger effects, suggesting that green finance can serve as a convergence mechanism reducing regional disparities. These findings have important implications for developing countries seeking to reconcile environmental sustainability with trade competitiveness, demonstrating that well-designed green finance systems can simultaneously advance both goals.
The remainder of this paper proceeds as follows.
Section 2 reviews the relevant literature.
Section 3 develops theoretical hypotheses.
Section 4 presents research design including models and data.
Section 5 reports empirical results including robustness checks and heterogeneity analyses.
Section 6 discusses findings and theoretical contributions.
Section 7 concludes with policy recommendations.
3. Theoretical Hypotheses
To theoretically examine how green finance affects urban export technological complexity, we develop an analytical framework building on the Cobb–Douglas production function and endogenous growth theory. This framework explicitly incorporates green finance as a resource allocation mechanism that influences both innovation and industrial structure.
Consider a city’s export production function that depends on capital (K), labor (L), and export technological complexity (A), following the Cobb–Douglas form:
where Y represents total export output, and A captures export technological complexity reflecting the knowledge and technology embodied in export products, and α and β are output elasticities with respect to capital and labor.
The evolution of export technological complexity depends on green innovation investment (R) relative to capital stock:
where
is a monotonically increasing concave function, reflecting diminishing returns to innovation investment. This specification follows endogenous growth theory where technological progress stems from deliberate innovation activities.
Green finance operates as a capital allocation mechanism that channels resources toward environmentally sustainable and technologically advanced sectors. Let GF denote the level of green finance development. Green finance affects both the availability of innovation funding and the cost of capital for different types of enterprises.
For clean, technology-intensive firms, green finance reduces financing constraints through preferential credit terms and dedicated green bonds. The innovation investment can be expressed as:
where
represents baseline innovation investment, and
captures the efficiency with which green finance mobilizes additional innovation resources. Substituting Equation (3) into Equation (2):
Taking the derivative with respect to GF:
Since by the monotonically increasing property and , green finance positively affects export technological complexity growth. Moreover, as higher A enables production of more sophisticated exports, this establishes the direct positive relationship. Based on this analysis, we propose:
H1. Green finance development positively enhances urban export technological complexity.
Green finance influences export technological complexity through promoting green technological innovation [
3,
42]. Let GTI represent green technological innovation capacity. The relationship between green finance and green innovation can be modeled as:
where HC represents human capital,
reflects how green finance supports innovation through stable funding and risk-sharing, and
captures human capital’s contribution.
Green innovation affects export complexity through two pathways. It directly generates green patents and clean technologies that become embedded in export products, raising the technological content of the export basket. This relationship can be expressed as:
where
measures the efficiency of converting green innovation into export technological sophistication. A higher level of green innovation thus translates directly into a more technologically advanced composition of exports.
In addition, green innovation creates knowledge spillovers and attracts skilled talent, forming agglomeration effects. Let TA represent talent agglomeration as a function of green innovation:
where
, and
captures increasing returns from knowledge spillovers. Talent agglomeration further enhances innovation capacity through collaborative effects:
where
represents spillover intensity. Combining Equations (6), (7), and (9), the total effect of green finance on export complexity through the green innovation channel is:
This positive relationship confirms green innovation serves as a transmission mechanism. Based on this analysis, we propose:
H2. Green finance enhances urban export technological complexity by promoting green technological innovation.
Green finance also operates through industrial structure transformation [
9,
13]. Let IS represent the industrial structure sophistication, measured by the ratio of advanced industries to traditional industries. Green finance affects industrial structure through differential financing, channeling capital away from polluting sectors toward knowledge-intensive ones:
where
captures green finance’s push toward advanced industries through preferential financing, and
represents the natural resistance to structural change from legacy industries. This resistance encompasses sunk costs in existing production capacity and regulatory transition costs faced by incumbent firms.
As industrial structure gradually adjusts to the level of green finance support, the rate of change diminishes and the economy approaches a new equilibrium. At steady state (dIS/dt = 0):
This shows green finance positively determines equilibrium industrial structure sophistication. Industrial structure affects export complexity through a nonlinear relationship:
where
and
. The negative quadratic term captures the fact that once an economy has already shifted substantially toward knowledge-intensive sectors, further structural upgrading yields progressively smaller gains in export complexity. The most accessible upgrading opportunities have already been exploited, and remaining transitions require increasingly specialized capabilities.
Combining Equations (12) and (13), the effect of green finance on export complexity through industrial structure is:
For regions where IS is not too high (i.e., ), this derivative is positive, confirming industrial structure upgrading as a positive transmission channel. Notably, Equation (14) also implies that the effect of green finance through this channel may become negligible or even negative in regions where industrial structure has already reached high levels of sophistication. This prediction is consistent with the heterogeneity patterns we document empirically. Based on this analysis, we propose:
H3. Green finance enhances urban export technological complexity by promoting industrial structure upgrading.
Having developed these theoretical hypotheses, we now turn to empirical testing. The next section outlines the research design employed to validate these predictions using city-level panel data from China.
4. Research Design
4.1. Model Selection
To test hypothesis H1 regarding green finance’s impact on urban export technological complexity, we construct the following baseline regression model:
Here represents export technological complexity for city i in year t, denotes green finance development level, represents control variables, captures city fixed effects, captures year fixed effects, and is the error term. If is significantly positive, this indicates green finance significantly promotes export technological complexity enhancement.
Given that green finance reform and innovation pilot zones established in 2017 provide a quasi-natural experiment, we employ a multi-period difference-in-differences approach:
where
equals 1 for cities in pilot provinces and 0 otherwise,
equals 1 for years 2017 onwards and 0 before.
To examine mechanism channels, we construct mediation models:
where
represents mechanism variables including green technological innovation and industrial structure upgrading.
4.2. Variables and Data
4.2.1. Dependent Variable
Following Hausmann et al. [
7] and adapting to city-level analysis following Chao et al. [
43], we calculate export technological complexity (Expy_c) through the following steps:
First, calculate product-level export technological complexity (PRODY):
where
represents city c’s exports of product i in year t,
is total exports, and
is per capita GDP. Then aggregate to provincial level:
Finally, following [
43], interact provincial export complexity with city tertiary sector GDP share to obtain city-level complexity:
This interaction approach is adopted because detailed product-level export data are not consistently available at the city level across the full sample period. The tertiary sector share serves as a proxy for a city’s capacity to participate in technologically sophisticated production and trade activities. It reflects the degree to which local economic structure supports the generation of complex exports. This method has been validated in city-level studies of Chinese trade patterns [
43].
4.2.2. Independent Variable
Following [
9], we construct a comprehensive green finance index using entropy method incorporating four dimensions: green credit, green bonds, green investment, and green insurance. Green credit includes the proportion of interest expenses in six high-energy-consuming industries and green credit balance. Green securities measure the market value proportion of six high-energy-consuming industries. Green investment includes environmental protection expenditure and pollution control investment proportions. Green insurance comprises agricultural insurance premium income share and payout ratio.
4.2.3. Mechanism Variables
Green technological innovation (GTI) is measured by the logarithm of green patents granted. Industrial structure upgrading (ISU) is measured by the ratio of tertiary to secondary industry output. This variable operationalizes the theoretical construct IS introduced in
Section 3, with higher values of ISU corresponding to greater industrial structure sophistication.
4.2.4. Control Variables
We include foreign direct investment (lnFDI, measured as FDI to GDP ratio), human capital (HR, measured by enrolled university students), economic development level (lnGDP, regional GDP), trade openness (OPEN, import–export to GDP ratio), and environmental regulation (ER, SO2 emissions per capita GDP).
Our sample covers 287 prefecture-level cities from 2011 to 2024. Data sources include China City Statistical Yearbooks, local statistical yearbooks, CEIC database, and CSMAR database.
Table 1 presents descriptive statistics for the main variables.
4.3. Identification Strategy
Several potential threats to causal identification warrant discussion before presenting results. The most direct concern is reverse causality: cities with higher export complexity may attract greater green finance investment, as sophisticated export sectors generate stronger demand for environmental financing. Omitted variable bias presents a related challenge, as unobserved city characteristics such as institutional quality, entrepreneurial culture, or geography may simultaneously drive both green finance adoption and export upgrading. Simultaneity bias may also arise if green finance levels and export complexity adjust contemporaneously in response to common policy or macroeconomic shocks. We address these threats through three complementary identification strategies.
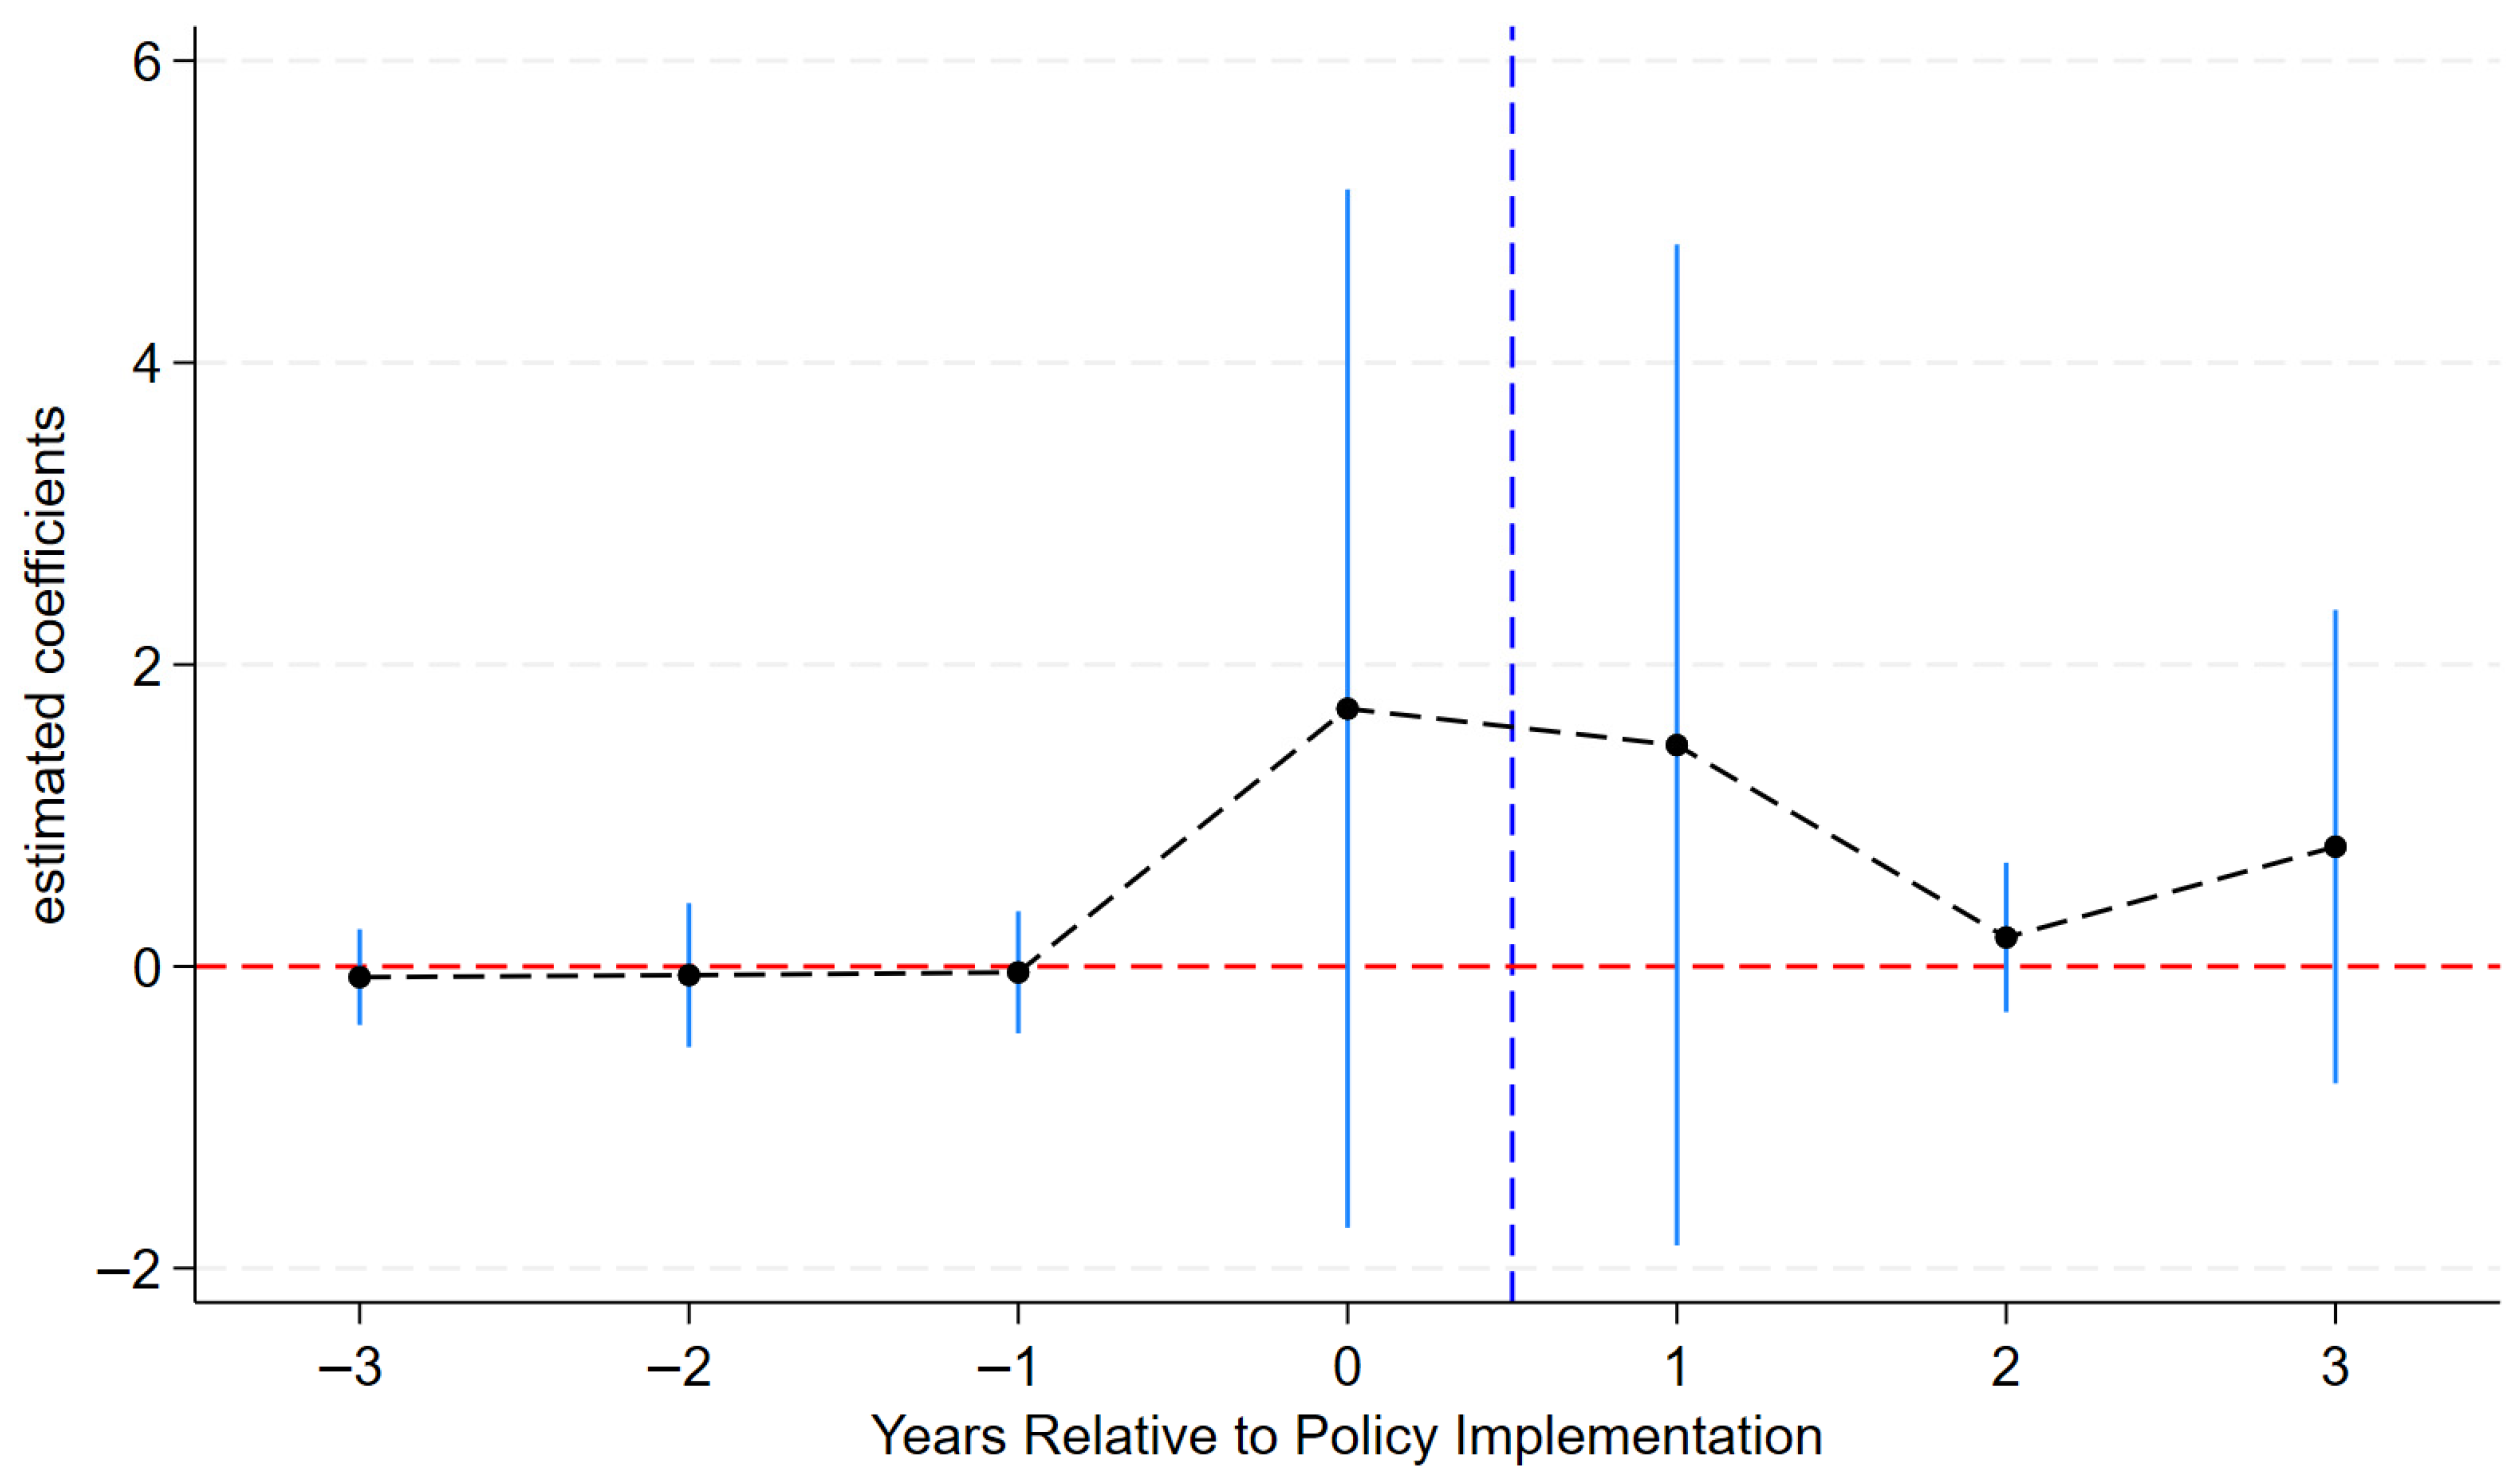
The establishment of green finance reform and innovation pilot zones in 2017 provides the foundation of our identification. These pilot zones were designated in five provinces: Zhejiang, Guangdong, Guizhou, Jiangxi, and Xinjiang. Selection criteria emphasized regional representation and existing financial infrastructure capacity rather than current export performance. This selection logic makes pilot status plausibly exogenous to pre-existing trends in export technological complexity. We exploit this policy variation through a difference-in-differences framework, comparing export complexity trajectories in pilot-province cities to those in non-pilot cities before and after 2017. Validation of the parallel trends assumption, which is required for the DID estimator to be consistent, is provided through event-study specifications.
Figure 1 presents the results of this event-study specification, plotting the estimated coefficients on leads and lags of the treatment indicator. The coefficients for the three years prior to policy implementation (t = −3, −2, −1) cluster tightly around zero and are statistically insignificant, confirming that treated and control cities exhibited parallel trends in export complexity before 2017. The vertical dashed line marks the policy implementation year. After treatment, the coefficients become positive and significant, rising to approximately 1.5 to 2.0 in the initial post-treatment years before tapering in later periods. This pattern is consistent with a causal effect of the green finance pilot policy on export complexity, with no evidence of pre-existing differential trends that would violate the parallel trends assumption.
Beyond the binary treatment variation, we also exploit the continuous variation in green finance intensity captured by our composite index. Even among pilot and non-pilot cities alike, green finance adoption intensity varies considerably across municipalities due to differences in local financial infrastructure, policy implementation capacity, and industrial composition. City and year fixed effects absorb time-invariant unobserved heterogeneity and common temporal shocks, respectively. Combined with this continuous variation, the specification enables estimation of dose–response relationships that complement the discrete DID design.
To address the dynamic nature of export complexity and potential simultaneity concerns, we further employ system GMM estimation. Export technological complexity exhibits substantial persistence over time, as documented by the significant lagged dependent variable in the system GMM specifications reported below. This persistence violates the assumptions underlying static panel estimators and calls for a dynamic approach. In the system GMM framework, we instrument the endogenous green finance variable and the lagged dependent variable using their own lagged values at t − 2 and beyond. The validity of these instruments rests on the assumption that past green finance levels affect current export complexity only through their impact on intervening green finance and export complexity values. This condition is consistent with the dynamic structure of our theoretical model. We report Hansen’s J-test statistics to assess the overidentifying restrictions and verify instrument validity, alongside the AR(2) test to confirm the absence of second-order serial correlation in the residuals.
Taken together, these three strategies provide complementary and mutually reinforcing evidence for the causal effect of green finance on export technological complexity. The DID design exploits quasi-experimental policy variation, the continuous specification leverages cross-sectional heterogeneity with comprehensive fixed effects, and system GMM addresses dynamic endogeneity concerns.
With the model specifications and identification strategies established, we proceed to present the empirical findings. The analysis begins with baseline results before examining robustness, heterogeneity, and transmission mechanisms.
6. Discussion
6.1. Contributions to the Existing Literature
This study provides systematic evidence on how green finance shapes urban export technological complexity using panel data from 287 Chinese cities spanning 2011 to 2024. We establish that green finance significantly enhances export complexity, with a one-standard-deviation increase associating with approximately 16% higher complexity. This effect operates through green innovation and industrial upgrading channels, though its magnitude varies substantially across regions and city types. In what follows, we situate these findings within the existing literature and discuss their broader implications.
6.1.1. Green Finance and Economic Development
While previous research has documented green finance’s environmental benefits [
5,
6,
27,
28], its economic growth implications remained contested. Some studies emphasized potential costs arising from constraining polluting industries [
3,
23], while others highlighted benefits channeled through innovation support [
4]. Our results reconcile this tension by demonstrating that green finance simultaneously constrains backward industries and catalyzes forward-looking sectors, with the net effect being positive for export technological sophistication.
This dual character contrasts with studies focused primarily on environmental outcomes. Su et al. [
5] and Zhang et al. [
6] showed that green finance reduces carbon emission intensity through resource reallocation and green innovation effects, yet these studies did not examine whether such reallocation might simultaneously upgrade economic structures. The present study extends this line of inquiry by demonstrating that green finance achieves environmental and economic objectives concurrently, rather than treating them as inherently in tension. This finding resonates with Scholtens’ [
44] theoretical argument that ecology and finance can be mutually reinforcing when properly aligned.
The magnitude of our estimated effect also warrants attention. A 16% increase in export complexity per standard deviation of green finance is notably larger than typical estimates for traditional financial development. Gu and Guo [
35] found that general financial development increased export complexity by approximately 8–10% in their sample of Chinese provinces. Several factors may account for this difference. Green finance operates not only as a capital provider but also as a quality screener, channeling resources toward technologically superior activities. Moreover, this financial instrument in China was implemented primarily through government-led policy initiatives, which may create stronger institutional effects than market-driven financial deepening. The study period also coincided with a significant phase of China’s manufacturing transformation, a stage at which targeted financial interventions can catalyze structural upgrading most effectively.
6.1.2. Export Technological Complexity
A rich literature has identified various determinants of export complexity, including human capital [
11], infrastructure [
15], FDI [
17], and financial development more broadly [
34,
35,
36,
37]. The role of environmentally oriented financial instruments in shaping export sophistication, however, had remained unexplored prior to this study. By demonstrating that green finance constitutes an independent driver of export complexity, we contribute to a more complete understanding of the factors governing trade upgrading.
The framework developed here extends beyond the financial provision mechanisms emphasized in traditional finance literature. Liu et al. [
37] and Wang and Du [
45] examined how conventional finance facilitates export upgrading primarily through reducing borrowing costs and easing credit constraints. Green finance, by contrast, adds a quality-based selection dimension that actively redirects resources toward technologically superior activities. This selective allocation mechanism, reinforced by signaling effects that attract complementary resources such as skilled labor, generates amplification effects that exceed those typically documented for traditional financial development.
The spatial patterns documented in this study also offer insights that go beyond prior work on export complexity. Hausmann et al. [
7] established that export complexity tends to concentrate in more developed economies, reflecting accumulated capabilities and institutional advantages. Yet our results suggest that targeted green financial interventions can partially reverse this concentration by providing disproportionate benefits to less developed regions. This implies that financial policy design can meaningfully shape the geographic distribution of export sophistication over time, with implications for theories of regional convergence.
6.1.3. Digital and Green Transformation
It is instructive to compare the effects documented here with those reported in the growing literature on digital finance and export complexity. Wang et al. [
38], Du and Guan [
39], and Liu et al. [
40] generally find that digital finance promotes export complexity, operating primarily through reduced information asymmetries and lower transaction costs. The comparable magnitude estimated for green finance in this study stands at 16%. This suggests that green transformation constitutes an equally potent force in driving export upgrading, despite relying on fundamentally different channels. Green finance shapes complexity not merely by lowering the cost of doing business, but by establishing quality standards and lengthening investment horizons that inherently favor R&D-intensive sectors.
This comparison raises broader questions about the interaction between green and digital transitions. The two types of transformation may in fact reinforce one another rather than competing for resources or policy attention. Digital tools can improve the monitoring and efficiency of green finance allocation, while green standards redirect digitally enabled industries toward more sustainable production. Whether such complementarity materializes in practice represents a promising direction for future research.
6.2. Heterogeneity Patterns
The heterogeneity results constitute one of the most informative dimensions of this study. They reveal not only where green finance is effective but also why its effects vary so markedly across geographic units.
6.2.1. Regional Variation
The finding that green finance significantly promotes export complexity in western regions but not in eastern regions calls for careful interpretation. Eastern regions have already achieved relatively sophisticated industrial structures and diversified export compositions over decades of prior development. In such contexts, green finance offers incremental improvements to an already-advanced system, yielding limited additional gains. This interpretation is consistent with the diminishing marginal returns captured in our theoretical framework, particularly as reflected in Equation (13). Western regions, by contrast, start from lower baselines in both industrial sophistication and export complexity, creating wider margin for improvement.
Financial access conditions further differentiate the two regions. Eastern regions benefit from mature commercial banking networks, well-developed capital markets, and proximity to major financial centers. In western regions, where capital scarcity has historically constrained development, the introduction of green finance represents a more consequential shift in the availability and direction of resources. Such support thus plays a gap-filling role in the west that it simply cannot replicate in the east. The establishment of green finance pilot zones in provinces such as Guizhou and Xinjiang, accompanied by substantial policy resources and regulatory flexibility, further amplifies these effects in western regions.
6.2.2. City-Tier Variation
A similar logic applies to the stronger effects observed in lower-tier cities relative to first-tier and new first-tier cities. Cities at the lower end of China’s urban hierarchy typically retain high concentrations of traditional manufacturing, leaving considerable scope for green finance to catalyze structural transformation. By relaxing financing constraints in these contexts, such financing unlocks underutilized productive capacity and redirects labor and capital toward emerging green industries. In first-tier cities, which have already shifted substantially toward services and high-technology sectors, the marginal contribution of these instruments to export complexity is correspondingly smaller.
Local governance dynamics may further explain the pattern. Municipalities in lower-tier cities face stronger growth pressures and greater dependence on manufacturing exports. They are therefore likely to implement green finance policies with particular vigor, both to attract investment and to demonstrate responsiveness to central policy directives. Taken together, these results suggest that green finance can serve as an equalizing force across the urban system. It may gradually narrow the disparities in export sophistication that have long characterized China’s development trajectory.
6.2.3. The Beijing-Tianjin-Hebei Region
The significantly negative coefficient for the Beijing-Tianjin-Hebei region requires particular attention, as it stands in sharp contrast to the broadly positive effects found elsewhere. This region has long been dominated by heavy chemical industries, steel production, and energy-intensive manufacturing, precisely the sectors that green finance policies seek to constrain. Under these structural conditions, green finance operates more as an environmentally oriented brake on existing activities than as a catalyst for new ones. In the short run, enterprises that continue to participate in export markets face tightened financing conditions. The green industries and high-end sectors that might eventually replace them have not yet matured sufficiently to compensate.
Environmental regulation compounds this effect. Beijing-Tianjin-Hebei has been subject to unusually stringent pollution controls, particularly in the years surrounding major national events, and this regulatory intensity further tightens the operating conditions for traditional exporters. The result is a transitional period during which export complexity declines before recovering once structural adjustment takes hold. It bears emphasizing that this finding likely reflects a short-run dynamic rather than a permanent feature of the relationship between green finance and export complexity. As replacement industries mature and enterprises adapt to new financing conditions, the negative effect may well reverse. Nevertheless, the experience underscores the importance of providing adequate transitional support in regions where the industrial base is heavily concentrated in polluting sectors.
6.3. Mechanism Analysis and Theoretical Implications
The mediation analyses shed further light on the pathways through which green finance shapes export complexity, and several findings merit discussion.
6.3.1. Innovation Quality
Perhaps the most notable result concerns the divergence between invention patents and utility model patents: while green finance promotes both types, only invention patents translate meaningfully into higher export complexity. Utility model patents, which require less substantive novelty, appear to serve primarily as vehicles for accessing preferential green financing rather than as indicators of genuine technological advancement. This distinction matters because it reveals that green finance’s effectiveness is contingent on the quality of innovation it stimulates. When such support is accompanied by rigorous evaluation of supported projects, the innovation channel functions as intended. Without such quality controls, resources risk being absorbed by superficial activity that yields innovation credentials without improving underlying competitiveness, a dynamic that has been termed “greenwashing” in the literature [
3].
6.3.2. Industrial Structure
The industrial upgrading channel exhibits context-dependent behavior that mirrors the heterogeneity patterns discussed above. In most regions, green finance successfully promotes a shift toward knowledge-intensive industries, and this structural change in turn raises export complexity. In regions where the traditional industrial base is either very entrenched or very underdeveloped, however, the upgrading process may stall or even prove disruptive in the short run. Rapid structural change can exceed the adaptive capacity of enterprises and workers, generating transitional disruptions that offset the intended gains. Conversely, in regions that have already undergone substantial upgrading, further movement along the structural dimension yields diminishing returns. These patterns confirm the nonlinear relationship between industrial structure and export complexity that our theoretical framework predicts in Equation (14). The pace of green finance-driven upgrading should therefore be calibrated to local conditions rather than applied uniformly.
6.3.3. Talent Attraction
The evidence also points to an indirect pathway operating through the agglomeration of skilled labor. Cities that expand green finance development become more attractive to professionals with relevant technical and managerial capabilities, and this influx of talent reinforces the innovation effects discussed above. The mechanism is inherently self-reinforcing: as green industries expand, the demand for specialized human capital rises, drawing talent from other regions and in turn enabling further expansion. The empirical evidence on this channel remains suggestive rather than conclusive, given the difficulty of isolating talent-driven effects. Nevertheless, it connects to a broader literature on urban economics and talent sorting. The implication is that green finance may yield returns that substantially exceed what the direct capital provision mechanism would predict alone.
6.4. Implications for Developing Economies
The evidence presented here carries several lessons for developing countries confronting the challenge of pursuing environmental sustainability and export competitiveness simultaneously. Perhaps the most fundamental is that green finance need not be viewed as a constraint on economic growth. The results demonstrate that well-designed green financial systems can advance environmental and economic objectives concurrently, provided that the systems are comprehensive enough to encompass multiple instruments and channels. Relying on a single tool, such as green credit alone, is unlikely to generate the full range of effects documented here. Policymakers should therefore consider building multi-layered green financial ecosystems that include green bonds, insurance, and investment funds alongside traditional credit instruments.
The substantial heterogeneity across regions and city types, however, cautions against assuming that a single policy configuration will work everywhere. Regions at different stages of industrial development require different approaches. In less developed areas, where financial access is limited and traditional industries still dominate, a more expansive and policy-supported green finance regime may be necessary to initiate structural change. In more developed regions, where financial markets are already mature, the emphasis should shift toward maintaining innovation quality and improving international competitiveness. Regions undergoing the most disruptive industrial transitions require carefully sequenced reforms that provide adequate adjustment periods and nurture replacement industries before aggressively constraining legacy ones. The experience of Beijing-Tianjin-Hebei, discussed above, illustrates what can happen when these transitional dynamics are not sufficiently accounted for in policy design.
The quality dimension of innovation also deserves emphasis. The divergence between invention and utility model patents suggests that credible standards for evaluating green projects are essential. Without them, such financing may be partially captured by firms seeking to exploit preferential terms without making genuine technological advances. Establishing robust monitoring and evaluation mechanisms is therefore not merely a governance nicety but a precondition for it to deliver its intended role in driving export upgrading. The stronger effects observed in western regions and lower-tier cities further suggest that these instruments can serve as an equalizing mechanism across the development landscape. International development institutions might consider prioritizing support for lagging regions, where marginal returns are greatest.
6.5. Limitations and Future Research
Several limitations of the present study should be acknowledged. The temporal coverage of some green finance indicators, particularly green insurance and green investment, is restricted, confining the most comprehensive analysis to a subset of the sample period. As data availability improves, revisiting these relationships over a longer horizon becomes worthwhile. Doing so will help clarify whether the documented effects represent stable features of the green finance–complexity relationship or evolve as green financial systems mature.
The analysis also treats cities as independent units, setting aside potential spatial interactions. Green finance activities in one city may generate spillovers to neighboring cities through knowledge diffusion, supply chain linkages, or labor mobility. Incorporating these dynamics through appropriate spatial econometric methods would provide a richer understanding of aggregate effects. Similarly, the present study operates at the city level and cannot examine the firm-level decisions that ultimately drive changes in export composition. Microdata on individual enterprises would enable more precise identification of the behavioral channels through which green finance translates into export upgrading. These include shifts in R&D investment, technology adoption, and product development strategies.
The institutional context of China, with its centralized policy apparatus and state influence over financial markets, also differs substantially from that prevailing in many other developing countries. Whether the causal relationships and magnitudes documented here would replicate in economies with more decentralized financial systems or weaker policy capacity remains an open question. Comparative studies spanning countries at similar development stages but with varying institutional configurations would be particularly valuable in establishing the generalizability of these findings. These extensions would refine our understanding of green finance’s role in shaping export complexity. They would also contribute to broader questions about how financial innovation can support sustainable development in diverse contexts.
7. Conclusions and Policy Recommendations
7.1. Summary
This study demonstrates that green finance significantly enhances urban export technological complexity, with effects operating through dual channels of green innovation and industrial structure upgrading. Using comprehensive panel data from 287 Chinese cities over 2011 to 2024, we employ multiple empirical approaches including difference-in-differences and system GMM estimations. These analyses establish that a one-standard-deviation increase in green finance associates with approximately 16% higher export complexity. This effect is not uniform across space. Western regions and lower-tier cities experience substantially stronger effects than their eastern and higher-tier counterparts. This pattern suggests that such mechanisms can serve as a convergence mechanism, providing the largest marginal benefits precisely where traditional finance has historically fallen short.
7.2. Policy Recommendations
These findings carry practical implications for developing economies seeking to reconcile environmental sustainability with trade competitiveness. At the broadest level, policymakers should move beyond traditional green credit toward building comprehensive financial ecosystems encompassing bonds, insurance, investment funds, and carbon products—all with environmental criteria. A multi-layered financial system of this kind improves the efficiency of resource allocation and provides sustained capital support for the technological upgrading of export enterprises. Particular attention should be directed toward establishing green technology innovation demonstration zones, where concentrated policy resources and technical capabilities can promote integrated innovation and its practical application. Successful experiences from pilot zones should be systematically evaluated and scaled to broader regions as conditions permit.
Equally important is strengthening the linkages between green finance and technology innovation. In developing economies, where the technological content of exports typically lags behind that of advanced nations, accelerating catch-up growth requires actively channeling green financial resources toward R&D activities. Governments may employ fiscal subsidies, risk compensation mechanisms, and dedicated innovation funds to guide capital in this direction. At the same time, the quality of the innovation generated matters no less than its quantity, as the mechanism analysis in this study demonstrates. Establishing credible evaluation systems for green projects, and linking continued financial support to verified advances in technological capability, is therefore a prerequisite for it to deliver its intended effects. The cultivation of green technology talent represents another dimension of this challenge. Universities and research institutions should adjust their training programs to bridge green finance, green technology, and industrial development. Collaborative industry–university–research systems should be encouraged to ensure that laboratory innovations translate into commercially viable products.
The substantial regional heterogeneity documented in this study implies that a single policy configuration will not serve all regions equally well. Building on the substantial regional heterogeneity documented in
Section 6.2, policy configurations must be differentiated across regions. Developed regions should focus on refining the innovation functions of green finance and exploring its integration with digital finance platforms. Less developed regions require more active government-backed green finance supply and targeted assistance. This includes expanded government-backed green finance supply and targeted talent and funding assistance. Lower-tier cities within these regions warrant particular attention, given the evidence that such support yields its largest marginal effects precisely in such contexts.
The experience of regions undergoing rapid industrial transition (as discussed in
Section 6.2.3) underscores the importance of calibrated environmental regulation. Tiered environmental standards differentiated by industry characteristics and local development stages, accompanied by clearly defined transition periods, can prevent excessive shocks.
7.3. Concluding Remarks
As the global economy grapples with intensifying climate pressures alongside persistent aspirations for economic growth, a central question has emerged. How can developing countries upgrade their export structures without sacrificing environmental sustainability? The evidence presented in this study suggests that well-designed green finance systems offer a viable pathway for advancing both objectives simultaneously, rather than treating them as inherently in tension. The dual-channel mechanism identified here operates through green innovation enhancement and industrial structure upgrading. Together, these channels reveal that the benefits of green finance extend well beyond simple capital provision. Quality screening, talent attraction, and knowledge spillover effects collectively amplify the impact on export sophistication.
Yet the heterogeneity patterns documented across regions and city types remind us that the effectiveness of green finance is deeply contingent on local conditions. Successful implementation requires nuanced understanding of the industrial base, the state of financial market development, and the pace at which structural adjustment can proceed without creating disruptive shocks. Translating the findings of this study into effective policy guidance across diverse institutional settings remains an important task for future research. Comparative studies spanning countries at similar development stages but with varying policy and financial structures will be particularly valuable. They can help establish the broader generalizability of these conclusions.