Article

Research on the Coupling Coordination Between Economic Resilience and Ecological Resilience in China’s Coastal Cities from the Perspective of Evolutionary Ecological Economics

1
School of Economics, Shandong Normal University, Jinan 250358, China
2
State Key Laboratory of Marine Environmental Science, Xiamen University, Xiamen 361102, China
3
College of Ocean and Earth Sciences, Xiamen University, Xiamen 361102, China
*
Author to whom correspondence should be addressed.
Sustainability 2026, 18(4), 1963; https://doi.org/10.3390/su18041963
Submission received: 24 December 2025 / Revised: 30 January 2026 / Accepted: 10 February 2026 / Published: 13 February 2026
(This article belongs to the Section Social Ecology and Sustainability)

Abstract

The conflict between the economy and the ecological environment is prominent in China’s coastal cities, and these cities contend with heightened uncertainty. Therefore, this study uses the econometric model to analyze the spatial–temporal pattern characteristics and affecting factors of the coupling coordination level between urban economic resilience (ER) and urban ecological resilience (EcR) in China’s coastal cities based on improvement of the evaluation index system, thus advancing policy suggestions. The main conclusions are as follows: (1) The coupling coordination degree (CCD) between ER and EcR across different types of coastal cities strongly correlates with their spatial distribution patterns of economic development. From the East China Sea to the South China Sea and Yellow and Bohai Sea Coast cities and from central cities to industrial cities, other types of cities, and resource-based cities, CCD exhibits an overall declining trajectory. (2) The gap in CCD in China’s coastal cities generally shows an expanding trend. (3) The spatial distribution pattern of the centrality of CCD in China’s coastal cities has a relatively high consistency. Urban spillover roles are highly consistent with levels of economic development. (4) The number and diversity of dominant influencing factors have steadily increased.

1. Introduction

COVID-19, anti-globalization trends, global warming, and major natural disasters have profoundly impacted urban development, making the enhancement of urban resilience a widely recognized global imperative. As a subsystem of urban resilience, urban economic resilience (ER) and urban ecological resilience (EcR) exhibit a dialectical relationship of mutual opposition and interdependence, underscoring both the necessity and potential of coupling coordination.
China’s coastal cities, positioned at the forefront of reform and opening up, are particularly susceptible to anti-globalization pressures. These regions house 21.4% of China’s population and 32% of its GDP, forming the core of China’s economic engine. However, they face severe environmental challenges and ecological problems such as coastline erosion, water resource depletion, sea-level rise, and prominent storm surges. The contradictions between economic risks and ecological risks in China’s coastal cities are prominent. For example, ecological damage restricts economic growth, and economic anti-globalization leads to a slowdown in economic growth, thereby reducing the capacity for ecological restoration. Therefore, it is of critical importance to strengthen both ER and EcR and promote their coupling coordination.
Scholarly perspectives on the concept of urban ER vary significantly. Debates focus on a range of capacities—such as the ability to predict and prepare before the impact, resistance, recovery, adaptability, learning capacity, creativity, transformation, and reconstruction in research on the concept of urban ER [1,2,3,4,5,6,7,8,9,10,11,12,13]. Different scholars have focused on one or a few of these factors in their interpretation of urban ER. Most urban ER evaluation index systems consist of some of these indicators: vulnerability, robustness, resistance, reconstruction, restructuring, recovery, adaptability, evolutionary capacity, transformation capacity, and digital technology identification and prevention [14,15,16,17,18,19]. In addition, there are other viewpoints on the evaluation index system: macroeconomic stability, micro-market efficiency, economic governance, and social development [20]. Drawing on adaptive circulation theory and the “drive–pressure–state–response” model, some researchers have proposed systems incorporating development and drivers, maintaining and bearing stress, resistance and release, and recovery and restructuring [21,22,23]; the systems of production, consumption, labor market, foreign trade, and innovation [24]; and the systems of economic operational resilience, economic structural resilience and economic potential resilience [25].
Urban EcR extends the concept of resilience from ecology and urban science. Holling first defined EcR as the rate at which an ecosystem returns to equilibrium and the capacity to manage crises, self-recovery and adaptive responses to new environments [26]. Later scholars refined EcR as the ecosystem’s speed in recovering from disturbances, as well as adaptation and transformation capacities [27,28,29,30]. From a human ecology perspective, Alberti et al. introduced the concept of EcR [31], which Folke further expanded to include disturbance absorption, adaptability, learning capacity, and self-organization [32]. Wang Shaojian et al. emphasized urban EcR as the capacity for impact resistance, self-adaptation, and post-impact recovery [33,34,35,36]. Mehryar et al. and Xue et al. defined it as the self-organization and coordination of the urban environment, adapting and bearing stress and the capacity to recover from disturbances [37,38]. The Resilience Alliance highlighted resilience as the ability to absorb external shocks and maintain original major features and structures, as well as maintaining key functions [39]. Urban EcR evaluation index systems reflect diverse analytical perspectives. These include: scale, density, and form [33]; resistance, adaptability, and recovery [40,41]; urban ecological social process resilience, urban ecological economic process resilience and urban ecological natural process resilience [42,43]; environmental pollution generation, the governance of environmental pollution, and ecological security [44]; habitat quality, biodiversity services, and landscape connectivity [45]; ecological risk index, connectivity index, and ecosystem potential [46,47]; drivers, pressure, state, impacts, and response [48,49]; potential, connectivity, and recovery [50]; remote sensing-based ecological index [51]; potential, elasticity, and stability [52,53]; resistance, recovery, reconstruction, and renewal [54]; ecological disturbance, carrying capacity, and recovery [55]; and prevention, resistance, adaptation, and recovery [56]. Urban EcR evaluation is based on the eight characteristics of EcR: stability, diversity, robustness, redundancy, connectivity, adaptability, innovation, and learning capacity [57]. Other dimensions include landscape diversity, disturbance, source–sink patch distance, habitat quality, minimum cumulative resistance, and landscape restoration [58].
Research on the coupling coordination between urban ER and EcR remains limited, with existing studies primarily addressing: spatial–temporal pattern characteristics of the coupling coordination degree (CCD) among ER, social resilience, and EcR in the Chengdu–Chongqing Urban Agglomeration [59]; the spatial–temporal variation in and factors affecting the ER–EcR CCD in cities along the Yellow River Basin [60]; the spatial–temporal patterns and obstacle factors of the ER–EcR CCD in the Northern Slope Economic Belt of the Tianshan Mountains [25]; and the spatio-temporal coupling and synergistic evolution of ER and EcR in Africa [61].
While these studies offer valuable insights, several gaps remain. First, existing conceptualizations and evaluations of urban ER often overlook historical–temporal importance and lack the “structure–agency” perspective. Second, the conceptualizations and evaluations of urban EcR do not attach sufficient importance to the wisdom of the human ecosystem and neglect both the “structure–agency” and circular economy perspectives. Third, research on the mechanisms of ER–EcR coupling coordination rarely considers the perspective of systems economics. Moreover, there is a lack of research on the coupling and coordination between urban ER and EcR using social network analysis. Fourth, there is a notable lack of empirical studies focusing on ER–EcR coupling coordination in China’s coastal cities.
In view of this, the main possible marginal contributions of this study are as follows: (1) Based on the evolutionary process from past to present to future and the “structure–agency” perspective of evolutionary economics, the evaluation indicators of urban ER and urban EcR are decomposed into preventive indicators, resistance indicators, and restructuring indicators. Indicators characterizing the circular economy are supplemented. (2) From the perspective of structure and function based on systems theory, the influencing factors of the coupling coordination between urban ER and EcR are proposed. (3) The characteristics of the spatial pattern and influencing factors of the coupling coordination level between the ER and EcR of China’s coastal cities are revealed.

2. Materials and Methods

2.1. Concept and Evaluation Index Systems

2.1.1. Concept

According to the evolutionary process from past to present to future and based on the “structure–agency” perspective, urban ER includes three aspects: economic prevention, characterized by past and agency; economic resistance, shaped by present and structure; and economic restructuring, characterized by future and agency.
By acknowledging humans as both agents within and co-creators of the biosphere, the human ecosystem is viewed as intelligent. Considering the role of humans in the ecological environment, urban EcR encompasses both natural and artificial resilience. Drawing on the evolutionary resilience perspective, the “structure–agency” perspective, and circular development theory, this study posits that urban EcR also includes the capacity for ecological prevention, ecological resistance, and ecological restructuring. Accordingly, the development of urban resilience evolves cyclically through these three aspects: prevention, resistance and restructuring.
Since the economy, society, and ecology exhibit both contradictory and interdependent relationships, a theoretical crossover is posited to exist between urban economic resilience, urban social resilience, and urban ecological resilience.
Urban ecological prevention primarily encompasses the social security of ecological management personnel, reduction in the consumption of natural resources and the ecological environment, the reuse and recycling of waste (including harmlessness), the ecological prevention capability of digital technology, the reserve level of natural resources and the ecological environment, and ecological planning. Based on the structural–functional model within ecosystem theory, urban ecological resistance is mainly determined by the structure and function of natural resources and the ecological environment. Drawing from the principles of disequilibrium and evolution in evolutionary ecology, this study shifts away from ecological recovery. It critiques the limitations of passive ecological adaptability and instead emphasizes proactive human learning and innovation in ecological management. Accordingly, ecological restructuring—comprising ecology-related learning and innovation capacity—is posited to be a core component of EcR.
The coupling coordination of urban ER and EcR refers to the close connection and mutual promotion between urban ER and urban EcR, with consistency and coordination, aiming to achieve a win–win situation for urban ER and urban EcR.

2.1.2. Index Systems

Informed by system science theory and circular development theory, this study refines the evaluation index systems for urban ER and EcR by integrating their concepts and the actual situation in China’s coastal cities (Table 1 and Table 2).
Indicators that enhance preventive capacity, resistance, and restructuring capacity are designated as positive indicators, while those that weaken preventive capacity, resistance, and restructuring capacity are defined as negative indicators.
Urban economic prevention is reflected by the identification and prevention of digital technology use (including the number of Internet users per 100 people, the number of mobile phones per 100 people, and the employment share in information transmission and computer services and software) and social protection. According to systems theory, economic resistance is reflected using indicators of the structure (including industrial structure rationalization, advancement of industry structure, consumption patterns and the urban–rural wealth gap) and functioning of the economy, expressed in terms of benefit indicators (including unemployment rate, per capita GDP, per capita disposable income, GDP growth rate and total grain output per capita). Meanwhile, economic restructuring is reflected in indicators of learning and innovation capacity related to the economy (including technology research and development: proportion of R&D personnel, investment intensity of scientific research funds and number of patent applications granted per 10,000 people; human capital indicators; share of university students in the total population, per capita health expenditure, the number of hospital beds per 10,000 people, and the proportion of doctors and education expenditure as a share of public financial expenditure; and fiscal support indicators: financial self-sufficiency rate) from the perspective of structure and agency.
To reduce ecological risks, and in accordance with circular development theory, we select indicators of a reduction in the consumption of natural resources and the ecological environment, namely, the carbon dioxide emission per unit GDP and the reduction rate of energy consumption per unit of GDP; an indicator for waste reuse, namely, the industrial waste comprehensive utilization rate; and recycling indicators (including the cycle between economy and nature), namely, the industrial sulfur dioxide removal rate, the harmless treatment rate of household garbage, the sewage treatment plant centralized treatment rate, and the industrial soot removal rate. These characterize the ecological prevention capacity of cities. Ecological resistance, within the framework of systems theory, is measured through ecosystem structure indexes (including per capita water supply, population density, proportion of urban construction land, proportion of clean energy consumption, forest coverage rate, green coverage rate in built-up areas and per capita park green space area) and function indexes (carbon dioxide emission per unit GDP, the proportion of days with air quality up to standard, industrial sulfur dioxide emission per unit value industrial output, industrial wastewater discharge per unit value of industrial output, industrial soot emissions per unit industrial output value and energy consumption per unit of GDP), and ecological restructuring is indicated by the learning and innovation capacity related to ecology (including green technology indicators: green patent grants per 10,000 population; green management indicators: employment share in water conservancy, environment, and public facilities management, environmental protection expenditure as a share of fiscal expenditure, per capita investment in ecological infrastructure, per capita investment in water supply infrastructure, per capita investment in drainage infrastructure and per capita investment in landscaping infrastructure) from the perspective of structure and agency.

2.2. Factors Affecting Coupling Coordination Between Urban ER and EcR

2.2.1. Internal Influencing Factors

According to systems science theory, the structure and function of urban ER and EcR—as well as their interactive relationship—are the internal influencing factors. Building on the concepts and logical correspondence between evaluation index systems, this study further analyzes the primary interactions between urban ER and EcR.
1
Effect of urban economic prevention on urban EcR
Social security and agricultural product reserves influence urban ecological restructuring and prevention by affecting the ecological governance of human capital and the social security level of ecological governance personnel.
Digital technology’s economic prevention contributes to urban ecological prevention by forecasting economic growth and the impact of ecological environmental risks on urban economic development. However, high-carbon digital technologies hinder improvements in urban EcR.
Urban economic planning enhances ecological prevention and resistance by anticipating and promoting urban economic development. This planning establishes a robust economic foundation for advancing urban ecological restructuring.
2
Effect of urban economic resistance on urban EcR
Urban economic resistance is primarily determined by the structure and benefits of the urban economy. The urban economic structure significantly affects reductions in the consumption of natural resources and the ecological environment, the reuse and recycling of waste, the reserve levels of natural resources and the ecological environment, and their structure and function. Consequently, urban economic resistance influences ecological prevention and ecological resistance. In turn, urban economic benefit affects the funds and human capital available for improving urban ecological restructuring and ecological prevention by affecting the social security system for ecological governance personnel.
3
Effect of urban economic restructuring on urban EcR
Learning and innovation capacities enhance urban ecological prevention and restructuring by influencing urban digital technology’s ecological prevention and ecological planning, as well as urban ecological technological innovation, and human capital in ecological management.
4
Effect of urban ecological prevention on urban ER
Reduction in the consumption of natural resources and the ecological environment, reuse and recycling of waste, and the reserved level of natural resources and the ecological environment require the development of circular and low-carbon economies. These efforts also demand research into green digital technologies and the implementation of green economic planning—thereby affecting urban economic prevention. Furthermore, these measures drive the green transformation of urban economic structures, thereby affecting economic resistance.
5
Effect of urban ecological resistance on urban ER
The structure and function of natural resources and the ecological environment influence urban economic structure and economic benefits, thereby influencing urban economic resistance. Additionally, they affect the urban learning and innovation environment, necessitating a green transformation in learning and innovation capacities, thereby influencing economic restructuring.
6
Effect of urban ecological restructuring on urban ER
Ecology-related learning and innovation capacities influence the urban economic structure and benefits through impacting ecological restoration, thereby contributing to urban economic resistance. There are interconnected relationships among eco-technological innovation, ecological system innovation, and ecological governance human capital—all of which intersect with the indicators of urban economic restructuring such as technological innovation, institutional innovation, and human capital. Consequently, ecological restructuring significantly impacts urban economic restructuring.
In summary, enhancing urban EcR depends on transforming urban ER into urban circular ER and urban low-carbon ER.

2.2.2. External Influencing Factors

From a governance perspective, external influencing factors, namely, the external environment, mainly include the impacts of globalization, domestic public participation, market and policies.

2.3. Study Area

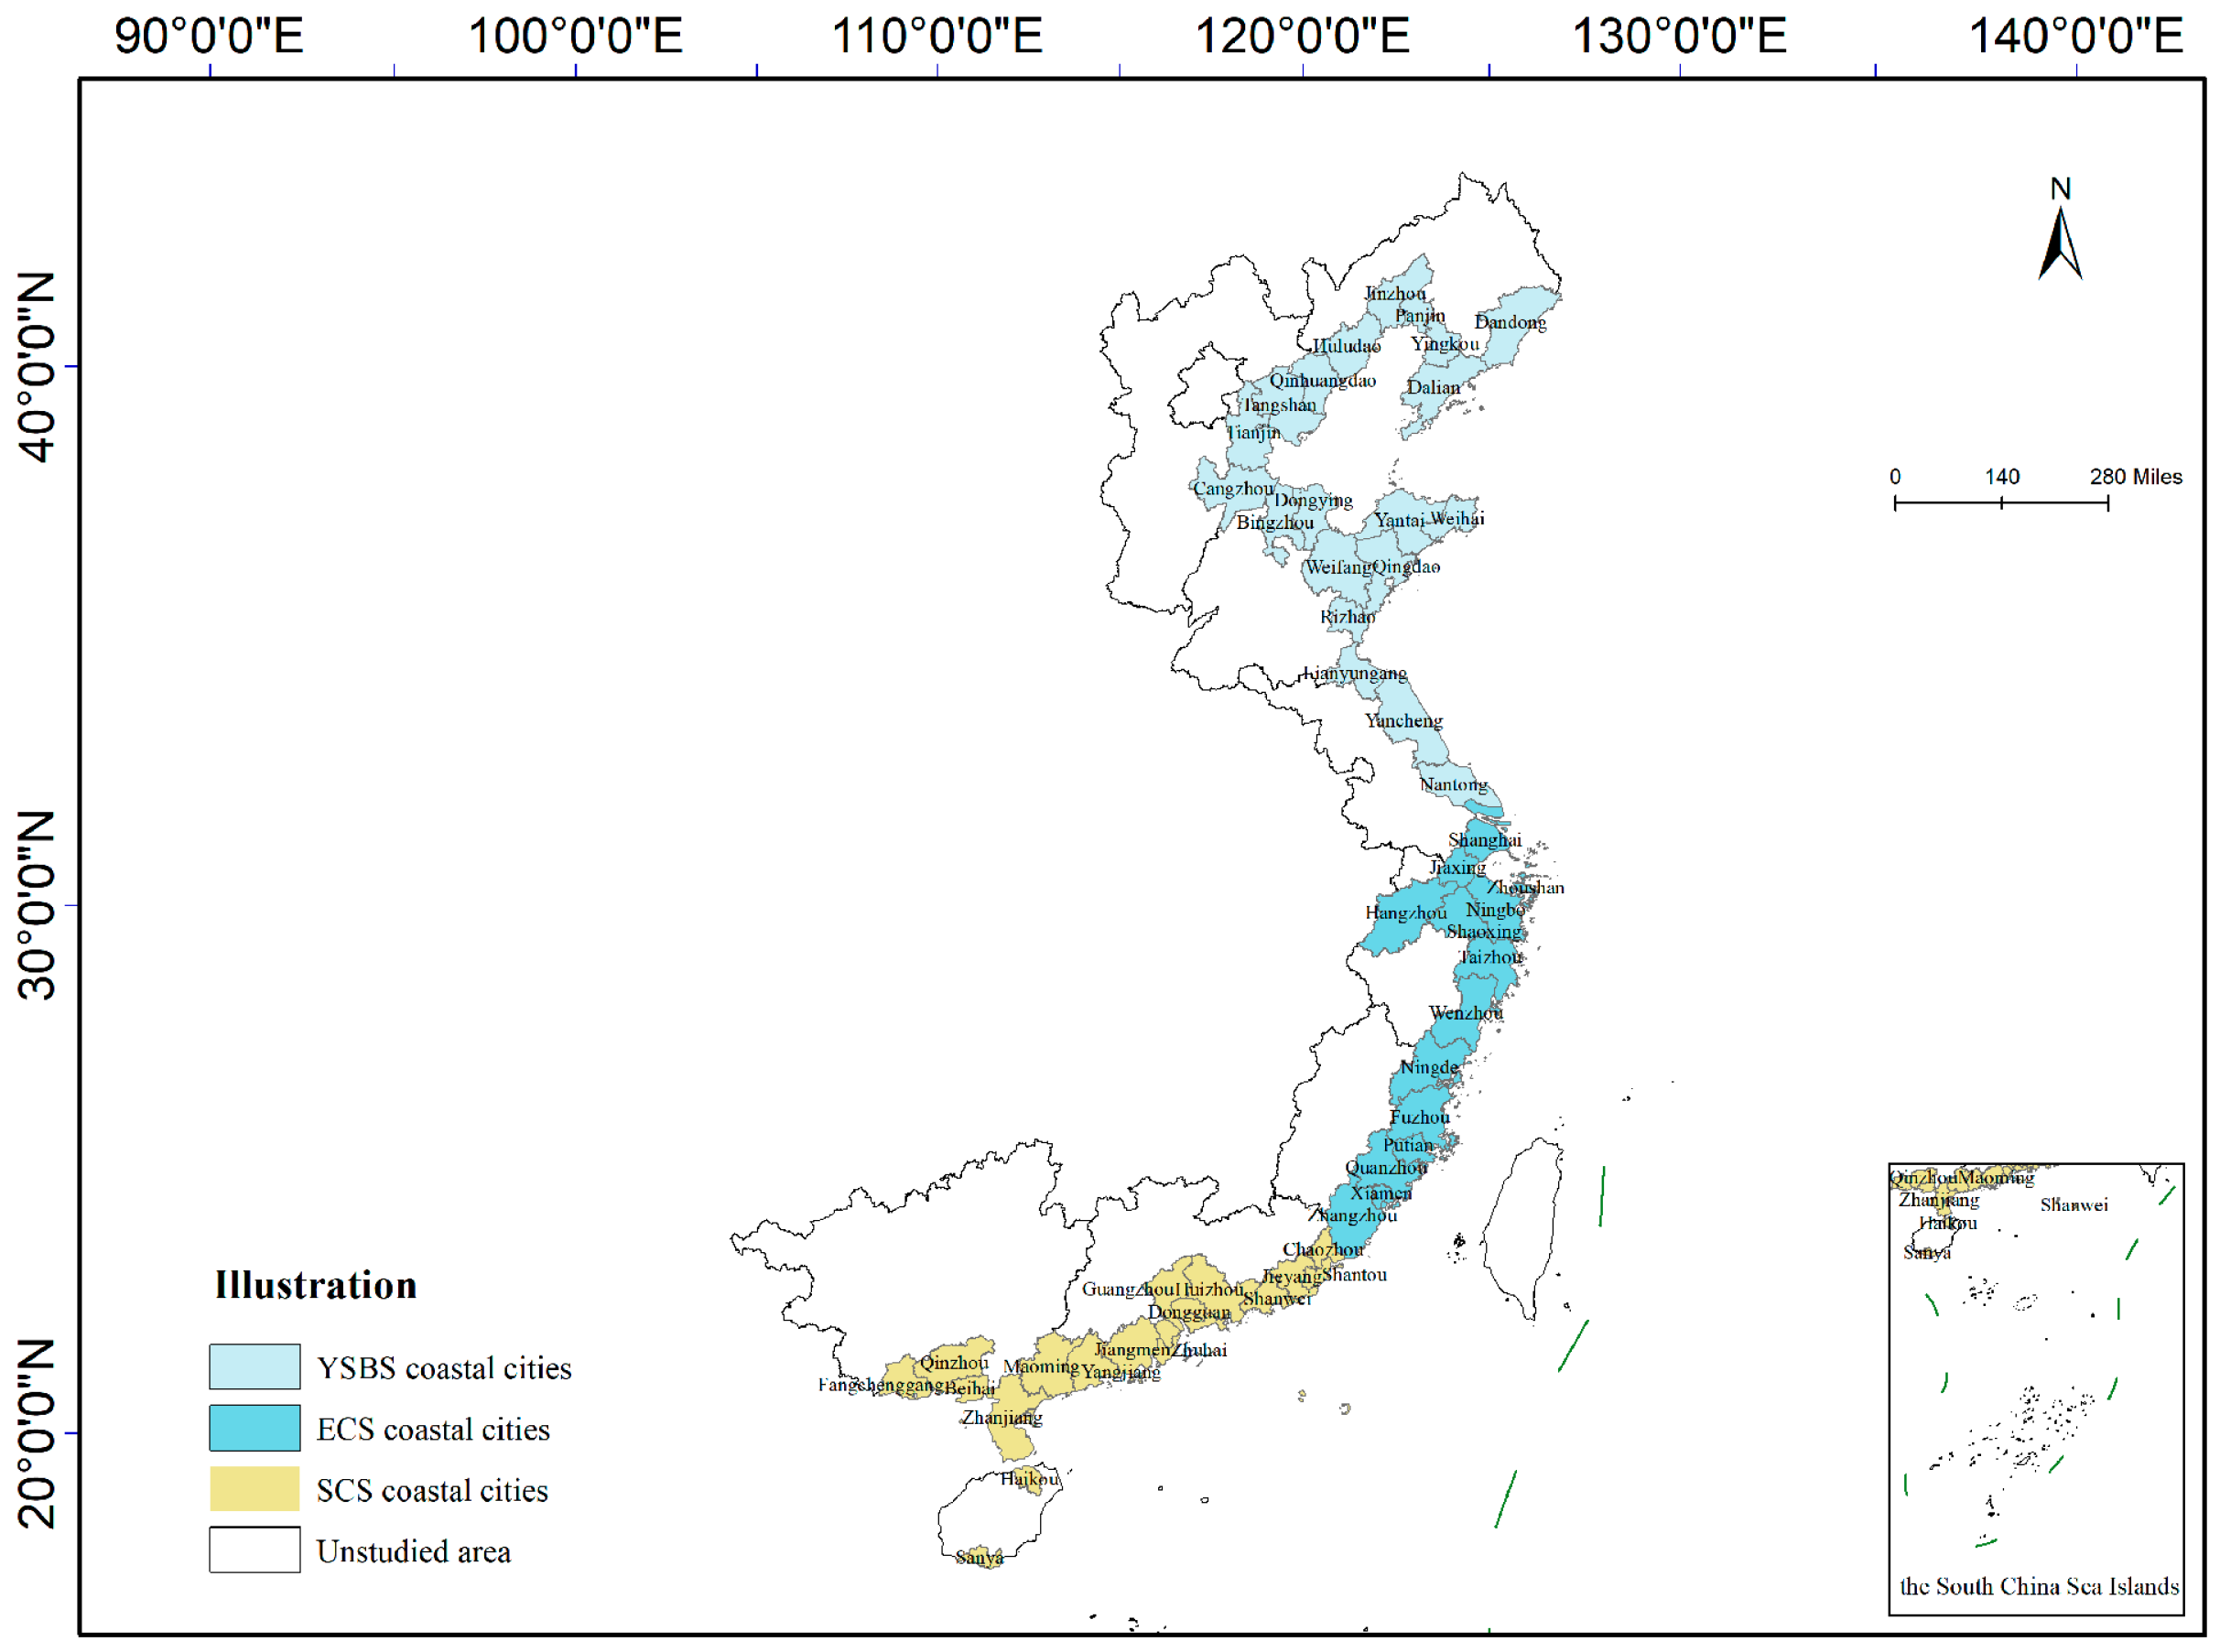
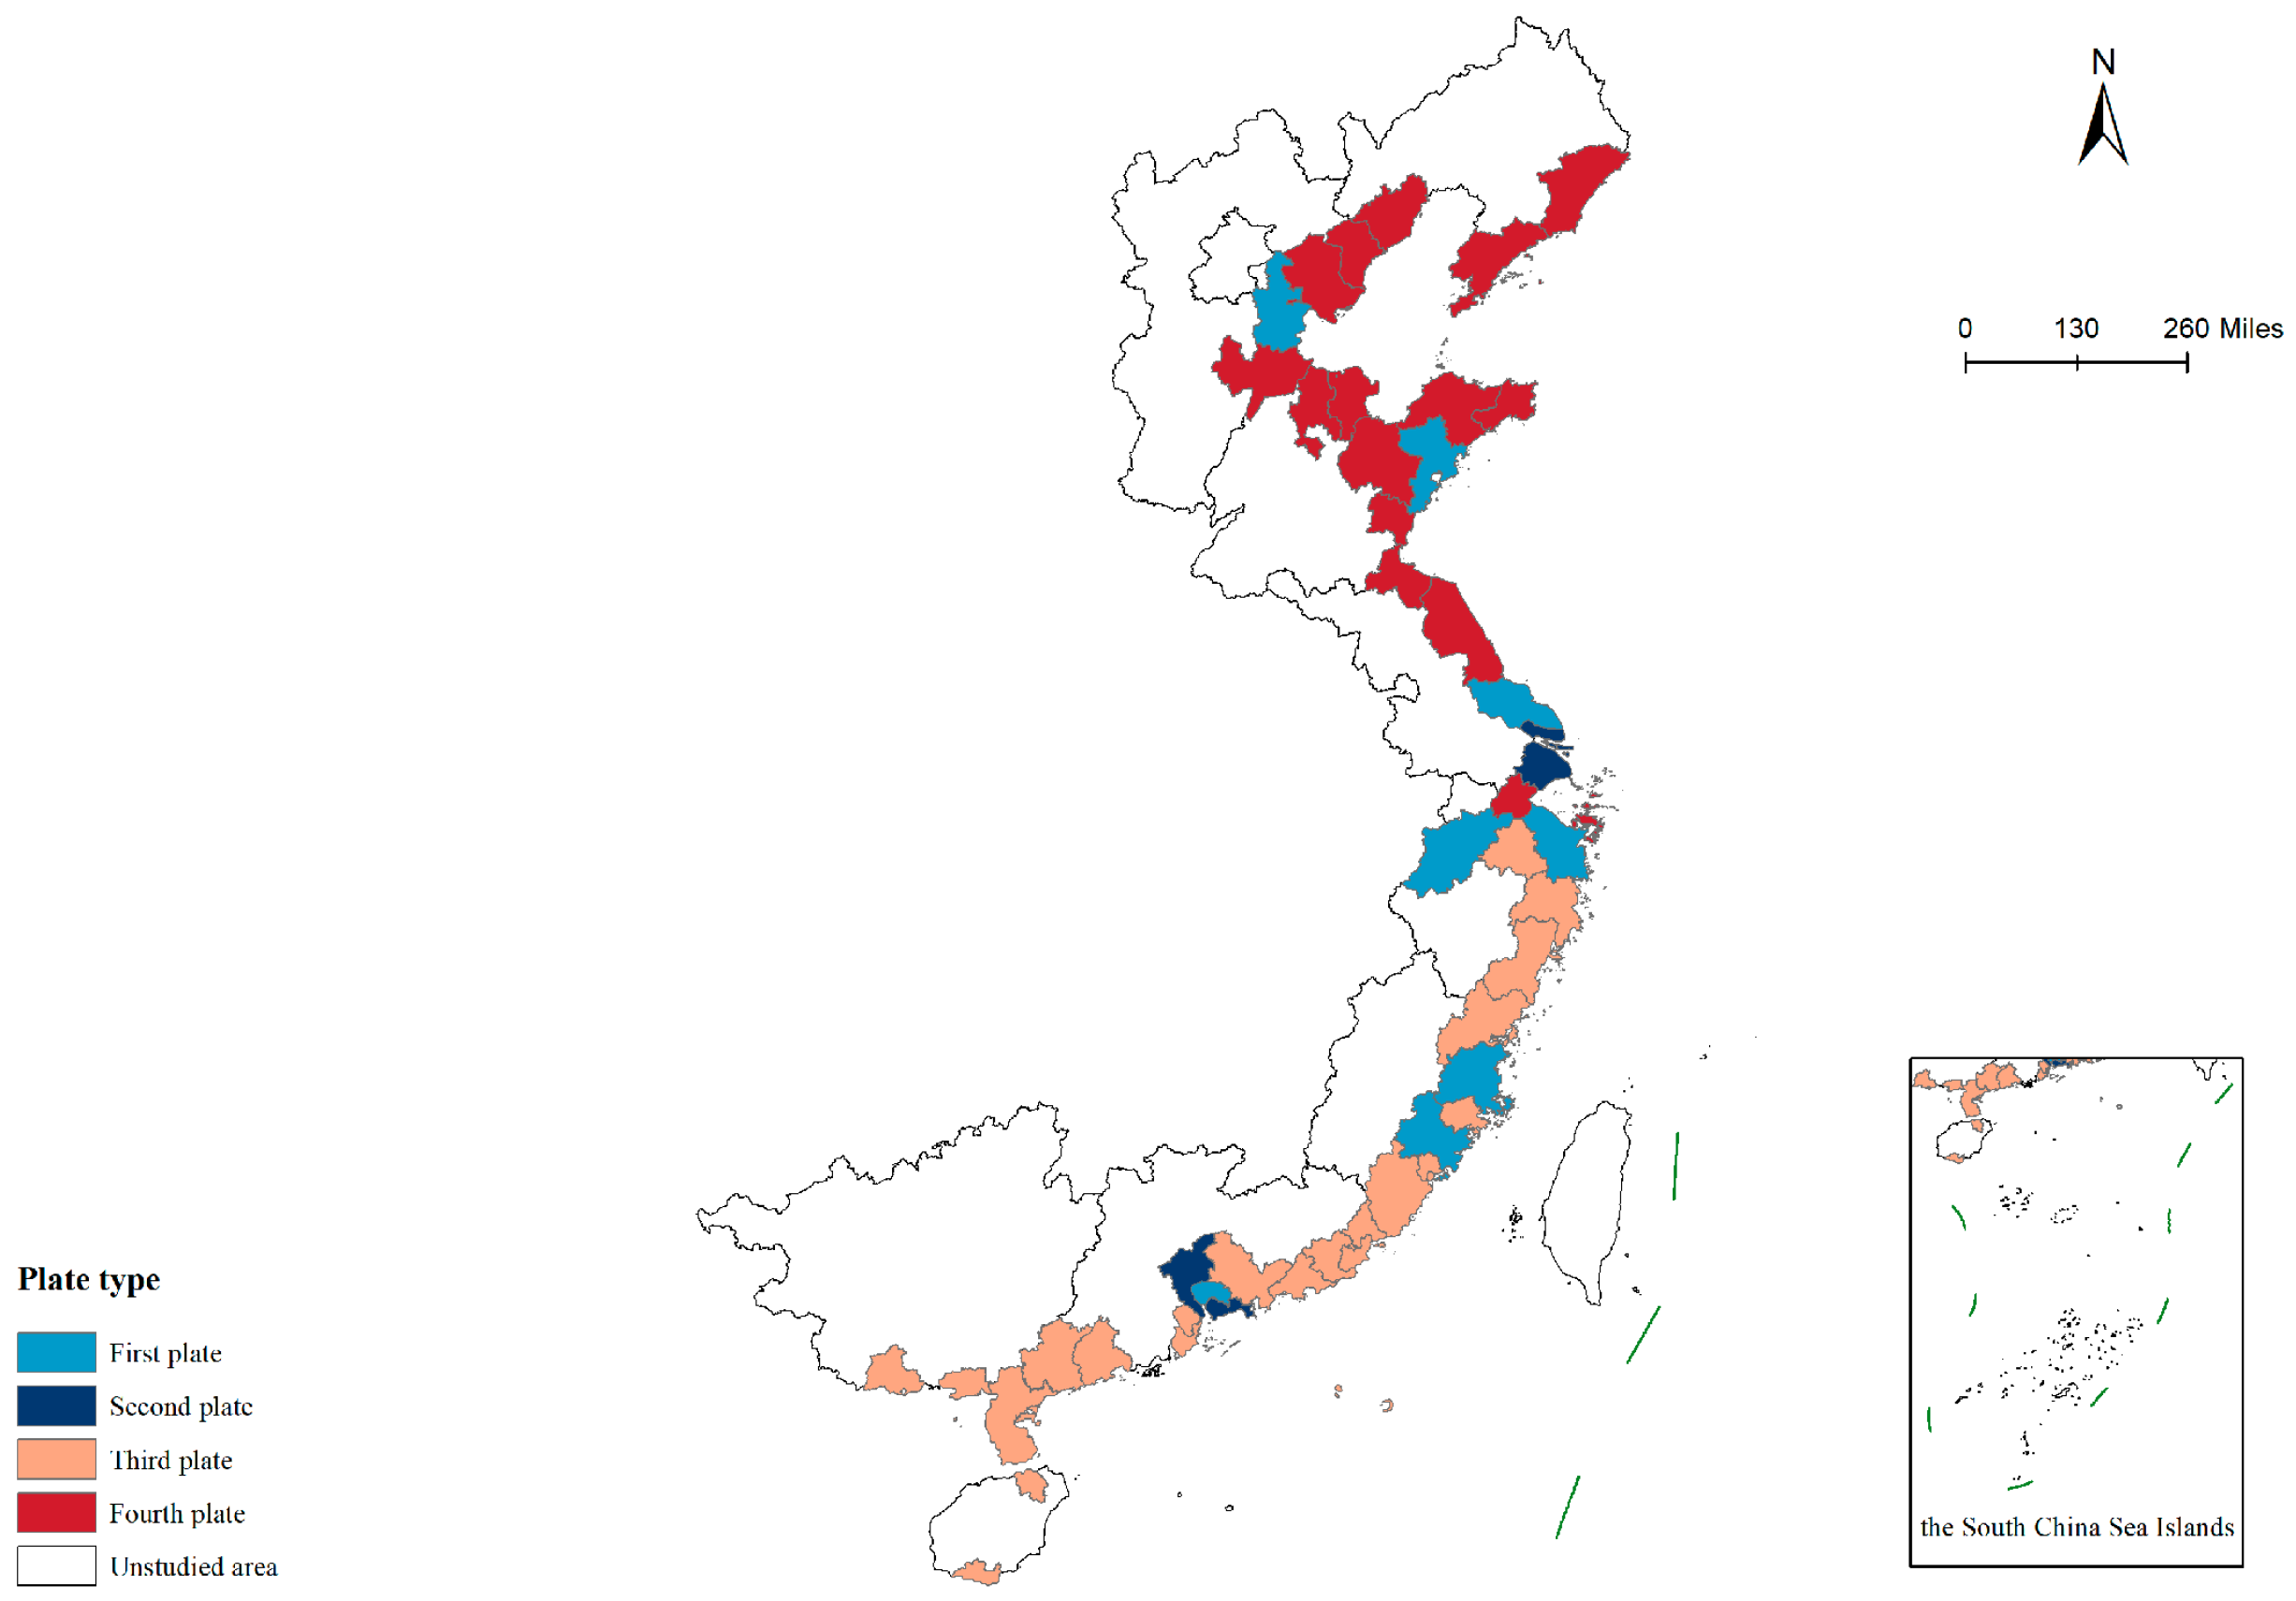
China’s coastal cities are located along the coastlines and islands bordering the Yellow and Bohai Sea (YSBS), East China Sea (ECS), and South China Sea (SCS), spanning from 107°28′ E to 125°42′ E longitude and 3°51′ N to 40°47′ N latitude. Based on administrative divisions outlined in the China Marine Economy Statistical Yearbook 2022 and data availability, 53 cities are identified as the study area, excluding Hong Kong, Macao, Taiwan, Sansha, and Danzhou in Hainan Province [40]. These cities are classified by their sea geographical location into YSBS, ECS, and SCS coastal cities (Figure 1). According to the results of China’s city classification, developed by Diao Beidi et al. using K-means clustering, its formula is as follows:
m i n   J = k = 1 K x i C k | | x i μ k | | 2
μ k = 1 | C k | x i C k x i
where K denotes the pre-defined number of clusters; Ck represents the k-th cluster set; xi denotes the i-th sample vector; μk represents the centroid (mean vector) of the k-th cluster; denotes the Euclidean distance; and | C k | is the number of samples in the k-th cluster [63]. The 53 cities are categorized into central cities, resource-based cities, industrial cities, and other types of cities (Table 3).

2.4. Research Methods

2.4.1. CCD Model

We use the entropy method and CCD model to calculate the comprehensive evaluation index and CCD between urban EcR and ER, respectively [64,65]. The relevant formulas are as follows:
C = 1 U M U m 2 × U m U M = 1 U M U m × U m U M
T = α U 1 + β U 2
D = C × T
where U1 and U2, respectively, represent the comprehensive evaluation indices of ER and EcR in a given year. UM is the larger one between the two values, and Um is the smaller one. C denotes the coupling degree, and T is the coupling coordination index. Urban ER and urban EcR are subsystems of urban resilience. The two are interdependent and mutually restrictive and play equally important roles in urban resilience; therefore, equal weights of 0.5 are assigned to α and β. D is CCD. The classification of evaluation grades follows the “ten-point method” proposed by Liao Chongbin [66].
This study employs the Relative Development Degree model to analyze the comparative development status between urban economic resilience and ecological resilience. The formula is as follows:
E = U 1 U 2

2.4.2. KD Analysis

Kernel density (KD) analysis is used to investigate the spatial evolution of CCD between urban ER and EcR [67]. The KD function is defined as follows:
f x = 1 n h d i = 1 n K x x i h
K(·) denotes the KD analysis equation, and x denotes the KD of the grid center. xi denotes the point KD, d is the dimensionality of the data, h is the threshold, and n denotes the number of points within the threshold range.

2.4.3. Social Network Analysis

To explore the spatial association network (SAN) characteristics of CCD between ER and EcR in coastal cities, this study applies social network analysis focusing on three aspects: overall and individual network characteristics and block model analysis [68]. The relevant formulas are as follows:
N e t w o r k   d e n s i t y : D = L / N ( N 1 )
N e t w o r k   C o n n e c t e d n e s s : C = 1 V / [ N ( N 1 ) / 2 ]
N e t w o r k   E f f i c i e n c y : E = 1 M / m a x ( M )
N e t w o r k   H i e r a r c h y : H = 1 S / m a x ( S )
D e g r e e   c e n t r a l i t y : D C = W / ( N 1 )
C l o s e n e s s   c e n t r a l i t y : C C = j = 1 N d i j
B e t w e e n n e s s   c e n t r a l i t y : B C = 2 j N k N b j k ( i ) N 2 3 N + 2 b j k ( i ) = g j k ( i ) g j k
B l o c k   t y p e : Z = ( Y h 1 ) / ( Y 1 )
Due to space limitations, for detailed descriptions of the formulas and metrics, refer to the references [68].

2.4.4. Geographical Detector

To assess the spatial distribution congruence between influencing factors and CCD, the Geographical Detector’s factor detection is utilized. The formula is as follows:
q = 1 1 N σ 2 h = 1 L N h σ h 2
where q denotes the influence coefficient of impact factors, ranging from 0 to 1, with higher values indicating stronger interpretive capacity for the spatial distribution of factor Y by factor X. N and Nh refer to the total number and the number of samples in sub-region h, respectively. L is the number of sub-regions, while σ2 and σh2 denote the variance in CCD and sub-regional variances in CCD, respectively.

2.5. Data Source

The data of this study cover the period from 2005 to 2022. The data related to socioeconomic indicators such as regional GDP, unemployment rate, and fiscal expenditures were obtained from the China City Statistical Yearbook, the China Urban Construction Statistical Yearbook and the statistical yearbooks of individual prefecture-level cities. The data related to ecological environment indicators such as industrial wastewater discharge volume, air pollutant discharge volume, and green coverage rate are derived from the China Urban Construction Statistical Yearbook, the China Environmental Statistical Yearbook, the statistical yearbooks of individual prefecture-level cities and the publicly available information of their governments; some indicators are obtained from the CNKI database. Patent data are from the INCOPAT database and missing values are filled in using interpolation methods. The data processing procedures mainly include searching for the data. For missing values, interpolation methods are used for supplementation. Then, the comprehensive value is calculated using the entropy method, and CCD is calculated using the coupling coordination model.

3. Results

3.1. Time-Series Characteristics

3.1.1. Overall Coastal Cities

The CCD between ER and EcR in coastal cities ranged from 0.43 to 0.54—not high enough, but with an upward trend. From 2005 to 2013, the CCD verged on disorder, rising to a state of bare coordination between 2014 and 2022. Two major downturns in CCD were triggered by the 2008 global financial crisis and the 2020 COVID-19 pandemic. According to the relative development index, the development of ER in overall coastal cities lags behind (Table 4).

3.1.2. Different Types of Cities in the Coastal Zone

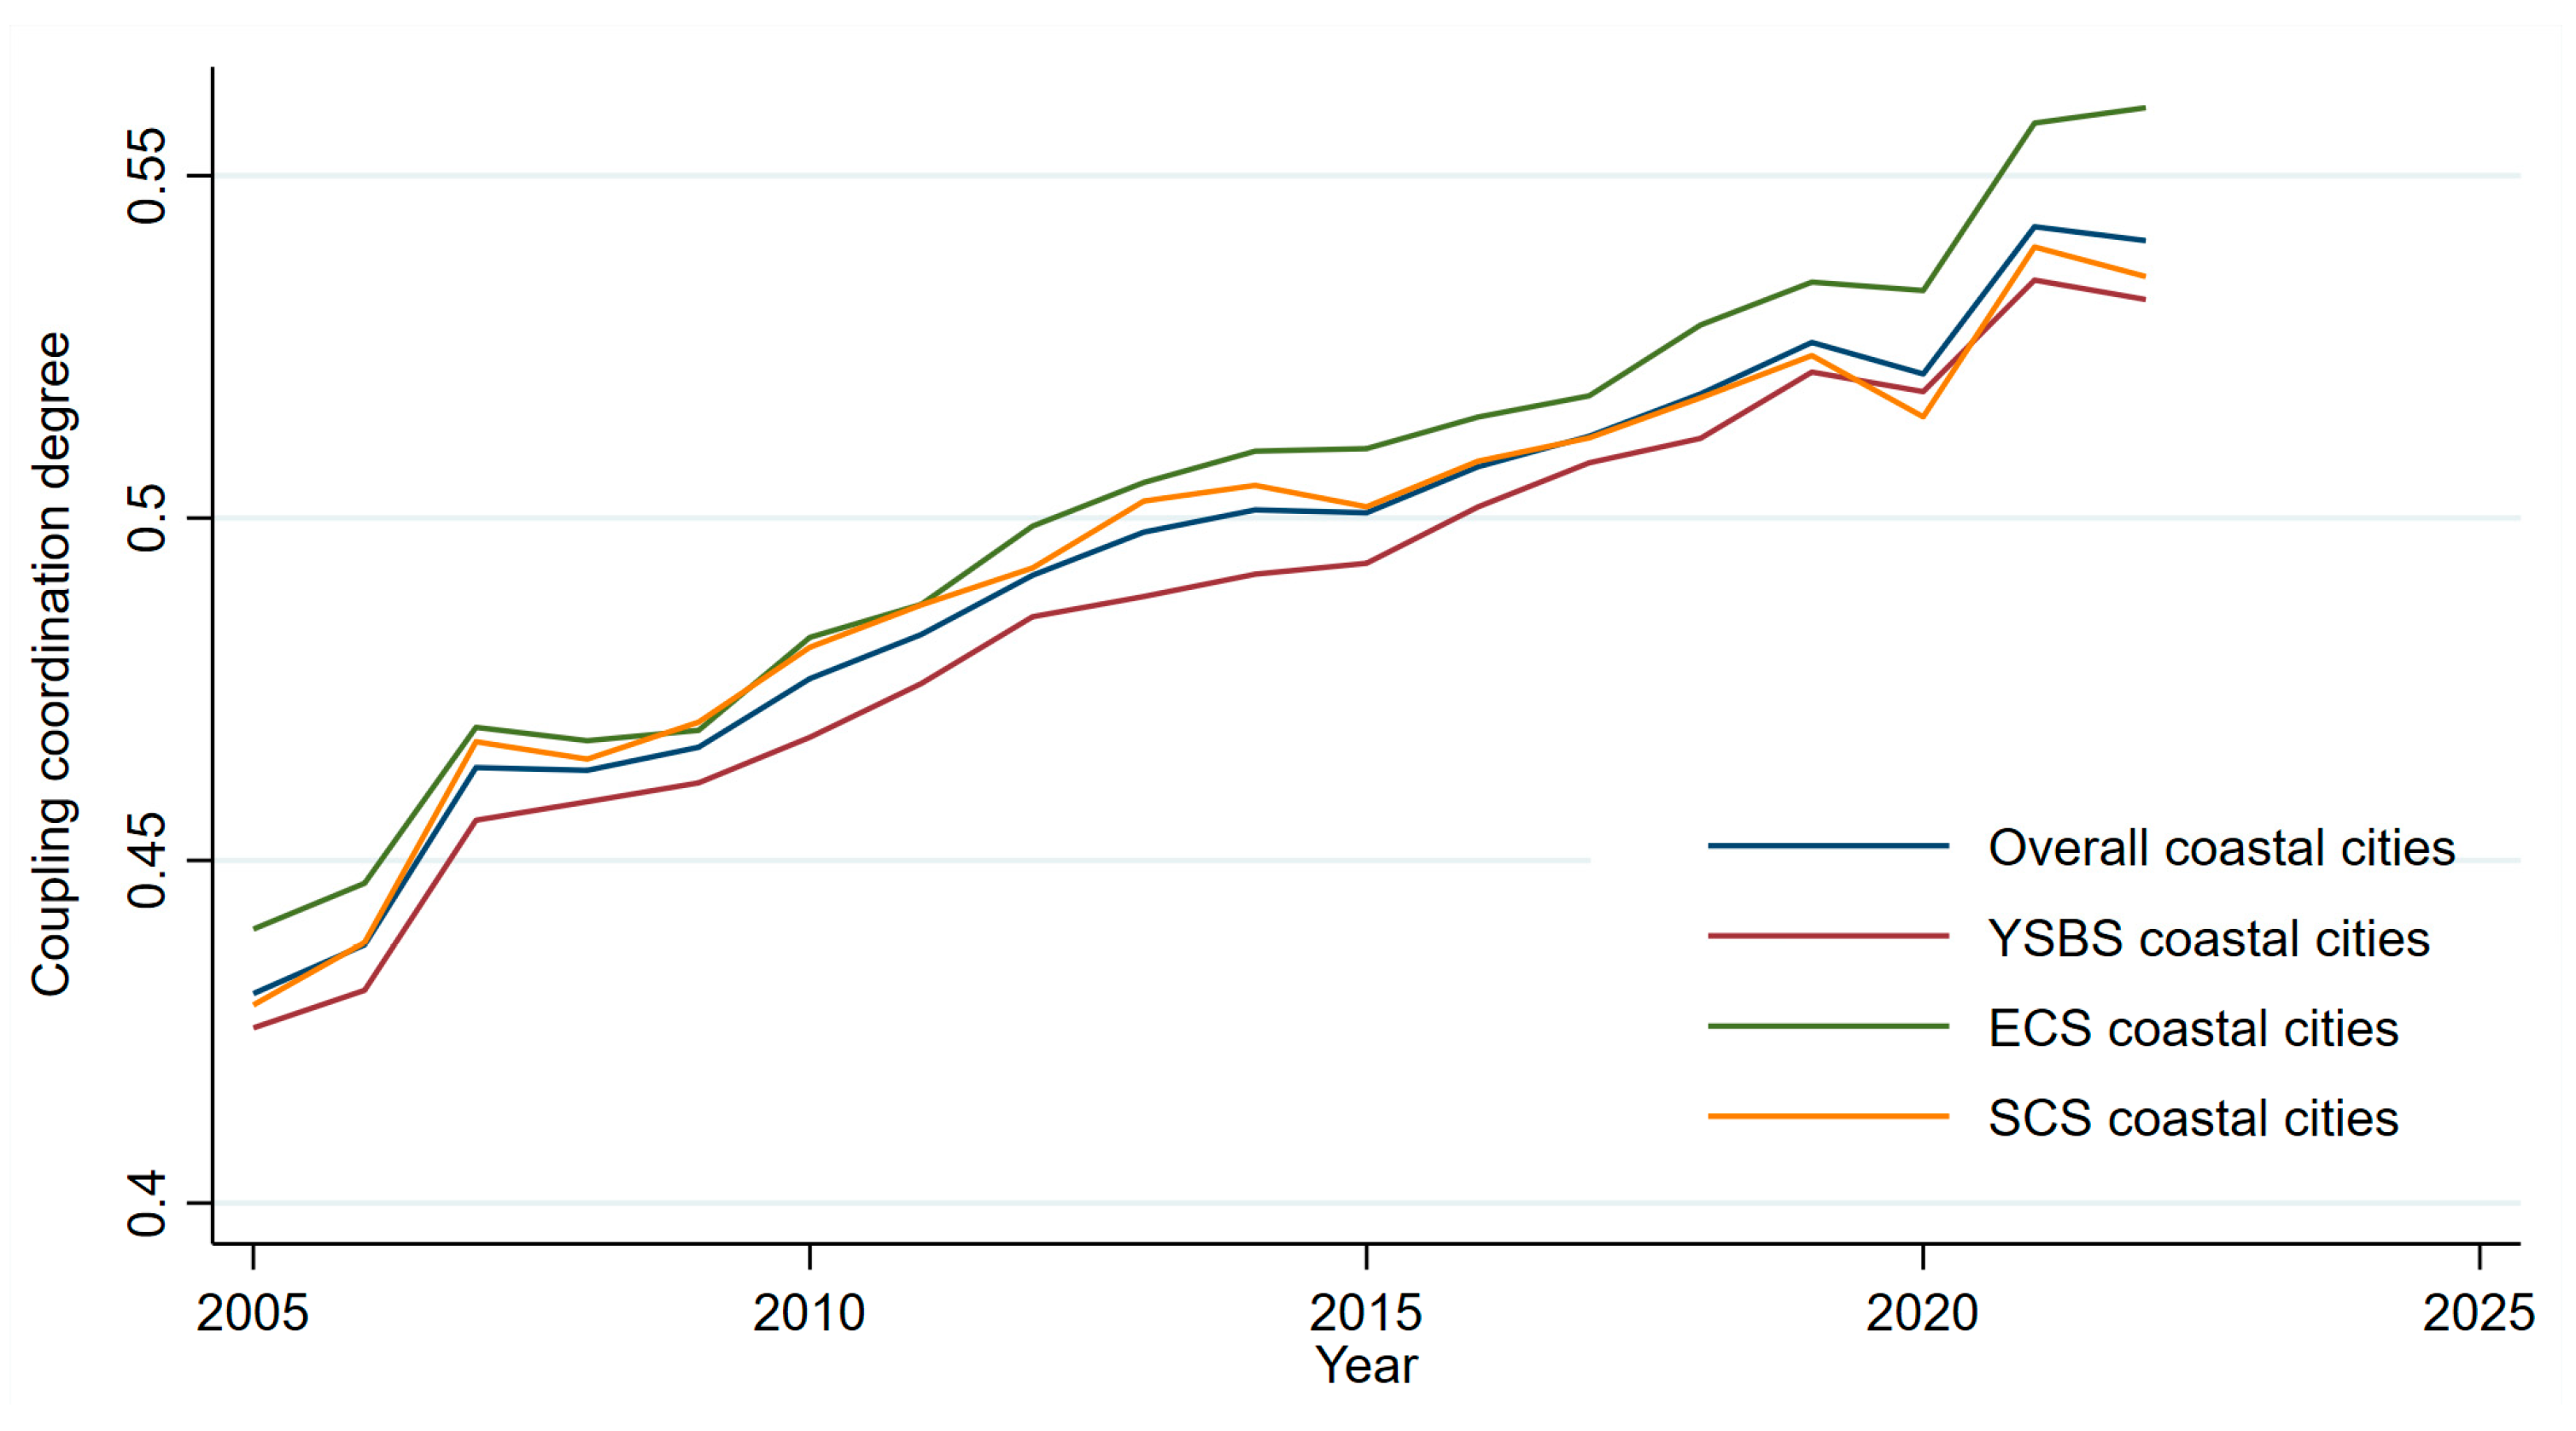
The CCD between ER and EcR in the YSBS, ECS, and SCS coastal cities exhibited a fluctuating upward trend. The ECS coastal cities consistently demonstrated the highest CCD levels, while the YSBS coastal cities remained at the lowest end (Figure 2).
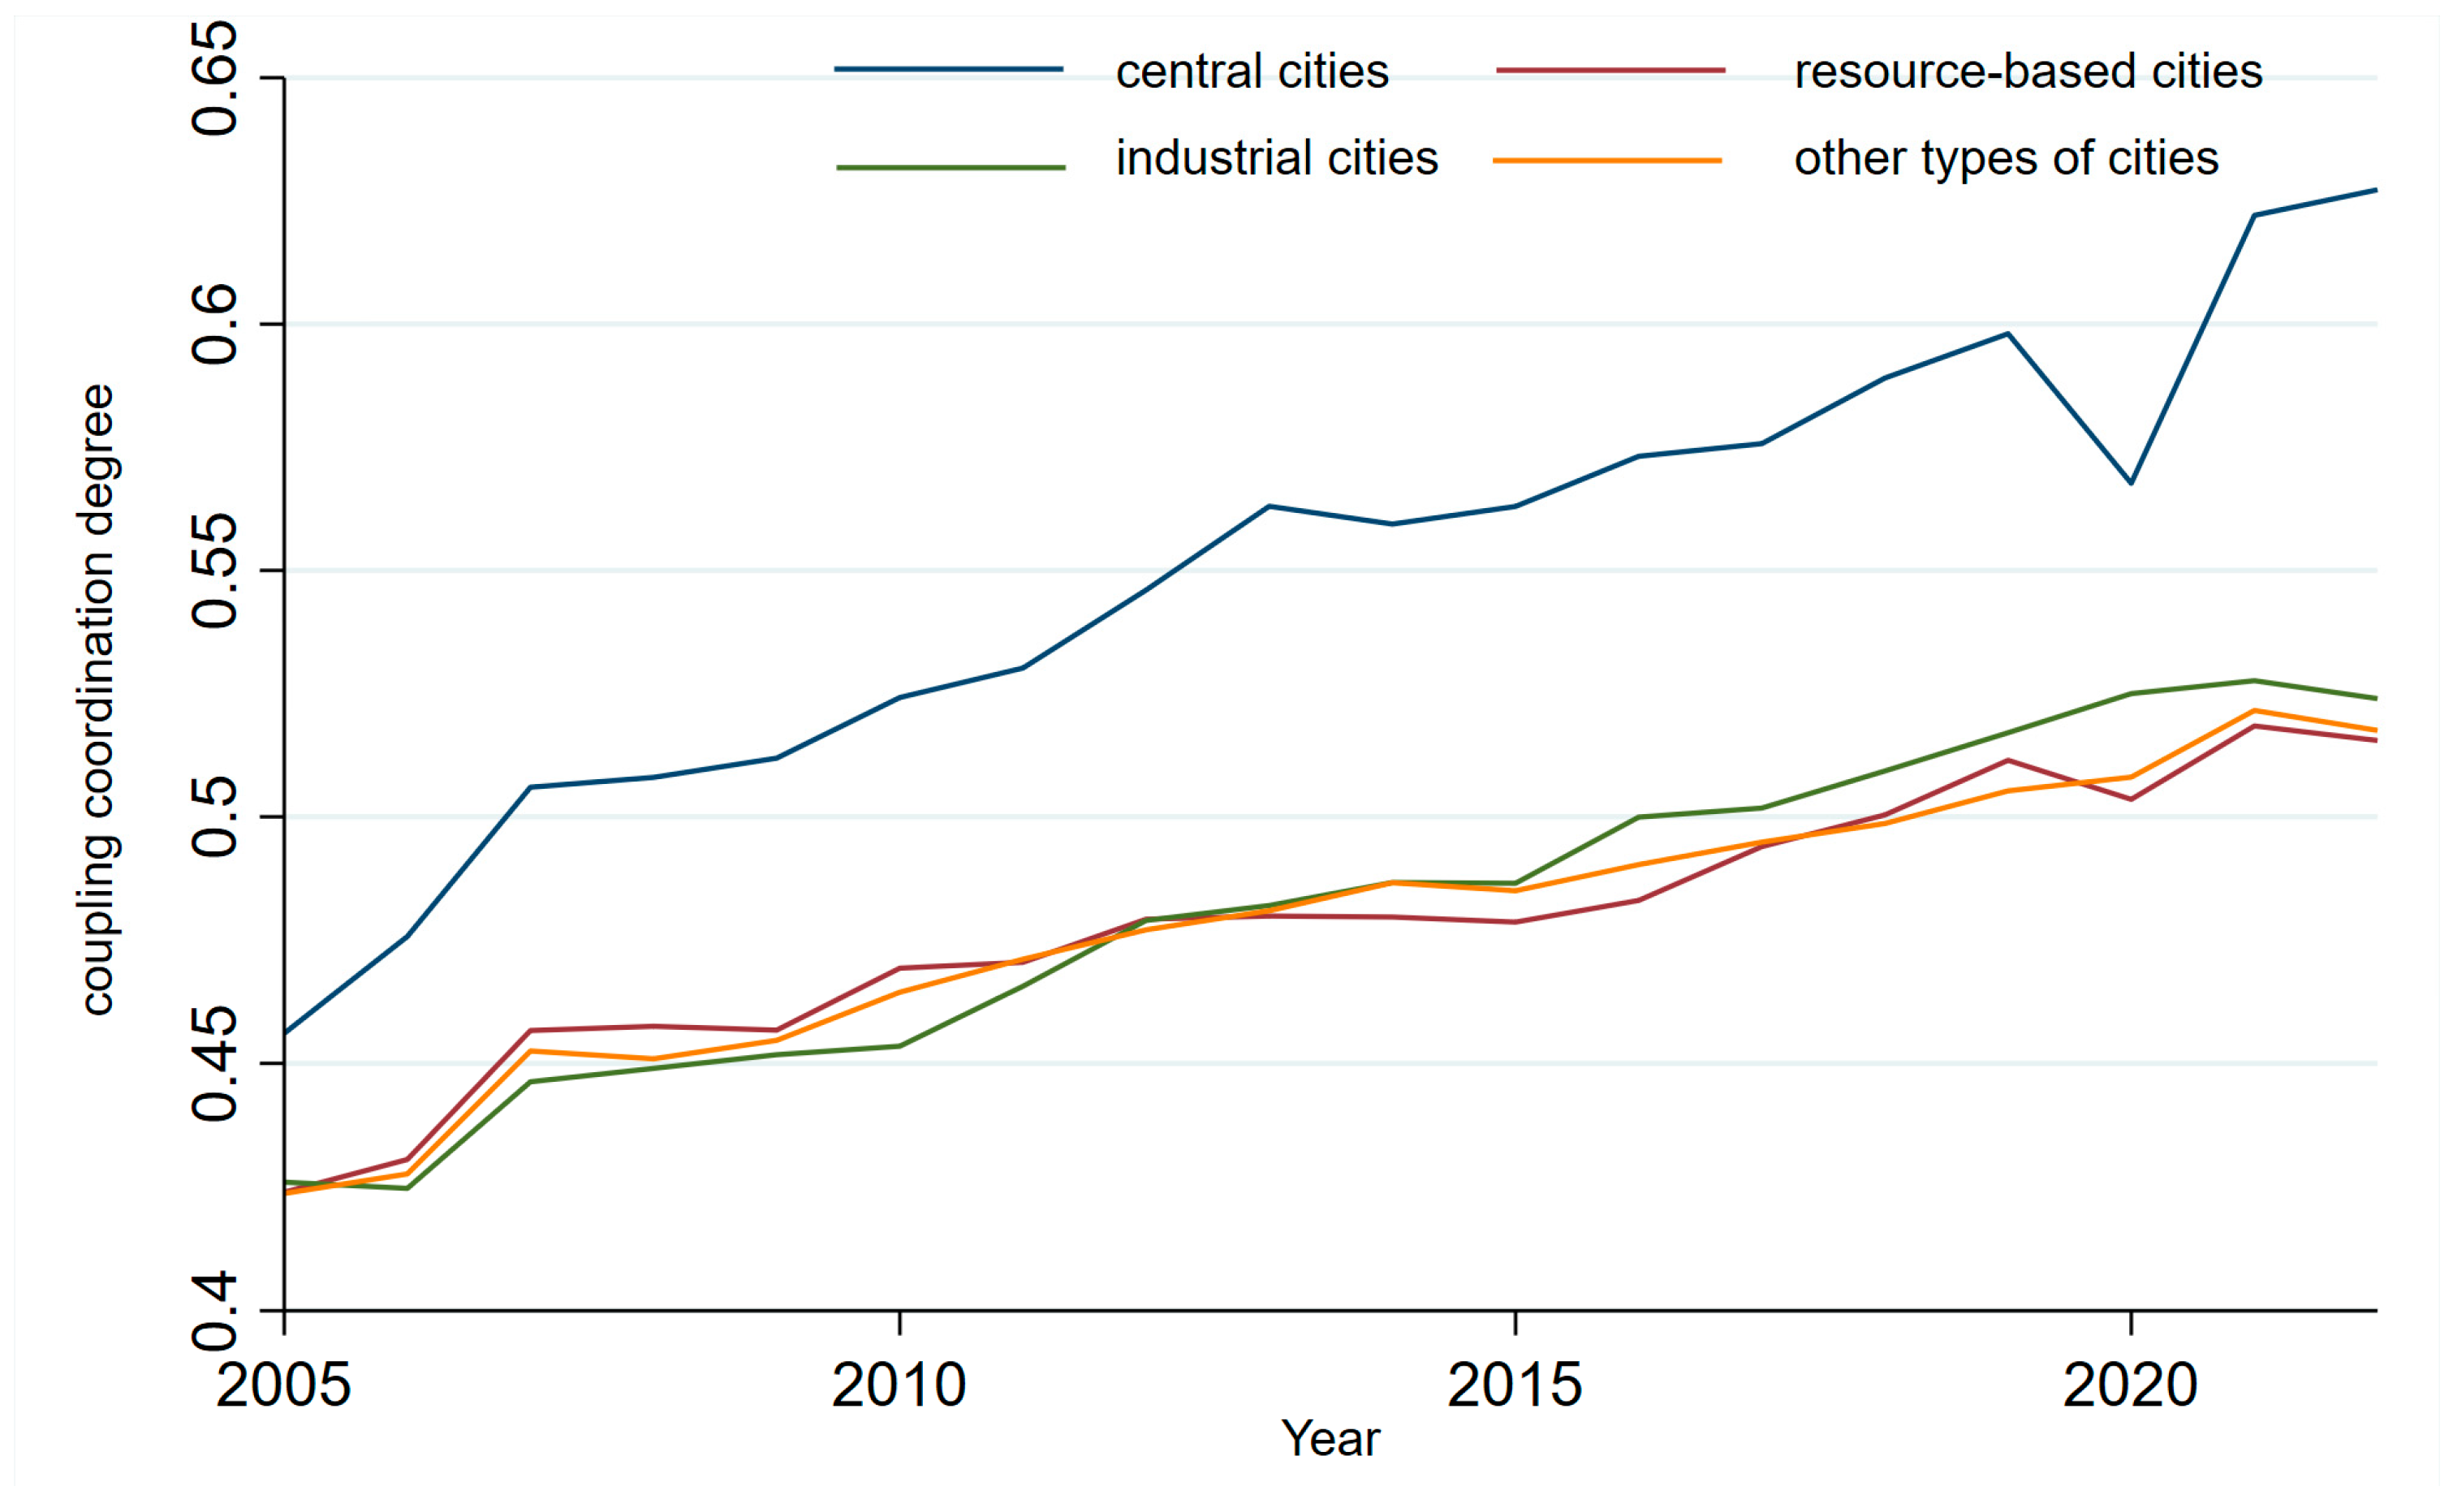
A fluctuating upward trend in CCD was observed across different city types, including central cities, industrial cities, resource-based cities, and other types of cities. Central cities consistently led in CCD between ER and EcR. Initially, industrial cities had the lowest CCD between ER and EcR among the four types of cities, but they surpassed both resource-based cities and other types of cities after 2015. Although the CCD between ER and EcR in resource-based cities has increased, it remained the lowest in 2022. The disparity in CCD across the four types of cities has continued to widen over time, mainly for the following reasons: central cities, relying on their advantages in factor agglomeration and strong capabilities in green transformation and restoration, have achieved rapid improvement of the synergy between ER and EcR; industrial cities, driven by industrial upgrading and green transformation, have experienced relatively fast growth in CCD between ER and EcR; resource-based cities and other types of cities, constrained by factors such as industrial path dependence, high costs of green transformation, and insufficient shock resistance, have a relatively slow pace of coordinated improvement between ER and EcR (Figure 3).

3.2. Spatial Distribution Characteristics

The raw data in this study cover the period 2005–2022, representing a relatively long time span. To ensure the identification of long-term evolutionary trends while avoiding redundant results and reduced readability caused by year-by-year analysis, this study adopts a time-section sampling approach to segment the study period. Specifically, taking 2005–2022 as the overall research interval, the time dimension is divided into approximately equal intervals, with 2005, 2011, 2017, and 2022 selected as representative key years. These years correspond to the initial, early–middle, middle–late, and final stages of the study period, respectively.

3.2.1. Overall Coastal Cities

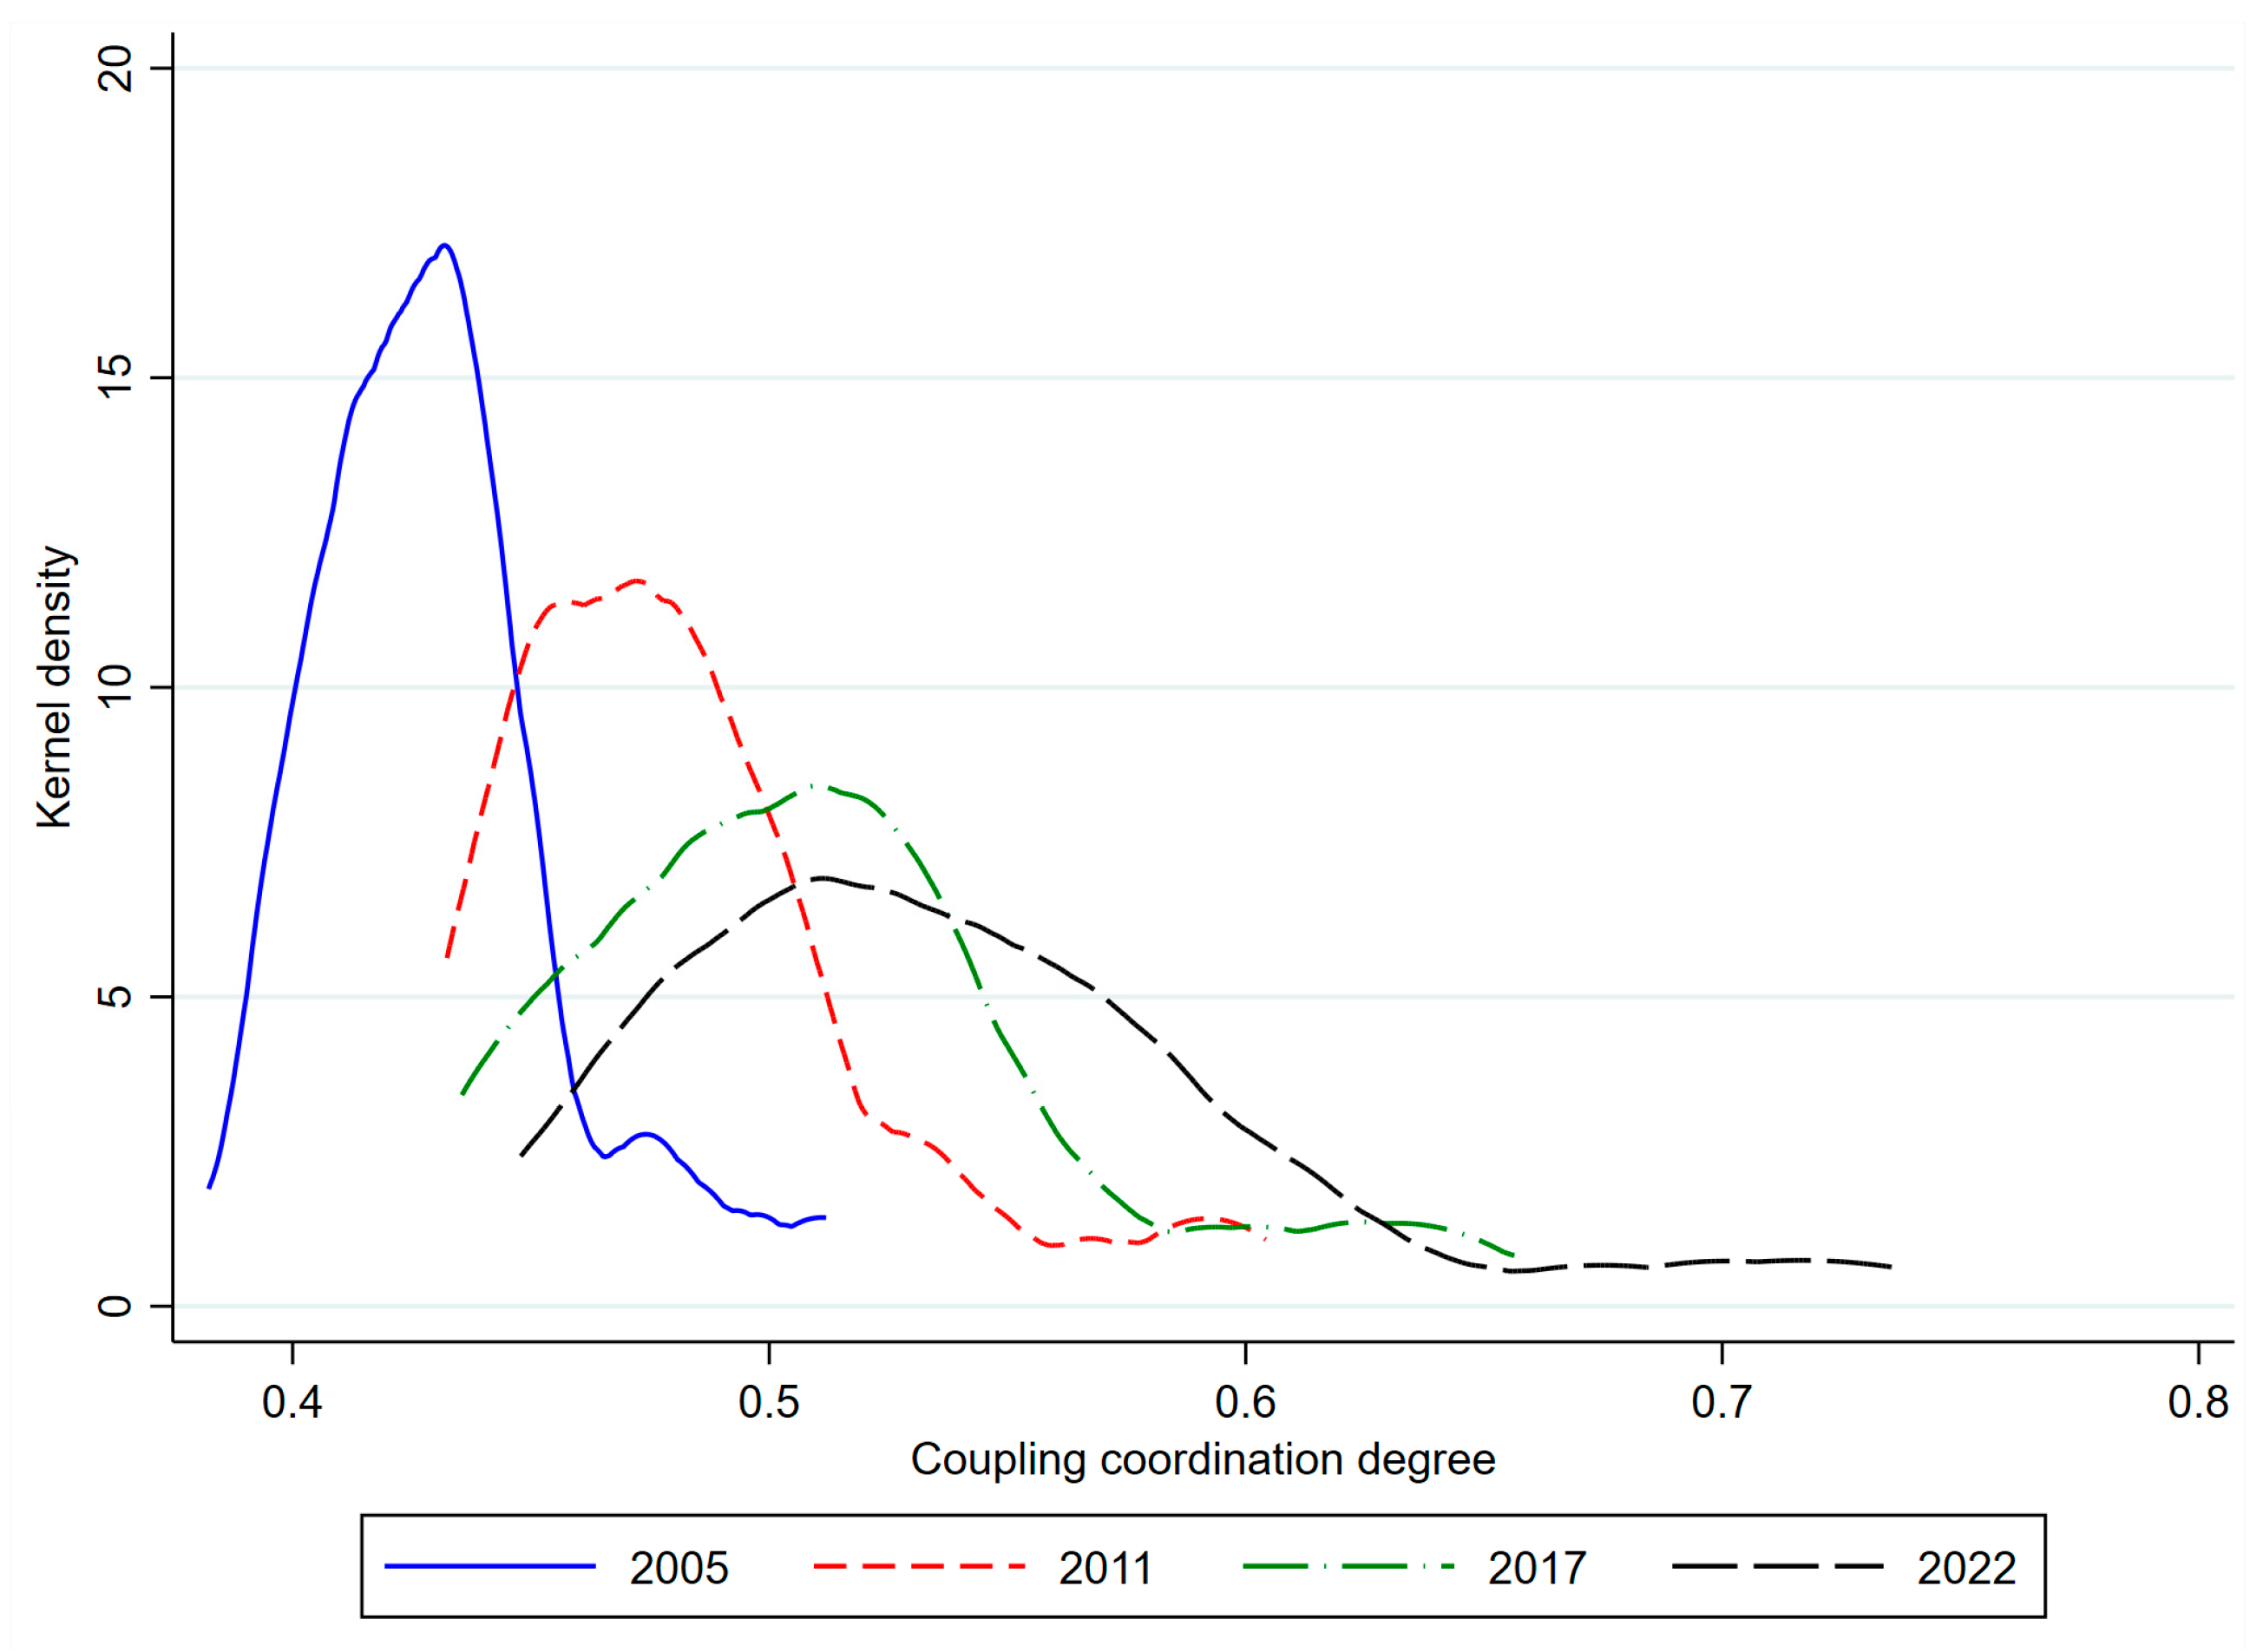
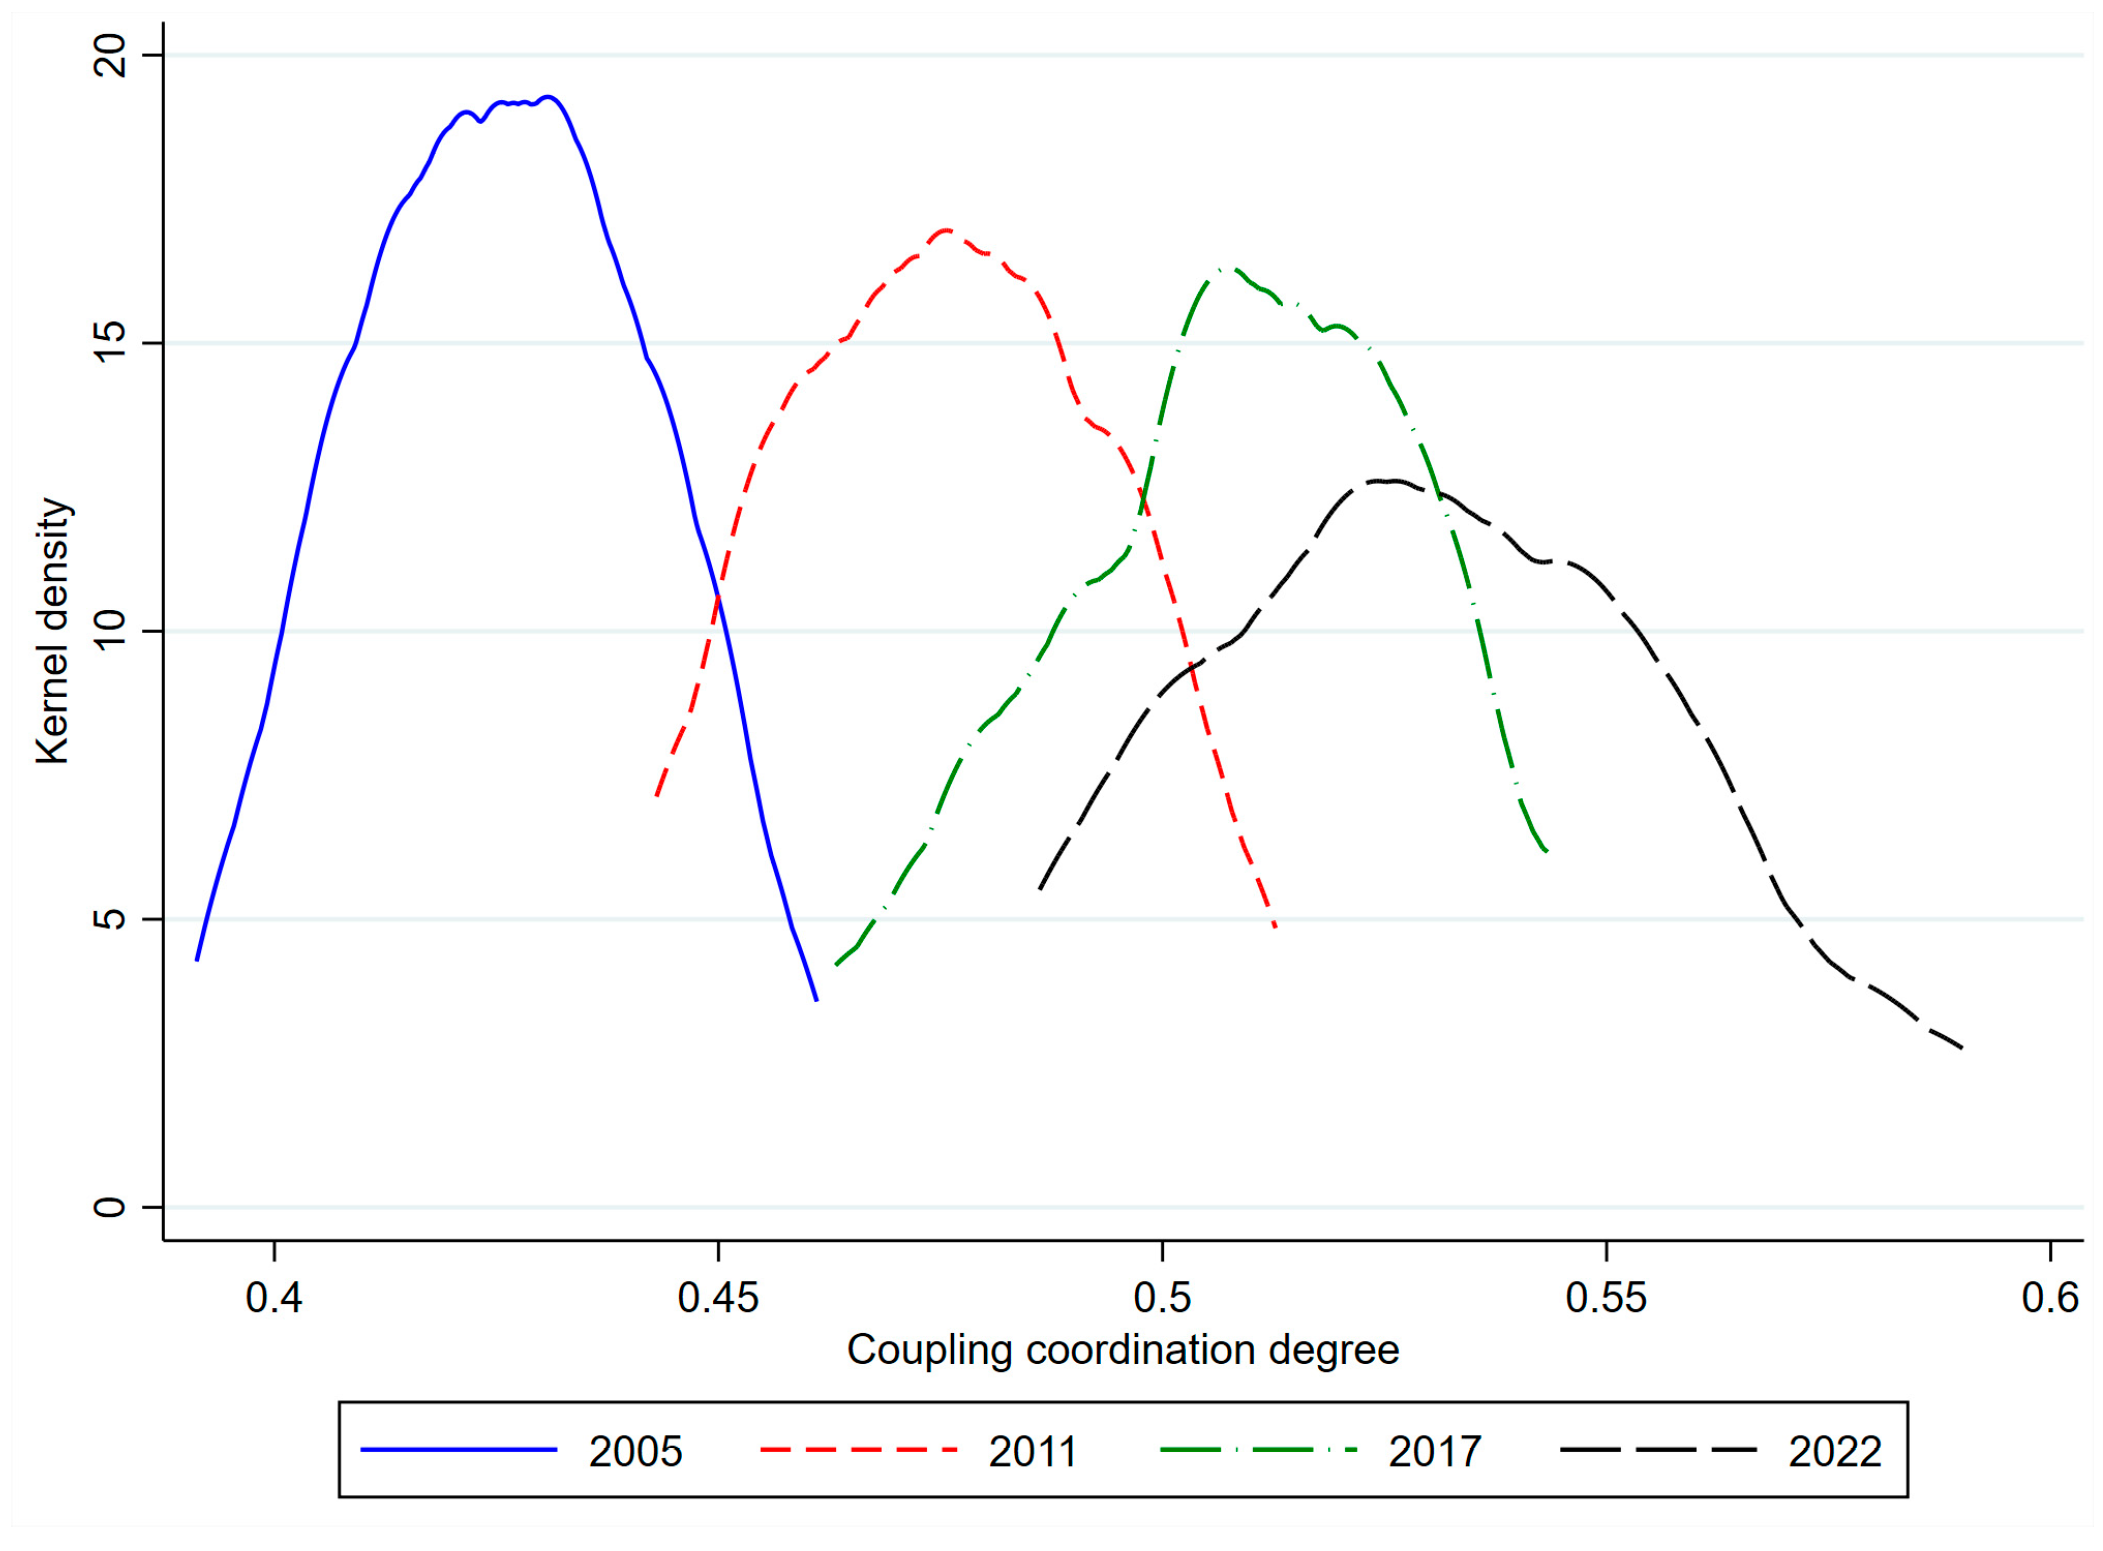
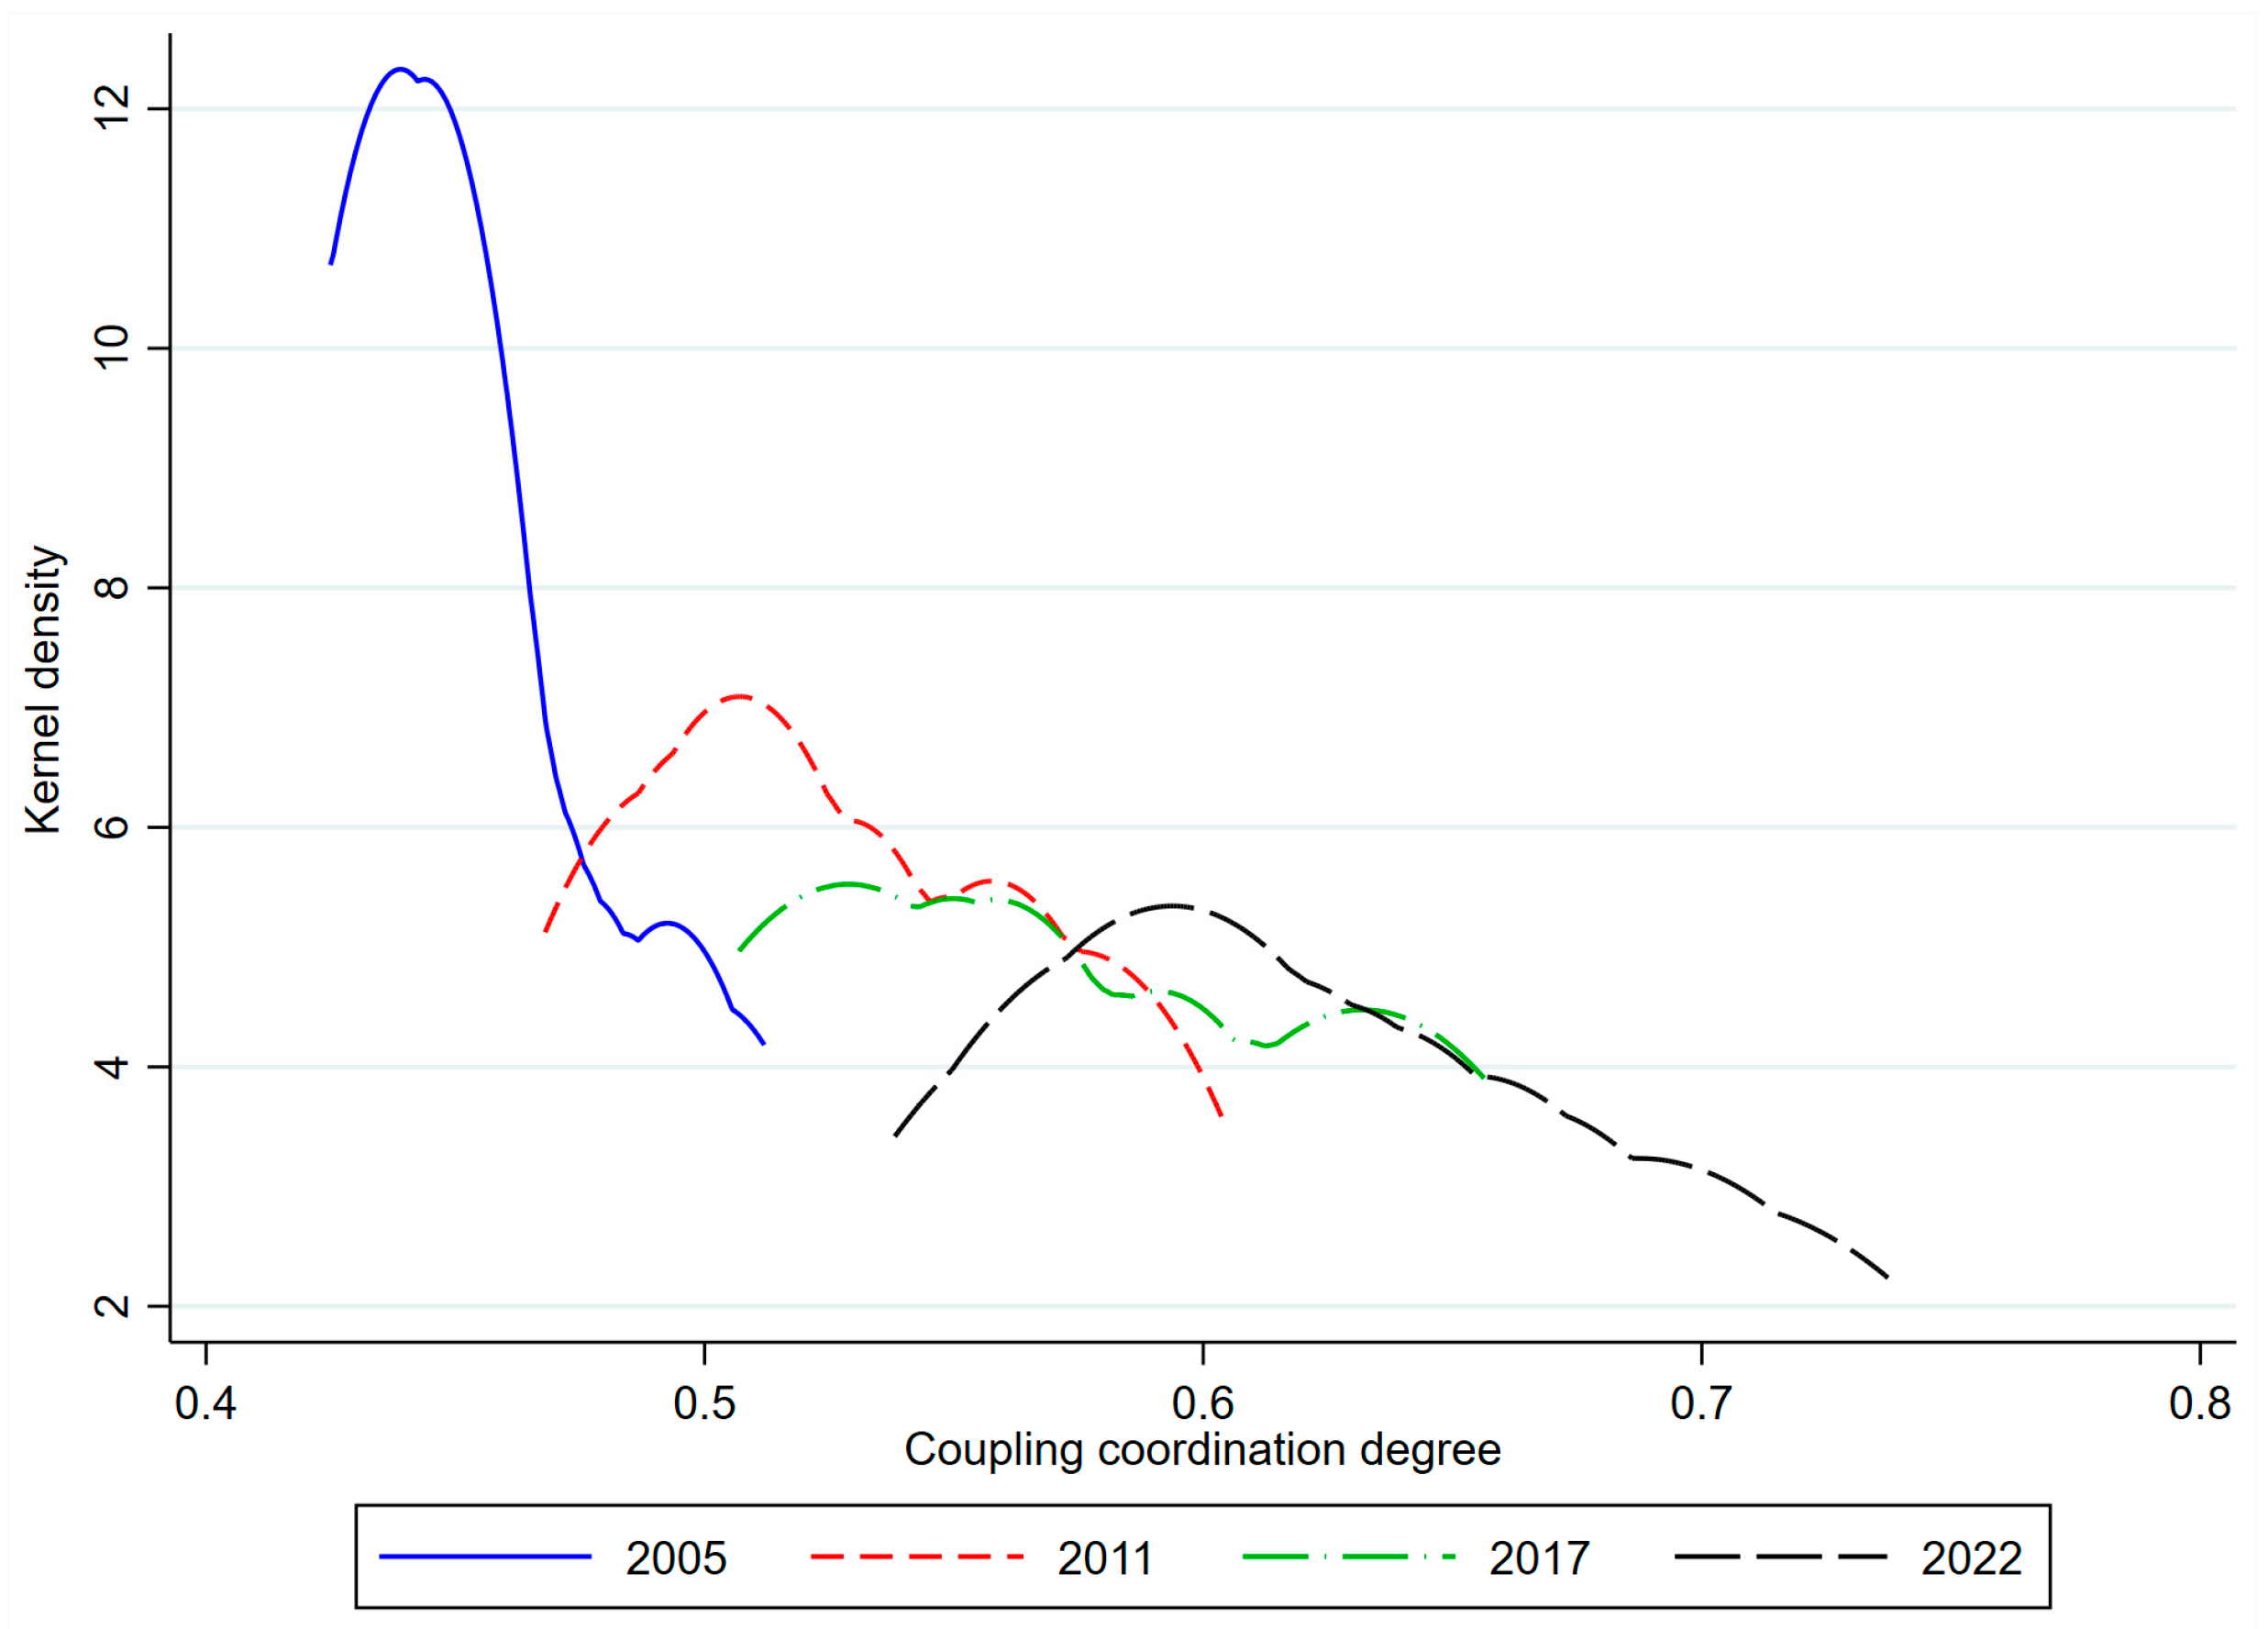
Stata 16 is a statistical analysis software package, and it is capable of analyzing panel data. The data used in this study are panel data of 53 coastal cities from 2005 to 2022. Stata 16 has robust support for panel data and is well-established in the application of kernel density estimation; the kernel density estimation curves plotted using Stata 16 are standardized and rigorous. The KD curves of CCD between ER and EcR for overall coastal cities were plotted using Stata 16 (Figure 4). In 2005, the main body of the curve peak was positioned toward the left, indicating a low CCD. After 2005, the curve shifted rightward, reflecting an upward trend in CCD. From 2005 to 2022, the main peak height decreased while the width expanded and curve gradually became flatter—signaling increasing intercity disparities in CCD. The main reason for this is that the disparities among coastal cities in terms of industrial transformation capacity, factor agglomeration level, and ecological governance effectiveness have been continuously accumulating, with the improvement rate of CCD in core cities being significantly faster than that in other cities. Right-trailing phenomena were observed to varying degrees from 2005 to 2022. After 2011, the tailing became more divergent, indicating a growing divergence between extreme and average CCD values.

3.2.2. Different Types of Cities

1
Cities divided by geographical location of the sea
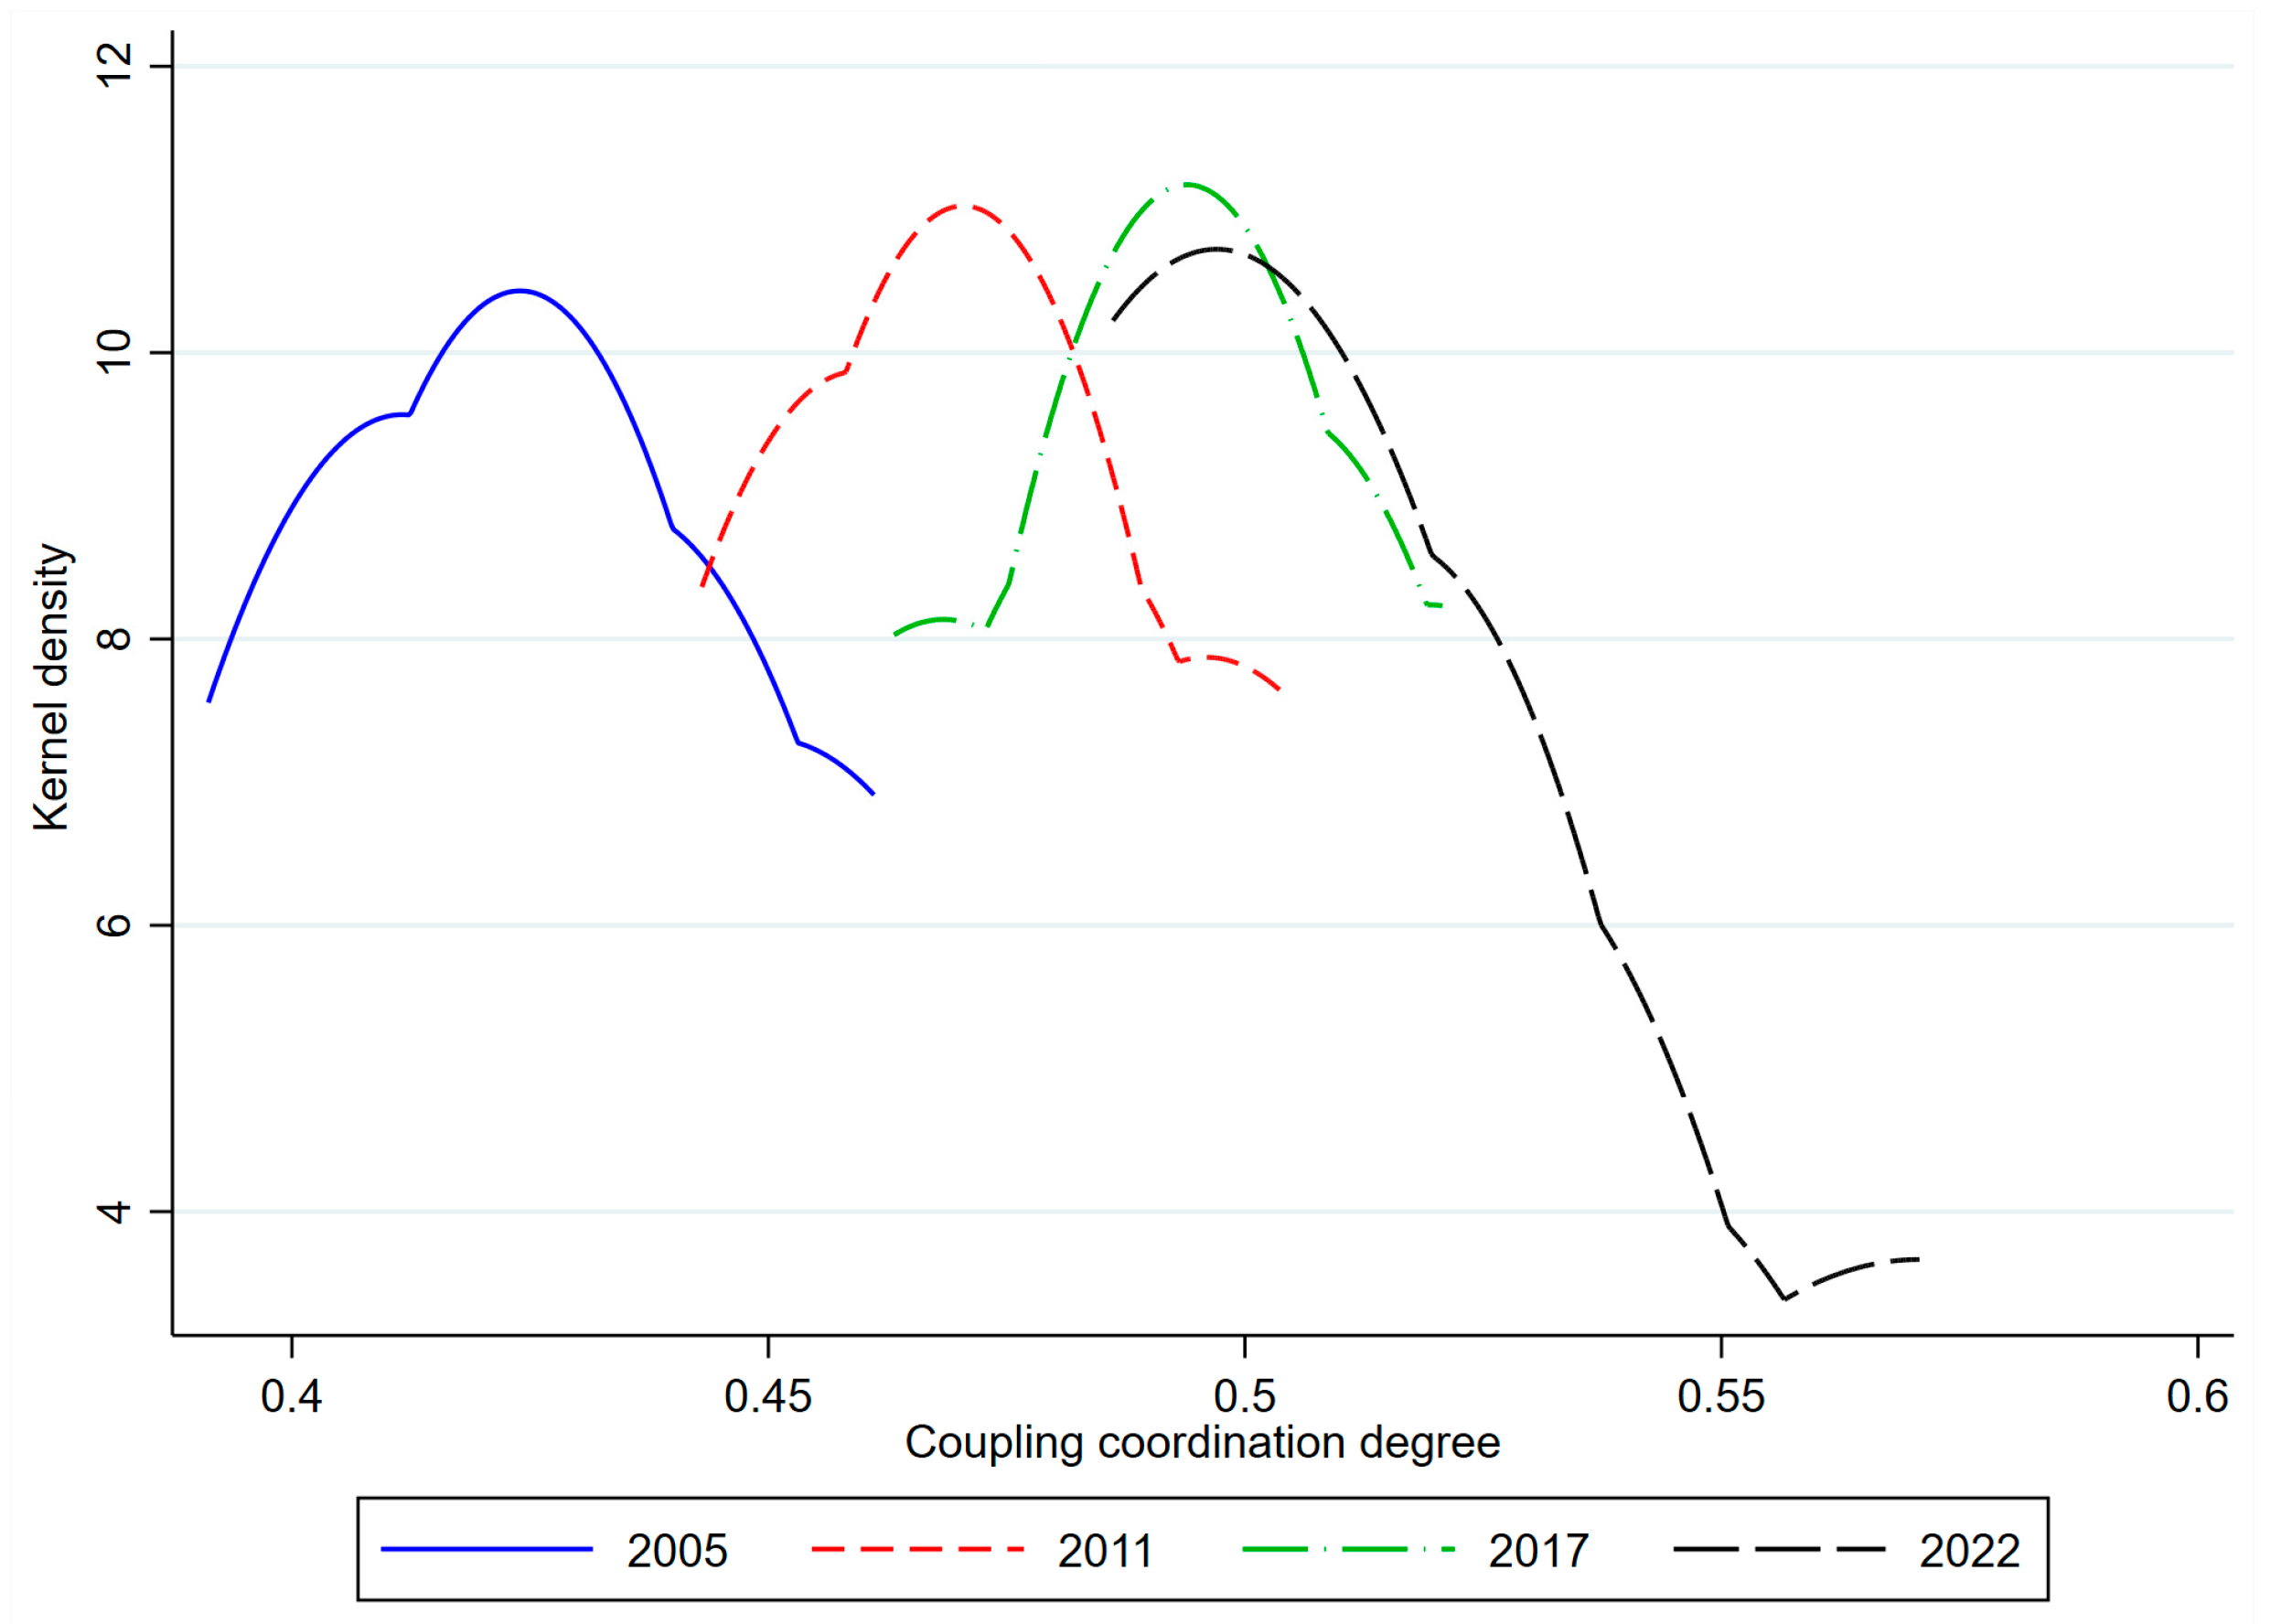
In 2005, the KD curve of CCD between ER and EcR in YSBS coastal cities exhibited a left-skewed primary peak. After 2005, the curve shifted rightward, indicating a general upward trend in CCD. Between 2005 and 2022, the curve’s main peak declined in height and broadened, suggesting an increasing disparity in CCD in YSBS coastal cities. The absence of a pronounced right-trailing section implies a relatively small difference between the mean and extreme CCD values. After 2005, the curve transitioned from a single peak to three peaks. In 2022, the three-peak shape became pronounced, with greater separation and height of the left- and right-side peaks, signaling the emergence of a strong multi-polarization phenomenon in CCD (Figure 5).
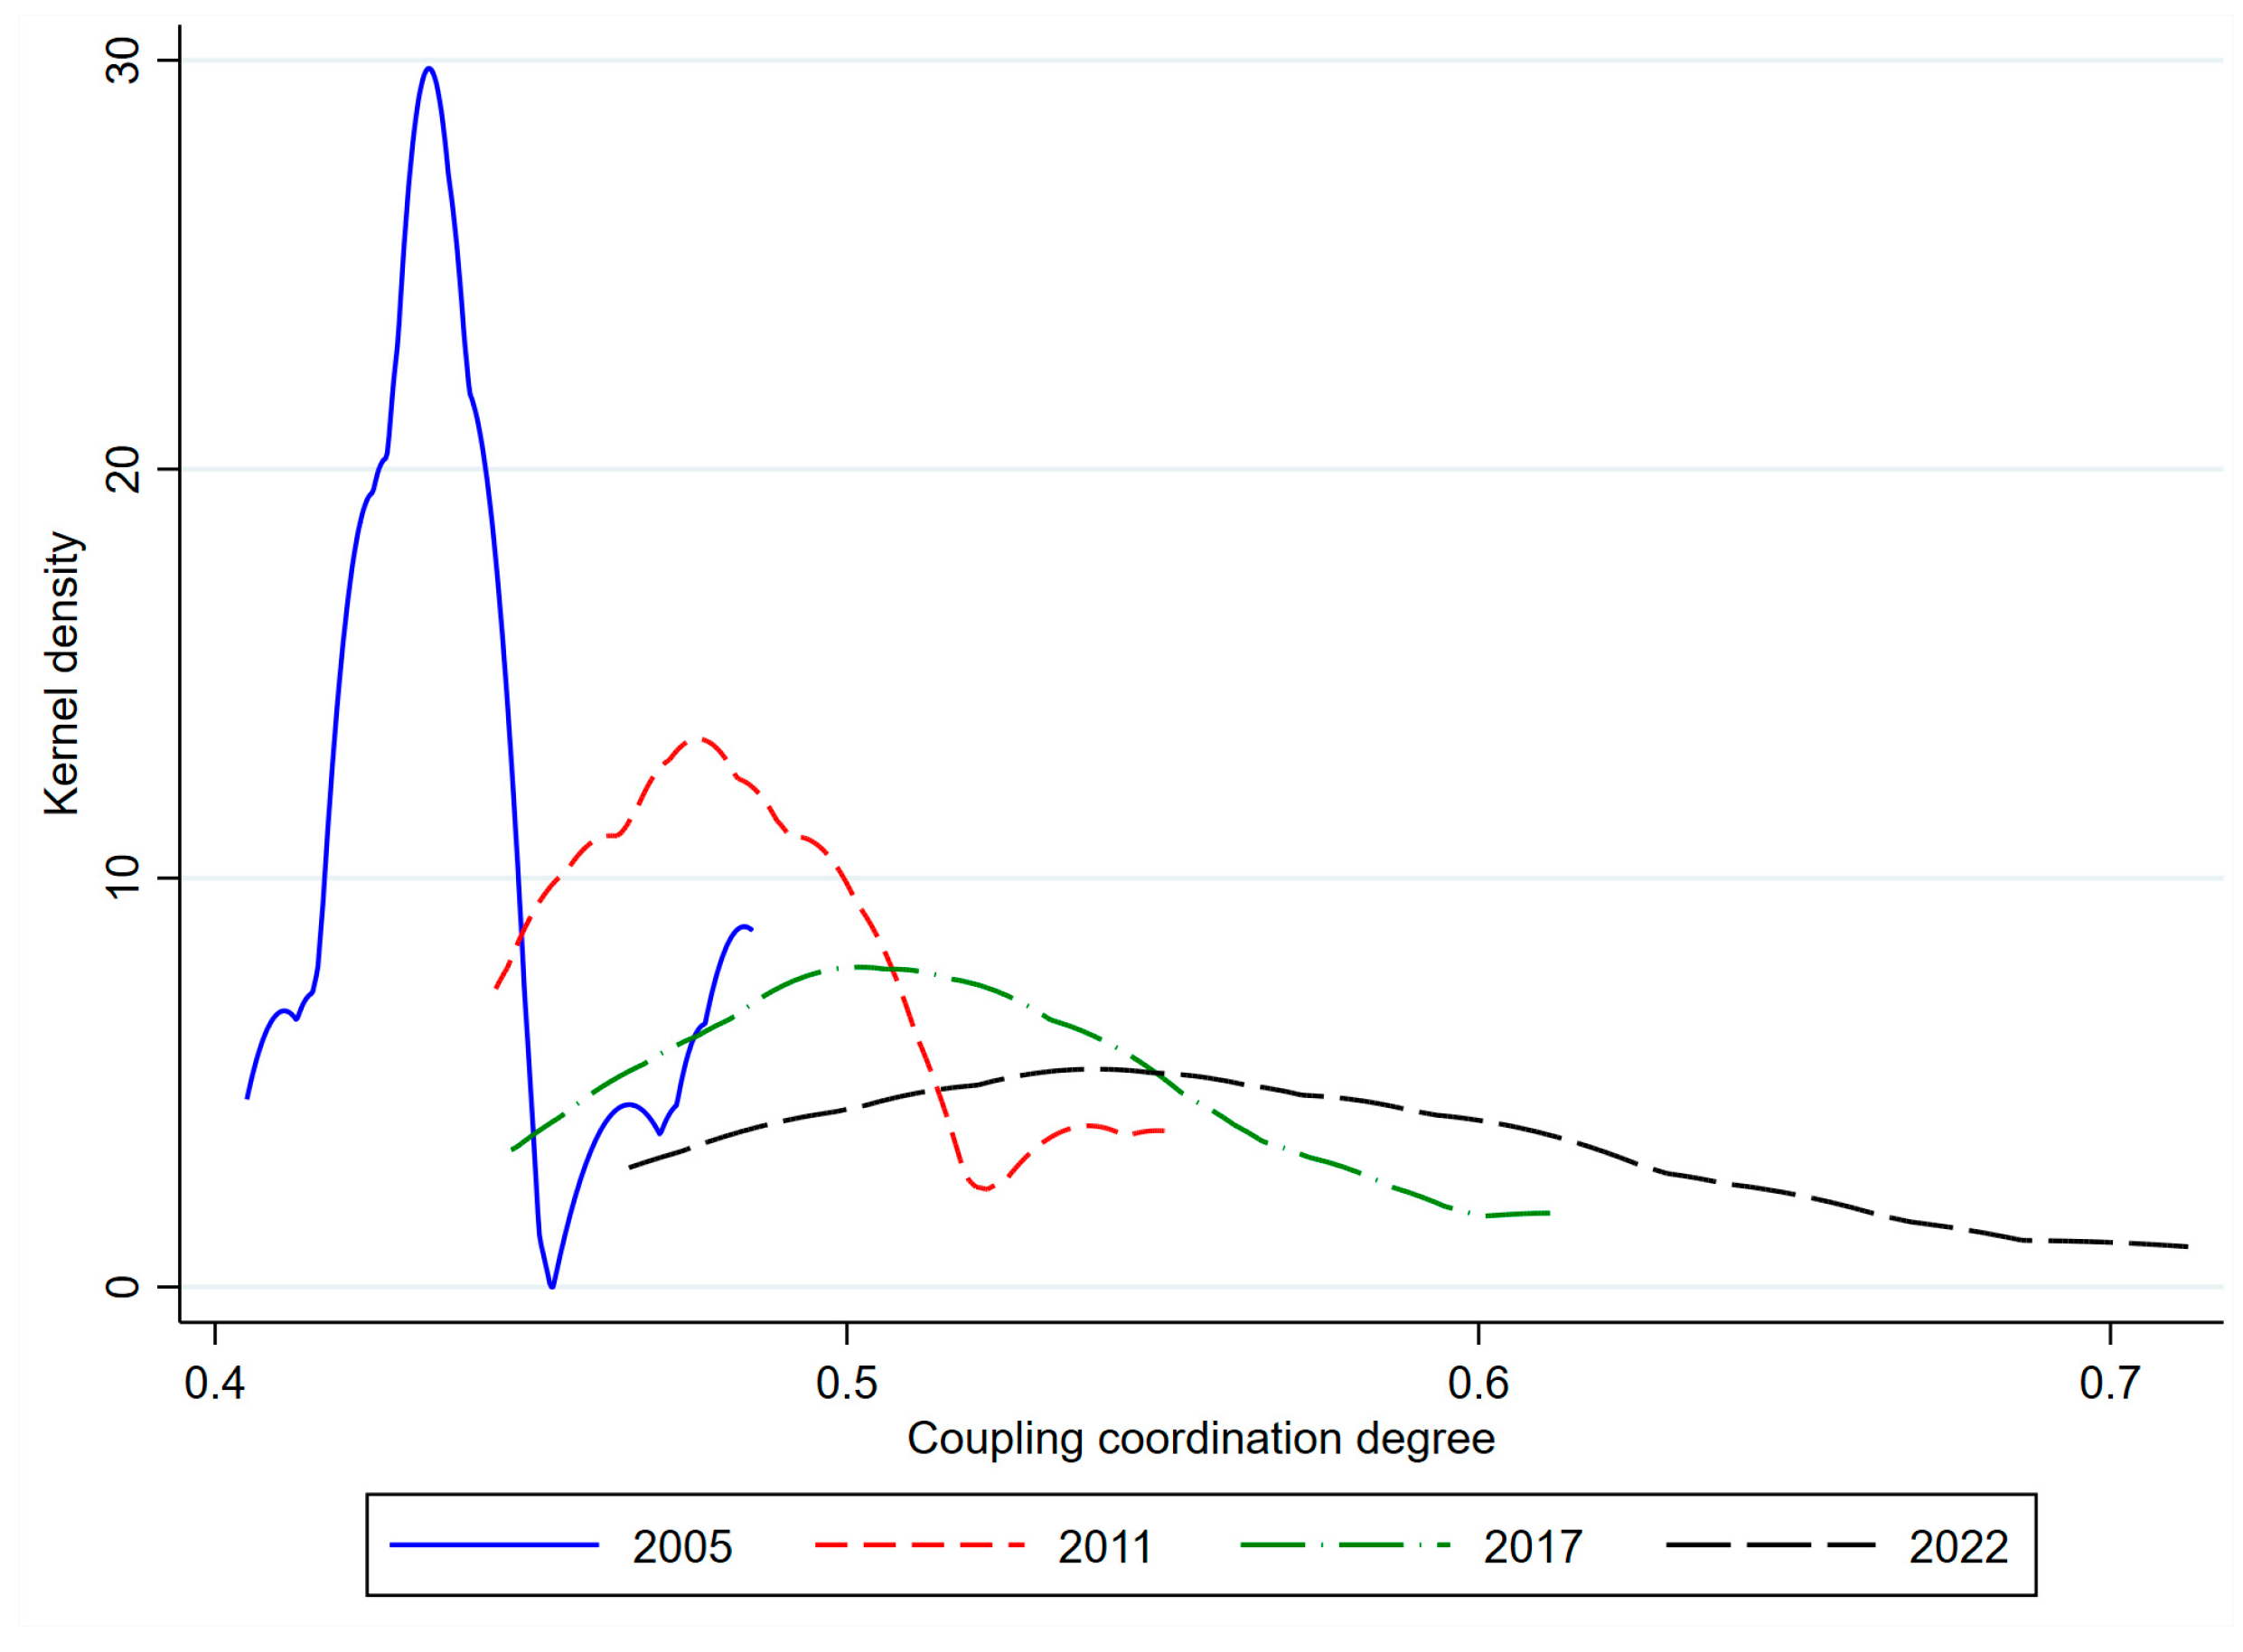
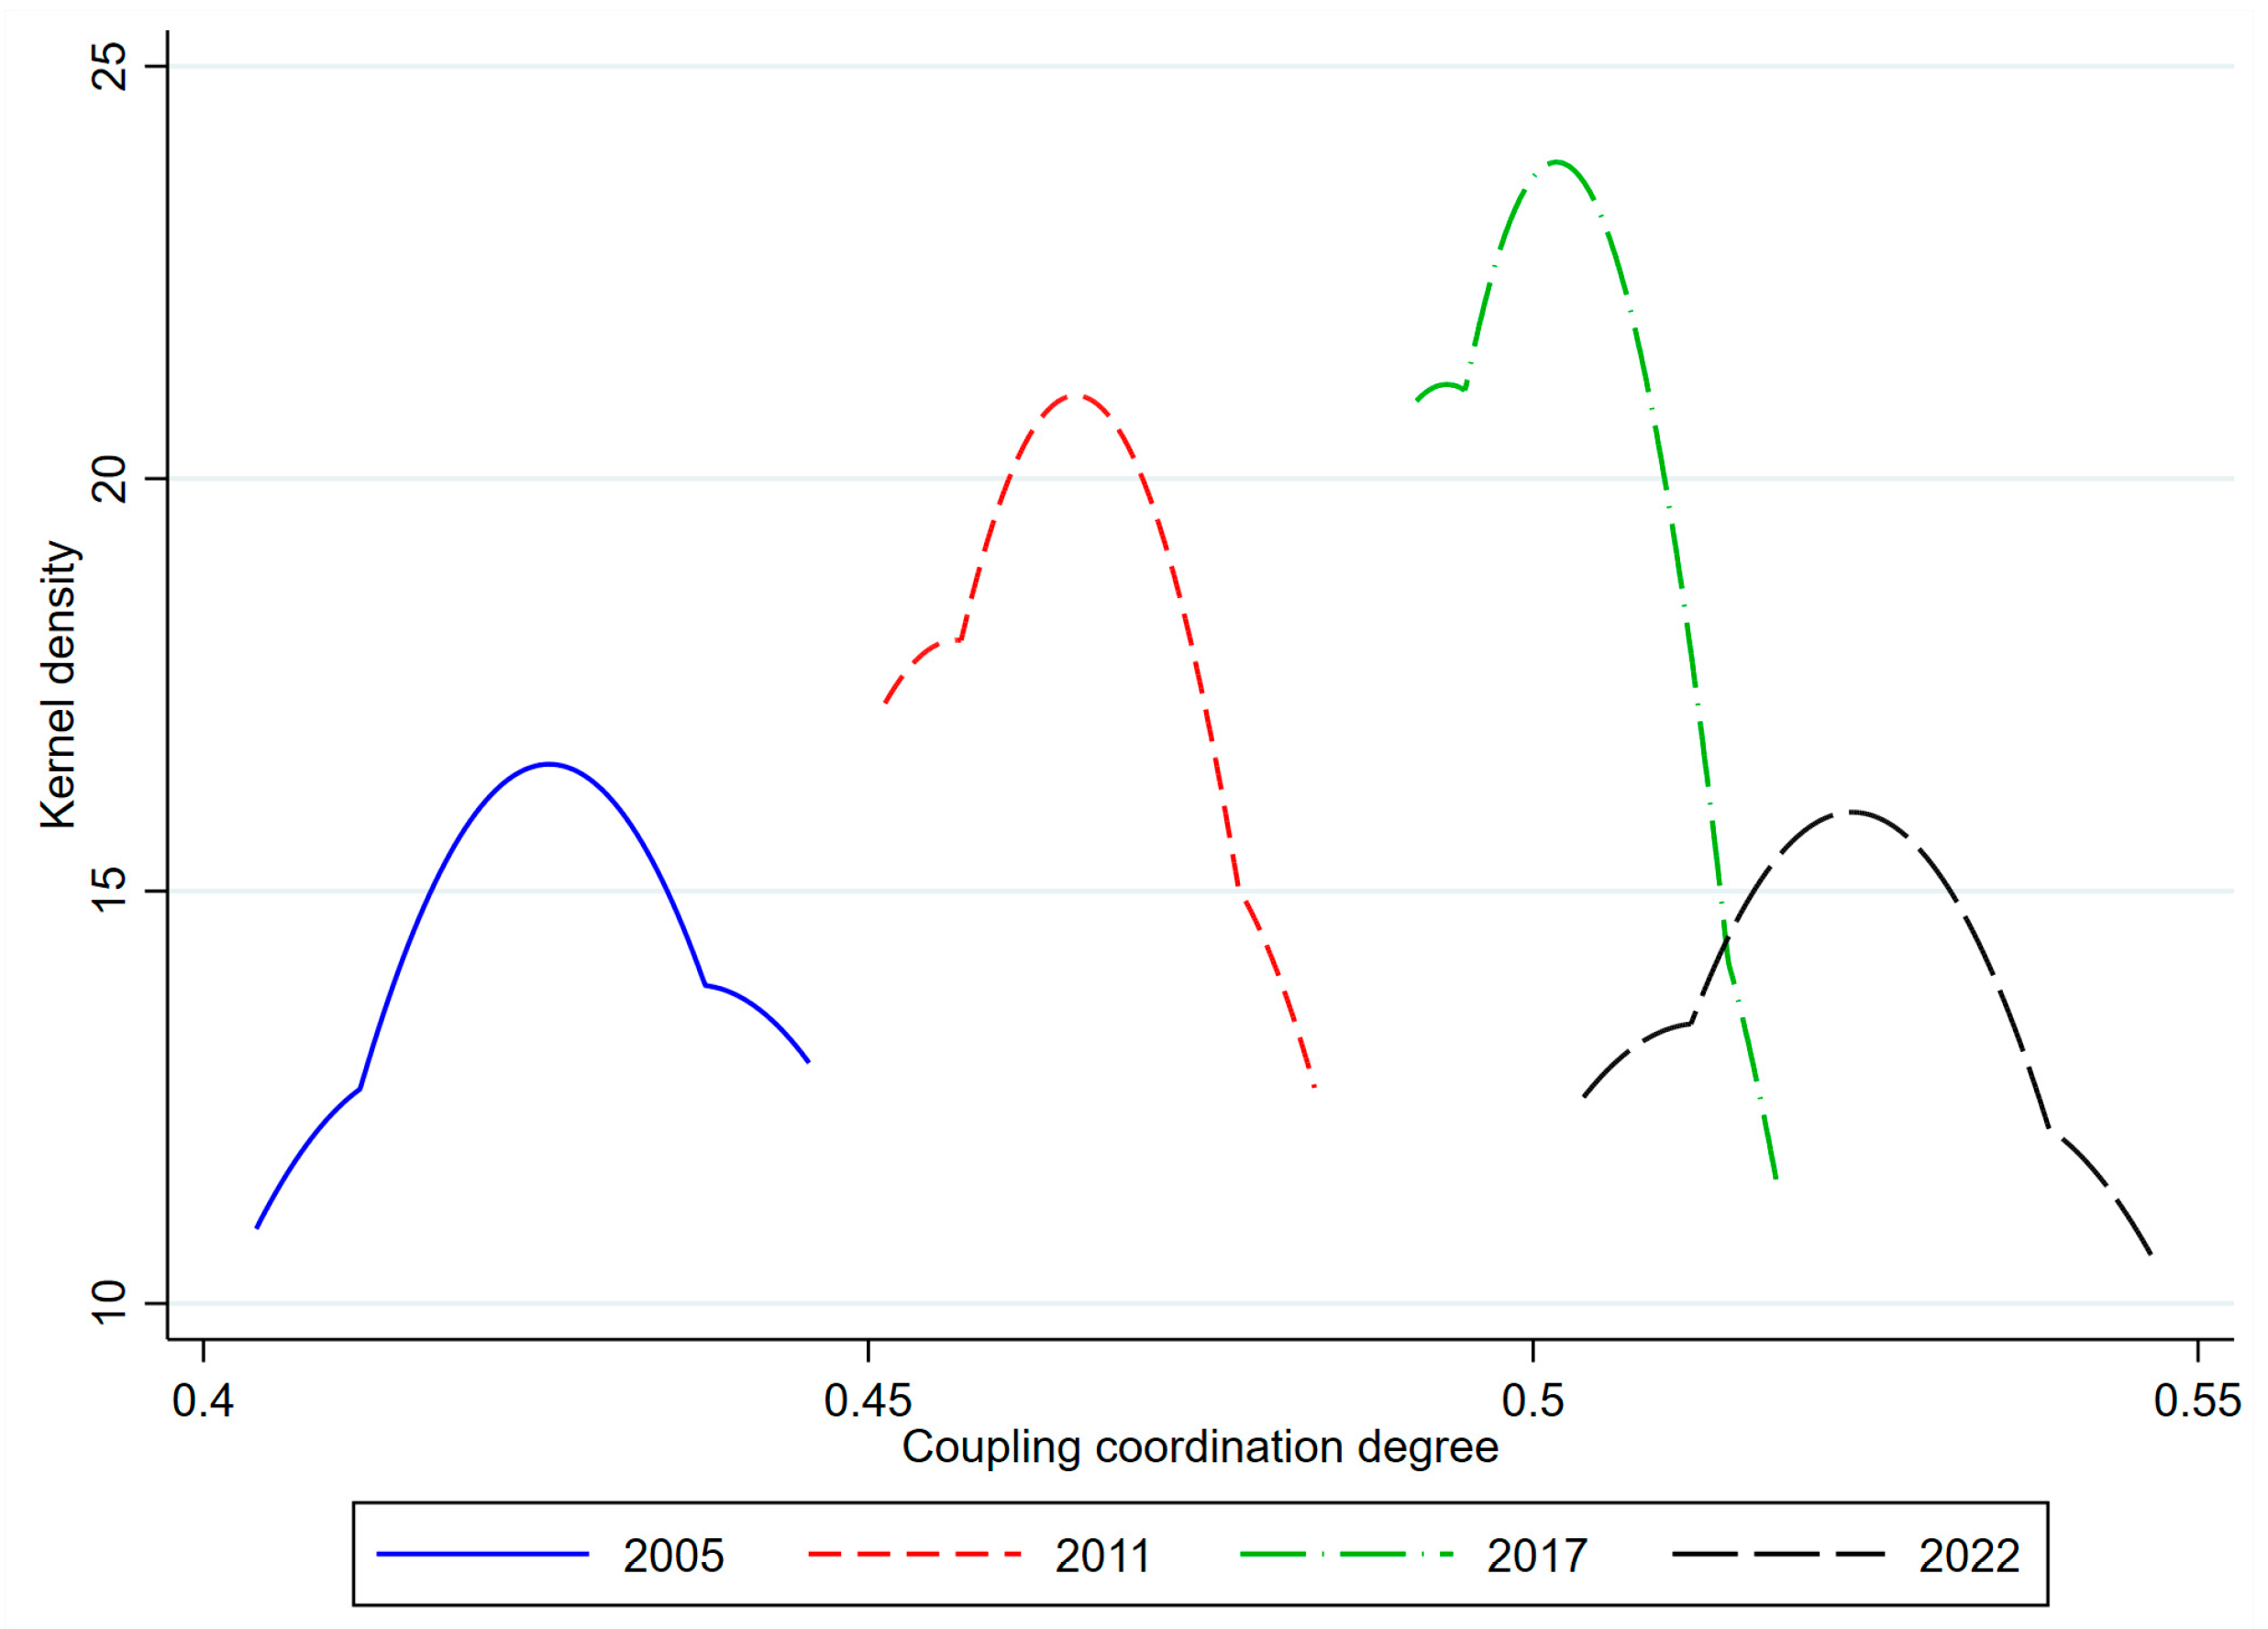
In 2005, the KD curve of CCD between ER and EcR in ECS coastal cities displayed a left-skewed peak. Following 2005, the curve shifted rightward, reflecting a rising CCD trend. From 2005 to 2011, the primary peak declined the most and broadened most significantly in the ECS coastal cities, indicating that the gap of CCD among these cities expanded the most significantly. The main reasons are as follows: core cities, relying on their export-oriented economies and advantages in factor agglomeration, have taken the lead in achieving the coordinated improvement of ER and EcR. In contrast, some traditional manufacturing cities have faced intensifying ecological constraints and lagged green transformation, leading to a significant divergence in the improvement rate of CCD among cities. By 2022, the curve had flattened considerably, signifying a persistently large gap in CCD across these cities. Post-2011, the curve developed a pronounced right-tailing and divergent characteristic, highlighting a growing divergence between mean and extreme CCD values. While a bimodal shape was evident in 2005, it gradually transitioned to a single peak after 2011, suggesting a weakening multi-polarization phenomenon (Figure 6).
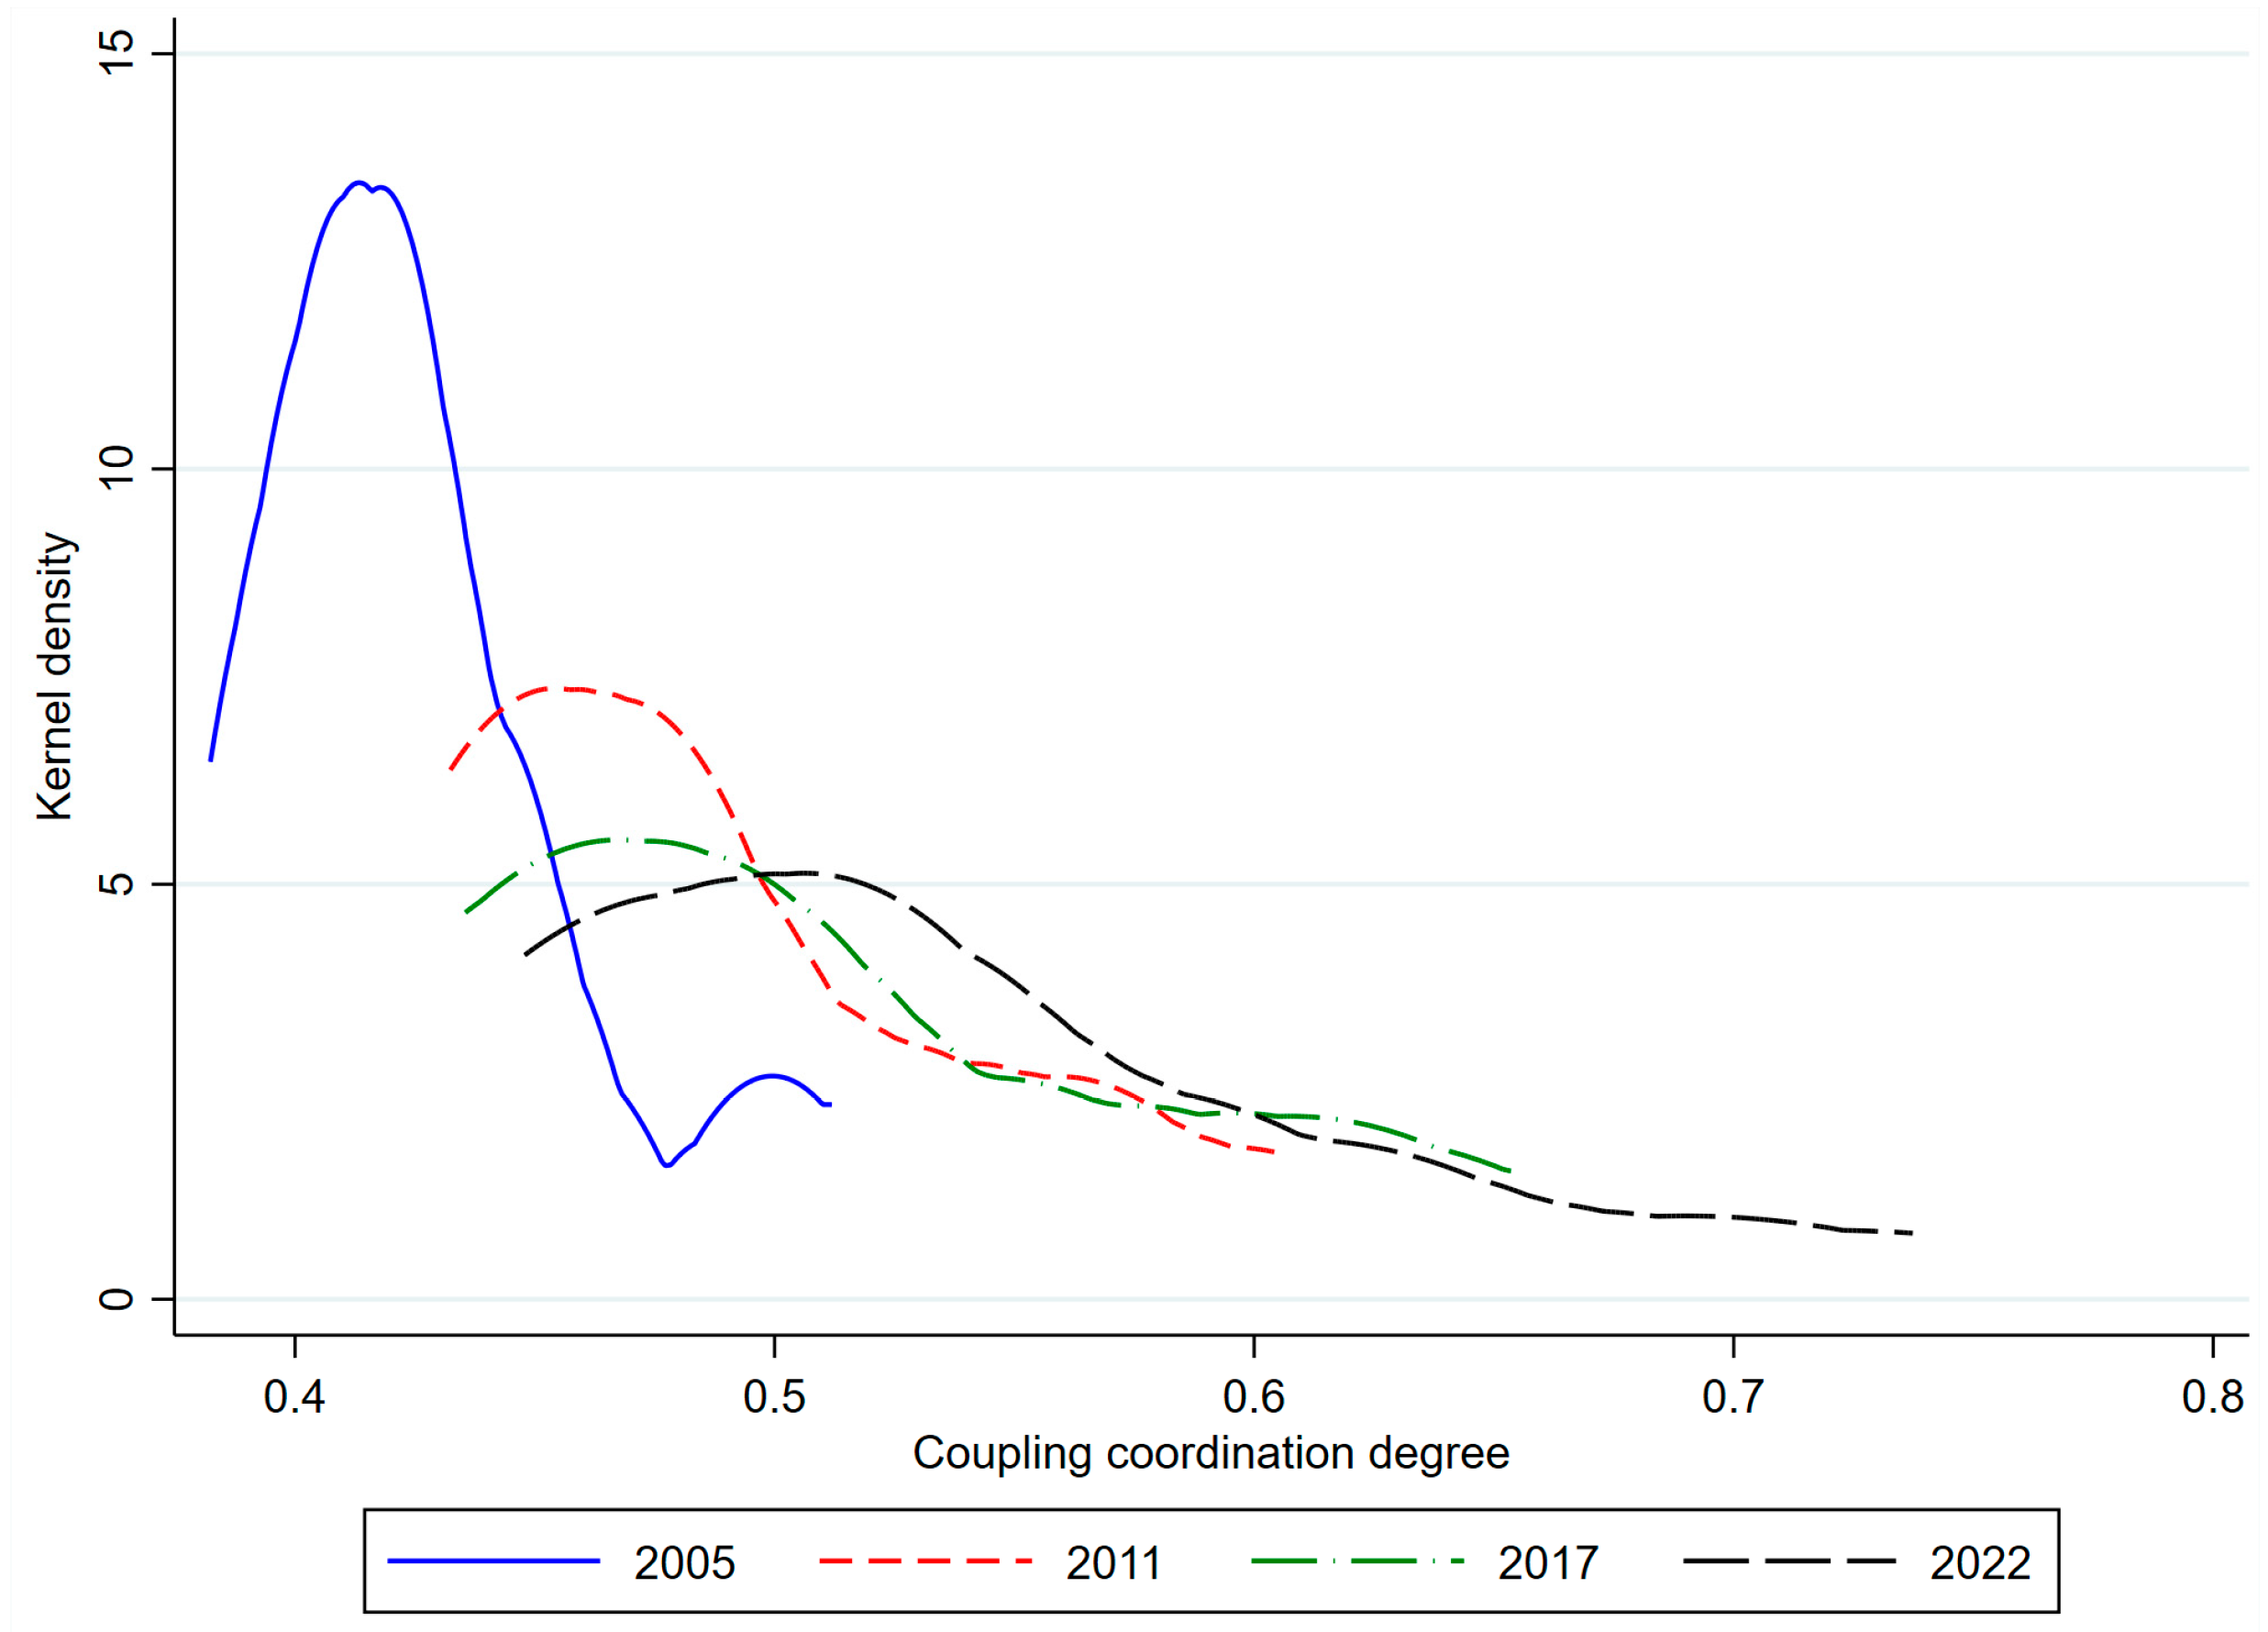
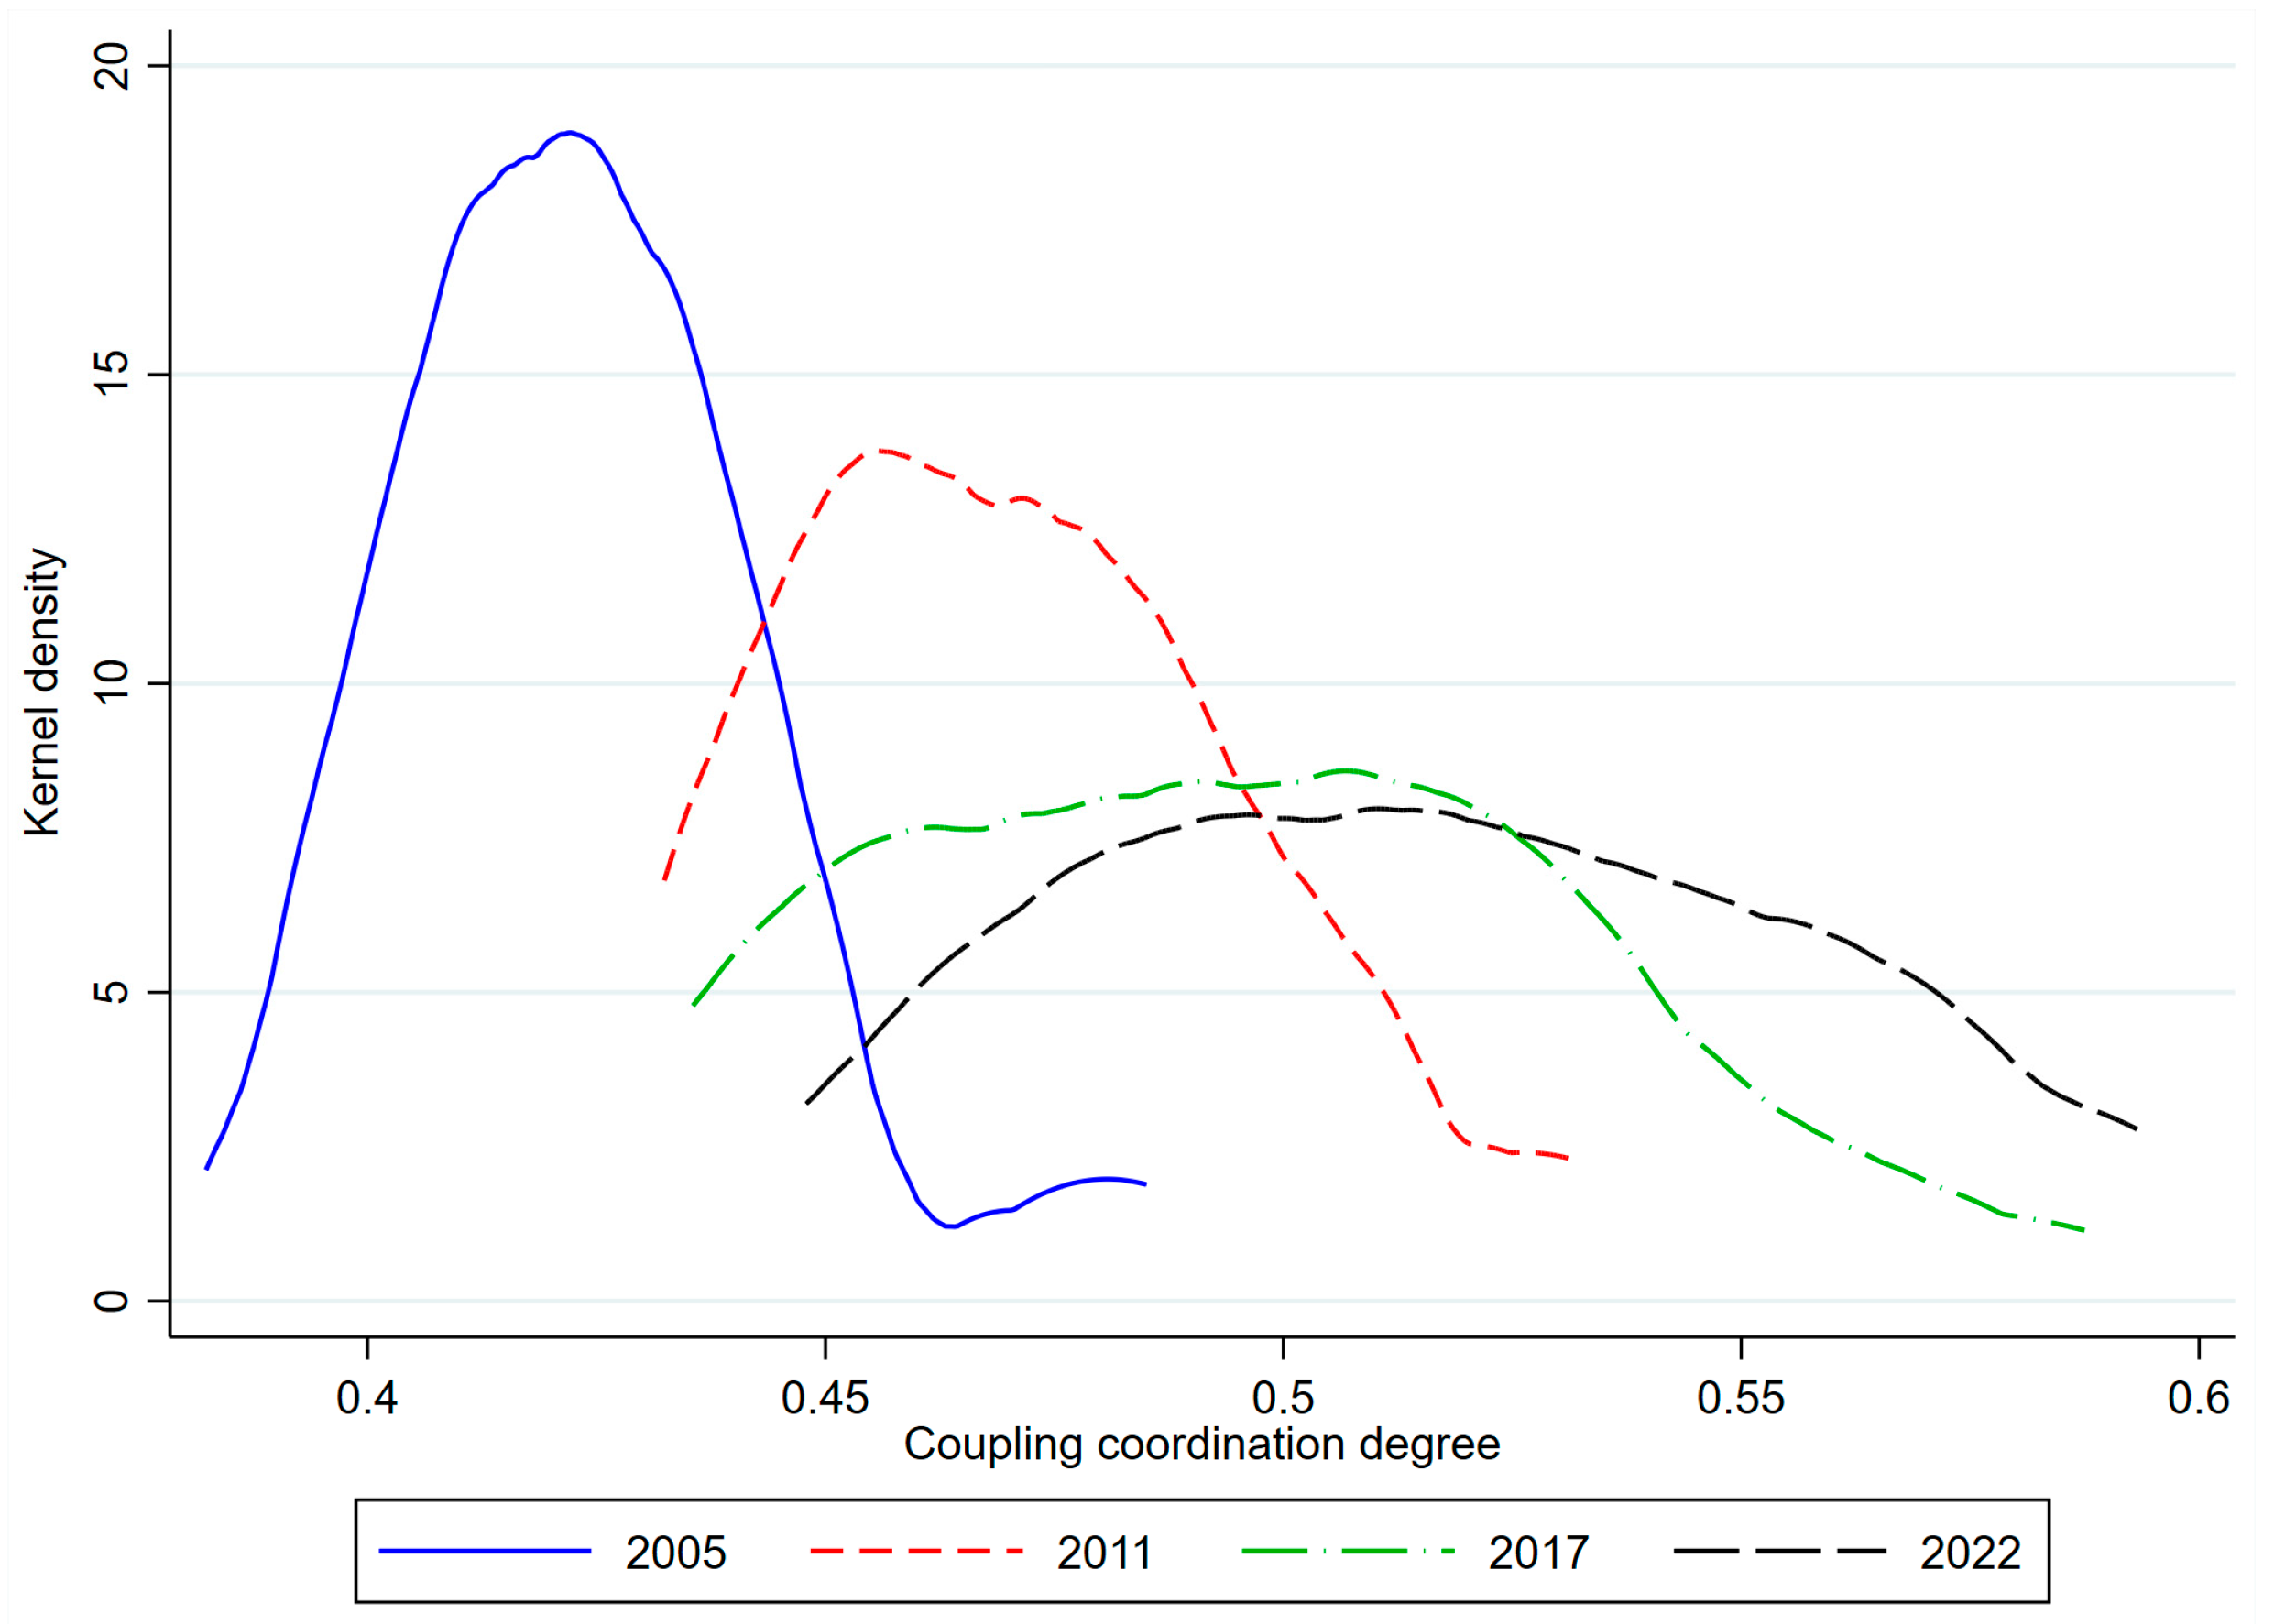
In 2005, the KD curve of CCD between ER and EcR in SCS coastal cities featured a left-skewed peak. After 2005, the curve moved rightward, indicating an overall rise trend in CCD. From 2005 to 2022, the primary peak declined in height and broadened in width, pointing to an increasing gap in CCD among SCS coastal cities. Concurrently, a divergent right-tailing trend emerged, indicating a growing divergence between mean and extreme CCD values. In 2005, curve exhibited a subtle bimodal shape. After 2005, the side peaks gradually diminished in prominence, reflecting a steady decline in multi-polarization phenomenon over time (Figure 7).
2
Cities classified based on K-means clustering
In 2005, the KD curve of CCD between ER and EcR in central cities exhibited a left-skewed peak. After 2005, the curve shifted rightward, indicating a rising trend in CCD. Between 2005 and 2022, the primary peak declined in height and broadened in width, suggesting an increasing disparity in CCD across central cities. Some core cities, relying on higher-level urban functions, innovation resources, and policy support, have achieved a faster rate of coordinated improvement in ER and EcR, while other central cities lag relatively behind in industrial upgrading and ecological governance. The curve also exhibited divergent right-tailing characteristics, highlighting a growing gap between extreme and average CCD values. From 2005 to 2017, the pronounced multi-peak morphology pointed to a multi-polarization phenomenon in CCD. By 2022, this multi-peak transformed into a single peak, reflecting a weakening of the multi-polarization phenomenon (Figure 8).
In 2005, the KD curve also displayed a left-skewed peak in CCD between ER and EcR in resource-based cities. Post-2005, the curve gradually shifted rightward, though with limited amplitude, indicating a slow increase in CCD. The main reasons for this are as follows: Resource-based cities are highly dependent on resource exploitation, with a single industrial structure and obvious path dependence, resulting in high costs for economic transformation and ecological restoration. Under the combined effect of resource constraints and environmental pressures, their room for improving ER is limited, and the progress of ecological governance is relatively slow, which restricts the coordinated improvement of ER and EcR. The primary peak remained relatively stable from 2005 to 2022, suggesting minimal change in CCD disparities in resource-based cities. However, by 2022, the lengthening of the right-tailing indicated a growing divergence between extreme and average CCD values (Figure 9).
In 2005, industrial cities showed a left-skewed KD curve peak for CCD between ER and EcR. After 2005, the curve moved rightward, marking an upward trend in CCD. From 2005 to 2017, the primary peak increased in height and narrowed in width, and it declined in height and broadened in width in 2022. These findings indicated a reduction in CCD disparities among industrial cities from 2005 to 2017. After 2017, the gap in the coupling coordination degree among industrial cities widened, as some industrial cities took the lead in high-end and green development, while cities with a high share of traditional industries faced transformation constraints. The pronounced presence of multi-peak morphology reflected the relatively strong multi-polarization phenomenon in CCD (Figure 10).
In 2005, the KD curve of CCD between ER and EcR in other types of cities was skewed to the left. Following 2005, the curve shifted rightward, denoting a rising trend in CCD. From 2005 to 2022, the primary peak declined in height and broadened in width, indicating widening CCD disparities in other types of cities. The rightward tailing of the curve showed no convergence over this period, suggesting that the gap between extreme and average CCD values had not decreased; the thickening of the rightward tailing reflected a gradual rise in the proportion of cities achieving high coupling coordination levels. The curve’s weak multi-peak morphology implied a relatively subdued multi-polarization phenomenon in CCD (Figure 11).
In conclusion, disparities in CCD among the four types of cities classified by K-means clustering generally increase divergence. The CCD gaps among overall coastal cities and within different types of coastal cities generally show an expanding trend.

3.3. Characteristics of the Spatial Association Pattern

3.3.1. Characteristics of the Overall Structure

The indicator values of the overall network structure characteristics were calculated using Ucinet 6.0 (Table 5). From 2005 to 2022, network density increased from 0.091 to 0.442, indicating a gradual rise in the degree of association in CCD among coastal cities. The network correlation degree remained at 1 throughout the period, signifying that there were direct or indirect associative relationships of CCD among these coastal cities. Meanwhile, network efficiency declined from 0.942 to 0.573, suggesting improved stability of the CCD association network among coastal cities. The network hierarchy is 0. In the SAN of CCD, two-way reachable relationships generally exist among cities, and no hierarchical control path with one-way dominance has been formed.

3.3.2. Characteristics of the Individual Structure

1
Degree centrality
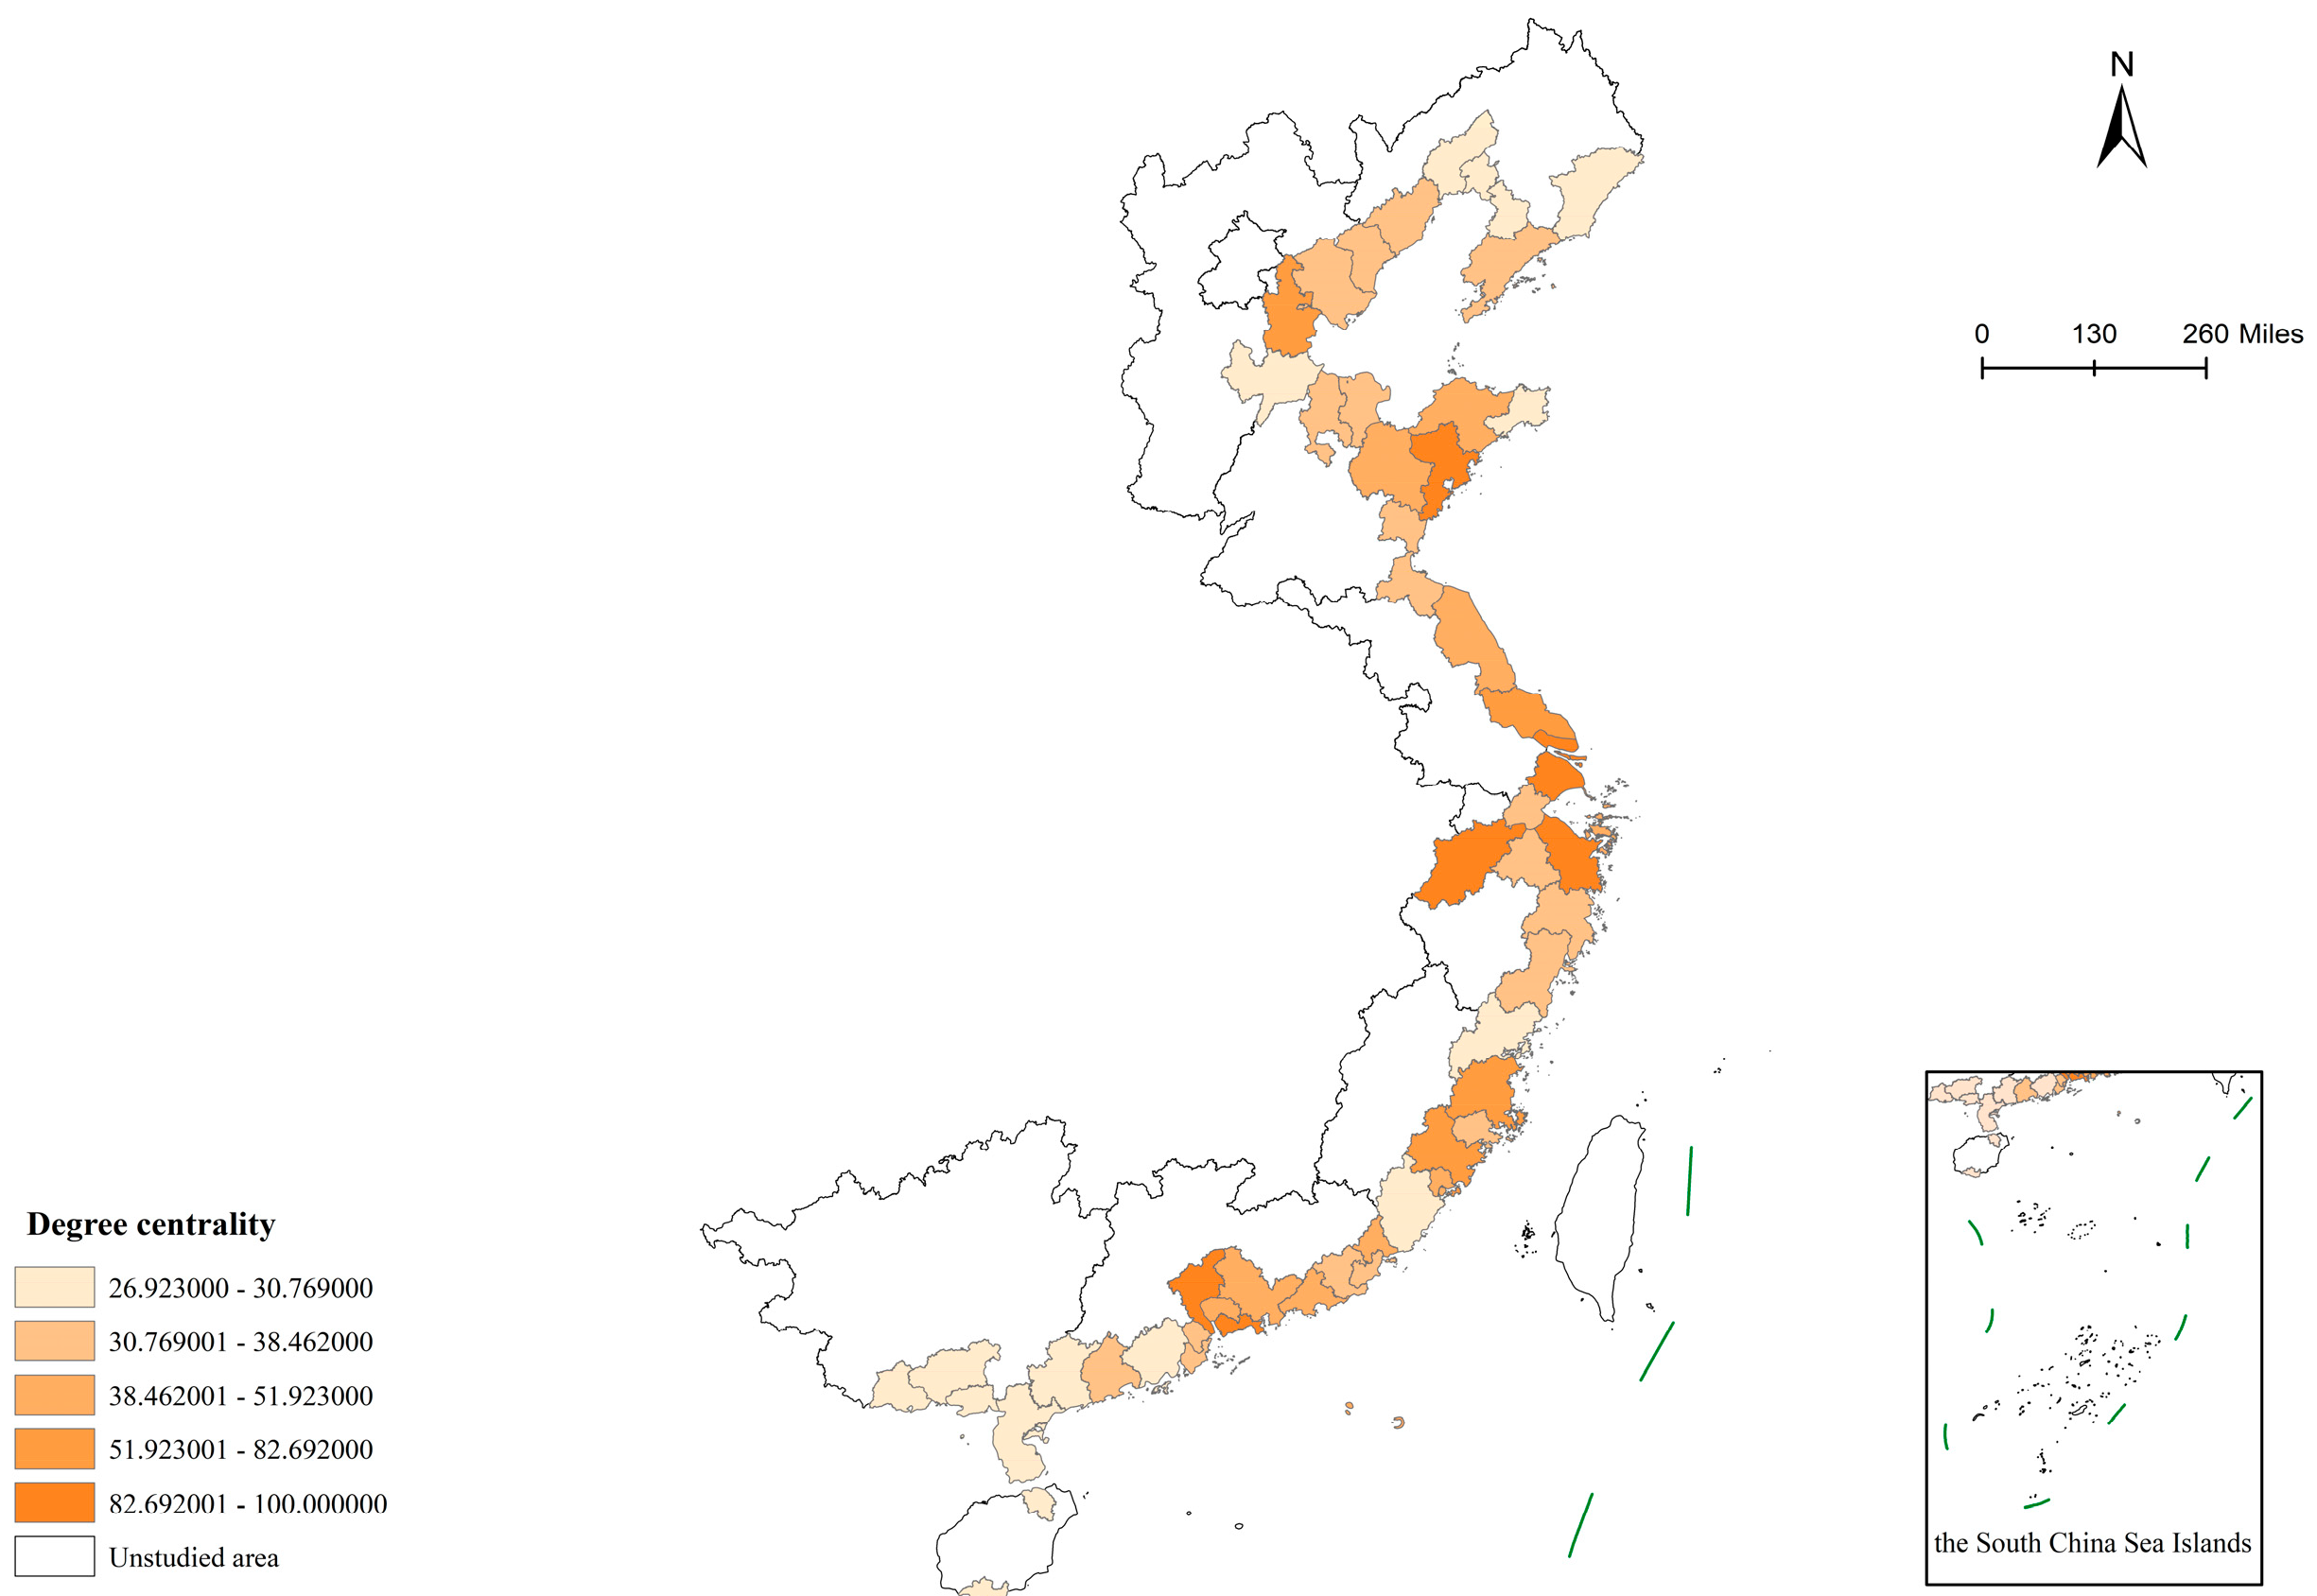
In 2022, the cities with the highest degree centrality (DC) were Shanghai, Guangzhou, Shenzhen, Hangzhou, and Ningbo, reflecting their dominant roles in the SAN. These cities have a high level of economic development and a good foundation for ecological environmental governance. Meanwhile, well-developed transportation infrastructure and information networks facilitate the rapid flow of factors between cities. In contrast, cities such as Jiangmen, Zhanjiang, Jinzhou, Panjin, and Yingkou had the lowest DC, placing them on the edge (Figure 12).
2
Closeness centrality
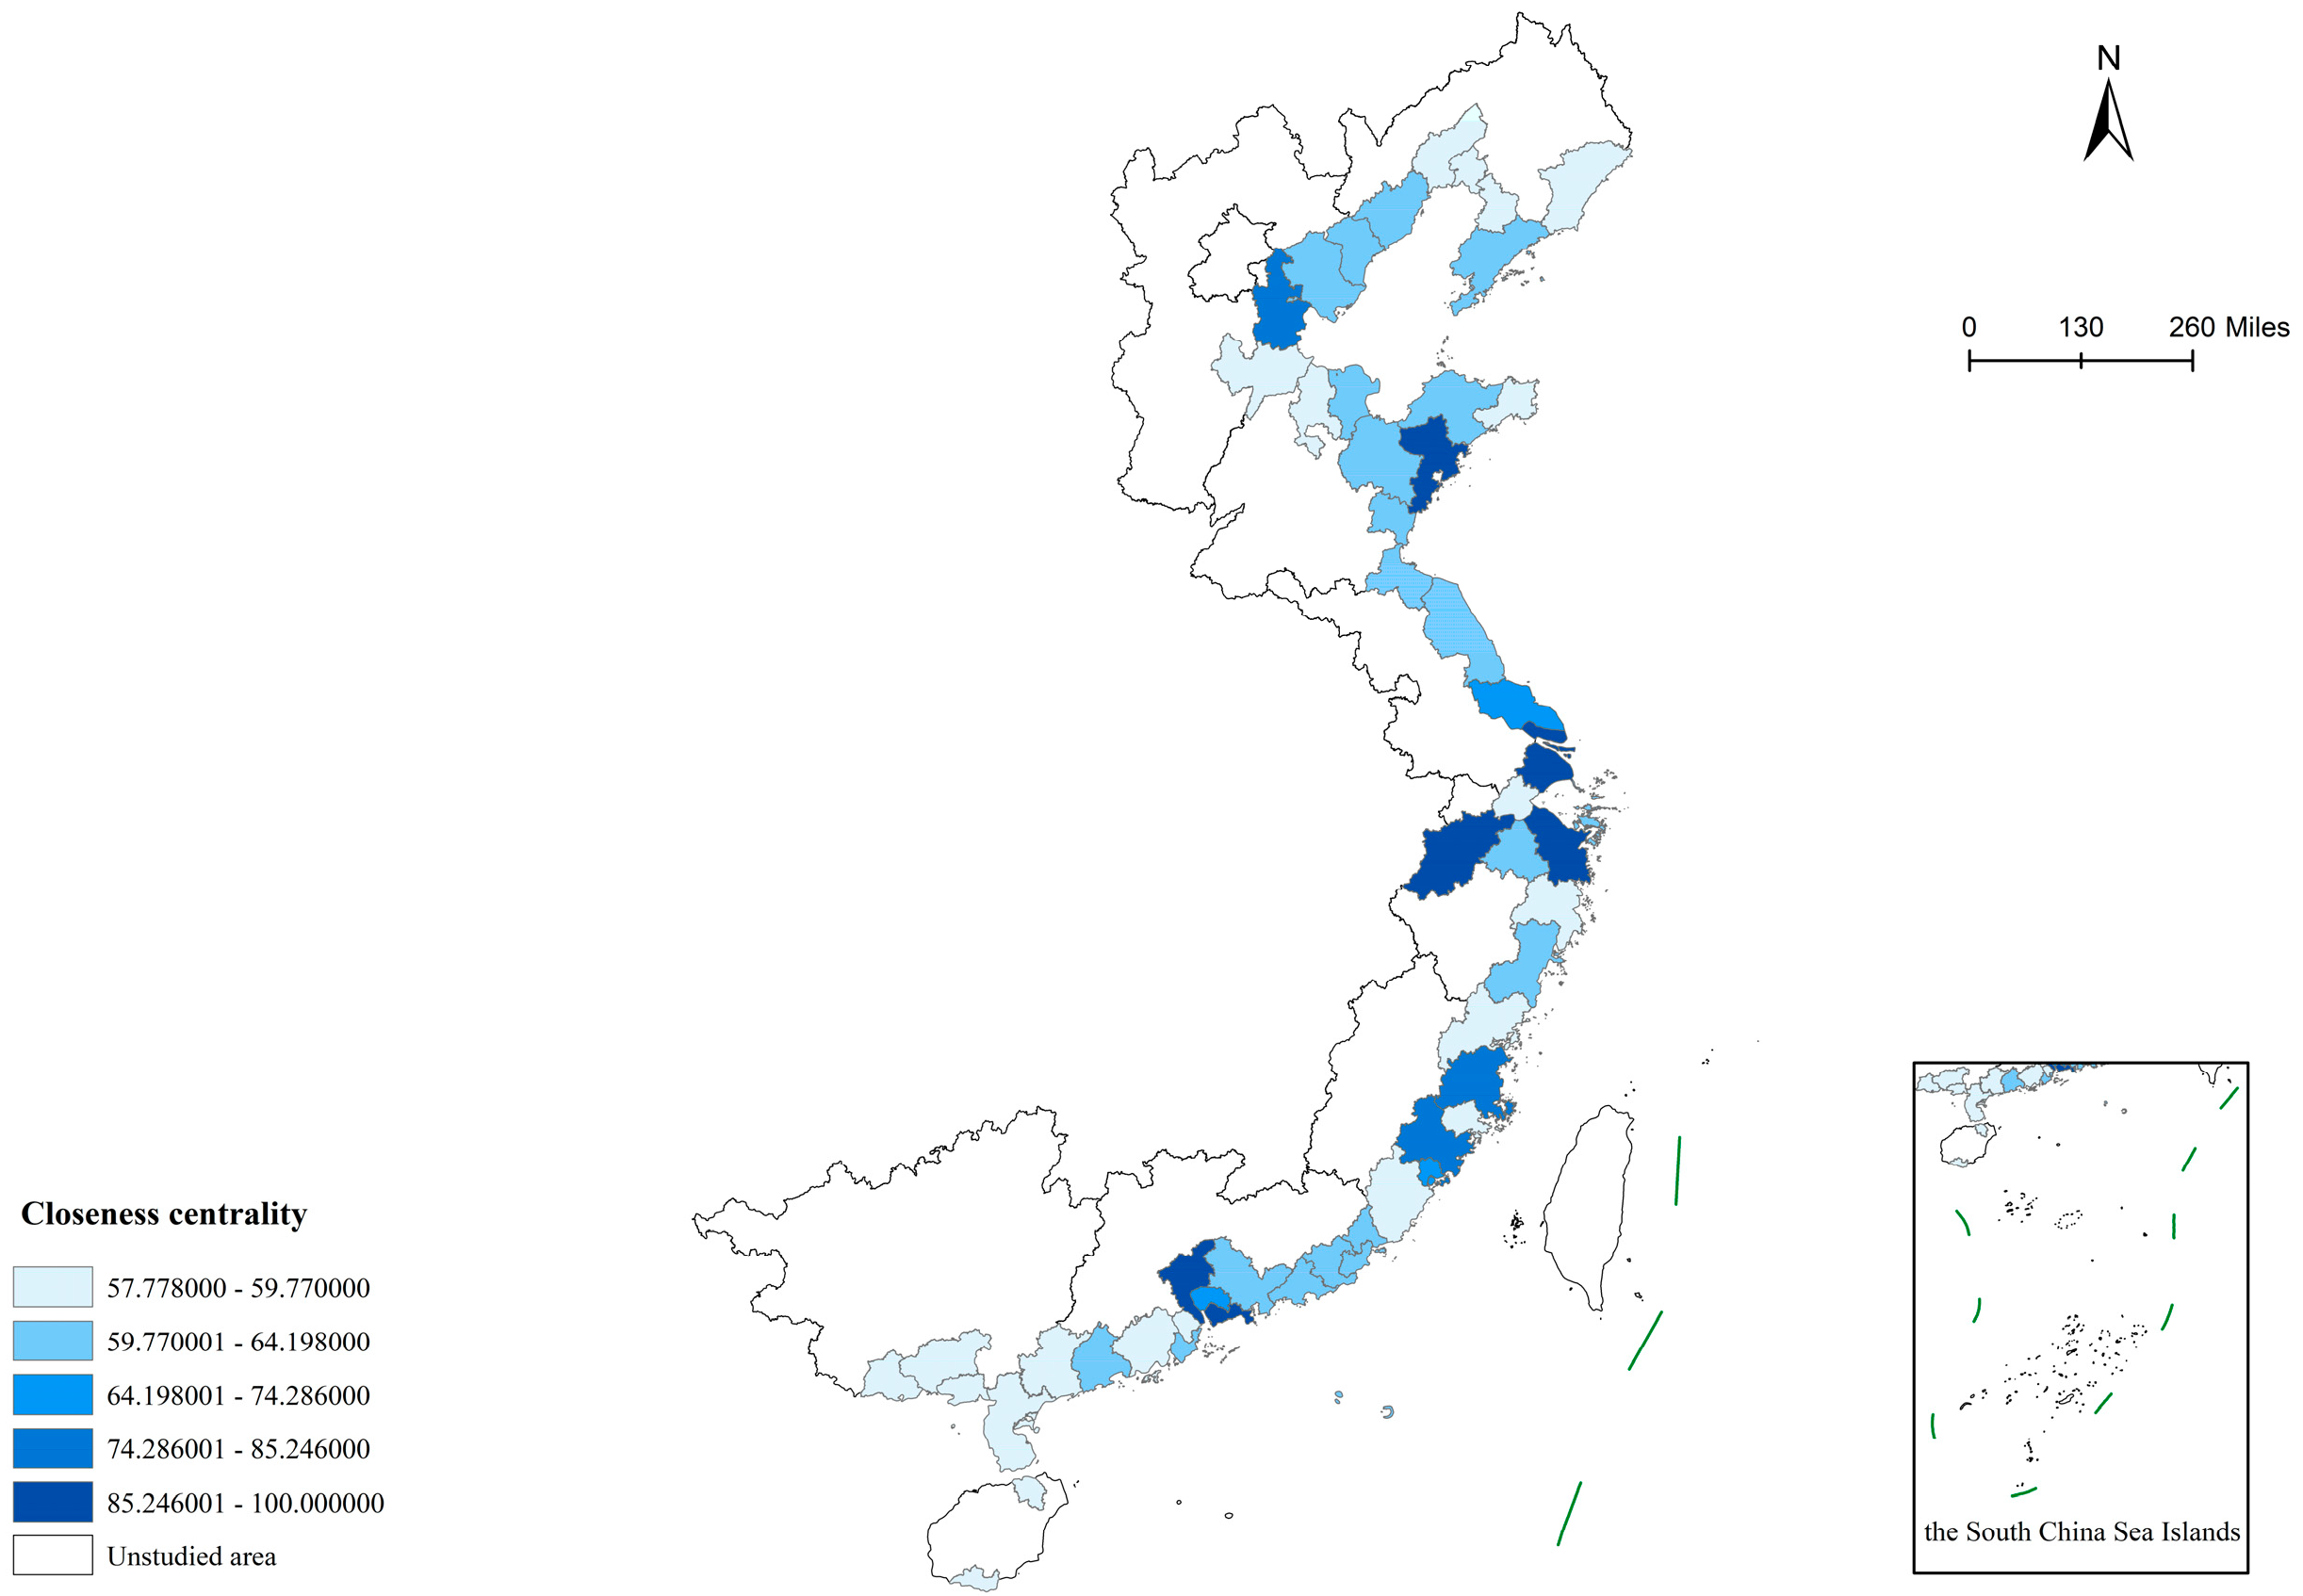
In terms of closeness centrality (CC) in 2022, Shanghai, Guangzhou, Shenzhen, Hangzhou, and Ningbo ranked highest, indicating they could rapidly interact with other cities in the SAN and serve as central actors. These cities are located in the core areas of national-level urban agglomerations and possess comprehensive transportation advantages. In the transmission of factors and influences, they are in a relatively favorable position, enabling them to establish connections with other cities at lower costs and higher efficiencies. Cities such as Zhanjiang, Haikou, Qinzhou, Cangzhou, Dandong, Yingkou, and Panjin exhibited the lowest CC, highlighting that they were marginal actors (Figure 13).
3
Betweenness centrality
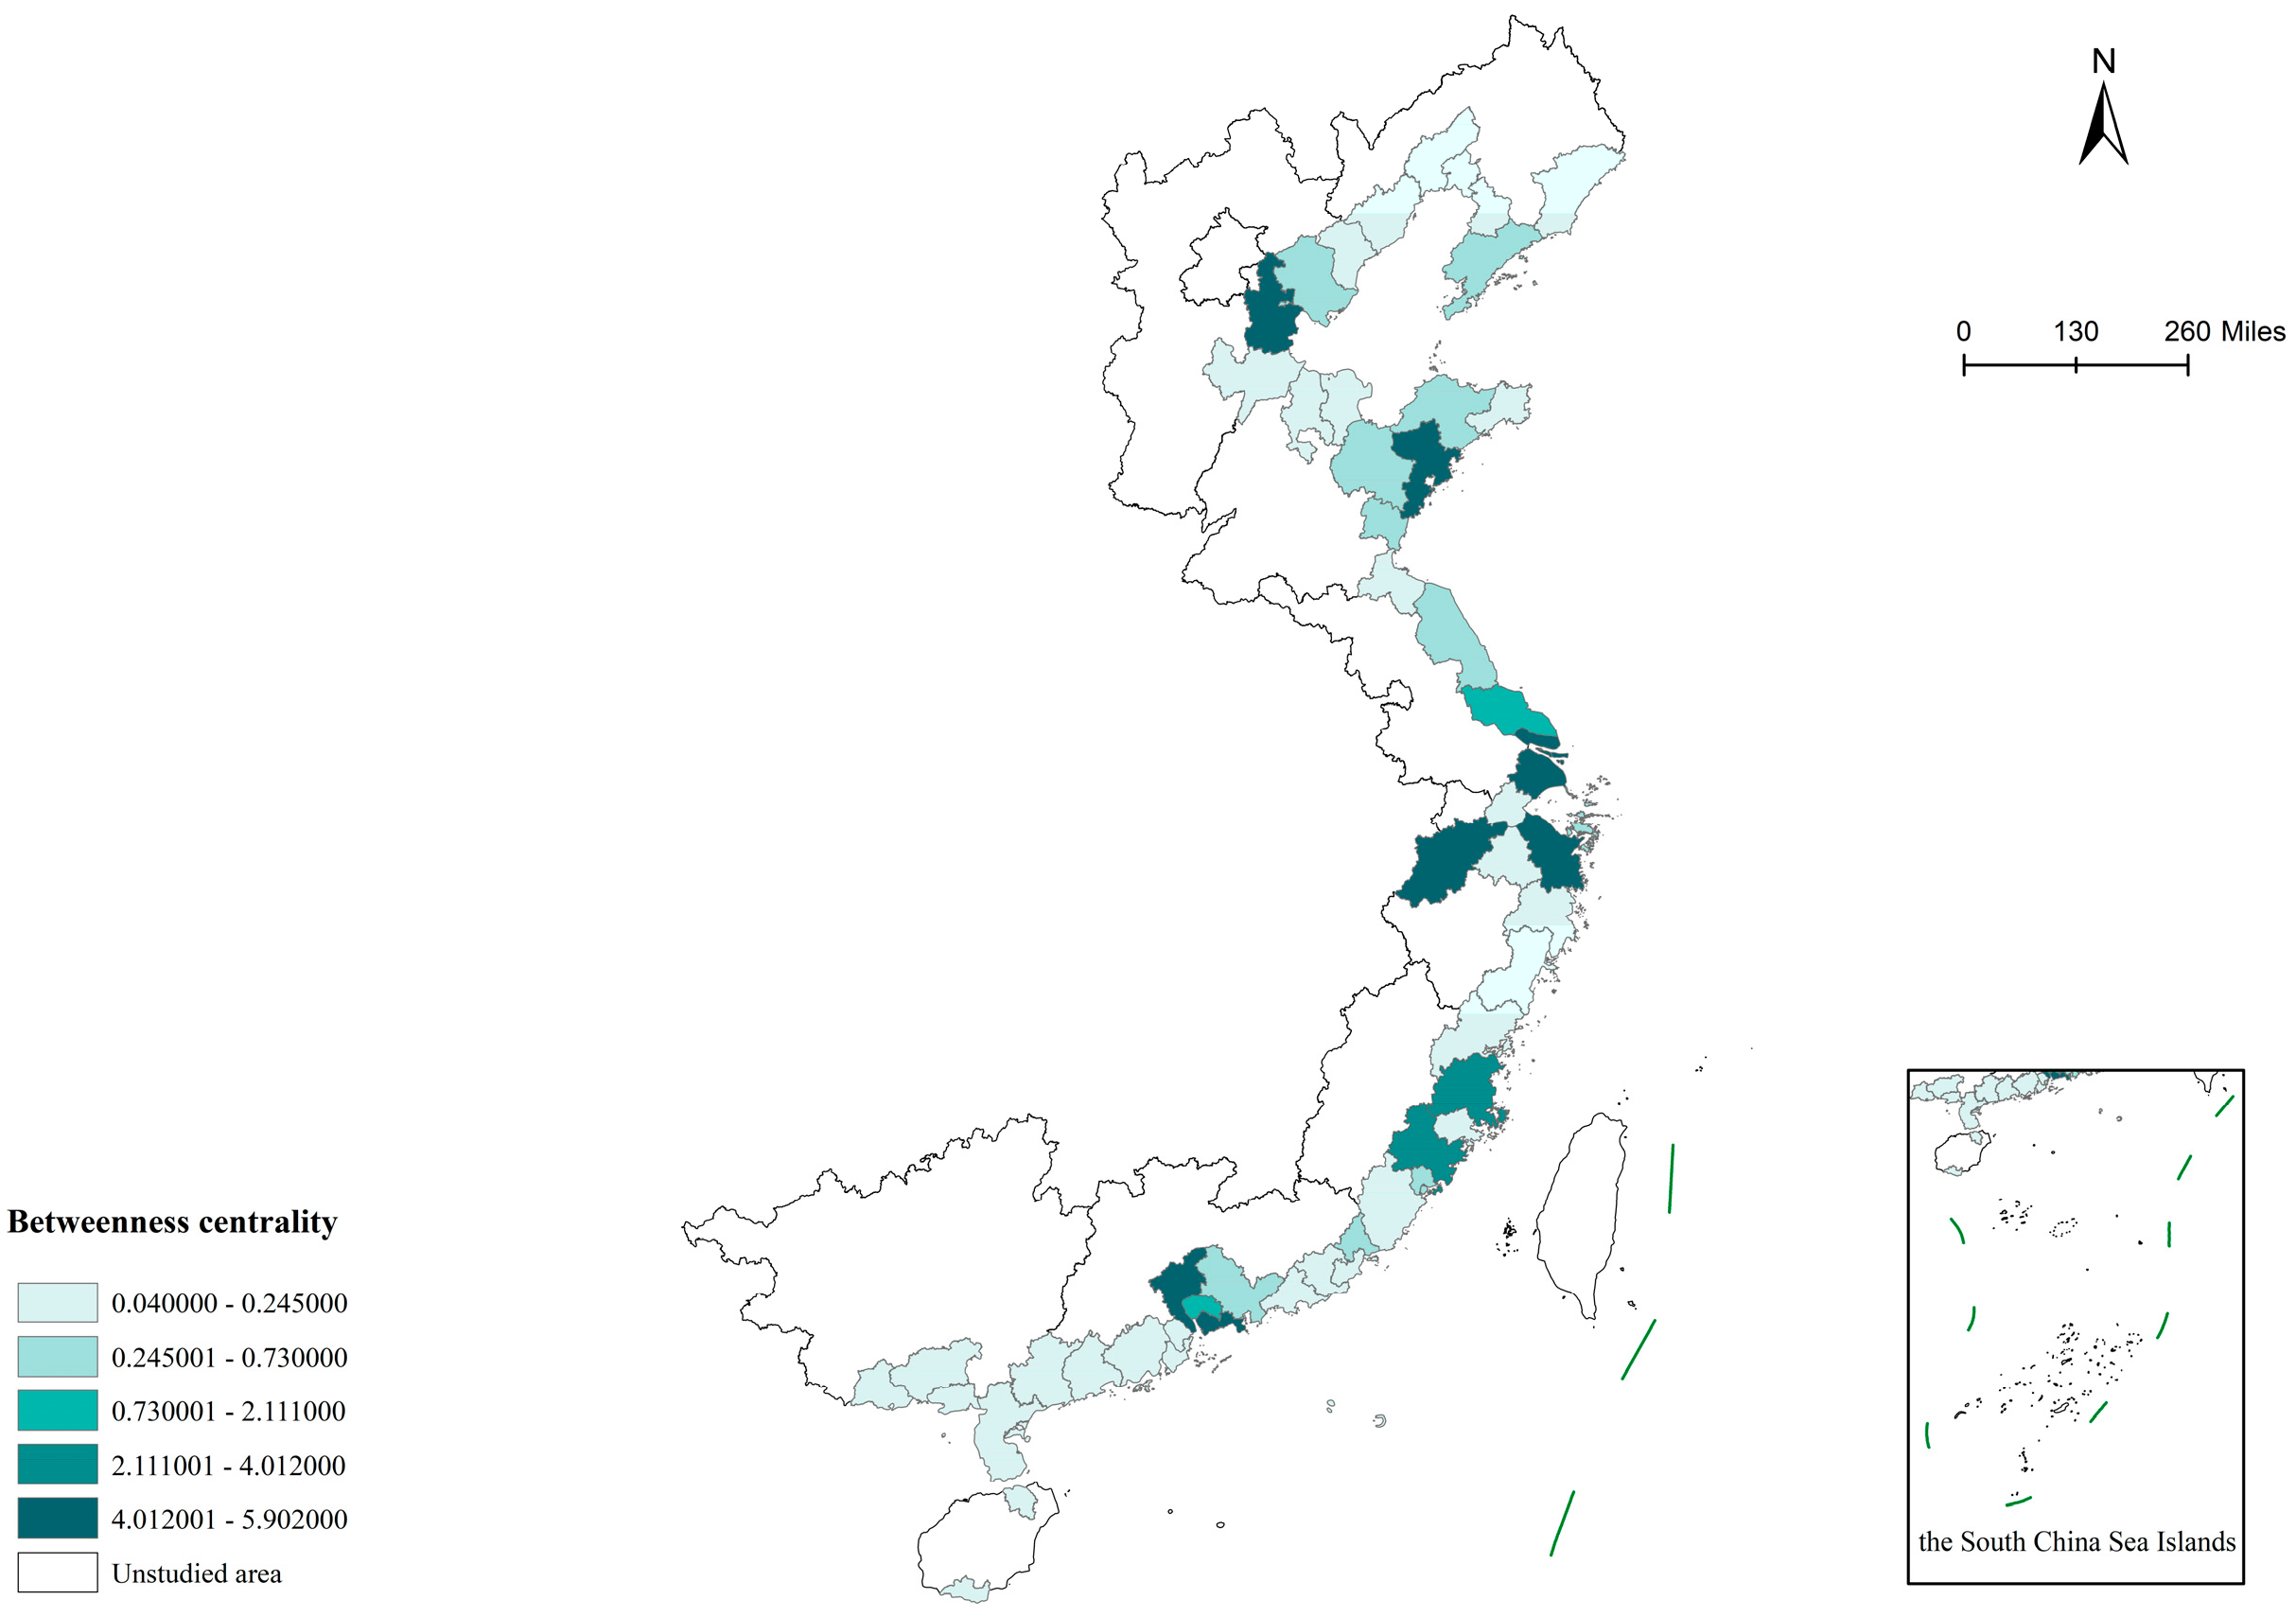
The individual betweenness centrality (BC) in 2022 were generally low, indicating the absence of high-level “bridge” cities within the SAN. Shanghai, Guangzhou, Shenzhen, Hangzhou, and Ningbo recorded the highest BC, indicating their intermediary and hub functions in the SAN. These cities boast advantages such as high development levels, key locational nodes, and cross-regional resource allocation capabilities. However, cities such as Jiangmen, Taizhou, Jinzhou, Panjin, and Yingkou recorded the lowest BC, below 0.1, suggesting they were in a subordinate position (Figure 14).
4
Urban spillover roles
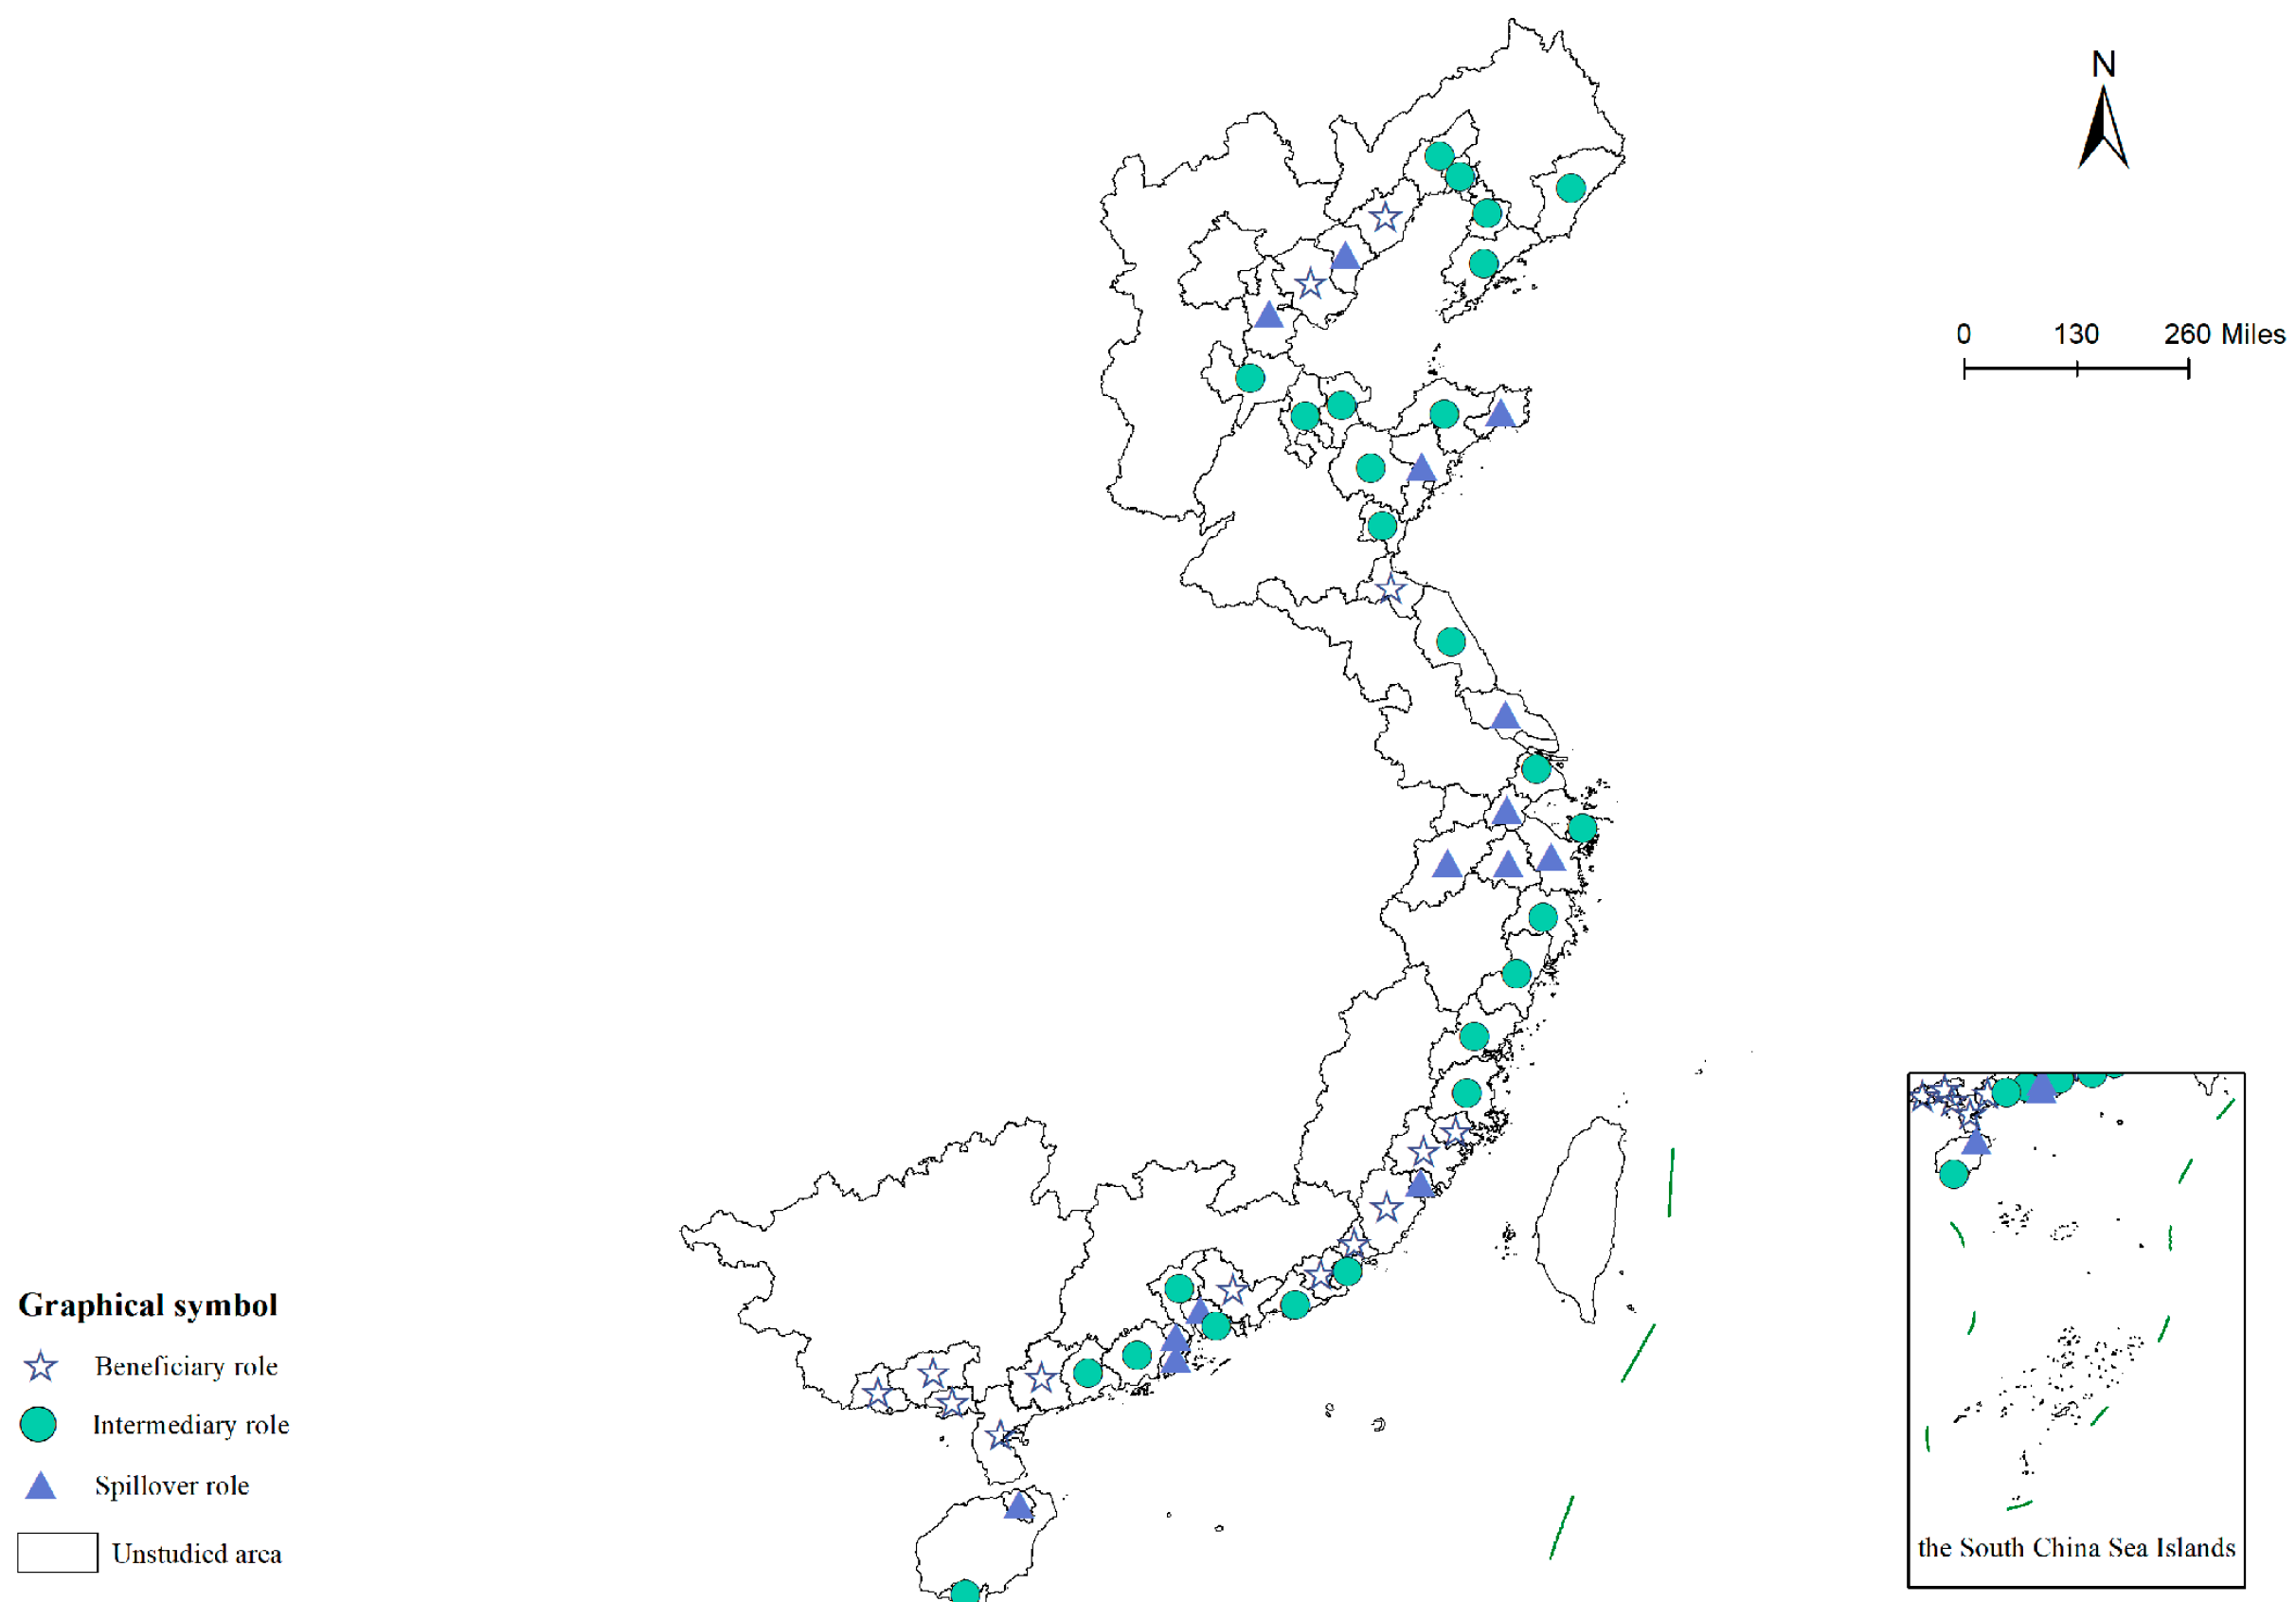
In 2022, beneficiary cities included Beihai, Binzhou, and Fangchenggang, among others. These cities are located at the periphery of the network structure, with receiving relationships significantly exceeding spillover relationships. Spillover roles cities included cities such as Tianjin, Qingdao, Hangzhou, Ningbo, Xiamen, and Dongguan. These cities can exert strong spillover effects on other cities through factor flows and the transmission of development experience. Two main types of intermediary cities were identified. The first type, including cities such as Shanghai, Guangzhou, and Shenzhen, had high in-degree and out-degree values. They were strongly influenced by other cities while also affecting other cities. The second type, represented by cities such as Yingkou, Binzhou, Jiangmen, and Yangjiang, had low in-degree and out-degree values, reflecting relatively weak connections (Figure 15).

3.3.3. Block Model Analysis

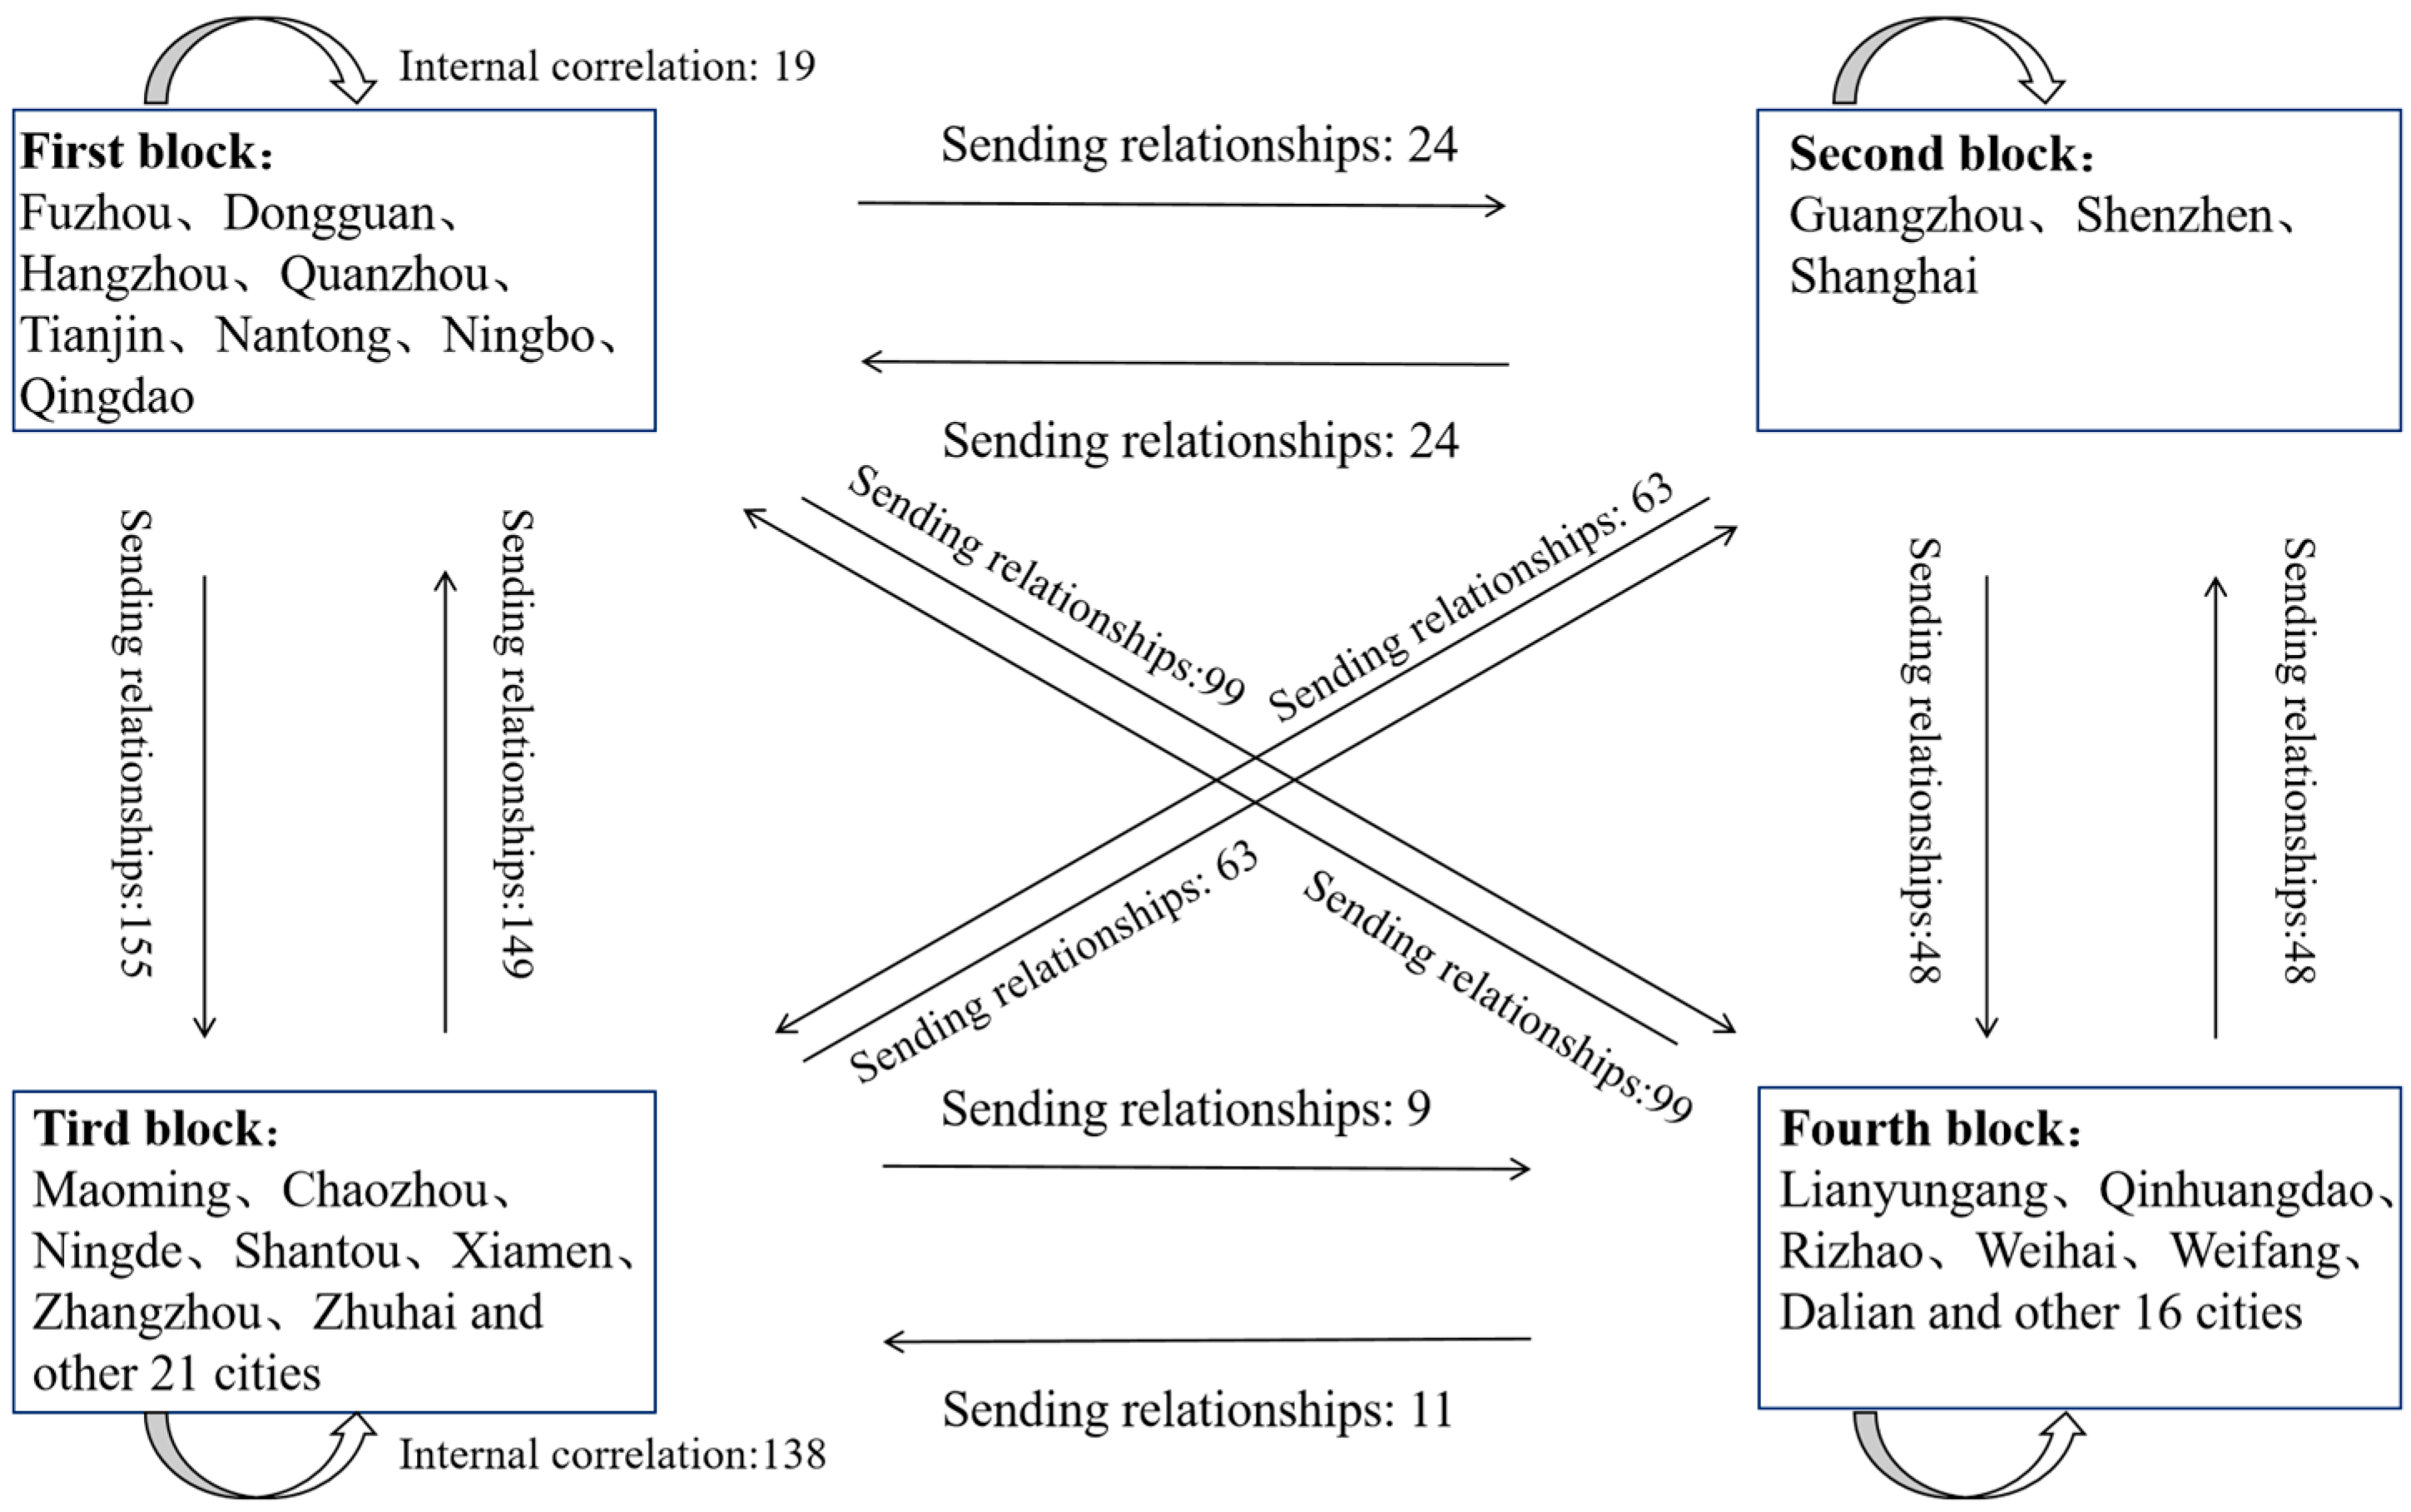
This study adopts the ideas of structural equivalence and block modeling from SNA, and it groups cities based on their characteristics of spillover and reception relationships in the network using the CONCOR method in Ucinet software. Due to the limitations of the Ucinet block model, five cities on the edges of the SAN—Jiangmen, Qinzhou, Jinzhou, Panjin, and Yingkou—were excluded. The remaining 48 cities were categorized into four blocks (Figure 16). Block 1 comprises 8 cities, including Fuzhou; Block 2 includes Guangzhou, Shenzhen, and Shanghai; Block 3 contains 21 cities, such as Maoming; and Block 4 consists of 16 cities, including Cangzhou.
These four blocks form a total of 792 interconnections, of which 285 are internal, and the spatial associations are primarily external to the blocks. Block 1 exhibits 278 spillover and 272 receiving relationships, characterizing it as a “net spillover” block. Block 2 has equal numbers of spillover and receiving relationships, both at 135, with fewer internal connections, and it is a “broker” block. Block 3, with 221 spillover and 229 receiving relationships, functions as a “net beneficiary” block. Block 4, with 158 spillover and 156 receiving relationships, functions as a "bilateral spillover" block (Table 6).
To further reveal the spatial connections between blocks (Figure 17), a block density matrix was calculated and transformed into an image matrix (Table 7).
The values for Blocks 1 and 3 are 0, indicating a relatively low degree of association among cities within Block 1 and Block 3, whereas Blocks 2 and 4 have values of 1, suggesting a relatively high degree of association among them. Off-diagonal values reflect the degree of association of CCD between blocks. Notably, the degree of association between Blocks 3 and 4 is relatively weak, while the associations among other blocks are comparatively strong.

3.4. Affecting Factors

3.4.1. Selection of Affecting Factors

Based on analytical conclusions regarding the influencing factors, a literature review, the actual situation of the coastal zone, and data availability, the following factors are identified as primary internal influences: social security (social security expenditure(X1)), digital technology (employment share in information transmission, computer services, and software(X2)), industrial structure (industrial structure rationalization(X3); advancement of industry structure(X4)), living standards (per capita disposable income(X5)), equity (urban–rural wealth gap(X6)), education (education expenditure as a share of public financial expenditure(X7)), healthcare (per capita health expenditure(X8)), characteristic factors of circular economy (industrial waste comprehensive utilization rate(X9)), atmospheric environment (the proportion of days with air quality up to standard(X10)), water resources (per capita water supply(X11)), land resources (population density(X12)), energy resources (proportion of clean energy consumption(X13)), vegetation (green coverage rate in built-up areas(X14)), eco-technological innovation (green patent grants per 10,000 population(X15)), human capital for ecological governance (employment share in water conservancy, environment, and public facilities managemen(X16)), ecological protection systems (environmental protection expenditure as a share of fiscal expenditure(X17)), and ecological restoration investment (per capita investment in ecological infrastructure(X18)). Foreign trade dependence (X19) is selected to represent the degree of globalization, while the marketization index (X20) reflects the degree of market development. The green finance index (X21) indicates the green market development. Industry association count (X22) and ecological environment awareness (X23) are used to reflect public engagement in ER and EcR development, respectively.

3.4.2. Analysis of Affecting Factors

Risk detection is employed to determine the significance and impact intensity of factors. The results of the single-factor detection are presented in Table 8.
This research revealed the following findings: (1) The influence of factors affecting the spatial–temporal patterns of the ER–EcR CCD in coastal cities vary in magnitude across different time periods. (2) Based on the actual situation, variables with a q-value greater than 0.5 were identified as primary influencing factors. In 2005, these included the degree of public engagement in EcR development, eco-technological innovation, and public participation in ER development. By 2011, the primary affecting factors were water resources, eco-technological innovation, living standards, and public engagement in ER. In 2017, the primary affecting factors were eco-technological innovation, water resources, public engagement in ER, healthcare, living standards, and digital technology. In 2022, the primary affecting factors were eco-technological innovation, healthcare, water resources, public engagement in EcR development, living standards, industrial structure rationalization, digital technology, globalization level, public engagement in ER development. The number of primary influencing factors has increased over time, showing a clear trend toward diversification. (3) Public engagement in ER and eco-technological innovation consistently emerged as dominant affecting factors. Over time, additional variables—such as water resources, living standards, digital technology, healthcare, industrial structure rationalization, and globalization level—successively gradually became primary affecting factors. Public engagement in EcR was a primary affecting factor in both 2005 and 2022, with its influence initially declining before rising.

4. Discussion

This study constructs evaluation index systems for the urban ER and urban EcR of China’s coastal cities and calculates their respective comprehensive evaluation indices and the CCD between the two. On this basis, it analyzes the spatial–temporal pattern characteristics and affecting factors of the coupling coordination level. The main innovations are as follows:
First, in current research on the concepts and evaluation of urban ER and urban EcR, insufficient attention has been paid to the agency of humans within the systems, and the “structure–agency” and dynamic evolutionary characteristics of the systems have been neglected. Based on evolutionary economics and the “structure–agency” perspective, this study improves the evaluation index system of urban ER from three dimensions: prevention, resistance, and restructuring; integrating the circular economy theory, it enhances the evaluation index system of urban EcR from the same three dimensions. This enriches the research on the urban resilience of China’s coastal cities.
Second, in the current research on the urban resilience of China’s coastal cities, most studies focus on a single dimension of resilience. Based on the systems economics perspective, this study unifies the urban ER and urban EcR of coastal cities using the CCD model and systematically explores the spatial–temporal evolution pattern of CCD. This is more closely aligned with reality, where the economic system and the ecological system interact with each other and develop in a dynamically coordinated manner.
Finally, this study adopts the SAN and systematically reveals the spatial structure characteristics of the coupling coordination relationship between ER and EcR from three dimensions: overall network structure, node centrality, and network clustering. This method can present the complex economic–ecological resilience relationships among regions in the form of a graph structure, break through the linear assumption of adjacency or distance in traditional spatial econometric methods, and effectively capture the multidimensional, multi-directional and asymmetric coupling interaction relationships among regions. Moreover, it possesses good structural identification abilities and mechanism characterization advantages.

5. Main Research Conclusions and Policy Recommendations

This study constructs evaluation index systems for the urban ER and urban EcR of China’s coastal cities and calculates their respective comprehensive evaluation indices and the CCD between the two. On this basis, it analyzes the spatial–temporal pattern characteristics and factors affecting the coupling coordination level. The main findings of this study are as follows:
(1) According to the evolutionary process, which is grounded in a dual theoretical framework from evolutionary economics from past to present to future and the “structure–agency” perspective, the evaluation indicators for urban ER and urban EcR are decomposed of three dimensions: preventive indicators, resistance indicators, and restructuring indicators. To reduce ecological risks, circular economy characteristic indicators are specifically employed as preventive indicators for urban ecological resilience.
(2) The CCD between ER and EcR in overall coastal cities and different types of coastal cities is not high enough, showing a fluctuating upward trend. ER development continues to lag behind that of EcR in overall coastal cities. Therefore, efforts should be made to accelerate the enhancement of ER in China’s coastal cities to promote the improvement of the coupling coordination level between their ER and EcR.
(3) The CCD between ER and EcR in different types of coastal cities closely aligns with the spatial distribution of their economic development levels. The CCD gaps among overall coastal cities and within different types of coastal cities show an expanding trend, with obvious characteristics of path dependence. Among them, the main reasons for the widening gap in CCD between central cities, industrial cities, resource-based cities, and other types of cities are as follows: central cities, relying on their advantages in factor agglomeration, as well as strong green transformation capabilities and restoration capabilities, have achieved the coordinated and rapid improvement of ER and EcR; driven by industrial upgrading and green transformation, the CCD of ER and EcR in industrial cities has grown rapidly; resource-based cities and other types of cities are constrained by factors such as industrial path dependence, high green transformation costs, and insufficient shock-resistance capabilities, resulting in a relatively slow pace of coordinated improvement in their ER and EcR. From ECS to SCS to YSBS coastal cities, and from central cities to industrial cities to other types of cities to resource–based cities, the government’s support for urban economic development should be gradually increased, aiming to narrow the gap in the degree of coupling coordination between different types of cities.
(4) The correlation degree of CCD among coastal cities shows a gradually increasing trend, and the SAN becomes more stable and relatively balanced.
(5) The spatial distribution of DC, CC, and BC shows a high degree of consistency. Urban spillover roles are highly consistent with levels of economic development. Beneficiary cities and intermediary cities with low in-degree and out-degree values are mainly those cities with lower economic development, whereas spillover cities and intermediary cities with high in-degree and out-degree values are mainly those cities with higher economic development. Therefore, to actively improve the economic development level of China’s coastal cities, particularly those that are less developed, the aim is to increase the number of spillover cities and intermediary role cities with high in-degree and high out-degree centrality, so as to promote enhancement of the coupling coordination level between ER and EcR in China’s coastal cities, while narrowing the gap in coupling coordination level among them. By actively improving the coupling coordination level of cities with lower DC, CC, and BC, disparities in the coupling coordination level across China’s coastal cities can be reduced.
(6) The spatial associations of CCD among the four blocks are primarily external. The correlation degree between Block 3 and Block 4 is relatively weak, while stronger correlation degrees are observed among the other blocks. Within Block 1 and Block 3, the internal correlation degrees are relatively low, whereas those within Block 2 and Block 4 are comparatively high. Therefore, emphasis should be placed on strengthening the spatial correlation of CCD among the four sectors. Actively improving the correlation degree between Block 3 and Block 4, as well as the correlation degree among cities within Block 1 and Block 3, will promote enhancement of the correlation degree in CCD among China’s coastal cities.
(7) According to systems science theory, the structures and functions of urban ER and urban EcR, as well as the interaction between urban ER and EcR, are internal influencing factors. From the perspective of governance, external influencing factors, namely, the external environment, mainly include the impact of globalization, as well as domestic public participation, markets, and policies. The number and diversity of dominant influencing factors have steadily increased. Public engagement in ER development and eco-technological innovation have remained consistent dominant influencing factors. Over time, factors such as water resources, living standards, digital technology, healthcare, industrial structure rationalization, and globalization level have successively become dominant influencing factors. Public engagement in EcR development emerged as a dominant factor in both 2005 and 2022, with its influence initially declining before rising. Therefore, full play should be given to the roles of dominant influencing factors, including the degree of public participation in ER development, ecological technological innovation, water resources, living standards, digital technology, healthcare, industrial structure rationalization, globalization level, and the degree of public participation in EcR development. Since the number of dominant influencing factors is gradually increasing and they tend to be diversified, the role of current non-dominant influencing factors should not be ignored. In particular, attention should be paid to those factors whose influence tends to rise, such as the marketization index and the atmospheric environment.
(8) Considering the availability of data, variables such as agricultural product reserves, reserves of natural resources and the ecological environment, and urban ecological planning were excluded from the evaluation index system. Additionally, using the number of patent applications to represent the level of ER policy development, green patent application counts to reflect the level of EcR policy development, and the green finance index to reflect green market maturity presents certain limitations.


Author Contributions

Conceptualization, D.C.; methodology, C.W.; software, C.W.; validation, D.C.; formal analysis, C.W.; investigation, C.W., M.W. and P.Y.; resources, D.C.; data curation, C.W.; writing—review and editing, C.W., M.W., D.C. and P.Y.; visualization, C.W., M.W., D.C. and P.Y.; supervision, D.C.; project administration, D.C.; funding acquisition, D.C. All authors have read and agreed to the published version of the manuscript.

Funding

This research was funded by the National Social Science Foundation, grant number No.:23CJY0190; No.:15BJY058.

Institutional Review Board Statement

Not applicable.

Informed Consent Statement

Not applicable.

Data Availability Statement

The raw data supporting the conclusions of this article will be made available by the authors on request.

Conflicts of Interest

The authors declare no conflicts of interest.

References

  1. Reggiani, A.; Graaff, T.D.; Nijkamp, P. Resilience: An evolutionary approach to spatial economic systems. Netw. Spat. Econ. 2022, 2, 211–229. [Google Scholar] [CrossRef]
  2. Berkes, F.; Colding, J.; Carl, F. Navigating Social–Ecological Systems Building Resilience for Complexity and Change; Cambridge University Press: Cambridge, UK, 2003; p. 416. [Google Scholar]
  3. Simmie, J.; Martin, R. The economic resilience of regions: Towards an evolutionary approach. Camb. J. Reg. Econ. Soc. 2010, 3, 27–43. [Google Scholar] [CrossRef]
  4. Ernstson, H.; Sander, E.; Redman, C.L.; Meffert, D.J.; Davis, G.; Alfsen, C.; Elmqvist, T. Urban transitions: On urban resilience and human-dominated ecosystems. AMBIO 2010, 39, 531–545. [Google Scholar] [CrossRef] [PubMed]
  5. Martin, R. Regional economic resilience, hysteresis and recessionary shocks. J. Econ. Geogr. 2012, 12, 1–32. [Google Scholar] [CrossRef]
  6. Boschma, R.; Minondo, A.; Navarro, M. The emergence of new industries at the regional level in Spain. A proximity approach based on product-relatedness. Econ. Geogr. 2012, 89, 29–51. [Google Scholar] [CrossRef]
  7. Shaw, K.; Maythorne, L. Managing for local resilience: Towards a strategic approach. Public Policy Adm. 2013, 28, 43–65. [Google Scholar] [CrossRef]
  8. Martin, R.; Sunley, P. On the notion of regional economic resilience: Conceptualisation and explanation. J. Econ. Geogr. 2015, 15, 1–42. [Google Scholar] [CrossRef]
  9. Boschma, R. Towards an evolutionary perspective on regional resilience. Reg. Stud. 2015, 49, 733–751. [Google Scholar] [CrossRef]
  10. Sun, J.; Sun, X. Research progress of regional economic resilience and exploration of its application in China. Econ. Geogr. 2017, 37, 1–9. [Google Scholar] [CrossRef]
  11. Cainelli, G.; Ganau, R.; Modica, M. Industrial relatedness and regional resilience in the European Union. Pap. Reg. Sci. 2019, 98, 755–779. [Google Scholar] [CrossRef]
  12. He, C.; Sheng, H. Regional economic resilience: A review and future development outlook. Hum. Geogr. 2023, 38, 1–10. [Google Scholar] [CrossRef]
  13. Li, R.M.; Xu, M.; Zhou, H.Y. Impact of high-speed rail operation on urban economic resilience: Evidence from local and spillover perspectives in China. Cities 2023, 141, 104498. [Google Scholar] [CrossRef]
  14. Sara, D. Regional resilience in the 2008–2010 downturn. Camb. J. Reg. Econ. Soc. 2011, 4, 369–382. [Google Scholar] [CrossRef]
  15. Qi, X.; Zhang, J.S.; Xu, W.X. A study on the evaluation of the development of county economic resilience in Zhejiang province. Zhejiang Soc. Sci. 2019, 273, 40–46. [Google Scholar] [CrossRef]
  16. Zeng, B. Analysis on the connotation of regional economic resilience construction of index system. J. Reg. Financ. Res. 2020, 576, 74–78. [Google Scholar]
  17. Xie, H.; Yang, D.; Zhang, K. Spatio-temporal evolution and network structure of urban economic resilience in China. East China Econ. Manag. 2022, 36, 64–74. [Google Scholar] [CrossRef]
  18. Yu, Z.; Li, Y.; Dai, L. Digital finance and regional economic resilience: Theoretical framework and empirical test. Financ. Res. Lett. 2023, 55, 103920. [Google Scholar] [CrossRef]
  19. Yang, Y.; Lin, Z.; Xu, Z.; Liu, S. The impact of digital finance on regional economic resilience. Pac.-Basin Financ. J. 2024, 85, 102353. [Google Scholar] [CrossRef]
  20. Briguglio, L.; Cordina, G.; Farrugia, N.; Vella, S. Economic vulnerability and resilience: Concepts and measurements. In Measuring Vulnerability in Developing Countries; Taylor & Francis Group: Abingdon, UK, 2014; pp. 47–65. [Google Scholar]
  21. Zhou, X.; Wang, J. Measurement and synergistic evolution analysis of the economic resilience and eco-efficiency of provincial regions in China. Arid Land Geogr. 2024, 47, 319–331. [Google Scholar]
  22. Xu, S.; Zhong, M.; Wang, Y. Can innovative industrial clusters enhance urban economic resilience? A quasi-natural experiment based on an innovative pilot policy. Energy Econ. 2024, 134, 107544. [Google Scholar] [CrossRef]
  23. Zhou, X.B.; Zhang, Y.L.; Wang, W.; Sun, Y.T. Spatial-temporal variation of economic resilience and its influencing factors under COVID-19. Int. J. Disaster Risk Reduct. 2024, 105, 104357. [Google Scholar] [CrossRef]
  24. An, L.; Xia, L.L.; Zhang, J.Z.; Lin, J.G. The spatial evolution and determinants of regional economic resilience in the Pearl River Delta. World Reg. Stud. 2024, 38, 131–147. [Google Scholar] [CrossRef]
  25. Wang, X.; Zhao, X. Spatial and temporal coupling research of economic resilience and ecological resilience in the Northern slope economic belt of Tianshan mountains. Acta Ecol. Sin. 2024, 44, 9670–9683. [Google Scholar]
  26. Holling, C.S. Resilience and stability of ecological systems. Annu. Rev. Ecol. Syst. 1973, 4, 1–23. [Google Scholar] [CrossRef]
  27. Pimm, S.L. The complexity and stability of ecosystems. Nature 1984, 307, 321–326. [Google Scholar] [CrossRef]
  28. Gunderson, L.; Holling, C. Panarchy Synopsis: Understanding Transformations in Human and Natural Systems; Island Press: Washington, DC, USA, 2002; Volume 4, pp. 1–12. [Google Scholar]
  29. Walker, B.; Holling, C.S.; Carpenter, S.R.; Kinzig, A. Resilience, adaptability and transformability in social-ecological systems. Ecol. Soc. 2004, 9, 5. [Google Scholar] [CrossRef]
  30. Yang, Z.; Cui, X.; Dong, Y.; Guan, J.; Wang, J.; Xi, Z.; Li, C. Spatio-temporal heterogeneity and influencing factors in the synergistic enhancement of urban ecological resilience: Evidence from the Yellow River Basin of China. Appl. Geophys. 2024, 173, 103459. [Google Scholar] [CrossRef]
  31. Alberti, M.; Marzluff, J.M.; Shulenberger, E.; Bradley, G.; Ryan, C.; Zumbrunnen, C. Integrating humans into ecology: Opportunities and challenges for studying urban ecosystems. Bioscience 2008, 53, 1169–1179. [Google Scholar] [CrossRef]
  32. FoLke, C. Resilience republished. Ecol. Soc. 2016, 21, 44. [Google Scholar] [CrossRef]
  33. Wang, S.; Cui, Z.; Lin, J.; Xie, J.; Su, K. Coupling relationship between urbanization and ecological resilience in the Pearl River Delta. Acta Geogr. Sin. 2021, 76, 973–991. [Google Scholar] [CrossRef]
  34. Xia, C.Y.; Dong, Z.Y.Z.; Chen, B. Spatio-temporal analysis and simulation of urban ecological resilience. Acta Ecol. Sin. 2022, 42, 116–126. [Google Scholar] [CrossRef]
  35. Tao, J.Y.; Dong, P.; Lu, Y.Q. Spatial-temporal analysis and influencing factors of ecological resilience in Yangtze River Delta. Resour. Environ. Yangtze Basin 2022, 31, 1975–1987. [Google Scholar]
  36. Wang, G. Research on the Spatiotemporal Evolution and Driving Mechanism of Urban Ecological Resilience in the Huaihe River Ecological Economic Belt. Sustainability 2025, 17, 10363. [Google Scholar] [CrossRef]
  37. Mehryar, S.; Sasson, I.; Surminski, S. Supporting urban adaptation to climate change: What role can resilience measurement tools play? Urban Clim. 2022, 41, 101047. [Google Scholar] [CrossRef]
  38. Xue, F.; Zhang, N.C.; Xia, C.Y.; Zhang, J.; Wang, C.Y. Spatial evaluation of urban ecological resilience and analysis of driving forces. Acta Ecol. Sin. 2023, 43, 6810–6823. [Google Scholar] [CrossRef]
  39. Resilience Alliance. About Resilience. Available online: https://www.resilience.org/about-resilience/ (accessed on 25 June 2024).
  40. Zhao, L.; Sun, Z. Evolution of coordinated development between economic development quality and ecological resilience in coastal cities and its spatial convergence features. Econ. Geogr. 2023, 43, 119–129. [Google Scholar] [CrossRef]
  41. Huang, J.; Zhong, P.; Zhang, J.; Zhang, L. Spatial-temporal differentiation and driving factors of ecological resilience in the Yellow River Basin, China. Ecol. Indic. 2023, 154, 110763. [Google Scholar] [CrossRef]
  42. Wang, T.; Zou, Z.; Zhou, G.; Zheng, J. A framework for measuring urban ecological resilience under high-quality development. J. Nat. Sci. Hunan Norm. Univ. 2022, 45, 33–40. [Google Scholar]
  43. Zhang, T.; Sun, Y.; Zhang, X.; Yin, L.; Zhang, B. Potential heterogeneity of urban ecological resilience and urbanization in multiple urban agglomerations from a landscape perspective. J. Environ. Manag. 2023, 342, 118129. [Google Scholar] [CrossRef]
  44. Li, D.; Yang, W.; Huang, R. The multidimensional differences and driving forces of ecological environment resilience in China. Environ. Impact Assess. Rev. 2023, 98, 106954. [Google Scholar] [CrossRef]
  45. Hu, T.; Yang, Y. Ecological resilience evaluation and restoration guidance strategies in urban coal mining subsidence area. J. Jiangsu Norm. Univ. Nat. Sci. Ed. 2023, 41, 14–20. [Google Scholar] [CrossRef]
  46. Xiao, S.; Duo, L.H.; Zou, Z. Assessment of ecological resilience in Nanchang based on “risk-connectivity-potential”. Chin. J. Appl. Ecol. 2023, 34, 733–741. [Google Scholar] [CrossRef]
  47. Pan, Y.; Jiao, S.; Hu, J.; Guo, Q.; Yang, Y. An ecological resilience assessment of a resource-based city based on morphological spatial pattern analysis. Sustainability 2024, 16, 6476. [Google Scholar] [CrossRef]
  48. Qian, T.; Wang, H.; Yu, F.; Wei, Y.; Yin, Y. Urban ecological resilience assessment and influencing factors analysis in Xinjiang based on DPSIR model. J. Huaqiao Univ. Nat. Sci. 2023, 44, 607–614. [Google Scholar] [CrossRef]
  49. Li, C.; Wang, Y.; Qing, W.; Li, C.; Yang, Y. Differential evaluation of ecological resilience in 45 cities along the Yangtze River in China: A new multidimensional analysis framework. Land 2024, 13, 1588. [Google Scholar] [CrossRef]
  50. Wang, W.; Zhong, Y.; Ma, H.; Ou, M.; Feng, X.; Wu, S. Spatial-temporal variations and influencing factors of ecological resilience in the Aquatic-Terrestrial Ecotone of Poyang Lake. Acta Ecol. Sin. 2023, 43, 9514–9526. [Google Scholar] [CrossRef]
  51. Xu, C.; Li, B.; Kong, F.; He, T. Spatial-temporal variation, driving mechanism and management zoning of ecological resilience based on RSEI in a coastal metropolitan area. Ecol. Indic. 2024, 158, 111447. [Google Scholar] [CrossRef]
  52. Song, S.; Wang, S.; Gong, Y.; Yu, Y. The past and future dynamics of ecological resilience and its spatial response analysis to natural and anthropogenic factors in Southwest China with typical Karst. Sci. Rep. 2024, 14, 19166. [Google Scholar] [CrossRef] [PubMed]
  53. Li, J.; Zhang, Y.; Zhang, H.; Gong, H.; Liu, Y. The research of spatio-temporal characteristics and influence factors of Wenzhou ecological resilience based on the “potential-elastic-stability” model. Acta Ecol. Sin. 2024, 44, 3253–3267. [Google Scholar] [CrossRef]
  54. Lu, F.; Liu, Q.; Wang, P. Spatiotemporal characteristics of ecological resilience and its influencing factors in the Yellow River Basin of China. Sci. Rep. 2024, 14, 16988. [Google Scholar] [CrossRef]
  55. Xiong, S.; Yang, F. Ecological resilience in water-land transition zones. Ecol. Indic. 2024, 166, 112284. [Google Scholar] [CrossRef]
  56. Zhang, X. Research on the dynamic mechanism of digital economy system coupling to enhance urban ecological resilience. Environ. Sci. Pollut. Res. 2024, 31, 22507–22527. [Google Scholar] [CrossRef]
  57. Ma, C.; Wen, C.; Li, Y. Land-sea integration measurement and governance of gulf ecological resilience. Acta Ecol. Sin. 2024, 44, 5102–5115. [Google Scholar] [CrossRef]
  58. Feng, X.; Zeng, F.; Loo, B.P.Y.; Zhong, Y. The evolution of urban ecological resilience: An evaluation framework based on vulnerability, sensitivity and self-organization. Sustain. Cities Soc. 2024, 116, 105933. [Google Scholar] [CrossRef]
  59. Han, S.; Wang, B.; Ao, Y.; Bahmani, H.; Chai, B. The coupling and coordination degree of urban resilience system. Environ. Impact Assess. Rev. 2023, 101, 107145. [Google Scholar] [CrossRef]
  60. Liu, T.C.; Wu, D. Study on the coupling coordination relationship between economic resilience and ecological resilience of cities in the Yellow River Basin. Yellow River 2024, 46, 6–11. [Google Scholar]
  61. Jiang, D.; Zhu, W.; Zhang, Z. The Spatiotemporal Coupling and Synergistic Evolution of Economic Resilience and Ecological Resilience in Africa. Sustainability 2025, 17, 863. [Google Scholar] [CrossRef]
  62. Gan, C.; Zheng, R.; Yu, D. An empirical study on the effects of industrial structure on economic growth and fluctuations in China. Econ. Res. J. 2011, 46, 4–16. [Google Scholar]
  63. Diao, B.; Ding, L.; Cheng, J. Differences of PM2.5 health risks and influencing factors in different types of cities. China Popul. Resour. Environ. 2021, 31, 90–100. [Google Scholar] [CrossRef]
  64. Chen, M.X.; Lu, A.; Zhang, H. Comprehensive evaluation and the driving factors of China’s urbanization. Acta Geogr. Sin. 2009, 64, 387–398. [Google Scholar] [CrossRef]
  65. Wang, S.; Kong, W.; Ren, L.; Zhi, D.; Dai, B. Research on misuses and modification of coupling coordination degree model in China. J. Nat. Resour. 2021, 36, 793–810. [Google Scholar] [CrossRef]
  66. Liao, C.B. Quantitative judgement and classification system for coordinated development of environment AMD economy. Trop. Geogr. 1999, 19, 171–177. [Google Scholar] [CrossRef]
  67. Zhao, Z.; Ru, S.; Xue, F. Spatio-temporal pattern and dynamic evolution of ecological resilience in the Yellow River Basin. China Popul. Resour. Environ. 2024, 34, 136–147. [Google Scholar] [CrossRef]
  68. Gai, M.; Xu, J.; Yue, P. Characteristics and formation mechanism of spatial association network of coastal human-nature system resilience in the Bohai Rim region. Resour. Sci. 2024, 46, 565–582. [Google Scholar] [CrossRef]
Figure 1. Map of China’s coastal cities.
Sustainability 18 01963 g001
Figure 2. Time–variation plot of the ER–EcR CCD of coastal cities (city classification based on the sea geographical location).
Sustainability 18 01963 g002
Figure 3. Time–variation plot of the ER–EcR CCD of coastal cities (city classification based on K-means clustering).
Sustainability 18 01963 g003
Figure 4. Kernel density (KD) estimation plot of the overall ER–EcR CCD in coastal cities.
Sustainability 18 01963 g004
Figure 5. KD estimation plot of the ER–EcR CCD in Yellow and Bohai Sea (YSBS) coastal cities.
Sustainability 18 01963 g005
Figure 6. KD estimation plot of the ER–EcR CCD in East China Sea (ECS) coastal cities.
Sustainability 18 01963 g006
Figure 7. KD estimation plot of the ER–EcR CCD in South China Sea (SCS) coastal cities.
Sustainability 18 01963 g007
Figure 8. KD estimation plot of the ER–EcR CCD in central cities.
Sustainability 18 01963 g008
Figure 9. KD estimation plot of the ER–EcR CCD in resource-based cities.
Sustainability 18 01963 g009
Figure 10. KD estimation plot of the ER–EcR CCD in industrial cities.
Sustainability 18 01963 g010
Figure 11. KD estimation plot of the ER–EcR CCD in other types of cities.
Sustainability 18 01963 g011
Figure 12. Individual degree centrality (DC) map of the spatial association network (SAN) of CCD between ER and EcR of coastal cities in 2022.
Sustainability 18 01963 g012
Figure 13. Individual closeness centrality (CC) map of the SAN of CCD between ER and EcR of coastal cities in 2022.
Sustainability 18 01963 g013
Figure 14. Individual betweenness centrality (BC) map in the SAN of CCD between ER and EcR of coastal cities in 2022.
Sustainability 18 01963 g014
Figure 15. Urban spillover roles map in the SAN of CCD between ER and EcR in coastal cities in 2022.
Sustainability 18 01963 g015
Figure 16. Four blocks map within the SAN of CCD between ER and EcR in coastal cities in 2022.
Sustainability 18 01963 g016
Figure 17. Plot of the associations among the four blocks in the SAN of ER and EcR coupling coordination in coastal cities in 2022 (The arrow indicates the direction.).
Sustainability 18 01963 g017
Table 1. Table of comprehensive evaluation frameworks of urban economic resilience (ER).
Standardized LayerIndicator LayerIndicator UnitAttribute
Economic preventive indicatorsSocial security%+ 1
Number of Internet users per 100 peopleHousehold+
Number of mobile phones per 100 peopleUnit+
Employment share in information transmission, computer services, and software%+
Economic resistance indicatorsIndustrial structure rationalization 2/ 4+
Advancement of industry structure/+
Consumption patterns/3
Unemployment rate%
Urban–rural wealth gap/+
Per capita GDPCNY+
Per capita disposable incomeCNY+
GDP growth rate%+
Total grain output per capitaTon+
Economic restructuring (learning ability, innovation ability) indicatorsShare of university students in total population%+
Proportion of R&D personnel%+
Investment intensity of scientific research funds%+
Number of patent applications granted per 10,000 peoplePiece+
Per capita health expenditureCNY+
Number of hospital beds per 10,000 peopleSheet+
Proportion of doctors%+
Education expenditure as a share of public financial expenditure%+
Financial self-sufficiency rate%+
1. + indicates a positive value. 2. The indexes of the industrial structure rationalization and advancement of industry structure refer to Gan Chunhui et al. [62]. 3. − indicates a negative value. 4. / indicates no unit.
Table 2. Table of the comprehensive evaluation frameworks of urban ecological resilience (EcR).
Standard LayerIndicator LayerIndicator UnitAttribute
Ecological prevention indicatorsCarbon dioxide decline rate per unit of GDP%+ 1
Industrial sulfur dioxide removal rate%+
Sewage treatment plant centralized treatment rate%+
Reduction rate of energy consumption per GDP%+
Harmless treatment rate of household garbage%+
Industrial waste comprehensive utilization rate%+
Industrial soot removal rate%+
Ecological resistance indicatorsCarbon dioxide emissions per unit GDPt/10,000 CNY2
The proportion of days with air quality up to standard%+
Industrial sulfur dioxide emission per unit value industrial outputt/10,000 CNY
Industrial wastewater discharge per unit value of industrial outputt/10,000 CNY
Per capita water supplym3+
Population densitypersons/km2
Proportion of urban construction land%
Industrial soot emissions per unit industrial output valuet/10,000 CNY
Proportion of clean energy consumption%+
Energy consumption per unit of GDPt/10,000 CNY
Forest coverage rate%+
Green coverage rate in built-up areas%+
Per capita park green space aream2+
Ecological restructuring (learning ability, innovation ability) indicatorsGreen patent grants per 10,000 populationpiece/10,000 people+
Employment share in water conservancy, environment, and public facilities management%+
Environmental protection expenditure as a share of fiscal expenditure%+
Per capita investment in ecological infrastructureCNY+
Per capita investment in water supply infrastructureCNY+
Per capita investment in drainage infrastructureCNY+
Per capita investment in landscaping infrastructureCNY+
1. + indicates a positive value. 2. − indicates a negative value.
Table 3. Classification of city types.
City TypeCities
Central citiesTianjin; Dalian; Shanghai; Hangzhou; Ningbo; Fuzhou; Xiamen; Qingdao; Guangzhou; Shenzhen; Dongguan
Resource-based citiesTangshan; Panjin; Huludao; Dongying
Industrial citiesCangzhou; Yancheng; Weifang
Other types of citiesQinhuangdao; Dandong; Jinzhou; Yingkou; Nantong; Lianyungang; Wenzhou; Jiaxing; Shaoxing; Zhoushan; Taizhou; Jieyang; Zhangzhou; Ningde; Yantai; Weihai; Rizhao; Binzhou; Zhuhai; Shantou; Jiangmen; Zhanjiang; Maoming; Chaozhou; Putian; Quanzhou; Beihai; Fangchenggang; Qinzhou; Haikou; Sanya; Huizhou; Shanwei; Yangjiang; Zhongshan
Table 4. Coupling coordination degree (CCD) between ER and EcR of overall coastal cities.
YearCoupling Coordination DegreeRelative Development IndexCoupling Coordination Level
20050.43060.4023Verge of disorder
20060.43770.4041Verge of disorder
20070.46360.4485Verge of disorder
20080.46320.4379Verge of disorder
20090.46650.4401Verge of disorder
20100.47660.4470Verge of disorder
20110.48300.4559Verge of disorder
20120.49160.4667Verge of disorder
20130.49790.4751Verge of disorder
20140.50120.4855Bare coordination
20150.50080.4790Bare coordination
20160.50750.4886Bare coordination
20170.51200.4900Bare coordination
20180.51810.4977Bare coordination
20190.52570.5121Bare coordination
20200.52100.5030Bare coordination
20210.54250.5336Bare coordination
20220.54050.5253Bare coordination
Table 5. Table of overall structural features of SAN for ER–EcR CCD in coastal cities.
Indicators2005201120172022
Network density0.0910.2110.3280.442
Network correlation degree1111
Network efficiency0.9420.8160.6940.573
Network hierarchy0000
Table 6. Table of spillover effects of spatial association blocks in 2022.
Block TypeNumber of Block MembersNumber of Spillover RelationshipsNumber of
Receiving Relationships
Block Type
Intra-BlockInter-BlockIntra-BlockInter-Block
Block 181927819272Net spillover
Block 2361356135Broker
Block 321138221138229Net benefit
Block 416122158122156Bilateral spillover
Table 7. Density matrix and image matrix.
Block TypeDensity MatrixImage Matrix
Block 1Block 2Block 3Block 4Block 1Block 2Block 3Block 4
Block 10.33910.9230.7730111
Block 211111111
Block 30.88710.3310.0271100
Block 40.77310.0330.5081101
Table 8. Table of analysis of factors affecting ER–EcR CCD in coastal cities.
DimensionIndicator2005201120172022
qRankqRankqRankqRank
Internal variableX10.1711170.1378230.3078130.404014
X20.0733230.359390.532560.64537
X30.1002220.3424120.418290.365616
X40.3411110.3561100.445980.49666
X50.458560.641130.627150.68655
X60.436670.387870.3701120.495210
X70.2621130.1448210.2043200.256919
X80.484240.458250.635240.75692
X90.1392210.1505200.1413230.263318
X100.3023120.1602190.2067190.446511
X110.479750.672110.701420.69993
X120.1628180.1886180.2944140.396315
X130.2285140.2313170.2569170.063723
X140.1861160.1488220.1695220.163621
X150.563120.667320.780410.77321
X160.3746100.2810150.1797210.154622
X170.1600190.2950140.2724160.233120
X180.428880.3339130.2737150.284217
External variableX190.2021150.380880.4097100.57398
X200.1411200.2333160.2326180.437712
X210.402290.3454110.3835110.415313
X220.502530.610340.684130.53179
X230.584310.435960.492870.68754
Disclaimer/Publisher’s Note: The statements, opinions and data contained in all publications are solely those of the individual author(s) and contributor(s) and not of MDPI and/or the editor(s). MDPI and/or the editor(s) disclaim responsibility for any injury to people or property resulting from any ideas, methods, instructions or products referred to in the content.