Article

Evolutionary Game Analysis of Low-Carbon Transition in the Steel Industry Under Demand-Side Constraints: A Simulation Based on Empirical Data

1
School of Public Administration, Zhejiang University of Technology, Hangzhou 310023, China
2
Jinhua Innovation Joint Research Institute, Zhejiang University of Technology, Jinhua 321000, China
*
Author to whom correspondence should be addressed.
Sustainability 2026, 18(4), 1951; https://doi.org/10.3390/su18041951
Submission received: 10 January 2026 / Revised: 7 February 2026 / Accepted: 9 February 2026 / Published: 13 February 2026
(This article belongs to the Section Environmental Sustainability and Applications)

Abstract

Under the constraints of China’s “Dual Carbon” targets, promoting green consumption has emerged as a critical market-based strategy to drive industrial decarbonization and achieve sustainable development. However, the existing literature primarily focuses on supply-side government regulation, leaving the mechanism of how demand-side constraints influence the strategic interaction between the government and enterprises under-explored. To bridge this gap, this paper constructs an evolutionary game model incorporating performance-based government incentives, consumer low-carbon preferences, and corporate abatement costs. Unlike theoretical models with hypothetical parameters, this study calibrates the simulation parameters using empirical data from the steel industry in Zhejiang Province, a pilot zone for China’s ecological civilization construction. The simulation results indicate that: First, under the current empirical parameters, the system fails to spontaneously converge to the ideal equilibrium state, highlighting a “governance deadlock”; second, consumer preference intensity serves as a vital external force that can effectively break this deadlock and reduce the government’s regulatory burden; and finally, sensitivity analysis reveals the critical thresholds for the synergistic effect between regulatory policies and market demand. Based on these findings, policy recommendations are proposed to foster a collaborative governance mechanism integrating government guidance, market-driven approaches, and demand-side driving forces.

1. Introduction

In response to the profound transformation of the global climate governance system, China announced the “Dual Carbon” strategic goals in 2021, aiming to peak carbon emissions by 2030 and achieve carbon neutrality by 2060. As the world’s largest steel producer, China’s steel industry accounted for approximately 16% of the national total carbon emissions in 2022 [1]. Consequently, the efficacy of its low-carbon transition is pivotal to the fulfillment of national climate commitments. However, a governance paradox persists in the low-carbon transition, where ambitious national targets are undermined by significant implementation gaps and policy stringency deficits at the local level [2]. The traditional dual governance model often leads to regulatory failure, where enterprises leverage information asymmetry to evade compliance [3]. To break this deadlock, China’s recent top-level policy design has explicitly signaled a paradigm shift from a purely government-centric approach to a modern environmental governance system characterized by multi-stakeholder participation [4]. Within this framework, promoting green consumption has been elevated to a national strategic priority, serving as a critical institutional entry point for integrating demand-side constraints into industrial decarbonization.
Theoretically and practically, consumers act not only as the terminal of carbon emissions but also as the pivotal driver for driving upstream transformation. Research on the demand-side challenges of the green steel market highlights that the willingness of downstream users (such as the automotive industry) to pay for green premiums is a critical driving factor [5]. Leading downstream enterprises enforce low-carbon standards as rigid entry thresholds, effectively excluding suppliers that fail to meet these criteria from the supply chain [6]. Through price signals and green purchasing preferences, this demand-side pressure transmits along the supply chain, directly influencing the production decisions of steel enterprises. Consequently, consumer constraint emerges as a vital market-based mechanism that complements traditional government regulation, forming a force for the industry’s low-carbon transition.
In recent years, evolutionary game theory has emerged as a pivotal tool in environmental governance. This framework is particularly effective for analyzing the strategic behaviors of multiple agents under regulatory constraints. Scholars have extensively investigated the green transition and cooperative behaviors of enterprises under the dual constraints of government incentives and market mechanisms [7,8]. From an industrial perspective, scholars have already completed extensive research on government–enterprise evolutionary games for emission reduction in sectors such as manufacturing [9], shipping industry [10], agriculture, and services [11]. However, the literature specifically refining this analysis to the steel industry remains relatively limited. Ma et al. further demonstrated that excess capacity induces short-termism in corporate decision-making, leading firms to prioritize immediate economic gains over long-term environmental benefits, thereby reinforcing dependence on polluting production paths [12].
Research on the low-carbon transition of the steel industry is increasingly focusing on the critical role of demand-side constraints. Chen et al. indicate that supply-side efficiency gains are increasingly offset by production expansion, particularly in China [13], necessitating a strategic shift toward demand-side drivers. However, Preziuso and Odonkor emphasize that governance gaps often lead to the structural exclusion of key stakeholders, creating barriers that undermine policy effectiveness [14]. To address this, Bataille et al. and Vogl et al. laid the theoretical groundwork, arguing that downstream green premiums and policy-driven green markets are critical for unlocking the transition [6,15]. In terms of research agents, many scholars have incorporated consumers into the models as game players [16]. For instance, Sun et al. [17] and Chen et al. [18] constructed tripartite frameworks involving the government, enterprises, and the public, demonstrating that active public supervision can synergize with government regulation.
Although existing studies have incorporated the consumer side as a game player, few studies have emphasized the unidirectional constraint mechanism imposed by the demand side on the strategic behaviors of the government and enterprises. Furthermore, critical parameters in many evolutionary game models are often detached from industrial reality, leading to conclusions that lack empirical support and operability. To address these gaps, this paper selects the steel industry in Zhejiang Province as a representative empirical sample. This region is particularly significant as it serves as “China’s first Ecological Civilization Pilot Zone” and is currently in a critical phase of dual carbon control. We construct a government–enterprise evolutionary game model incorporating demand-side constraints. The key contributions are as follows: (1) Empirical Calibration: unlike theoretical models, we quantify and calibrate simulation parameters based on actual carbon emission data from Zhejiang’s steel sector to enhance practical relevance. (2) Mechanism Design: we convert the demand-side constraint into a consumer low-carbon preference coefficient embedded in the payoff function and incorporate carbon emission quotas as a core variable. (3) Dynamic Regulation: we construct a reward and punishment function that varies linearly with the gap between the enterprise’s actual carbon emissions and its assigned quota, which constitutes a dynamic government reward–punishment mechanism. By analyzing the evolutionary stability of low-carbon strategies under these constraints, this study aims to identify the optimal conditions for cooperative decarbonization, providing theoretically grounded and empirically supported references for the sustainable transition and decision-making in the steel industry.

2. Construction of the Evolutionary Game Model

2.1. Definition of Key Concepts and Policy Background

2.1.1. Definition of Key Concepts

From the perspective of the full supply chain lifecycle, consumption constitutes the terminal point of economic activities. It serves as both the engine of industrial production and the fundamental driver of greenhouse gas (GHG) emissions [19]. Consequently, achieving the “Dual Carbon” goals necessitates not only continuous technological innovation and institutional reform on the supply side, but also the recognition of demand-side responsibilities.
In this study, demand-side constraint is defined as a market-driven mechanism where downstream industrial clients (e.g., automotive and construction sectors) exert pressure on steel manufacturers through green procurement standards and price premiums [20]. Unlike traditional environmental regulation, this constraint transmits low-carbon signals directly along the supply chain (Figure 1). To accurately capture the heterogeneity of demand-side pressure, we theoretically decompose the constraints into two distinct sub-dimensions based on the supply chain structure:
  • Direct Industrial Constraint: This dimension refers to the green procurement behaviors of downstream industrial clients, particularly in the automotive and construction sectors. Leading manufacturers enforce specific carbon intensity thresholds, such as Green Public Procurement standards, as rigid constraints. For steel enterprises, failure to meet these criteria results in direct exclusion from the supply chain [6].
  • Indirect Consumer Constraint: This dimension encompasses the low-carbon preferences of end consumers, characterized by price elasticity and willingness to pay. Consumers express this preference by accepting a green premium for final products, such as low-carbon vehicles [5].
Since steel enterprises typically do not transact directly with end consumers, these two dimensions interact through a vertical transmission mechanism. End consumers transfer price premiums to downstream manufacturers, who subsequently translate these incentives into procurement standards imposed on upstream steel mills. Therefore, in our evolutionary game model, the demand-side constraint parameter θ is defined to quantify the combined efficacy of rigid industrial standards driven by indirect consumer preferences.

2.1.2. Policy Background

Currently, external policies facing the steel industry in Zhejiang are in a transitional implementation phase, creating a time window that necessitates complementary demand-side drivers. Specifically, in terms of external trade, although the EU Carbon Border Adjustment Mechanism (CBAM) is scheduled for full implementation in 2026, it remains in a transitional phase, imposing minimal immediate tariff burdens on Chinese steel exports [21]. Simultaneously, regarding domestic regulation, China’s national carbon ETS included the steel sector in its 2024–2026 launch phase [22]. During this period, a loose free allocation strategy is adopted to ensure industry stability, meaning enterprises prioritize data management over bearing high compliance costs.
Consequently, relying solely on current government regulations is insufficient to drive rapid decarbonization, highlighting the urgency of introducing demand-side constraints into the evolutionary game framework. However, the Carbon Border Adjustment Mechanism and China’s national carbon ETS are expected to become significant external constraints in the future. To address this evolving challenge, we model the consumer constraint as a financial variable in the subsequent framework. This approach is designed to quantify the direct economic penalty derived from the carbon emission differential. Mechanistically, these future external constraints operate consistently with the market penalty variable θ2 constructed in this study, as they function as a deterministic payment based on product carbon intensity rather than a probabilistic administrative fine.

2.2. Model Assumptions

Assumption 1: Both local governments and steel enterprises are agents with bounded rationality, engaging in a strategic game under conditions of information asymmetry. Neither party can fully anticipate the complete decision-making information of the other; instead, they adjust their decisions based on limited cognition and dynamic feedback. Enterprises can choose to invest funds in clean production or adhere to the traditional production mode, while the government faces the choice of implementing active support or maintaining existing policies. The game equilibrium of the system is the outcome of strategic adaptation based on cost–benefit analysis by both parties.
Assumption 2: Based on the prevailing carbon quota system, the standard carbon emission quota allocated by the government to enterprises is denoted as E. If an enterprise does not undertake technological innovation, its emissions will be difficult to contain within this quota. Consequently, it is assumed that when an enterprise selects the “clean production” strategy, its actual carbon emission volume is E1 (satisfying E1 < E); conversely, when the “traditional production” strategy is selected, the actual carbon emission volume is E2 (satisfying E2 > E).
Assumption 3: A consumer-side low-carbon preference mechanism is introduced. Given that products gain consumer favor due to their green and low-carbon attributes [23], and building upon the market acceptance variables analyzed by previous scholars [24], this paper introduces a low-carbon product coefficient θ to represent the degree of consumer recognition for green production. Specifically, when an enterprise selects the “clean production” strategy, the emission reduction amount below the quota (E − E1) translates into additional enterprise revenue θ1(E − E1), where θ1 denotes the positive low-carbon product coefficient. Conversely, when the “traditional production” strategy is chosen, the excess emissions (E2 − E) result in a market loss θ2(E2 − E) due to consumer resistance, where θ2 represents the negative low-carbon product coefficient.
Assumption 4: The government’s reward and punishment mechanism depends on its strategy selection. When the government adopts the “active support” strategy, a strict reward and punishment system is established: low-carbon enterprises receive a subsidy α per unit of emission reduction, totaling α(E − E1), while enterprises exceeding emissions face a fine β per unit of excess, totaling β(E2 − E). In contrast, when the government chooses the “maintaining the status quo” strategy, due to a lack of special funds and strict regulation, it neither issues additional subsidies nor imposes heavy penalties, thereby reflecting the difference in administrative costs between the two strategies. It is important to note that while the marginal coefficients (α, β) are set as constant parameters, the total volume of subsidies and penalties is endogenous and scales dynamically with the enterprise’s actual emission performance.
Assumption 5: Parameters regarding social reputation and environmental benefits are established. When the government and the enterprise achieve cooperation—that is, when the government chooses policy support and the enterprise selects clean production—the government will obtain gains in social reputation and international image, denoted as D1, due to the effective fulfillment of its duties. Conversely, in the scenario where the enterprise persists with the traditional mode and the government remains passive (inaction), this will not only incur direct environmental governance costs and pollution losses, denoted as D2, but also result in losses in social reputation and international image for the government, denoted as D3, due to regulatory absence.The specific definitions of these variables are summarized in Table 1.

3. Model Solution and Stability Analysis

3.1. Replicator Dynamics Equations

According to the principle of Malthusian dynamics, if a specific strategy yields a payoff higher than the average population payoff, its frequency of adoption will increase over time. Based on the payoff matrix presented in Table 2, we calculate the expected payoffs for both parties. Consequently, the replicator dynamics equations for the local government and the steel enterprise are derived as follows:
F ( x ) = x ( 1 x ) ( D 2 C 2 + D 3 + β ( 1 y ) ( E 2 E ) + y ( D 1 D 3 ) + α y ( E 1 E ) )
F ( y ) = y ( 1 y ) ( π 1 C 1 π 2 + ( θ 1 + α x ) ( E E 1 ) + ( θ 2 + β x ) ( E 2 E ) )

3.2. System Equilibrium Stability Analysis

According to evolutionary game theory, by setting the replicator dynamics equations to zero (i.e., d x d t = 0 , d y d t = 0 ), we can identify five potential equilibrium points within the plane N = ( x , y ) 0 x 1 , 0 y 1 . These equilibrium points are P 1 ( 0 , 0 ) ,   P 2 ( 0 , 1 ) ,   P 3 ( 1 , 0 ) ,   P 4 ( 1 , 1 ) ,   P 5 ( x 0 , y 0 ) , 0 x 0 , y 0 1 . Where
x 0 = π 2 + C 1 π 1 + θ 1 ( E 1 E ) + θ 2 ( E E 2 ) / ( α ( E E 1 ) + β ( E 2 E ) )
y 0 = ( C 2 D 2 D 3 + β ( E E 2 ) / ( D 1 D 3 + β ( E E 2 ) + α ( E 1 E ) ) ,
According to evolutionary game theory, the stable equilibrium point (ESS) for an individual agent is achieved when the replicator dynamic equation equals zero and its first derivative is less than zero. The analysis of the government’s individual equilibrium stability is as follows:
G ( y ) = ( D 2 C 2 + D 3 + β ( E 2 E ) + y ( D 1 D 3 + β ( E E 2 ) + α ( E 1 E ) )
y * = ( C 2 D 2 D 3 + β ( E E 2 ) / ( D 1 D 3 + β ( E E 2 ) + α ( E 1 E ) )
Similarly, the analysis of the steel enterprise’s individual equilibrium stability is as follows:
T ( x ) = ( π 1 C 1 π 2 + θ 1 ( E E 1 ) + θ 2 ( E 2 E ) + x ( α ( E E 1 ) + β ( E 2 E ) )
x * = π 2 + C 1 π 1 + θ 1 ( E 1 E ) + θ 2 ( E E 2 ) / ( α ( E E 1 ) + β ( E 2 E ) )

3.3. Stability Analysis of the Evolutionary Game System

The stability of the system’s equilibrium points is determined by analyzing the local stability of the Jacobian matrix (J). The Jacobian matrix of the evolutionary system, derived from the replicator dynamics equations, is expressed as follows:
A ( x , y ) = d F ( x ) d x d F ( x ) d y d F ( y ) d x d F ( y ) d y = ( 1 2 x ) ( D 2 C 2 + D 3 + β ( 1 y ) ( E 2 E ) + y ( D 1 D 3 ) + α y ( E 1 E ) ) x ( 1 x ) ( D 1 D 3 ) + α y ( E 1 E ) ) y ( 1 y ) ( α ( E E 1 ) + β ( E 2 E ) ) ( 1 2 y ) ( π 1 C 1 π 2 + ( θ 1 + α x ) ( E E 1 ) + ( θ 2 + β x ) ( E 2 E ) ) ( 1 2 x ) ( D 2 C 2 + D 3 + β ( 1 y ) ( E 2 E ) + y ( D 1 D 3 ) + α y ( E 1 E ) ) x ( 1 x ) ( D 1 D 3 ) + α y ( E 1 E ) ) y ( 1 y ) ( α ( E E 1 ) + β ( E 2 E ) ) ( 1 2 y ) ( π 1 C 1 π 2 + ( θ 1 + α x ) ( E E 1 ) + ( θ 2 + β x ) ( E 2 E ) )
The expressions for the determinant (Det(J)) and trace (Tr(J)) of the Jacobian matrix corresponding to each equilibrium point are calculated and listed in Table 3.
Based on the det(J) and tr(J) conditions, the system evolves into four distinct stable states depending on the parameter configurations. We classify these scenarios to interpret their policy implications for the steel industry:
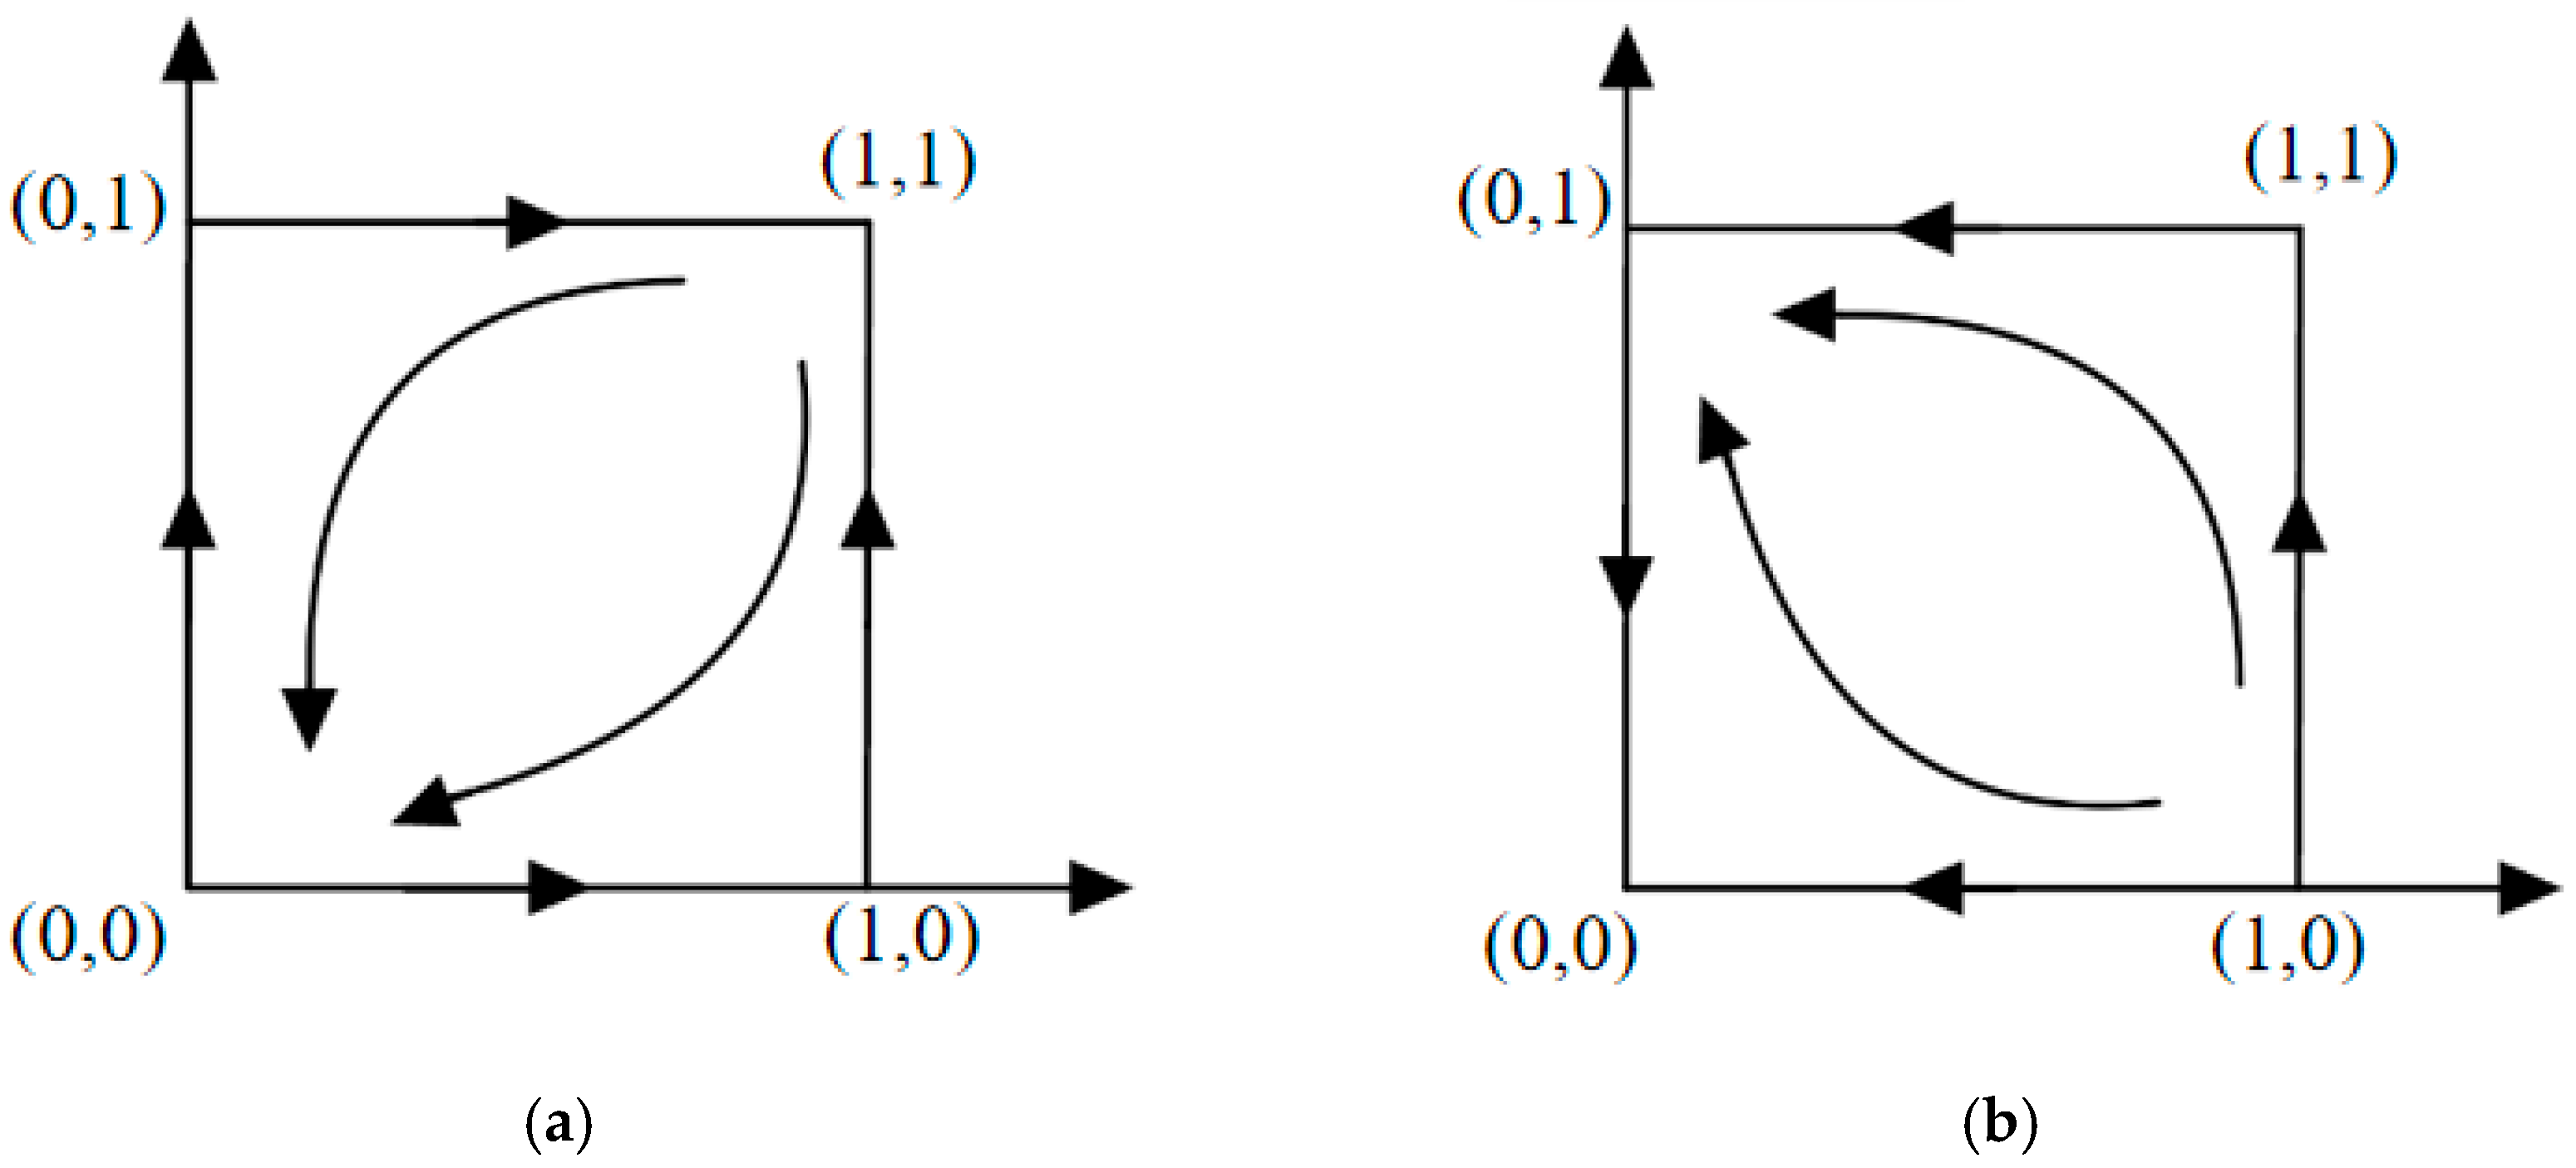
Scenario 1: When D 2 C 2 + D 3 + β ( E 2 E ) < 0 ( π 1 C 1 π 2 + θ 1 ( E E 1 ) + θ 2 ( E 2 E ) ) < 0 , the Evolutionarily Stable Strategy of the evolutionary system is P 1 ( 0 , 0 ) . For specific evolutionary trajectories, please refer to Figure 2a. This means the net benefit of inaction exceeds that of action for both parties. This represents a state of regulatory absence. It typically occurs when carbon quotas are set too loosely or environmental inspection intensity is weak, making the cost of compliance higher than the cost of violation. Consequently, steel enterprises are locked into traditional high-carbon production paths to maximize short-term profits.
Scenario 2: When ( C 2 D 2 D 1 + α ( E E 1 ) ) > 0 ( π 1 C 1 π 2 + θ 1 ( E E 1 ) + θ 2 ( E 2 E ) ) > 0 , the Evolutionarily Stable Strategy of the evolutionary system is P 2 ( 0 , 1 ) . For specific evolutionary trajectories, please refer to Figure 2b. Although the government provides subsidies, the penalty coefficient is insufficient to deter pollution, or the subsidy fails to cover the high abatement costs. In this case, government funds are wasted as enterprises engage in speculative behavior, accepting minor penalties rather than investing in deep decarbonization.
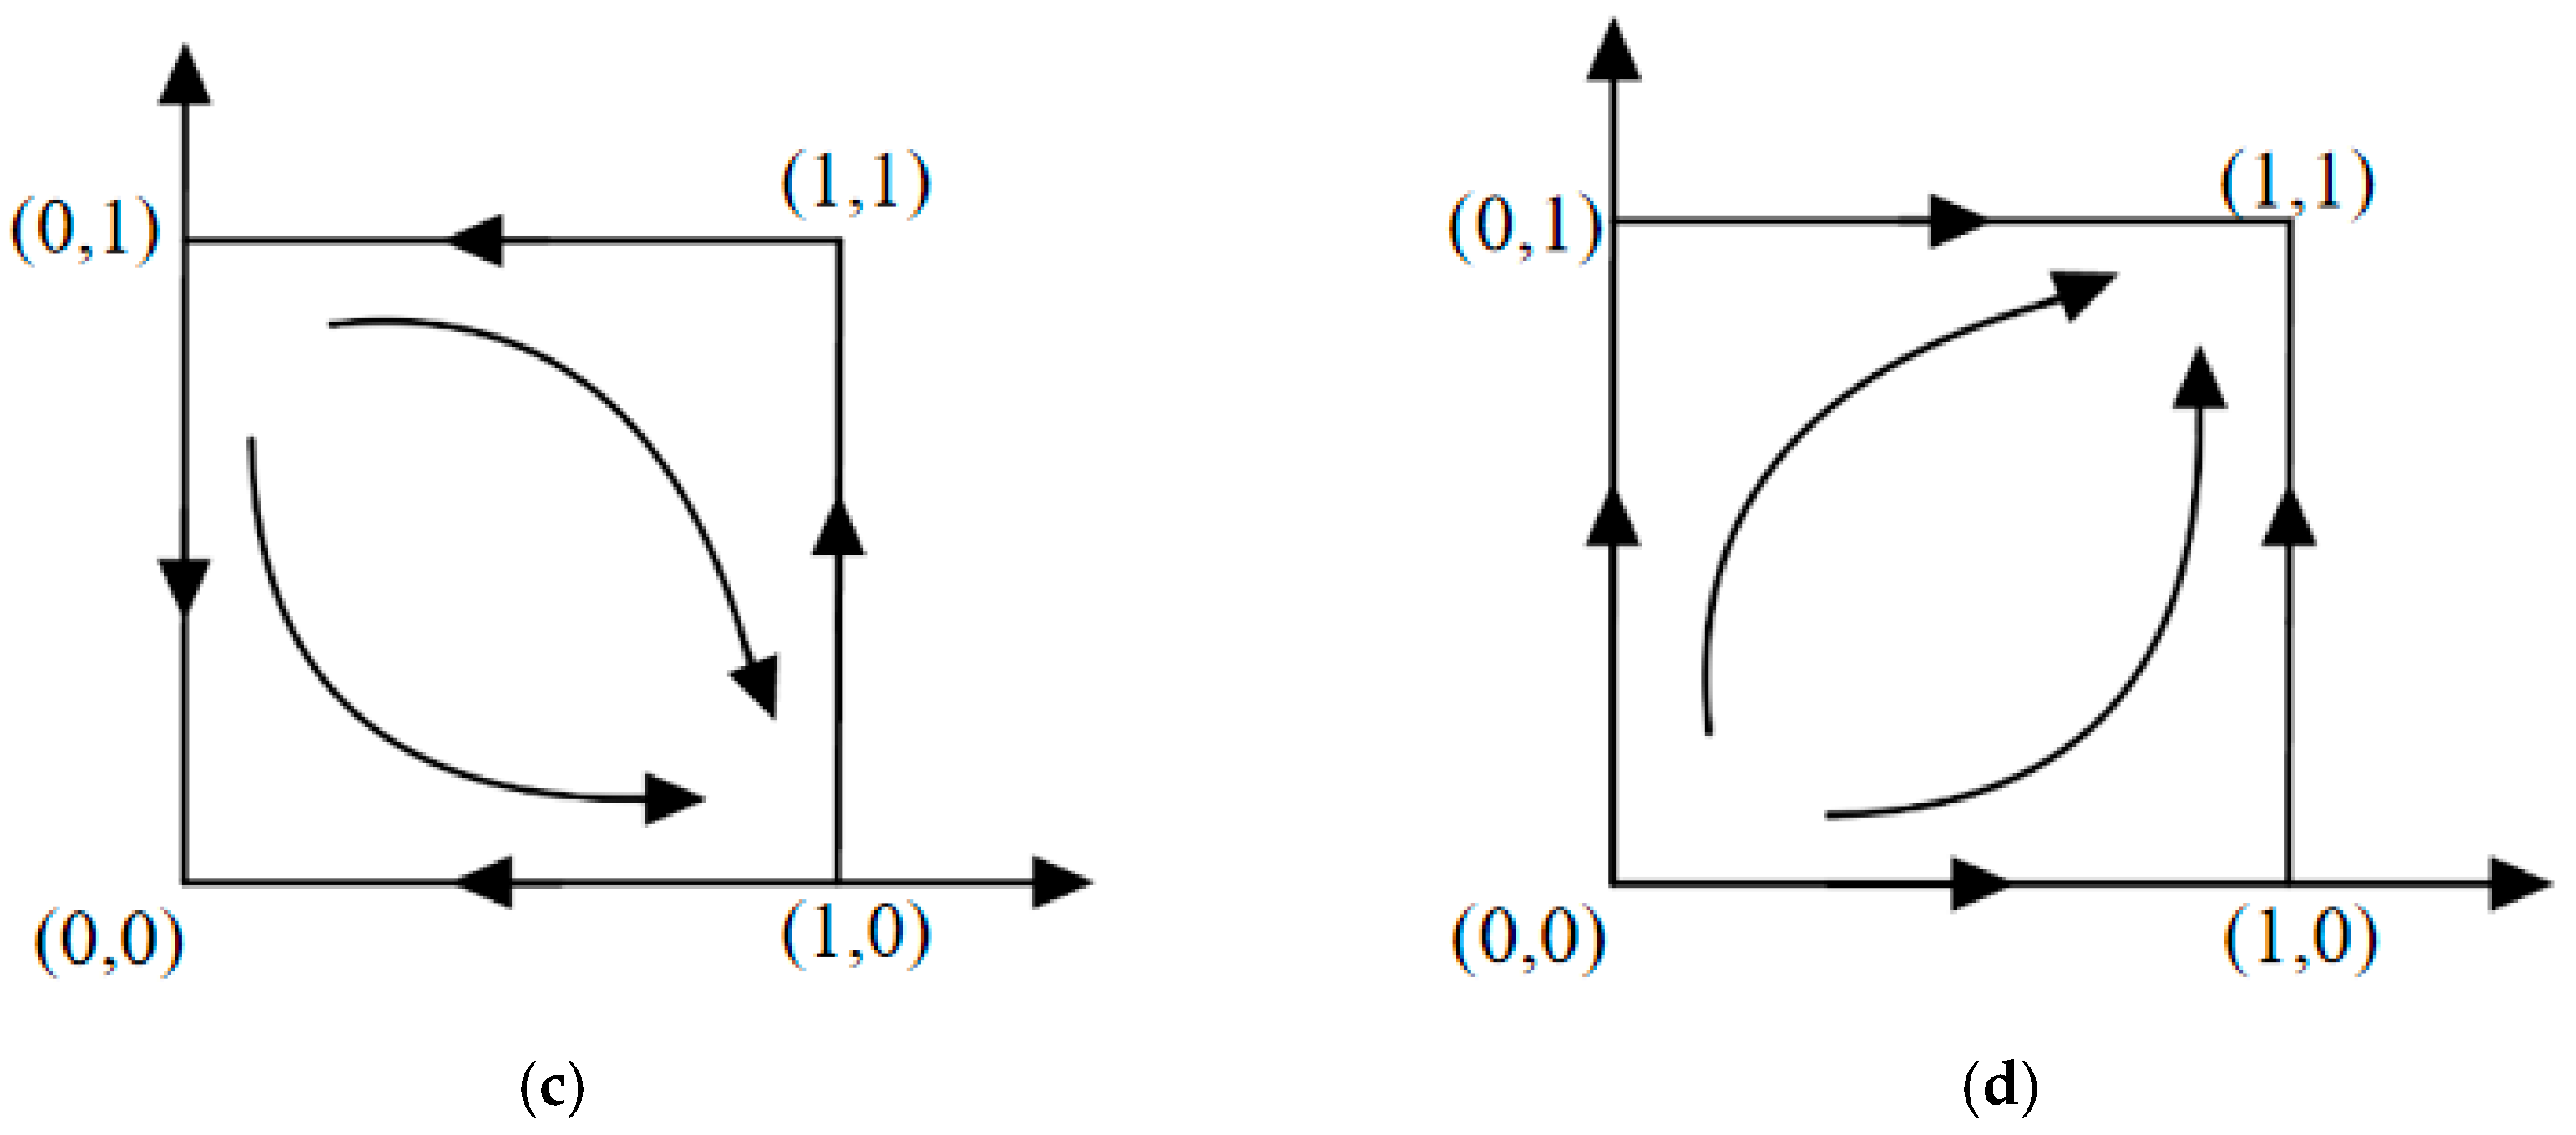
Scenario 3: When ( D 2 C 2 + D 3 + β ( E 2 E ) ) > 0 ( π 2 + C 1 π 1 + ( θ 1 + α ) ( E 1 E ) + ( θ 2 + β ) ( E E 2 ) ) > 0 , the Evolutionarily Stable Strategy of the evolutionary system is P 3 ( 1 , 0 ) . For specific evolutionary trajectories, please refer to Figure 2c. This scenario represents a mature market-driven stage. Strong demand-side constraints, characterized by significant consumer premiums and the market exclusion of high-carbon products, generate sufficient revenue to offset abatement costs. Consequently, the government can implement a policy retreat, reducing administrative intervention while the industry autonomously sustains green operations.
Scenario 4: When ( C 2 D 2 D 1 + α ( E E 1 ) ) < 0 ( π 2 + C 1 π 1 + ( θ 1 + α ) ( E 1 E ) + ( θ 2 + β ) ( E E 2 ) ) < 0 , the Evolutionarily Stable Strategy (ESS) of the evolutionary system is P 4 ( 1 , 1 ) (Government policy support, Enterprise clean production). For specific evolutionary trajectories, please refer to Figure 2d. Under the condition of consumer-side constraints, the evolutionary game system between the government and steel enterprises exhibits four stable strategic states, with each strategy accompanied by specific stability conditions. As the values of relevant parameters change, the strategies adopted by the government and steel enterprises will adjust accordingly. Furthermore, when: D 2 C 2 + D 3 + β ( E 2 E ) < 0 ( π 1 C 1 π 2 + θ 1 ( E E 1 ) + θ 2 ( E 2 E ) ) < 0 ( C 2 D 2 D 1 + α ( E E 1 ) ) > 0 ( π 1 C 1 π 2 + ( θ 1 + α ) ( E E 1 ) + ( θ 2 + β ) ( E 2 E ) ) > 0 , the stable points of the evolutionary system are E 1 ( 0 , 0 ) and E 4 ( 1 , 1 ) . Specific details are shown in Table 4.
The determinant of the Jacobian matrix at the interior equilibrium P5(x0,y0) is zero, indicating that it is a non-hyperbolic point where local linear stability analysis is inconclusive. Economically, this point corresponds to a state where the marginal incentives for both the government and the enterprise are exactly balanced.

4. Simulation Analysis of the Evolutionary Game Model

As indicated by the analysis in Section 3, the evolutionary outcome of the system depends on the specific values of the initial parameters. To ensure the rigor and validity of the results and discussion, this section performs parameter assignment using data sources such as the Provincial Greenhouse Gas Inventories and the China Emission Accounts and Datasets (CEADs). In cases where the results fail to reach a stable state under initial conditions, adjustments are made through a sensitivity analysis of the coefficients. The objective is to determine the fluctuation ranges of various influence coefficients that can effectively promote the evolution of steel enterprises toward emission reduction strategies.

4.1. Parameter Calibration and Assignment

In terms of CO2 emissions, according to research data from the Centre for Research on Energy and Clean Air (CREA) in 2024, the carbon emission intensity of China’s steel industry is ranked second only to that of the power sector; its total emissions account for 17% of the national total [25], making it the second-largest source of carbon emissions. Given Zhejiang Province’s pioneering role in low-carbon transition and high-quality development, this paper sets empirical parameters based on the case of the steel industry in Zhejiang. According to the 2022 Zhejiang Provincial Greenhouse Gas Inventory Report calculated by our research team and statistical data on the local steel industry, the CO2 emissions from the steel production process in Zhejiang Province in 2022 amounted to 2.3759 million tons. The carbon emission volume under the enterprise’s routine production scenario is set as E2 = 240 (104 tons). Field surveys indicate that the actual carbon emissions of steel enterprises in Zhejiang Province slightly exceed the government-issued quotas; therefore, the government-allocated carbon quota is set as E = 215(104 tons). Under the active emission reduction scenario, enterprises can control emissions below the quota and generate a surplus; thus, the emission volume under the active reduction strategy is set as E1 = 200(104 tons). According to relevant studies, under a stable development scenario, the average carbon abatement cost for China’s steel industry is 433 CNY/ton CO2 [26] (For simplicity, “CNY/ton” is used as the standard unit hereinafter). Assuming that future abatement costs will continue to decrease under stable conditions, the abatement cost is set as C1 = 420 CNY/ton. Since government support investment is generally lower than enterprise operational investment [27], the government support cost is set as C2 = 350 CNY/ton. Analyses indicate that the marginal benefit of abatement policies approximates the implementation cost; consequently, the profit parameter for enterprise clean production is calculated and set as π1 = 840 CNY/ton. As the comprehensive benefits of implementing abatement strategies are approximately 20% higher than the non-abatement baseline [28], the profit from routine production is set as π2 = 700 CNY/ton. Furthermore, considering that consumer low-carbon preference increases demand for green products [29], and referencing BCG’s (2023) research on low-carbon product premiums (willingness to pay is 3–12% higher) [30], the positive and negative consumer product coefficients are set as θ1 = 10,θ2 = 5.
D3 represents the erosion of government credibility triggered by consumer supervision. When the government fails to disclose information on polluting enterprises in a timely manner, consumer groups may exert accountability pressure through administrative appeals and the escalation of public opinion. Government failure in environmental governance induces dual losses: first, a decline in industrial economic indicators (e.g., in the first quarter of 2020, China’s industrial output contracted by 8.5% due to economic stagnation); second, a loss of government trust capital. Based on damage correlation assessments, the government reputation loss D3 caused by consumer supervision is equivalent to 10% of the enterprise’s non-abatement profit π2 [31]. Therefore, we calculated D3 = 700 × 10% = 70.
Similarly, D1 represents the government’s reputation gain under consumer low-carbon preferences. Although this gain is difficult to quantify directly as part of enterprise revenue, it acts as a potential and indirect benefit by enhancing consumer trust and market competitiveness. In recent years, the reputation gain obtained by the government after taking active measures in the international context is comparable to the reputation loss D3 [31]; thus, it is set as 70 CNY/ton.
According to the 2022 Zhejiang Steel Statistical Report, the unit for carbon emissions is ten thousand tons (104 tons). To ensure dimensional consistency in the simulation matrix, the relevant monetary parameters (CNY/ton) are scaled to correspond with the magnitude of the emission units. The initial values, which reflect the operational status of the Zhejiang steel industry, are expressed as follows:
π1 = 840, π2 = 700, C1 = 420, C2 = 350, E = 215, E1 = 200, E2 = 240, D1 = 70, D2 = 60, D3 = 70, θ1 = 10, θ2 = 5, α = 10, β = 10
By constructing a payoff matrix and keeping other parameters constant, this paper treats the adjustment of parameters related to the government and consumers (α, β, θ) as policy tools. This approach is used to simulate the evolutionary process of enterprise behavior under different policy orientations.

4.2. Data Simulation Analysis

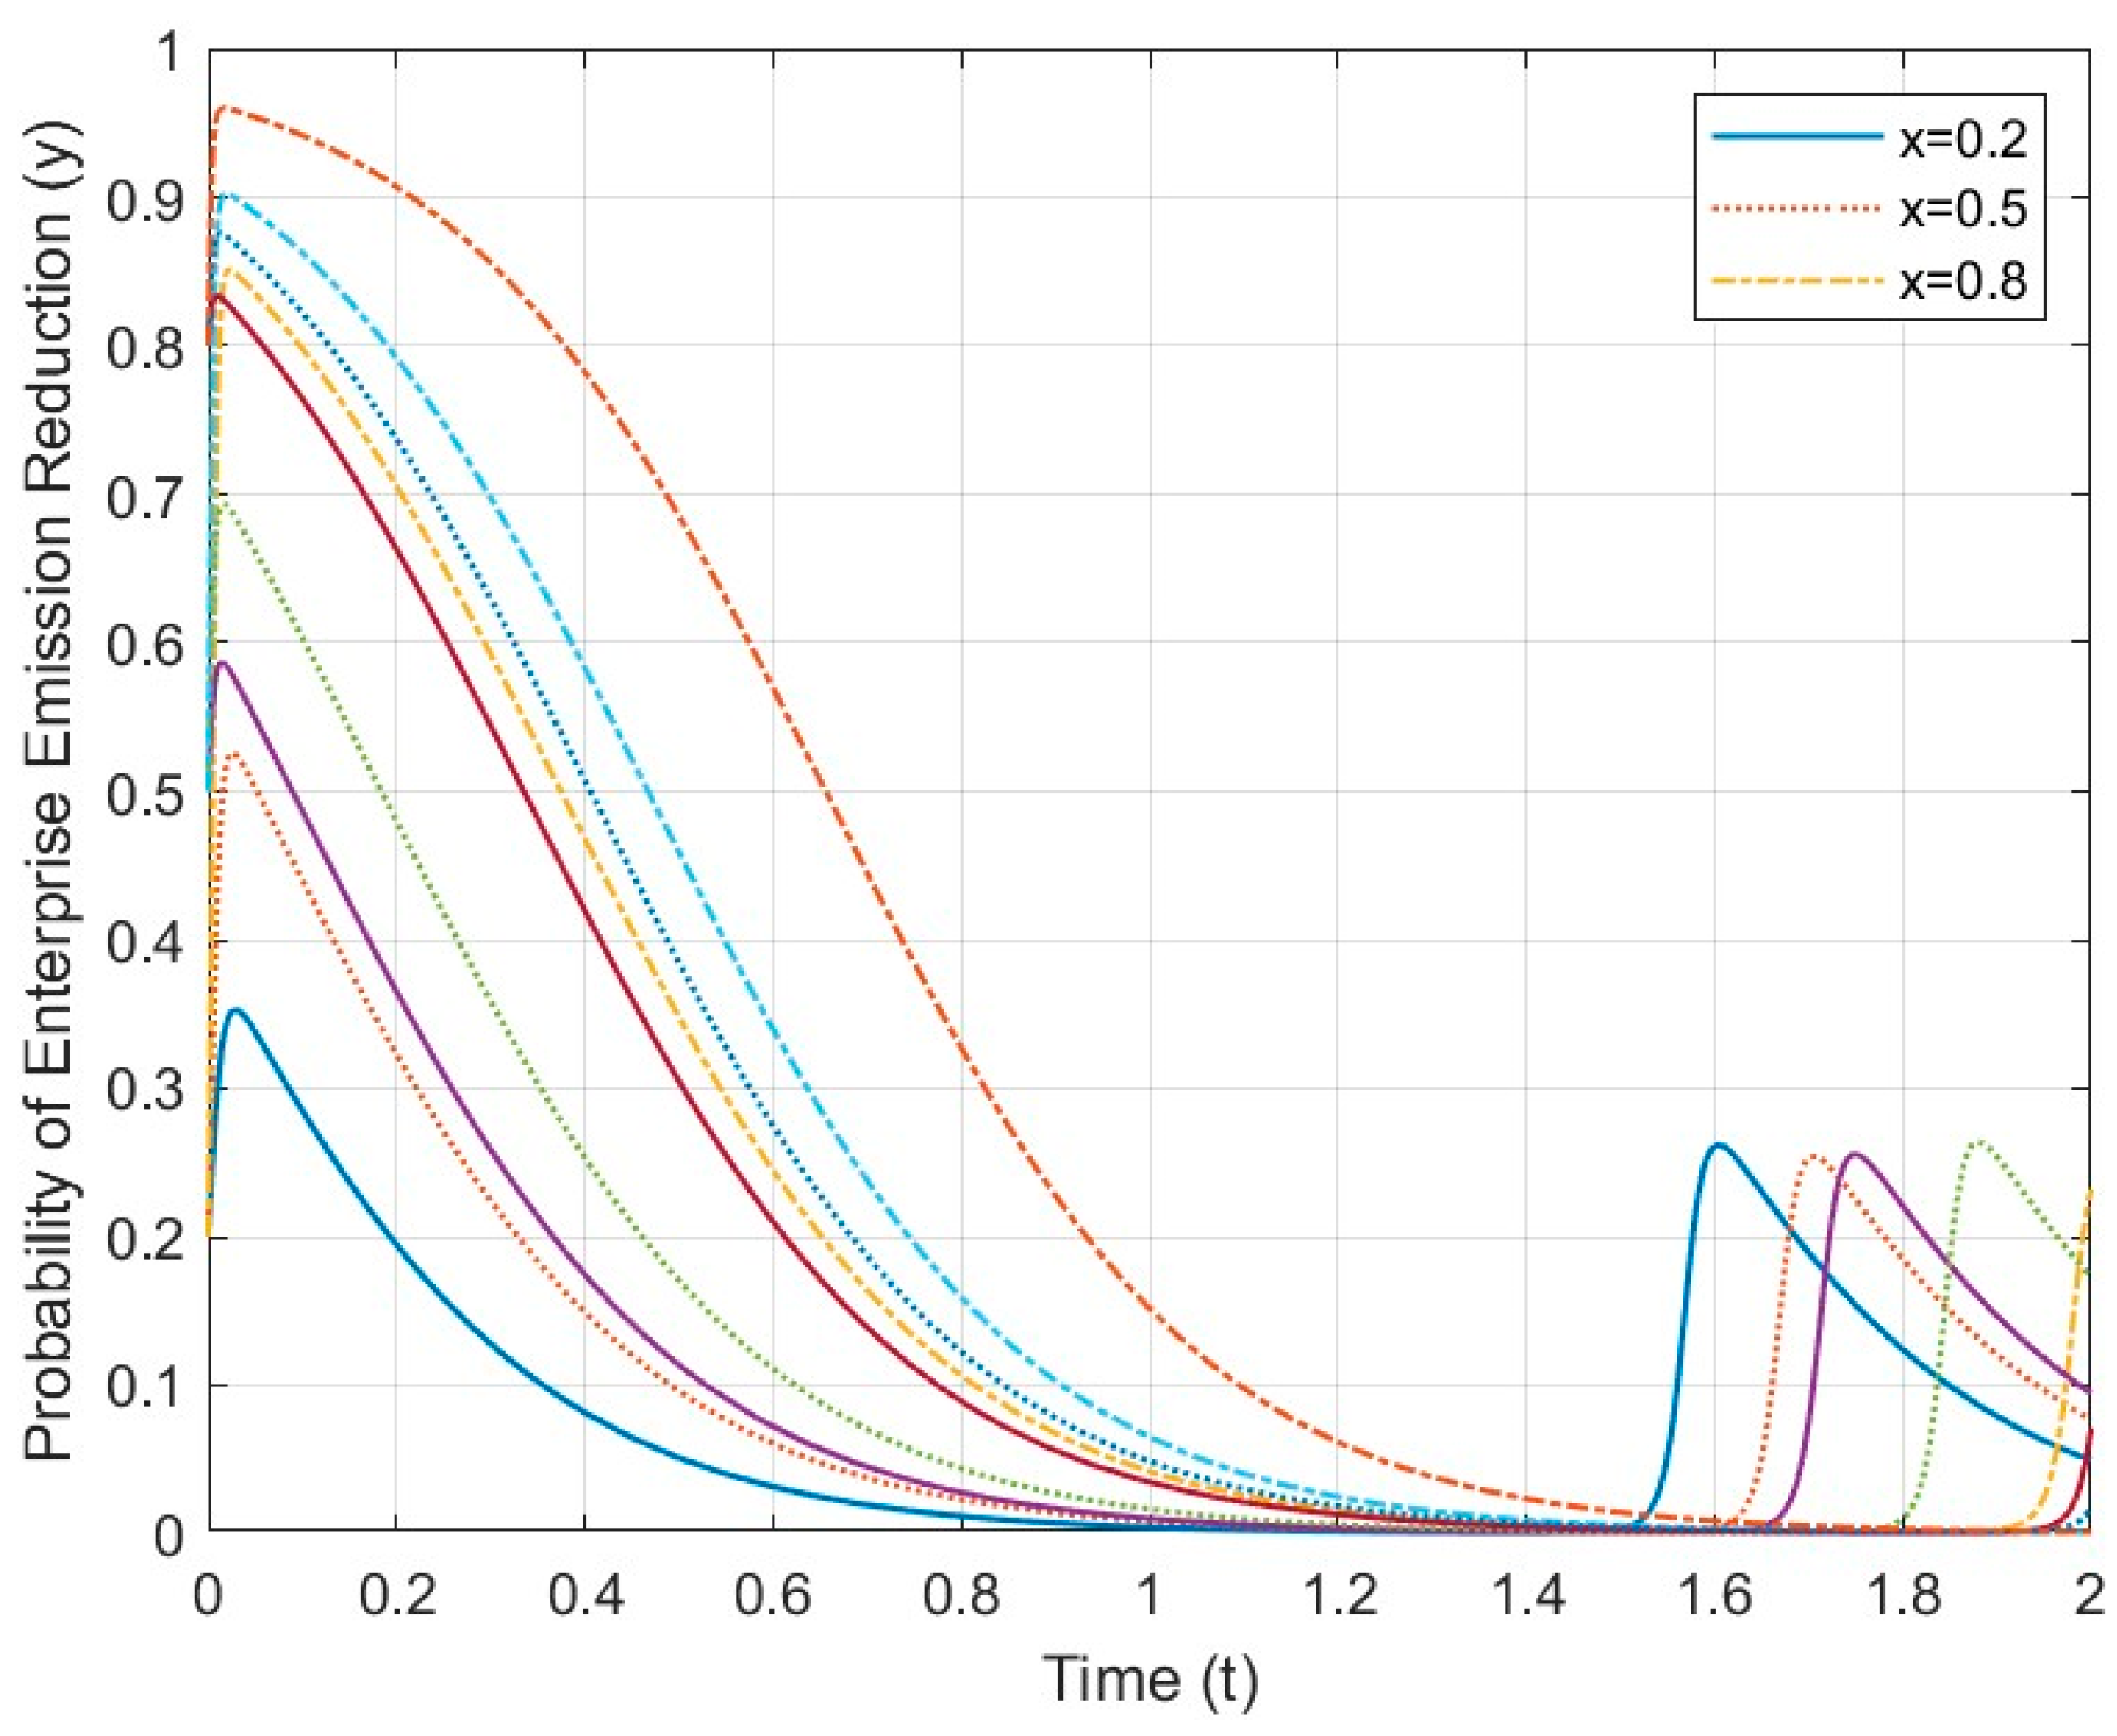
Initial State Analysis: Under the initial scenario of θ1 = 10, θ2 = 5, α = 10, and β = 10, regardless of how high the initial probability of government support is, enterprises will eventually converge to the “routine production” strategy (as shown in Figure 3). At this point, the system satisfies the condition where the sum of the government’s penalty revenue from enterprises and the reputation gain based on consumer low-carbon preference is lower than the cost of providing policy support. Simultaneously, the total revenue for enterprises adopting clean production is lower than that of maintaining routine production. That is ( π 1 C 1 π 2 + θ 1 ( E E 1 ) + θ 2 ( E 2 E ) ) < 0 D 2 C 2 + D 3 + β ( E 2 E ) < 0 .
The simulation results indicate that under different initial willingness levels (0.2/0.5/0.8), the strategic interaction mechanism between enterprises and the government reveals that the evolution of the government’s support policy probability has a significant regulatory effect on enterprise emission reduction decisions. Specifically, government agents with lower initial willingness values demonstrate stronger sensitivity to strategy adjustments; their rapid-response policy regulation behavior is transmitted to enterprise decisions through the game payoff function. Notably, the evolutionary trajectory of enterprise agents exhibits common characteristics independent of initial willingness: in the initial stage of evolution, they all show a preference for non-reduction strategies, followed by a phase of periodic strategic oscillation. The increase in government support probability enhances the revenue advantage of the enterprise’s emission reduction strategy by adjusting the utility weights of the subsidy coefficient and the penalty coefficient, thereby driving the strategic equilibrium to shift towards emission reduction. However, the emission reduction behavior of enterprises possesses distinct short-term strategic characteristics. Although willingness increases rapidly and reaches a peak in the initial stage of the game, due to the lack of long-term stable incentives, this willingness is maintained only briefly before declining rapidly, ultimately leading to the stagnation of emission reduction actions. This evolutionary pattern is universal under different initial willingness conditions, and the dynamic inflection point uniformly appears at the time node t = 1.5.
From the perspective of phase space analysis, this result indicates that under the current empirical parameters, the basin of attraction for the undesirable equilibrium effectively covers 100% of the feasible domain. This implies that the system faces a structural lock-in rather than a conditional failure; regardless of the magnitude of the government’s initial political will (x0), the system lacks an internal mechanism to sustain the high-level equilibrium. This quantification underscores the scale of the challenge: breaking this global deadlock requires structural parameter reforms (e.g., introducing strong demand-side constraints) rather than merely adjusting initial strategic intensities.
Further analysis reveals that the initial probability of government support significantly influences the duration of the inclination toward clean production in steel enterprises. A high initial support probability can transiently stimulate this inclination, providing a valuable “window of opportunity” for the government to implement policy interventions during critical stages. Furthermore, the transient recovery tendency observed when the enterprise’s willingness to reduce emissions drops to zero suggests that some enterprises, despite attempting innovation, failed to successfully implement the “mutation” strategy. Consequently, an in-depth investigation into the causes of failure in low-carbon innovation among these enterprises—particularly regarding potential issues such as low input-output efficiency—is of great significance for fostering sustained emission reduction by enterprises.

4.3. Sensitivity Analysis

The market selection mechanism on the consumer side (i.e., “purchasing low-carbon products” and “rejecting high-carbon products”) serves as a critical external force constraining enterprise production decisions. Given that consumer willingness is difficult to quantify directly, this paper operationalizes it into a positive product coefficient (θ1) and a negative product coefficient (θ2), adopting the enterprise’s carbon emission differential (δE) as the variable associated with these coefficients. To verify the rationality of the parameter settings and the robustness of the model, this section conducts a sensitivity analysis on the core parameters. By simulating the system’s evolutionary paths under different scenarios, this study assesses the marginal impact of parameter variations on the decision-making of both the government and enterprises.

4.3.1. Impact of the Positive Low-Carbon Product Coefficient (θ1) on the Probability of Enterprise Emission Reduction (y)

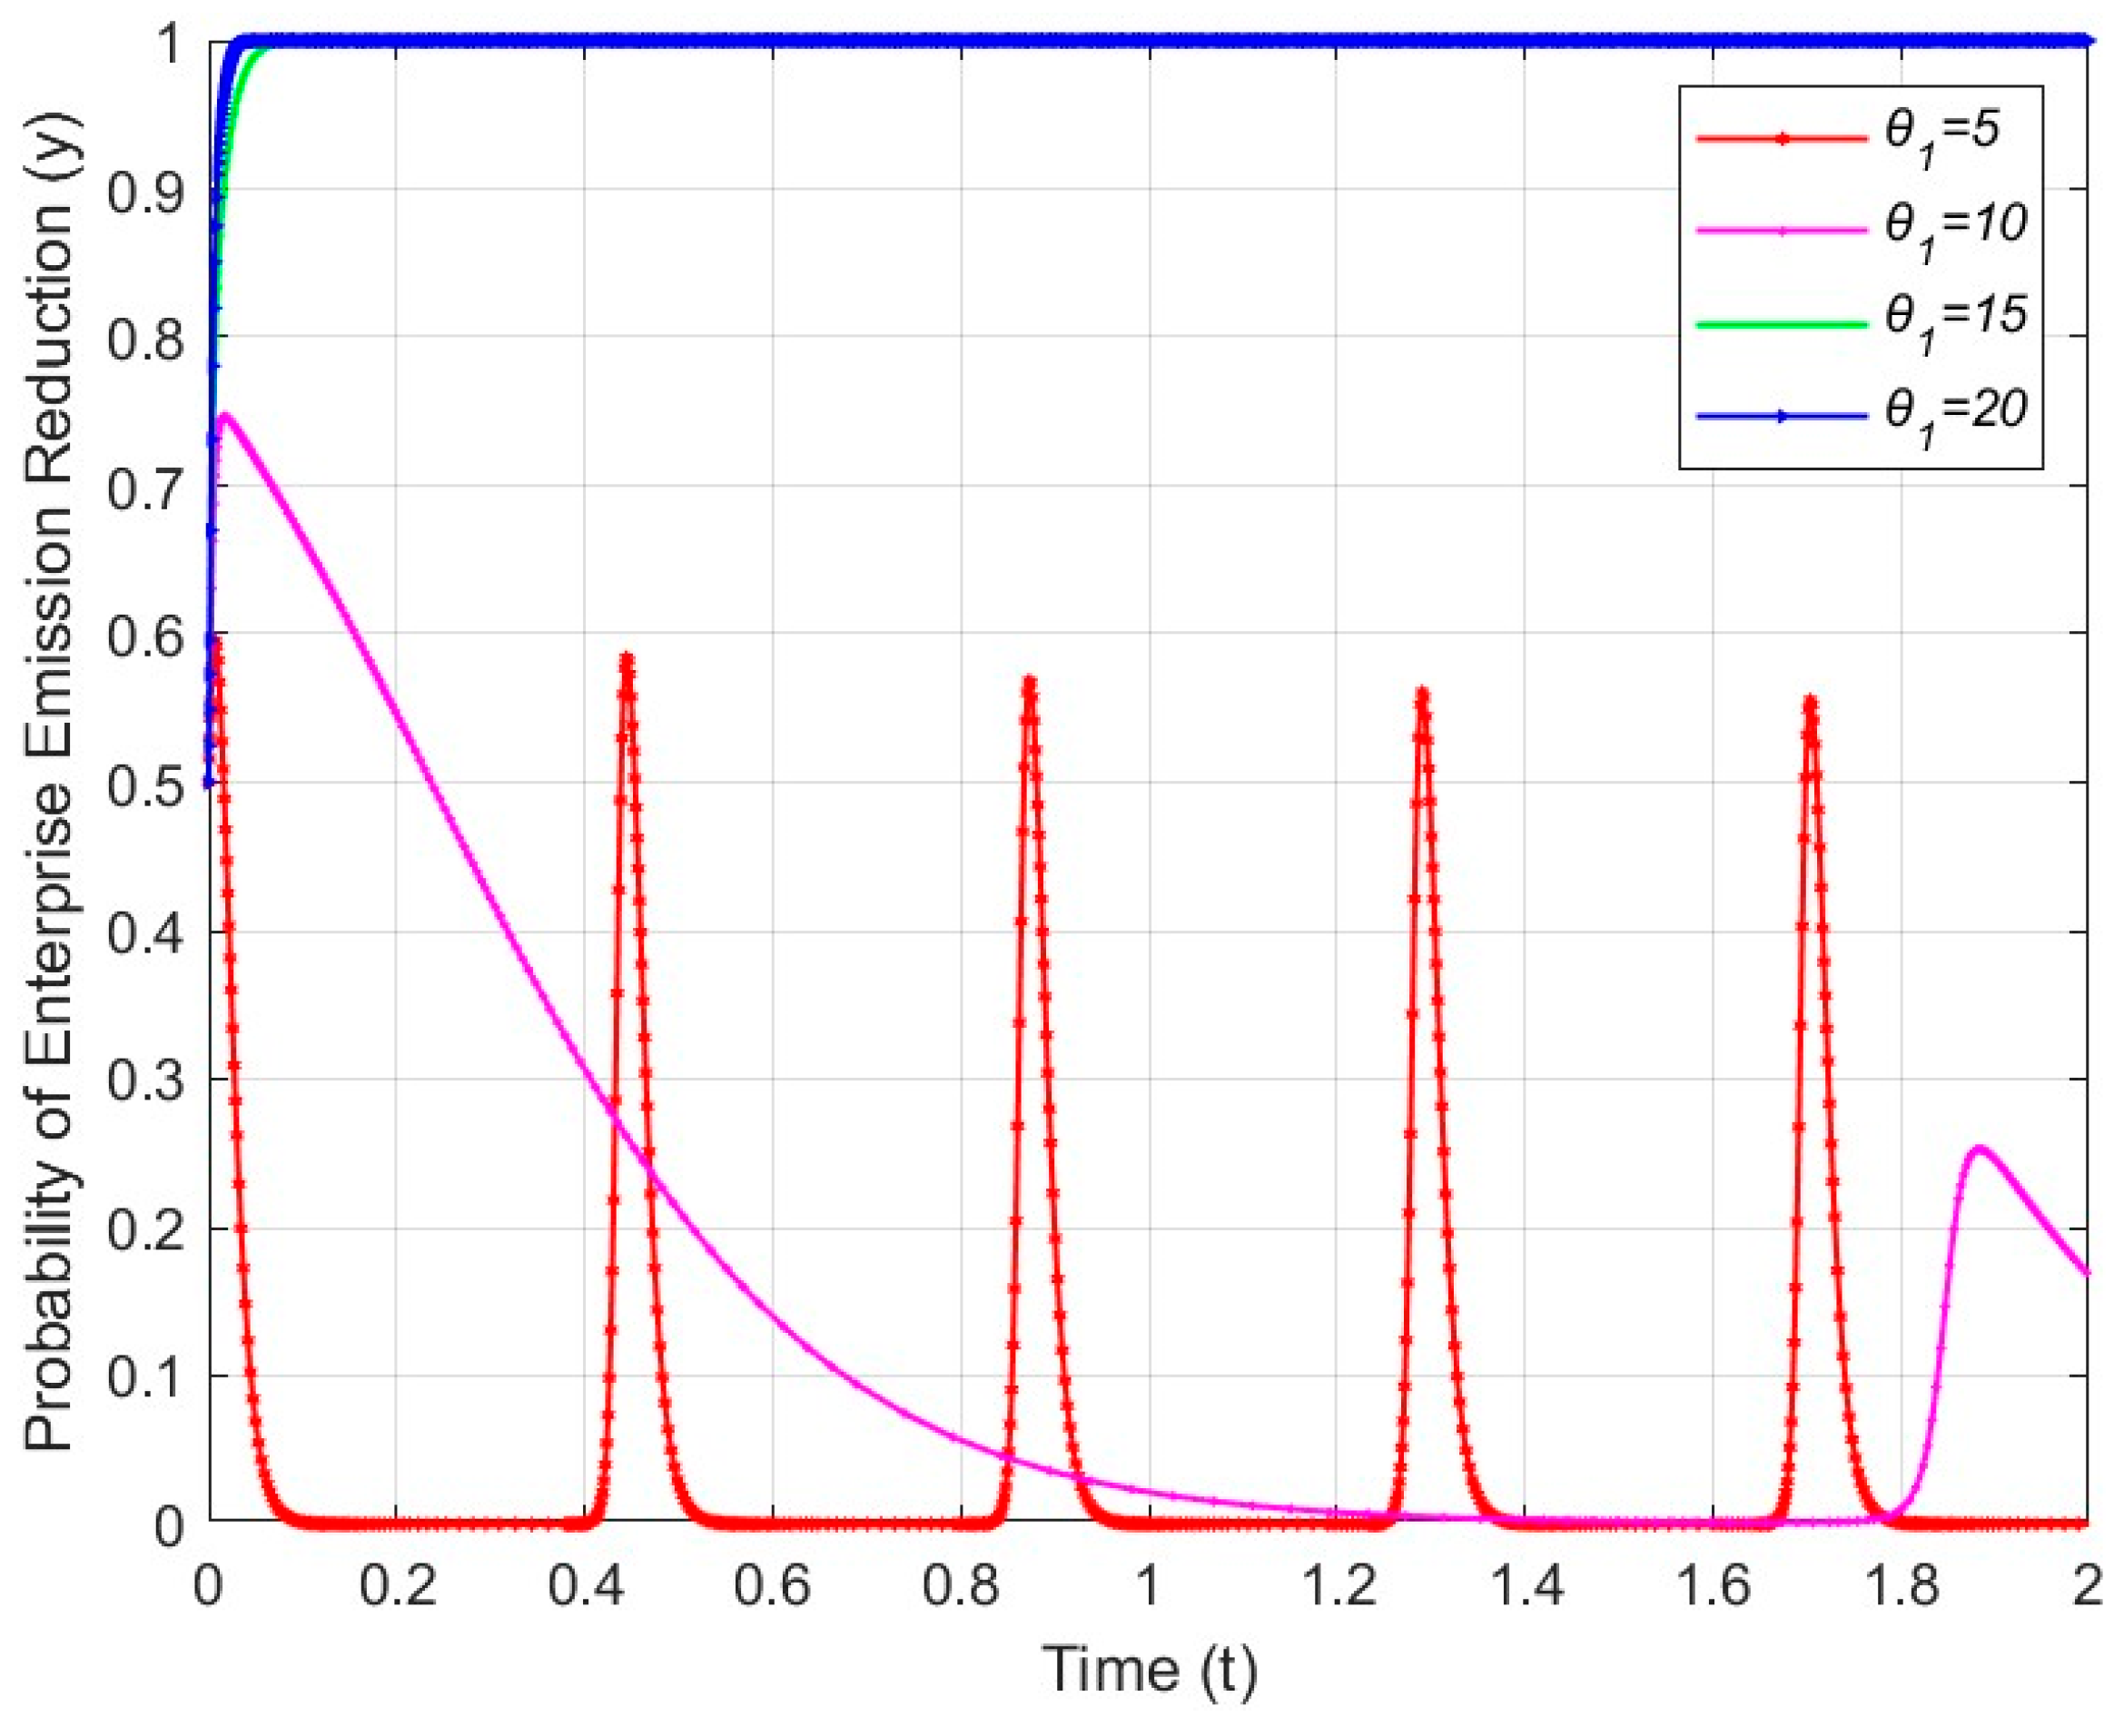
The consumer-side response mechanism constrains enterprise production decisions through green premiums (θ1) and market rejection (θ2). With initial probabilities set at 0.5, when θ1 = 5, the system exhibits high-frequency oscillation but remains inclined toward routine production (Figure 4). Mechanistically, this relapse is caused by the negative feedback loop of policy dependency: the initial surge in clean production (y) is supported solely by the government’s high support probability (x). However, when the consumer product coefficient (θ1) is below the critical threshold, the intrinsic market revenue fails to cover the abatement costs. Once the government reduces its support intensity (x) due to cost pressures, the net benefit of emission reduction turns negative, causing the enterprise’s strategy to collapse. This finding aligns with Fang et al. [31], who identified such transient surges as a “window period” resulting from the absence of long-term stable incentives. Only when θ1 reaches a critical threshold (θ1 = 15 in this case) does the system rapidly converge to the clean production strategy. The sensitivity analysis suggests that consumer preference exhibits a significant threshold effect: only when positive incentives reach a specific critical point can they effectively trigger a strategic mutation, driving a complete transition to a stable green mode.

4.3.2. Impact of the Negative Low-Carbon Product Coefficient (θ2) on the Probability of Enterprise Emission Reduction (y)

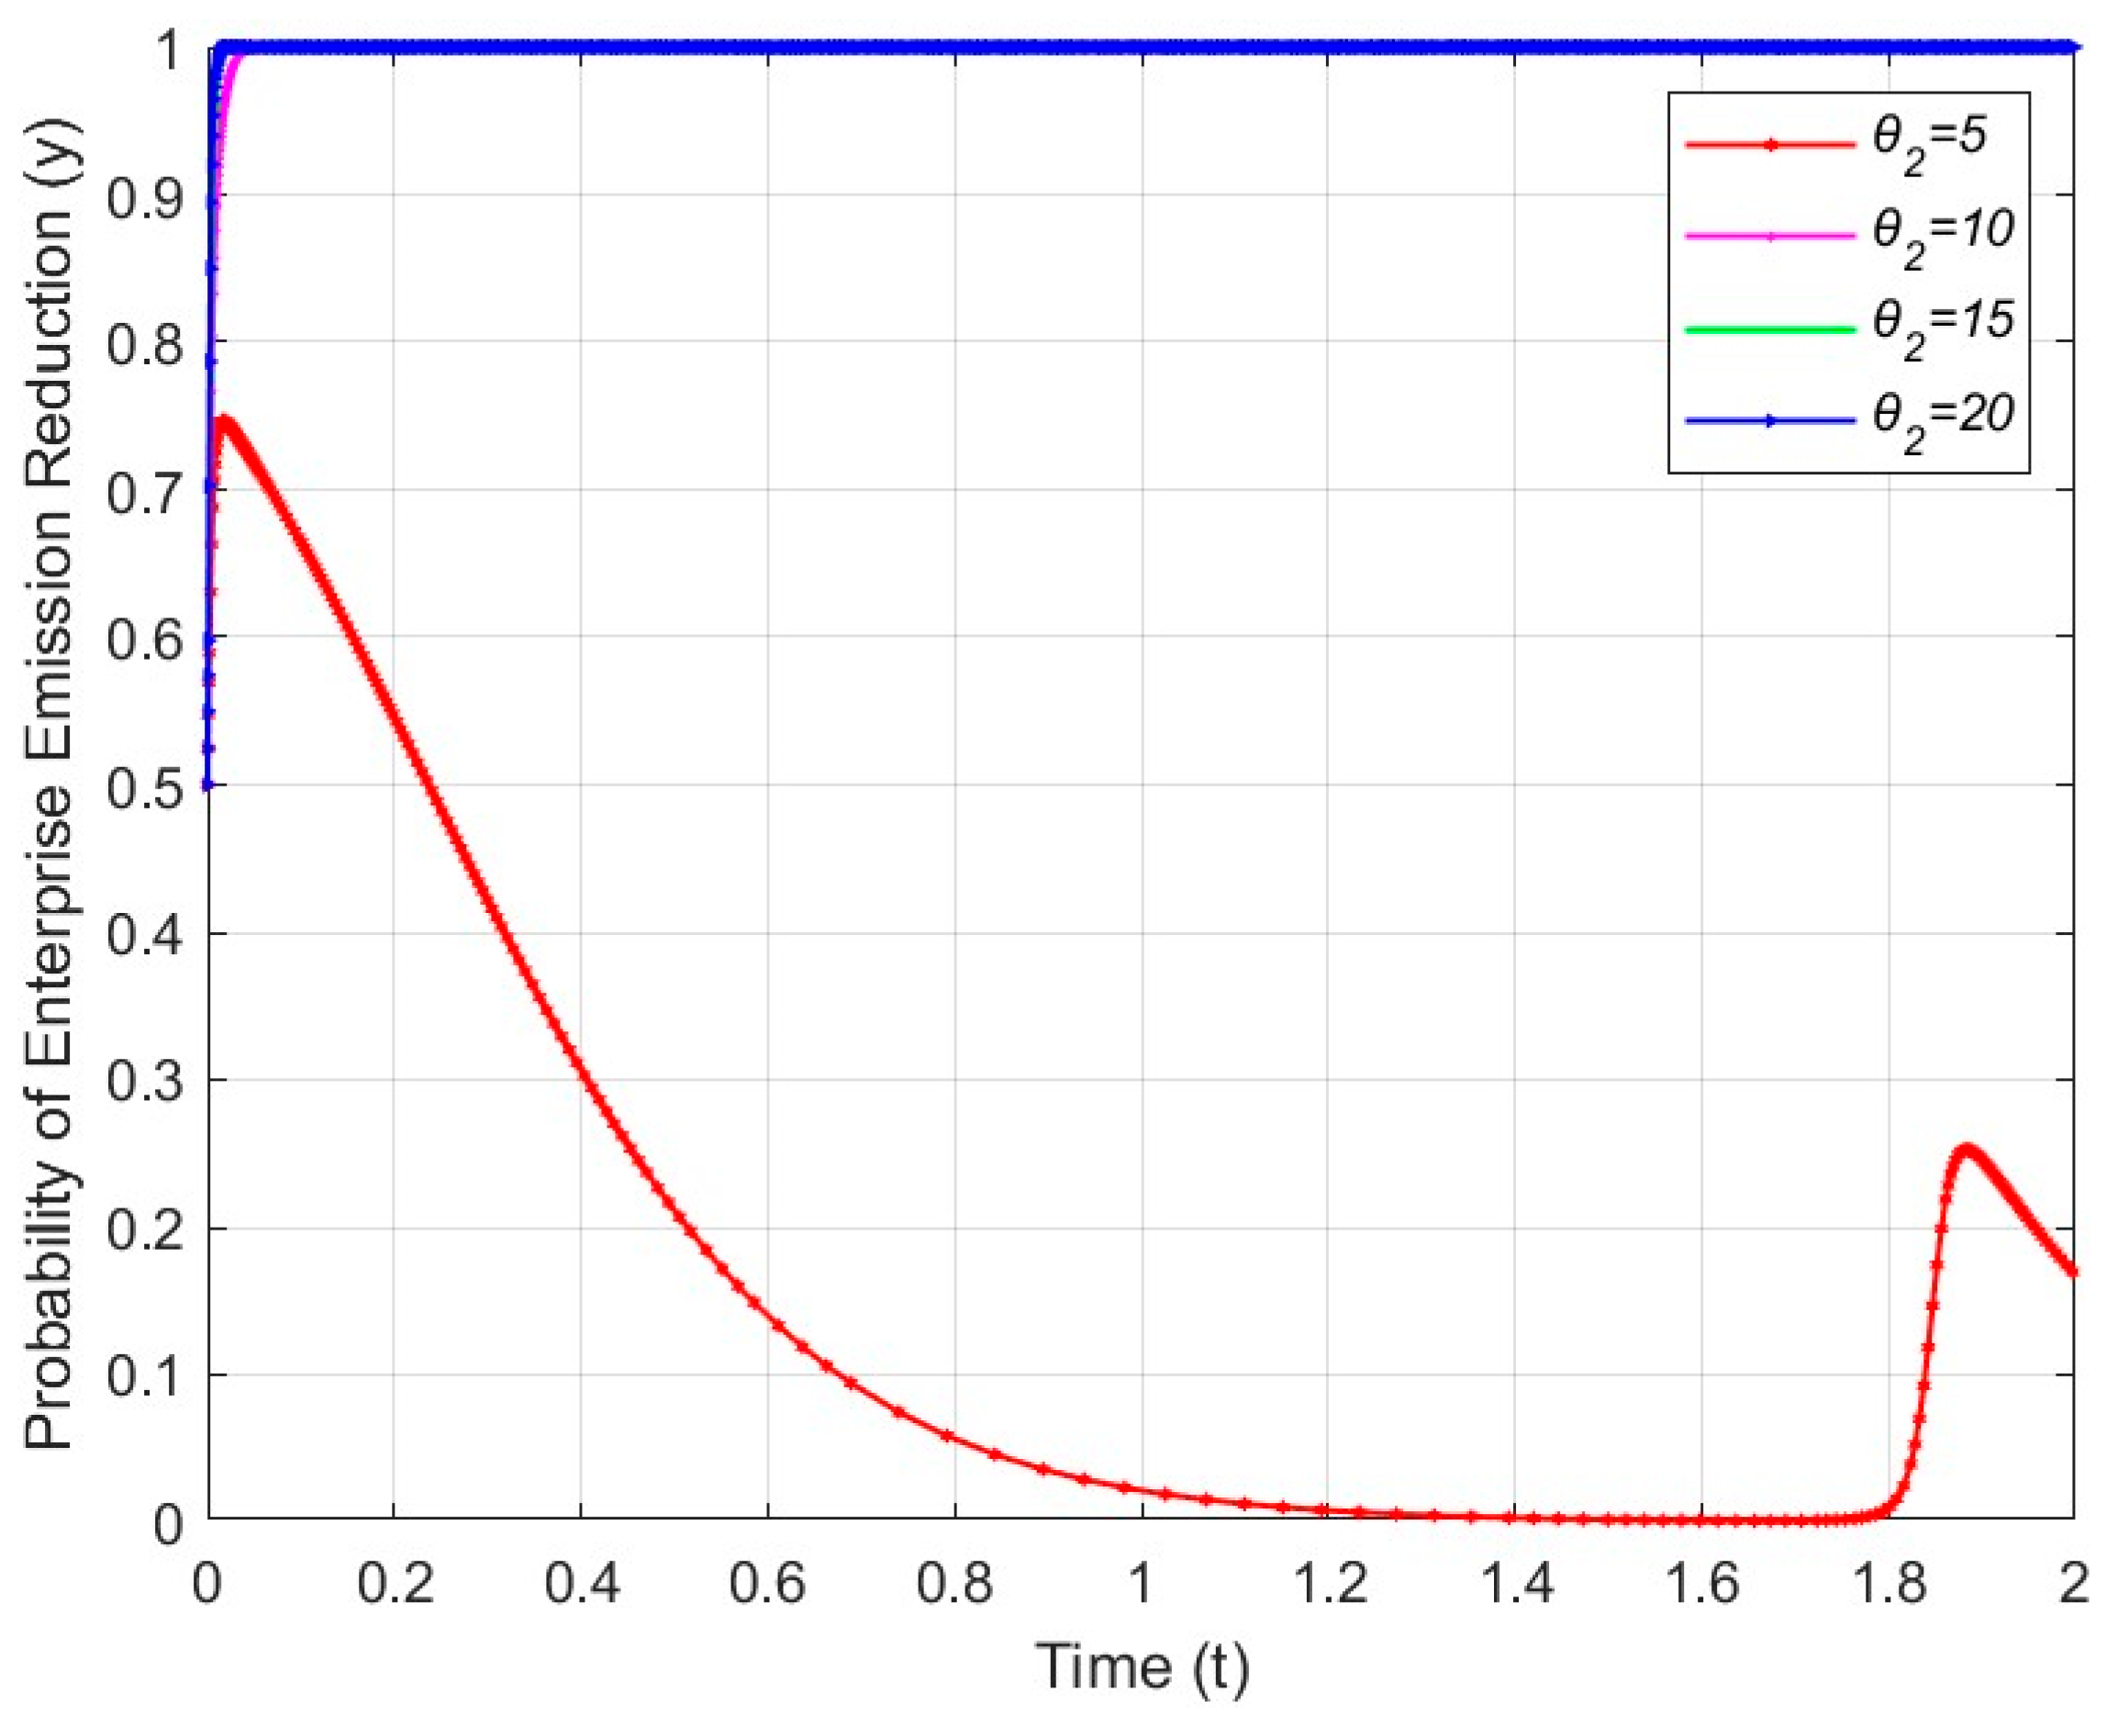
Figure 5 indicates that, compared to the gradual evolution driven by θ1, an increase in the negative low-carbon product coefficient (θ2) exerts a more rapid influence on enterprise decision-making within the same value range. When θ2 = 5, the system briefly trends toward clean production before shifting to low-level oscillation; however, as θ2 increases further, enterprises rapidly converge to the clean production strategy. Notably, although both coefficients have a linear relationship with carbon emissions, θ2 demonstrates a stronger driving force than θ1. This suggests that consumer rejection of high-carbon products (θ2) creates a more binding constraint than the preference for low-carbon products (θ1). This phenomenon aligns with the principle of loss aversion in behavioral economics, where agents are more sensitive to potential losses than equivalent gains.

4.3.3. Impact of Subsidy (α) and Penalty (β) Coefficients on the Probability of Enterprise Emission Reduction (y)

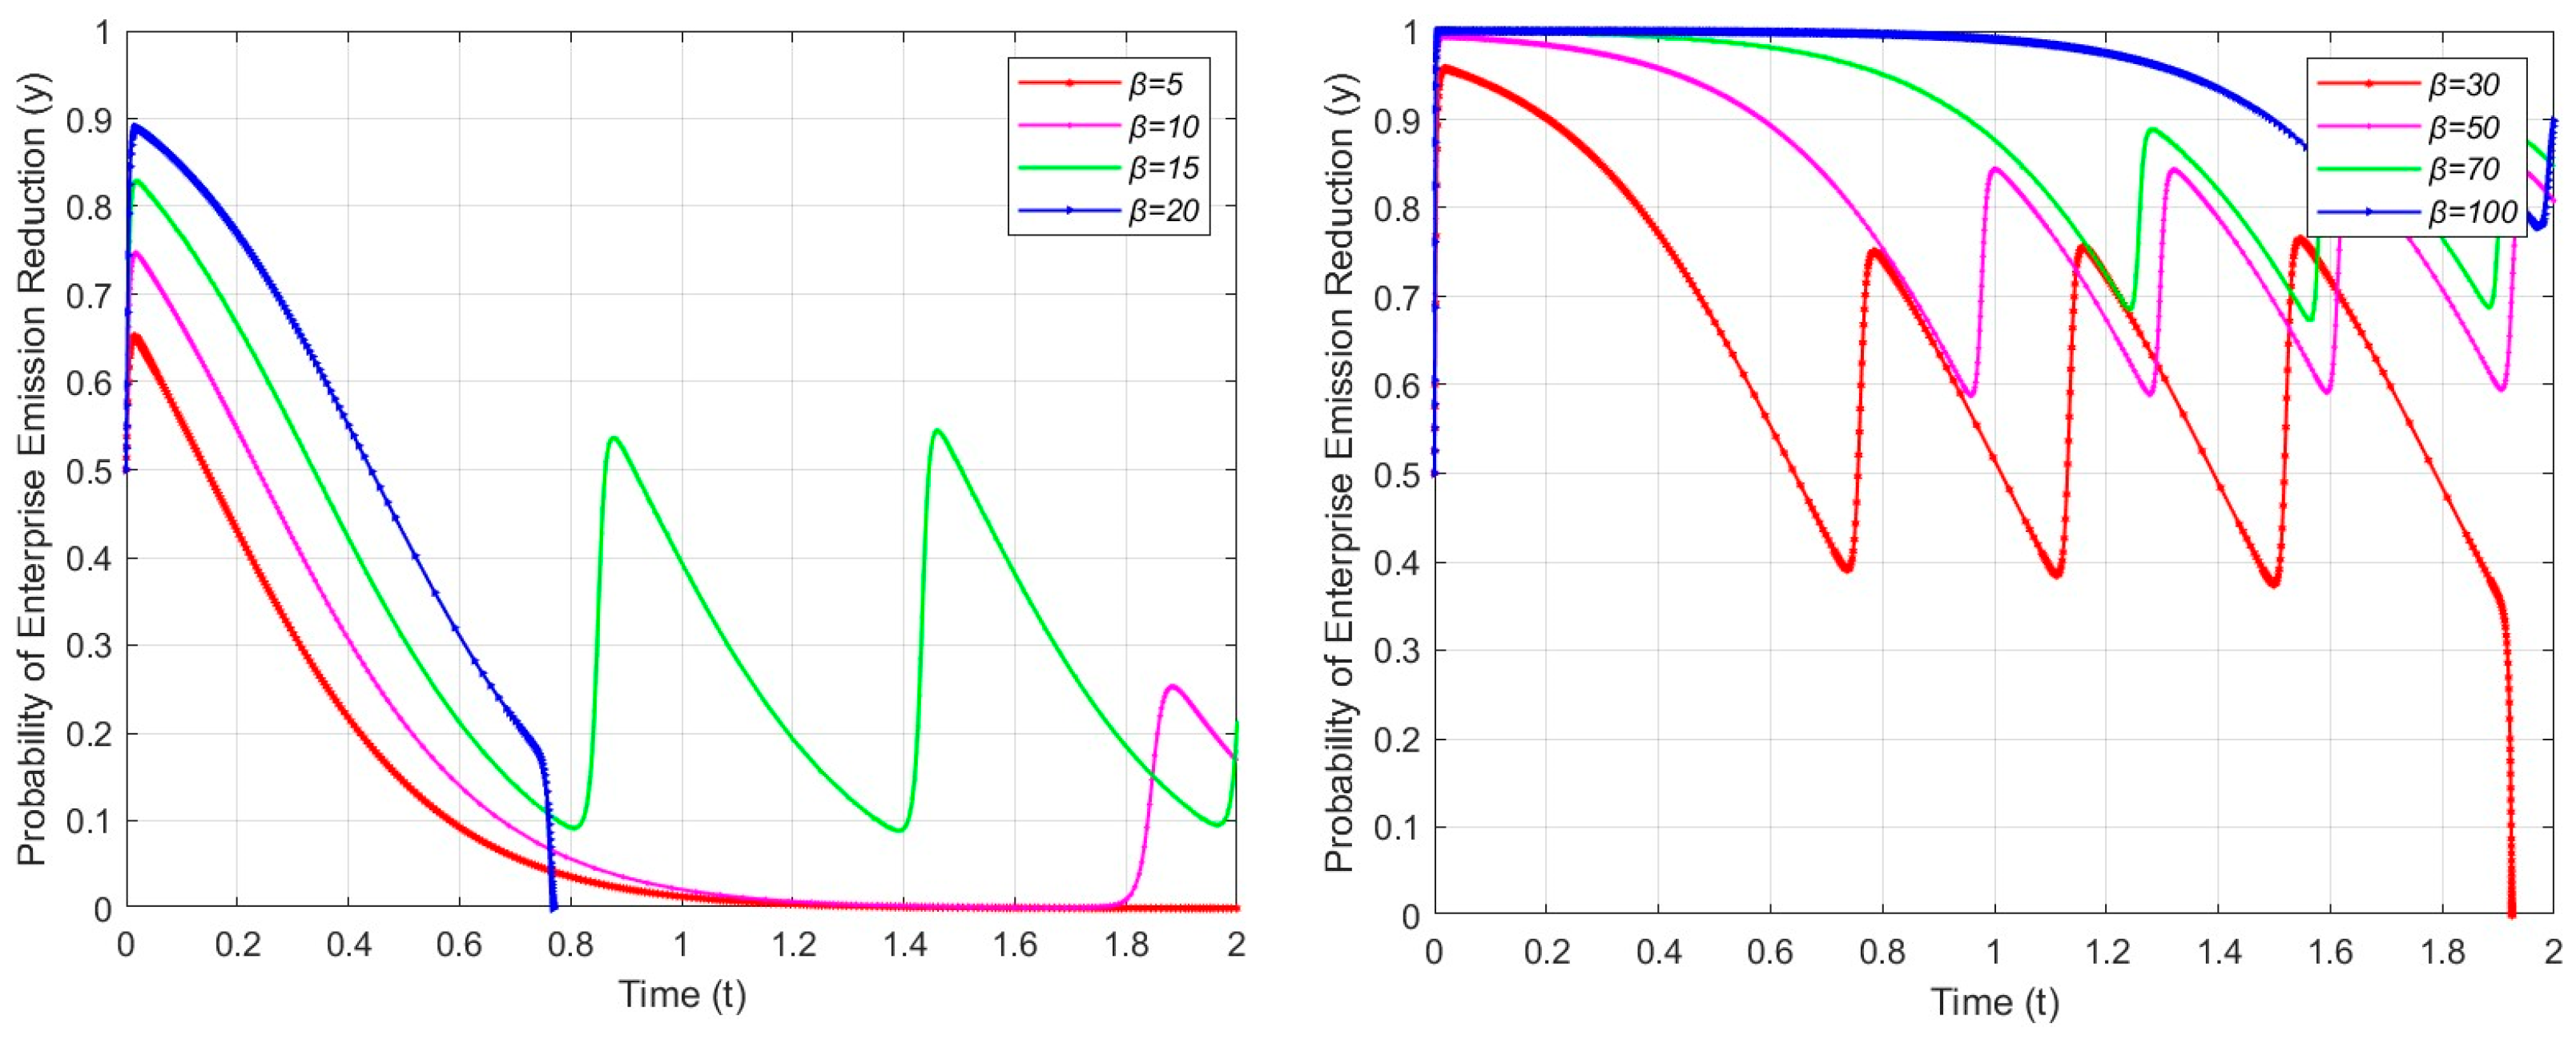
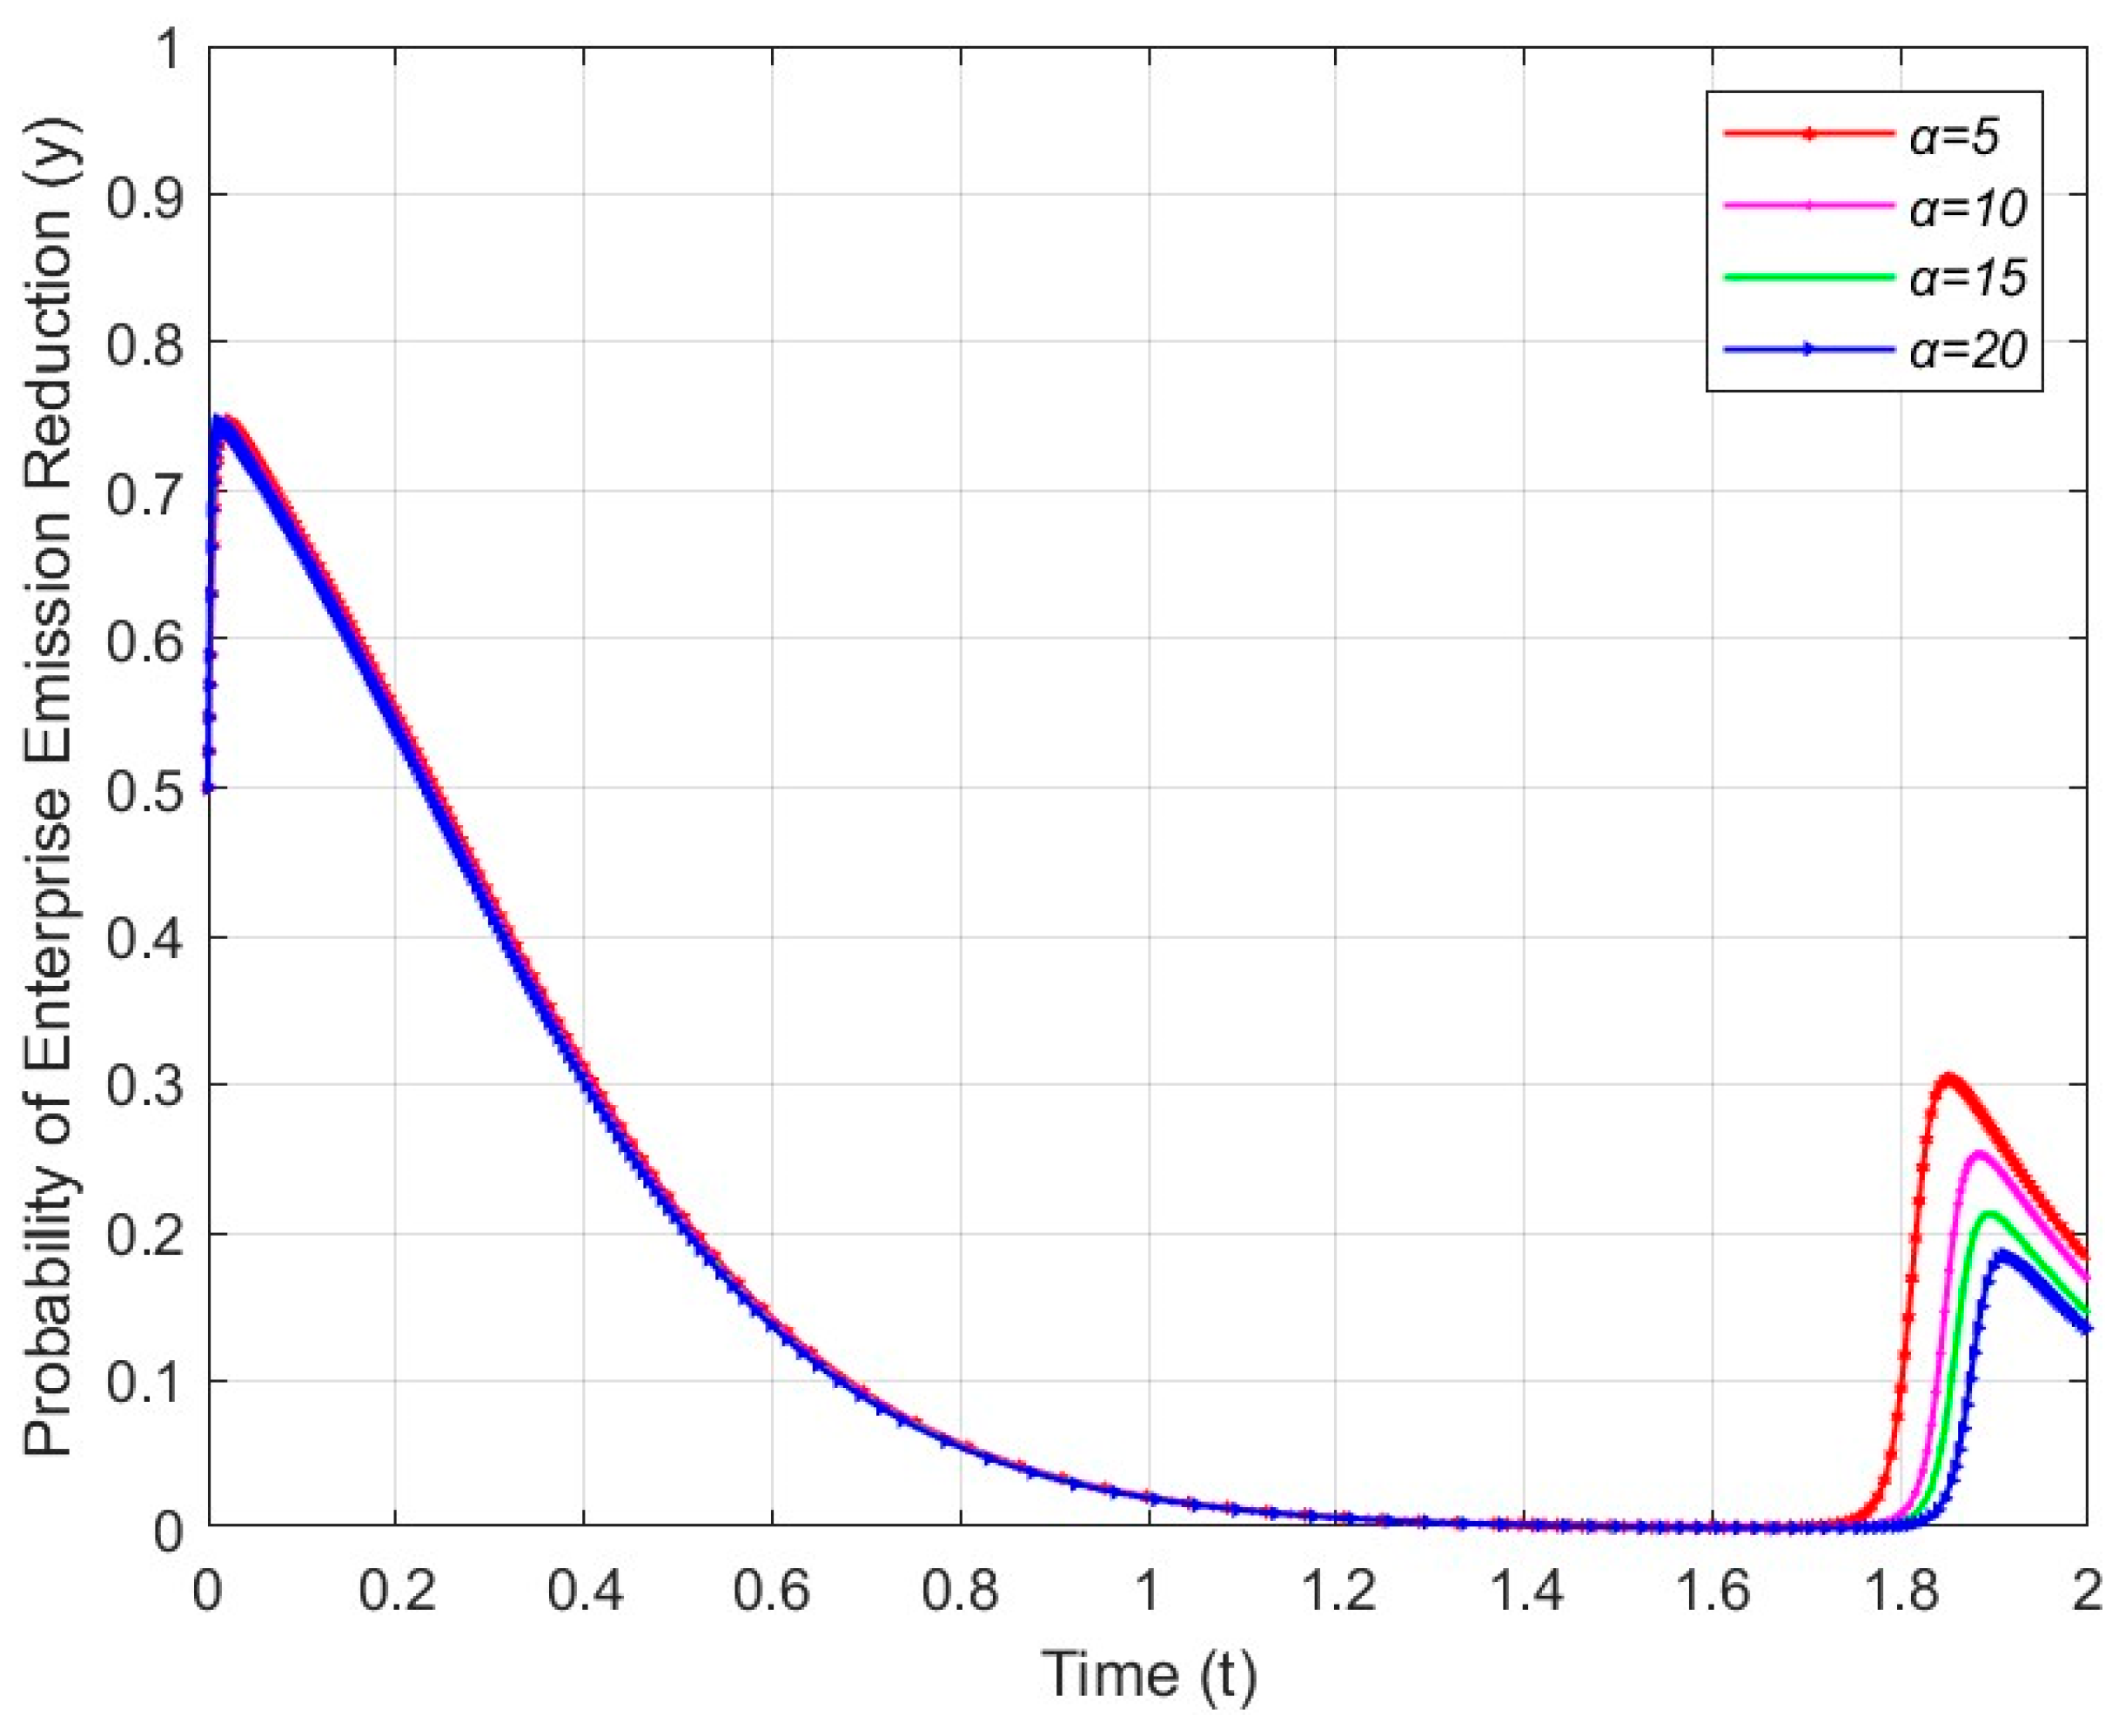
Although theoretical frameworks typically postulate that the government subsidy coefficient should significantly influence the orientation of enterprise decision-making, the empirical simulation analysis reveals a deviation from this expectation. The impact of this coefficient on the actual decision-making process is not as significant as generally anticipated; instead, it merely results in a slight reduction in the cycle of enterprise behavioral oscillation. As α increases, the tendency for strategic oscillation and cyclicity persists, albeit with a gradual attenuation in amplitude (Figure 6). Specifically, when α = 20, the enterprise’s inclination toward emission reduction converges toward zero.
Simulation results indicate that while penalties influence decision-making, moderate levels are insufficient for a complete transformation. As penalties increase, enterprises shift toward clean production in an oscillatory manner, achieving stable convergence only when the coefficient exceeds 50 (Figure 7). This finding aligns with recent research on low-carbon system optimization [32], which demonstrates that carbon pricing instruments exhibit “threshold effects”—meaning policy intensity must exceed a specific critical value to effectively activate low-carbon technologies while balancing economic costs. Synthesizing these findings, the efficacy of the penalty mechanism in stimulating enterprises’ willingness to reduce emissions is significantly superior to that of the subsidy mechanism. However, regarding the sensitivity of strategic response and the amplitude of fluctuations, the intensity of government administrative penalties remains weaker than the market-driven effects generated by consumer-side constraints.

5. Conclusions and Discussion

5.1. Conclusions

Based on the numerical simulations and sensitivity analysis, the following conclusions are drawn:
  • Conditions for Ideal Convergence: The system converges to the strategy profile of (Government policy support, Enterprise clean production) only when the following stability conditions are met: ( C 2 D 2 D 1 + α ( E E 1 ) ) < 0 ( π 2 + C 1 π 1 + ( θ 1 + α ) ( E 1 E ) + ( θ 2 + β ) ( E E 2 ) ) < 0 . Based on this finding and empirical data, the government can reasonably calibrate parameters such as subsidies and quotas to drive enterprises toward this goal. However, under the current scenario with fixed baseline parameters derived from policy inventories, steel enterprises lack the spontaneous motivation to initiate clean production and achieve emission reductions.
  • Market Drivers Outweigh Administrative Regulation: Under the combined effect of consumer constraints and government instruments, enterprise decision-making is more heavily influenced by consumer-side product coefficients. Specifically, increasing the product coefficients alters the speed of evolution toward clean production more effectively than government coefficients.
  • Sensitivity Ranking of Parameters: With abatement costs and carbon quotas fixed, the sensitivity of enterprise decision-making to key parameters is ranked as: θ2 > θ1 > β > α. The threat of market share loss (θ2) is the strongest driver, causing a rapid shift from non-reduction/oscillation to emission reduction. Conversely, the subsidy coefficient (α), even at critical high values, fails to independently drive the decision for emission reduction.

5.2. Discussion

  • Our conclusions indicate that market-driven forces exert a stronger impact on enterprise decision-making than external administrative regulation. However, it is worth noting that this conclusion is premised on the abatement cost (C1) being within a feasible range. If C1 is excessively high (e.g., during the early stages of technological development), the marginal utility of market premiums alone may be insufficient to cover the costs. In such high-cost scenarios, the leverage of market signals may diminish relative to subsidies, necessitating stronger, though likely transient, government intervention to lower the initial entry barrier before market forces can take over.
  • In our current model, θ is treated as an exogenous parameter. However, in real-world scenarios, consumer preferences are often endogenous and co-evolve with policy interventions. Specifically, as the government increases its publicity efforts, consumer environmental awareness (θ) would rise, imposing stronger constraints on enterprises. This, in turn, would push more firms to adopt clean production, further reinforcing social norms. This implies that the research results would remain robust.
  • Grounded in economic rationality, our model effectively captures the behavioral inertia of market-driven entities that prioritize cost minimization over environmental benefits. Notably, a significant portion of the steel industry consists of state-owned enterprises. In practice, these entities are often obligated to fulfill national mandates regardless of economic costs, rendering political authority a decisive driver of their green transition. Nevertheless, in broader long-term scenarios where external incentives are insufficient to cover abatement costs, enterprises remain prone to retaining traditional production strategies. Therefore, integrating demand-side constraints is essential to facilitate and sustain the industry-wide transformation.

6. Policy Implications and Future Research

6.1. Policy Implications

Based on the above conclusions, the following policy recommendations are proposed:
  • Implement a Targeted Support Strategy Focused on Leading Enterprises. In reality, the Zhejiang steel industry exhibits a highly concentrated structure, where production capacity is primarily dominated by two leading enterprises: Ningbo Iron & Steel and Yuanli Metal, while other enterprises are smaller [33]. Therefore, to optimize administrative costs (C2), government intervention should focus on these core enterprises rather than engaging in fragmented support for scattered SMEs. Specifically, innovation subsidies (α) should be prioritized for these leaders to alleviate their abatement pressure and facilitate technological breakthroughs. By concentrating resources here, the government can drive technology diffusion, which effectively reduces the incremental abatement cost (C1) for the entire industrial cluster. Furthermore, the government should actively facilitate the adoption of smart responsiveness technologies. For instance, technical research indicates that implementing IoT-based real-time monitoring systems allows factories to dynamically adjust production plans based on external signals [34].
  • Strengthen Consumer-Side Constraints on High-Carbon Products: Simulation results indicate that enterprise decision-making is most sensitive to the negative product coefficient. Therefore, the government should prioritize refining market penalty mechanisms for high-carbon products. Measures such as implementing a carbon labeling grading system and levying differentiated consumption taxes on high-carbon steel should be considered. These actions will intensify consumer rejection (θ2) of high-carbon products and enhance the binding force of consumers “voting with their feet,” thereby compelling enterprises to transform.
  • Furthermore, drawing on the conclusion by Meng et al. that effective carbon pricing requires a minimum threshold to trigger low carbon optimization [32], we recommend that the government strictly calculate the administrative penalty (β) to ensure the penalty is set above the critical level identified in our sensitivity analysis.
  • Cultivate Low-Carbon Market Dynamics: Given that sensitivity to product coefficients (θ1,θ2) is significantly higher than to government subsidies (α), the government must recognize the pivotal role of consumer constraints. Policy efforts should focus on strengthening environmental publicity to guide low-carbon consumption preferences (θ1). Dual-directional incentive policies should be implemented, such as offering VAT deductions for downstream enterprises purchasing low-carbon steel and granting floor area ratio (FAR) rewards to real estate developers using low-carbon materials. By leveraging consumer power to alleviate abatement pressure, a synergy between government guidance and market selection can be achieved, realizing a win-win for environmental protection and economic development, which is essential for enhancing the overall sustainability of the regional industrial ecosystem.

6.2. Future Research

Based on the current framework, future research could be extended in the following aspects. On the one hand, the current model assumes an interaction between the government and the enterprise sector. In reality, enterprises operate within a competitive market. Future research could extend this work by incorporating competition for market share. Theoretically, such competition would amplify the effectiveness of consumer-side constraints. In a competitive environment, strong consumer low-carbon preferences would drive market share from high-carbon to low-carbon firms. This would transform emission reduction from a simple compliance choice into a competitive necessity, likely accelerating the transition speed compared to the current non-competitive baseline. On the other hand, the current model treats the enterprise sector as a representative agent calibrated using provincial weighted average data. In reality, significant differences exist between Integrated Mills (BF-BOF) and Electric Arc Furnace (EAF) producers regarding abatement costs (C1) and baseline emissions (E2). However, given that empirical studies indicate that the BF-BOF route accounts for approximately 90% of the total crude steel output in China [35], our parameters primarily reflect the high-cost, high-emission characteristics of these traditional producers. Future research could refine this by constructing a multi-population evolutionary game to simulate the differential strategic responses of heterogeneous enterprises.

Author Contributions

Conceptualization, Y.M.; methodology, Y.-L.T.; software, Y.-L.T.; validation, Y.M. and Y.-L.T.; formal analysis, Y.M. and Q.-Y.C.; investigation, X.-Q.Y.; resources, Y.M. and Q.-Y.C.; data curation, Y.-L.T.; writing—original draft preparation, Y.-L.T.; writing—review and editing, Y.M. and Q.-Y.C.; visualization, X.-Q.Y.; supervision, X.-Q.Y.; project administration, Y.-L.T. and Q.-Y.C.; funding acquisition, Y.M. All authors have read and agreed to the published version of the manuscript.

Funding

This research was funded by the National Social Science Fund of China (Grant No. 24BZZ036), the Jinhua Science and Technology Research Program (Grant No. 2024-4-210), and the Hangzhou Philosophy and Social Science Planning Project (Grant No. Z24YD039). And The APC was funded by the authors.

Institutional Review Board Statement

Not applicable.

Informed Consent Statement

Not applicable.

Data Availability Statement

The data presented in this study are available on request from the corresponding author. The data are not publicly available due to privacy restrictions regarding internal government reports.

Conflicts of Interest

The authors declare no conflict of interest.

References

  1. Liu, X.; Liu, Y.; Bai, C.; Peng, R.; Chi, Y. Pathways for decarbonizing China’s iron and steel industry using cost-effective mitigation technologies: An integrated analysis with top-down and bottom-up models. Renew. Energy 2024, 237, 121506. [Google Scholar] [CrossRef]
  2. Zhang, F.; Gallagher, K.S.; Deng, M.; Liu, H.; Orvis, R.; Xuan, X. Assessing the Policy Gaps for Achieving China’s Carbon Neutrality Target. Environ. Sci. Technol. 2025, 59, 18124–18133. [Google Scholar] [CrossRef]
  3. Ma, H.; Shen, G. Do new mayors bring fresh air? Some evidence of regulatory capture in China. Rev. Econ. Des. 2021, 25, 227–249. [Google Scholar] [CrossRef]
  4. Central Committee of the Communist Party of China. Recommendations of the Central Committee of the Communist Party of China for Formulating the 15th Five-Year Plan for National Economic and Social Development; Central Committee of the Communist Party of China: Beijing, China, 2025. [Google Scholar]
  5. Muslemani, H.; Liang, X.; Kaesehage, K.; Ascui, F.; Wilson, J. Opportunities and challenges for decarbonizing steel production by creating markets for ‘green steel’ products. J. Clean. Prod. 2021, 315, 128127. [Google Scholar] [CrossRef]
  6. Vogl, V.; Åhman, M.; Nilsson, L.J. The making of green steel in the EU: A policy evaluation for the early commercialization phase. Clim. Policy 2021, 21, 78–92. [Google Scholar] [CrossRef]
  7. Li, M.D.; Han, C.F.; Shao, Z.G.; Meng, L.P. Exploring the evolutionary mechanism of the cross-regional cooperation of construction waste recycling enterprises: A perspective of complex network evolutionary game. J. Clean. Prod. 2024, 434, 15. [Google Scholar] [CrossRef]
  8. Li, M.; Dong, H.; Yu, H.C.; Sun, X.Q.; Zhao, H.J. Evolutionary Game and Simulation of Collaborative Green Innovation in Supply Chain under Digital Enablement. Sustainability 2023, 15, 3125. [Google Scholar] [CrossRef]
  9. Cao, J.; Wu, X.; Zhou, G. Evolution of green operation mode in manufacturing enterprises and analysis of government function. Sci. Res. Manag. 2013, 34, 108–115. (In Chinese) [Google Scholar] [CrossRef]
  10. Zhang, S.; Song, X. Carbon emissions reduction in shipping based on four-party evolutionary game. Front. Mar. Sci. 2025, 12, 1527598. [Google Scholar] [CrossRef]
  11. Kang, K.; Zhao, Y.J.; Zhang, J.; Qiang, C. Evolutionary game theoretic analysis on low-carbon strategy for supply chain enterprises. J. Clean. Prod. 2019, 230, 981–994. [Google Scholar] [CrossRef]
  12. Ma, H.Q.; Shen, G.J.; Zou, J.X. Does excess capacity strengthen firms’ dependence on the polluting path? Evidence from Chinese iron and steel firms. Econ. Transit. Inst. Change 2024, 32, 971–1000. [Google Scholar] [CrossRef]
  13. Wang, P.; Ryberg, M.; Yang, Y.; Feng, K.; Kara, S.; Hauschild, M.; Chen, W.-Q. Efficiency stagnation in global steel production urges joint supply-and demand-side mitigation efforts. Nat. Commun. 2021, 12, 2066. [Google Scholar] [CrossRef]
  14. Preziuso, D.; Odonkor, P. Governance gaps in urban decarbonization: Illuminating structural exclusion in residential energy transitions. Energy Environ. Sustain. 2025, 1, 100054. [Google Scholar] [CrossRef]
  15. Bataille, C.; Åhman, M.; Neuhoff, K.; Nilsson, L.J.; Fischedick, M.; Lechtenböhmer, S.; Solano-Rodriquez, B.; Denis-Ryan, A.; Stiebert, S.; Waisman, H. A review of technology and policy deep decarbonization pathway options for making energy-intensive industry production consistent with the Paris Agreement. J. Clean. Prod. 2018, 187, 960–973. [Google Scholar] [CrossRef]
  16. Wang, J.M.; Jia, L.; He, P.; Wang, P.; Huang, L. Engaging stakeholders in collaborative control of air pollution: A tripartite evolutionary game of enterprises, public and government. J. Clean. Prod. 2023, 418, 13. [Google Scholar] [CrossRef]
  17. Zhao, Y.; Huang, Y.C.; Hu, S.L.; Sun, J. How Tripartite Stakeholders Promote Green Technology Innovation of China’s Heavily Polluting Enterprises? Sustainability 2023, 15, 9650. [Google Scholar] [CrossRef]
  18. Chen, L.; Bai, X.; Chen, B.; Wang, J.J. Incentives for Green and Low-Carbon Technological Innovation of Enterprises Under Environmental Regulation: From the Perspective of Evolutionary Game. Front. Energy Res. 2022, 9, 14. [Google Scholar] [CrossRef]
  19. Zhuang, G. Consumer responsibility and policy suggestions under the guidance of carbon neutrality goals. Frontiers 2021, 14, 62–68. (In Chinese) [Google Scholar] [CrossRef]
  20. Shen, J.L.; Zhang, Q.; Tian, S.S. Decarbonization pathways analysis and recommendations in the green steel supply chain of a typical steel end user-automotive industry. Appl. Energy 2025, 377, 13. [Google Scholar] [CrossRef]
  21. European Commission. Carbon Border Adjustment Mechanism (CBAM). Available online: https://taxation-customs.ec.europa.eu/carbon-border-adjustment-mechanism_en (accessed on 20 November 2023).
  22. Ministry of Ecology and Environment of the People’s Republic of China. Notice on Issuing the “Work Plan for the National Carbon Emission Trading Market Covering Iron and Steel, Cement, and Aluminum Smelting Industries”. Available online: https://www.mee.gov.cn/xxgk2018/xxgk/xxgk03/202503/t20250326_1104736.html (accessed on 17 November 2025). (In Chinese)
  23. Joshi, Y.; Rahman, Z. Factors affecting green purchase behaviour and future research directions. Int. Strateg. Manag. Rev. 2015, 3, 128–143. [Google Scholar] [CrossRef]
  24. Hojnik, J.; Ruzzier, M. What drives eco-innovation? A review of an emerging literature. Environ. Innov. Soc. Transit. 2016, 19, 31–41. [Google Scholar] [CrossRef]
  25. Centre for Research on Energy and Clean Air. China’s Steel Sector Invests USD 100 Billion in Coal-Based Steel Plants Despite Low Profitability and Overcapacity: 2023 H2 China Steel Analysis; Centre for Research on Energy and Clean Air: Helsinki, Finland, 2024. [Google Scholar]
  26. Dong, J.; Wang, X.; Cai, B.; Chen, Z.; Li, B.; Cao, L. Research on CO2 emission reduction technology and cost of China’s iron and steel industry. Environ. Eng. 2021, 39, 23–31. (In Chinese) [Google Scholar]
  27. Li, S.; Cai, J.; Feng, Z.; Xu, Y.; Cai, H. Government contracting with monopoly in infrastructure provision: Regulation or deregulation? Transp. Res. Part E Logist. Transp. Rev. 2019, 122, 506–523. [Google Scholar] [CrossRef]
  28. Levinson, R.; Akbari, H. Potential benefits of cool roofs on commercial buildings: Conserving energy, saving money, and reducing emission of greenhouse gases and air pollutants. Energy Effic. 2010, 3, 53–109. [Google Scholar] [CrossRef]
  29. Zhang, H.; Li, Y.; Han, Y. Research on pricing decisions of manufacturer recycling/remanufacturing based on carbon tax and low-carbon preference. Ind. Technol. Econ. 2018, 37, 130–136. (In Chinese) [Google Scholar]
  30. Baker, T.; Pieper, C.; Weber, S.; Uguen-Csenge, D. Consumers Are Willing to Pay for Net Zero Production. Available online: https://www.bcg.com/publications/2023/consumers-are-willing-to-pay-for-net-zero-production (accessed on 11 December 2025).
  31. Fang, G.; He, Y.; Tian, L. Evolutionary game analysis of government-enterprise carbon emission reduction driven by carbon trading. Chin. J. Manag. Sci. 2021, 32, 196–206. (In Chinese) [Google Scholar] [CrossRef]
  32. Meng, Q.; He, Y.; Hussain, S.; Lu, J.; Guerrero, J.M. Low carbon optimization for wind integrated power systems with carbon capture and energy storage under carbon pricing. Sci. Rep. 2025, 15, 32714. [Google Scholar] [CrossRef] [PubMed]
  33. Zhejiang Provincial Economy and Information Technology Department; Development and Reform Commission of Zhejiang Province; Department of Ecology and Environment of Zhejiang Province. Implementation Plan for Carbon Peaking in the Industrial Sector of Zhejiang Province. Available online: https://www.ccn.ac.cn/policies-and-regulations/cpcn/696.html (accessed on 11 December 2025).
  34. Yang, H.; Liang, R.; Zheng, Y.; Peng, S.; Rae, A.; Ackom, E.; Johnston, A. Receding horizon optimization of power demand response for production-oriented users with real-time operating status-awareness. IEEE Trans. Consum. Electron. 2025. [Google Scholar] [CrossRef]
  35. Ren, L.; Zhou, S.; Peng, T.; Ou, X. A review of CO2 emissions reduction technologies and low-carbon development in the iron and steel industry focusing on China. Renew. Sustain. Energy Rev. 2021, 143, 110846. [Google Scholar] [CrossRef]
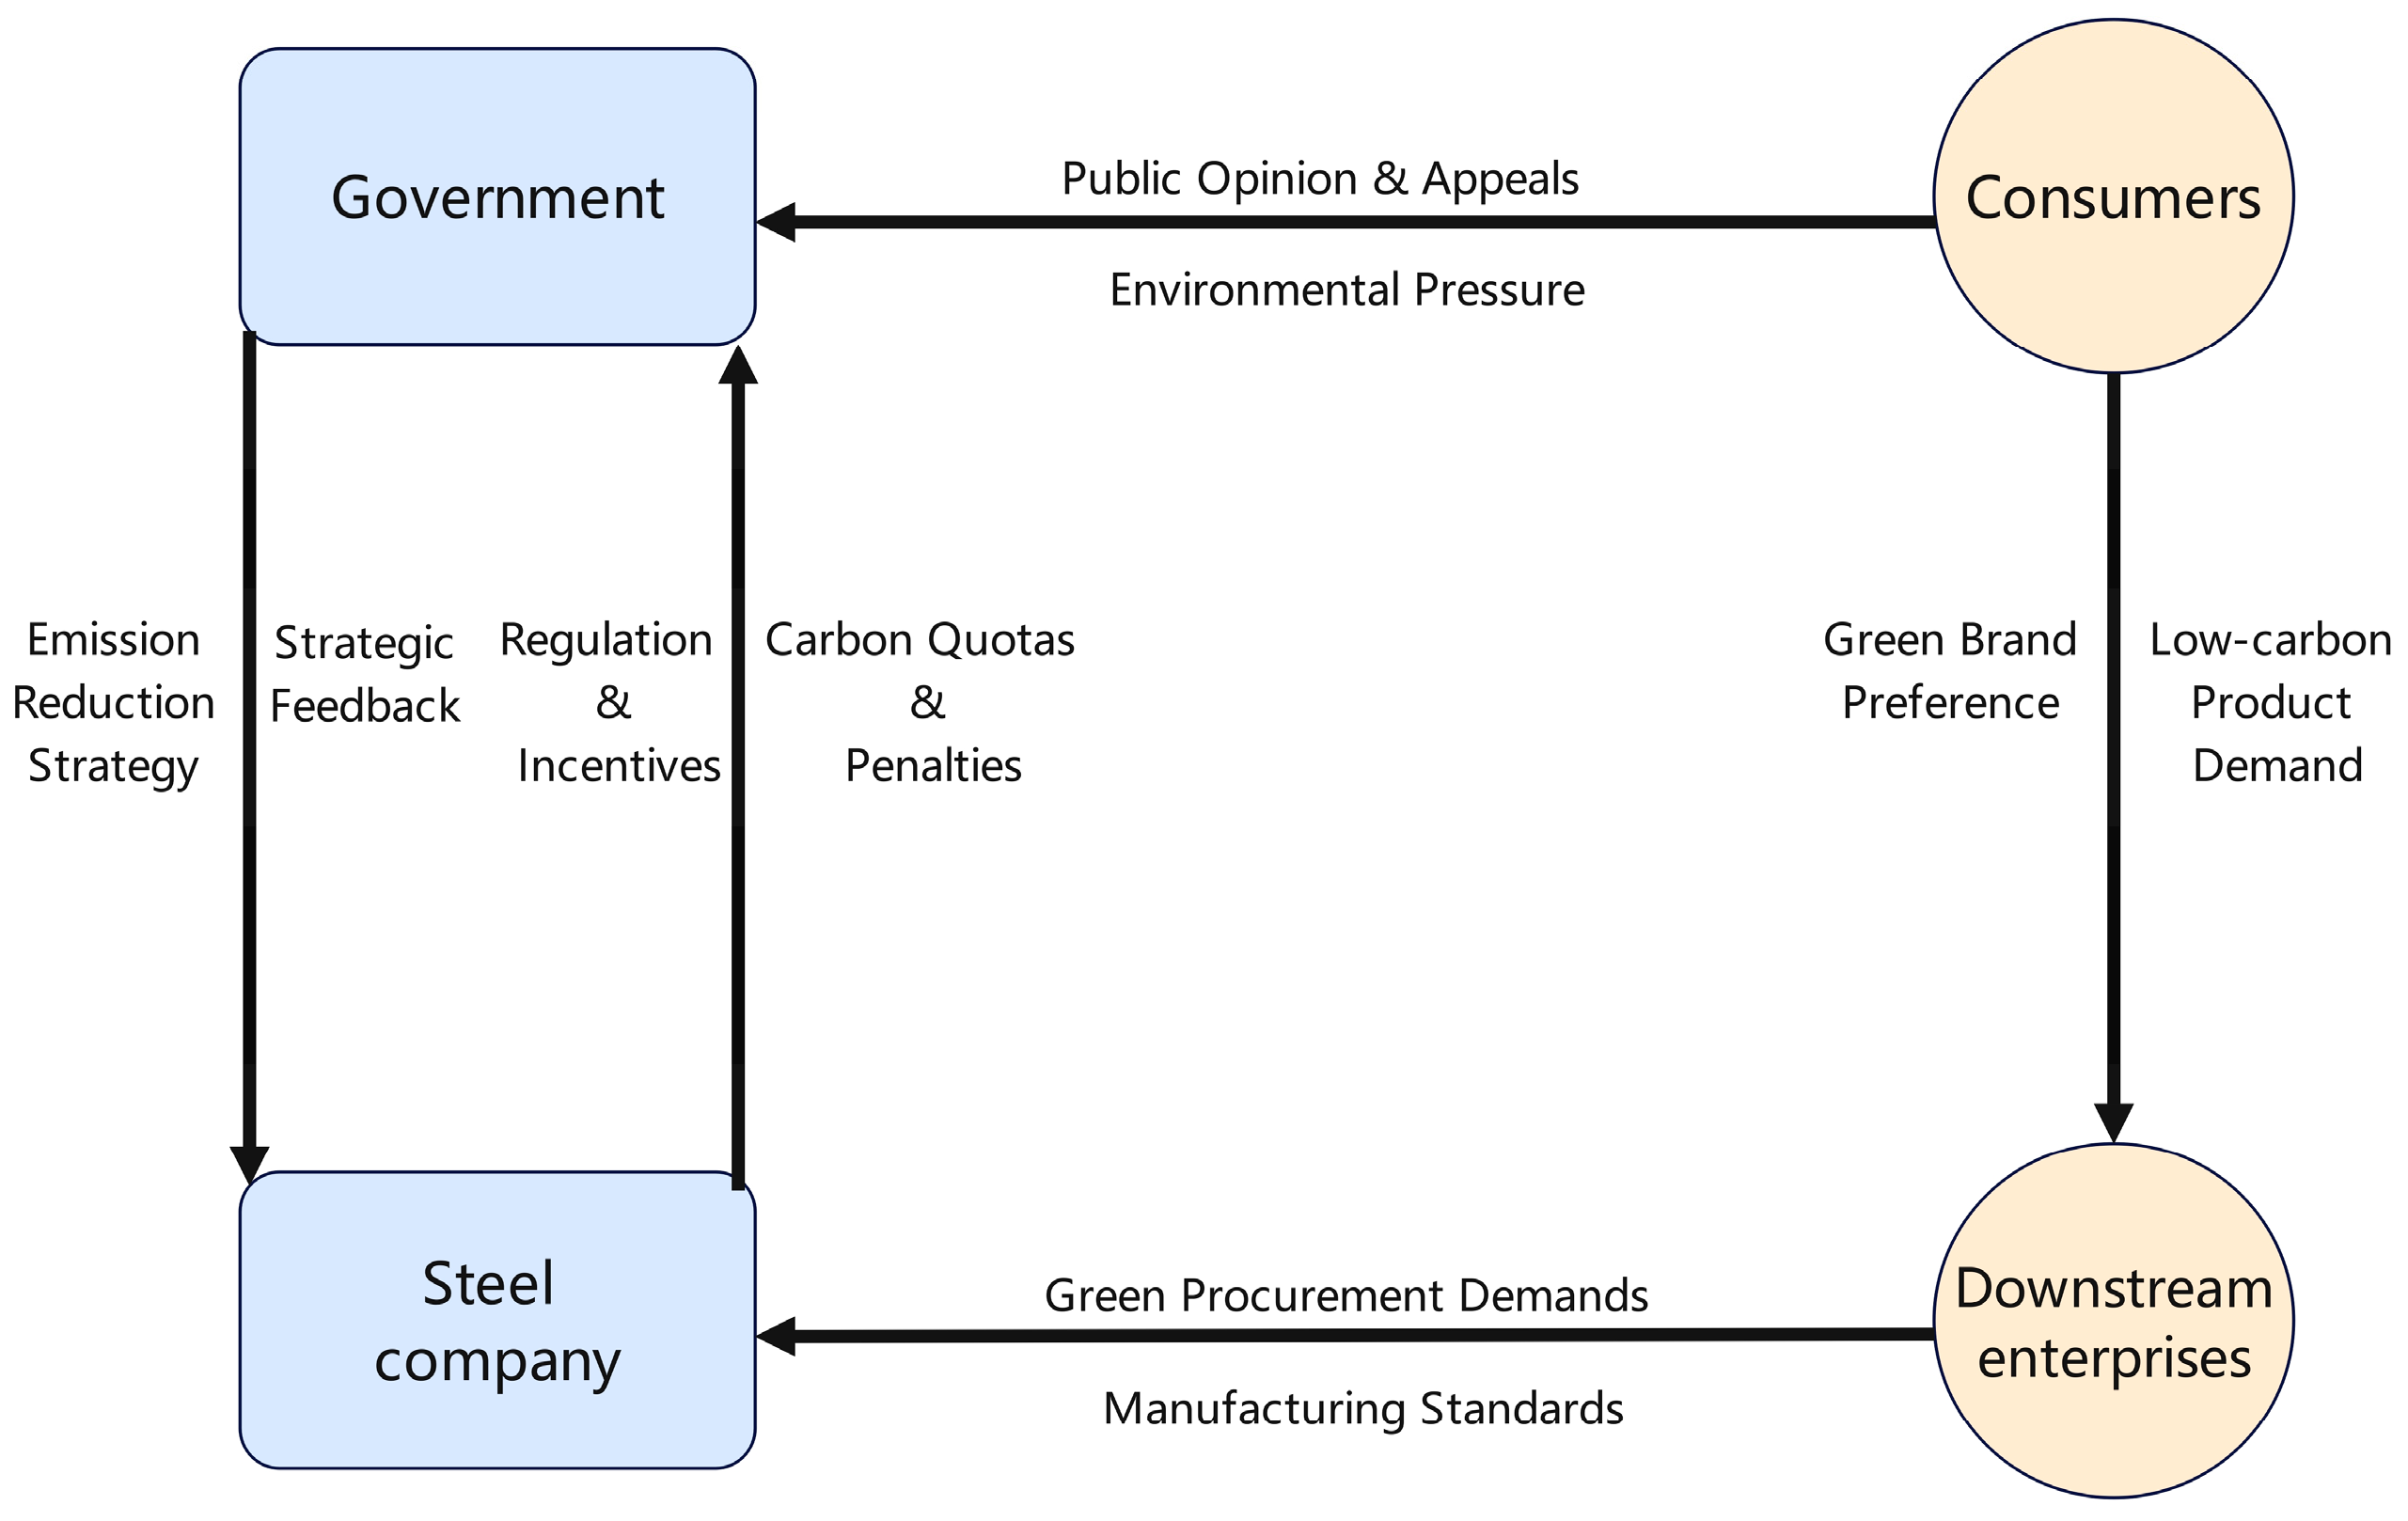
Figure 1. The influence of demand-side constraints on the game relationship between the steel industry and the government.
Sustainability 18 01951 g001
Figure 2. Phase diagram of the system evolution in different cases. (a) Scenario 1: The system converges to the equilibrium point (0,0). (b) Scenario 2: The system converges to the equilibrium point (0,1). (c) Scenario 3: The system converges to the equilibrium point (1,0). (d) Scenario 4: The system converges to the equilibrium point (1,1).
Sustainability 18 01951 g002aSustainability 18 01951 g002b
Figure 3. Influence of the initial support probability of local governments (x) on the probability of low-carbon innovation of steel enterprises.
Sustainability 18 01951 g003
Figure 4. The influence of the positive low-carbon product coefficient (θ1) on the low-carbon innovation probability (y) of steel enterprises.
Sustainability 18 01951 g004
Figure 5. The influence of the negative low-carbon product coefficient (θ2) on the low-carbon innovation probability (y) of steel enterprises.
Sustainability 18 01951 g005
Figure 6. The influence of the subsidy coefficient (α) on the clean production probability (y) of steel enterprises.
Sustainability 18 01951 g006
Figure 7. The influence of the penalty coefficient (β) on the clean production probability (y) of steel enterprises.
Sustainability 18 01951 g007
Table 1. Variables involved in local governments and steel enterprises.
VariablesDescription
π1, π2Revenue of the enterprise under clean and traditional production modes
W1, W2Government revenue under clean and traditional production scenarios
C1Incremental abatement cost for clean production
C2Administrative cost of government active support
EStandard carbon emission quota assigned by the government
E1Carbon emissions under clean production mode
E2Carbon emissions under traditional production mode
θ1Positive consumer preference coefficient
θ2Negative consumer preference coefficient
αGovernment subsidy coefficient
βGovernment penalty coefficient
D1social reputation benefit
D2environmental management cost
D3Social reputation loss
xProbability of the enterprise choosing “Clean Production”
yProbability of the government choosing “Active Support”
Table 2. Payoff matrix of local governments and steel enterprises.
Steel Enterprises
Clean Production (y)Traditional Production (1 − y)
Local GovernmentActive Support
(x)
W 1 C 2 α ( E E 1 ) + D 1 , π 1 + ( α + θ 1 ) ( E E 1 ) C 1 W 2 C 2 + β ( E 2 E ) + D 1 D 3 , π 2 ( β + θ 2 ) ( E 2 E )
Passive Regulation
(1 − x)
W 1 D 2 , π 1 C 1 + θ 1 ( E E 1 ) W 2 D 2 D 3 , π 2 θ 2 ( E 2 E )
Table 3. Determinants and traces of the Jacobian matrix for the equilibrium.
Equilibrium PointDet(J)Tr(J)
P 1 ( 0 , 0 ) D 2 C 2 + D 3 + β ( E 2 E ) * ( π 1 C 1 π 2 + θ 1 ( E E 1 ) + θ 2 ( E 2 E ) ) D 2 C 2 + D 3 + β ( E 2 E ) + ( π 1 C 1 π 2 + θ 1 ( E E 1 ) + θ 2 ( E 2 E ) )
P 2 ( 0 , 1 ) ( D 1 + D 2 C 2 + α ( E 1 E ) ) * ( ( π 1 C 1 π 2 + θ 1 ( E E 1 ) + θ 2 ( E 2 E ) ) ) ( D 2 C 2 + D 3 + ( D 1 D 3 ) + α ( E 1 E ) ) ( π 1 C 1 π 2 + θ 1 ( E E 1 ) + θ 2 ( E 2 E ) )
P 3 ( 1 , 0 ) ( D 2 C 2 + D 3 + β ( E 2 E ) ) * ( π 1 C 1 π 2 + ( θ 1 + α ) ( E E 1 ) + ( θ 2 + β ) ( E 2 E ) ) ( D 2 C 2 + D 3 + β ( E 2 E ) ) + ( π 1 C 1 π 2 + ( θ 1 + α ) ( E E 1 ) + ( θ 2 + β ) ( E 2 E ) )
P 4 ( 1 , 1 ) ( C 2 D 2 D 1 + α ( E E 1 ) ) * ( π 2 + C 1 π 1 + ( θ 1 + α ) ( E 1 E ) + ( θ 2 + β ) ( E E 2 ) ) ( D 2 C 2 + D 3 + ( D 1 D 3 ) ) ( π 1 C 1 π 2 + ( θ 1 + α ) ( E E 1 ) + ( θ 2 + β ) ( E 2 E ) )
P 5 ( x 0 , y 0 ) *0
*: The determinant of the Jacobian matrix is positive.
Table 4. Strategy stability analysis of government and steel enterprises.
Det(J)Tr(J)Stability
E 1 ( 0 , 0 ) +ESS
E 2 ( 0 , 1 ) UncertainSaddle Point
E 3 ( 1 , 0 ) UncertainSaddle Point
E 4 ( 1 , 1 ) +ESS
E 5 ( x 0 , y 0 ) Non-existent
Disclaimer/Publisher’s Note: The statements, opinions and data contained in all publications are solely those of the individual author(s) and contributor(s) and not of MDPI and/or the editor(s). MDPI and/or the editor(s) disclaim responsibility for any injury to people or property resulting from any ideas, methods, instructions or products referred to in the content.