Article

Fairness-Oriented Optimal Energy Management of Hydrogen-Integrated Residential Energy Communities


by
Burak Şafak
and
Alper Çiçek
*
Department of Electrical and Electronics Engineering, Faculty of Engineering, Trakya University, 22030 Edirne, Türkiye
*
Author to whom correspondence should be addressed.
Sustainability 2026, 18(4), 1864; https://doi.org/10.3390/su18041864
Submission received: 6 January 2026 / Revised: 9 February 2026 / Accepted: 9 February 2026 / Published: 11 February 2026

Abstract

Renewable energy sources (RESs) play a key role in the global energy transition by reducing carbon emissions, enhancing energy security, and supporting sustainable development. This study presents a fairness-oriented energy management strategy for residential communities integrated with hydrogen-based technologies. The proposed system comprises photovoltaics (PV), a wind turbine (WT), an energy storage system (ESS), an electrolyzer (EL), a hydrogen tank, and bidirectional grid interaction. For the first time, four fairness indices are introduced to ensure the equitable utilization of renewable generation, stored hydrogen, and ESS among households. The problem was formulated as a mixed-integer linear programming (MILP) model to minimize operating costs. A case study conducted for a residential area in Lüleburgaz, Kırklareli assessed system performance in terms of cost, grid consumption, and carbon emissions. The results demonstrate that the proposed framework reduced grid consumption by 32.25% and carbon emissions by 31.82%. Moreover, increasing renewable capacity by 2.5 times reduced costs by 81,253.16 TL and yielded a profit of 70,107.39 TL, while a similar expansion of ESS capacity enabled 100% green energy accessibility for all households.

1. Introduction

1.1. Motivation

Energy systems are undergoing one of the most profound transformations of the twenty-first century [1]. The depletion of fossil fuel reserves, the growing energy demand, the pressures caused by climate change, and international sustainability targets necessitate a fundamental shift in the approaches to energy production, storage, and consumption [2]. The rapid expansion of renewable energy sources (RESs), advancements in energy storage systems (ESSs), and the emergence of alternative energy carriers have accelerated the transition from centralized generation to more flexible and locally oriented hybrid energy systems [3].
This transformation not only strengthens energy supply security but also brings to the forefront a new model of energy sharing, referred to as energy communities [4]. This concept holds significant potential, particularly in local structures such as residential areas where energy production and consumption take place in the same location. This approach aims to localize energy flows, enhance resource efficiency, reduce carbon emissions, and increase energy independence [5]. Moreover, the active involvement of users in the energy system not only enhances economic benefits but also strengthens community awareness and a culture of solidarity.
Ensuring the effective, efficient, and sustainable operation of this new energy ecosystem is only possible through well-designed energy management models [6]. These models serve as strategic tools that optimize the flows between production, storage, conversion, consumption, and grid interactions, enabling the most efficient use of resources while balancing technical, economic, environmental, and social objectives [7]. In this way, the intermittent nature of renewable generation can be better managed, storage capacity can be used efficiently, grid load can be balanced, energy costs can be minimized, emissions can be reduced, and in the case of surplus production, additional income can be generated through sales to the grid [8].
Hybrid systems, in which different energy carriers such as electricity and hydrogen are managed together, require multidimensional and complex decision-making processes, further increasing the need for advanced energy management models [9]. In this context, hybrid electricity-hydrogen systems offer a strategic solution [10]. Electricity generated from solar panels and wind turbines (WTs) can primarily be used to meet local electricity demand. When generation exceeds demand, it can be handled in different ways: stored in battery systems for short-term use, converted into hydrogen through electrolyzers (ELs) for long-term storage, or sold to the electricity grid depending on real-time market conditions and price advantages [11]. Hydrogen, with its high energy density and zero carbon emissions, can be directly utilized in residential areas for everyday energy needs such as heating through hydrogen boilers, cooking with hydrogen stoves, and transportation via fuel cell electric vehicles (FCEVs). This versatile use makes hybrid systems critical for balancing energy supply and demand, relieving grid load, enhancing energy security, and creating additional income potential [12].
However, minimizing the total cost of the system alone may not be sufficient in hybrid systems. At the scale of residential areas, it is also important to emphasize the fair distribution of electricity and hydrogen produced from renewable sources among users [13]. The intermittent nature of renewable generation may lead to differences in users’ access levels to these resources; some users may benefit disproportionately during advantageous periods, while others may benefit less [14]. This situation can lead to dissatisfaction within the community, loss of trust, and a decrease in willingness to participate in collective energy infrastructure in the long run. Therefore, energy management models should not only focus on efficiency but also be designed to ensure energy justice [15].
The current literature mostly addresses energy justice within the context of electricity; significant gaps remain regarding the fair distribution of hydrogen in hybrid systems, the equitable use of ESSs, and the holistic sharing of total green energy production [16]. Moreover, there have been no studies investigating the impact of applying energy justice at different levels on system performance. However, the application of different justice indices and fairness levels may lead to significant variations in technical efficiency, economic profitability, grid interaction strategies, and social satisfaction.
This study developed a novel energy management model that considers different justice indices (i.e., fair use of only the ESS, fair use of only renewable electricity, fair use of only hydrogen energy, and fair use of total green energy) and varying levels of justice implementation within hybrid energy ecosystems designed for residential areas. The model provides a multidimensional decision-making mechanism that simultaneously optimizes local consumption, storage, hydrogen conversion, and grid sales options.

1.2. Literature Review

While energy management systems aim to ensure the efficient use of resources and promote sustainability, increasing attention is being paid to their fairness and inclusiveness from a societal perspective. Issues such as equitable access to energy, participation in decision-making processes, and the just distribution of resources have positioned the concept of justice as a central concern in energy management models. Erdinç [17] proposed a real-time energy management method for residential communities integrating photovoltaic (PV) and ESSs that minimizes cost and improves fairness under PV uncertainty via rolling-horizon mixed-integer linear programming (MILP). Lee and Kwon [18] proposed a threshold-based ESS sharing strategy for residential communities that used a two-stage stochastic program to tune charge/discharge thresholds from historical demand and solar data. Simulations using a Texas community dataset showed equitable access and efficient operation under price volatility and renewable intermittency, with adaptability across diverse settings. Paudel et al. [19] proposed a cooperative joint-operation framework for electric vehicle fast-charging hubs and stand-alone battery storage systems, formulated as a bi-objective model reformulated into a second-order cone Nash bargaining problem for fairness. Using ERCOT market data, they showed that cooperation yielded fairly shared added benefits. Dynge and Cali [20] examined fairness in local electricity markets by defining distributive energy justice and evaluating common fairness indicators using simulations with real Norwegian household consumption data. They found that widely used indicators need refinement and proposed adjustments to improve accuracy and relevance, highlighting that better-aligned metrics can support fairer market designs and reduce participant bias. Tairo et al. [21] proposed a multi-objective microgrid energy management model that targeted cost and energy non-supplied (ENS) while enforcing fairness in electric vehicle charging via an index based on state of charge, capacity, and charging-time availability. Hardware-in-the-Loop testing within an IoT framework using CAMPUSGRID data showed reduced ENS, 18% cost savings, and more equitable EV energy allocation. Soares et al. [22] reviewed 80 studies to map how fairness was defined and operationalized in Local Energy Systems (LESs) under user-centric decentralization. They classified the literature by LES applications, fairness/justice interpretations (e.g., equality, meritocracy), and post-method indicators, and concluded that a unified LES fairness framework is still lacking while outlining key gaps and future research directions. Santos et al. [23] analyzed four Portuguese energy-community scenarios to compare sharing and metering mechanisms in terms of self-consumption, self-sufficiency, and participant equity, clarifying fairness–efficiency–sustainability trade-offs.
Energy management systems in residential areas and communities focus on optimizing the energy consumption patterns of individual users and collectives. These systems aim to develop sustainable and participatory energy solutions by integrating dynamics such as local energy generation, sharing, and demand management. Çiçek [24] proposed a multi-objective MILP operating model for a grid-interactive green building with RESs, fuel cells (FCs), hydrogen-based systems, flexible loads, and electric and hydrogen vehicles. A Nottingham (UK) case study showed full autonomy under grid disconnection, about a 29% cost reduction via RESs and FC, and highlighted the importance of HEVs and FC during outages and the WT for lowering electricity costs. Deng et al. [25] proposed a multi-stage framework to improve smart residential community resilience during planned outages by coordinating household load shifting and electric vehicle (EV) storage as Virtual Flexible Energy Resources. It generates detailed appliance and EV schedules from pre-announced outage windows, and simulations showed scalable, computationally efficient reductions in outage disruptions. Hussain et al. [26] proposed a decentralized demand response scheme combining time-of-use pricing, incentive-based bidding, and peer-to-peer trading to maximize net present value (NPV). Game-theoretic Nash-equilibrium scheduling and a color-based bilateral trading rule improved privacy and efficiency, delivering NPV gains up to 42.4% for prosumers and 34.79% for the community. Dos Santos et al. [27] proposed a community energy management system (CEMS) for shared and individual PV and battery storage under Brazil’s Time-of-Use tariffs. A two-level community and home controller applied price-based demand response with multi-objective hybrid optimization to reduce cost and discomfort, achieving efficient battery scheduling and up to 20% daily savings in simulations. Taşçıkaraoğlu et al. [28] proposed an optimization framework that coordinates fixed and mobile electric vehicle charging stations supported by CES to satisfy distributed charging demand while accounting for user preferences. Simulations reported 90% emission reduction, elimination of queue times, and improved cost-efficiency and scalability relative to existing methods. Ghasemnejad et al. [29] proposed a robust optimization model for Citizen Energy Communities to manage net-load ramping from variable Distributed Energy Resources while considering flexibility limits, thermal comfort via the Predicted Mean Vote index, and upstream price uncertainty. Results showed that integrating CES cuts operating costs by 34.6% and reduces curtailment by 602.98 kW.
Energy management systems are not limited to residential areas; they are also implemented in non-residential contexts such as industrial facilities, commercial buildings, and infrastructure. These models aim to enhance energy efficiency and sustainability by considering different consumption needs and operational conditions.
Abomazid et al. [30] proposed an optimal PV-based hydrogen production scheduling model with ESSs that used a Z-score of historical electricity prices to enable seasonal hydrogen storage. Four case studies indicated reliable and cost-effective operation across intra-seasonal and seasonal storage, with performance driven by electrolyzer capacity factor, hydrogen storage size, and PV share. Khavari et al. [31] proposed a bi-level optimization model for underground hydrogen storage (UHS) that integrates daily scheduling with yearly planning to manage seasonal energy fluctuations. Using South Australia data, they showed that linking short-term flexibility with long-term planning improved UHS performance. Wade et al. [32] proposed a bi-level optimization model for a Power-to-Hydrogen-to-Power system with wind and solar, an EL, hydrogen storage, and a hydrogen gas turbine. In an Australian case study, renewables supplied base demand and hydrogen assets provided flexibility and sales revenue, but subsidies were needed for profitability. Dai [33] proposed an optimal energy management strategy for a multi-energy multi-microgrid network to minimize operating cost and carbon emissions under regulatory constraints. Using a fuzzy-enhanced Mountain Gazelle Optimizer with Pareto optimality, the approach supports decentralized control and reduces wind curtailment, delivering up to 37.5% emission reductions and 12.3% cost savings in simulations. Ahmed et al. [34] evaluated an intelligent energy management system for an Islamabad hybrid microgrid with PVs, WTs, ESSs, and hydrogen FCs, identifying Transient Search (TS) as the best-performing optimizer. Their 25-year analysis showed that the PV-wind-battery configuration was the most cost-effective, reducing costs by up to 13.2% versus fully integrated systems. Tang et al. [35] proposed a three-layer multi-time scale scheduling strategy for a coupled hydrogen-electricity port energy system to improve renewable integration under uncertain demand. A Ningbo Zhoushan Port case study reported 25.42% cost reduction and 14.78% CO2 reduction versus no energy management, with sensitivity results highlighting hydrogen price and soft open points rated power effects. Çiçek [36] proposed an MILP-based operating model for an autonomously powered hydrogen-based country house supporting fishing activities, targeting cost minimization and outage resilience. Using real data from Edirne, Türkiye, results showed that renewable integration, particularly wind, reduced both energy cost and emissions and supported rural energy independence.

1.3. Contributions

This study proposes an MILP based strategy for the economic operation of a residential community composed of individual households. The main contributions of the proposed energy management strategy are summarized as follows:
  • A fairness-oriented energy management model is introduced to minimize the operating cost of a residential area with coupled electricity and hydrogen energy demands.
  • To support equitable energy utilization within the community, four fairness index types are defined, namely fair use of the ESS only, fair use of renewable electricity only, fair use of hydrogen energy only, and fair use of total green energy. This diversity enables a multidimensional assessment of fairness in hybrid energy systems.
  • Hydrogen energy is integrated to supply household heating via hydrogen boilers, cooking via hydrogen stoves, and transportation via fuel cell electric vehicles (FCEVs), while other electrical loads are met through RESs, the ESS, and the electricity grid.
The proposed energy management strategy was validated through case studies using real data from Lüleburgaz, Kırklareli, Türkiye. The results indicate that the framework is applicable not only in Türkiye, but also in regions with different geographical, climatic, and socio-economic characteristics. Therefore, this study can serve as a reference for researchers and practitioners interested in designing and operating similar hybrid energy systems.

1.4. Paper Organization

The rest of the paper is structured as follows. Section 2 presents the mathematical formulation of the proposed fairness-oriented green energy management model. Section 3 discusses the test studies conducted to evaluate the model’s performance and provides a detailed analysis of the results. Finally, Section 4 concludes the paper by summarizing the key findings and outlining future research directions.

2. Methodology

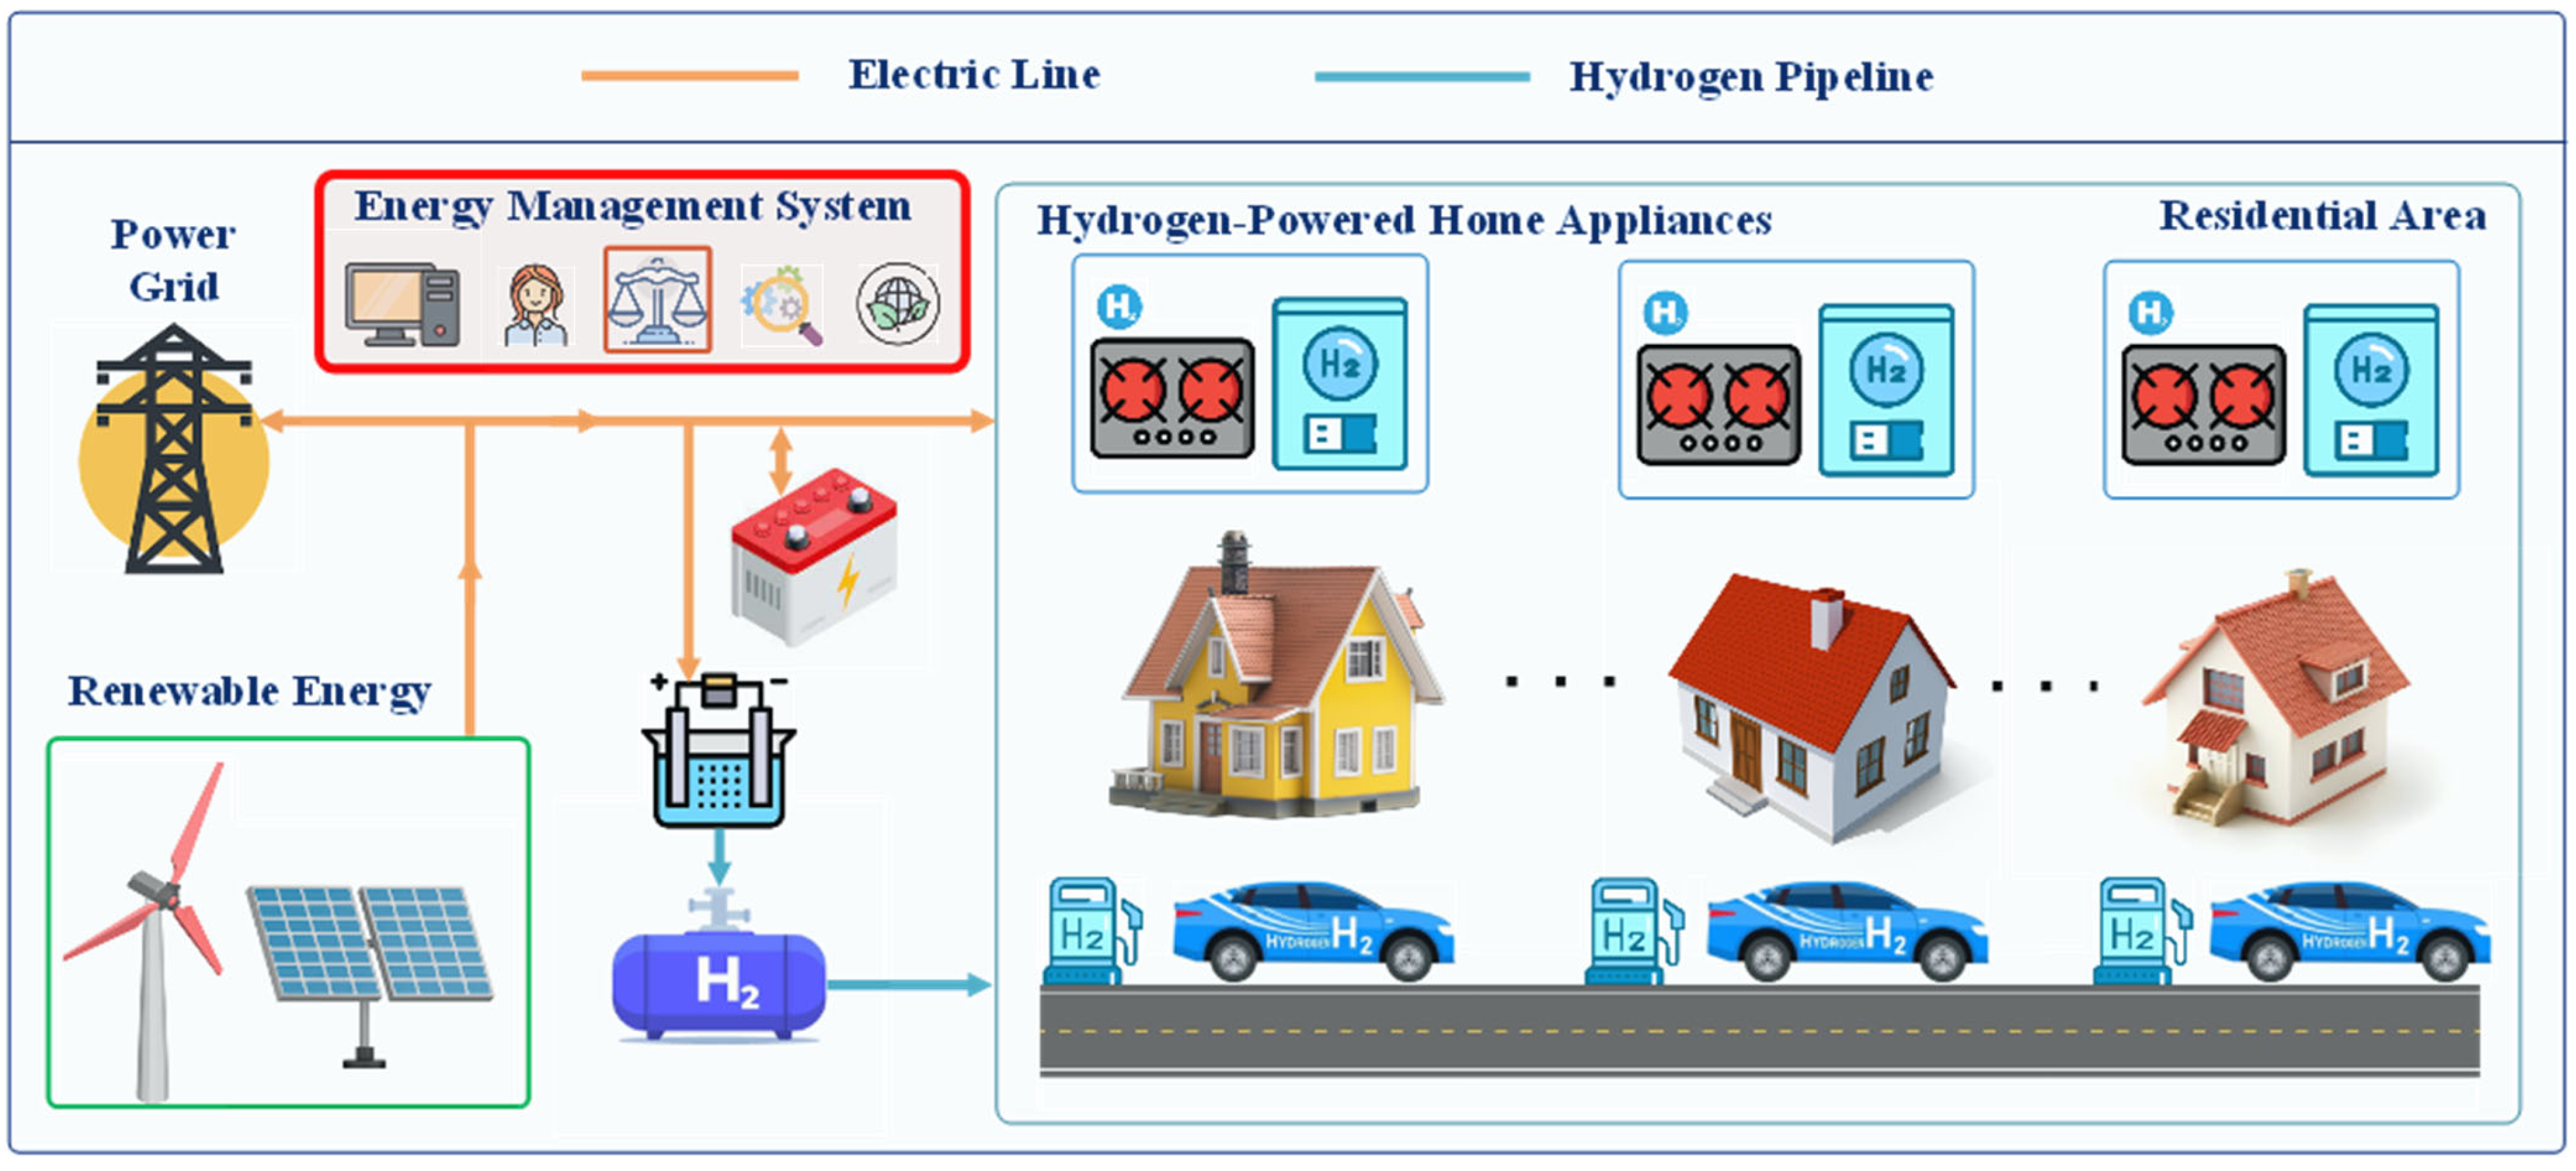
Figure 1 presents the general layout of a residential area managed by a fairness-oriented green energy system. The system integrates multiple households, each of which consumes electricity and hydrogen-based energy. Power is generated on-site by RESs including PV panels and WTs. A centralized EL converts electrical energy into hydrogen, which is then stored in a hydrogen tank and supplied to households for usage in hydrogen-based equipment such as FCEVs or appliances. The system also includes an energy storage unit that balances surplus and deficit energy across time. All components are managed by a central controller that determines the energy flow paths between the sources, storage units, and consumers. The controller ensures that the energy demands of all households are met in a cost-effective and fair manner, respecting minimum and maximum thresholds of green energy and hydrogen usage per house. The system is connected to the electricity grid, allowing power purchases and sales depending on economic and operational considerations.
The mathematical formulation of the proposed fairness-oriented green energy management strategy for residential areas powered by hydrogen technologies is explained in this section. The developed model aims to ensure equitable hydrogen usage among households while optimizing the operation of RESs, the EL, hydrogen tanks, and hydrogen-based equipment. The mathematical model is structured as an MILP problem.
In the proposed model, capital expenditures are not considered, and the study focused solely on operational optimization.
The mathematical formulation comprises 36 equations, each of which contributes to the representation of the system constraints and fairness mechanisms. Equation (1) defines the objective of the study. It aims to minimize the total operational cost of the residential area by considering the electricity purchased from the power grid and subtracting any revenue obtained from selling electricity back to the grid throughout the planning horizon.
M i n i m i z a t i o n t o t a l   o p e r a t i o n   c o s t = t P t b u y _ g r i d P t s e l l _ g r i d λ t p r i c e Δ T
Equation (2) ensures the hydrogen balance within the hydrogen tank. It states that at each time step, the net hydrogen content change in the tank equals the hydrogen produced by the EL using renewable and grid electricity, minus the hydrogen consumed by residential demands. Equation (3) enforces the hydrogen tank capacity limits, ensuring that the stored hydrogen quantity remains within the defined minimum and maximum limits. Equation (4) sets the terminal constraint on the hydrogen storage level at the final time period.
A t t a n k s A t 1 t a n k s A t E L _ R E S s A t E L _ G r i d s + h A t , h R H _ R E S s + h A t , h R H _ G r i d s = 0 ,     i f   t > 1
A m i n t a n k A t t a n k A m a x t a n k ,     t
A t t a n k A f i n a l t a n k ,     i f   t = l a s t   t i m e   p e r i o d
Equation (5) ensures that the total amount of hydrogen delivered to households and labeled as produced from RESs does not exceed the total hydrogen actually generated by the EL using renewable electricity. This constraint is essential for maintaining the integrity of green hydrogen accounting. Equation (6) defines the hydrogen demand of each household as the sum of hydrogen supplied from both renewable-based and grid-based sources, enabling traceability of the hydrogen origin. Equation (7) further breaks down the total household hydrogen demand into two main consumption categories: hydrogen used by domestic hydrogen appliances and hydrogen consumed by FCEVs. These formulations collectively support the accurate tracking of hydrogen flow.
t h A t , h R H _ R E S = t A t E L _ R E S ,     t
A t , h H o u s e _ H 2 _ D e m a n d = A t , h R H _ R E S + A t , h R H _ G r i d ,     t
A t , h H o u s e _ H 2 _ D e m a n d = A t , h H y d r o g e n _ a p p l i a n c e s + A t , h F C E V ,     t
Equation (8) sets the operational limits for the EL power input, ensuring it remains within technical minimum and maximum capacities. Equation (9) establishes the relationship between the hydrogen production of the EL and the input electrical power. It calculates the amount of hydrogen generated based on the EL’s efficiency, the lower heating value of hydrogen, and the duration of each time step, thereby converting electrical energy into the corresponding amount of hydrogen. Equation (10) quantifies the amount of hydrogen produced in the EL using electricity exclusively sourced from RESs. This includes the power supplied by the PV system, WT, and ESS that has previously stored renewable energy. Equation (11) calculates the amount of hydrogen produced using the electricity purchased from the grid and supplied to the EL. The grid-supplied power is first multiplied by the efficiency of the EL to determine the effective energy input. This energy is then divided by the lower heating value of hydrogen to convert it into the equivalent mass of hydrogen produced. Finally, the result is scaled by the time interval to reflect the total hydrogen production during that period.
P m i n E L P t E L P m a x E L ,     t
A t E L _ R E S + A t E L _ G r i d = η E L P t , s E L L H V H 2 Δ T ,     t
A t E L _ R E S = η E L P t P V _ t o _ E L + P t W T _ t o _ E L + P t E S S _ t o _ E L ( P V ) + P t E S S _ t o _ E L ( W T ) L H V H 2 Δ T ,     t
A t E L _ G r i d = η E L P t g r i d _ t o _ E L L H V H 2 Δ T ,     t
Equation (12) models the total power input to the EL as the sum of power sourced from the power grid, PV system, WT, and ESS.
P t , s E L = P t g r i d _ t o _ E L + P t P V _ t o _ E L + P t W T _ t o _ E L + P t E S S _ t o _ E L ( P V ) + P t E S S _ t o _ E L ( W T ) + P t E S S _ t o _ E L ( G r i d ) ,     t
Equations (13) and (14) define the power exchange direction with the grid using a binary variable. When the binary variable is 1, power can only be purchased from the power grid; when it is 0, power can only be sold. These constraints ensure that electricity cannot be bought and sold simultaneously at any time step.
P t b u y _ g r i d u t g r i d B P N ,     t
P t s e l l _ g r i d ( 1 u t g r i d ) B P N ,     t
Equation (15) defines the total electrical power purchased from the power grid at each time step. It is calculated as the sum of the power delivered from the grid to the residential houses, EL, and ESS. Equation (16) expresses the total power sold to the grid, which includes the surplus electricity generated by the PV system, WT, and the energy discharged from the ESS.
P t b u y _ g r i d = h P t , h g r i d _ t o _ h o u s e + P t g r i d _ _ t o _ E L + P t g r i d _ t o _ E S S ,     t
P t s e l l _ g r i d = P t P V _ t o _ g r i d + P t W T _ t o _ g r i d + P t E S S _ t o _ g r i d ,     t
Equation (17) determines the power balance for the system. The power demand of the residential houses and the EL, as well as the charging power of the ESS, can be supplied by the power grid, WT, PV system, and discharging power from the ESS. Additionally, the sale of excess energy to the power grid is also considered.
P t R H + P t s e l l _ g r i d + P t E L + P t c h _ E S S = P t b u y _ g r i d + P t W T + P t P V + P t d i s c h _ E S S ,     t
Equation (18) defines the total power demand of the residential area at each time step, which is calculated as the sum of the electricity consumption of all individual houses. Equation (19) details the composition of the house power demand by identifying its various sources, including direct supply from the WT and PV system, as well as electricity discharged from the ESS that was originally charged by PV, WT, or the grid. Additionally, it includes the electricity directly purchased from the grid. This formulation enables a clear allocation of the energy source responsible for meeting each house’s demand.
P t R H = h P t , h h o u s e ,     t
P t , h W T _ t o _ h o u s e + P t , h P V _ t o _ h o u s e + P t , h d i s c h _ t o _ H o u s e ( P V ) + P t , h d i s c h _ t o _ H o u s e ( W T ) + P t , h d i s c h _ t o _ H o u s e ( G r i d ) + P t , h g r i d _ t o _ h o u s e = P t , h h o u s e ,     t , h
Equation (20) describes the power balance for the PV system. The total electricity generated is allocated among four destinations: energy sold to the power grid, electricity used to charge the ESS, power supplied directly to residential houses, and electricity consumed by the EL. Similarly, Equation (20) defines the distribution of the electricity generated by the WT across the same four pathways. These formulations ensure the accurate tracking of renewable energy flows and enable source-specific attribution throughout the system.
P t P V = P t P V _ t o _ g r i d + P t P V _ t o _ E S S + h P t , h P V _ t o _ h o u s e + P t P V _ t o _ E L ,     t
P t W T = P t W T _ t o _ g r i d + P t W T _ t o _ E S S + h P t , h W T _ t o _ h o u s e + P t W T _ t o _ E L ,     t
Equation (22) updates the state of charge of the ESS at each time step. It accounts for the energy charged from the PV system, WT, and power grid, and subtracts the energy discharged to the residential houses, power grid, and EL. This dynamic energy balance ensures the accurate tracking of energy inflows and outflows, preserving consistency in the operation of the ESS over time. Equation (23) defines the total charging power directed to the ESS. It aggregates power contributions from the power grid, PV system, and WT. Equation (24) represents the total discharging power from the ESS. It includes the energy supplied to houses (originating from previously stored grid, PV, or WT), the power exported to the grid, and the electricity used to operate the EL. Equation (25) limits the charging power of the ESS, allowing it only when the corresponding binary variable indicates a charging state. Equation (26) restricts the discharging power to periods when the system is not in charging mode.
E t E S S = E t 1 E S S + P t P V _ t o _ E S S + P t c h _ E S S Δ T η b a t c h P t d i s c h _ E S S   Δ T / η b a t d i s c h ,     t > 1
P t c h _ E S S = P t g r i d _ t o _ E S S + P t P V _ t o _ E S S + P t W T _ t o _ E S S ,     t
P t d i s c h _ E S S = P t E S S _ t o _ g r i d + h P t , h d i s c h _ t o _ h o u s e ( P V ) + h P t , h d i s c h _ t o _ h o u s e ( W T ) + h P t , h d i s c h _ t o _ h o u s e ( G r i d ) + P t E S S _ t o _ E L ( P V ) + P t E S S _ t o _ E L ( W T ) + P t E S S _ t o _ E L ( G r i d ) ,     t
P t c h _ E S S u t E S S P c h _ c a p ,     t
P t d i s c h _ E S S ( 1 u t E S S ) P d i s c h _ c a p ,     t
Equation (27) defines a fundamental energy balance condition to ensure that the total renewable electricity discharged from the ESS to residential houses does not exceed the cumulative amount of green energy previously stored from PV and WT. Equation (28) ensures that the total renewable electricity discharged from the ESS to residential houses and the EL does not exceed the amount previously stored from PV and WT.
t h P t , h d i s c h _ t o _ h o u s e ( P V ) + t h P t , h d i s c h _ t o _ h o u s e ( W T ) t P t P V _ t o _ E S S + P t W T _ t o _ E S S ,     t
t P t P V _ t o _ E S S + P t W T _ t o _ E S S t h P t , h d i s c h _ t o _ h o u s e ( P V ) + P t , h d i s c h _ t o _ h o u s e ( W T ) + t P t E S S _ t o _ E L ( P V ) + P t E S S _ t o _ E L ( W T ) ,     t
Fairness index structures have been addressed in the literature under various concepts [22]. The fairness index structure used in this model falls under the supply-and-demand ratio (SDR) concept and has been adopted in many studies. As an example from the literature, Erdinç [17] presented an energy management model focusing on the fair utilization of an energy storage system and PV-based electricity generation within a community. In that model, the fair utilization of the energy storage system was defined as the percentage of ESS supply ratio (%ESR), while the fair utilization of electricity generated by PV was defined as the percentage of photovoltaic supply ratio (%PSR).
Equations (29)–(32) quantify the shares of renewable and green energy used to meet the combined electricity and hydrogen demands of each house. Specifically, Equation (29) defines the Renewable Electricity Supply Ratio (RESR) as the percentage of a house’s total electricity demand that is met directly by the PV system, WT, and by energy discharged from the ESS that was originally generated from RESs. Equation (30) defines the Energy Storage System Supply Ratio (ESSSR) for each house. This index quantifies the share of the house’s electricity demand that is met using energy discharged from the ESS. Specifically, it includes energy originally generated by the PV system, WT, or purchased from the power grid, which was previously stored and later discharged to meet the electricity needs of house h. Equation (31) introduces the Hydrogen Energy Supply Ratio (HESR), representing the proportion of a house’s hydrogen demand met by hydrogen produced from RESs. Finally, Equation (32) defines the Total Green Energy Supply Ratio (TGESR) for each house. It calculates the percentage of the total energy demand covering both electricity and hydrogen that is met by green energy sources. These include the direct electricity supply from the PV system and WT, the renewable electricity discharged from the ESS, and the renewable-based hydrogen consumption converted into its energy equivalent.
In the proposed model, hydrogen energy is produced and consumed only within the region, and no hydrogen pipeline infrastructure is considered. Therefore, the “green” status of hydrogen can be clearly tracked. The electricity input of the EL can be supplied from the electricity grid, RESs, or the ESS. Green hydrogen production is associated solely with the consumption of RES-based electricity. Since RESs can charge the ESS, supplying the EL with electricity generated by RESs and stored in the ESS is also considered green hydrogen production. To enable this distinction, the relevant inputs and outputs are detailed in the mathematical model by defining them with multiple variables.
% R E S R = t P t , h W T _ t o _ h o u s e + P t , h P V _ t o _ h o u s e + P t , h d i s c h _ t o _ h o u s e ( P V ) + P t , h d i s c h _ t o _ h o u s e ( W T ) Δ T t P t , h h o u s e Δ T 100 ,     h
% E S S S R = t P t , h d i s c h _ t o _ h o u s e ( P V ) + P t , h d i s c h _ t o _ h o u s e ( W i n d ) + P t , h d i s c h _ t o _ h o u s e ( G r i d ) Δ T t P t , h h o u s e Δ T 100 ,     h
% H E S R = t A t , h R H _ R E S t A t , h H o u s e _ H 2 _ D e m a n d 100 ,     h
% T G E S R = t P t , h W T _ t o _ h o u s e + P t , h P V _ t o _ h o u s e + P t , h d i s c h _ t o _ h o u s e ( P V ) + P t , h d i s c h _ t o _ h o u s e ( W T ) Δ T + t A t , h R H _ R E S α t P t , h h o u s e Δ T + t A t , h H o u s e _ H 2 _ D e m a n d α 100 ,     h
Equations (33)–(36) define the fairness constraints applied to green energy distribution among houses. Each constraint sets allowable bounds for a specific energy ratio: RESR, ESSSR, HESR, and TGESR. These inequalities ensure that each house receives a fair and balanced portion of green energy within the defined minimum thresholds, promoting equity in energy access.
N m i n % R E R N m a x
N m i n % E S S R N m a x
N m i n % H E R N m a x
N m i n % T G E R N m a x

3. Tests and Results

The proposed energy model was tested using GAMS v.24.1.3 software and solved by the commercially available CPLEX v.12 [37] solver. The model includes 35 variables and a total of 44 equations, including constraints. The problem can be solved in 5.39 s even for the longest case.

3.1. Input Data

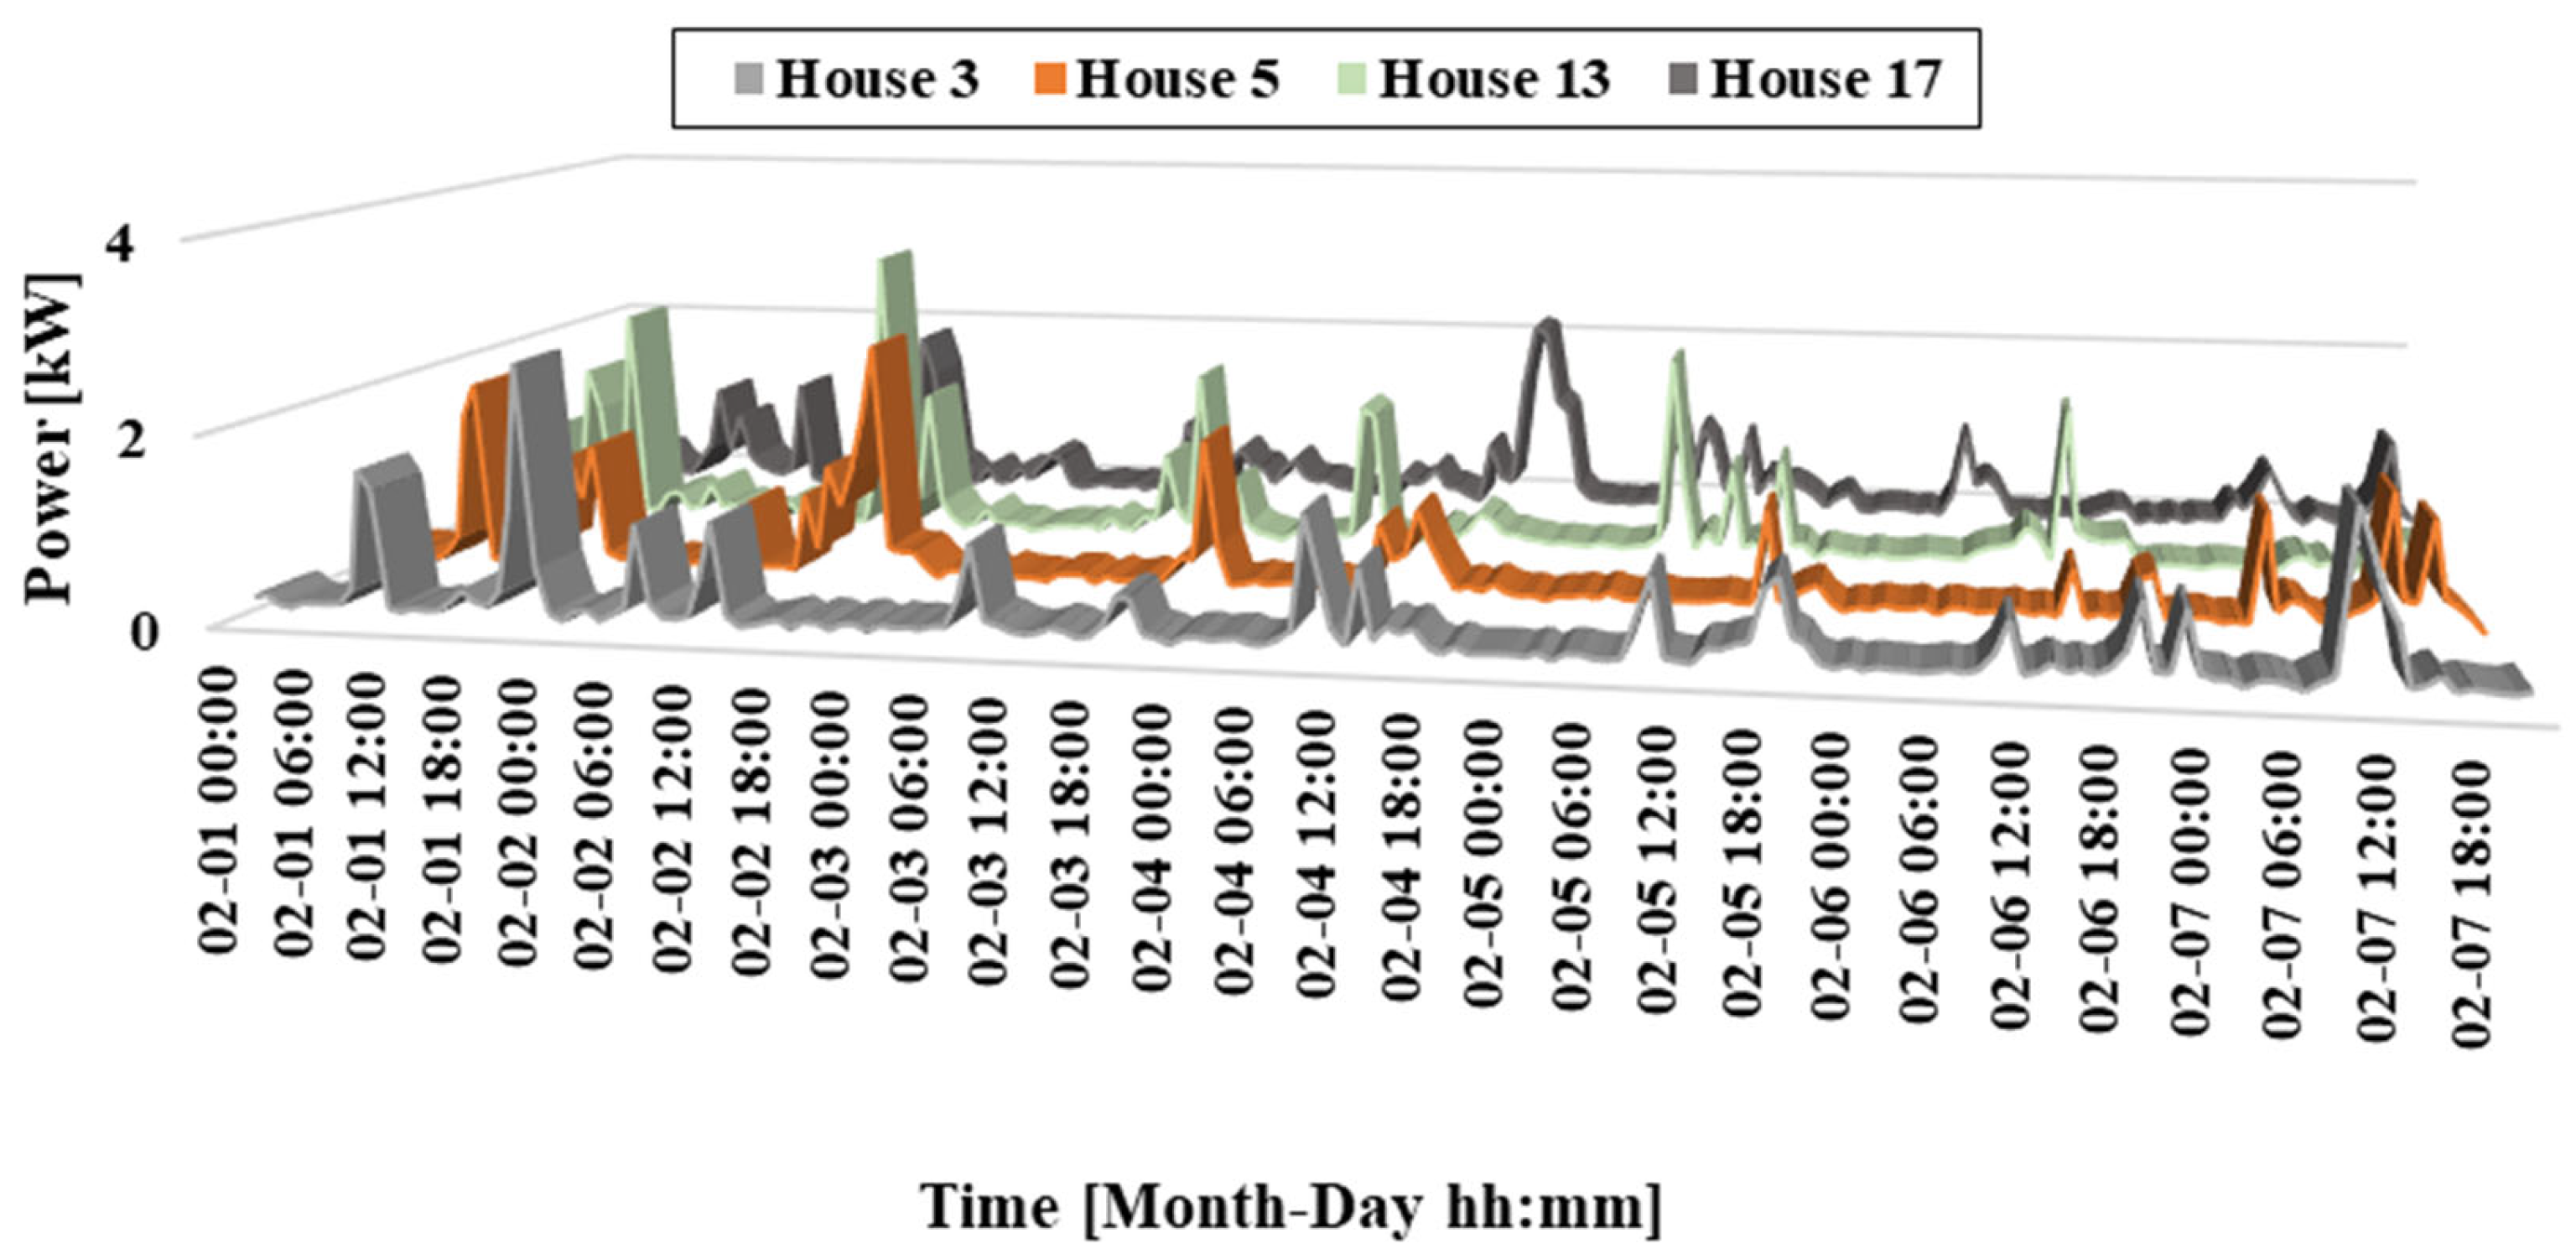
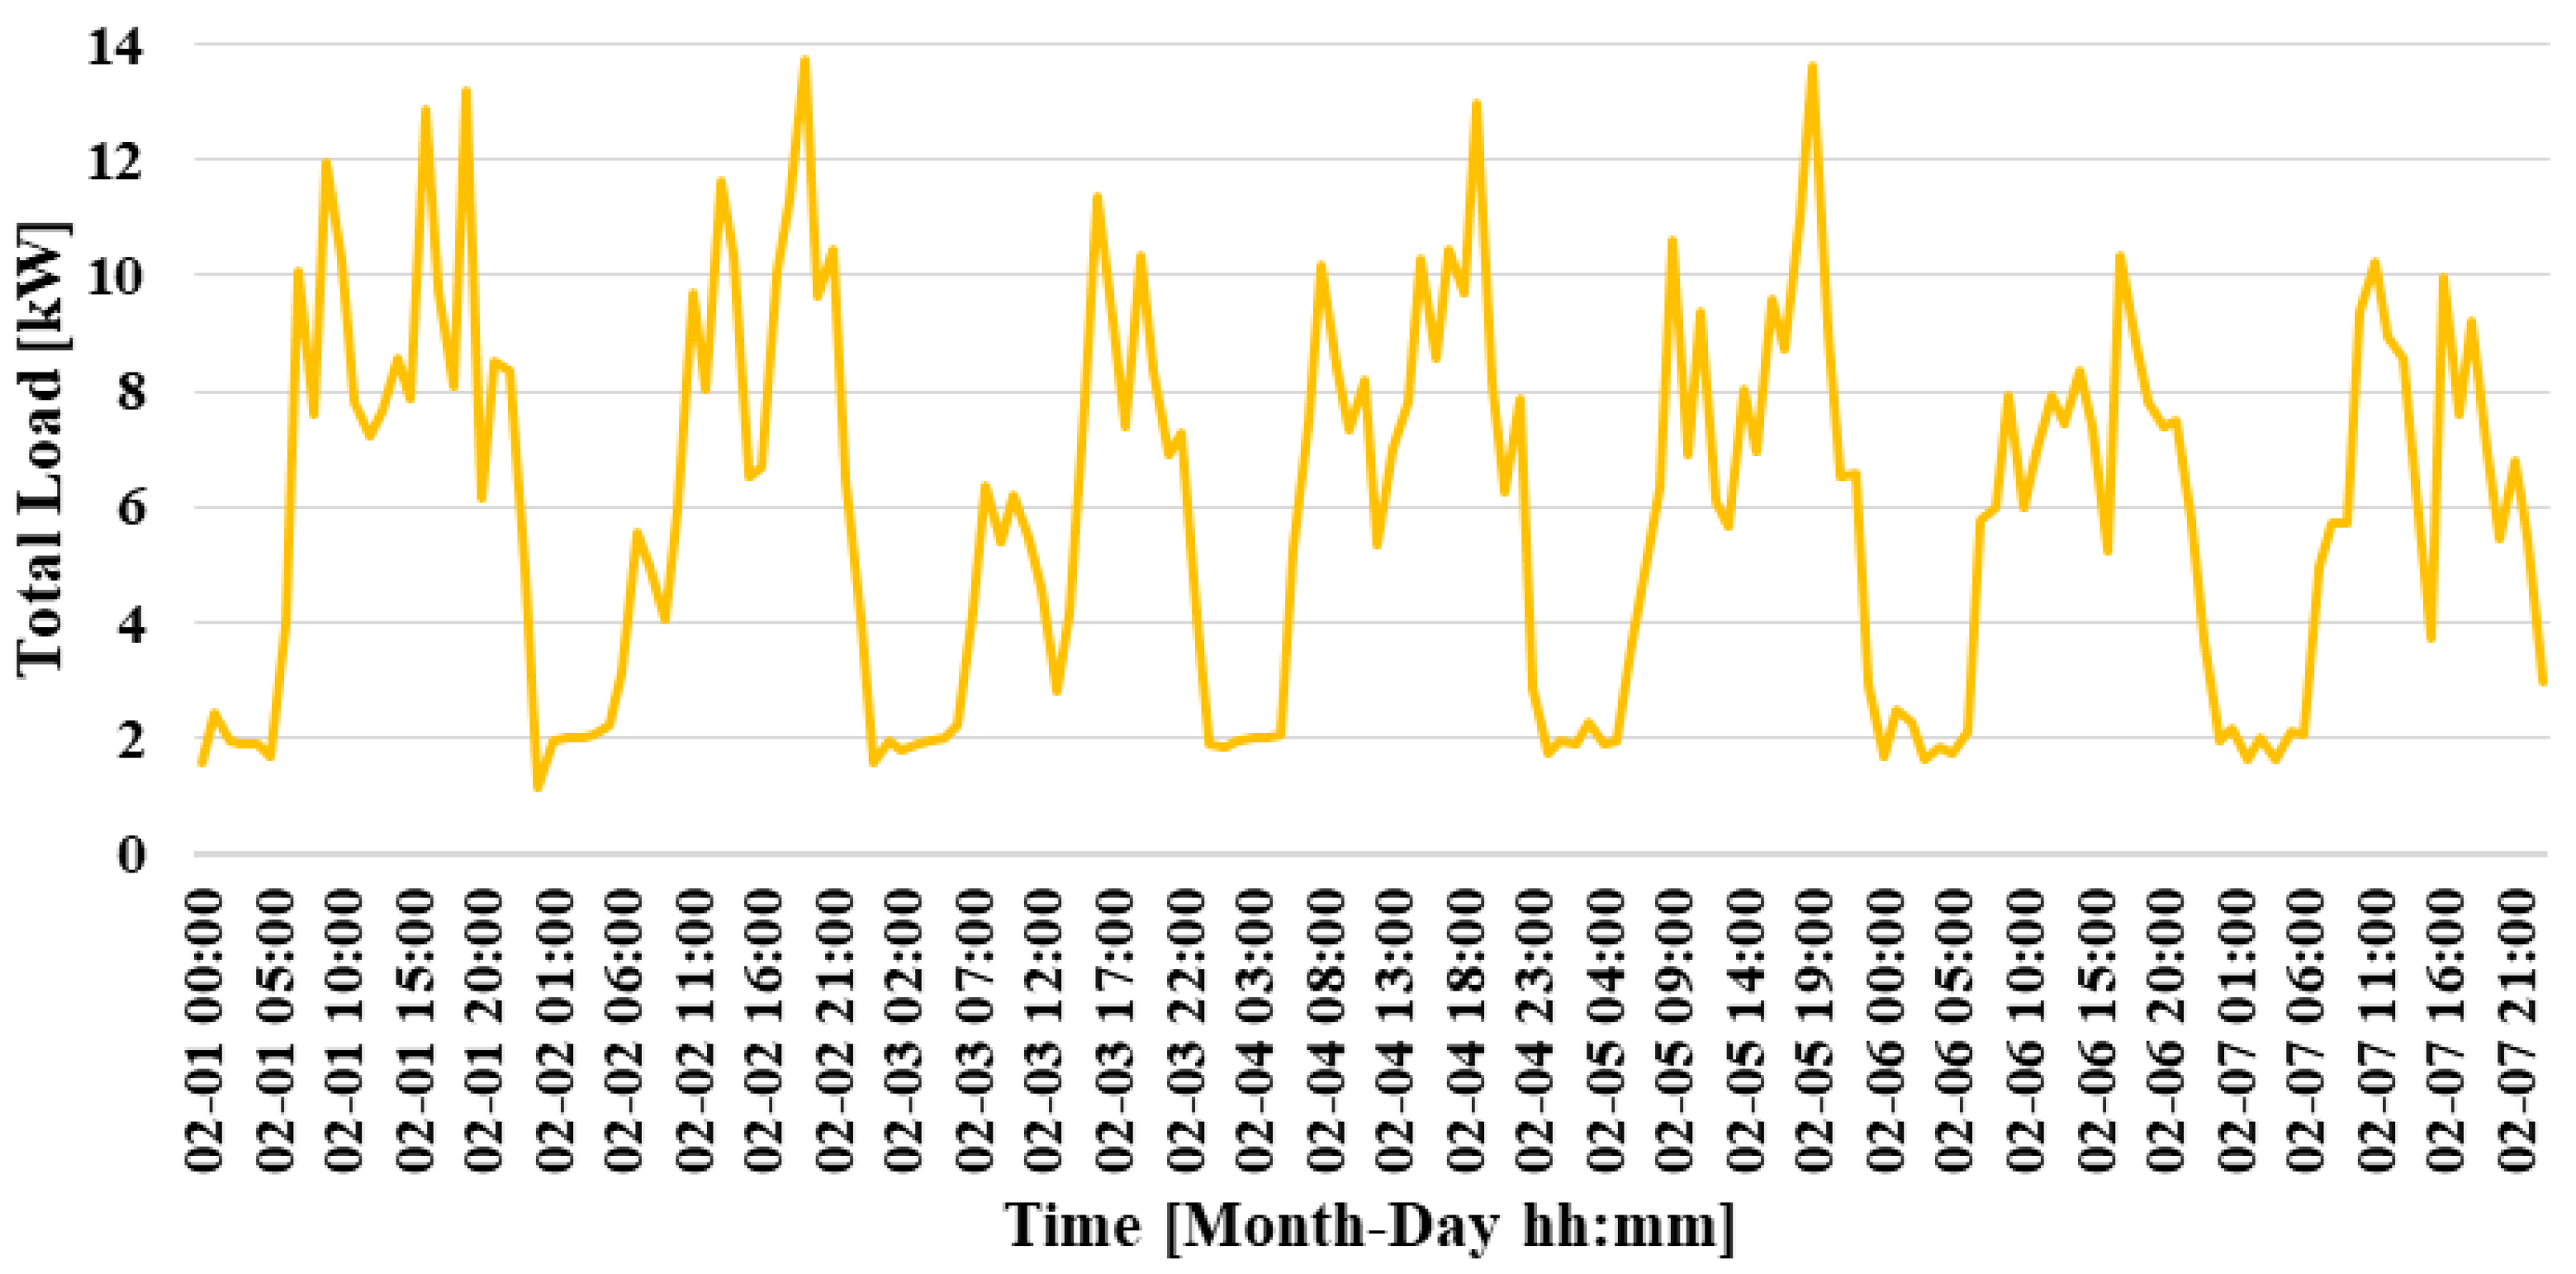
The proposed model was tested using assumed data based on a residential area located in Lüleburgaz, a district in the Kırklareli province of Türkiye. The area consists of 20 houses, including 3 single-occupant houses, 5 houses with two residents, 8 houses with three residents, and 4 houses with four residents. The relevant data were created using a Microsoft Excel workbook available online [38]. One-week sample consumption data for each house type are presented in Figure 2. In Figure 2, House 3 represents a single-occupant house, House 5 a two-person house, House 13 a three-person house, and House 17 a four-person house. The total electrical power demand of the residential area is presented in Figure 3.
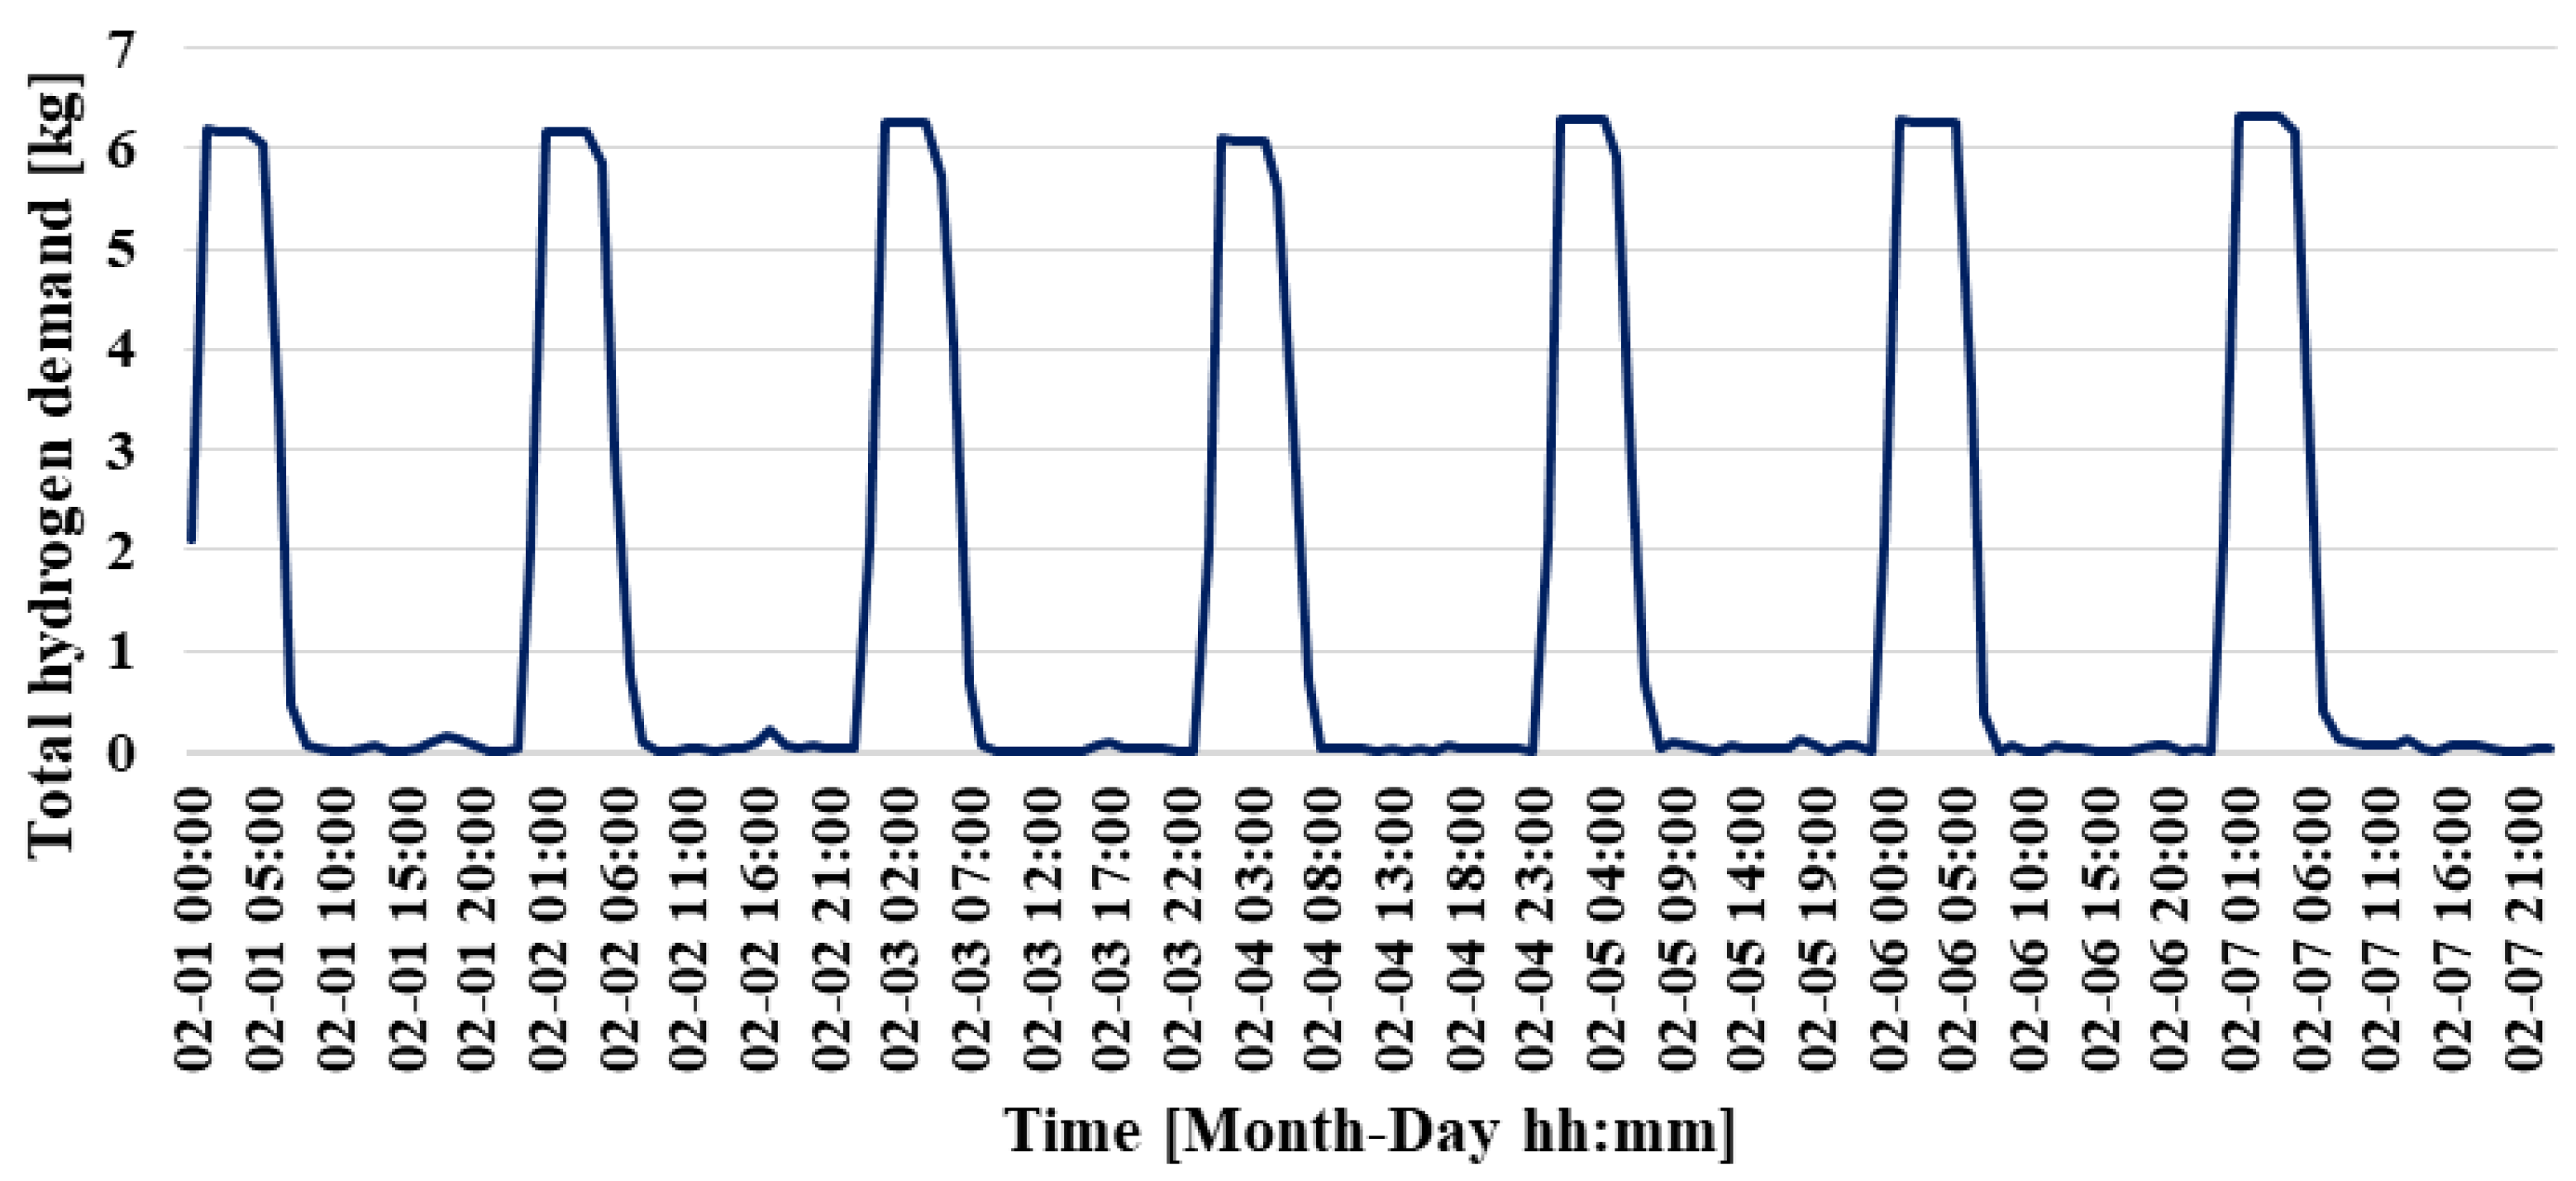
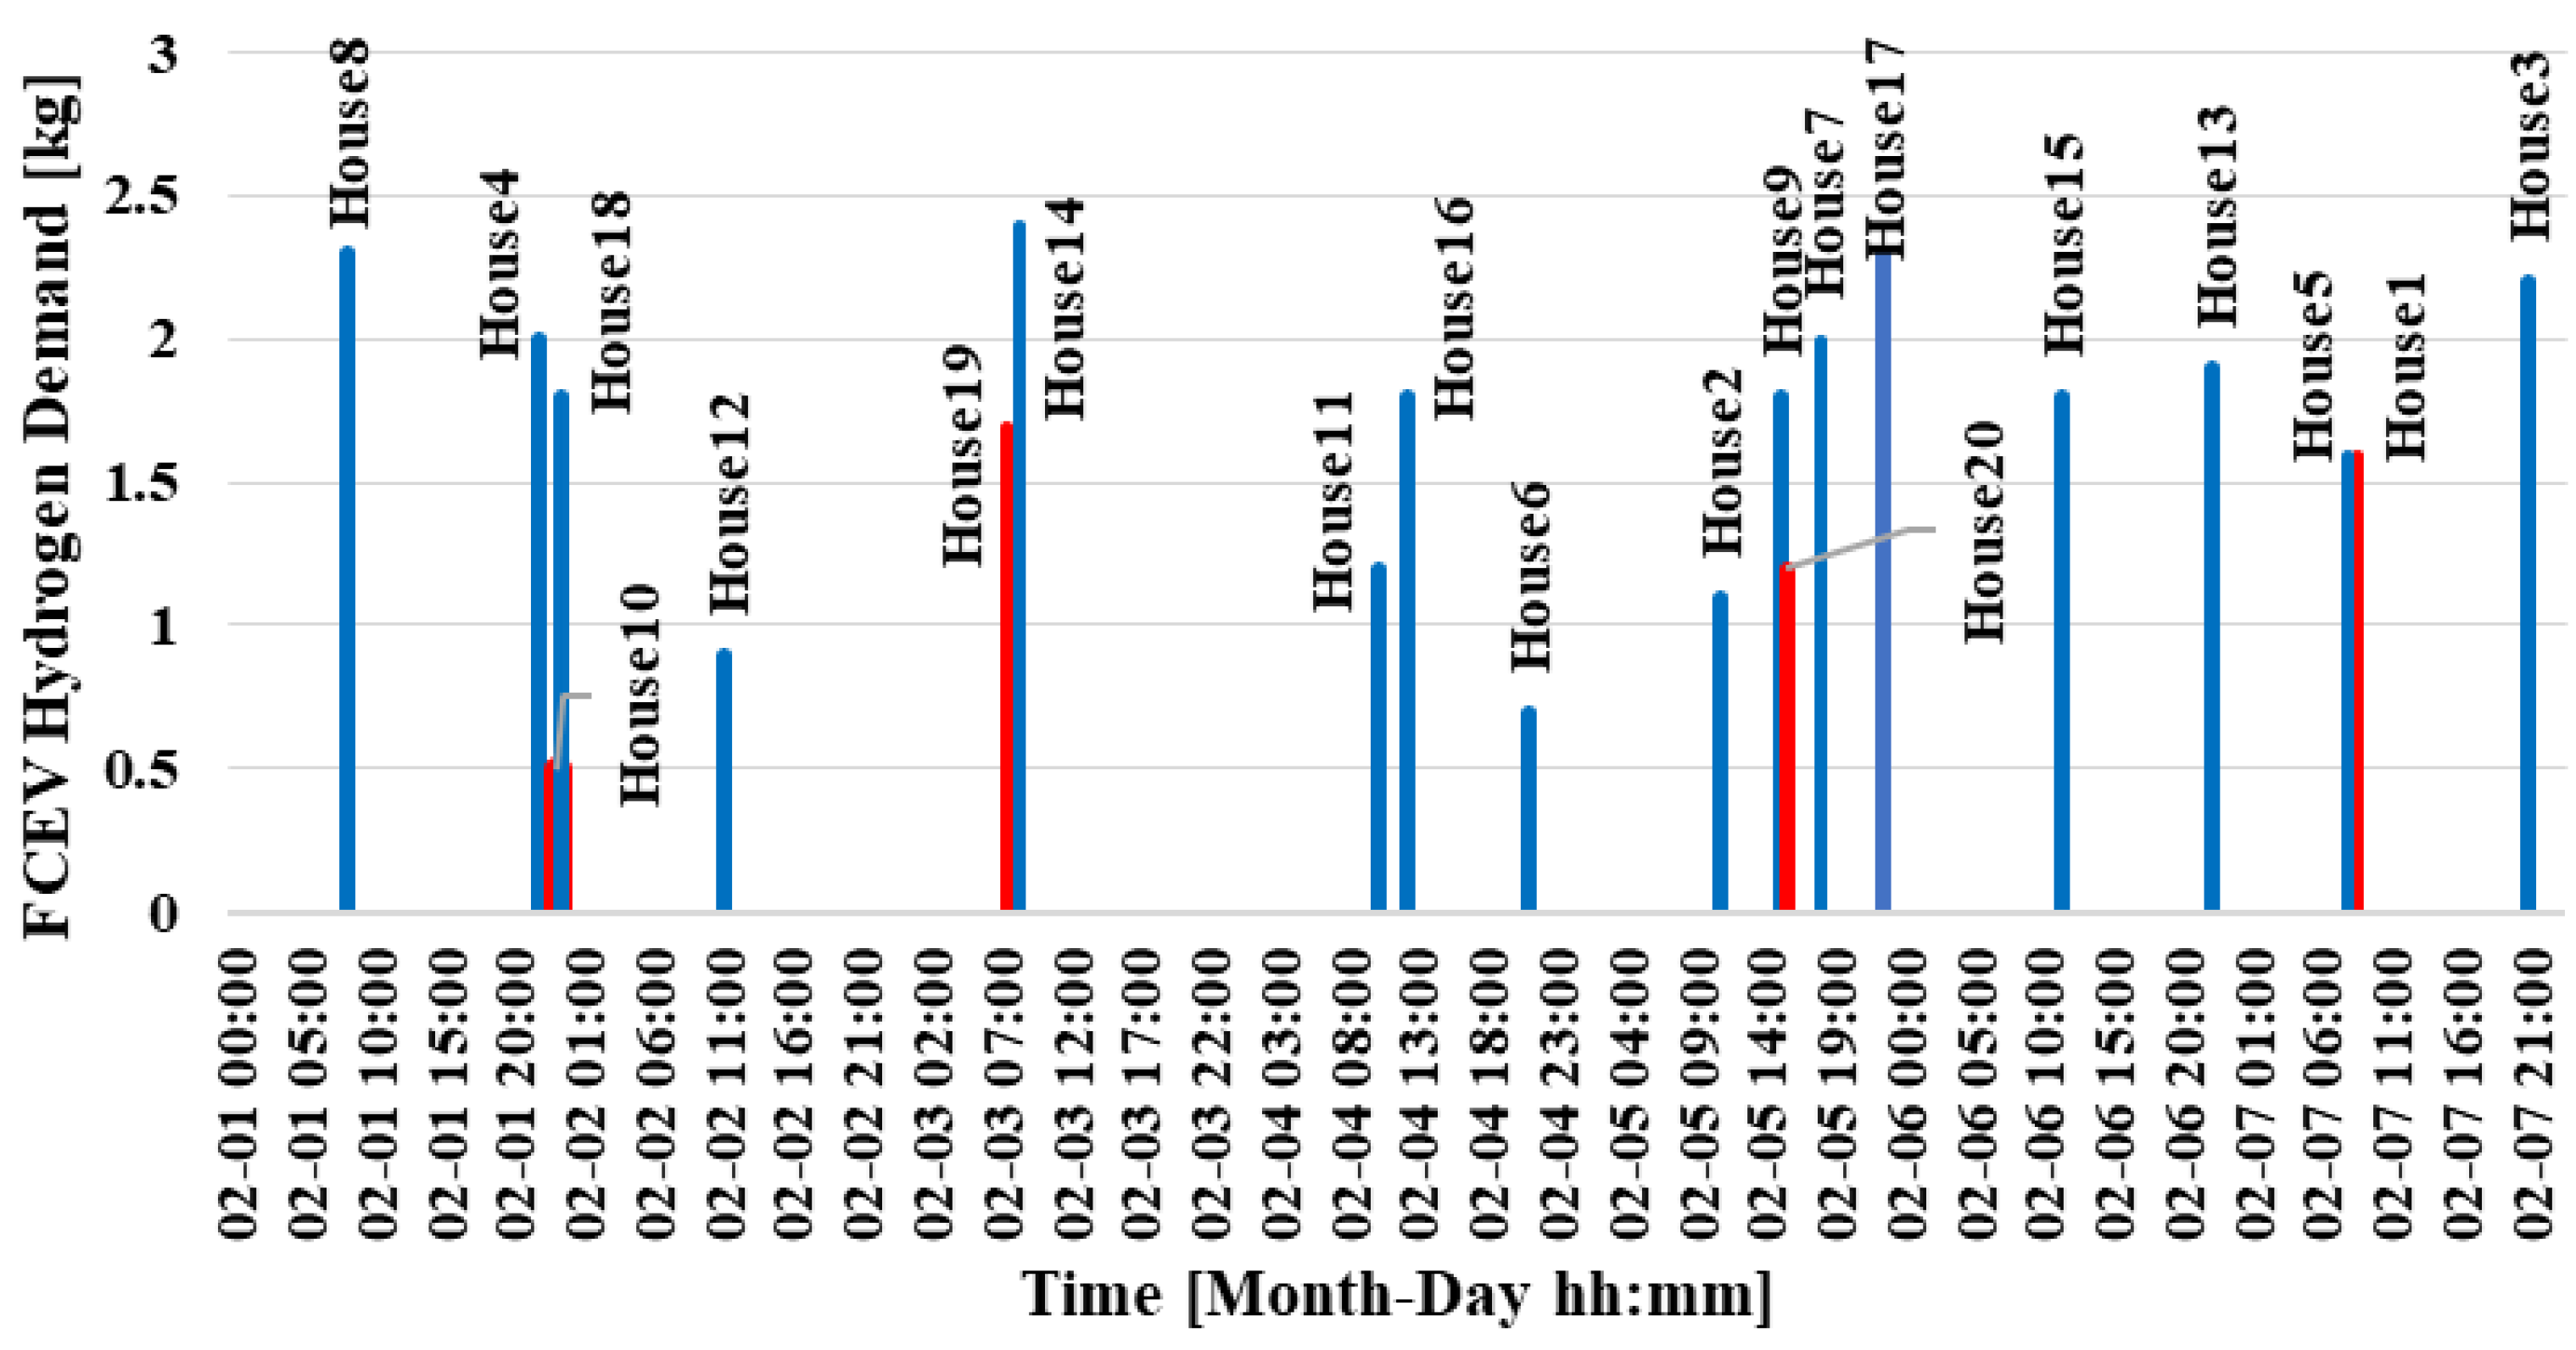
Figure 4 illustrates the hydrogen demands of FCEVs used by residents within the residential area. The variability in hydrogen consumption reflects differences in household vehicle ownership and usage frequency. Figure 5 presents the hydrogen demand of the houses for domestic heating and cooking purposes, specifically covering the usage of boilers and cooking hobs. The demand values were based on standard thermal energy requirements for space heating, water heating, and daily cooking activities. The corresponding data were obtained by converting the electrical load derived from Reference [38] into hydrogen demand.
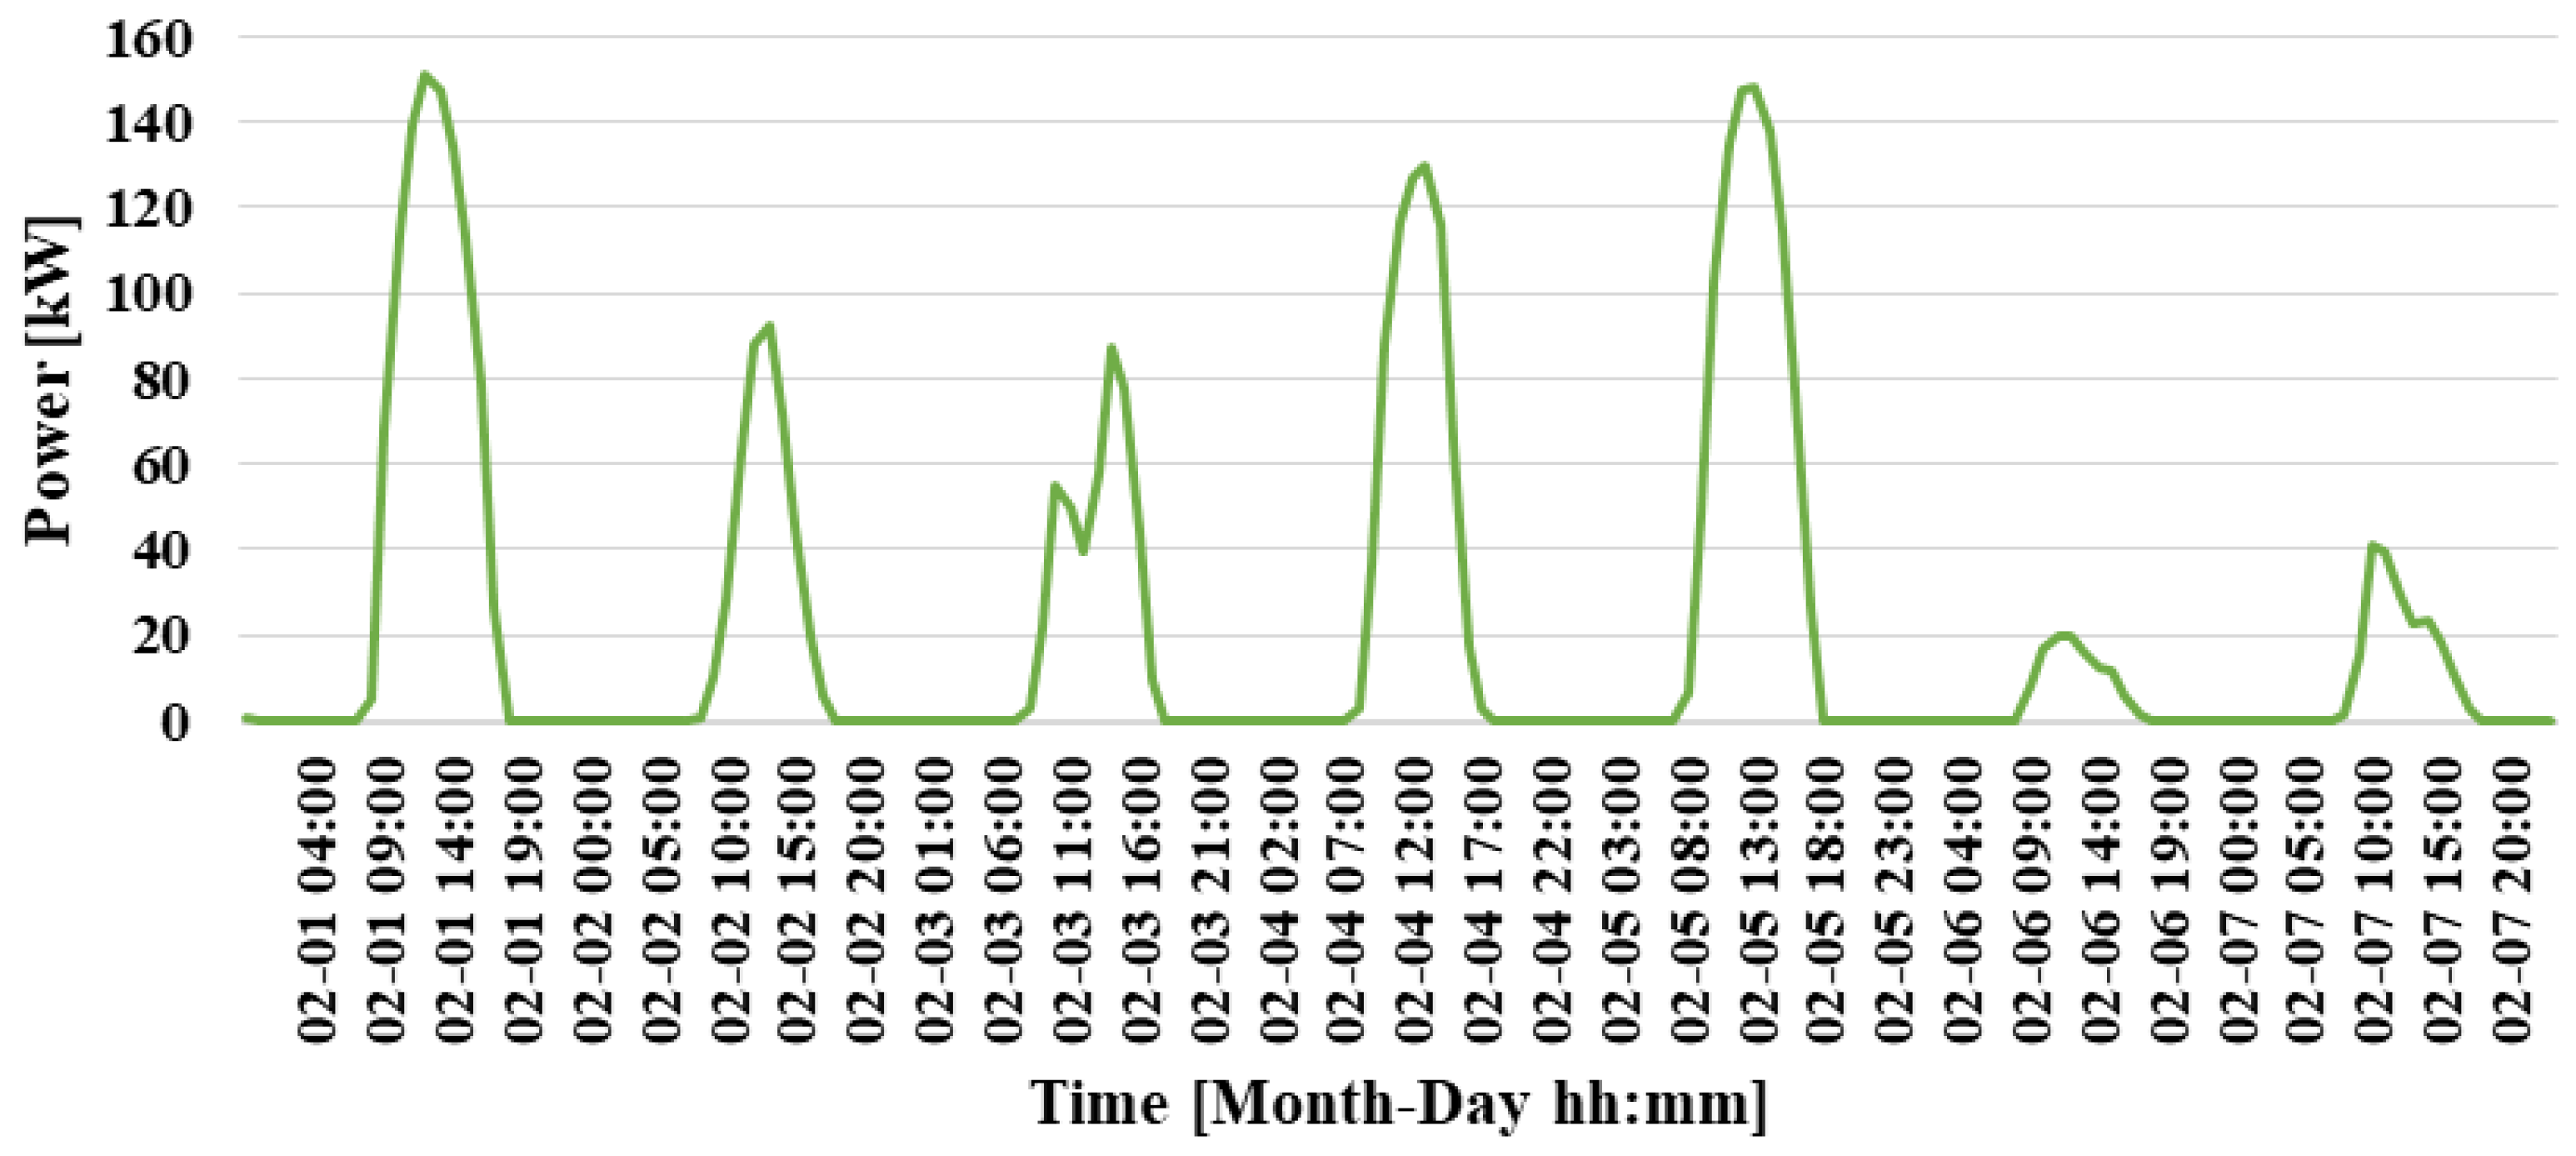
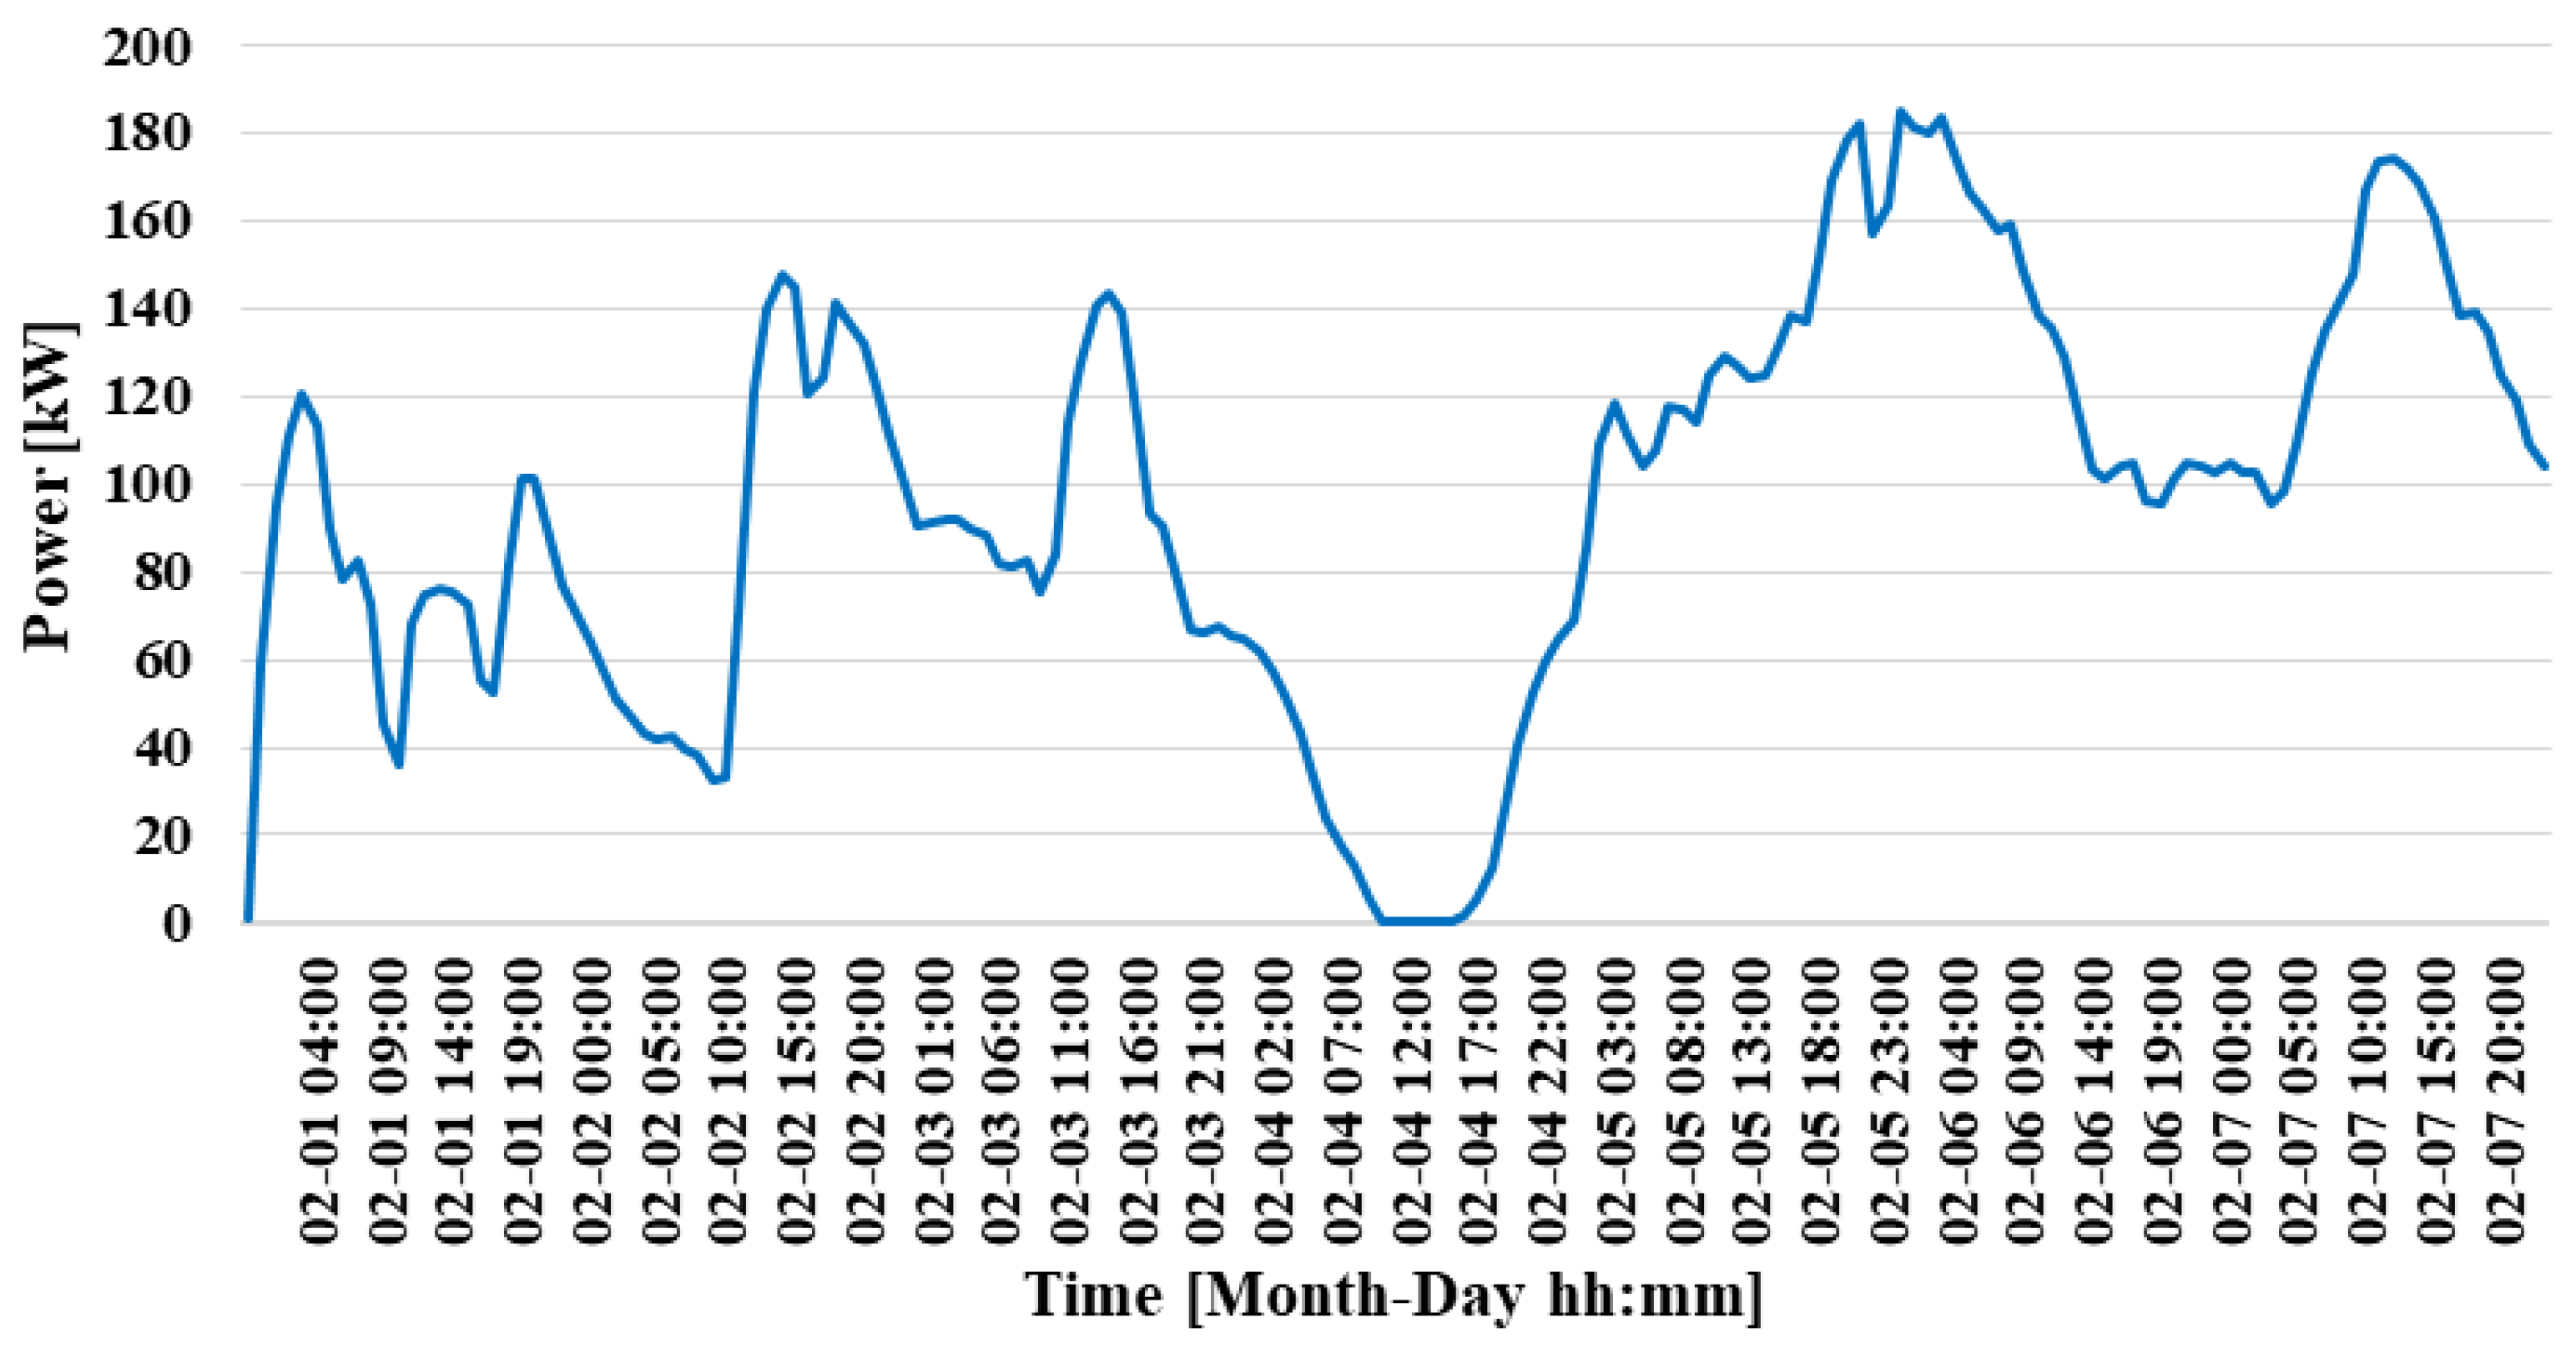
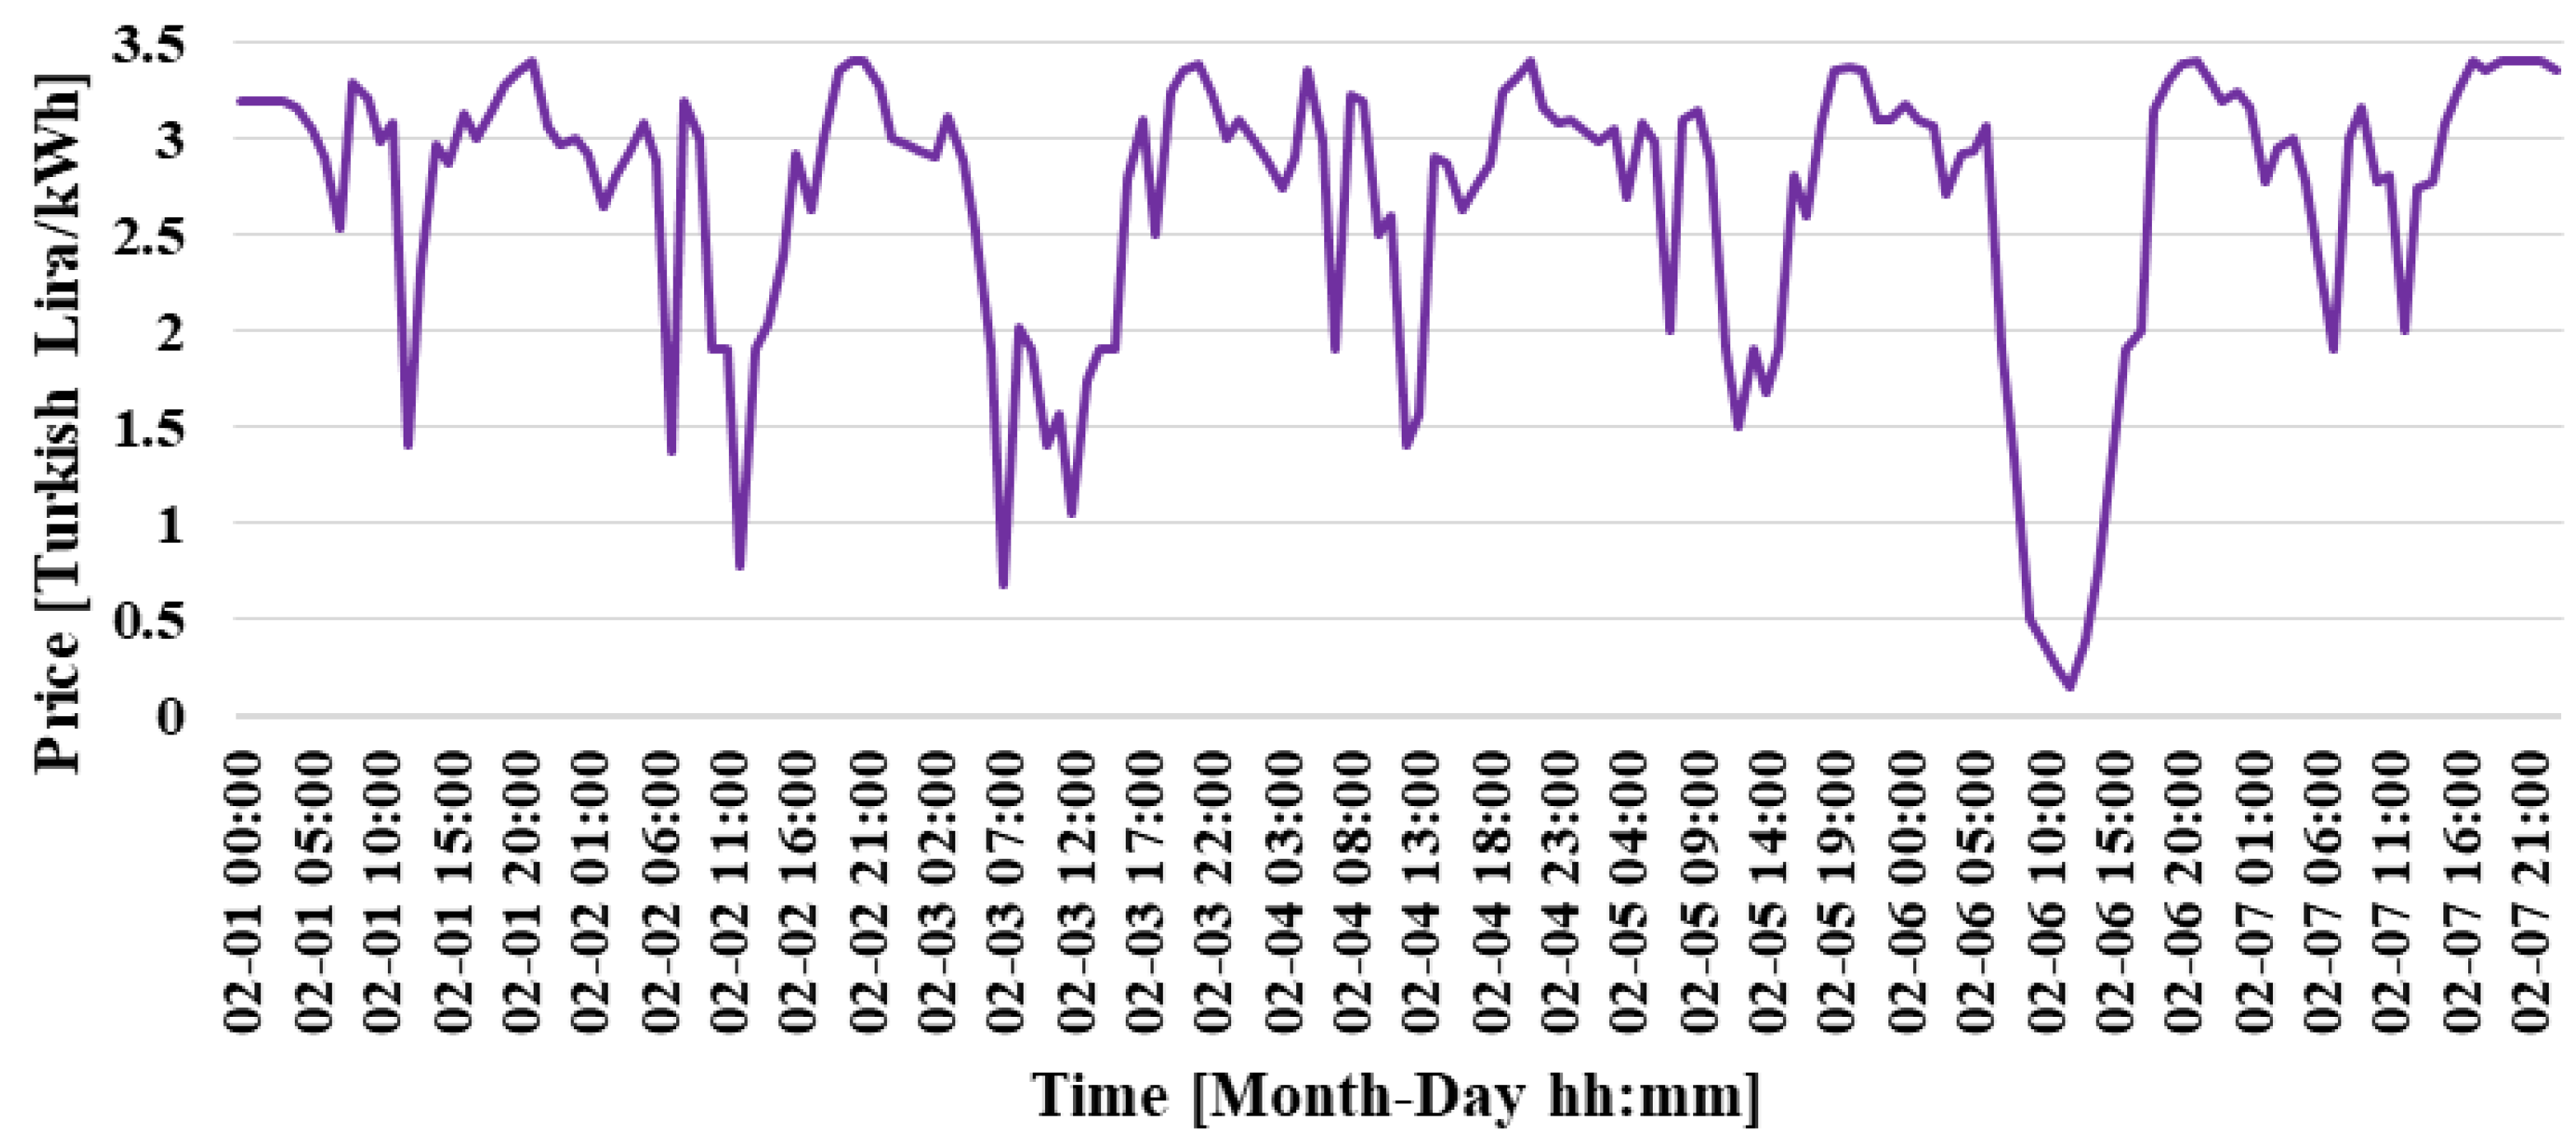
A one-week operation period between 1 February and 7 February was considered for the residential area. The residential area is powered by an integrated RES consisting of a PV system and a WT unit, which together serve as the primary sources of electricity for meeting the local energy demand. The power generation data for both renewable sources were generated using the dataset provided in reference [39]. The power output of the 200 kW PV system for the specified period is illustrated in Figure 6, while the corresponding wind power generation is presented in Figure 7. In addition, the residential area is enabled to perform energy trading with the power grid via the Türkiye day-ahead electricity market [40]. Accordingly, the day-ahead market prices corresponding to the selected period (1–7 February 2025) were employed in the analysis, as depicted in Figure 8.
The hydrogen tank has a maximum storage capacity of 50 kg and a minimum allowable level of 30 kg. The final hydrogen level at the end of the operation was also set to 50 kg. The EL has a rated power of 300 kW, and it operates with an efficiency of 75%. The ESS has both charging and discharging power capacities of 100 kW. The minimum allowable state of charge for the ESS was set to 10% of its total capacity. The ESS was assumed to be fully charged, with 100 kWh of energy, at both the initial and final time periods. The time step used in the test studies was 1 h.
The data related to the conducted test studies are presented in Table 1. A total of 20 cases were considered in the study. Since the technical specifications of PV, WT, and ESS structures used in the residential area were predetermined, the PV capacity, WT capacity, and ESS capacity values were kept constant from Case 1 to Case 16.
The use of different minimum fairness ratio values enabled the analysis to capture not only the technical but also the social dimension of energy sharing within the residential area. Defining a distinct lower bound for each scenario revealed that fairness is not a uniform concept, but rather one that can be flexibly applied under varying conditions. As a result, the model produced more realistic outcomes in terms of both system efficiency and user satisfaction. This diversity also strengthens the adaptability of the proposed approach to different policy and operational contexts. From Case 1 to Case 16, every four cases were constructed under a specific minimum fairness ratio, with varying fairness index types applied to create comprehensive case studies. In this way, the study aimed to analyze the performance of each fairness index type under different minimum fairness ratio values, as well as the effect of each minimum fairness ratio across different fairness index types.
The fair distribution of total green energy usage is considered the most significant type of fairness, since this approach simultaneously promotes environmental sustainability and social satisfaction within the residential area. It ensures the reduction in carbon emissions while guaranteeing equal access to green energy among users. Moreover, this approach offers a vision more consistent with long-term energy policies and sustainability-oriented strategies. In this context, TGESR was adopted as the fairness index type from Case 16 to Case 20. In Cases 16 and 17, the same fairness index type, minimum fairness ratio, and ESS capacity values were maintained, while different renewable energy capacities were defined to examine the impact of renewable energy capacity. In Cases 16 and 18, the same fairness index type, minimum fairness ratio, and renewable energy capacities were applied, but different ESS capacity values were used to assess the impact of ESS. Finally, in Cases 19 and 20, high minimum fairness ratio values, PV capacity, WT capacity, and ESS capacity were applied under the TGESR fairness index type to evaluate their combined effects.

3.2. Test Results

The test results of the case studies presented in Table 1 are summarized in Table 2. Although different fairness index types were defined in Case 1, Case 2, Case 3, and Case 4, the minimum fairness ratio was 0%. Therefore, the outcomes in terms of cost, grid power consumption, and carbon emissions were identical. The first conclusion that can be drawn is that when fairness constraints are set to zero, the system operates solely through economic optimization. The fact that the fairness type does not produce any difference here demonstrates that when constraints are not activated, this parameter does not affect system behavior. The carbon emission values for each case study were obtained from [41] based on the electrical energy consumed from the power grid. Carbon emission values were calculated based on the electrical energy consumed from the power grid; therefore, electricity exported to the grid was not considered as an emission credit.
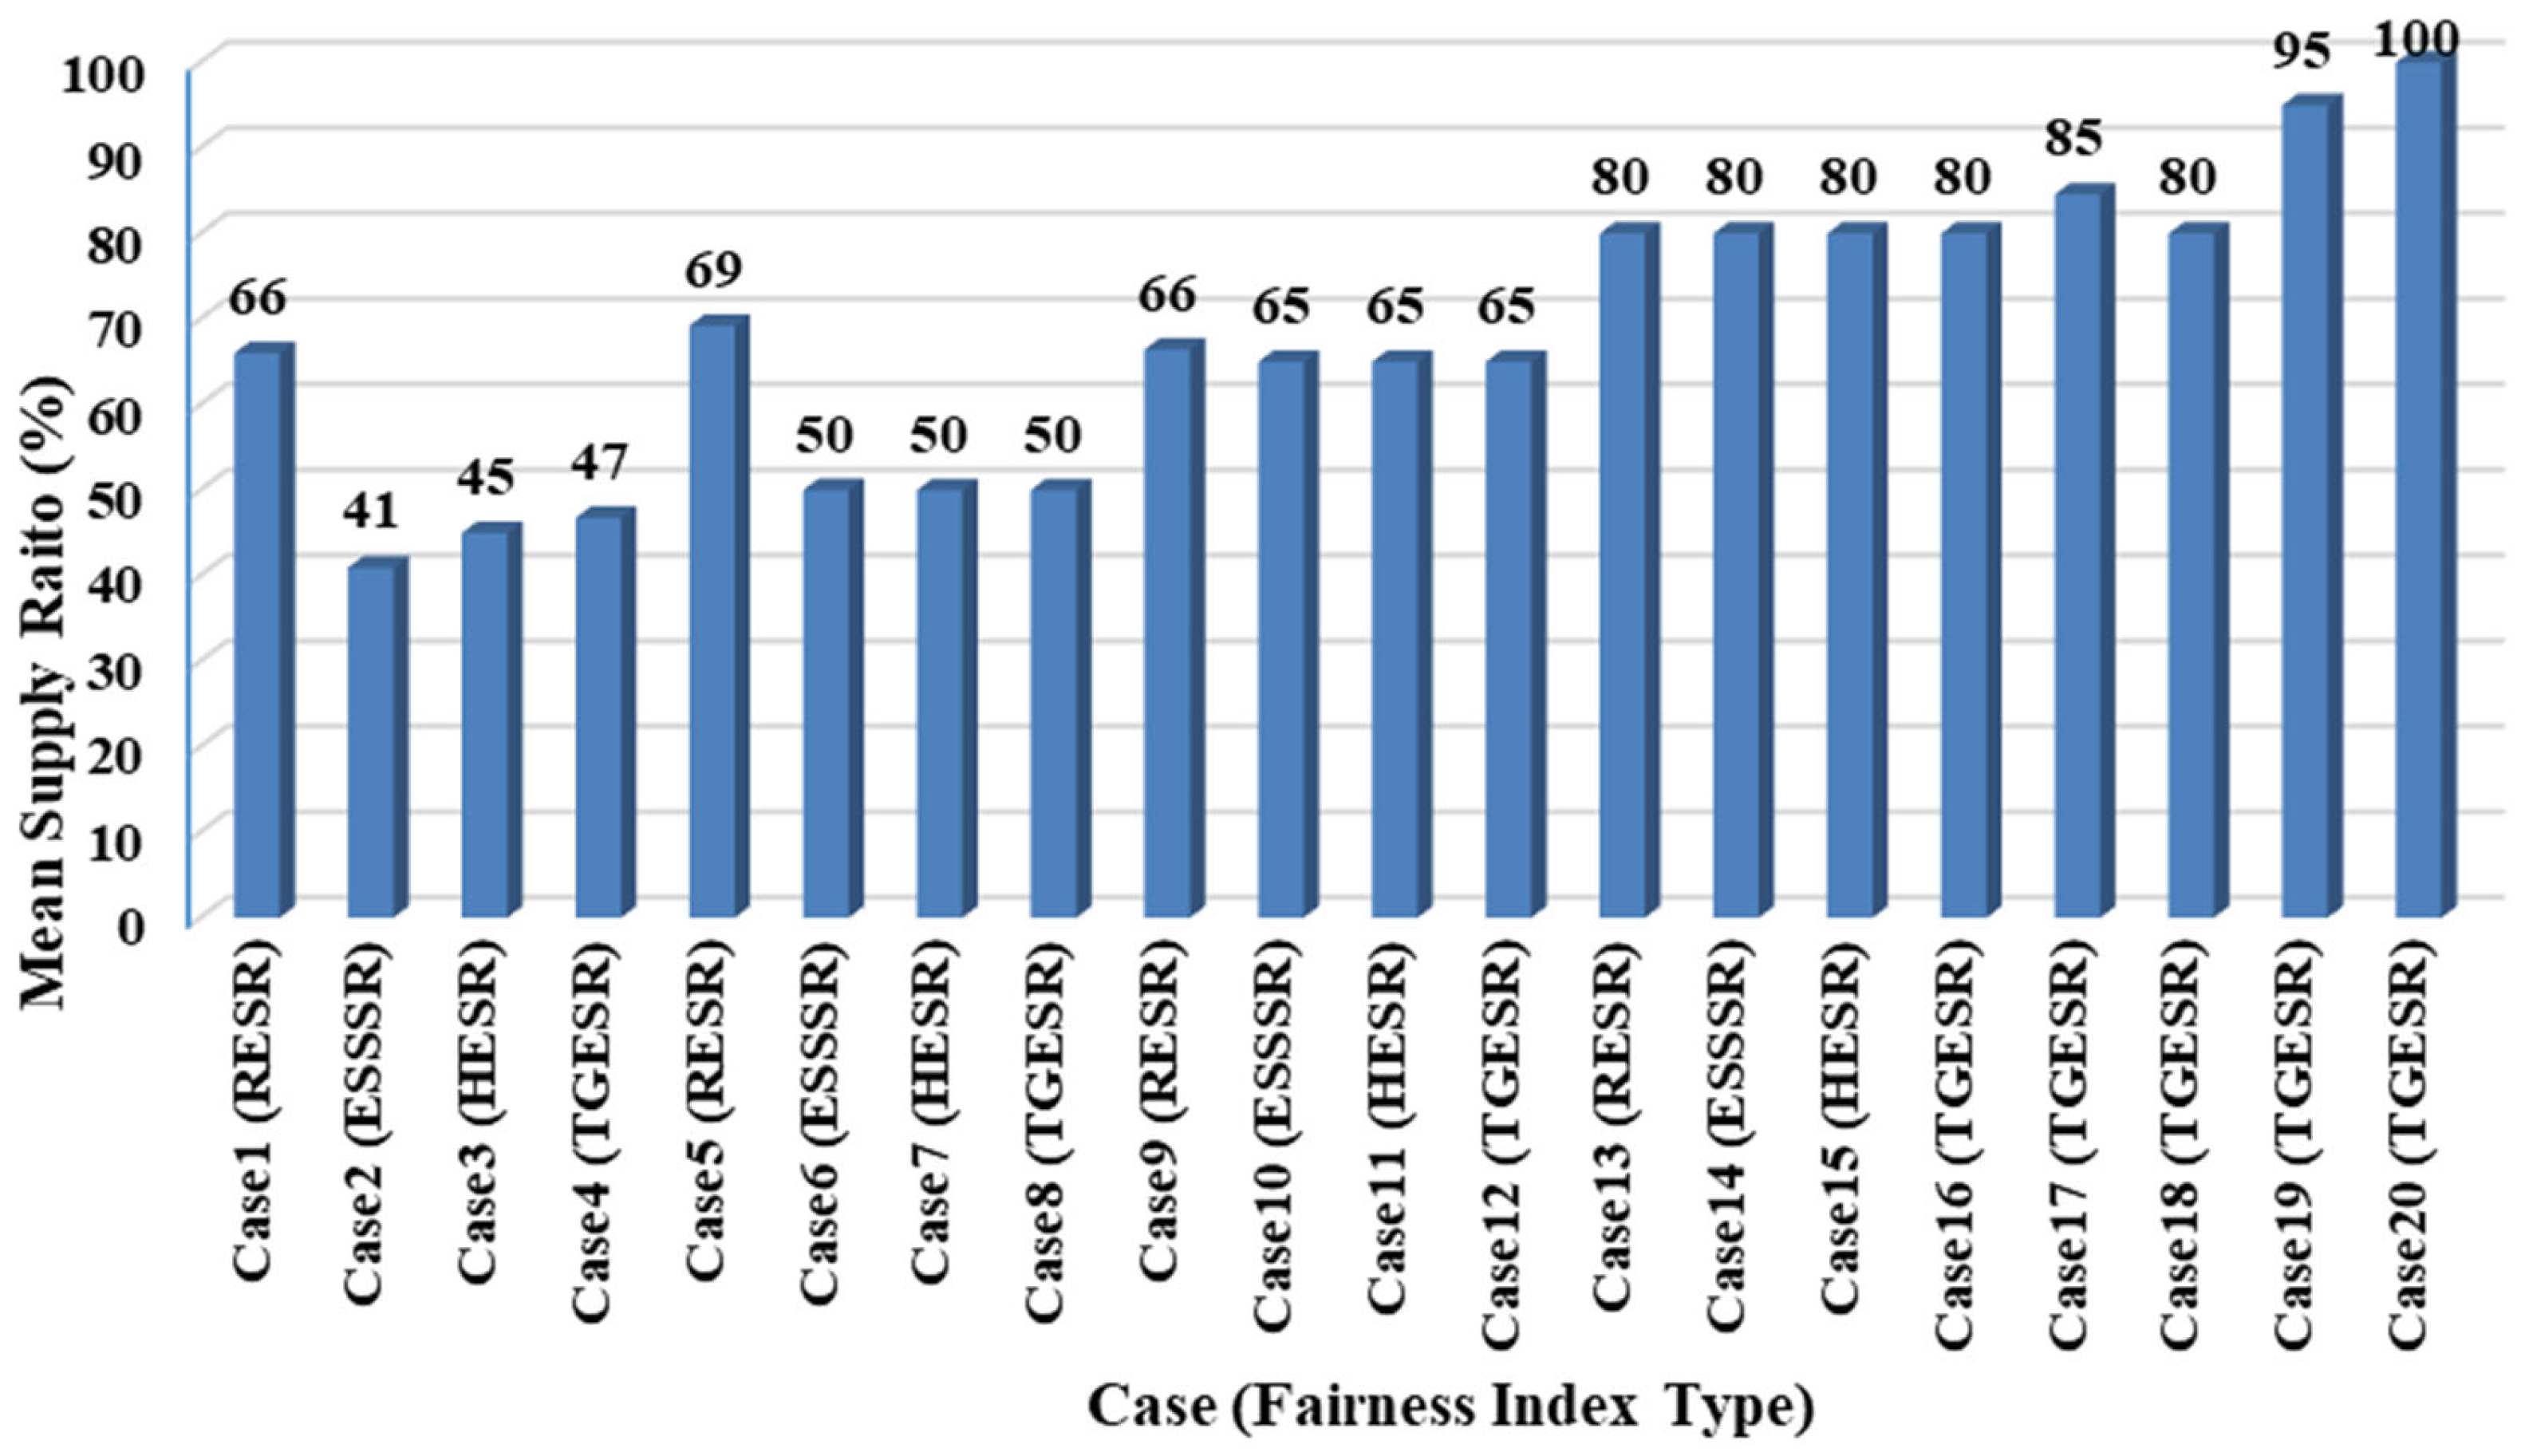
When the minimum fairness ratio increased to 50%, certain differences began to appear. Under the RESR index type, although the minimum fairness ratio in Case 1 was 0%, the achieved result, as shown in Figure 8, was 66%. Similarly, in Case 5, the minimum fairness ratio was set at 50%, while the achieved result was 69%. Since the minimum fairness ratios in Case 1 and Case 5 were very close, no differences in cost, grid power consumption, or carbon emissions were observed. However, other cases revealed notable variations. For example, when comparing Case 2 and Case 6, cost increased by 5.32 Turkish Liras in Case 6, while grid power consumption decreased by 12.05 kW. In the comparison of Case 3 and Case 7, cost increased by 16.24 Turkish Liras in Case 7, while grid power consumption decreased sharply by 839.89 kW, which reduced the carbon emissions to 6.2 metric tons. A comparison of Case 4 and Case 8 showed that while cost remained unchanged, grid power consumption decreased by 171.94 kW in Case 8. One of the most significant findings from the transition of the minimum fairness ratio from 0% to 50% was observed between Case 3 and Case 7: a relatively small increase in cost led to a substantial decrease in grid power consumption. Since both cases shared the HESR fairness index type, it is evident that the fair allocation of hydrogen energy considerably reduces grid dependency.
When the minimum fairness ratio increased from 50% to 65%, similar patterns emerged. For example, in Cases 5 and 9, both under the RESR index type, the achieved mean supply ratios were 69% and 66%, respectively, as illustrated in Figure 8. This slight difference resulted in no observable change in cost, grid power consumption, or carbon emissions. Comparing Case 6 and Case 10 showed that cost increased by 25.37 Turkish Liras in Case 10, while grid power consumption decreased by 27.78 kW. Between Case 7 and Case 11, a significant cost increase of 807.38 Turkish Liras, corresponding to 9.54%, was recorded in Case 11, but this was accompanied by a substantial reduction of 2122.72 kW in grid power consumption, lowering carbon emissions to 5.4 metric tons. This 13.37% decrease in grid dependency once again highlights the flexibility of the HESR index type and its impact on reducing reliance on the power grid. Comparing Case 8 and Case 12 revealed that while cost increased by 646.16 Turkish Liras in Case 12, grid power consumption decreased significantly by 2639.55 kW, representing a 15.96% reduction. In terms of grid dependency, the most notable improvement during the transition from 50% to 65% minimum fairness ratio was achieved under the TGESR fairness index type.
When the minimum fairness ratio increased from 65% to 80%, Cases 9 and 13, both under the RESR index type, showed identical values for cost, grid power consumption, and carbon emissions. Comparing Case 10 and Case 14 indicates that cost increased by 122.99 Turkish Liras in Case 14, while grid power consumption decreased by 158.97 kW. Between Case 11 and Case 15, cost rose by 2821.41 Turkish Liras, while grid power consumption decreased by 2320.32 kW, reducing carbon emissions from 5.4 to 4.5 metric tons. Likewise, when comparing Case 12 and Case 16, cost increased by 2811.52 Turkish Liras, while grid power consumption decreased by 2579.56 kW.
By grouping all cases between Case 1 and Case 16 in successive sets of four, the influence of fairness index types on the system can be more clearly explained. In Cases 1–4, identical values for cost, grid power consumption, and carbon emissions were obtained. In Cases 5–8, the lowest cost was observed in Cases 5 and 8, while the lowest grid power consumption and carbon emissions were achieved in Case 7 with a significant margin compared to the others. In Cases 9–12, the lowest cost occurred in Case 9, while the lowest grid power consumption and carbon emissions were recorded in Case 11. For Cases 13–16, the lowest cost was found in Case 13, while the lowest grid power consumption and carbon emissions were observed in Case 16. In summary, when the minimum fairness ratio was 50%, the lowest cost was achieved under the RESR and TGESR fairness index types, while the lowest grid power consumption and carbon emissions occurred under HESR. At a 65% minimum fairness ratio, the lowest cost was observed under RESR, and the lowest grid power consumption and carbon emissions again under HESR. Finally, with an 80% minimum fairness ratio, the lowest cost was obtained under RESR, while the lowest grid power consumption and carbon emissions were recorded under TGESR.
In Case 17, renewable energy capacity was increased to 2.5 times that of Case 16, resulting in a cost reduction of 81,253.16 Turkish Liras, thereby generating a profit of 70,107.39 Turkish Liras. At the same time, grid power consumption decreased by 5512.19 kW, reflecting a 48.68% reduction, which lowered carbon emissions from 4.5 to 2.3 metric tons. In Case 18, ESS capacity was increased to 2.5 times that of Case 16, leading to a cost reduction of 2174.22 Turkish Liras, representing a 19.51% decrease. However, grid power consumption increased by 694.5 kW, indicating a 6.13% rise, which raised carbon emissions from 4.5 to 4.7 metric tons. Although there was a slight regression in terms of grid dependency, significant progress was observed regarding cost reduction.
Cases 19 and 20, both under the TGESR fairness index type, included higher minimum fairness ratio values compared to the other cases. The results for both were highly favorable. In Case 20, although the minimum fairness ratio was 5% higher than in Case 19, the renewable energy capacity was 25% greater, which led to a cost increase of 24,928.21 Turkish Liras, corresponding to 55.84%. Nevertheless, grid power consumption decreased by 1978.53 kW, reflecting a 43.83% reduction, which reduced carbon emissions from 1.8 to 1.0 metric tons. This outcome demonstrates that the positive effect of increased renewable energy capacity outweighed the higher minimum fairness ratio.
Each case included a specific minimum fairness ratio value, and the corresponding mean supply ratio results are presented in Figure 9. Although the minimum fairness ratio was defined as 0% for Case 1, Case 2, Case 3, and Case 4, the actual mean supply ratios achieved were 66%, 41%, 45%, and 47%, respectively. Among the cases with minimum fairness ratios of 0%, 50%, and 65%, those under the RESR fairness index type reached higher mean supply ratio values compared to the cases defined by other fairness index types. This indicates that electricity generated from RESs in the residential area can be allocated more equitably under RESR than under the other fairness index types. As the minimum fairness ratio increases, this difference diminishes. Once the minimum fairness ratio reaches 80% or higher, the actual mean supply ratios align exactly with the defined minimum values.
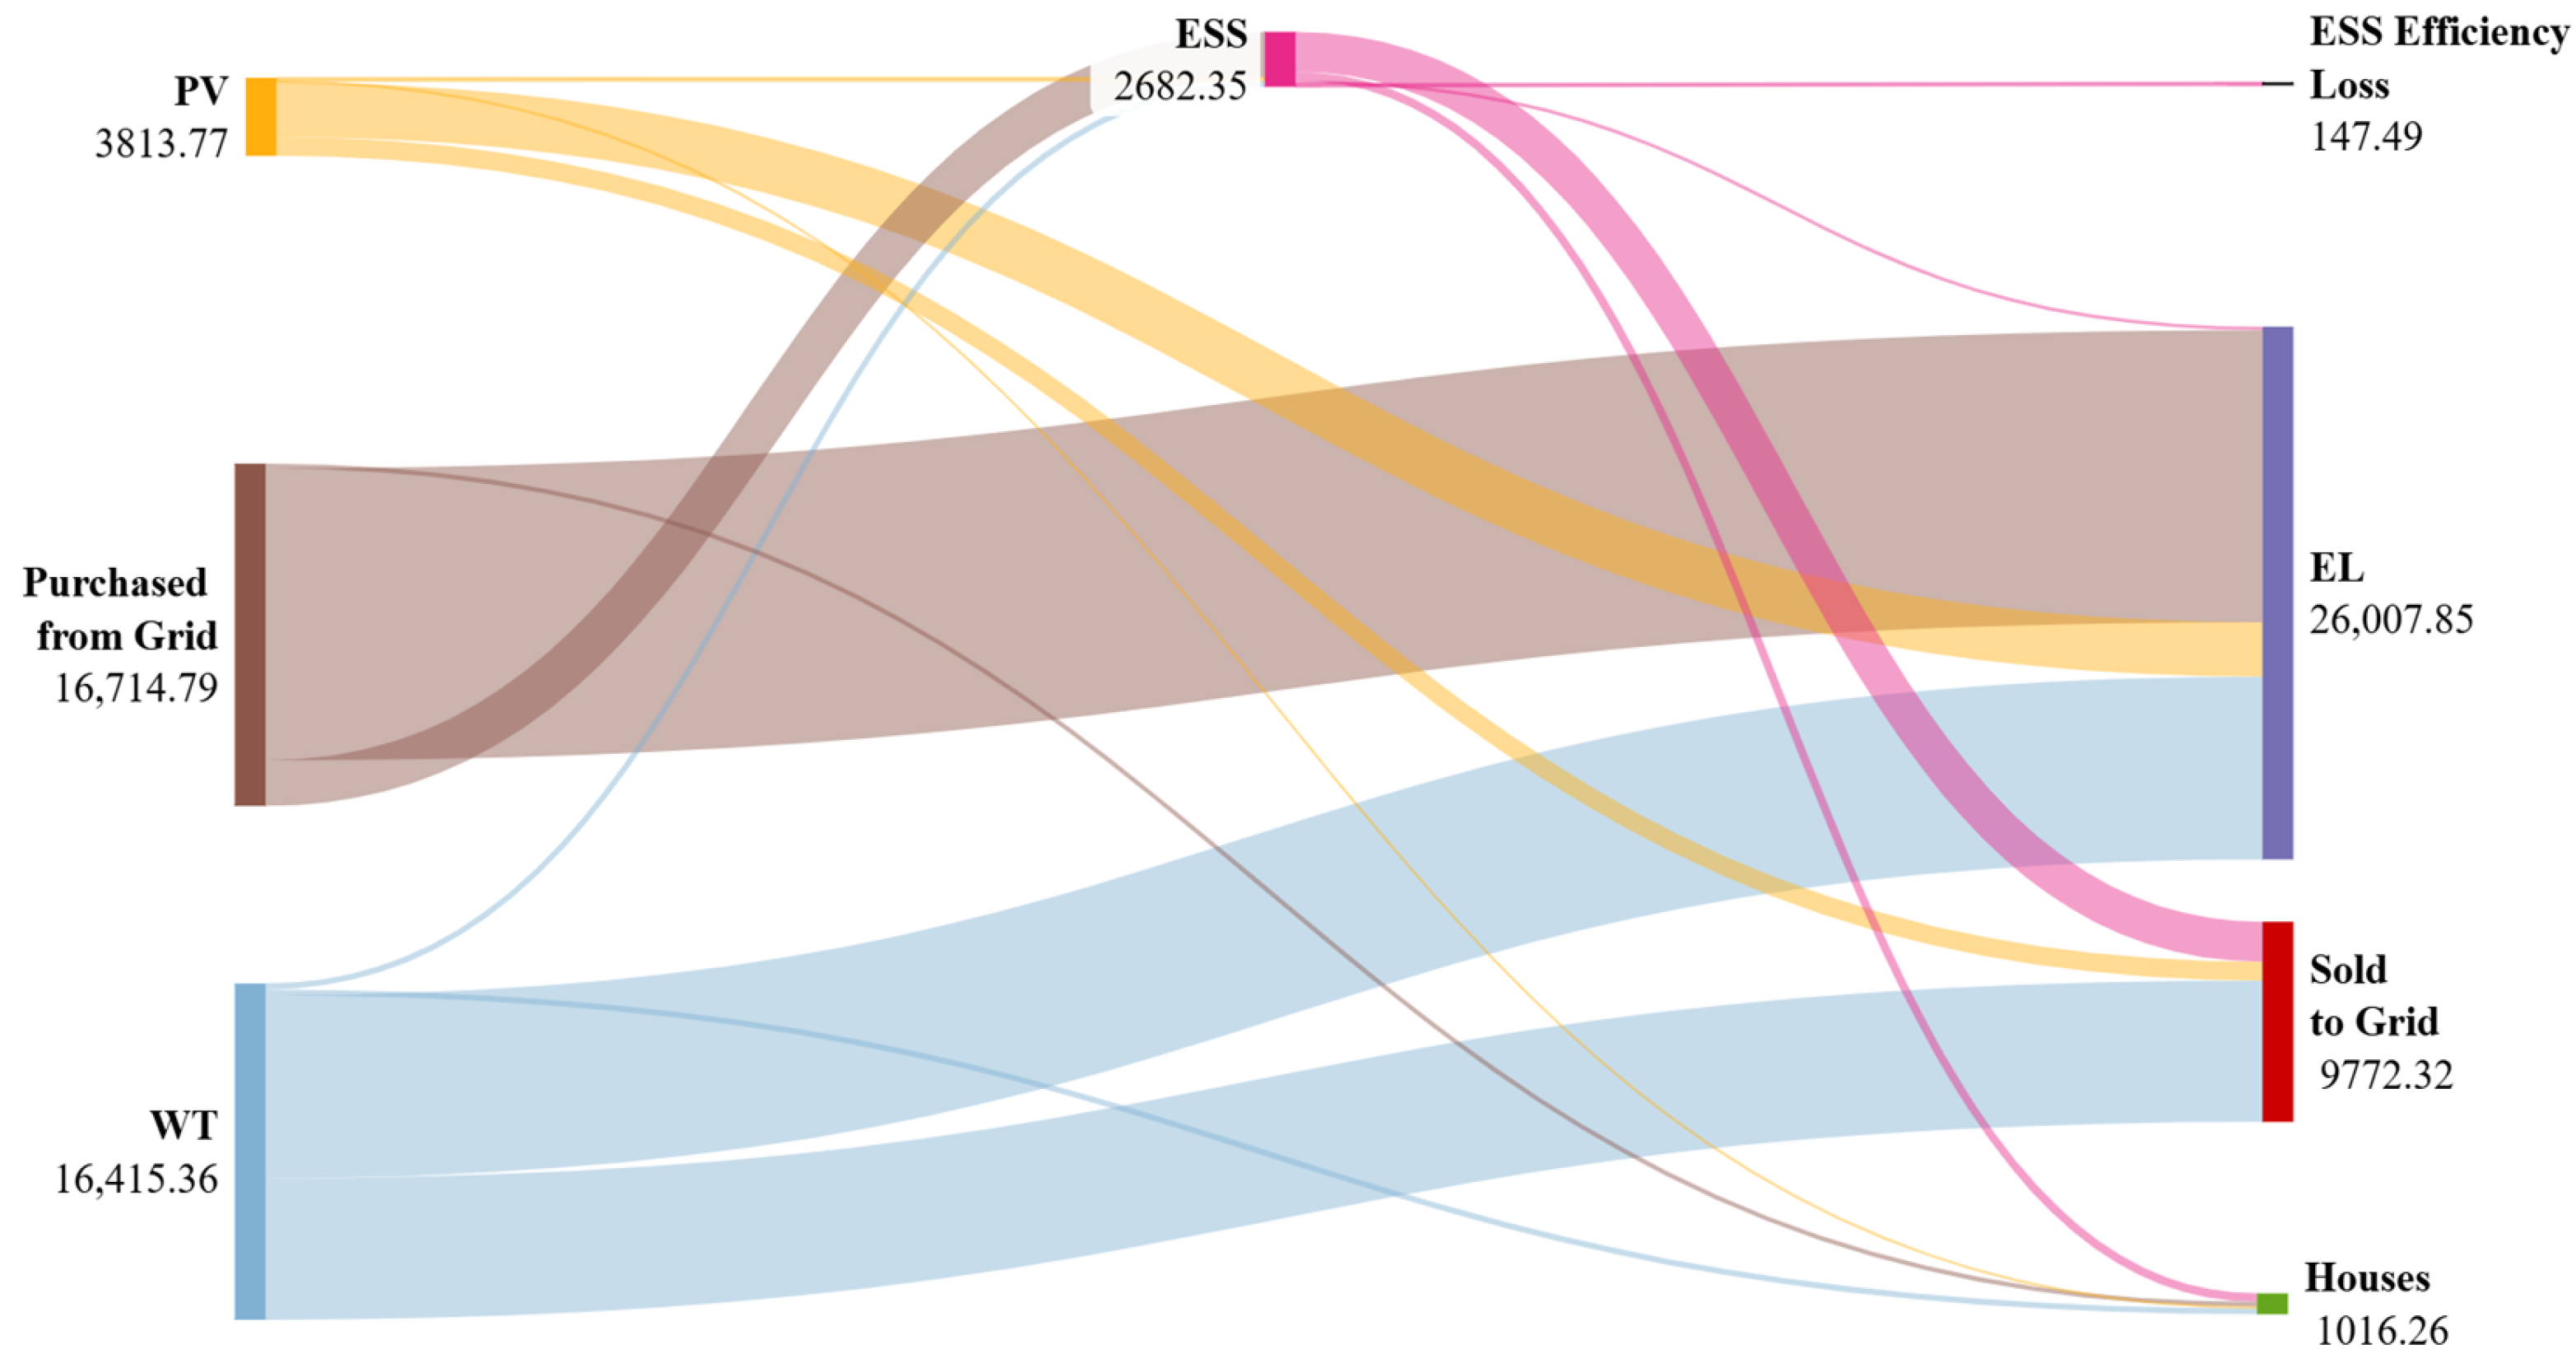
The power balance for Case 4 is presented in Figure 10. Of the total electricity supplied to the residential area, 44.43% was generated by WT and 10.32% by PV, while 45.24% was purchased from the power grid. A total of 7.26% of the supplied electricity was stored in the ESS. All generation units contributed to the electricity charged into the ESS, and all consumption units utilized the electricity discharged from the ESS. Regarding electricity consumption, 70.4% of the electricity supplied to the residential area was consumed by the EL, 2.75% by households, 26.45% was sold back to the grid, and 0.4% was lost due to ESS efficiency losses. In Case 4, although RESs played a significant role in supplying electricity to the residential area, the share of electricity purchased from the grid was also considerable. As a result, this case represents one of the scenarios with the highest carbon emissions.
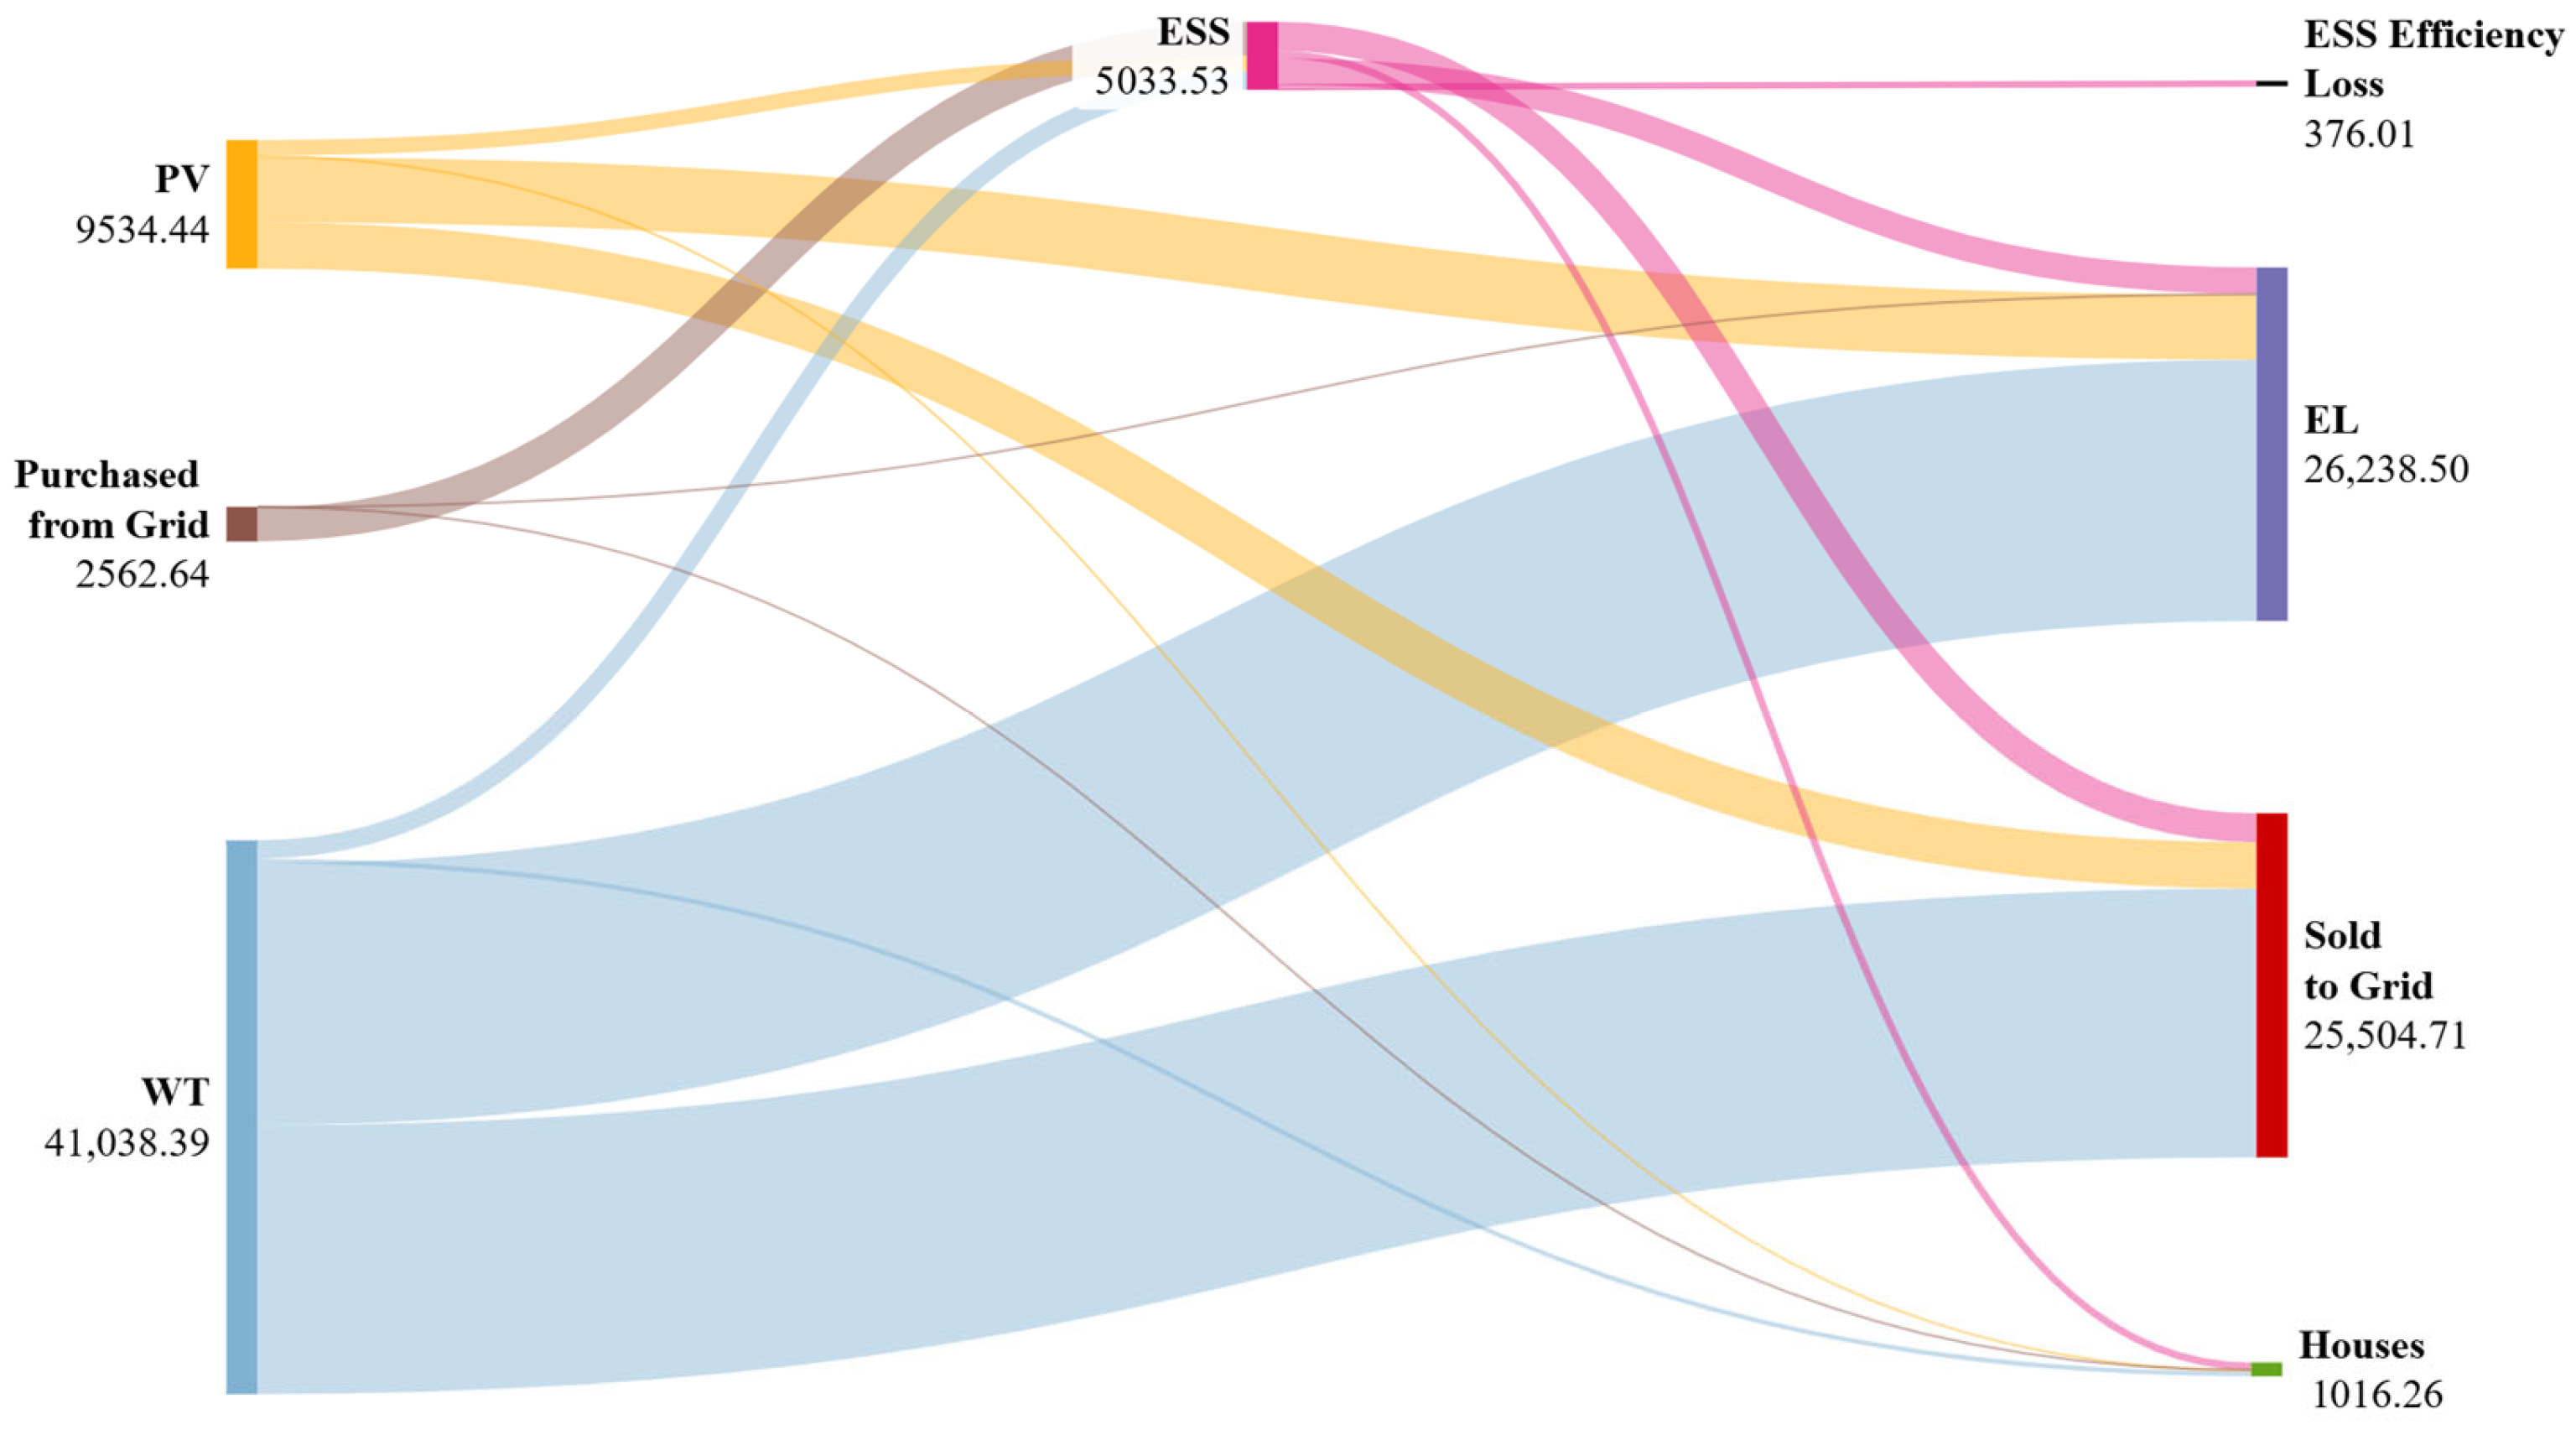
The power balance for Case 20 is presented in Figure 11. Of the total electricity supplied to the residential area, 77.23% was generated by WT and 17.94% by PV, while only 4.82% was purchased from the power grid. A total of 9.47% of the supplied electricity was stored in the ESS. All generation units contributed to the electricity charged into the ESS, and all consumption units utilized the electricity discharged from the ESS. Regarding electricity consumption, 49.38% of the electricity supplied to the residential area was consumed by the EL, 1.9% by households, 48% was sold back to the grid, and 0.7% was lost due to ESS efficiency losses.
In Case 20, grid dependency was drastically reduced, while electricity generation from RESs increased substantially. As a result, this case achieved the lowest carbon emissions among all scenarios. Furthermore, due to the large amount of electricity sold back to the grid, Case 20 represents the second most profitable scenario overall.
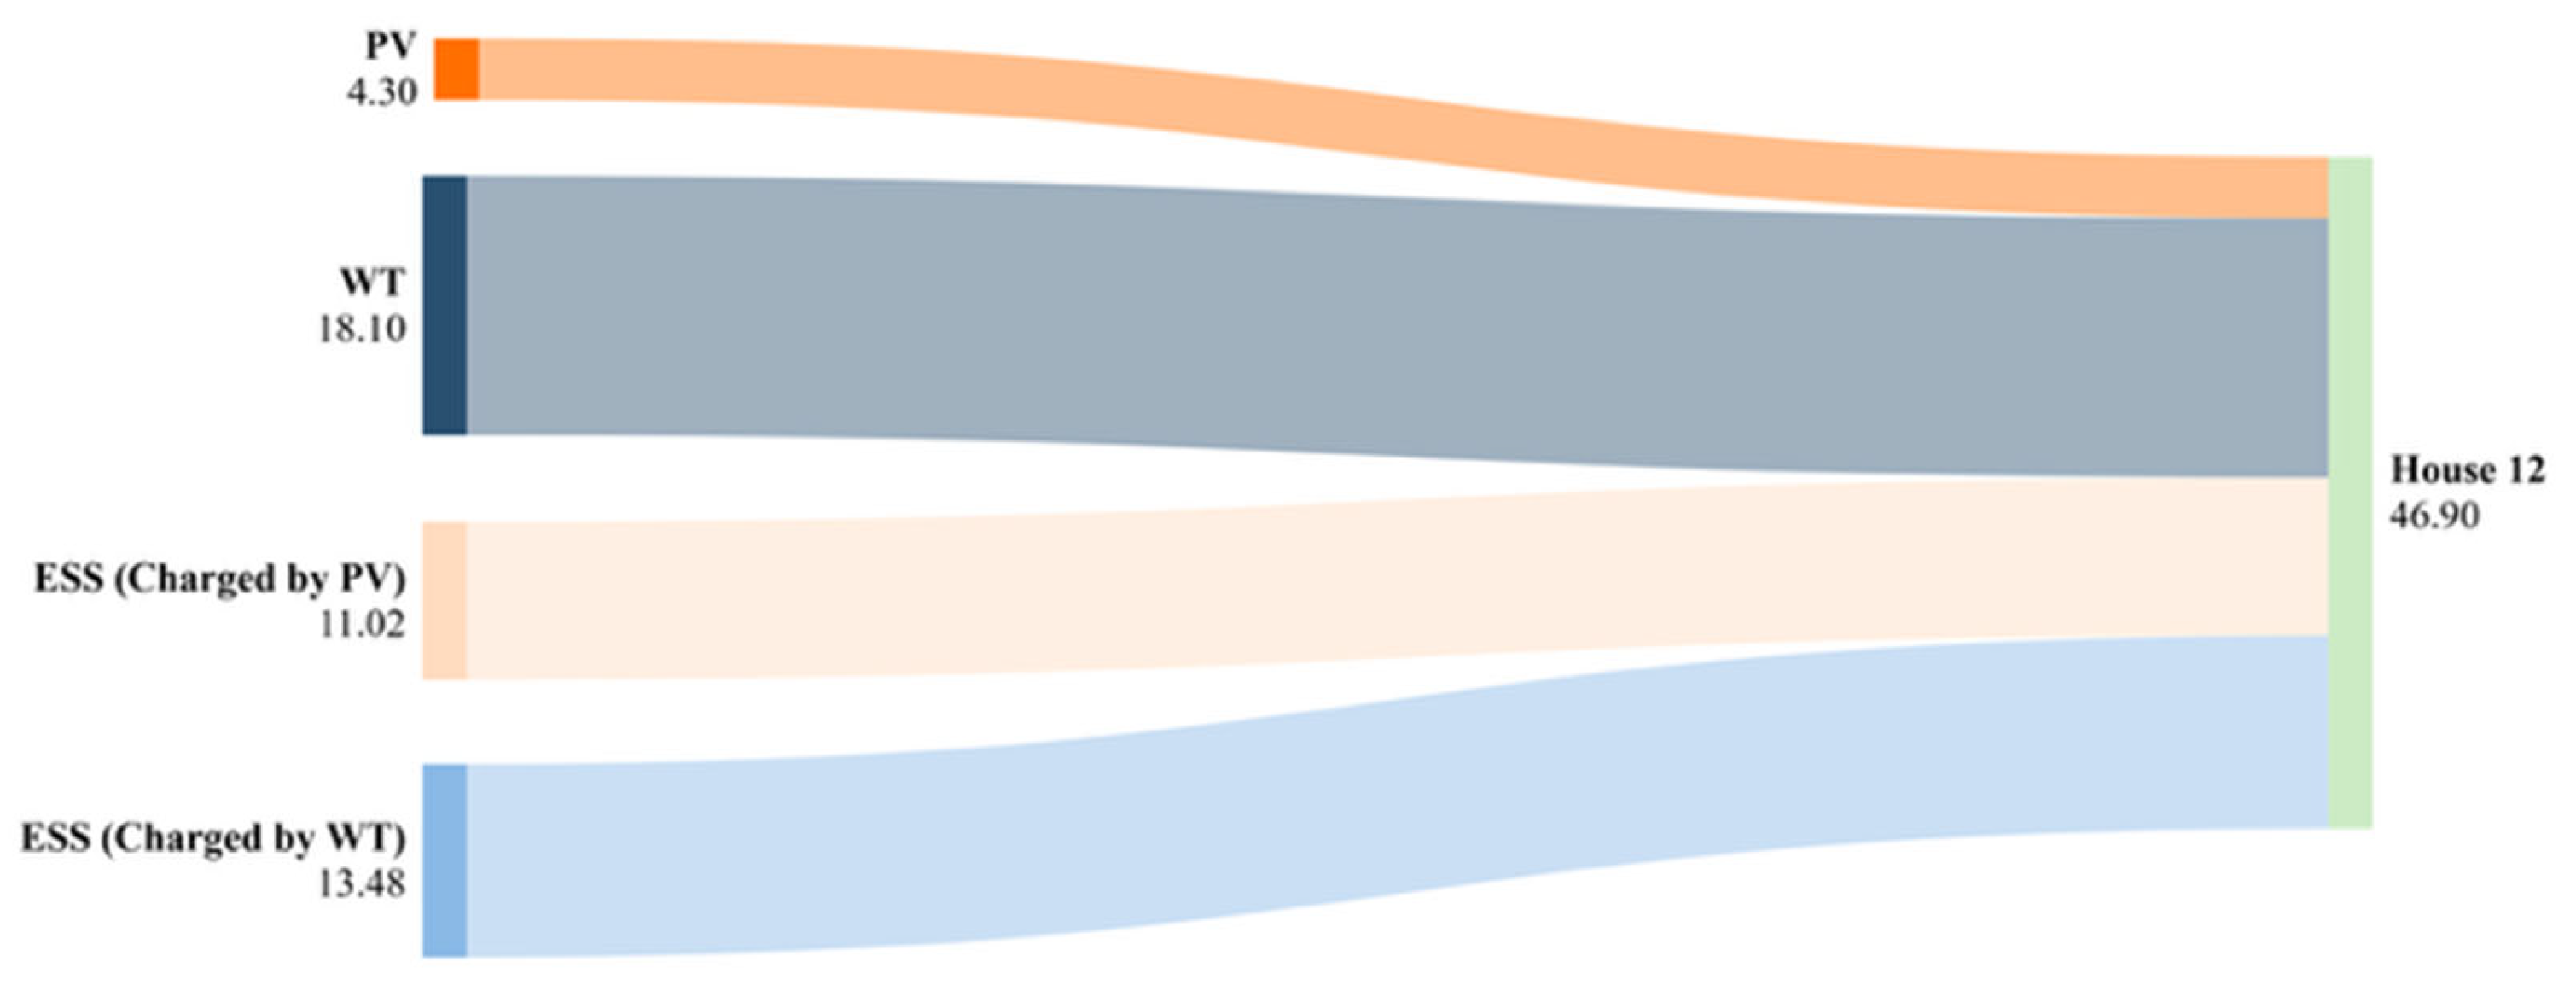
The power balance of House 12, a household with three residents within Case 20, is presented in Figure 12. Of the electricity consumed in House 12, 52.23% was supplied by the ESS, 38.6% by WT, and 9.17% by PV. Of the total electricity stored in the ESS, 55% originated from WT and 45% from PV. Grid dependency was completely eliminated, and the household relied exclusively on green energy consumption.
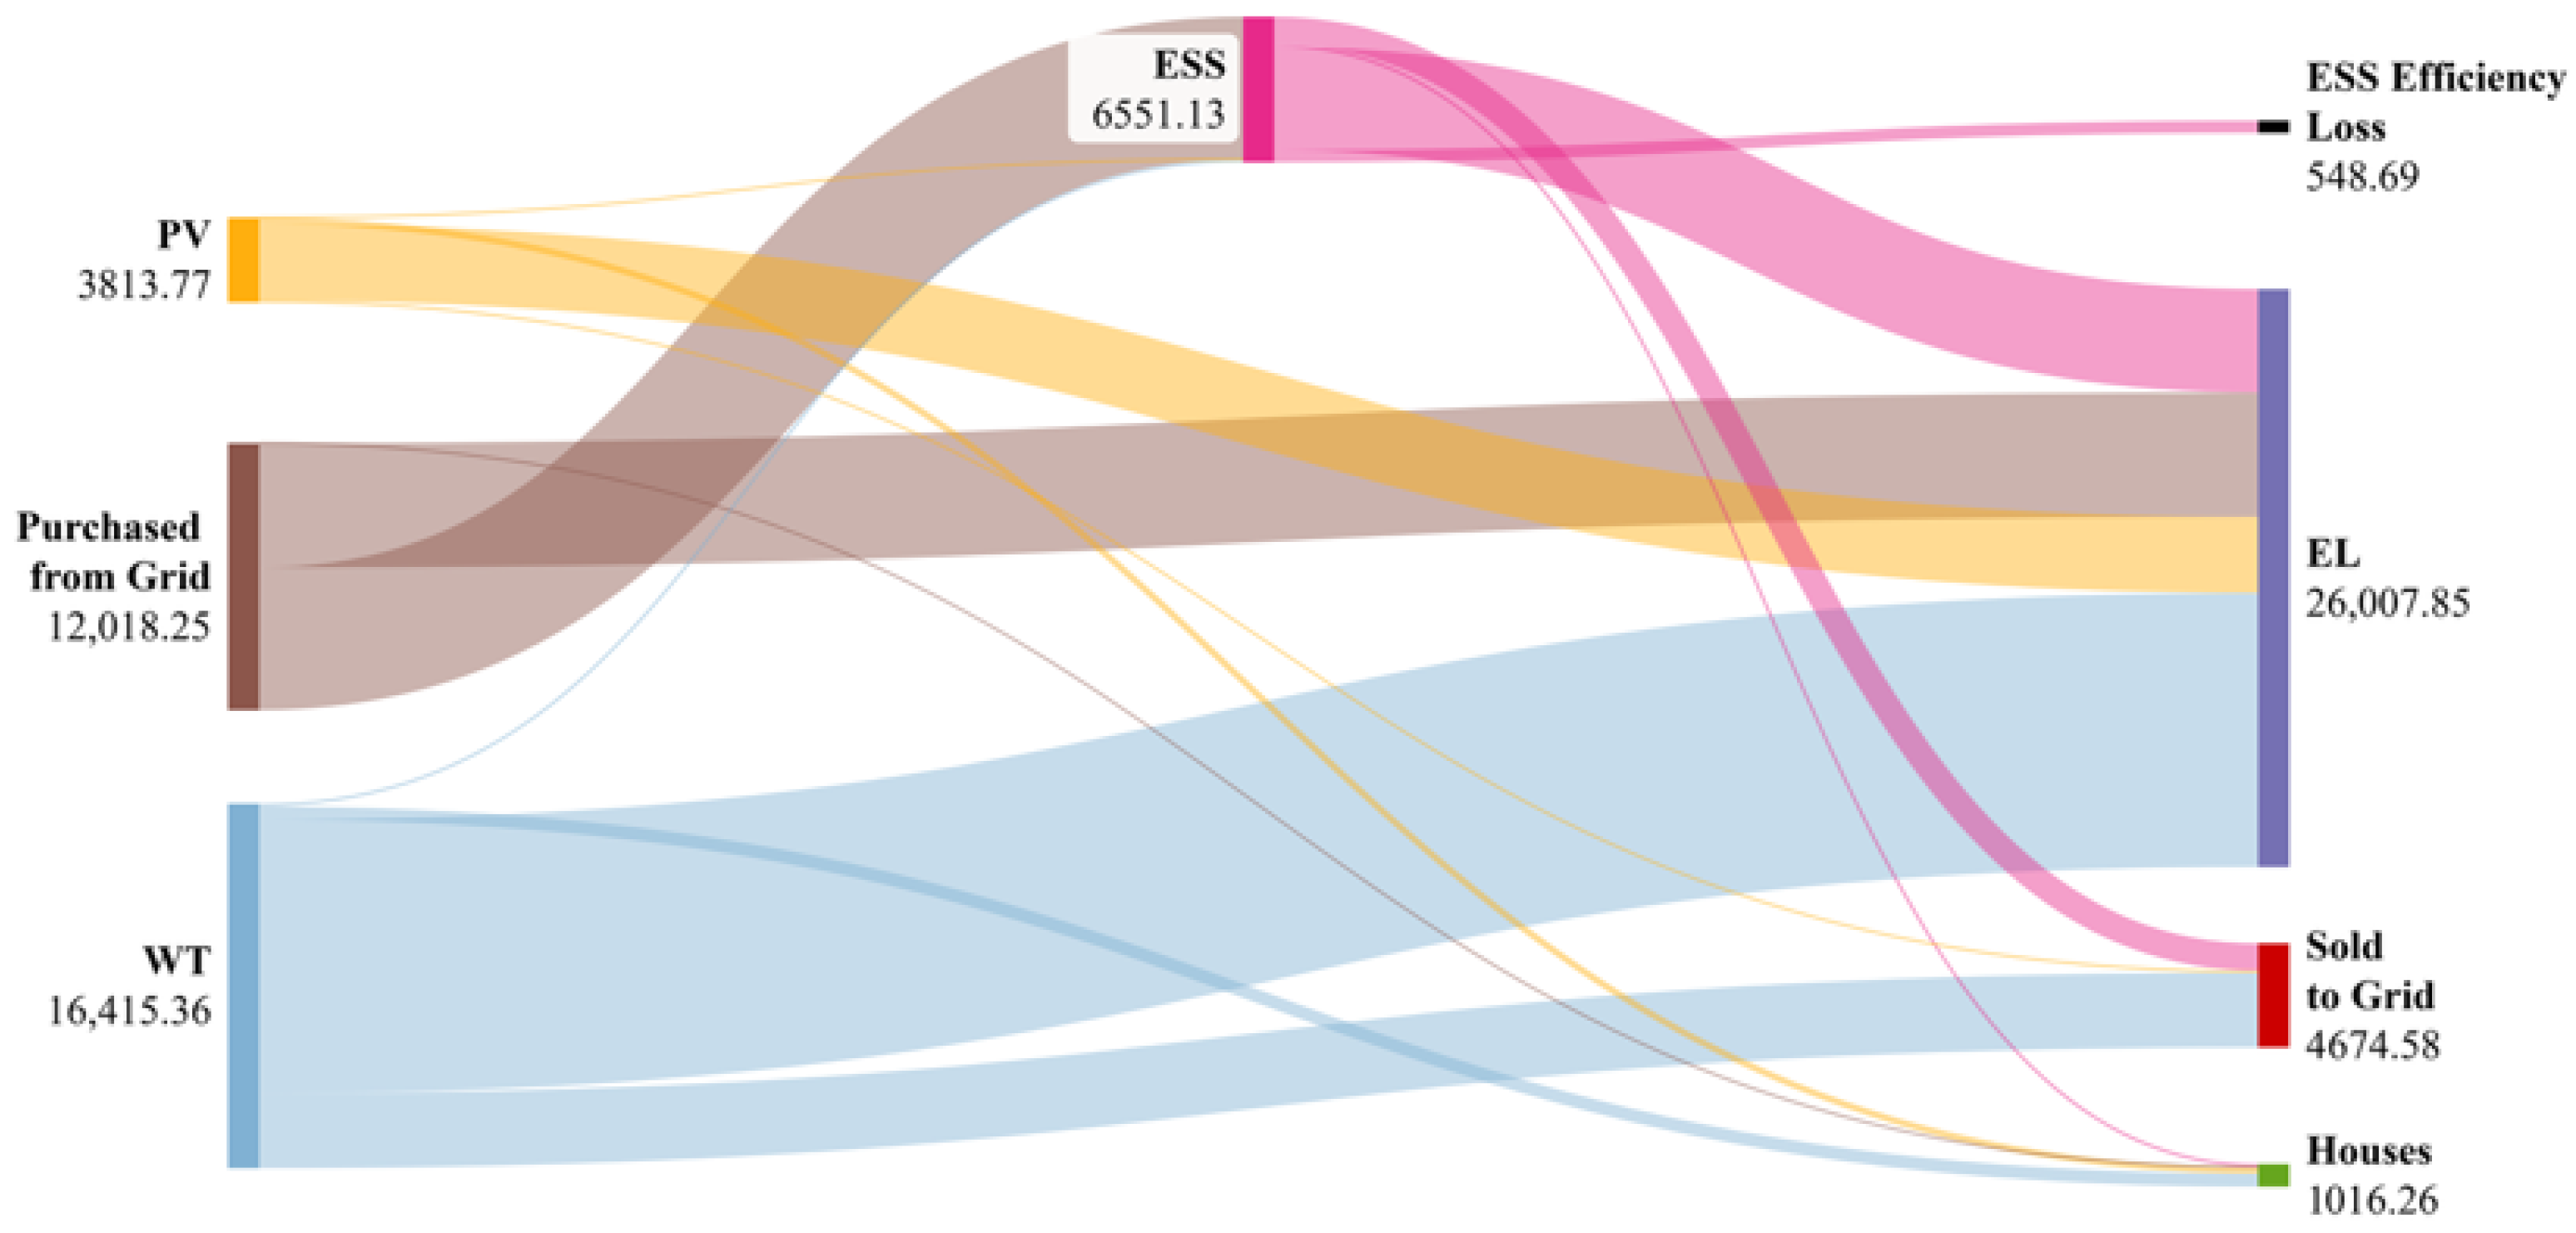
The power balance for Case 18 is presented in Figure 13. Of the electricity supplied to the residential area, 50.9% was generated by WT and 11.83% by PV, while 37.27% was purchased from the power grid. A total of 20.32% of the supplied electricity was stored in the ESS. All generation units contributed to the electricity charged into the ESS, and all consumption units utilized the electricity discharged from the ESS. Regarding electricity consumption, 80.65% of the electricity supplied to the residential area was consumed by the EL and 3.15% by households, while 14.5% was sold back to the grid and 1.7% was lost due to ESS efficiency losses.
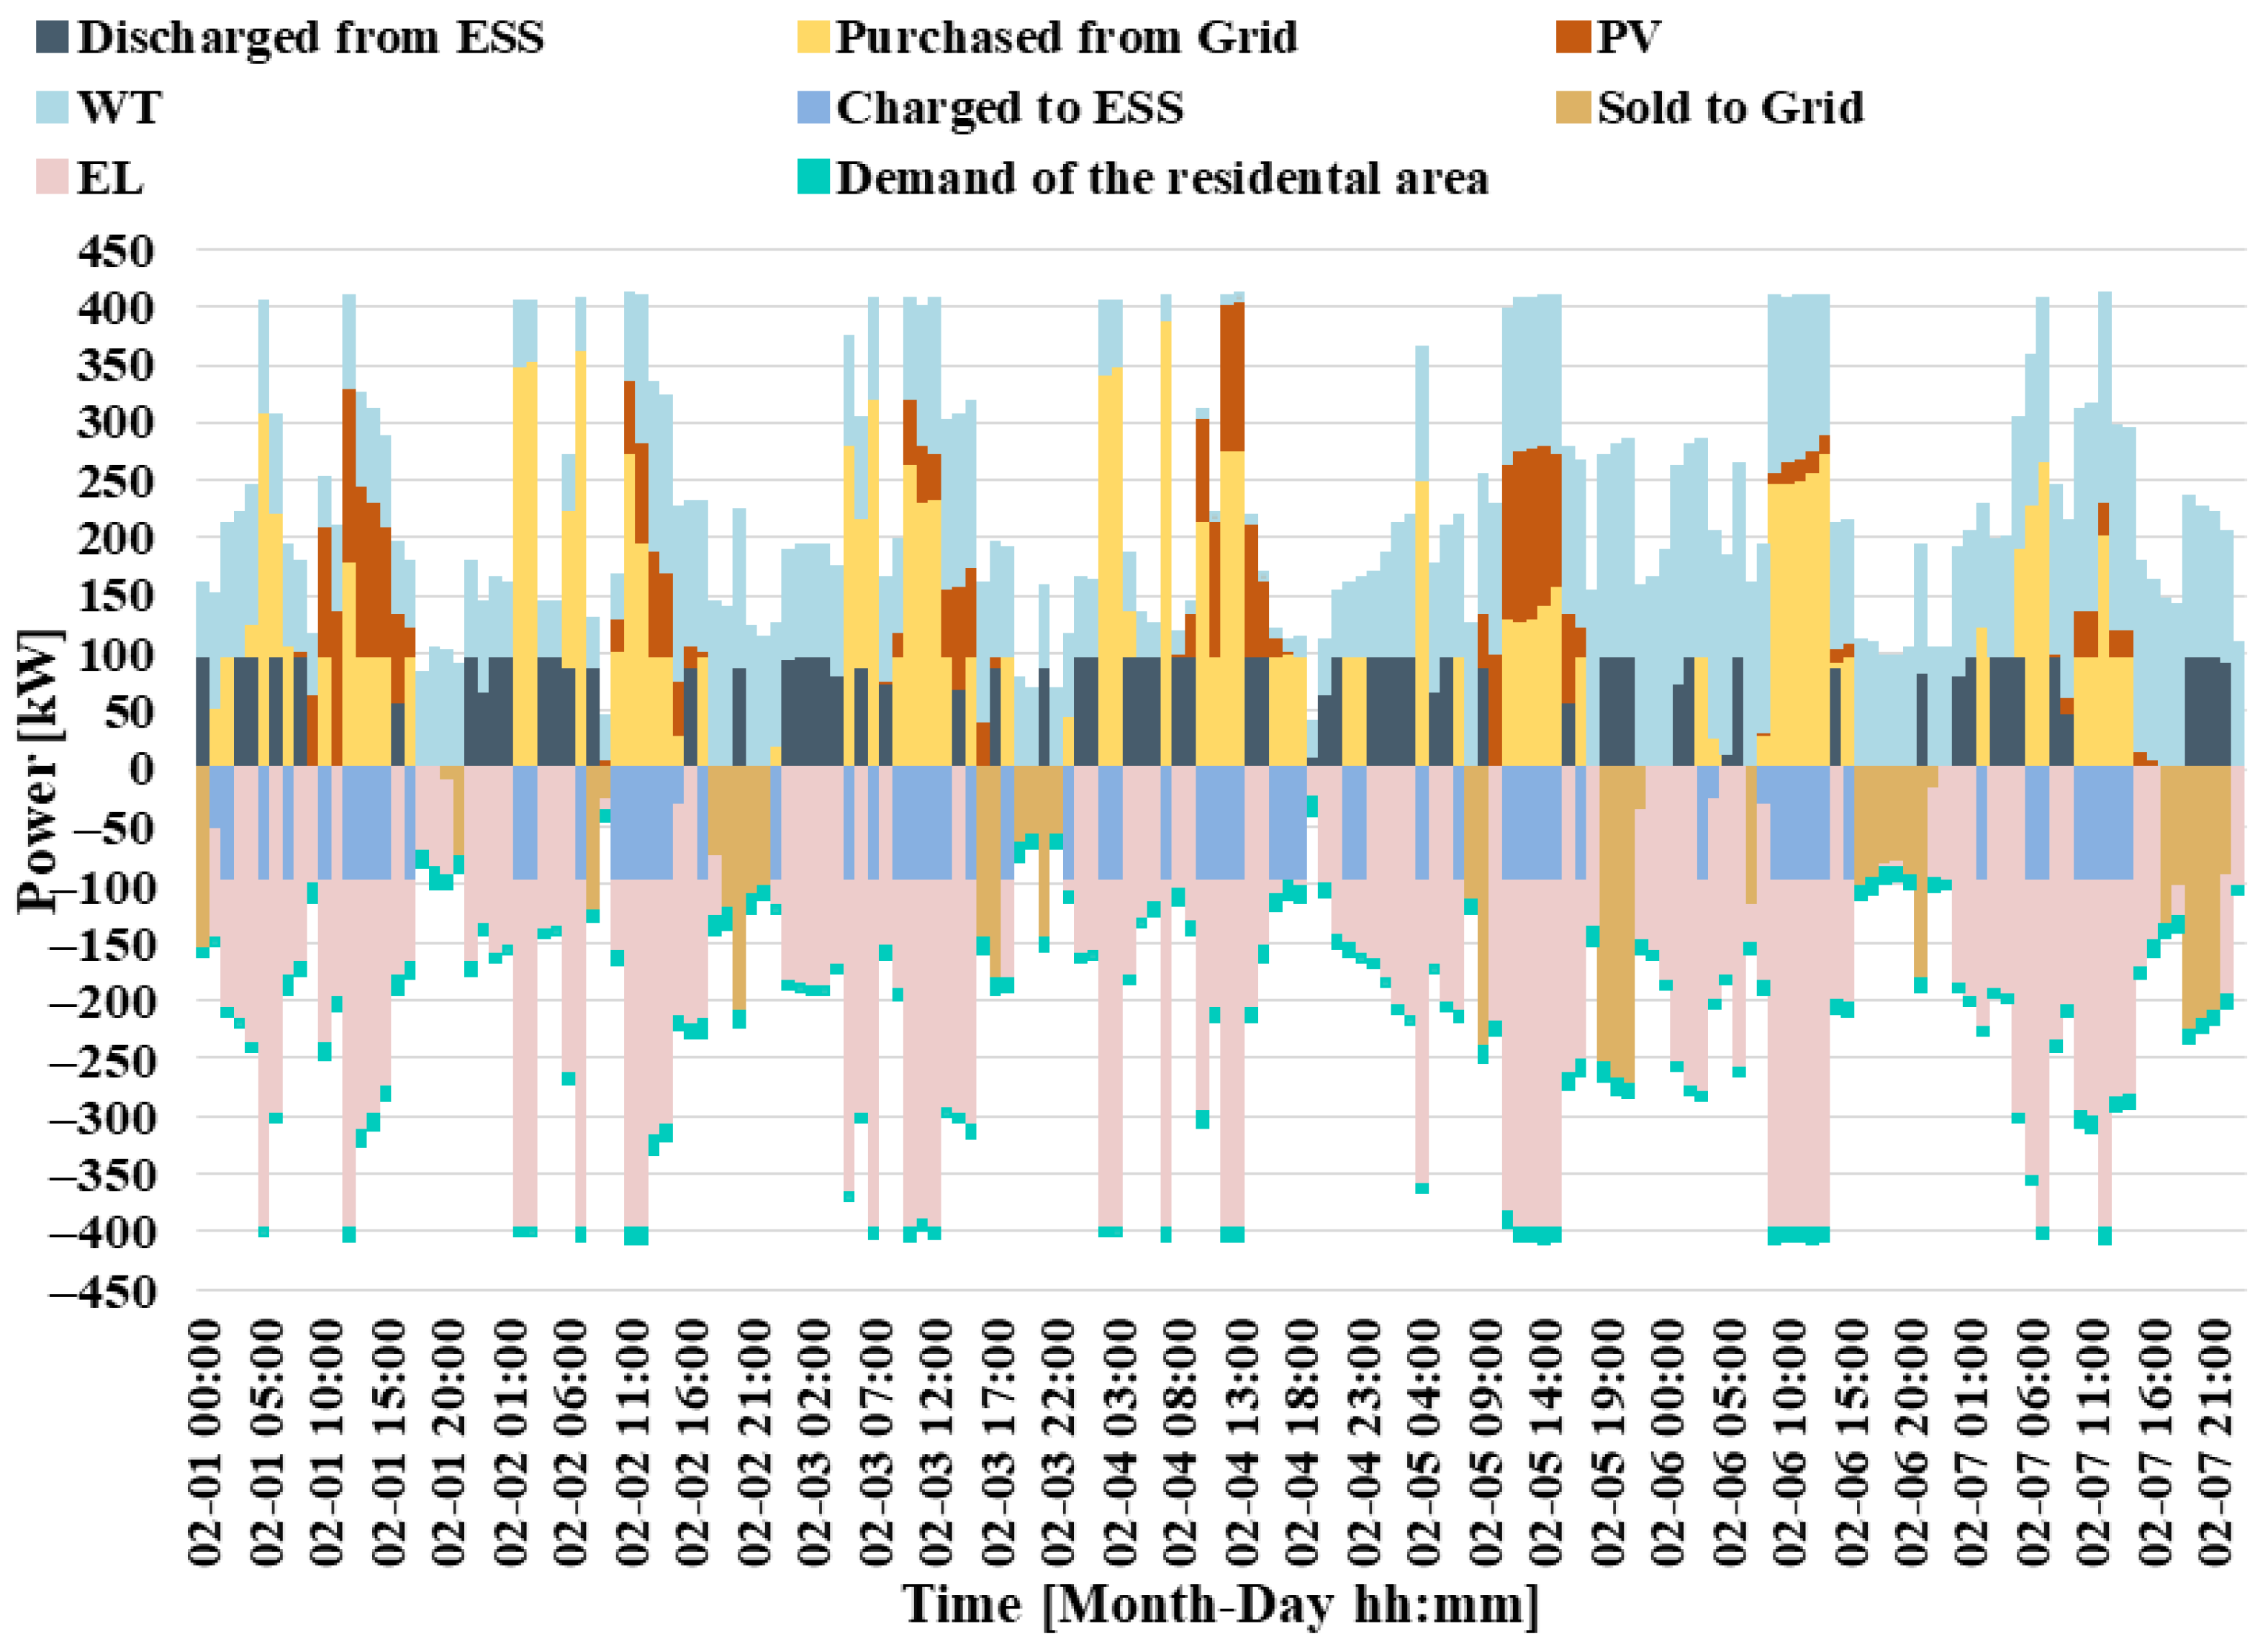
The power balance for Case 18 is presented in Figure 14. Compared to Figure 13, Figure 14 provides a clearer representation of which sources generate or consume energy during specific time periods. The results of the graph reveal that, despite the high fluctuations in RESs, the energy demand was continuously met through the interaction between the ESS and the grid. During periods of surplus generation, the ESS was charged, electricity was sold to the grid, and hydrogen was produced via the EL, thereby ensuring the efficient utilization of RES. In addition, the ESS guaranteed users’ access to green energy. During periods of insufficient generation, the discharge of the ESS and electricity purchased from the grid maintained supply security. These findings demonstrate that the proposed energy management model enhances operational flexibility while ensuring both economic efficiency and sustainability.

4. Conclusions

In this study, a fairness-oriented energy management strategy was proposed for a residential area that incorporated RESs, an ESS, a hydrogen tank, and an EL while simultaneously meeting both the electricity and hydrogen energy demands. This approach goes beyond the sole objective of technical efficiency and introduces a more inclusive and sustainable framework for energy sharing by taking social dimensions into account. In this community, which interacts bidirectionally with the grid, residents use hydrogen boilers for heating, hydrogen hobs for cooking, and FCEVs for transportation. The operation was designed to minimize costs while ensuring fair utilization of the ESS, hydrogen tank, RESs, and total green energy under different minimum fairness ratios. The problem was formulated using the MILP method.
This study presented, for the first time in the literature, an energy management model that considered fair utilization in a community jointly involving hydrogen and electrical energy. By incorporating fairness indices based on the SDR concept, four fairness index types, ESSSR, HESR, TGESR, and RESR, were systematically investigated under different minimum fairness ratio levels. To position the proposed approach within the literature, the aims, scope, and key findings of the most closely related studies are presented below.
Zhou et al. [42] proposed a multi-agent simulation framework and a unified set of evaluation indices to compare different mechanisms for peer-to-peer (P2P) energy sharing among residential prosumers. The evaluation considered economic metrics together with technical metrics. In the Great Britain context, SDR, mid-market rate (MMR), and bill sharing (BS) mechanisms were examined, and SDR was reported to outperform the others in overall performance. Erdinç [17] proposed a rolling-horizon MILP for a 20-house community with shared PV and battery storage to minimize operating costs while enforcing fair PV and storage usage. Under fairness on the percentage of PV supply ratio (%PSR), the household %PSR range narrowed from 13.32–89.82% to 42.82–51.38%, with only a 0.38% cost increase. For storage-based or combined fairness, the cost increase was reported to be on the order of about 5%. Ghanavati et al. [43] proposed an energy management strategy for local energy communities to enable fair and cost-effective electricity sharing among smart homes. They defined fairness by providing clean-energy access in line with participants’ demand shares when renewable supply was scarce and by distributing surplus-related benefits proportionally to contribution when excess existed. Their case study results indicated that the approach reduced the daily total energy cost by about 23% compared with the baseline. Lee and Kwon [18] proposed a data-driven, threshold-based control strategy for operating a shared residential battery energy storage system to ensure both fair access and fair benefit. They enforced fairness by preventing households from discharging more energy than they had contributed and by requiring that battery usage generated a nonnegative net benefit at the household level. Their results showed that the strategy eliminated fair-access violations by 100% and reduced fair-benefit violations by about 76%. However, it increased the total cost by about 2.3% and decreased the total benefit by about 4.9%. Tairo et al. [21] proposed a real-time energy management system for a three-phase unbalanced alternating-current microgrid that accounted for PV generation and demand uncertainties. They aimed to jointly reduce grid-related operating costs and the energy not supplied to EVs, and they enforced fair EV charging through a fairness index based on state of charge, battery capacity, and available charging time. Their Pareto compromise solution reported about 18% savings in operating cost. Boccard and Goetz [44] studied PV energy communities and proposed a fair-but-unequal gain-sharing rule that accounted for ownership entitlements and realized consumption and production. They reported that sufficiently large PV reduced median energy costs by up to 65%, while P2P trading provided about 2.5% additional savings under similar demand profiles and up to 11% under high heterogeneity. Zhao et al. [45] designed a PV-based community P2P sharing scheme that jointly improved cost, grid power fluctuations, and revenue fairness. Compared with P2P-only operation, they reported a 16.8% lower total cost, 76% lower power fluctuation, and 62.6% lower inequality.
In this study, a total of 20 case studies were conducted to provide a comprehensive and explanatory assessment of different fairness index types and ratios, combined with varying PV, WT, and ESS capacities. This extensive set of case studies systematically examined how different levels of fairness and capacity variations are reflected in community operation, thereby addressing an important research gap in the literature. The results demonstrated significant improvements in terms of cost, grid power consumption, and carbon emissions while ensuring that each household in the community was guaranteed fair access to green energy under the respective fairness index type. Another finding indicated that while the operating cost was 11,145.77 TL, increasing the capacity of RESs by 1.5 times resulted in a profit of 70,107.39 TL. In this case, grid power consumption decreased by 48.68%, and carbon emissions were reduced by 2.2 metric tons. These outcomes strongly demonstrate that investments in renewable energy can simultaneously deliver both economic and environmental benefits. In this context, the increase in RES capacity substantially reduced both cost and carbon emissions.
The lowest levels of grid power consumption were generally observed under the HESR index type. Since a large share of the community’s energy demand is derived from hydrogen, fair utilization of the hydrogen tank reduced grid dependency and provided environmentally favorable outcomes. Therefore, the hydrogen-oriented fairness approach can be considered as a particularly effective strategy for reducing reliance on the grid. As the minimum fairness ratio increased, operating costs generally rose, while grid power consumption declined. When the ESS capacity was increased by 1.5 times, the cost decreased by 19.51%, whereas grid power consumption increased by 6.13%. In the scenario where total green energy fairness was ensured and the minimum fairness ratio was set at 100%, enlarging the RES and ESS capacities by 1.5 times yielded a profit of 69,569.72 TL, with only 2562.64 kW of electricity purchased from the grid and 1.0 metric ton of carbon emissions. This finding represents the most environmentally friendly and economically satisfactory outcome of the study, highlighting the strong alignment of the fairness-based approach with long-term energy policies. Notably, this scenario achieved the lowest grid power consumption and carbon emission levels among all case studies.
Based on the conducted case studies, the proposed framework ensured fair access to green energy under each fairness index type while delivering noticeable improvements in operating cost, grid electricity consumption, and carbon emissions. As the minimum fairness ratio increased, operating costs generally rose, whereas grid power consumption declined, indicating a clear trade-off between fairness and cost versus grid dependency and emissions. This balance was strongly shaped by capacity choices, since renewable capacity expansion could deliver economic and environmental benefits simultaneously, whereas increasing the ESS capacity alone reduced cost but increased grid purchases and emissions.
This study reveals that fairness-oriented strategies in hybrid energy communities are critically important not only for technical and economic performance, but also for social satisfaction and environmental sustainability. Particularly, the TGESR approach has demonstrated compatibility with long-term energy policies, thereby validating the strategic role of fairness in the sustainable energy transition. Future research is encouraged to examine the impacts of different climatic zones and consumption patterns, and to explore fairness strategies in multi-community scenarios. In addition, stochastic MILP, robust optimization, and scenario-based analysis approaches can be incorporated to explicitly model uncertainties. The proposed framework can be scaled up to larger communities and evaluated over longer operating horizons. Moreover, seasonal scenarios can be developed to assess how varying conditions across the year affect model performance.

Author Contributions

Conceptualization, B.Ş. and A.Ç.; methodology, B.Ş. and A.Ç.; software, B.Ş. and A.Ç.; formal analysis, B.Ş. and A.Ç.; investigation, B.Ş. and A.Ç.; data curation, B.Ş. and A.Ç.; writing—original draft preparation, B.Ş. and A.Ç.; visualization, B.Ş. and A.Ç. All authors have read and agreed to the published version of the manuscript.

Funding

This research received no external funding.

Institutional Review Board Statement

Not applicable.

Informed Consent Statement

Not applicable.

Data Availability Statement

The original data presented in this study are openly available in the Türkiye Electricity Market Transparency Platform (EPİAŞ) at https://seffaflik.epias.com.tr/electricity/electricity-markets/day-ahead-market-dam/market-clearing-price-mcp (accessed on 15 December 2025), in Renewables ninja at https://www.renewables.ninja/ (accessed on 15 December 2025), and in the published study at https://doi.org/10.1016/j.enbuild.2008.02.006 (accessed on 15 December 2025).

Acknowledgments

During the preparation of this manuscript, the authors used ChatGPT (https://chatgpt.com/) (OpenAI) for the purpose of language editing. The authors have reviewed and edited the output and take full responsibility for the content of this publication.

Conflicts of Interest

The authors declare no conflicts of interest.

Abbreviations

The following abbreviations are used in this manuscript:
ELElectrolyzer
ESSEnergy storage system
ESSSREnergy storage system supply ratio
FCEVFuel cell electric vehicle
HESRHydrogen energy supply ratio
PVPhotovoltaic
RESRRenewable energy supply ratio
RESRenewable energy source
WTWind turbine
TGESRTotal green energy supply ratio
Sets and Indices
hSet of residential houses
tSet of time periods
Parameters
A t , h F C E V Hydrogen consumption of the FCEV of house h at time t [kg]
A t , h H y d r o g e n _ a p p l i a n c e s Hydrogen consumption of household hydrogen-powered appliances in house h at time t [kg]
A f i n a l t a n k Hydrogen level in the tank at the end of the time horizon [kg]
A m a x t a n k Maximum allowable capacity of the hydrogen tank [kg]
A m i n t a n k Minimum allowable capacity of the hydrogen tank [kg]
L H V H 2 Lower heating value of hydrogen [MJ/kg]
P c h _ c a p The maximum allowable charging power [kW]
P d i s c h _ c a p The maximum allowable discharging power [kW]
P m a x E L Maximum allowable power input to the EL [kW]
P m i n E L Minimum allowable power input to the EL [kW]
P t , h h o u s e Electricity consumption of house h at time t [kW]
P t W T Power output from the WT at time t [kW]
P t R H Total power demand of the residential area at time t [kW]
P t P V Power output from PV system at time t [kW]
B P N Sufficiently positive big number
N m a x Maximum allowed ratio of hydrogen, RES, or total green energy supplied to each house
N m i n Minimum allowed ratio of hydrogen, RES, or total green energy supplied to each house
sStep size of the EL [Integer]
λ t p r i c e Electricity market price at time t (currency/kWh)
η b a t c h Charging efficiency of the ESS [%]
η b a t d i s c h Discharging efficiency of the ESS [%]
η E L Efficiency of the EL [%]
α Hydrogen-to-electric energy conversion coefficient
Δ T Time interval [hour]
Variables
A t E L _ G r i d Amount of hydrogen produced by using power purchased from the power grid in the EL at time t [kg]
A t E L _ R E S Amount of hydrogen produced by using power generated from the RESs in the EL at time t [kg]
A t , h R H _ G r i d Amount of hydrogen produced using power purchased from the power grid and supplied to house h at time t [kg]
A t , h R H _ R E S Amount of hydrogen produced using power generated from the RESs and supplied to house h at time t [kg]
A t t a n k Hydrogen level in the hydrogen tank at time t [kg]
E t E S S ESS energy level at time t [kWh]
P t E L Power used by the EL at time t [kW]
P t c h _ E S S Charging power of the ESS at time t [kW]
P t d i s c h _ E S S Discharging power of the ESS at time t [kW]
P t , h d i s c h _ t o _ h o u s e ( G r i d ) Power supplied from the ESS (charged by the power grid) to the house h at time t [kW]
P t , h d i s c h _ t o _ h o u s e ( P V ) Power supplied from the ESS (charged by the PV system) to the house h at time t [kW]
P t , h d i s c h _ t o _ h o u s e ( W T ) Power supplied from the ESS (charged by the WT) to the house h at time t [kW]
P t b u y _ g r i d Power purchased from the power grid at time t [kW]
P t g r i d _ t o _ E L Power supplied from the power grid to the EL at time t [kW]
P t g r i d _ t o _ E S S Power supplied from the power grid to the ESS at time t [kW]
P t , h g r i d _ t o _ h o u s e Power supplied from the power grid to the house h at time t [kW]
P t s e l l _ g r i d Power sold to the power grid at time t [kW]
P t E S S _ t o _ E L ( G r i d ) Power supplied from the ESS (charged by the grid) to the EL at time t [kW]
P t E S S _ t o _ E L ( P V ) Power supplied from the ESS (charged by the PV system) to the EL at time t [kW]
P t E S S _ t o _ E L ( W T ) Power supplied from the ESS (charged by the WT) to the EL at time t [kW]
P t E S S _ t o _ g r i d Power supplied from the ESS to the power grid at time t [kW]
P t P V _ t o _ E L Power supplied from the PV to the EL at time t [kW]
P t P V _ t o _ E S S Power supplied from the PV to the ESS at time t [kW]
P t P V _ t o _ g r i d Power sold to the power grid from the PV system at time t [kW]
P t , h P V _ t o _ h o u s e Power supplied from the PV to the house h at time t [kW]
P t W T _ t o _ E L Power supplied from the WT to the EL at time t [kW]
P t W T _ t o _ E S S Power supplied from the WT to the ESS at time t [kW]
P t , h W T _ t o _ h o u s e Power supplied from the WT to the house h at time t [kW]
P t W T _ t o _ g r i d Power sold to the power grid from the WT at time t [kW]
u t E S S Binary variable indicating the operational mode of the ESS at time t. A value of 1 indicates that the system can be charged, while a value of 0 indicates that it can be discharged.
u t g r i d Binary variable indicating power grid usage at time t. If the value is 1, electricity can be purchased from the grid; if it is 0, electricity can be sold to the grid.
% E S S S R Energy storage system supply ratio [%]
% H E S R Hydrogen energy supply ratio [%]
% R E S R Renewable energy supply ratio [%]
% T G E S R Total green energy supply ratio [%]

References

  1. Li, L. Reskilling and Upskilling the Future-ready Workforce for Industry 4.0 and Beyond. Inf. Syst. Front. 2022, 26, 1697–1712. [Google Scholar] [CrossRef] [Scilit] [PubMed]
  2. Amir, M.; Deshmukh, R.G.; Khalid, H.M.; Said, Z.; Raza, A.; Muyeen, S.; Nizami, A.-S.; Elavarasan, R.M.; Saidur, R.; Sopian, K. Energy storage technologies: An integrated survey of developments, global economical/environmental effects, optimal scheduling model, and sustainable adaption policies. J. Energy Storage 2023, 72, 108694. [Google Scholar] [CrossRef] [Scilit]
  3. Loni, A.; Asadi, S. Power System Resilience: The Role of Electric Vehicles and Social Disparities in Mitigating the US Power Outages. Smart Grids Energy 2024, 9, 23. [Google Scholar] [CrossRef] [Scilit]
  4. Watts, N.; Amann, M.; Arnell, N.; Ayeb-Karlsson, S.; Belesova, K.; Berry, H.; Bouley, T.; Boykoff, M.; Byass, P.; Cai, W.; et al. The 2018 report of the Lancet Countdown on health and climate change: Shaping the health of nations for centuries to come. Lancet 2018, 392, 2479–2514. [Google Scholar] [CrossRef] [Scilit]
  5. Kabeyi, M.J.B.; Olanrewaju, O.A. Sustainable Energy Transition for Renewable and Low Carbon Grid Electricity Generation and Supply. Front. Energy Res. 2022, 9, 743114. [Google Scholar] [CrossRef] [Scilit]
  6. Calvin, K.; Dasgupta, D.; Krinner, G.; Mukherji, A.; Thorne, P.W.; Trisos, C.; Romero, J.; Aldunce, P.; Barrett, K.; Blanco, G.; et al. IPCC, 2023: Climate Change 2023: Synthesis Report. In Contribution of Working Groups I, II and III to the Sixth Assessment Report of the Intergovernmental Panel on Climate Change; Core Writing Team, Lee, H., Romero, J., Eds.; Intergovernmental Panel on Climate Change (IPCC): Geneva, Switzerland, 2023. [Google Scholar] [CrossRef] [Scilit]
  7. Breyer, C.; Khalili, S.; Bogdanov, D.; Ram, M.; Oyewo, A.S.; Aghahosseini, A.; Gulagi, A.; Solomon, A.A.; Keiner, D.; Lopez, G.; et al. On the History and Future of 100% Renewable Energy Systems Research. IEEE Access 2022, 10, 78176–78218. [Google Scholar] [CrossRef] [Scilit]
  8. McIlwaine, N.; Foley, A.M.; Morrow, D.J.; Al Kez, D.; Zhang, C.; Lu, X.; Best, R.J. A state-of-the-art techno-economic review of distributed and embedded energy storage for energy systems. Energy 2021, 229, 120461. [Google Scholar] [CrossRef] [Scilit]
  9. Sovacool, B.K.; Griffiths, S.; Kim, J.; Bazilian, M. Climate change and industrial F-gases: A critical and systematic review of developments, sociotechnical systems and policy options for reducing synthetic greenhouse gas emissions. Renew. Sustain. Energy Rev. 2021, 141, 110759. [Google Scholar] [CrossRef] [Scilit]
  10. Rissman, J.; Bataille, C.; Masanet, E.; Aden, N.; Morrow, W.R.; Zhou, N.; Elliott, N.; Dell, R.; Heeren, N.; Huckestein, B.; et al. Technologies and policies to decarbonize global industry: Review and assessment of mitigation drivers through 2070. Appl. Energy 2020, 266, 114848. [Google Scholar] [CrossRef] [Scilit]
  11. Rasolomampionona, D.; Kłos, M. Energy Storage Systems and Their Role in Smart Grids. In Smart Grids Technology and Applications; IntechOpen: London, UK, 2023. [Google Scholar] [CrossRef] [Scilit]
  12. Meng, L.; Zafar, J.; Khadem, S.K.; Collinson, A.; Murchie, K.C.; Coffele, F.; Burt, G.M. Fast Frequency Response From Energy Storage Systems—A Review of Grid Standards, Projects and Technical Issues. IEEE Trans. Smart Grid 2020, 11, 1566–1581. [Google Scholar] [CrossRef] [Scilit]
  13. Uddin, M.; Mo, H.; Dong, D.; Elsawah, S.; Zhu, J.; Guerrero, J.M. Microgrids: A review, outstanding issues and future trends. Energy Strategy Rev. 2023, 49, 101127. [Google Scholar] [CrossRef] [Scilit]
  14. Gajdzik, B.; Wolniak, R.; Nagaj, R.; Žuromskaitė-Nagaj, B.; Grebski, W.W. The Influence of the Global Energy Crisis on Energy Efficiency: A Comprehensive Analysis. Energies 2024, 17, 947. [Google Scholar] [CrossRef] [Scilit]
  15. Intergovernmental Panel on Climate Change (IPCC). Climate Change 2022—Impacts, Adaptation and Vulnerability; Cambridge University Press: Cambridge, UK, 2023. [Google Scholar] [CrossRef] [Scilit]
  16. Gordon, J.A.; Balta-Ozkan, N.; Nabavi, S.A. Gauging public perceptions of blue and green hydrogen futures: Is the twin-track approach compatible with hydrogen acceptance? Int. J. Hydrog. Energy 2024, 49, 75–104. [Google Scholar] [CrossRef] [Scilit]
  17. Erdinç, F.G. Rolling horizon optimization based real-time energy management of a residential neighborhood considering PV and ESS usage fairness. Appl. Energy 2023, 344, 121275. [Google Scholar] [CrossRef] [Scilit]
  18. Lee, C.; Kwon, S. Fair access and benefit guaranteed sharing strategy for Battery Energy Storage systems in a residential community. Appl. Energy 2025, 383, 125350. [Google Scholar] [CrossRef] [Scilit]
  19. Paudel, D.; Wolf, L.; Das, T.K. Joint operation of a fast-charging EV hub with a stand-alone independent battery storage system under fairness considerations. Energy 2025, 330, 136720. [Google Scholar] [CrossRef] [Scilit]
  20. Dynge, M.F.; Cali, U. Distributive energy justice in local electricity markets: Assessing the performance of fairness indicators. Appl. Energy 2025, 384, 125463. [Google Scholar] [CrossRef] [Scilit]
  21. Tairo, D.C.; Silva, J.A.A.; López, J.C.; Rider, M.J. Implementation of a microgrid energy management system considering fair EV charging, uncertainties and contingencies: A multi-objective approach. Appl. Energy 2025, 396, 126242. [Google Scholar] [CrossRef] [Scilit]
  22. Soares, J.; Lezama, F.; Faia, R.; Limmer, S.; Dietrich, M.; Rodemann, T.; Ramos, S.; Vale, Z. Review on fairness in local energy systems. Appl. Energy 2024, 374, 123933. [Google Scholar] [CrossRef] [Scilit]
  23. Santos, J.B.; Scharnigg, R.; Monteiro, J.; Pacheco, A. Fair shares or smart savings? Exploring business models, justice and efficiency trade-offs in Portuguese energy communities. Energy Res. Soc. Sci. 2025, 125, 104102. [Google Scholar] [CrossRef] [Scilit]
  24. Çiçek, A. A novel resilience-oriented energy management strategy for hydrogen-based green buildings. J. Clean. Prod. 2024, 470, 143297. [Google Scholar] [CrossRef] [Scilit]
  25. Deng, Y.; Luo, F.; Mu, Y. Multi-stage energy management framework for residential communities using aggregated flexible energy resources in planned power outages. Int. J. Electr. Power Energy Syst. 2025, 166, 110584. [Google Scholar] [CrossRef] [Scilit]
  26. Hussain, J.; Huang, Q.; Li, J.; Hussain, F.; Mirjat, B.A.; Zhang, Z.; Ahmed, S.A. A fully decentralized demand response and prosumer peer-to-peer trading for secure and efficient energy management of community microgrid. Energy 2024, 312, 133538. [Google Scholar] [CrossRef] [Scilit]
  27. Santos, S.A.B.D.; Coutinho, L.R.R.; Tofoli, F.L.; Barroso, G.C. Community energy management system for residential energy communities integrating demand response, distributed generation, and energy storage systems. J. Energy Storage 2025, 132, 117832. [Google Scholar] [CrossRef] [Scilit]
  28. Taşcıkaraoğlu, A.; Beyazıt, M.A.; Kleissl, J.; Shi, Y. Coordinated Management of Mobile Charging Stations and Community Energy Storage for Electric Vehicle Charging. Appl. Energy 2025, 393, 126066. [Google Scholar] [CrossRef] [Scilit]
  29. Ghasemnejad, H.; Rashidinejad, M.; Abdollahi, A.; Dorahaki, S. Energy management in citizen energy communities: A flexibility-constrained robust optimization approach considering prosumers comfort. Appl. Energy 2024, 356, 122456. [Google Scholar] [CrossRef] [Scilit]
  30. Abomazid, A.M.; El-Taweel, N.A.; Farag, H.E.Z. Optimal Energy Management of Hydrogen Energy Facility Using Integrated Battery Energy Storage and Solar Photovoltaic Systems. IEEE Trans. Sustain. Energy 2022, 13, 1457–1468. [Google Scholar] [CrossRef] [Scilit]
  31. Khavari, F.; Hajipour, E.; Liu, J. Energy management considering underground hydrogen storage. J. Energy Storage 2025, 127, 116946. [Google Scholar] [CrossRef] [Scilit]
  32. Wade, F.; Roche, R.; Chailan, A.; Bertrand, V.; Paire, D. Optimal sizing and energy management of an integrated energy system coupling a hydrogen-fueled gas turbine with storage for Power-to-Power and hydrogen supply. Int. J. Hydrog. Energy 2025, 135, 31–47. [Google Scholar] [CrossRef] [Scilit]
  33. Dai, S. Optimal energy management of multi-energy multi-microgrid networks using mountain gazelle optimizer for cost and emission reduction. Energy 2025, 329, 136640. [Google Scholar] [CrossRef] [Scilit]
  34. Ahmed, S.; Huang, Y.; Kinjo, M.; Senjyu, T.; Song, D.; Elkholy, M.H. Sustainable and reliable energy management for urban hybrid energy systems: A case study in Islamabad Pakistan on hydrogen and battery integration using transient search optimization algorithm. Results Eng. 2025, 27, 106272. [Google Scholar] [CrossRef] [Scilit]
  35. Tang, D.; Ge, P.; Yuan, C.; Ren, H.; Zhong, X.; Dong, M.; Agundis-Tinajero, G.D.; Diaz-Londono, C.; Guerrero, J.M.; Zio, E. Optimal management of coupled hydrogen-electricity energy systems at ports by multi-time scale scheduling. Appl. Energy 2025, 391, 125885. [Google Scholar] [CrossRef] [Scilit]
  36. Çiçek, A. Resilience-oriented energy operation of a country house sustained by fishing with renewable sources and hydrogen-based technologies. Int. J. Hydrog. Energy 2025, 144, 947–963. [Google Scholar] [CrossRef] [Scilit]
  37. CPLEX 12 Solver. Available online: https://www.gams.com/latest/docs/S_CPLEX.html (accessed on 15 December 2025).
  38. Richardson, I.; Thomson, M.; Infield, D. A high-resolution domestic building occupancy model for energy demand simulations. Energy Build. 2008, 40, 1560–1566. [Google Scholar] [CrossRef] [Scilit]
  39. Renewables.ninja. Wind Power and Solar Photovoltaic Power. Available online: https://www.renewables.ninja/ (accessed on 15 December 2025).
  40. EPIAS. Turkey Electricity Market Prices. Available online: https://seffaflik.epias.com.tr/electricity/electricity-markets/day-ahead-market-dam/market-clearing-price-mcp (accessed on 15 December 2025).
  41. EPA. United States Environmental Protection Agency. Available online: https://www.epa.gov/energy/greenhouse-gas-equivalencies-calculator (accessed on 15 December 2025).
  42. Zhou, Y.; Wu, J.; Long, C. Evaluation of peer-to-peer energy sharing mechanisms based on a multiagent simulation framework. Appl. Energy 2018, 222, 993–1022. [Google Scholar] [CrossRef] [Scilit]
  43. Ghanavati, F.; Osório, G.J.; Matias, J.C.O.; Catalão, J.P.S. Fair Energy Sharing Strategy for Smart Homes in Local Energy Communities. In Proceedings of the 2025 IEEE International Conference on Environment and Electrical Engineering and 2025 IEEE Industrial and Commercial Power Systems Europe (EEEIC/I&CPS Europe); IEEE: Crete, Greece, 2025; pp. 1–6. [Google Scholar] [CrossRef] [Scilit]
  44. Boccard, N.; Goetz, R. Power Trading within an Energy Community: Applying a fair unequal sharing rule of photovoltaic energy. Energy Econ. 2025, 150, 108822. [Google Scholar] [CrossRef] [Scilit]
  45. Zhao, F.; Li, Z.; Wang, D.; Ma, T. Peer-to-peer energy sharing with demand-side management for fair revenue distribution and stable grid interaction in the photovoltaic community. J. Clean. Prod. 2023, 383, 135271. [Google Scholar] [CrossRef] [Scilit]
Figure 1. General overview of a residential area operated with a fairness-oriented green energy management model.
Sustainability 18 01864 g001
Figure 2. Total energy consumption data of the sample houses selected from each type.
Sustainability 18 01864 g002
Figure 3. Total energy consumption data of the residential area.
Sustainability 18 01864 g003
Figure 4. Hydrogen demand by FCEVs used by the residents in the housing area.
Sustainability 18 01864 g004
Figure 5. Hydrogen demand of houses for domestic boilers and cooking hobs.
Sustainability 18 01864 g005
Figure 6. Power output data of the 200 kW PV system.
Sustainability 18 01864 g006
Figure 7. Power output data of the 200 kW WT.
Sustainability 18 01864 g007
Figure 8. Data of the day-ahead electricity market prices.
Sustainability 18 01864 g008
Figure 9. Mean supply ratio values for all cases.
Sustainability 18 01864 g009
Figure 10. Energy balance for Case 4 using a Sankey diagram [kWh].
Sustainability 18 01864 g010
Figure 11. Energy balance for Case 20 using a Sankey diagram [kWh].
Sustainability 18 01864 g011
Figure 12. Energy balance for House 12 in Case 20 using a Sankey diagram [kWh].
Sustainability 18 01864 g012
Figure 13. Energy balance for Case 18 using a Sankey diagram [kWh].
Sustainability 18 01864 g013
Figure 14. Power balance for Case 18 using a stacked bar chart.
Sustainability 18 01864 g014
Table 1. Data on test studies conducted.
CaseFairness Index TypeMinimum Fairness RatioPV CapacityWT CapacityESS Capacity
Case 1RESR0%200 kW200 kW200 kW
Case 2ESSSR0%200 kW200 kW200 kW
Case 3HESR0%200 kW200 kW200 kW
Case 4TGESR0%200 kW200 kW200 kW
Case 5RESR50%200 kW200 kW200 kW
Case 6ESSSR50%200 kW200 kW200 kW
Case 7HESR50%200 kW200 kW200 kW
Case 8TGESR50%200 kW200 kW200 kW
Case 9RESR65%200 kW200 kW200 kW
Case 10ESSSR65%200 kW200 kW200 kW
Case 11HESR65%200 kW200 kW200 kW
Case 12TGESR65%200 kW200 kW200 kW
Case 13RESR80%200 kW200 kW200 kW
Case 14ESSSR80%200 kW200 kW200 kW
Case 15HESR80%200 kW200 kW200 kW
Case 16TGESR80%200 kW200 kW200 kW
Case 17TGESR80%500 kW500 kW200 kW
Case 18TGESR80%200 kW200 kW500 kW
Case 19TGESR95%400 kW400 kW500 kW
Case 20TGESR100%500 kW500 kW500 kW
Table 2. Data on test results of case studies.
CaseCost
[Turkish Lira]
Grid Power
Consumption [kW]
Carbon Emission
[Metric Ton]
CaseCost
[Turkish Lira]
Grid Power
Consumption [kW]
Carbon Emission
[Metric Ton]
Case 17688.1016,714.796.6Case 118511.7213,752.185.4
Case 27688.1016,714.796.6Case 128334.2613,903.35.5
Case 37688.1016,714.796.6Case 137688.1016,714.796.6
Case 47688.1016,714.796.6Case 147841.7816,516.396.5
Case 57688.1016,714.796.6Case 1511,333.1311,431.864.5
Case 67693.4216,702.746.6Case 1611,145.7711,323.744.5
Case 77704.3415,874.96.2Case 17−70,107.395811.552.3
Case 87688.1016,542.856.5Case 188971.5512,018.244.7
Case 97688.1016,714.796.6Case 19−44,641.514514.171.8
Case 107718.7916,675.366.6Case 20−69,569.722562.641.0
Disclaimer/Publisher’s Note: The statements, opinions and data contained in all publications are solely those of the individual author(s) and contributor(s) and not of MDPI and/or the editor(s). MDPI and/or the editor(s) disclaim responsibility for any injury to people or property resulting from any ideas, methods, instructions or products referred to in the content.