Article

Spatial Patterns and Driving Mechanisms of Intangible Cultural Heritage in the Pearl River Basin Area


1
Faculty of Humanities and Social Sciences, Macau Polytechnic University, Rua de Luis Gonzaga Gomes, Macau 999078, China
2
Scientific Institute of Pearl River Water Resources Protection, Guangzhou 510611, China
*
Author to whom correspondence should be addressed.
Sustainability 2026, 18(4), 1801; https://doi.org/10.3390/su18041801
Submission received: 15 December 2025 / Revised: 11 January 2026 / Accepted: 13 January 2026 / Published: 10 February 2026
(This article belongs to the Section Tourism, Culture, and Heritage)

Abstract

Intangible Cultural Heritage (ICH) is vital for regional cultural sustainability and social cohesion. While ICH patterns in the Yangtze and Yellow River basins have been widely investigated, macro-scale research on the Pearl River Basin Area (PRBA) remains insufficient. Using GIS-based spatial analytical techniques, this study examines the agglomeration patterns and driving mechanisms of 377 national-level ICH resources within the PRBA. The findings reveal that: (1) the spatial distribution exhibits a pronounced “coastal agglomeration and inland dispersion” density gradient, with the Pearl River Delta serving as a high-density core and ethnic minority regions forming secondary clusters; (2) the gravity center of ICH resources has gradually shifted northwestward from 2006 to 2021, reflecting the influence of policy interventions; and (3) while socioeconomic factors are the primary drivers, hydrological factors exert strong nonlinear enhancement effects through interactions with social variables, highlighting the dependency of cultural genesis on the water environment. These findings provide a scientific basis for ICH living transmission, planning, and regional collaborative governance in the PRBA, thereby promoting regional cultural sustainability.

1. Introduction

Intangible Cultural Heritage (ICH) refers to living heritage that is transmitted across generations, including traditional practices, artistic expressions, rituals, and craftsmanship. Since China acceded to the Convention for the Safeguarding of the Intangible Cultural Heritage in 2004, ICH protection has entered a new stage of development [1,2]. To date, the Chinese government has designated 1557 national-level ICH items (3610 sub-items) across ten categories [3]. Strengthening ICH protection is vital for fostering cultural confidence, enhancing soft power, and sustaining local cultural identity [4,5]. Such preservation dovetails with the UN Sustainable Development Goals, positioning transmission as a central theme in global governance [6]. However, urbanization and modernization continue to pose challenges to the survival of these living traditions [7].
As a crucial medium for the transmission and accumulation of human culture, water systems shape settlement morphologies and foster diverse cultural expressions with distinct regional identities [8,9]. Since 2017, Chinese leadership has repeatedly emphasized “ecological civilization” and the need to preserve the historical continuum of river-based civilizations. Located in southern China, the Pearl River Basin Area (PRBA) features a dense river network. It is not only economically strategic due to the downstream Pearl River Delta [10], but also serves as a repository of the unique Lingnan culture and long-standing historical legacies [11]. Previous studies in the Yangtze River Basin and the Yellow River Basin have revealed the spatial clustering of ICH and have begun to link hydrological factors with cultural patterns [12,13]. These studies generally argue that river waterways strengthen cultural interaction and transmission by facilitating population mobility and cross-regional connections.
Earlier research on ICH focused on defining cultural heritage and analyzing the tensions between practice and preservation [14,15], emphasizing the theoretical frameworks and conceptual definitions of ICH. Subsequently, research priorities shifted toward governance practices and tourism experiences. Representative studies focused on digital preservation, cultural identity, consumption intention, and tourist experiences, all revolving around a more comprehensive experience chain [16,17,18]. More recently, research has integrated themes such as cultural landscapes and spatial distribution [19,20], focusing on preservation practices, spatial patterns, and their underlying mechanisms.
With the advancement of Geographic Information System (GIS) technologies, analyzing the spatial differentiation of ICH has become a dominant research paradigm. At the national level, studies indicate that the spatial distribution of ICH resources in China exhibits significant unevenness, following a “dense east, sparse west” pattern [21]. The distribution features two high-density core areas in North and East China and two secondary high-density areas in South and Southeast China [3], exhibiting spatial clustering characteristics in urban agglomerations such as the Beijing-Tianjin-Hebei region, the Yangtze River Delta, and the Pearl River Delta [22]. At the urban agglomeration scale, the internal spatial differences in ICH are even more prominent. For instance, ICH hotspots in the Beijing–Tianjin–Hebei region are concentrated in node cities such as Beijing, Tianjin, and Handan [23], while sports-related ICH in the Greater Bay Area is clustered in Guangzhou and Foshan [24]. Existing research areas are delineated by administrative divisions, lacking consideration of natural geographical units such as river basins.
Existing studies have confirmed that economic factors such as economic development and urbanization rates are core forces shaping the spatial patterns of ICH [25,26]. Cultural institutions and traditional villages have also been proven to be significant explanatory factors [3,27]. The independent explanatory power of natural factors such as temperature, topography, and climate is limited. However, interaction detection analysis reveals that the interaction between natural and social factors often generates significant enhancement effects [28,29]. Although the interactions of natural factors have received attention, the synergistic effects between the hydrological environment and sociocultural elements remain underexplored.
Driven by the ecological civilization policy, which emphasizes the “protection and promotion of river civilizations”, an increasing number of scholars have examined ICH protection issues from a watershed perspective. Research indicates that ICH resources in the Yangtze, Yellow River basins, and Grand Canal display distinct axial and nodal clustering tailored to local hydro-social conditions [13,30,31,32]. Compared with the above studies, macro-level research investigating the geographic dispersion of ICH across the PRBA remains limited. Existing studies are mainly concentrated in specific subregions, such as Yunnan, Guangxi, Guizhou, and the Greater Bay Area [24,33], while comprehensive comparative analyses that integrate upper, middle, and lower reaches across provincial boundaries are still lacking at the basin-wide scale.
Against this background, this study utilizes the national ICH inventory and multi-source geographic data to address four core questions from a basin-wide perspective: (1) What are the typological structures and spatial distribution characteristics of national-level ICH in the PRBA? (2) What characterizes the spatiotemporal evolution of ICH after the publication of the initial National List in 2006? (3) What are the spatial clustering patterns of the ICH? (4) What are the independent and interactive effects of physical geographic, socioeconomic, and historical-cultural factors, and how do hydrological factors influence the interaction and transmission of national-level ICH within the basin? This study offers two primary contributions. Unlike previous studies, this paper uses natural hydrological boundaries as the study area to identify the spatial pattern of ICH in the PRBA. Furthermore, the study incorporates river density and water resources as hydrological factors within a natural geographical framework to reveal the mechanisms by which hydrological conditions shape the spatial differentiation of intangible cultural heritage. This study has some limitations. Provincial-level intangible cultural heritage lists and township-level statistical data were not included in the scope of this study; therefore, it does not fully reflect the distribution of living heritage. Future research will delve deeper into these micro-scale analyses and incorporate longitudinal data to verify the underlying mechanisms.

2. Materials and Methods

2.1. Research Area

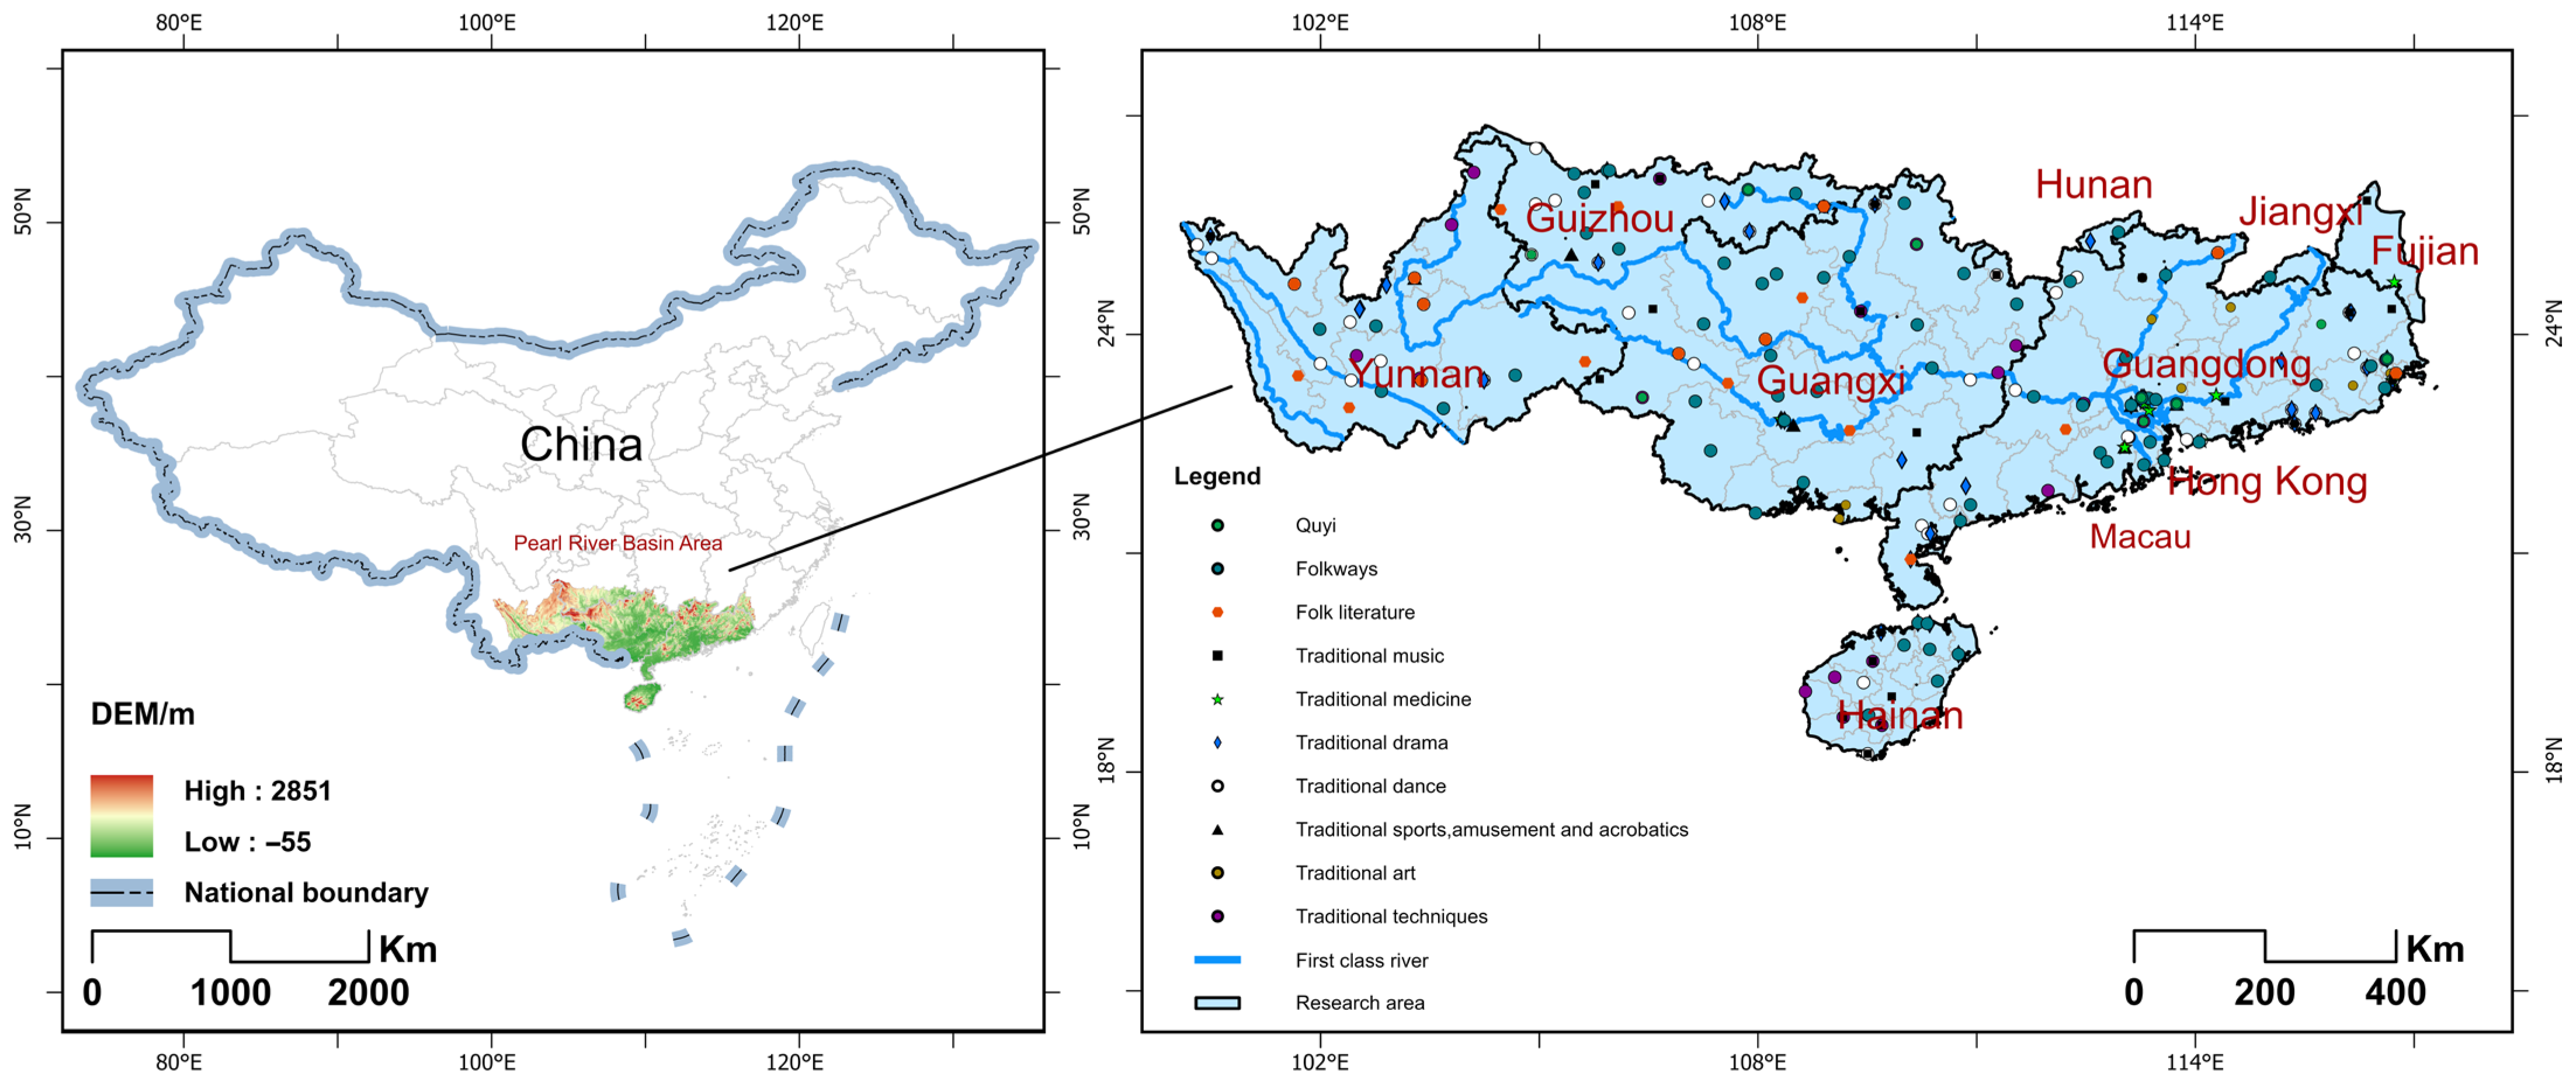
Water systems provide connectivity corridors for the flow and dissemination of cultural elements, and river estuaries, with their advantages in transportation and resources, are more likely to form cultural exchange nodes [34,35]. To reveal the influence of the hydrological environment on the cultural pattern of the river basin, this study takes the Pearl River Basin Area (PRBA) as its object and delineates the research area based on its hydrological and geomorphological characteristics (see Figure 1) [36]. This approach preserves the watershed’s spatial integrity, overcoming the constraints imposed by administrative divisions. The PRBA, defined here as the study region, located in southern China, encompasses the Pearl River Basin, the Han River Basin, the coastal river systems of Guangdong and Guangxi, as well as the river basins of Hainan Province. This region extends across eight provinces (or autonomous regions): Yunnan, Guizhou, Guangxi, Guangdong, Jiangxi, Hunan, Fujian, and Hainan, as well as the Hong Kong and Macao Special Administrative Regions. Within China, the PRBA covers a total area of 654,300 km2 [37]. However, due to differences in statistical standards and the classification of intangible cultural heritage items, Hong Kong and the Macao SARs are excluded from this study.

2.2. Data Resources

The Chinese government has published five batches of the national-level ICH List across the years 2006, 2008, 2011, 2014, and 2021. Based on data from the China Intangible Cultural Heritage [38], this study processed and organized ICH categories, applicant regions, and safeguarding institutions within the defined scope of the PRBA. A total of 377 national-level ICH items (including sub-items) were ultimately selected as the research sample. The geographic coordinates of the ICH items were obtained using Baidu Maps based on applicant regions and safeguarding institutions published on the Heritage Network and converted in ArcGIS 10.7 to compile an ICH database for the PRBA (Figure 1). The base maps used in the figures are derived from Map No. GS(2019)1697 provided by the Standard Map Service website of the Ministry of Natural Resources of the People’s Republic of China [39], with the map boundaries remaining unmodified. Data for natural indicators (e.g., temperature, precipitation, and hydrological parameters) were retrieved from the National Bureau of Statistics [40] and the National Geomatics Center of China [41]. Socio-economic data, covering resident population, urbanization rate, GDP, and the share of the tertiary sector, were collected from local statistical yearbooks, National Population Census records, and Statistical Communiqués. Cultural data were acquired from statistical yearbooks, Statistical Communiqués, and the National Cultural Heritage Administration website [42].

2.3. Research Methods

Regarding research methods, existing studies commonly employed kernel density estimation, nearest neighbor index, Moran’s I, and hotspot analysis to identify the spatial patterns of ICH. The directional characteristics of ICH spatial distribution have also been investigated via the Standard Deviational Ellipse [43]. Meanwhile, the geographical detector and multiscale geographically weighted regression are widely applied to identify influencing factors and their spatial heterogeneity [44,45], and some studies have further incorporated coupling models to examine the interrelationships among factors [46]. To address the four research questions proposed earlier, this study adopted the PRBA as the research area and applied ArcGIS10.7 analytical tools, together with the nearest neighbor index, kernel density analysis, standard deviational ellipse analysis, and the geographical detector, to examine the spatial distribution characteristics, spatial evolutionary patterns, and drivers affecting national-level ICH distribution within the PRBA.

2.3.1. Lorenz Curve and the Imbalance Index

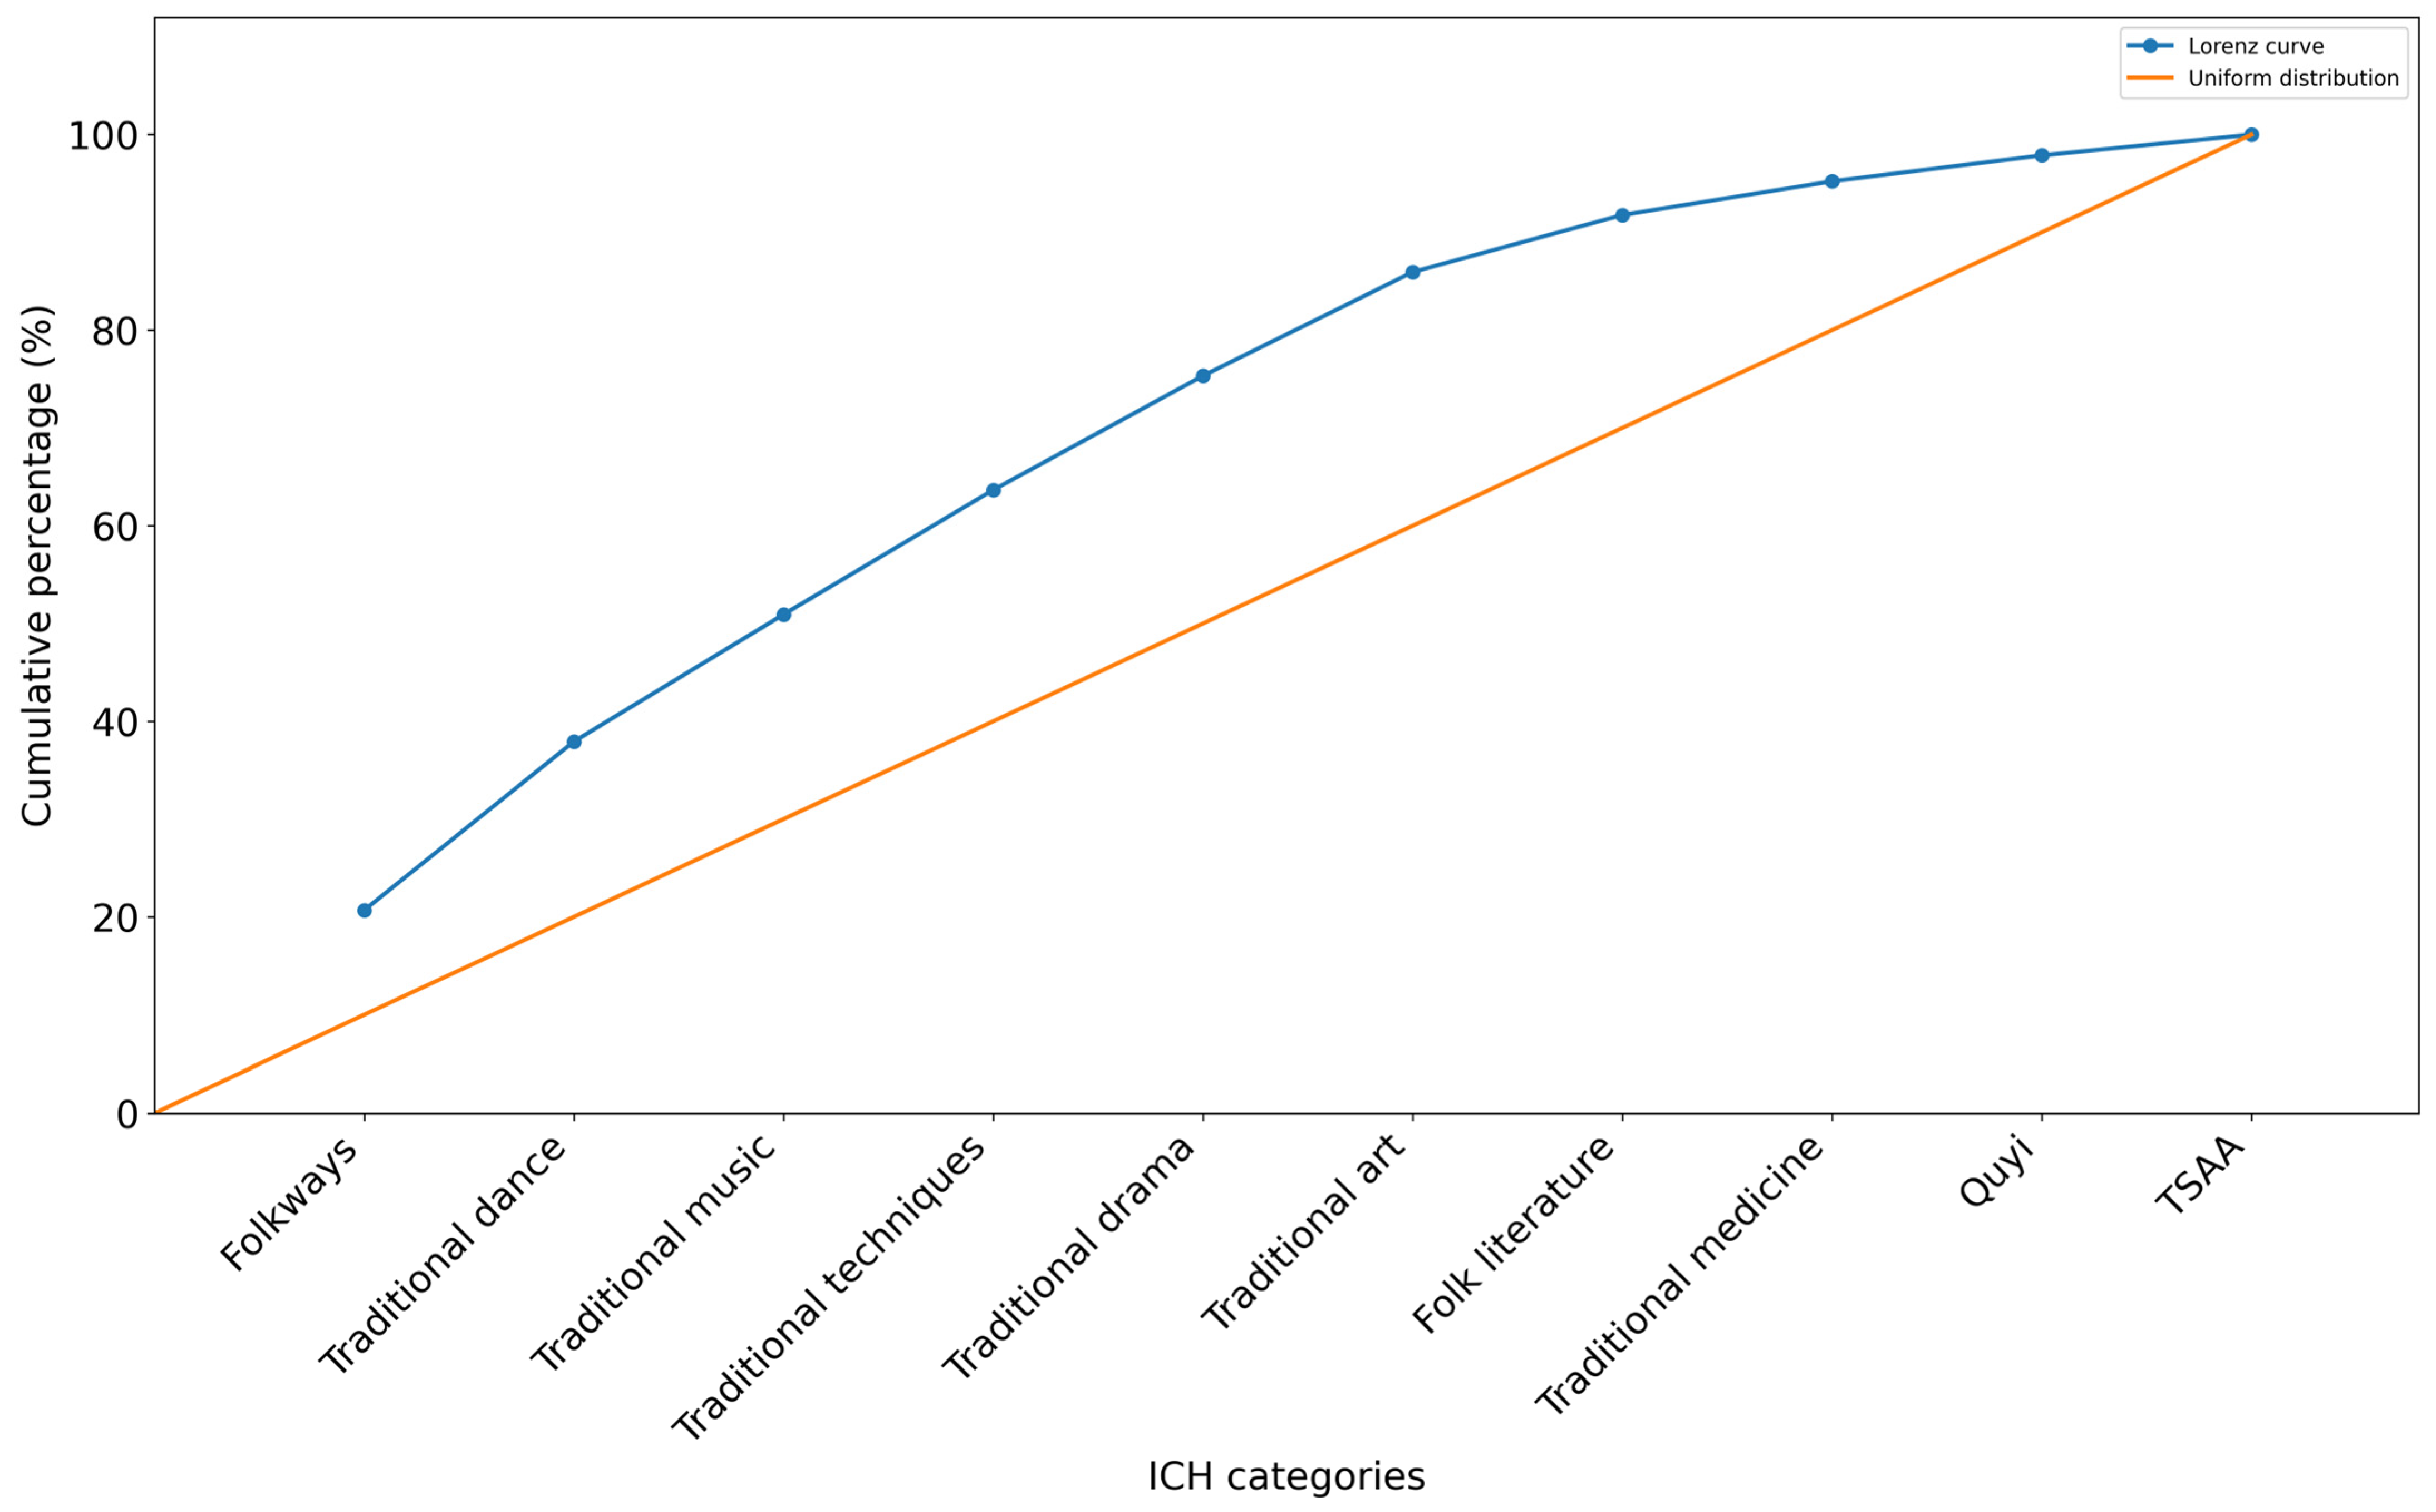
The Lorenz curve and Imbalance Index were used to assess the concentration levels of national-level ICH across various categories [33,47]. The calculation formula is given by:
S = i = 1 n Y i 50 n + 1 100 n 50 n + 1
In this equation, S denotes the imbalance index of ICH; n represents the total number of the ten national-level ICH categories in the PRBA; Y i denotes each category’s share of the total number of ICH items in the PRBA. The value of S ranges from 0 to 1. As the value of S approaches 1, it implies that the distribution of ICH items is relatively unbalanced among all categories; conversely, a value nearing 0 denotes a balanced distribution among all categories. The greater the curvature of the Lorenz curve, the more it deviates from the uniform line, and the more uneven the distribution of ICH types.

2.3.2. The Nearest Neighbor Index

ICH is conceptualized as a set of point features, whose spatial patterns can be categorized as random, clustered, or dispersed. This study employs the Nearest Neighbor Index (NNI) to determine the distribution type [48]. The calculation formulas are as follows:
R = r o ¯ r e ¯ ,   r o ¯ = 1 N i = 1 N d i ,   r e ¯ = 1 2 N / A
In these equations, R denotes the average nearest-neighbor ratio, r o ¯   represents the observed mean distance to the nearest neighbor, r e ¯ represents the expected mean nearest-neighbor distance, d i is the distance from point i to its nearest neighbor. N refers to the total count of spatial points, and A represents the geographic extent of the research area. The R value serves as the evaluation criterion: when R > 1, the spatial distribution of ICH sites tends toward uniformity, where higher values indicate a greater degree of dispersion. When R = 1, the distribution approaches randomness. When R < 1, the distribution tends toward clustering, and smaller R values indicate a higher degree of clustering.

2.3.3. The Standard Deviational Ellipse

To analyze the spatial centrality, dispersion, and directionality of the study objects, this paper employs the Standard Deviational Ellipse (SDE) to describe the spatial evolution of five batches of national-level ICH lists. The SDE uses the mean center as the ellipse centroid, and the two principal axes derived from the sample covariance matrix as the major and minor axes, indicating the directions of maximum and minimum dispersion; the ellipse orientation represents the dominant trend [23,49]. The ellipse constructed from the standard distances along the principal axis and its perpendicular direction encompasses the overall distribution, and its area quantifies overall dispersion: a smaller area and smaller difference between the major and minor axes indicate stronger clustering and weaker directionality, and vice versa.
S D E x = i = 1 n ( x i X ¯ ) 2 n
S D E y = i = 1 n ( y i Y ¯ ) 2 n
S D E x and S D E y denote the axial lengths of the standard deviational ellipse along the x- and y-axes, respectively. x i and y i represent the spatial coordinates of each ICH item, while X ¯ and Y ¯ signify the average spatial positions of all heritage resources across the region. Additionally, n denotes the aggregate number of ICH items.

2.3.4. The Kernel Density Estimation

Kernel density estimation (KDE) effectively reveals specific clusters and the intensity of resource concentration [50]. Therefore, KDE is employed to quantify the spatial clustering characteristics of national-level ICH sites in the PRBA, as follows:
f x = 1 n h i = 1 n k x x i h
In the above formula, k denotes the kernel function, n is the total number of ICH points, and h represents the bandwidth. The term x x i refers to the Euclidean distance between the estimation location x and the i-th ICH point x i . The bandwidth h controls the degree of smoothing: a larger h produces a smoother and more generalized surface, while a smaller h preserves more local detail.

2.3.5. The Geographical Detector

The Geographic Detector is well suited for analyzing the spatial heterogeneity of cultural heritage, as it can identify non-linear relationships between ICH distribution and influencing factors. Furthermore, this method excels at quantifying interaction effects between factors, which helps to reveal the synergistic mechanisms driving the spatial patterns of ICH in the PRBA [51].
q = ( N σ 2 h = 1 L N h σ h 2 ) / N σ 2
In the above equation, q represents the explanatory power of a factor in the geographical detector model, while σ h 2 and σ 2 denote the within-category variance and the overall variance, respectively. In the calculation, one must input the total sample size N and its overall variance σ 2 , as well as the sample size N h and variance σ h 2 for each category of the influencing factor (with L categories in total). The q value reflects the factor’s contribution to the spatial differentiation of ICH, with values approaching 1 indicating stronger explanatory power.

3. Results

3.1. Structural Distribution Characteristics of ICH in the PRBA

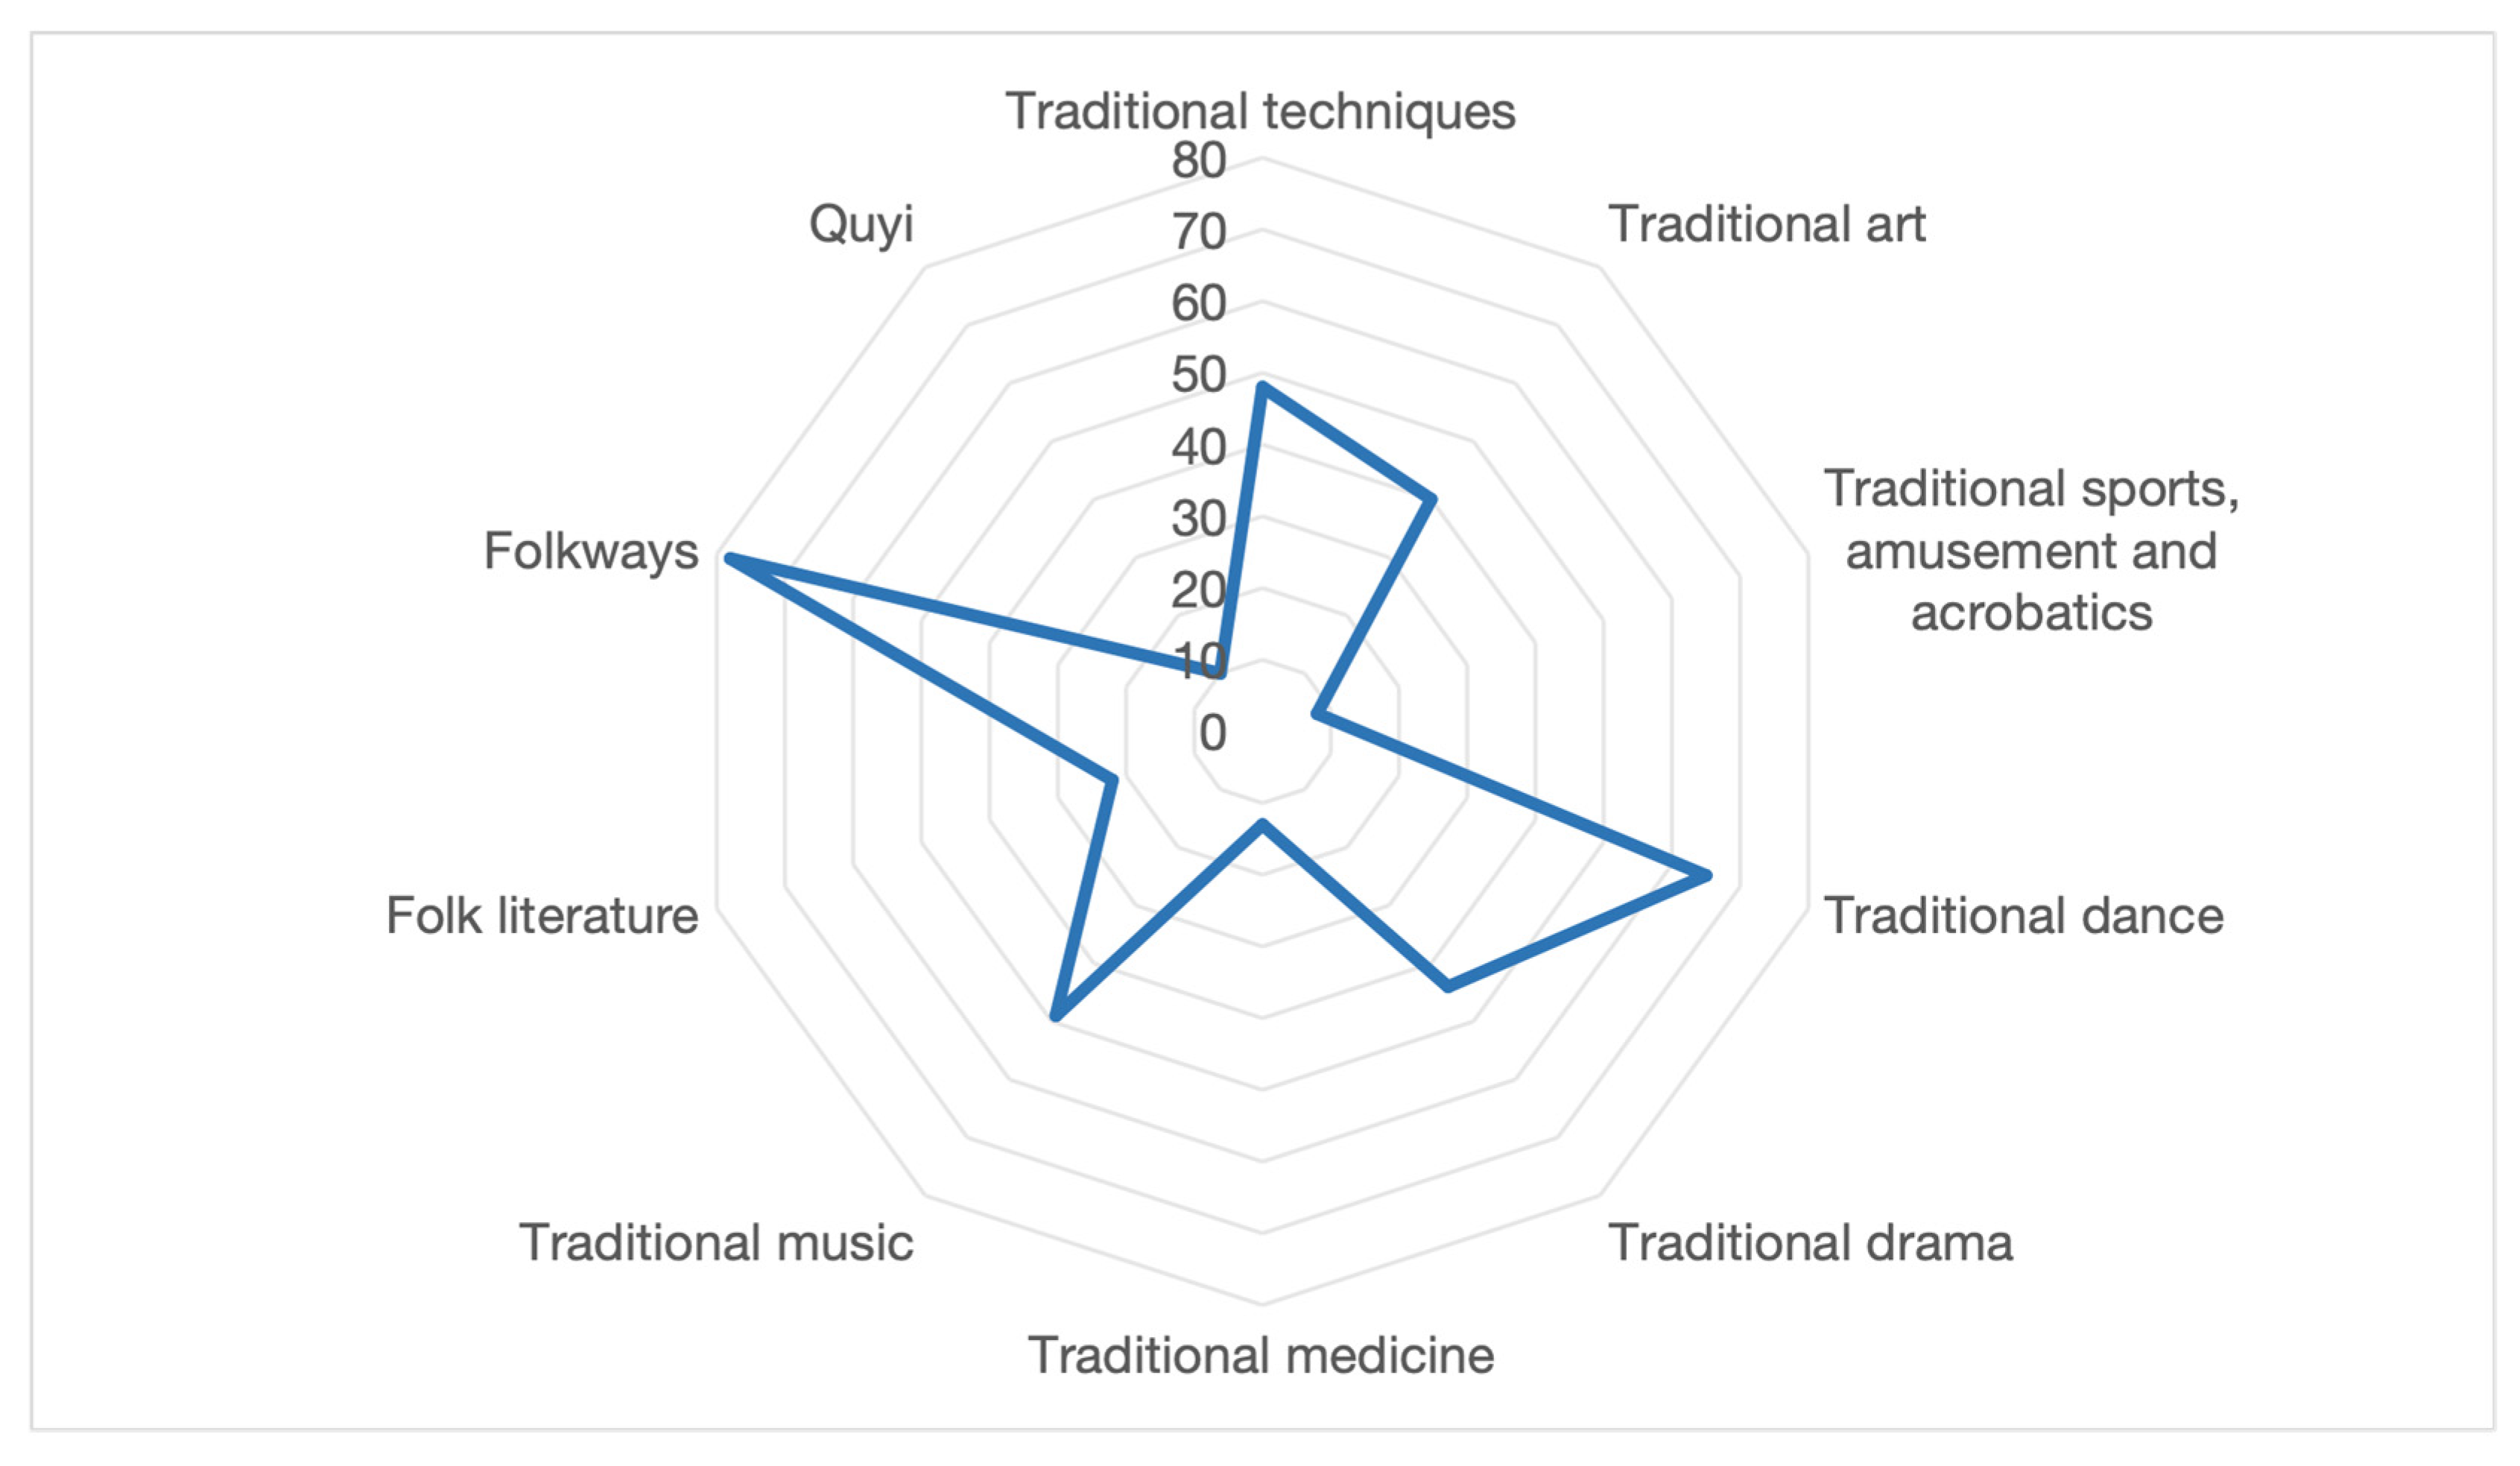
Based on Equation (1), the Lorenz curve for intangible cultural heritage (ICH) was derived (Figure 2), and the calculated Imbalance Index was 0.3764. As shown in the figure, the Lorenz curve exhibited a convex shape and deviated considerably from the line of uniform distribution, indicating that the ICH items within the Pearl River Basin Area (PRBA) were unevenly distributed. In addition, this study conducted a visual analysis of the structural characteristics of the 377 ICH items in the PRBA (Figure 3). Specifically, Folkways and traditional dance were the largest categories, accounting for 20.69% and 17.24% of the total, respectively. These were followed by traditional music, traditional techniques, traditional drama, and traditional art, whose proportions were relatively balanced, each ranging between 10% and 13%. By contrast, the quantity of ICH items in folk literature, traditional medicine, and Quyi was comparatively small, representing 5.84%, 3.45%, and 2.65%, respectively. TSAA accounted for the smallest share, at only 2.12%. To gain deeper insights into the structural attributes of ICH assets across the PRBA, this study conducted a further analysis from both the watershed perspective and the prefecture-level city perspective.
The Pearl River Basin Water Resources Bulletin categorizes the PRBA into ten secondary water-resource regions, including the Nanpan–Beipan River Basin, the Hong–Liu River Basin, the Pearl River Delta, the Han River Basin, and the river basins of eastern Guangdong, among others. From the overall watershed perspective (see Table 1), traditional music ICH was primarily distributed in Hainan Island and the South China Sea river basins, accounting for 22.45%. Traditional dance ICH was highly concentrated in the Nanpan–Beipan River Basin, with a share of 16.92%. Traditional drama and traditional art were mainly found in the Han River and eastern Guangdong river basins, accounting for 25.00% and 40.00%, respectively. Meanwhile, traditional medicine and TSAA were predominantly concentrated in the Pearl River Delta, representing 46.15% and 62.50%, respectively. Folkways ICH was highly concentrated in the Hong–Liu River Basin.
In terms of the municipal-level analysis (Table 2), the distribution of ICH resources across the PRBA’s 66 cities revealed distinct spatial disparities. Guangzhou held the largest number of items in three categories: TSAA, traditional techniques, and traditional medicine, demonstrating the diversity of its ICH resources. Chaozhou stood out in traditional art, accounting for 20.00%. Nanning and Shenzhen each dominated in traditional drama and traditional dance. Meanwhile, folkways ICH was concentrated in Hechi, accounting for 8.97%.

3.2. Spatial Cluster Analysis of ICH in the PRBA

The computation of the nearest-neighbor index for national-level ICH in the PRBA was performed via Equation (2) (Table 3). The results indicated that the national-level ICH in the PRBA exhibited a significantly clustered spatial pattern overall, with substantial variation across different ICH categories. Among the categories, folkways, traditional music, traditional drama, traditional dance, traditional art, and traditional techniques all had nearest-neighbor ratios below 1 with p < 0.05, indicating statistically significant clustering. Traditional art presented the lowest nearest-neighbor ratio, exhibiting the most pronounced clustering pattern. In contrast, folk literature and TSAA had nearest-neighbor ratios above 1 with p < 0.05, reflecting a significantly uniform distribution. The nearest-neighbor ratios for Quyi and traditional medicine also exceeded 1, but with p > 0.05, indicating a random spatial distribution. Collectively, 324 items in six categories exhibited clustered distributions, 30 items in two categories exhibited uniform distributions, and 23 items in two categories exhibited random distributions.
Regarding the temporal evolution of ICH inscription batches, the nearest-neighbor ratios for the five ICH batches (2006–2021) in the PRBA were all below 1, indicating that each batch exhibited a clustered spatial pattern (Table 4). Specifically, the first two batches had notably lower NNI values, demonstrating a stronger clustering tendency compared with the later batches. Since 2008, the NNI has shown a marked increase, followed by a slight decline and stabilization. Although spatial distances increased and clustering intensity weakened marginally in the later batches, the overall pattern remained significantly clustered. This suggests that future conservation policies should therefore place greater emphasis on achieving spatial balance across regions to promote coordinated protection of ICH resources.

3.3. Spatial Evolution Characteristics of ICH in the PRBA

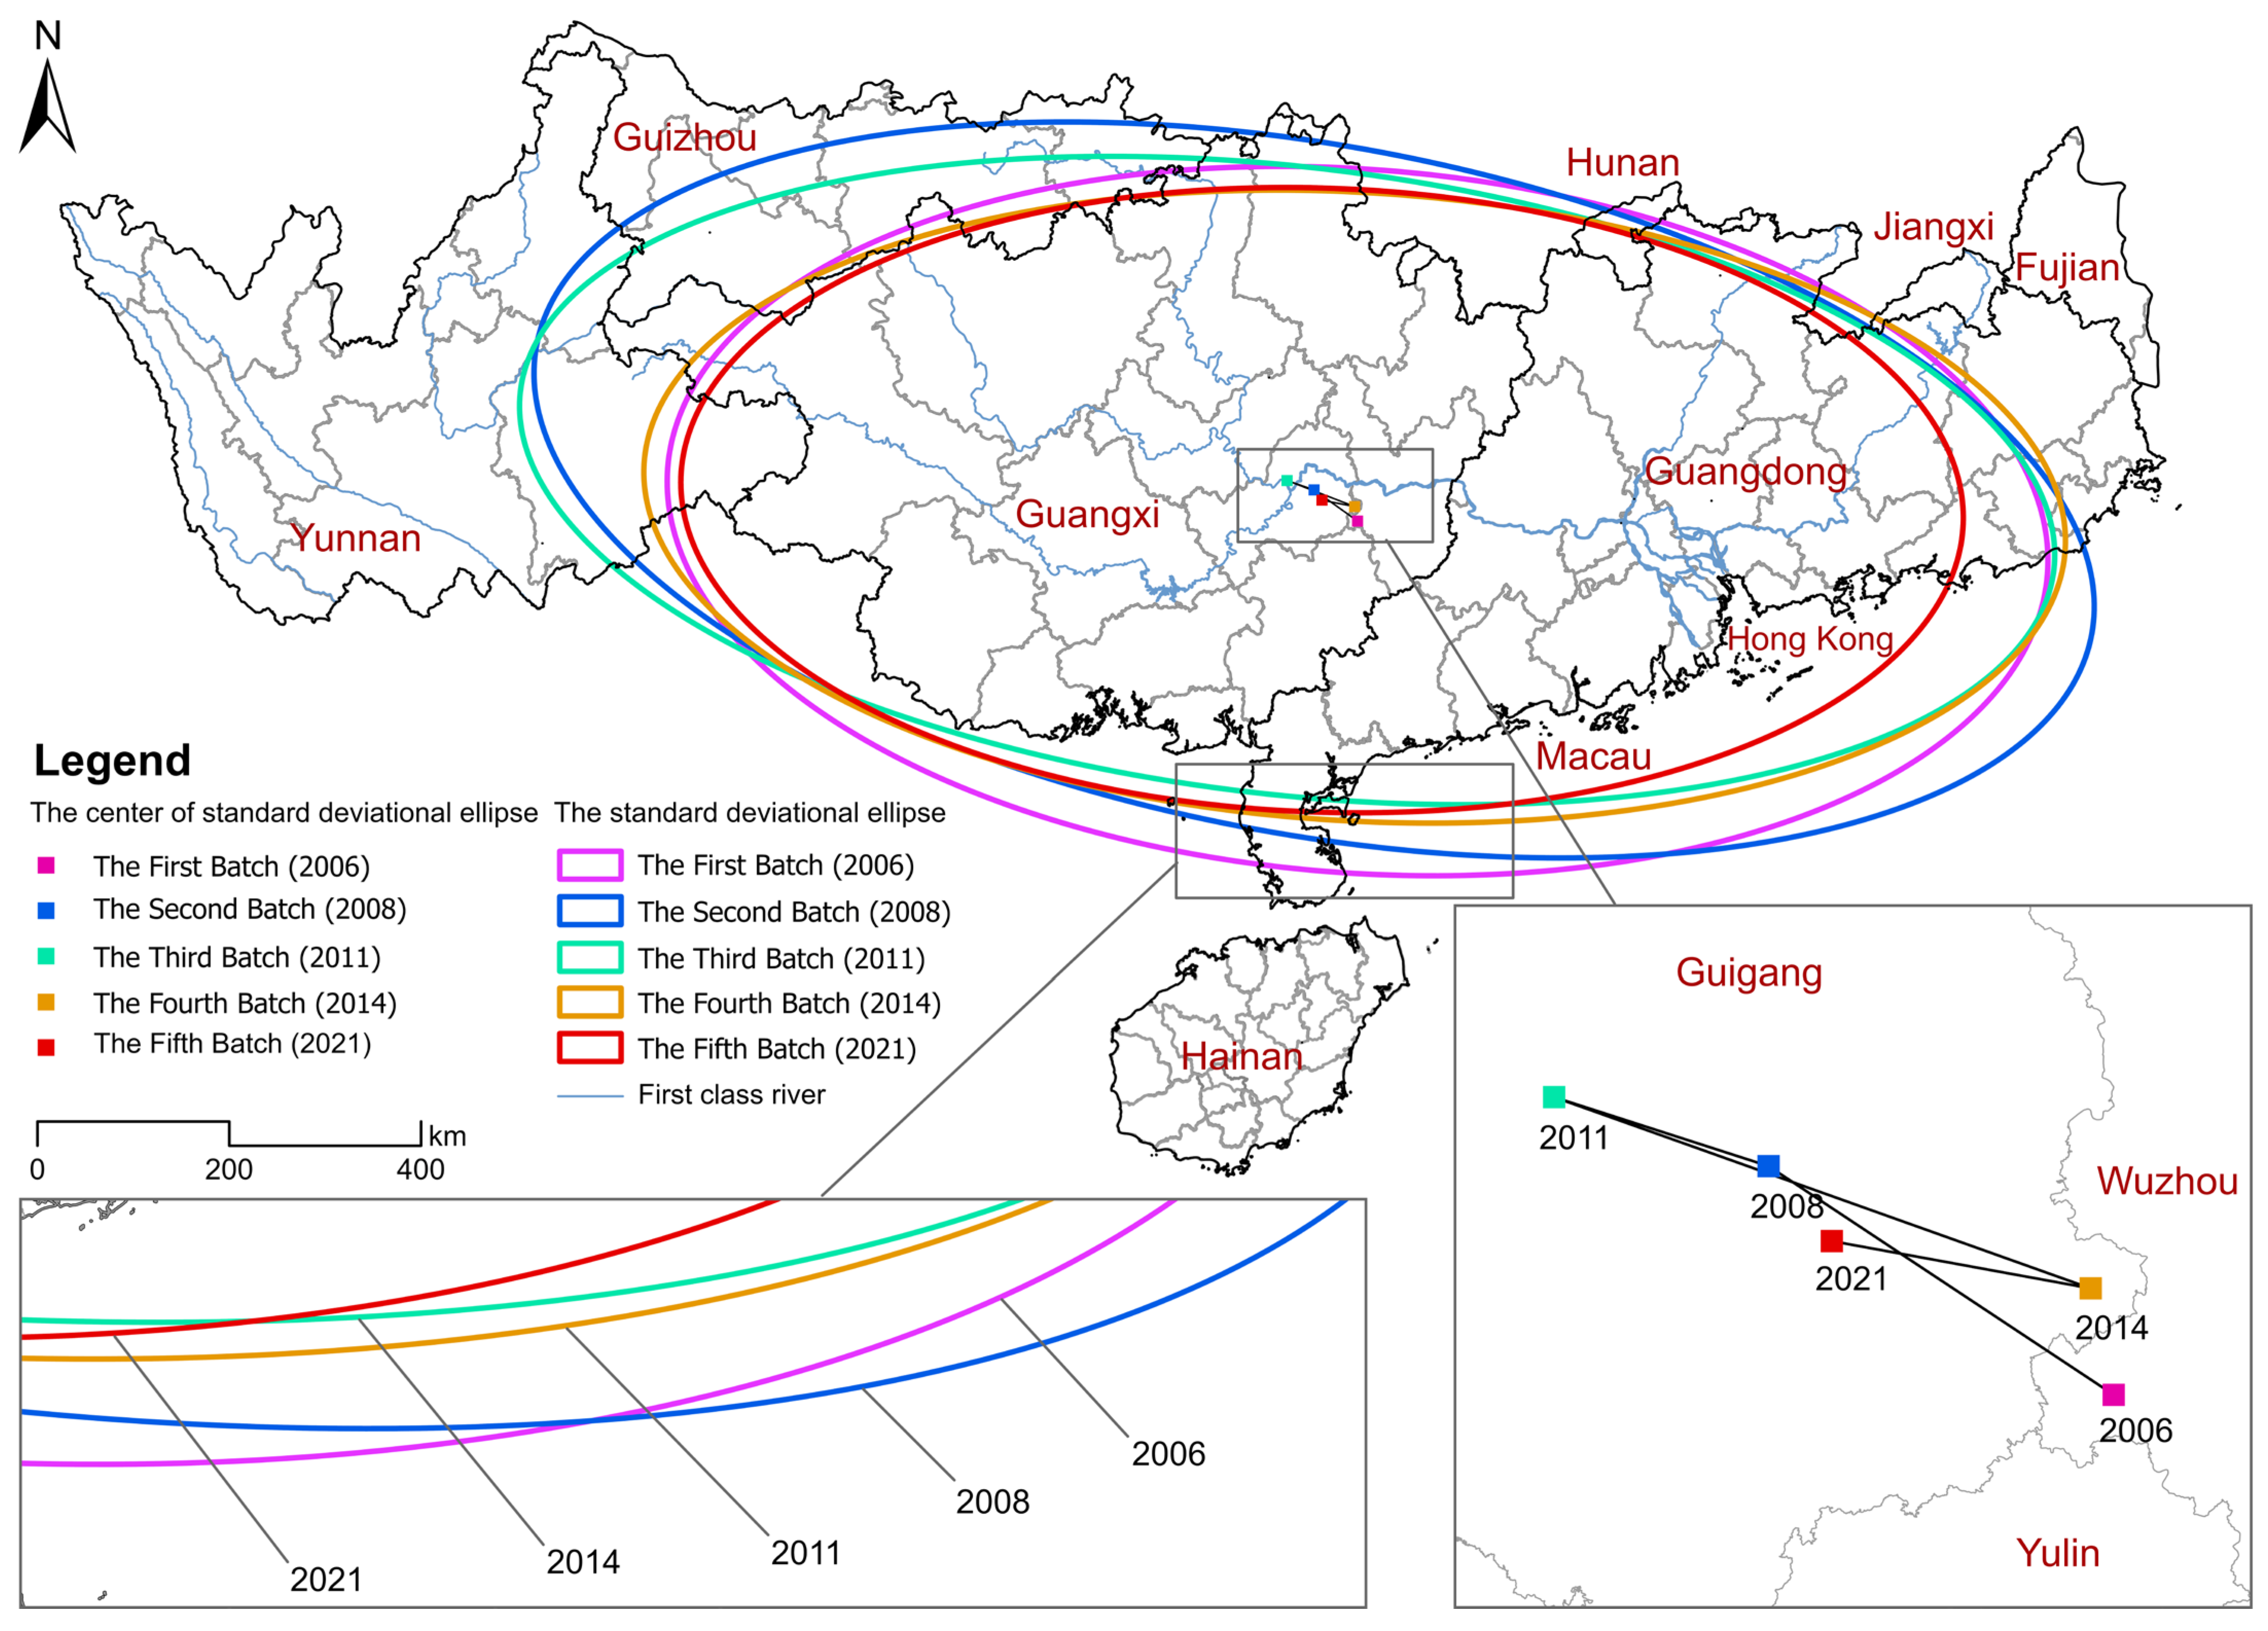
By applying the standard deviational ellipse method, this study mapped the ellipses and centroid trajectories of five batches of ICH items in the Pearl River Basin Area (Figure 4). The results indicated that, between 2006 and 2021, the centroid of national-level ICH in the PRBA generally shifted from the southeast toward the northwest. Specifically, the centroid was located in southeastern Guangxi (the Yulin–Wuzhou area) in 2006, moved markedly toward Guigang between 2008 and 2011, then temporarily shifted back to the southeast after 2014, and eventually returned to a position slightly east of central Guangxi by 2021. Across all periods, the major axis of the SDE was substantially longer than the minor axis, with the primary orientation running approximately east–west, displaying a slight northwest–southeast tilt and minor angular adjustments over time. The total area covered by the ellipses exhibited an overall contraction trend, characterized by modest expansion in the mid-period and subsequent reconcentration. This pattern suggests that the core area of ICH resources in the PRBA has gradually stabilized, accompanied by improved spatial equilibrium.
The formation of this spatiotemporal pattern was closely linked to the combined influence of regional nomination capacity and the policy environment. Before 2006, under the guidance of documents such as the Opinions of the General Office of the State Council on Strengthening the Protection of China’s Intangible Cultural Heritage and the Notice of the Ministry of Culture on Conducting a Census of Intangible Cultural Heritage, large-scale surveys of ICH items were launched nationwide. Subsequently, systematic guidelines were introduced through the release of interim measures targeting both national ICH protection and the identification of representative inheritors. These policies addressed recognition procedures, support mechanisms, and training, thereby yielding significant achievements in the national ICH census. In 2011, the enactment of the Law of the People’s Republic of China on Intangible Cultural Heritage and the Guiding Opinions of the Ministry of Culture on Strengthening the Productive Protection of Intangible Cultural Heritage, among other key regulations, further tightened the selection criteria and enhanced quality control mechanisms for ICH items. Overall, policy regulation and structural optimization have driven the spatial pattern of ICH to exhibit an evolutionary trend from dispersion toward concentration.

3.4. Density Distribution Characteristics of ICH in the PRBA

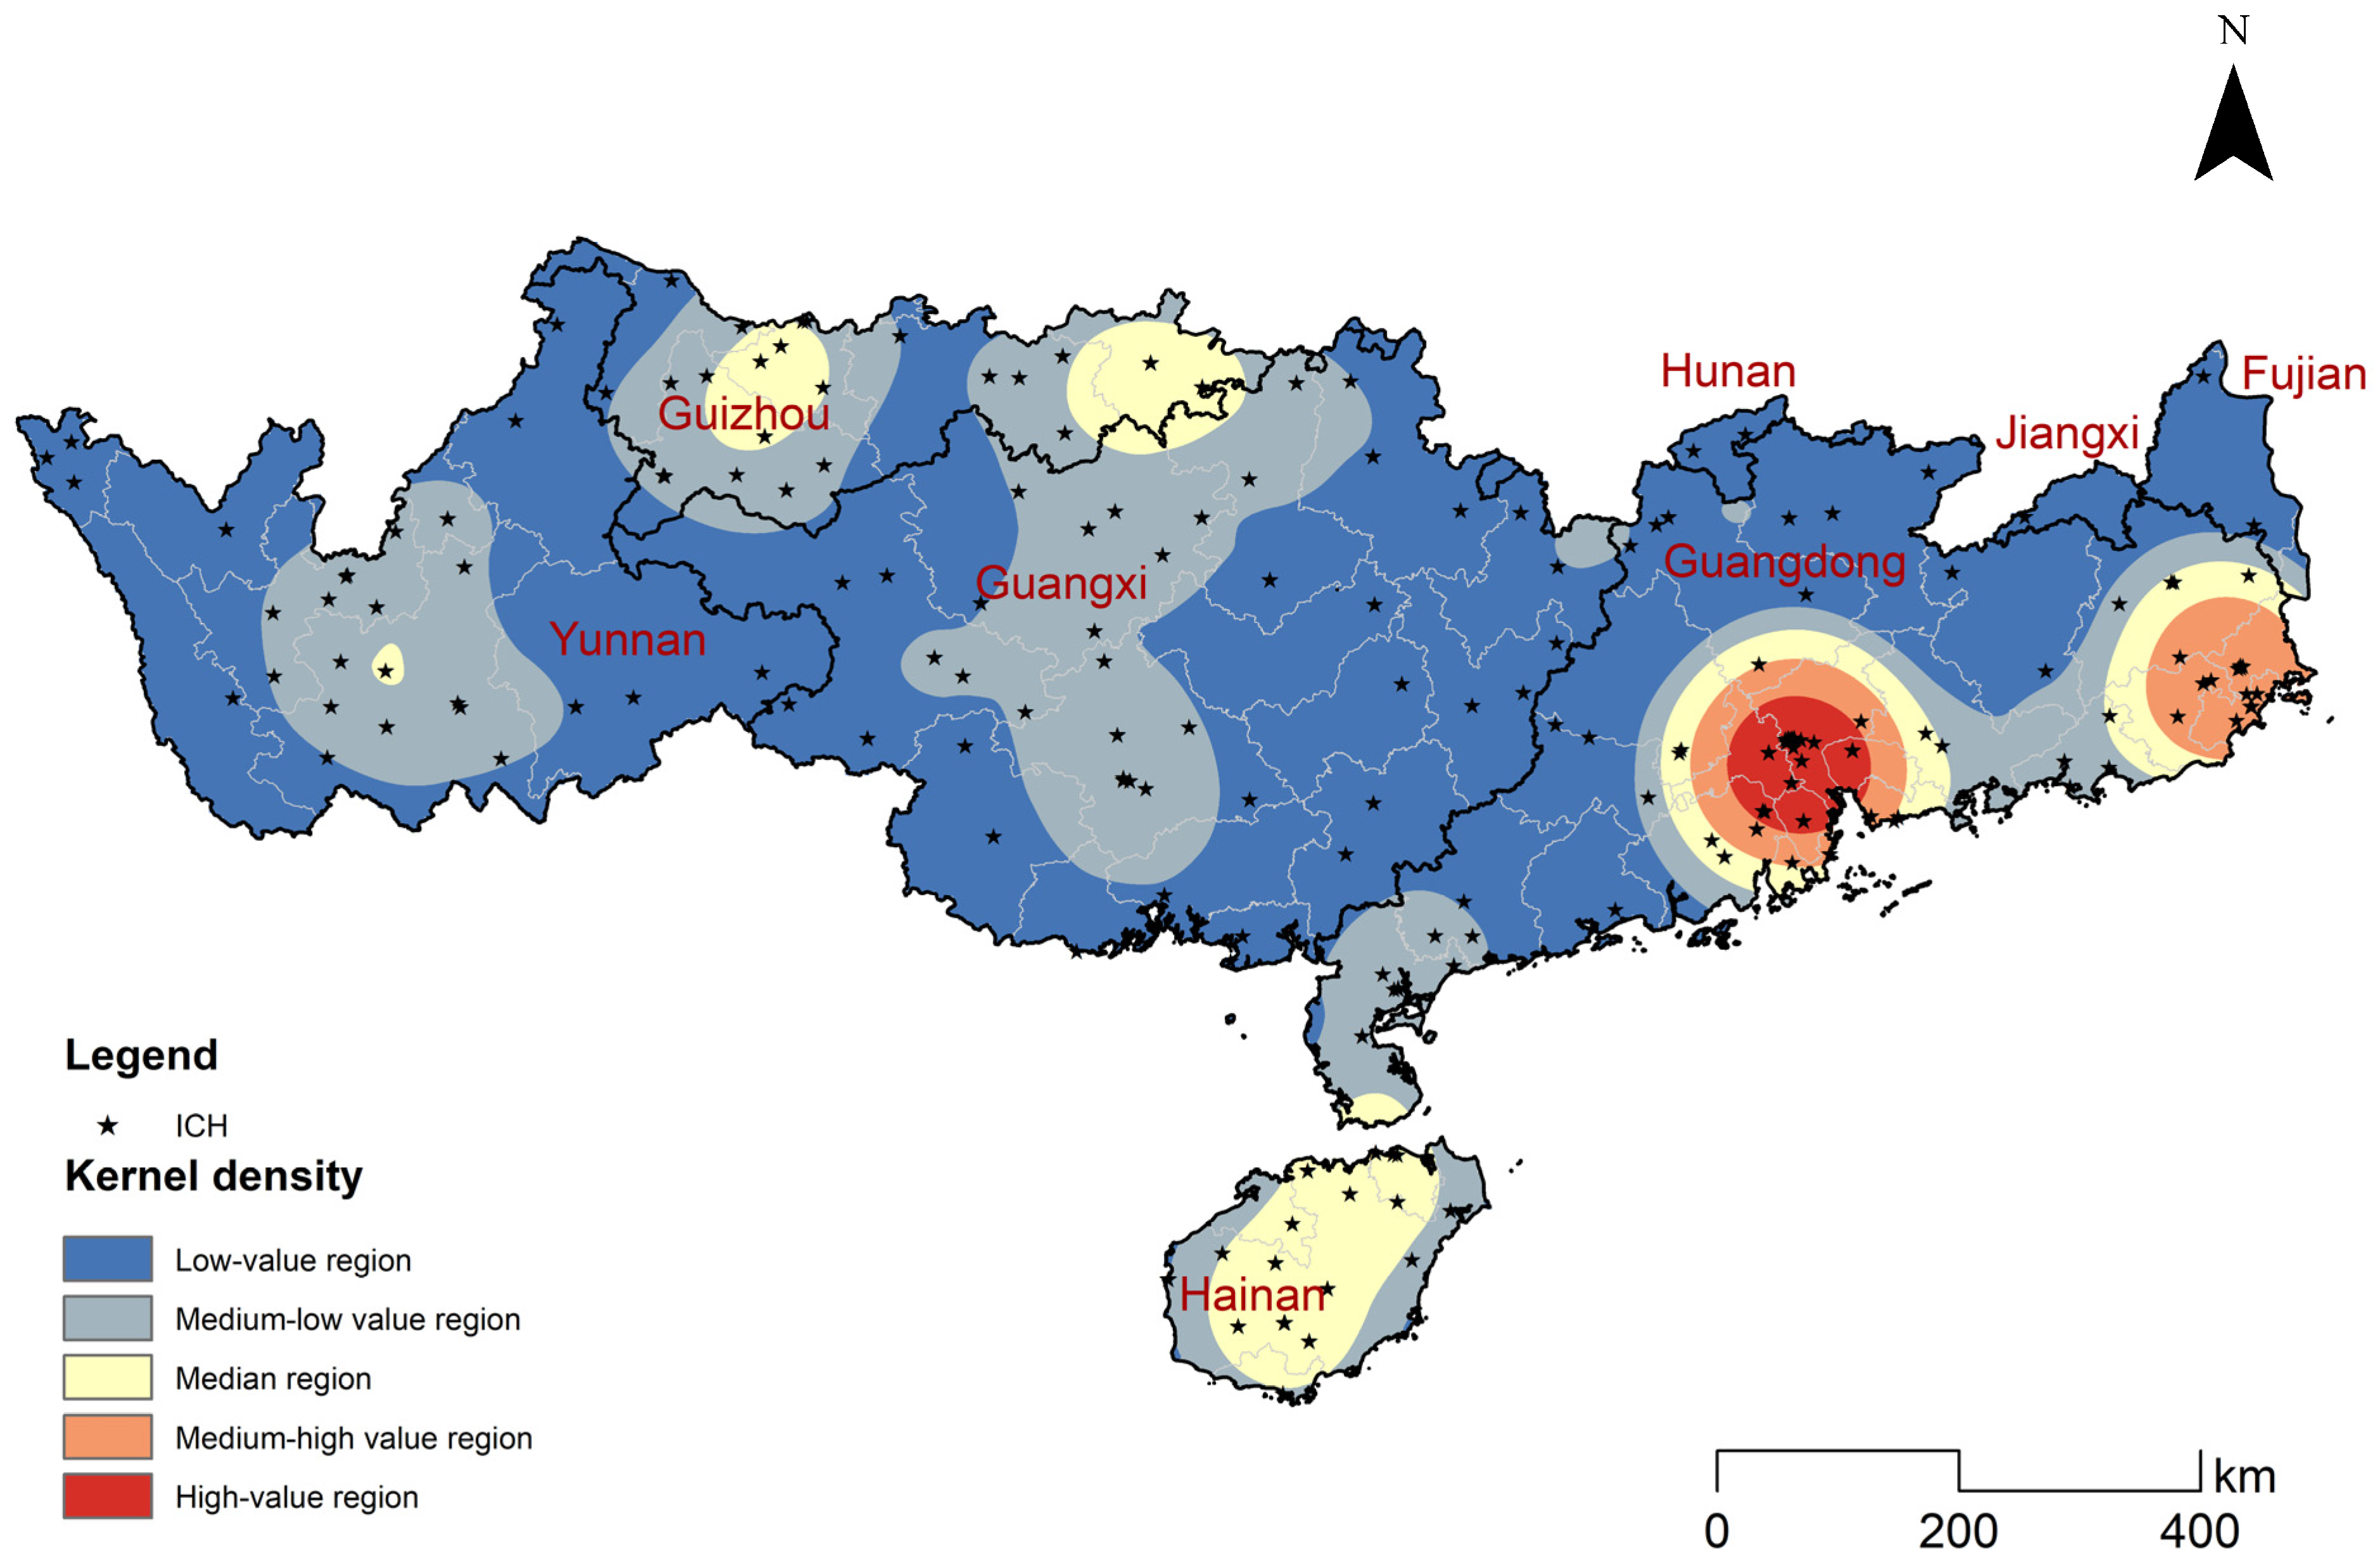
Kernel Density Estimation (KDE) was employed to visualize the spatial clustering of national-level ICH resources in the PRBA (Figure 5), revealing distinct regional density characteristics. The highest-density areas were concentrated along the mid-eastern coast of Guangdong Province, particularly in the Pearl River Delta cities such as Guangzhou, Foshan, Shenzhen, and Dongguan. These areas formed a core high-value cluster, represented in red, which extended toward eastern and western Guangdong, creating a belt-like zone of medium to high density. Additional secondary density clusters appeared in the southeastern coastal area of Fujian (e.g., southern Zhangzhou), the northern to central parts of Hainan Island, and the southwestern and southeastern regions of Guizhou. Central Guangxi (e.g., Nanning, Baise, and Hechi), the Qiannan and Qiandongnan autonomous prefectures of Guizhou, as well as Honghe Hani and Yi Autonomous Prefecture, Yuxi, and Kunming in central Yunnan, exhibited scattered medium-to-low density clusters.
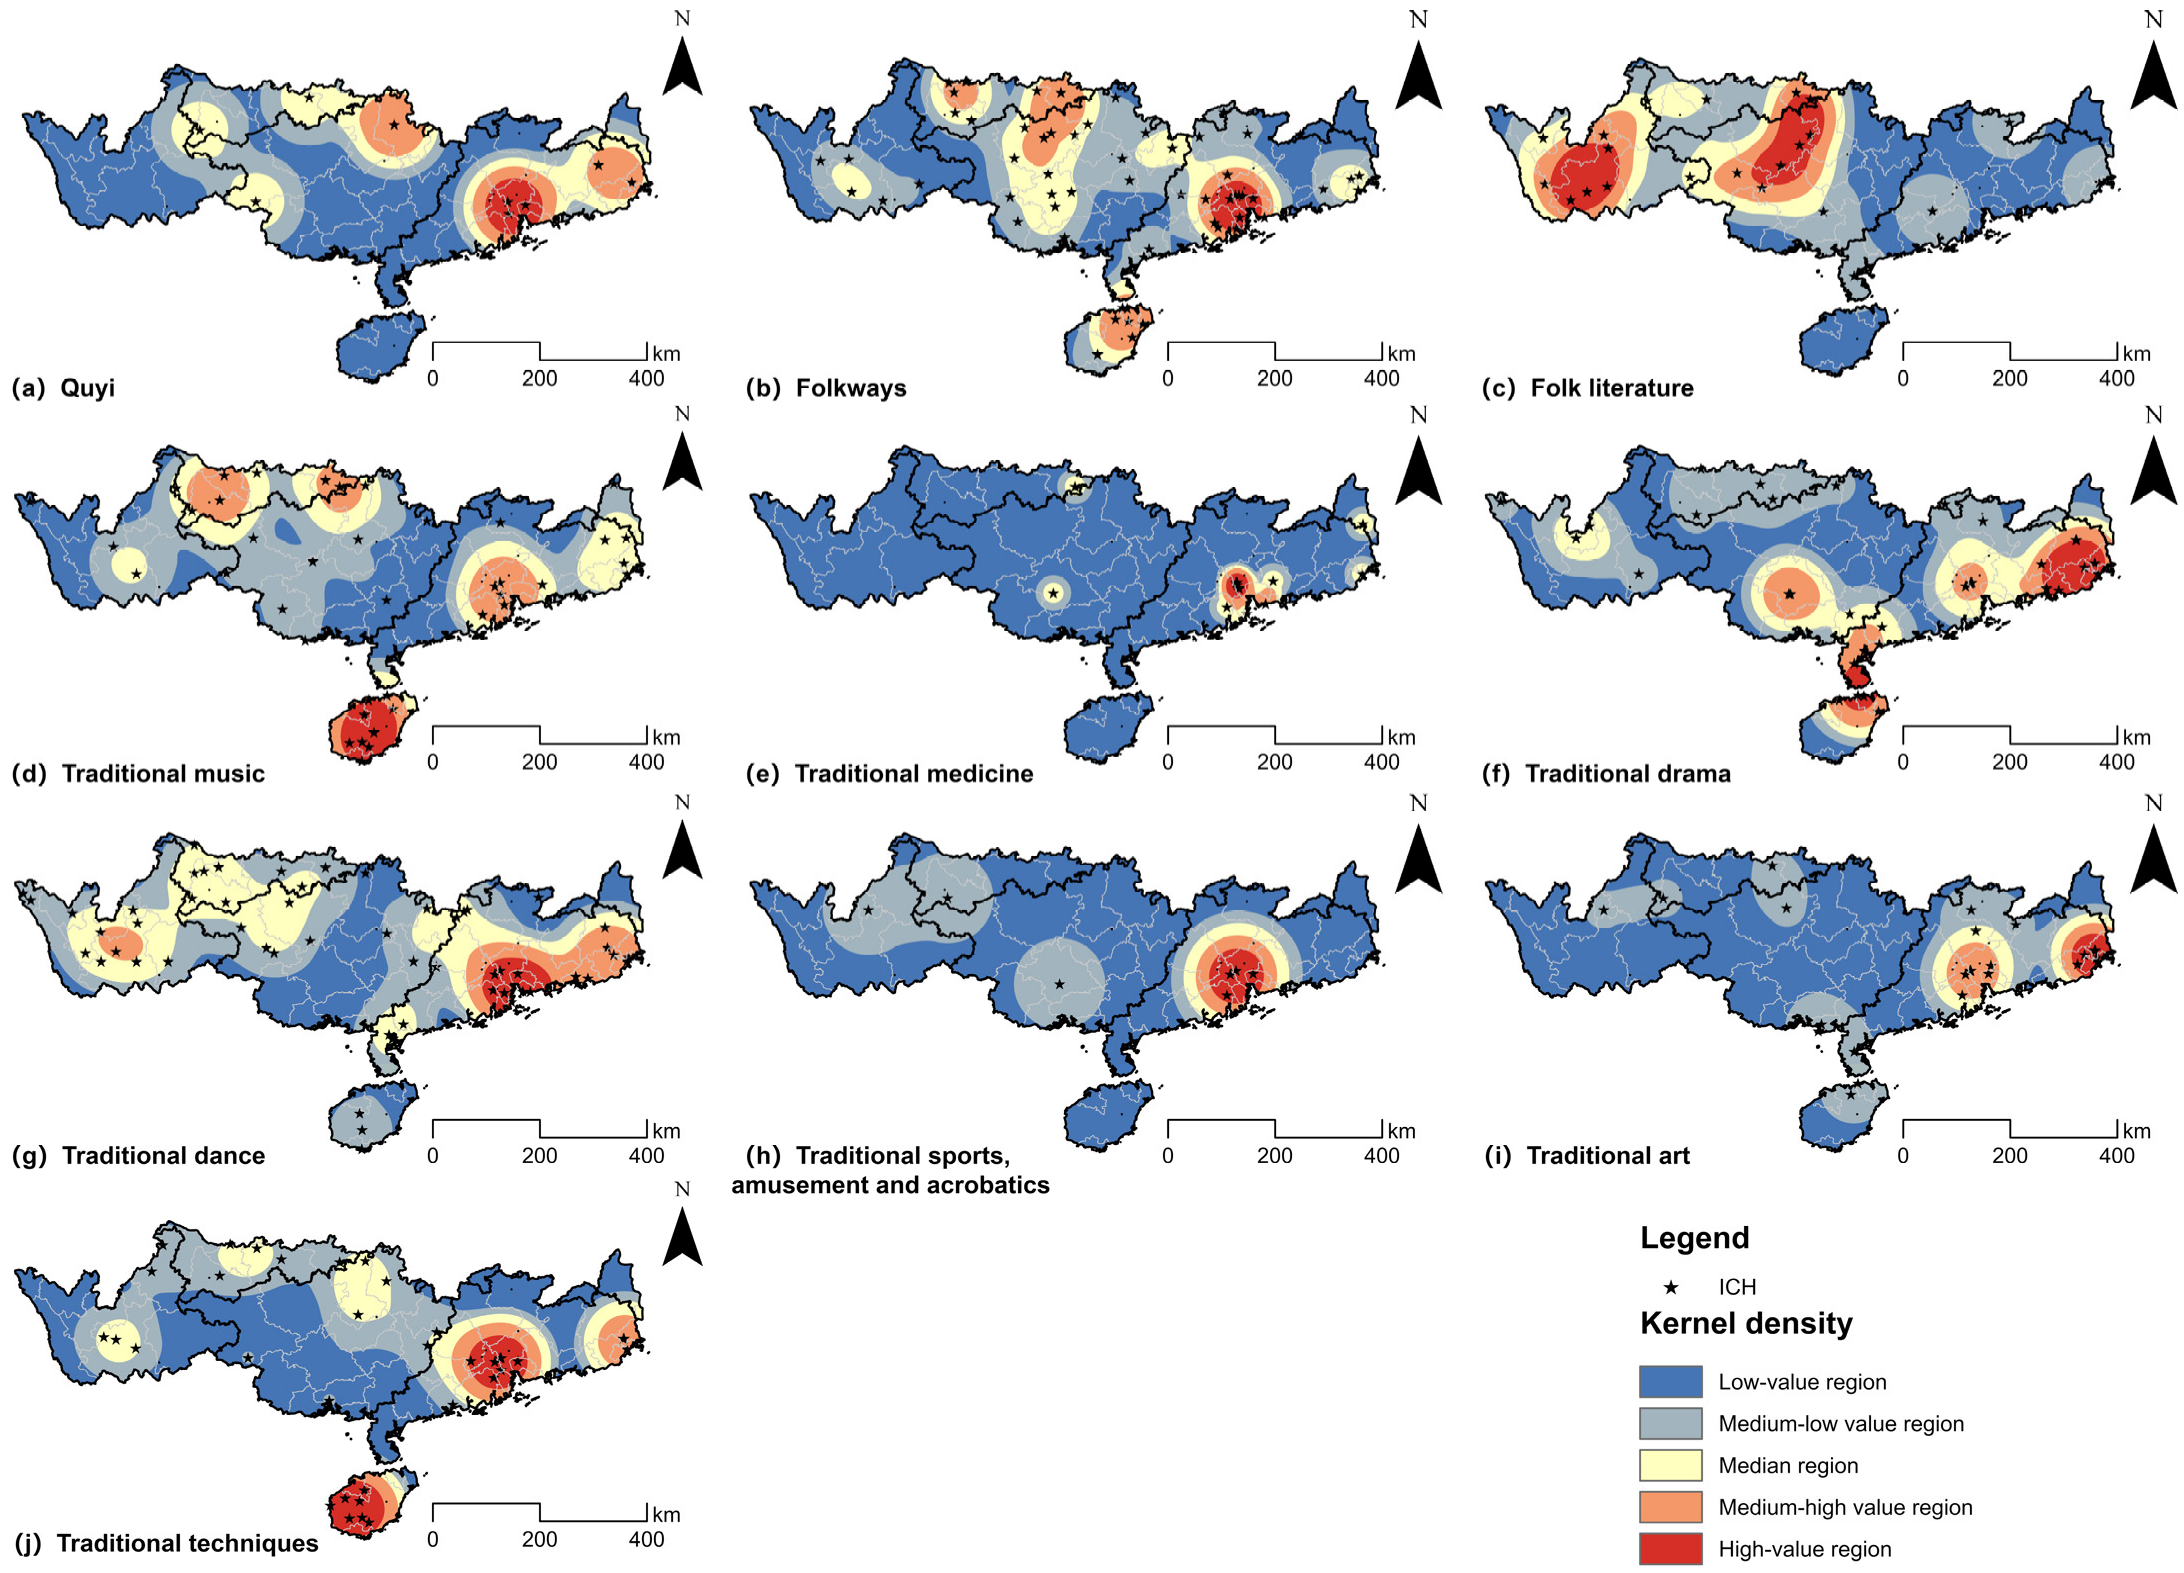
To investigate the spatial agglomeration characteristics of ICH in greater depth, this study produced kernel density maps for ten ICH categories in the PRBA. The results showed clear spatial heterogeneity among categories (Figure 6). Quyi were mainly distributed across the eastern reaches of the basin, creating a major hotspot within the Pearl River Delta, with secondary clusters along the eastern Guangdong coast and in northeastern Guangxi (Figure 6a). The Folkways category, which contained the highest quantity of ICH resources, showed a wide distribution. It displayed high density in the Pearl River Delta and secondary high-density areas in northeastern Hainan, northern Guangxi, and southeastern and southwestern Guizhou (Figure 6b). Traditional music had a high-density center in Hainan, along with three secondary-density areas in the Pearl River Delta and in southeastern and southwestern Guizhou (Figure 6d). Traditional medicine was strongly concentrated within a single core area in the Pearl River Delta (Figure 6e). Traditional drama was mainly concentrated in Guangdong and Hainan Province (Figure 6f), while traditional dance formed an arc-shaped high-value zone from the Pearl River Delta to eastern Guangdong (Figure 6g). Traditional sports, amusement, and acrobatics, which were the smallest category, clustered only in the Pearl River Delta (Figure 6h). Traditional art formed high and medium-high-density cores in eastern Guangdong and the Pearl River Delta (Figure 6i). Traditional techniques were concentrated in the Pearl River Delta and Hainan and formed a belt-like pattern across Yunnan, Guizhou, and Guangxi (Figure 6j). In contrast, folk literature showed a clear inland shift in its high-density areas. It was mainly concentrated in northwestern Guangxi and southern Yunnan, while coastal areas were mostly at medium-to-low density levels (Figure 6c). Overall, the ICH categories presented a pattern of coastal concentration and inland dispersion. The Pearl River Delta served as the core area for most categories, while eastern Guangdong often acted as a secondary core. Hainan was more prominent in traditional music and techniques, and inland Guangxi had a relative advantage in folk literature.

3.5. Driving Factors of ICH Spatial Distribution in the PRBA

Building on the preceding literature review and spatial analysis, and referencing relevant studies [23,31,33], this study employed the Geographical Detector model to evaluate the independent and interactive effects of 13 driving variables (Table 5). In the physical geography dimension, in addition to conventional indicators such as temperature, precipitation, and elevation, river network density and water resource volume were incorporated to capture the specific influence of hydrological factors on the distribution of ICH in the PRBA. While water resource volume has been utilized as a driving factor in Geographical Detector analyses to explain topics such as the spatial distribution of nature reserves and water resource carrying capacity [52,53], its synergistic effects with socio-cultural elements in the context of ICH remain underexplored. The socio-economic dimension is characterized by the year-end permanent resident population, GDP, urbanization rate, tertiary industry proportion, and road network density. Finally, the historical and cultural dimension is reflected by cultural institutions, traditional villages, and national priority protected sites.
The Geographical Detector analysis indicated that the year-end permanent resident population, cultural institutions, GDP, the proportion of the tertiary industry, and the urbanization rate had relatively high q-values, making them the core factors explaining the spatial variation in the quantity of national-level ICH resources in the PRBA. In contrast, natural environmental indicators exhibited generally weaker explanatory power. Among them, water resource volume and mean annual precipitation showed slightly stronger effects, while the contributions of mean annual temperature, elevation, and river network density were comparatively small. Among historical and cultural determinants, the explanatory capacity of the number of cultural institutions was significantly higher than that of nationally designated cultural heritage protection sites and traditional villages. Overall, natural environmental conditions imposed relatively weak constraints regarding the spatial patterns of ICH within the PRBA. Instead, the density and diversity of ICH items were more reliant on human and social conditions, particularly population size, the level of urban development, and the presence of cultural facilities.

3.5.1. Physical Geography Factors

The PRBA has a favorable geographical location, characterized by high temperatures, abundant rainfall, and a dense network of rivers, which together provide advantageous natural conditions for rice-based agriculture, fishing, and other subsistence and livelihood activities. The Geographical Detector results showed that among the natural environmental indicators, water resource volume had the highest q-value (0.2126), followed by mean annual precipitation (0.1859). This pattern indicated that areas with more abundant hydrological conditions were more likely to exhibit concentrations of ICH. Notable examples include prefecture-level cities in the Pearl River Delta and those situated along the Han River, the river systems of eastern Guangdong, and the Hongliu River, all of which possess rich water resources. In comparison, mean annual temperature (0.0687), elevation (0.0666), and river network density (0.0630) displayed lower q-values and exerted weaker explanatory power than water resource volume and precipitation. These factors tended to influence the spatial clustering of ICH by shaping settlement patterns, transportation accessibility, and land use structures.

3.5.2. Socioeconomic Factors

The spatial pattern of ICH across the PRBA was significantly shaped by socio-economic determinants. Among these variables, the year-end permanent resident population (0.4284) exhibited the strongest explanatory power. This indicated that areas with higher population density tended to show higher demand for cultural consumption and were more likely to develop clusters of ICH items. Gross domestic product (0.3257) and the proportion of the tertiary industry (0.2609) followed closely, reflecting that economically developed cities with thriving service sectors are better positioned to revitalize and utilize ICH through financial investment and cultural industrialization. In contrast, road network density (0.0229) had a relatively weak influence on the spatial patterns of ICH, suggesting that transportation accessibility functioned more as a supportive condition rather than a decisive factor.

3.5.3. Historical and Cultural Factors

The explanatory capacity of historical-cultural variables regarding the spatial variation in ICH in the PRBA followed the order: cultural institutions (0.3358) > national priority protected sites (0.0741) > traditional villages (0.0493). Among these, cultural institutions displayed the highest q-value, indicating that the number of libraries, art galleries, cultural centers, and museums had the highest explanatory capacity for the spatial differentiation of ICH. These institutions frequently host exhibitions, educational programs, and cultural festivals to showcase and revitalize various forms of ICH, thereby playing a crucial role in its protection and transmission. Although the q-values of the national priority protected sites and traditional villages were relatively low, they still indicated that tangible cultural heritage also shaped the spatial distribution of ICH. Large numbers of historical buildings, ancient towns, significant archaeological sites, and traditional villages provided not only the physical settings in which ICH practices take place but also the living environments that allowed folk activities, festival rituals, and traditional techniques in the PRBA to persist.

3.5.4. Interaction Analysis of Driving Factors

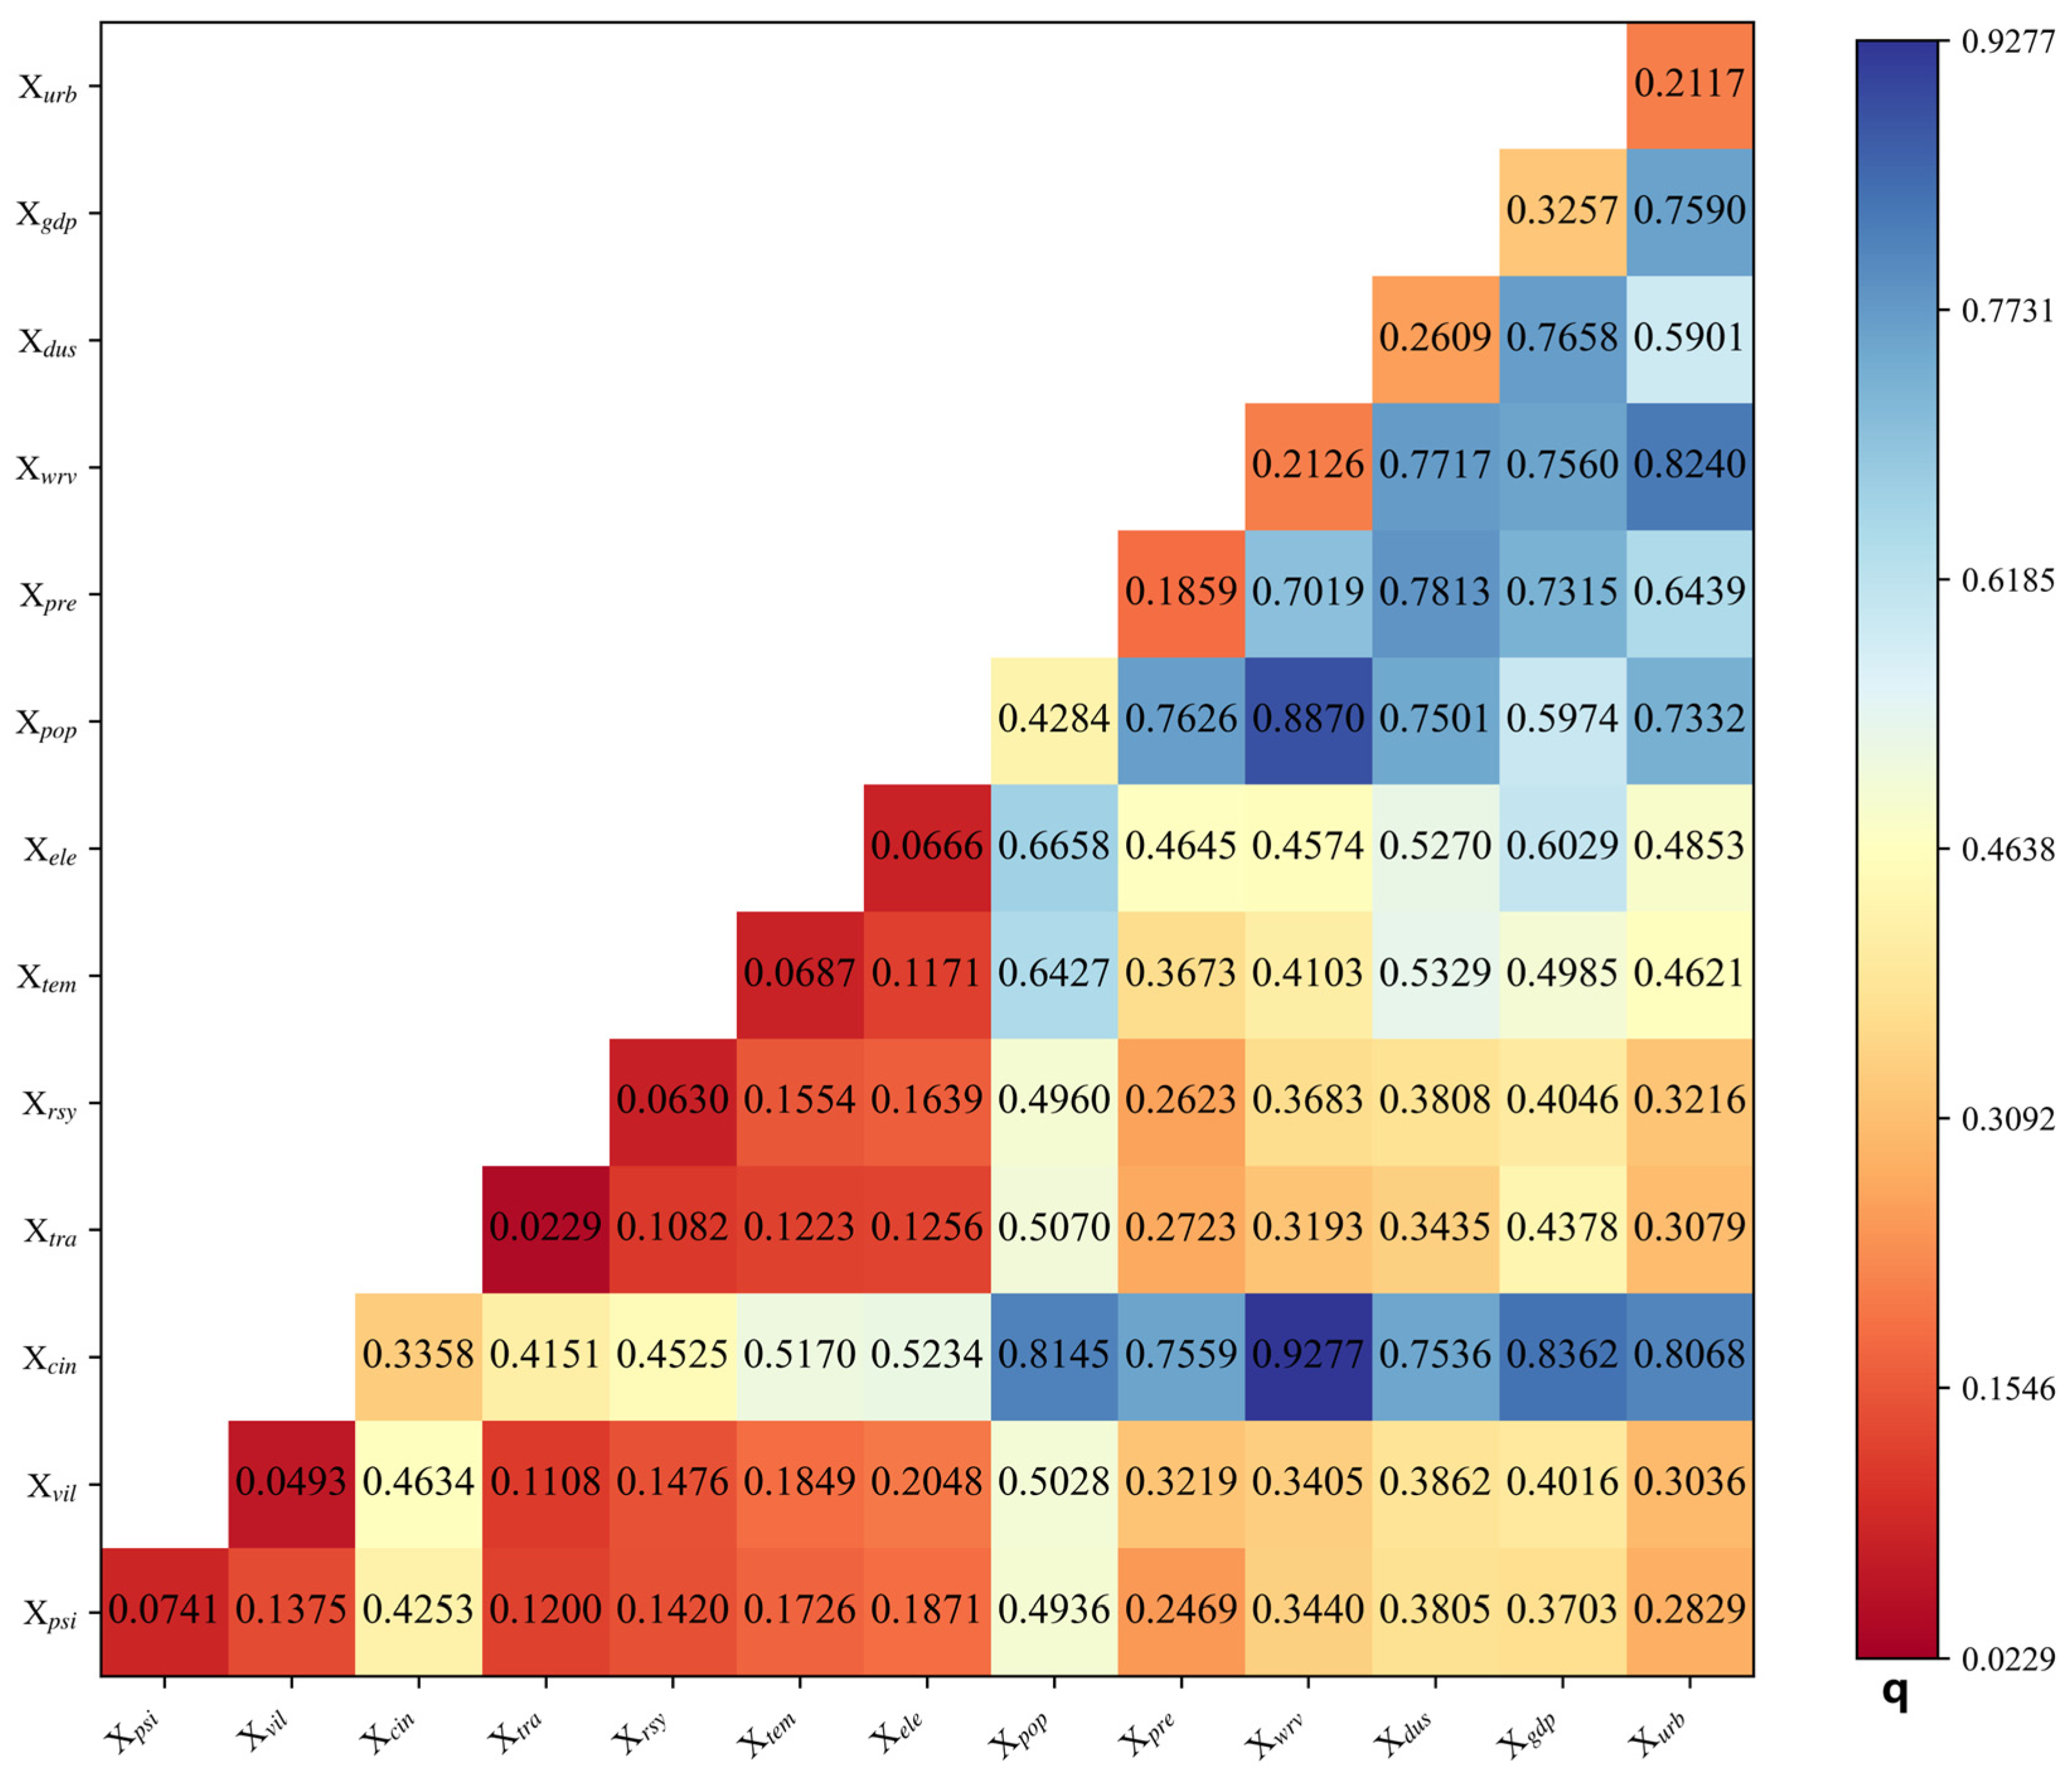
The interaction detection analysis (Table 6) reveals that the spatial heterogeneity of ICH in the PRBA is driven by the synergistic effects of multiple factors. For any pair of factors, their combined explanatory power exceeded that of each factor considered individually, with nonlinear enhancement being the dominant interaction type, followed by bi-enhancement. Among all combinations, interactions between cultural institutions and other factors were the most prominent. In particular, the intersection between cultural institutions and water resources had the highest q-value (0.9277), indicating that their joint effect on the distribution of ICH in the PRBA was the most significant. This was followed by permanent population ∩ water resources (0.8870) and urbanization rate ∩ water resources (0.8240), highlighting the critical role of water resources in composite interactions. Combinations such as cultural institutions ∩ GDP (0.8362), cultural institutions ∩ permanent population (0.8145), cultural institutions ∩ urbanization rate (0.8068), and cultural institutions ∩ precipitation (0.7559) also exhibited high explanatory power, indicating that the coupling of economic development, water resource conditions, population agglomeration, urbanization, and cultural institutions was crucial for shaping the spatial pattern of ICH in the basin. By contrast, river system ∩ road network density (0.1082) showed the weakest interaction, and combinations such as traditional village ∩ road network density (0.1108), key cultural relics ∩ road network density (0.1200), and temperature ∩ DEM (0.1171) had relatively low q-values, suggesting limited combined effects. Overall, the spatial distribution of ICH in the PRBA was not determined by any single natural or socio-economic factor but rather resulted from the spatial synergies among diverse natural environmental conditions, levels of economic development, and cultural spatial carriers (Figure 7).

4. Discussion

Intangible cultural heritage (ICH) constitutes a vital carrier of Chinese civilization, embodying its historical continuity, ethnic diversity, and regional distinctiveness [54,55]. Historically, rivers have acted as essential conduits for civilizational development by providing water resources and transportation corridors, thereby shaping river-dependent settlement patterns among early communities [56,57]. The Pearl River Basin Area (PRBA) encompasses Guangfu culture, Chaoshan culture, and the diverse ethnic cultures in Yunnan and Guizhou, whose linguistic forms, festive rituals, and traditional techniques collectively form a diverse cultural network, which serves as a crucial foundation for the cultural sustainability and regional resilience of the PRBA.
The results indicate that the national-level ICH resources in the PRBA exhibit a distribution pattern of high density in the east and low density in the west, with a concentration along the coast. This spatial pattern is consistent with the overall trend observed in national-scale studies [3]. The spatial distribution pattern of ICH in the PRBA is closely related to the settlement structure within the basin. Significant differences exist in the types of ICH across different river systems. In the Pearl River Delta, a high-density core area has developed under the influence of urban agglomeration. Economic resources and cultural institutions enhance the capacity for ICH nomination, official recognition, and sustained transmission. The secondary core area in eastern Guangdong highlights the role of Chaozhou as a historical and cultural city, where ICH in traditional art and traditional drama (e.g., embroidery, wood carving, and paper-cutting) are preserved and continued in daily life and folk rituals. Hainan shows a prominent concentration of ICH in traditional music (e.g., Lingao fishing songs and Danjia fishing songs), reflecting the continuity and preservation of maritime musical forms. In the Guizhou and Yunnan region, festival rituals and livelihood-related practices in ethnic villages inhabited by groups such as the Miao, Dong, and Yi (e.g., the Miao lusheng dance) provide stable settings for living transmission. Overall, the ICH in the PRBA has formed a cultural circle pattern with urban clusters as the core and multi-ethnic cultures as the foundation, which is similar to the cultural spatial structure of the Yangtze River Basin [13]. It should be noted that the density gradient identified in this study mainly reflects the spatial distribution of items included in the national-level ICH list, rather than the actual distribution of living heritage. Since national-level nomination and evaluation require extensive fieldwork, systematic documentary support, and strong administrative coordination, some regions may be comparatively underrepresented in the inventory [58,59]. This bias may further intensify the observed spatial disparities in ICH distribution.
Across the five batches of national-level ICH projects in the PRBA, the spatial pattern shows an evolutionary trajectory of initial intensification, subsequent weakening, and eventual stabilization. The spatial center of gravity of ICH projects shifted slowly from southeast to northwest and began to concentrate after 2011, a process that corresponds to the policy development stages of China’s ICH protection system [2]. Owing to differences in survey capacity and administrative resources, ICH projects are mainly concentrated in the Pearl River Delta and coastal areas. Following the promulgation of China’s national ICH law and continued policy support for ethnic minority regions, the number of ICH projects in Guangxi, Yunnan, and Guizhou increased, and the spatial distribution gradually became more balanced. This process illustrated the capacity of policy discourse to shape the reproduction of cultural space and indirectly underscores the crucial role of institutional arrangements in the construction of the national ICH list [60].
Geodetector analysis indicated that the spatial pattern of ICH in the PRBA was primarily shaped by socioeconomic and historical–cultural factors. Among these, indicators such as permanent population size, the proportion of tertiary industry, urbanization rate, and gross regional product exhibited high q-values and constituted the core variables influencing the overall clustering of ICH. This finding demonstrated that population scale, the level of urban development, and economic strength had strong explanatory power for the spatial agglomeration of ICH items and the capacity of localities to apply for national recognition [61,62]. Among historical–cultural factors, the number of cultural institutions showed the strongest explanatory capacity, highlighting the critical role of public cultural infrastructure in the identification, nomination, and dissemination of ICH. In contrast, natural environmental factors such as elevation, temperature, and river network density exhibited relatively low individual explanatory power. However, the interaction terms between hydrological factors and variables such as population, urbanization, and cultural institutions exhibited significant enhancement effects. Abundant water resources and convenient river transportation in the PRBA influence the distribution of settlements, thereby concentrating the bearers of ICH in these areas. Beyond these human factors, the hydrological environment acts as a pivotal force in shaping cultural heritage. For instance, the water-rich Pearl River Delta has given rise to specific ICH forms such as Dragon Boat Racing, Huidong Fishermen’s Songs, and the Doumen Waterborne Wedding custom, which represent cultural responses to aquatic environments.
This study conducted a systematic analysis of the typological structure, spatiotemporal evolution, spatial patterns, and drivers of ICH in the PRBA, and its findings provided several implications for regional ICH conservation and governance.
  • The number of TSAA and traditional medicine projects in the PRBA is relatively small, and the number of inheritors is insufficient, which is consistent with the trend of “rarity of certain categories” in the western region [43]. In the future, policy support and financial assistance can be strengthened to reduce the risk of their disappearance through measures such as establishing training bases, creating digital archives, and supporting representative inheritors.
  • The spatial evolution of ICH was strongly conditioned by existing cultural foundations and policy environments. To avoid imbalances in the spatial structure of ICH, it is necessary to strengthen cross-regional coordination and collaboration by integrating strategies such as the development of the Guangdong-Hong Kong-Macao Greater Bay Area, the Xijiang Economic Belt, and the coordinated development of Guangxi, Yunnan, and Guizhou. Cities with strong cultural foundations and policy implementation capabilities, such as Guangzhou, Chaozhou, Kunming, and Nanning, can be selected as demonstration points to strengthen their leading role.
  • Differentiated spatial governance strategies can be adopted for the protection of ICH. In high-density core areas such as the Pearl River Delta and the eastern coastal region of Guangdong, the spatial planning of ICH resources should be integrated with that of public cultural facilities [63]. Representative items should be embedded into urban renewal projects, tourism itineraries, and public spaces to enhance daily visibility and public participation, thereby preventing cultural displacement. In contrast, for medium and low-density areas with distinctive ethnic cultures (e.g., Guangxi, Yunnan, and Guizhou), productive protection and community participation are more appropriate, emphasizing living transmission within traditional villages, ethnic festivals, and everyday life. Furthermore, considering the amplifying effects of interactions between natural and socioeconomic factors, basin-scale management tools should be utilized. These tools can facilitate integrated projects combining ICH conservation, ecological protection, and rural revitalization to achieve the coordinated development of culture, ecology, the economy, and watershed management.
This study had several limitations. First, the dataset included only national-level ICH items and excluded provincial and lower-level lists, which may have led to an underestimation of cultural density in rural and ethnic minority areas. Future work could incorporate provincial-level ICH to enable multi-scalar comparisons. Second, the driving factors were mainly derived from municipal-level statistics, which made it difficult to capture spatial characteristics at the county and township scales, more fine-grained analyses at these levels are needed. Third, the enhanced interaction between hydrological factors and other drivers identified in this study reflects a spatial association. However, the relationship between river systems and ICH could be interpreted as a mere co-occurrence, which remains open to philosophical debate. Future research should incorporate longitudinal data, such as historical waterways and settlement changes, to clarify the underlying mechanisms. Despite these limitations, this study still makes several theoretical and methodological contributions. Theoretically, this study highlights the potential role of hydrological connectivity in the production of cultural space, addressing the limited attention given to hydrological factors in previous research. Methodologically, using the natural boundaries of the PRBA’s water system as the unit of analysis helps to examine the spatial transmission mechanisms linking hydrological connectivity, population mobility, and cultural exchange, and provides a reference for basin-scale integrated safeguarding of ICH and coordinated regional development. The spatial analysis framework presented in this paper can also provide a reference framework for other cross-administrative regional river basins (such as the Huaihe River and Haihe River basins) to better study the relationship between “water and culture” under different geographical backgrounds.

5. Conclusions

This study analyzes the type of structure, evolutionary process, spatial clustering, and driving mechanisms of 377 national-level ICH items in the PRBA. The findings enrich the empirical evidence and theoretical basis for spatial research on ICH in China’s river-system regions, and can support decision-making on zoned safeguarding, heritage route development, and cultural space optimization in the PRBA.
  • There are pronounced differences in the structural composition of China’s national-level ICH items across the PRBA. The categories of folk techniques and traditional dance are represented by larger numbers of items, whereas traditional sports, recreation, and acrobatics have the fewest. Spatially, folkways, traditional drama, and traditional dance exhibit significant clustering, while quyi and traditional medicine display an approximately random distribution pattern.
  • Standard deviation ellipse analysis reveals a spatial evolution trajectory characterized by major-axis contraction and slow centroid migration. The gravity center consistently advances northwestward, while the major axis maintains a stable east–west orientation. The ellipse’s coverage area follows a rhythmic pattern of initial expansion followed by contraction, underscoring the strong dependence of ICH resources on established cultural foundations and policy frameworks.
  • ICH exhibits a distinctive spatial distribution characterized by “coastal clustering and inland point-like dispersion”. The Pearl River Delta and eastern Guangdong constitute the core areas with high and sub-high densities, respectively, whereas Hainan, Guangxi, and Guizhou form secondary clustering zones. Specifically, the Pearl River Delta serves as a high-density core for quyi, folkways, traditional medicine, traditional dance, TSAA, and traditional techniques; Hainan functions as a high-density core for traditional music and traditional techniques; traditional drama and traditional art are highly concentrated in eastern Guangdong; and only folk literature shows relatively strong clustering in inland areas.
  • The spatial differentiation of ICH is driven primarily by socioeconomic and historical–cultural factors, among which the number of cultural institutions, population size, and gross domestic product (GDP) exhibit the strongest explanatory power. The availability of water resources shows relatively weak explanatory power as a single factor; however, when it interacts with factors such as the configuration of cultural facilities and the process of urbanization, it produces a pronounced nonlinear enhancement effect. This finding corroborates the view that hydrological connectivity, as a fundamental environmental carrier, can substantially amplify the clustering and intergenerational transmission of cultural heritage.
  • Future research could expand the scope by incorporating provincial and municipal ICH lists and utilizing finer spatial scales (e.g., county-level data). Integrating diverse drivers, such as tourism and ethnic demographics, would further clarify local spatial heterogeneity that is often overlooked at the macro scale. Additionally, historical waterways data should be included to distinguish causal links from spatial co-occurrence.

Author Contributions

Conceptualization, J.Z. and J.F.I.L.; methodology, J.Z., W.L. and K.R.; software, J.Z. and W.L.; validation, J.Z., W.L. and J.F.I.L.; formal analysis, J.Z.; investigation, J.Z. and W.L.; resources, J.Z. and J.F.I.L.; data curation, J.Z. and W.L.; writing—original draft preparation, J.Z.; writing—review & editing, J.Z., W.L., K.R. and J.F.I.L.; visualization, J.Z. and W.L.; supervision, J.F.I.L. All authors have read and agreed to the published version of the manuscript.

Funding

This research was funded by the Major Project of the Key Research Base of Humanities and Social Sciences, Ministry of Education, grant number 22JJD850009.

Institutional Review Board Statement

Not applicable.

Informed Consent Statement

Not applicable.

Data Availability Statement

The original contributions presented in this study are included in the article. Further inquiries can be directed to the corresponding author.

Acknowledgments

The author extends sincere gratitude to the editor and anonymous reviewers for their professional insights and constructive suggestions.

Conflicts of Interest

The authors declare no conflicts of interest.

Abbreviations

The following abbreviations are used in this manuscript:
ICHIntangible Cultural Heritage
PRBAPearl River Basin Area
TSAATraditional sports, amusement and acrobatics

References

  1. Blake, J. The Impact of UNESCO’s 2003 Convention on National Policy-Making: Developing a New Heritage Protection Paradigm? In The Routledge Companion to Intangible Cultural Heritage; Routledge: Oxfordshire, UK, 2016; pp. 69–78. [Google Scholar]
  2. Xu, Y.; Tao, Y.; Smith, B. China’s Emerging Legislative and Policy Framework for Safeguarding Intangible Cultural Heritage. Int. J. Cult. Policy 2022, 28, 566–580. [Google Scholar] [CrossRef]
  3. Zhang, Z.; Cui, Z.; Fan, T.; Ruan, S.; Wu, J. Spatial Distribution of Intangible Cultural Heritage Resources in China and Its Influencing Factors. Sci. Rep. 2024, 14, 4960. [Google Scholar] [CrossRef] [PubMed]
  4. Xu, Q.; Xu, Y.; Ma, C. Analysis of Contemporary Value and Influence of Intangible Cultural Heritage Based on Online Review Mining. PLoS ONE 2024, 19, e0315805. [Google Scholar] [CrossRef]
  5. Zabulis, X.; Partarakis, N.; Zidianakis, E.; Kaplanidi, D. A Critical Review of the Function of Intangible Cultural Heritage as a Driver for Social Resilience and Cohesion. Encyclopedia 2025, 5, 189. [Google Scholar] [CrossRef]
  6. SDG 11.4 Indicators|Institute for Statistics (UIS). Available online: https://www.uis.unesco.org/en/methods-and-tools/sdg114-indicators (accessed on 5 December 2024).
  7. Yan, L.; Shen, X.; Pengling, L. Spatiotemporal Evolution of the Coupling Coordination between Inheritance of Local Culture and New-Style Urbanization in China. Herit. Sci. 2022, 10, 73. [Google Scholar] [CrossRef]
  8. Liu, Y.; Ma, X. Heritage Corridor Construction in the Sui–Tang Grand Canal’s Henan Section Based on the Minimum Cumulative Resistance (MCR) Model. Land 2025, 14, 2128. [Google Scholar] [CrossRef]
  9. Sun, Y. Mapping Urban Morphological Prototypes: Unveiling Local Identity in Historic Water Towns of the Northern Zhejiang Plain, China. Geocarto Int. 2025, 40, 2547011. [Google Scholar] [CrossRef]
  10. Bie, J.; de Jong, M.; Derudder, B. Greater Pearl River Delta: Historical Evolution towards a Global City-Region. J. Urban Technol. 2015, 22, 103–123. [Google Scholar] [CrossRef]
  11. Zhou, D. Ethnicity and Culture Along Zhujiang River Basin: The Perspective of Macro-anthropology. Soc. Sci. Front. 2017, 1–8. [Google Scholar]
  12. Nie, X.; Xie, Y.; Xie, X.; Zheng, L. The Characteristics and Influencing Factors of the Spatial Distribution of Intangible Cultural Heritage in the Yellow River Basin of China. Herit. Sci. 2022, 10, 121. [Google Scholar] [CrossRef]
  13. Wang, J.; Chen, M.; Zhang, H.; Ye, F. Intangible Cultural Heritage in the Yangtze River Basin: Its Spatial Distribution Characteristics and Influencing Factors. Sustainability 2023, 15, 7960. [Google Scholar] [CrossRef]
  14. Armstrong-Fumero, F. Artifactual Surface and the Limits of Inclusion: Blurring the Boundary Between Materiality and Intangible Heritage. Anthropol. Q. 2018, 91, 1303–1328. [Google Scholar] [CrossRef]
  15. Robischon, M. Nonhuman Animal Behavioral Phenomena Are Central to the Emerging Concept of Intangible Natural Heritage. Soc. Anim. 2019, 27, 628–645. [Google Scholar] [CrossRef]
  16. Zhang, G.; Chen, X.; Law, R.; Zhang, M. Sustainability of Heritage Tourism: A Structural Perspective from Cultural Identity and Consumption Intention. Sustainability 2020, 12, 9199. [Google Scholar] [CrossRef]
  17. Qing, F.; Tan, G.; Sun, C.; Chen, P. Research on Knowledge Organization of Intangible Cultural Heritage Based on Metadata. Inf. Technol. Libr. 2022, 41. [Google Scholar] [CrossRef]
  18. Luo, J.M.; Hu, Z.; Leong, A.M.W. Exploring the Experience Attributes of Intangible Cultural Heritage through Big Data Analytics. J. Vacat. Mark. 2025, 13567667251323644. [Google Scholar] [CrossRef]
  19. Csurgó, B.; Smith, M.K. Cultural Heritage, Sense of Place and Tourism: An Analysis of Cultural Ecosystem Services in Rural Hungary. Sustainability 2022, 14, 7305. [Google Scholar] [CrossRef]
  20. Ren, K.; Li, C.; Zhan, J.; Lam, J.F.I. Spatiotemporal Distribution and Influencing Factors of Intangible Cultural Heritage in the Guangdong-Hong Kong-Macao Region. npj Herit. Sci. 2025, 13, 407. [Google Scholar] [CrossRef]
  21. Wang, F.; Zhang, T.; Zhang, S. MGWR Reveals Scale Heterogeneity Shaping Intangible Cultural Heritage Distribution in China. Npj Herit. Sci. 2025, 13, 367. [Google Scholar] [CrossRef]
  22. Hu, Q.; Yang, P.; Ma, J.; Wang, M.; He, X. The Spatial Differentiation Characteristics and Influencing Mechanisms of Intangible Cultural Heritage in China. Heliyon 2024, 10, e38689. [Google Scholar] [CrossRef]
  23. Pang, L.; Wu, L. Distribution Characteristics and Influencing Factors of Intangible Cultural Heritage in Beijing-Tianjin-Hebei. Herit. Sci. 2023, 11, 19. [Google Scholar] [CrossRef]
  24. Mo, B.; Zhang, X.; Chen, W.; Zhou, R.; Zhang, J. Research on the Spatial Distribution Characteristics and Influencing Factors of Sports Intangible Cultural Heritage in the Guangdong-Hong Kong-Macao Greater Bay Area. Sci. Rep. 2025, 15, 27147. [Google Scholar] [CrossRef] [PubMed]
  25. Zhang, H.; Li, F.; Zhang, J.; Liang, H.; Huangfu, Y. Spatial Structure and Influencing Factors of Agricultural Civilization Heritage in the Yellow River Basin. Sci. Rep. 2025, 15, 29836. [Google Scholar] [CrossRef]
  26. Gao, T.; Wang, D. Spatial Distribution and Pedigree Age of Traditional Handicraft Intangible Cultural Heritage in the Yellow River Basin. npj Herit. Sci. 2025, 13, 420. [Google Scholar] [CrossRef]
  27. Wang, X.; Zhang, T.; Duan, L.; Liritzis, I.; Li, J. Spatial Distribution Characteristics and Influencing Factors of Intangible Cultural Heritage in the Yellow River Basin. J. Cult. Herit. 2024, 66, 254–264. [Google Scholar] [CrossRef]
  28. Kuang, R.; Zuo, Y.; Gao, S.; Yin, P.; Wang, Y.; Zhang, Z.; Cai, S.; Li, N. Research on the Spatial Distribution Characteristics and Influencing Factors of Central China’s Intangible Cultural Heritage. Sustainability 2023, 15, 5751. [Google Scholar] [CrossRef]
  29. Liu, C.; Kang, L. How Do Geographical Factors Affect the Distribution of Intangible Cultural Heritage: A Case Study of Xinjiang, China. Sustainability 2023, 15, 8943. [Google Scholar] [CrossRef]
  30. Zhang, Z.; Li, Q.; Hu, S. Intangible Cultural Heritage in the Yellow River Basin: Its Spatial–Temporal Distribution Characteristics and Differentiation Causes. Sustainability 2022, 14, 11073. [Google Scholar] [CrossRef]
  31. Yang, J.; Wang, L.; Wei, S. Spatial Variation and Its Local Influencing Factors of Intangible Cultural Heritage Development along the Grand Canal in China. Int. J. Environ. Res. Public Health 2023, 20, 662. [Google Scholar] [CrossRef]
  32. Li, L. Cultural Communication and Diversity along the Grand Canal of China: A Case Study of Folk Songs in Intangible Cultural Heritage. Herit. Sci. 2023, 11, 66. [Google Scholar] [CrossRef]
  33. Wu, L.; Yang, G.; Chen, X. Spatial Distribution Characteristics and Influencing Factors of Intangible Cultural Heritage in the Yunnan, Guangxi, and Guizhou Rocky Desertification Area. Sustainability 2024, 16, 4722. [Google Scholar] [CrossRef]
  34. O’Shea, J.M. A River Runs Through It: Landscape and the Evolution of Bronze Age Networks in the Carpathian Basin. J. World Prehist. 2011, 24, 161–174. [Google Scholar] [CrossRef]
  35. Schillinger, K.; Lycett, S.J. The Flow of Culture: Assessing the Role of Rivers in the Inter-Community Transmission of Material Traditions in the Upper Amazon. J. Archaeol. Method Theory 2019, 26, 135–154. [Google Scholar] [CrossRef]
  36. Pearl River Water Resources Commission of the Ministry of Water Resources. Available online: https://www.pearlwater.gov.cn/swh/zjzj/201807/t20180720_84920.html (accessed on 1 December 2024).
  37. Wu, X. Overall Ideas and Countermeasures for the 15th Five-Year Plan for Water Security in the Pearl River Basin. China Water Resour. 2025, 4–9. [Google Scholar] [CrossRef]
  38. China Intangible Cultural Heritage. Available online: https://www.ihchina.cn/project (accessed on 8 December 2024).
  39. The Standard Map Service Website of the Ministry of Natural Resources of the People’s Republic of China. Available online: http://bzdt.ch.mnr.gov.cn/ (accessed on 15 November 2024).
  40. National Bureau of Statistics. Available online: https://data.stats.gov.cn/ (accessed on 8 December 2024).
  41. National Geomatics Center of China. Available online: https://www.ngcc.cn/ (accessed on 8 December 2024).
  42. National Cultural Heritage Administration. Available online: http://www.ncha.gov.cn/index.html (accessed on 8 December 2024).
  43. Liu, Y.; Chen, M.; Tian, Y. Temporal and Spatial Patterns and Influencing Factors of Intangible Cultural Heritage: Ancient Qin-Shu Roads, Western China. Herit. Sci. 2022, 10, 201. [Google Scholar] [CrossRef]
  44. Qian, X.; Yu, Y.; Liu, R. The Spatial Relationship Characteristics and Differentiation Causes Between Traditional Villages and Intangible Cultural Heritage in China. Buildings 2025, 15, 2094. [Google Scholar] [CrossRef]
  45. Chen, Y.; Zhao, J.; Zhao, X.; Wang, Z.; Xu, Z.; Li, S.; Liu, W. Study on the Spatial Distribution Characteristics and Influencing Factors of Intangible Cultural Heritage Along the Great Wall of Hebei Province. Sustainability 2025, 17, 6962. [Google Scholar] [CrossRef]
  46. Shao, D.; Zoh, K.; Xie, Y. The Spatial Differentiation Mechanism of Intangible Cultural Heritage and Its Integration with Tourism Development Based on Explainable Machine Learning and Coupled Coordination Models: A Case Study of the Jiang-Zhe-Hu in China. Herit. Sci. 2024, 12, 414. [Google Scholar] [CrossRef]
  47. Sitthiyot, T.; Holasut, K. A Simple Method for Estimating the Lorenz Curve. Humanit. Soc. Sci. Commun. 2021, 8, 268. [Google Scholar] [CrossRef]
  48. Wu, Y.J.; Wang, F.Y. Study on the Spatial Connectivity and Distribution of the Landscape for Maoershan Region in Heilongjiang Province. Adv. Mater. Res. 2014, 955–959, 3987–3993. [Google Scholar] [CrossRef]
  49. Tang, Z.; Zhang, Z.; Zuo, L.; Wang, X.; Zhao, X.; Liu, F.; Hu, S.; Yi, L.; Xu, J. Spatial Evolution of Urban Expansion in the Beijing–Tianjin–Hebei Coordinated Development Region. Sustainability 2021, 13, 1579. [Google Scholar] [CrossRef]
  50. Ge, B.; Song, Y.; Wang, J.; Wang, Y.; Yuan, X. Spatio-Temporal Pattern and Entropy Variation of Agricultural Heritage in China. Herit. Sci. 2024, 12, 415. [Google Scholar] [CrossRef]
  51. Lin, X.; Zheng, Q.; Su, K.; Chen, Q. Mechanisms Influencing Spatiotemporal Differentiation of Tourist Towns Based on Geographic Detector: A Case Study of Fujian Province. PLoS ONE 2024, 19, e0298078. [Google Scholar] [CrossRef]
  52. Ouyang, S.; Wen, J. Geospatial Drivers of China’s Nature Reserves: Implications for Sustainable Agricultural Development. Agriculture 2025, 15, 1596. [Google Scholar] [CrossRef]
  53. Yang, L.; Pan, Z.; Li, H.; Wang, D.; Wang, J.; Wu, C.; Wu, X. Study on the Spatiotemporal Evolution and Driving Factors of Water Resource Carrying Capacity in Typical Arid Regions. Water 2024, 16, 2142. [Google Scholar] [CrossRef]
  54. Liu, Y. Application of Digital Technology in Intangible Cultural Heritage Protection. Mob. Inf. Syst. 2022, 2022, 7471121. [Google Scholar] [CrossRef]
  55. Gao, J.; Wu, B. Revitalizing Traditional Villages through Rural Tourism: A Case Study of Yuanjia Village, Shaanxi Province, China. Tour. Manag. 2017, 63, 223–233. [Google Scholar] [CrossRef]
  56. Wang, H.; He, G. Rivers: Linking Nature, Life, and Civilization. River 2022, 1, 25–36. [Google Scholar] [CrossRef]
  57. Guo, Y.; Rao, J.; Huang, J.; Zhu, Y. Spatial and Temporal Evolution and Conservation Significance of Traditional Villages in the Yangtze River Basin, China. Buildings 2024, 14, 3249. [Google Scholar] [CrossRef]
  58. Eichler, J. Intangible Cultural Heritage, Inequalities and Participation: Who Decides on Heritage? Int. J. Hum. Rights 2021, 25, 793–814. [Google Scholar] [CrossRef]
  59. Lixinski, L. Selecting Heritage: The Interplay of Art, Politics and Identity. Eur. J. Int. Law 2011, 22, 81–100. [Google Scholar] [CrossRef]
  60. Li, J.; Wu, X.; Du, Y. Reframing Cultural Heritage Policy Through Place-Based Perspectives: The Evolution of China’s ICH Governance Amid Historical Continuity and Global Convergence. Land 2025, 14, 1425. [Google Scholar] [CrossRef]
  61. Han, Q.; Tao, F.; Hong, Z.; Qin, G.; Wei, Y.; Chen, Y.; Zhou, T. Research on the Spatiotemporal Distribution and Factors Influencing Intangible Cultural Heritage in Fujian Province from a Multiscale Perspective. Herit. Sci. 2024, 12, 239. [Google Scholar] [CrossRef]
  62. Shen, W.; Chen, Y.; Cao, W.; Yu, R.; Rong, P.; Cheng, J. Spatial Pattern and Its Influencing Factors of National-Level Cultural Heritage in China. Herit. Sci. 2024, 12, 384. [Google Scholar] [CrossRef]
  63. Selmanović, E.; Rizvic, S.; Harvey, C.; Boskovic, D.; Hulusic, V.; Chahin, M.; Sljivo, S. Improving Accessibility to Intangible Cultural Heritage Preservation Using Virtual Reality. J. Comput. Cult. Herit. 2020, 13, 13. [Google Scholar] [CrossRef]
Figure 1. The Distribution Map of ICH Projects in the PRBA.
Sustainability 18 01801 g001
Figure 2. Lorenz Curve of ICH in the PRBA. TSAA denotes traditional sports, amusement, and acrobatics.
Sustainability 18 01801 g002
Figure 3. Structural characteristics of ICH categories in the PRBA.
Sustainability 18 01801 g003
Figure 4. Standard Deviation Ellipse and Central Trajectory Map of ICH in the PRBA.
Sustainability 18 01801 g004
Figure 5. The Kernel Density Distribution of ICH in the PRBA.
Sustainability 18 01801 g005
Figure 6. The Kernel Density Distribution of the ten categories of ICH in the PRBA.
Sustainability 18 01801 g006
Figure 7. Heatmap of interaction effects among influencing factors.
Sustainability 18 01801 g007
Table 1. Distribution of ICH Resources from a Watershed Perspective.
ICH CategoriesSecondary Water
Resource Zone
Number
(Item)
Total
(Item)
Proportion (%)
Folk literatureHong–Liu River Basin52222.73
Nanpan–Beipan River Basin522.73
Traditional musicHainan Island and the South China Sea river basins114922.45
Traditional danceNanpan–Beipan River Basin116516.92
Traditional dramaHan River and eastern
Guangdong river basins
114425.00
QuyiPearl River Delta31030.00
Hong–Liu River Basin330.00
Traditional sports, amusement, and acrobaticsPearl River Delta5862.50
Traditional artHan River and eastern
Guangdong river basins
164040.00
Traditional
techniques
Hainan Island and the South China Sea river basins124825.00
Traditional
medicine
Pearl River Delta61346.15
FolkwaysHong–Liu River Basin187823.08
The second column indicates the Secondary Water Resource Zone with the highest ICH distribution for each category.
Table 2. Distribution of ICH Resources from the Prefecture-Level City Perspective.
ICH CategoriesPrefecture-Level CityNumber (Item)Total
(Item)
Proportion (%)
Folk literatureHonghe Hani and Yi Autonomous Prefecture42218.18
Traditional musicQiandongnan Miao and Dong
Autonomous Prefecture
4498.16
Traditional danceShenzhen5657.69
Traditional dramaNanning54411.36
QuyiGuilin21020.00
Traditional sports, amusement and acrobaticsGuangzhou2825.00
Traditional artChaozhou84020.00
Traditional techniquesGuangzhou54810.42
Traditional medicineGuangzhou41330.77
FolkwaysHechi7788.97
The second column identifies the prefecture-level city with the largest distribution of ICH items for each category.
Table 3. Average Nearest-Neighbor Index Summary for the Ten ICH Categories.
ICH
Categories
AmountNNIAverage Nearest-Neighbor Distance (km)Expected Nearest-Neighbor Distance (km)ZpDistribution Pattern
Quyi101.13111.2798.260.800.42random
Folkways780.5835.6260.60−6.960clustered
Folk literature221.25120.3996.132.260.02uniform
Traditional music490.7161.5485.92−3.800clustered
Traditional medicine131.2390.3072.861.650.09random
Traditional drama440.5543.5078.57−5.660clustered
Traditional dance650.5540.9173.82−6.870clustered
Traditional sports, amusement and acrobatics81.60 122.0075.843.290uniform
Traditional art400.4130.0573.22−7.130clustered
Traditional techniques480.5239.5474.72−6.240clustered
Total3770.268.5131.61−27.140clustered
Table 4. Spatial Clustering Characteristics of the Five Batches of National-Level ICH Items.
ICH
Batch
AmountNNIAverage Nearest-Neighbor Distance (km)Expected Nearest-Neighbor Distance (km)ZpDistribution Pattern
First batch
(2006)
950.3921.8655.46−11.290.00clustered
Second batch
(2008)
1240.4221.9151.87−12.300.00clustered
Third batch
(2011)
660.8055.9069.02−2.950.00clustered
Fourth batch
(2014)
440.6952.1675.57−3.930.00clustered
Fifth batch
(2021)
480.6652.9179.49−4.430.00clustered
Table 5. Explanatory force detection results of driving factors.
CategoryDriving FactorsIndex Definitionqp
Physical
geography
Xtem: TemperatureAnnual average
temperature
0.06870.0000
Xpre: PrecipitationAnnual average
precipitation
0.18590.0000
Xele: ElevationAltitude0.06660.0000
Xrsy: River systemRiver network
density
0.06300.0000
Xwrv: Water resource
volume
Annual water
resources volume
0.2126 0.0000
SocioeconomicXpop: PopulationYear-end resident population0.42840.0000
Xtra: TransportationRoad network
density
0.0229 0.0000
Xurb: Urban Development LevelUrbanization rate0.21170.0000
Xgdp: Level of economic developmentGDP0.32570.0000
Xdus: Level of Industrial DevelopmentThe proportion of tertiary industry0.26090.0000
Historical and CulturalXvil: Traditional VillageNumber of traditional villages0.04930.0026
Xpsi: Cultural Heritage Protection SiteNational priority protected site0.07410.0000
Xcin: Cultural institutionsNumber of libraries, art galleries, cultural centers, and museums0.33580.0000
Table 6. Explanatory force detection results of influencing factors.
Driving
Factors
XurbXgdpXdusXwrvXpreXpopXeleXtemXrsyXtraXcinXvilXpsi
Xurb0.2117
Xgdp0.7590 (NE)0.3257
Xdus0.5901 (NE) 0.7658 (NE) 0.2609
Xwrv0.8240 (NE) 0.7560 (NE) 0.7717 (NE) 0.2126
Xpre0.6439 (NE) 0.7315 (NE)0.7813 (NE) 0.7019 (NE) 0.1859
Xpop0.7332 (NE) 0.5974 (BE)0.7501 (NE) 0.8870 (NE) 0.7626 (NE)0.4284
Xele0.4853 (NE)0.6029 (NE)0.5270 (NE) 0.4574 (NE) 0.4645 (NE)0.6658 (NE)0.0666
Xtem0.4621 (NE) 0.4985 (NE)0.5329 (NE) 0.4103 (NE) 0.3673 (NE)0.6427 (NE)0.1171 (BE)0.0687
Xrsy0.3216 (NE) 0.4046 (NE)0.3808 (NE) 0.3683 (NE) 0.2623 (NE) 0.4960 (NE) 0.1639 (NE)0.1554 (NE) 0.0630
Xtra0.3079 (NE) 0.4378 (NE)0.3435 (NE) 0.3193 (NE) 0.2723 (NE)0.5070 (NE)0.1256 (NE) 0.1223 (NE) 0.1082 (NE)0.0229
Xcin0.8068 (NE) 0.8362 (NE)0.7536 (NE) 0.9277 (NE) 0.7559 (NE) 0.8145 (NE)0.5234 (NE) 0.5170 (NE) 0.4525 (NE)0.4151 (NE)0.3358
Xvil0.3036 (NE) 0.4016 (NE)0.3682 (NE) 0.3405 (NE) 0.3219 (NE) 0.5028 (NE)0.2049 (NE) 0.1849 (NE) 0.1476 (NE)0.1108 (NE)0.4634 (NE)0.0493
Xpsi0.2829 (BE)0.3703 (BE) 0.3805 (NE) 0.3440 (NE) 0.2469 (BE) 0.4936 (BE) 0.1871 (NE) 0.1726 (NE) 0.1420 (NE)0.1200 (NE)0.4253 (NE)0.1375 (NE)0.0741
In this table, (NE) stands for nonlinear enhancement and (BE) stands for bi-enhancement; Xurb is an abbreviation for Urban Development Level, and the full names corresponding to the other abbreviations are presented in Table 5.
Disclaimer/Publisher’s Note: The statements, opinions and data contained in all publications are solely those of the individual author(s) and contributor(s) and not of MDPI and/or the editor(s). MDPI and/or the editor(s) disclaim responsibility for any injury to people or property resulting from any ideas, methods, instructions or products referred to in the content.