Article

Achieving Sustainable Development Through Structural Tools: Institutional Configurations and Pathways

College of Business Administration, Capital University of Economics and Business, Beijing 100070, China
*
Author to whom correspondence should be addressed.
Sustainability 2026, 18(4), 1736; https://doi.org/10.3390/su18041736
Submission received: 13 January 2026 / Revised: 2 February 2026 / Accepted: 6 February 2026 / Published: 8 February 2026

Abstract

Sustainable development is a central objective for contemporary firms. It involves both long-term organizational resilience and improved environmental, social, and governance (ESG) performance. Structural tools that support long-term stability and strategic continuity play a critical role in achieving these goals. However, their adoption depends on the interaction between formal and informal institutional forces. Drawing on institutional theory, this study applies fuzzy-set qualitative comparative analysis (fsQCA) to data from Chinese listed firms. We examine how four institutional dimensions jointly shape structural tool adoption: governance structure, intergenerational heterogeneity, institutional and cultural context, and market-driven and mimetic forces. Structural tools facilitate governance consolidation and leadership succession, which are essential for sustainable development. Our findings show that no single institutional condition is sufficient to trigger adoption. Instead, multiple conditions must combine to enable firms to implement structural tools. The seven configurations identified reveal diverse governance paths across different institutional contexts, including complementary, substitutive, and conflicting relationships between formal and informal institutions. We also find clear causal asymmetry: the conditions that promote adoption differ fundamentally from those that inhibit it. Structural tools provide an institutional foundation for balancing short-term pressures with long-term sustainability commitments. Firms lacking these mechanisms face greater risks of leadership succession failure and long-term instability. Additional analyses using mean difference tests and fixed-effects models further confirm that structural tool adoption significantly enhances both sustainable development capacity and ESG performance. Overall, this study advances institutional theory. It shows how the interaction between formal and informal institutions shapes governance choices. It also explains how governance structures are linked to sustainable development outcomes.

1. Introduction

The sustainable development of enterprises is critical to global economic growth and social welfare. International frameworks such as the United Nations Global Compact and the Sustainable Development Goals emphasize that integrating environmental, social, and governance (ESG) principles into core business strategies is essential for long-term value creation. Empirical evidence supports this view: firms committed to the UN Global Compact achieve higher sustainability performance, with average EcoVadis scores of 54 compared to 42 for non-signatories [1]. In China, sustainable development has also become a national priority under the 14th Five-Year Plan, encouraging firms to embed ESG considerations into strategic decision-making. Despite its importance, achieving sustainable development remains challenging [2,3]. Governance instability during leadership transitions poses a major threat to long-term continuity, often weakening firms’ ability to sustain ESG commitments. When succession and ownership arrangements are unclear, firms face strategic disruption and increased short-termism. The Gucci case illustrates this risk: the absence of effective succession planning led to prolonged control disputes and legal conflicts, ultimately resulting in the loss of family control to external investors [4].
To address these challenges, firms increasingly adopt structural tools, such as holding companies, trusts, foundations, and limited partnerships, as formal governance mechanisms [5]. These tools provide an institutional framework for long-term planning and control continuity [6]. IKEA offers a prominent example. By placing ownership under the Stichting INGKA Foundation in the Netherlands, IKEA has maintained stable governance and sustained investment in sustainability, including over €4 billion in renewable energy assets [7]. As a result, the company reduced its climate footprint by 28% relative to its 2016 baseline [8] and achieved 93% renewable electricity use across its operations [9]. In contrast, inheritance disputes within the Wahaha founding family highlight how poorly designed trust arrangements can expose firms to governance risks [10].
From an institutional theory perspective, the adoption of structural tools reflects a shift from personalized to formalized governance. Institutions comprise both formal and informal elements that jointly shape organizational behavior [11]. In settings where formal institutions are weak, informal mechanisms—such as family networks or business guilds—often substitute for formal governance [12]. However, during periods of institutional transition, firms must balance formal and informal arrangements to achieve sustainable development [13]. Prior studies have typically examined these factors in isolation, overlooking their interaction. This issue is particularly salient in China, where many first-generation entrepreneurs from the 1980s and 1990s are approaching retirement, making succession and sustainability urgent strategic concerns [14,15,16]. Against this backdrop, this study employs fuzzy-set qualitative comparative analysis (fsQCA) to address two questions in the Chinese context. First, is there a necessary condition that drives firms to adopt structural tools for sustainable development? Second, under different institutional environments and organizational characteristics, what configurations of conditions lead to structural tool adoption and support sustainable growth?
This study makes three main contributions. First, it advances institutional theory by showing how formal and informal institutions interact dynamically across contexts [17,18]. Rather than operating independently, institutions may substitute for, complement, or conflict with one another, forming flexible systems that shape governance choices. Second, using fsQCA, the study identifies multiple pathways to structural tool adoption and demonstrates that these tools enhance both sustainable development capacity and ESG performance. The results reveal seven effective configurations and highlight causal asymmetry: the conditions that promote adoption differ fundamentally from those that inhibit it. Third, the study shows how firms actively reshape institutions to build sustainable governance. Rather than passively complying with rules, firms strategically combine formal regulations, cultural traditions, and organizational resources to create governance solutions. This finding underscores that sustainable development depends not only on institutional constraints but also on firms’ ability to creatively mobilize institutional resources for governance innovation and long-term competitive advantage.

2. Theoretical Basis and Literature Review

2.1. Institutional Theory

To understand firms’ governance systems, an institutional theory perspective is essential. Institutional theory explains organizational behavior through the interaction of formal and informal institutions [11]. Formal institutions consist of codified rules, such as laws and regulations, enforced by state authority or judicial systems. Informal institutions include norms, conventions, and cultural traditions that operate through social expectations, reputation, and shared values [19]. Together, they form the institutional environment that shapes firms’ strategic choices and governance practices [20]. Institutional theory further distinguishes three dimensions of influence. The regulative dimension constrains behavior through formal rules and sanctions. The normative dimension guides behavior through values, norms, and social obligations [21]. The cognitive dimension shapes shared understandings of what is considered appropriate through cultural frameworks [22]. These dimensions interact to form a multi-layered mechanism influencing organizational behavior. Firms are simultaneously constrained by formal rules and embedded in informal contexts, and the interaction between these forces plays a central role in shaping governance model choices [23].

2.2. Sustainable Development of Firms

Sustainable development has become a core imperative for modern enterprises. It extends beyond short-term profitability to emphasize long-term value creation that balances economic performance with environmental and social responsibility [24]. From an institutional perspective, sustainable development is shaped by both formal and informal institutions that guide firms toward socially responsible behavior. At the firm level, sustainable development refers to the capacity to maintain competitive advantage while fulfilling responsibilities to multiple stakeholders [25]. This capacity is reflected in sustainable development capability and ESG performance, which capture outcomes across environmental, social, and governance dimensions [26]. Firms develop such capacity by adopting governance mechanisms that embed long-term orientation into decision-making processes [20]. As ESG standards become increasingly institutionalized globally, governance structures play a critical role in aligning short-term incentives with long-term sustainability goals [27]. However, their effectiveness depends on alignment with informal institutional forces such as organizational culture, creating institutional complementarity essential for achieving sustainable development outcomes [19].

2.3. Structural Tools

Structural tools are defined as legal entities or legal structures with clear legal regulations and certainty, mainly including family holding companies, limited partnerships, foundations, and trusts [28]. From an institutional theory perspective, these tools represent formal institutional arrangements that create stable governance frameworks through codified legal rules [11]. They possess clear legal status, explicit rights and obligations, and predictable judicial protection [29]. One core challenge facing firms is how to attract external capital while maintaining control [30]. Traditional equity structures often struggle to balance this contradiction: excessive equity concentration limits financing capacity, while equity dispersion may lead to loss of control [31]. This reflects the institutional dilemma between market pressures for capital access and firms’ desires for control and continuity. Structural tools provide innovative solutions by decoupling ownership from control rights. For example, firms can concentrate dispersed equity into a single controlling entity through holding companies or trust structures, achieving coordination between “equity dispersion” and “control concentration” [32]. Furthermore, certain structural tools, particularly foundations and trusts, explicitly embed sustainability principles into their governance charters, creating binding institutional commitments to ESG objectives that transcend individual leadership tenures. By legally codifying ESG commitments, families create self-enforcing mechanisms that help firms resist short-term market pressures and maintain consistent progress toward environmental, social, and governance excellence across generational transitions.

2.4. The Use of Structural Tools and Sustainable Development of Firms

From an institutional perspective, structural tools function as formal arrangements that shape firms’ sustainable development capacity. By formalizing governance through legal mechanisms, these tools link institutional structures to sustainability outcomes. Structural tools support sustainable development through three mechanisms. First, they enhance governance stability by reducing uncertainty during leadership transitions, helping firms sustain long-term commitments. Second, they clarify boundaries between family interests and corporate governance, enabling professional management to pursue sustainability strategies. Third, they strengthen external legitimacy in environments where ESG standards are increasingly formalized, facilitating access to sustainability-oriented capital [20]. However, their effectiveness depends on alignment with informal institutions; without such alignment, structural tools may remain symbolic rather than substantive.
The Chinese institutional context presents distinct features. China’s evolving legal framework offers multiple pathways for governance formalization [17]. Holding companies and limited partnerships operate under the Company Law and enjoy clear legal recognition, supporting coordinated sustainability initiatives within business groups [33]. Trusts face greater uncertainty, as China’s Trust Law primarily recognizes commercial rather than family trusts, limiting their role in long-term governance [34]. Foundations are subject to strict regulatory oversight but benefit from tax incentives, encouraging family firms to pursue sustainability through philanthropic channels. These variations reflect China’s gradual institutional development, where formal rules continue to evolve alongside informal practices [12].

2.5. Governance Structure and the Use of Structural Tools

The adoption of structural tools is closely linked to family governance characteristics, particularly family involvement in management and equity concentration. Family involvement activates informal institutions such as kinship trust, family reputation, and founder authority, strengthening internal governance and supporting long-term orientation and ESG engagement [35,36]. In such settings, reliance on formal structural tools is often limited. However, as family involvement declines and professional managers assume control, informal governance weakens, increasing the risk of governance gaps and short-termism [37]. Structural tools then become critical for formalizing control, preserving family influence, and institutionalizing long-term sustainability objectives.
Equity concentration also shapes governance pathways [30]. Concentrated ownership supports informal coordination and strategic coherence, facilitating sustained ESG strategies [38]. In contrast, dispersed equity weakens coordination and heightens conflict, threatening sustainability outcomes. Structural tools such as holding companies and partnerships allow firms to legally reconsolidate control, balancing governance efficiency with control preservation and providing a stable foundation for sustainable development.

2.6. Intergenerational Heterogeneity and the Use of Structural Tools

Intergenerational heterogeneity, reflected in leadership tenure duration and subsequent generations’ overseas experience, influences a firm’s governance choices and its capacity for sustainable development through institutional mechanisms. Extended tenure of the founding leadership often reinforces the firm’s reliance on informal governance mechanisms, aligning corporate objectives with long-term sustainability goals from a normative institutional perspective [11]. However, this personalized governance model, while effective, can create path dependency, posing risks to sustained development. To mitigate these risks, firms may adopt formal structural tools—such as trusts and holding companies to ensure governance continuity beyond the tenure of individual leaders [28]. This shift from informal to formal governance mechanisms reflects an evolution in the firm’s institutional framework, supporting sustainable intergenerational continuity by embedding stability and strategic direction into the organizational structure.
Conversely, exposure of subsequent generations to international governance systems enhances their receptiveness to formal structural arrangements [20]. This institutional learning enables firms to recognize that tools such as trusts and foundations provide more enduring governance structures than personalized authority. Moreover, these structural tools can formalize ESG accountability mechanisms that align with global sustainability standards increasingly expected by international stakeholders. The adoption of such tools thus represents a strategic adaptation to evolving institutional environments, allowing firms to balance control preservation with governance modernization, thereby strengthening their long-term sustainability performance and resilience.

2.7. Institutional and Cultural Context and the Use of Structural Tools

Institutional and cultural context, comprising the legal environment and business guild culture, significantly shapes the pathways through which firms develop sustainable development capacity [11,19]. In contexts with strong legal systems, clear property rights provide a reliable foundation for structural tools [39]. Here, formal and informal institutions often function complementarily: structural tools legally secure intergenerational transition, while informal cohesion supports their implementation. This combined institutional framework provides a stable basis for meeting formal ESG disclosure requirements and long-term environmental or social commitments. Conversely, in weak legal environments, the credibility of formal institutions is low. Firms tend to rely more on kinship trust and social networks [17]. While this supports short-term continuity, it may limit the sustainable development of firms, as informal mechanisms alone may lack the accountability and transparency needed to address complex ESG risk.
Business guild culture, as a pervasive informal institution, provides an alternative governance framework through shared norms and values [40]. It functions as a normative system that guides behavior through social expectations and reputational mechanisms [21], contributing to sustainable development. Such cultural contexts can organically promote socially responsible practices and environmental stewardship aligned with local values. However, as firms expand and interact with stakeholders outside these cultural boundaries, the reach of informal governance becomes limited [17]. To achieve sustainable, cross-generational growth in a globalized context, firms must adopt formal structural tools that are recognizable and credible to external parties. Thus, the relationship between formal and informal institutions often shifts from substitution to complementarity as the firm scales, reflecting an institutional adaptation to support long-term sustainability and to align internal cultural values with externally recognized ESG frameworks.

2.8. Market-Driven Forces and Mimetic Forces and the Use of Structural Tools

Market-Driven Forces and Mimetic Forces include long-term institutional investors and corporate peer effects. Long-term institutional investors exert regulative pressure, pushing firms toward formal governance structures aligned with institutional standards [4]. This pressure strategically channels firms toward adopting structural tools that reconcile external governance demands with the preservation of family control [32]. By implementing mechanisms like dual-class shares or family holding companies, firms can secure essential external capital while maintaining decision-making authority, improving the sustainable development of firms, and meeting rising investor expectations for robust, transparent ESG frameworks.
Corporate peer effects drive mimetic isomorphism, as firms emulate successful governance practices of industry leaders to reduce uncertainty and gain legitimacy [41,42]. When structural tools become institutionalized within an industry, especially those integrating ESG oversight mechanisms, adoption transforms from optional to normative, creating legitimacy imperatives for firms [43]. This process improves the sustainable development of firms by aligning firms with recognized governance standards, reducing stakeholder uncertainty, and enhancing credibility in environmental and social performance reporting.
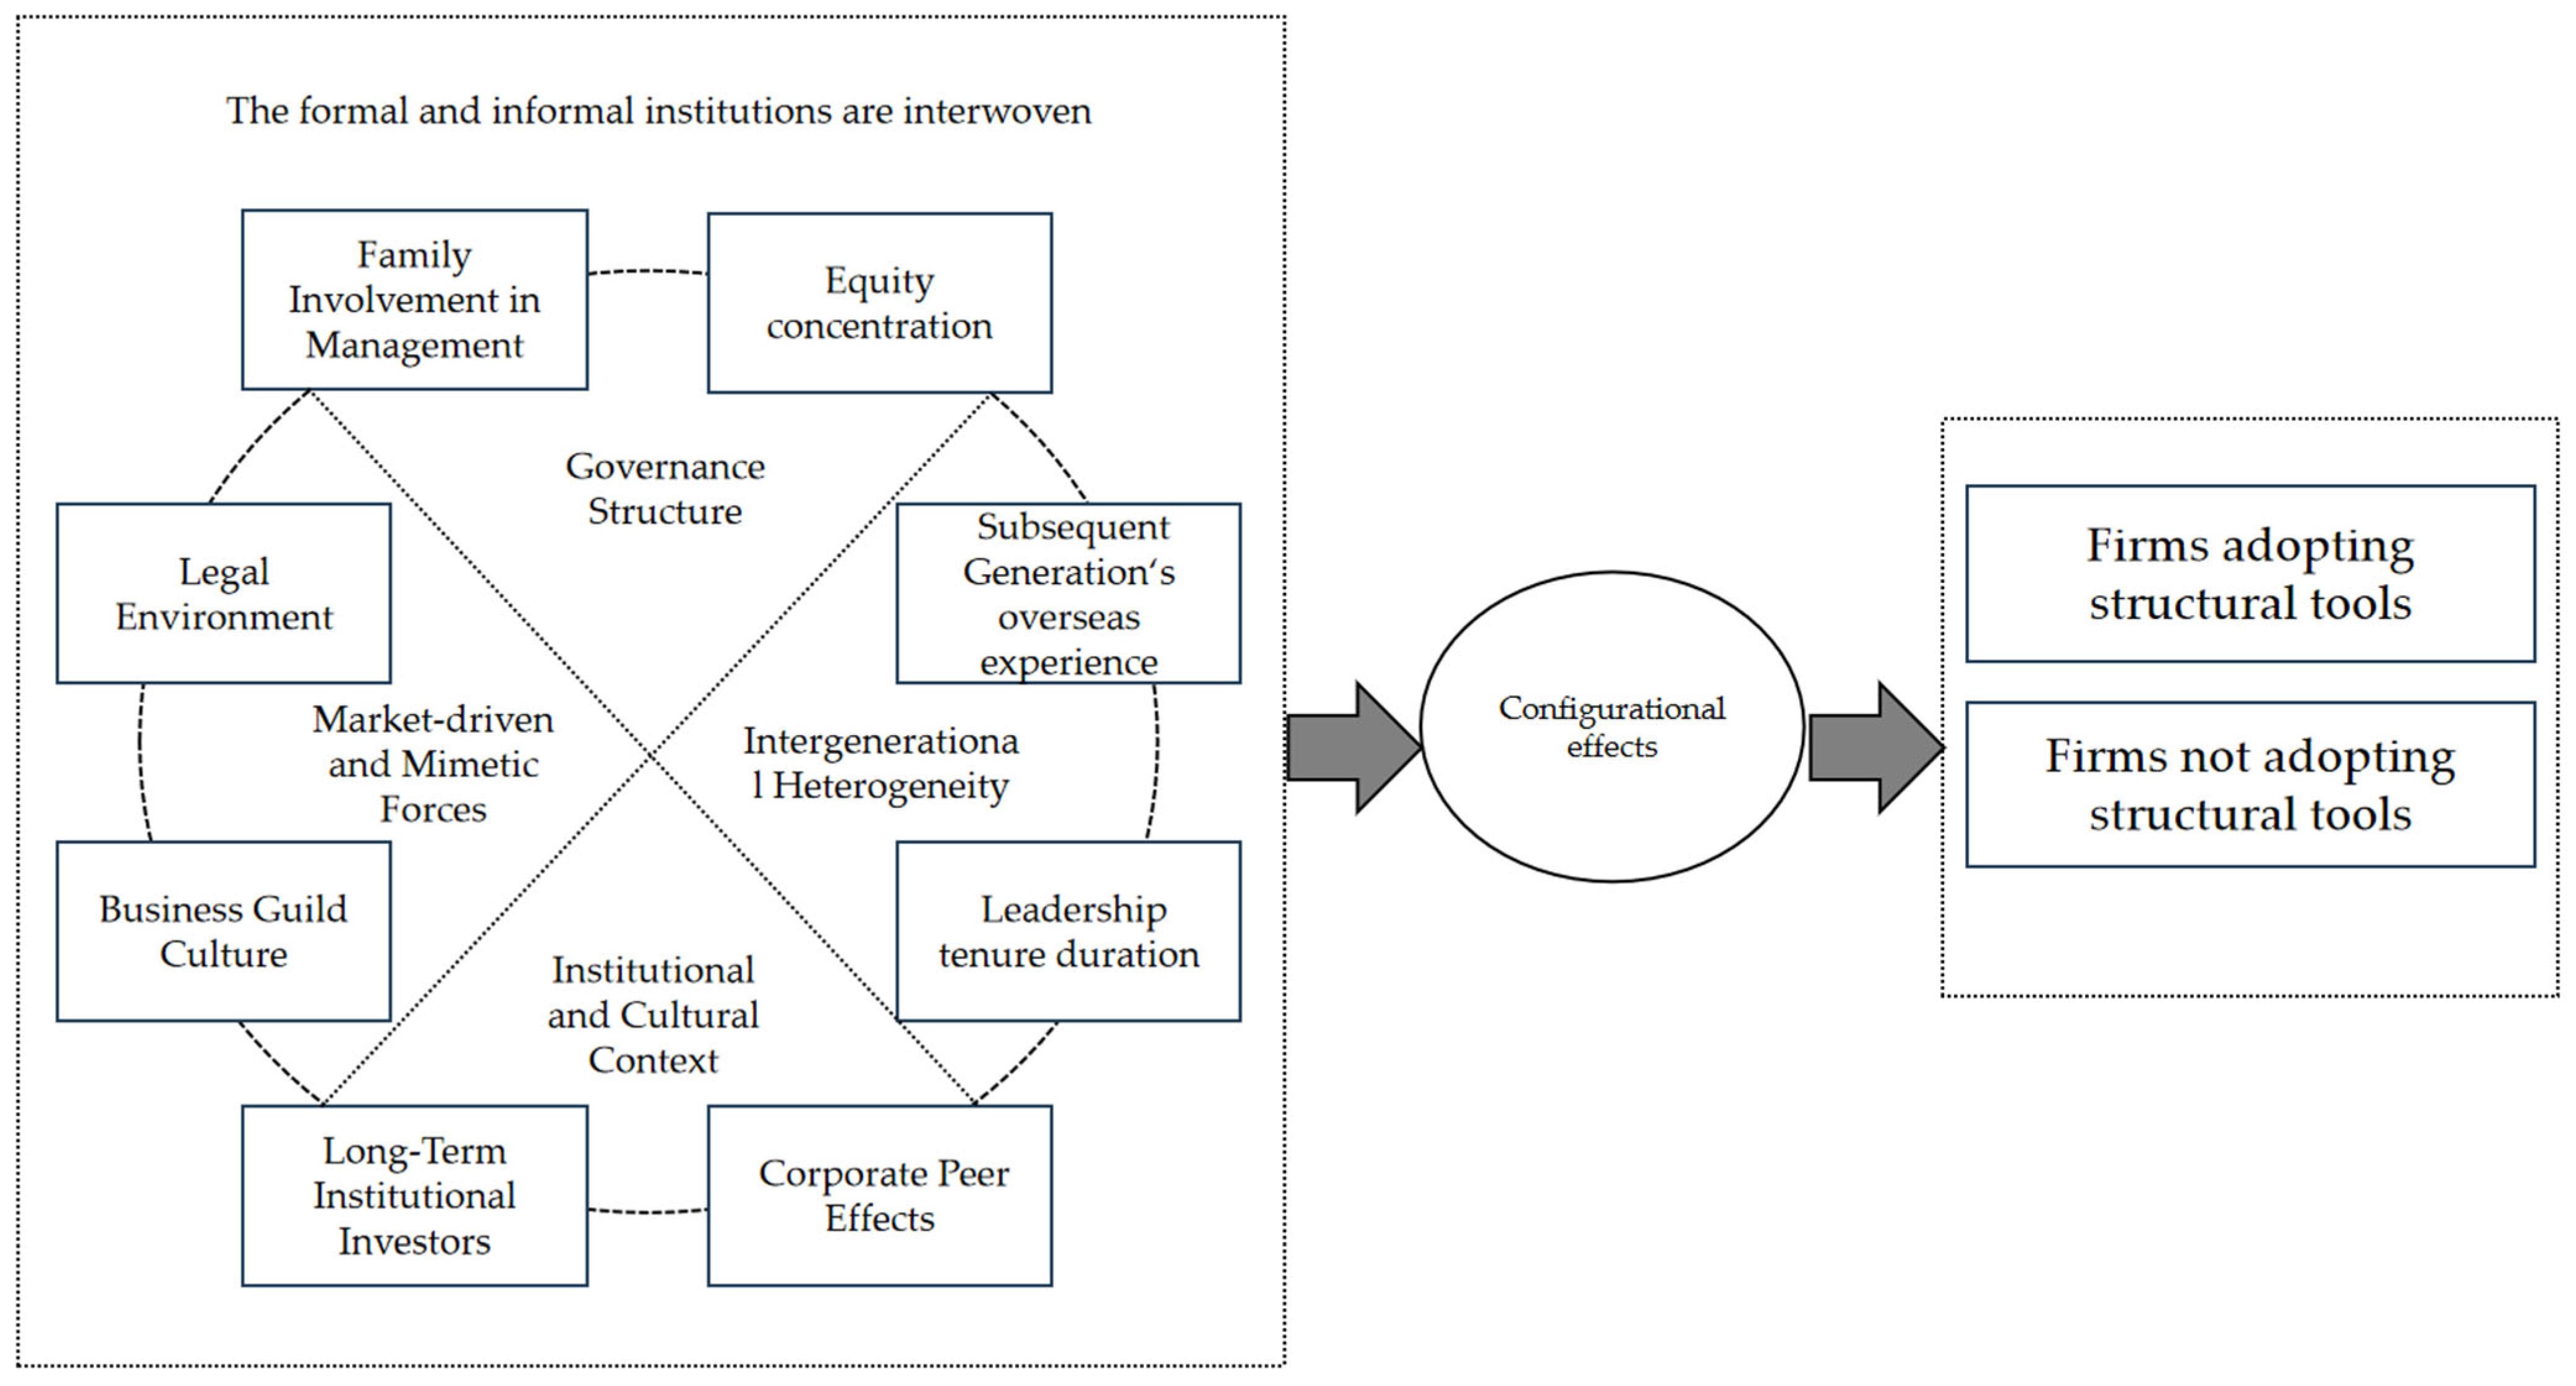
In summary, the adoption of structural tools by firms is shaped by the interplay of four institutional dimensions: family governance structure, intergenerational heterogeneity, institutional and cultural context, and market-driven and mimetic forces. These factors do not operate independently but interact within specific firm contexts, collectively shaping the configurational pathways through which firms adopt or refrain from adopting structural tools, ultimately influencing the firm’s sustainable development. The framework is depicted in Figure 1.

3. Research Design

3.1. Selection of Research Method

This paper adopts the fuzzy-set Qualitative Comparative Analysis (fsQCA) method to conduct the research, primarily based on the following considerations. The QCA method can identify configurations of condition variables leading to specific outcomes from a holistic perspective, thereby helping to reveal the multiple factors influencing firms’ use of structural tools and their combinatorial effects [13]. According to different data types, QCA can be divided into crisp-set QCA (csQCA), multi-value QCA (mvQCA), and fuzzy-set QCA (fsQCA). FsQCA offers greater analytical flexibility and robustness than csQCA, particularly when examining sufficient conditions [44], by preserving natural variation in data and capturing nuanced threshold effects [45]. Published fsQCA research frequently combines binary and continuous conditions within the same analysis [46]. The mixing of crisp and fuzzy sets is not only permissible but often necessary to accurately represent the complexity of organizational phenomena. Therefore, our choice of the fsQCA method is justified.

3.2. Sample Selection and Data Sources

To empirically examine the adoption of structural governance tools for sustainable development, this study focuses on Chinese listed family firms. This context offers clear empirical advantages for analyzing how structural tools shape sustainable development outcomes. First, Chinese family firms face core governance challenges central to this study, including balancing control retention with governance modernization and managing vulnerabilities during leadership transitions. The close intertwining of family relationships and ownership structures creates governance complexity, making this setting well-suited to examining the interaction between informal and formal governance mechanisms.
Second, Chinese family firms are at a critical historical juncture. Many first-generation entrepreneurs from the 1980s and 1990s reform era are approaching retirement, and a growing number of firms will face succession challenges in the near future. This demographic shift makes governance choices highly consequential and observable. While this succession pressure is particularly salient in China, similar challenges arise in Western contexts, especially among younger family firms undergoing first-generation transitions. In such cases, the governance dynamics identified in this study remain directly applicable.
Accordingly, this study uses Chinese listed family firms in 2024 as the research sample to explore the conditions and configurational paths influencing structural tool adoption. As there is no unified definition of family firms, this study follows prior literature and defines a firm as family-controlled if it meets four criteria: (1) The ultimate controller of the enterprise is a natural person or family. This excludes cases in which the actual controller is composed of multiple unrelated natural persons. In these cases, no family members hold shares or serve as directors, supervisors, or senior executives [47]. (2) The ultimate controller’s shareholding ratio is greater than 10% [48]. (3) At least two family members with kinship ties hold shares in the listed company or serve as senior executives, including positions such as chairman, directors, or senior management [49]. (4) At least two generations of family members are involved in the enterprise. The second-generation successor has a kinship relationship with the first generation or with the actual controller [50].
To ensure the validity and reliability of sample data, this paper conducts screening according to the following steps: First, enterprises with abnormal trading status such as ST or *ST are excluded; second, financial companies such as banks and securities firms are excluded; third, enterprises where the actual controller is inconsistent with the largest shareholder of the invested listed company are excluded; subsequently, enterprise samples where the kinship relationships of board members cannot be determined are excluded; finally, samples with severe data deficiencies are excluded.
The main data sources for this paper are the CSMAR database, combined with public information from CNINFO, Wind database, Chinese Research Data Services, and corporate annual reports. For family relationships and executive information of some enterprises, cross-validation and supplementation are conducted through manual retrieval of corporate announcements and news reports. After the above rigorous screening and verification, 444 valid sample enterprises are finally obtained.

3.3. Variable Measurement

In fsQCA research, variables are divided into outcome variables and condition variables. The outcome variable in this study is family firms’ use of structural tools. The condition variables are family involvement in management, equity concentration, leadership generation’s tenure duration, subsequent generation’s overseas experience, legal environment, business guild culture, long-term institutional investors, and corporate peer effects. The specifics are as follows.

3.3.1. Outcome Variable

Adoption of Structural Tools: Structural tools are defined as legally regulated and formally established legal entities or legal structures used for ownership holding purposes. These include holding companies, limited partnerships, foundations, and trusts. Among them, holding companies, limited partnerships, and foundations are legal entities, whereas trusts constitute legal structures. To measure the adoption of structural tools, we utilize the control chain data from the Chinese Research Data Services (CNRDS) database, which provides comprehensive information on the ultimate controlling shareholders of listed firms. Specifically, we trace the ownership structure through the control chain to identify the ultimate controlling shareholder. If the ultimate controlling shareholder is identified as a holding company, limited partnership, foundation, or trust, we classify the firm as adopting structural tools (coded as 1); otherwise, it is coded as 0. This approach ensures accurate identification by examining the actual legal form of the ultimate controlling entity rather than relying solely on intermediate ownership layers [51].

3.3.2. Condition Variable

  • Family involvement in management: Family management involvement is measured by whether there are family members on the board of directors, supervisors, and the senior management team. It is assigned a value of 1 if there are family members, and 0 otherwise [11,52].
  • Equity concentration: This variable is measured by the proportion of shares held by the family controller relative to the total shareholding of all family members within the firm’s top ten shareholders. Specifically, we first sum the shareholding ratios of all family members among the top ten shareholders, and then divide the family controller’s shareholding by this total to obtain the family controller’s proportion within the family’s total shareholdings in the top ten shareholders. If this proportion is higher than the median value of all sample firms, it is coded as 1; otherwise, it is coded as 0 [2].
  • Leadership tenure duration: The first generation’s tenure is measured by the total number of months they served as directors, supervisors, or senior management personnel in the company. If the first generation’s tenure exceeds the median tenure of the first generation in the sample firms, it is assigned a value of 1; otherwise, it is assigned a value of 0 [53,54].
  • Subsequent generation’s overseas experience: The second generation’s overseas experience is measured by whether the successor has overseas experience, including overseas study or overseas work experience. If the successor has overseas experience, it is assigned a value of 1; otherwise, it is assigned a value of 0 [55,56].
  • Legal environment: This is measured by the development of market intermediary organizations and the legal institutional environment in China’s Marketization Index. If the degree of marketization exceeds the median of all sample firms, it is assigned a value of 1; otherwise, it is assigned a value of 0 [57].
  • Business guild culture: The degree of business guild culture influence is measured by the geographical distance between the enterprise’s location and the birthplaces of the ten major business guilds. Specifically, the minimum distance between the listed company’s office location and each business guild’s birthplace is calculated, and its opposite number is used as the variable value. A smaller value indicates that the enterprise is closer to the business guild’s birthplace and is more strongly influenced by business guild culture [58,59]. The fourth quartile (95%), median, and first quartile (5%) of the case sample are set as the three calibration points for full membership, crossover point, and full non-membership, respectively, to calibrate business guild culture.
  • Long-term institutional investors: We use the trading behavior of institutional investors over the past four semi-annual periods as the criterion for distinguishing long-term investors from short-term investors. This paper defines them based on the turnover rate characteristics of institutional trading. The average turnover rate for each period is calculated based on the portfolio situation of institutional investors. Then, institutional investors are ranked by turnover rate and divided into three groups, with those having lower turnover rates defined as long-term investors. Finally, for each stock, the shareholding ratio of long-term institutional investors is calculated separately. This ratio is defined as the total number of shares held by long-term institutional investors in each period. It is divided by the total number of tradable shares in the same period [60,61]. The fourth quartile (95%), median, and first quartile (5%) of the case sample are set as the three calibration points for full membership, crossover point, and full non-membership, respectively, to calibrate institutional investors.
  • Corporate peer effects: The degree of structural tool usage in the province where the enterprise is located is measured by the number of sample firms using structural tools in that province [41,62]. Specifically, it refers to the total number of sample firms in the same province that have adopted structural tools. To calibrate firm-level peer effects, three thresholds are used. The fourth quartile (95%) is set as the point of full membership, the median as the crossover point, and the first quartile (5%) as the point of full non-membership.

4. Empirical Results and Analysis

4.1. Variable Calibration

This paper uses the direct calibration method to calibrate three continuous variables: business guild culture, long-term institutional investors, and corporate peer effects. Using the 75%, 50%, and 25% percentile values of the variable sample as the three calibration points for full membership, crossover point, and full non-membership would cause the calibrated values to polarize more toward the two extremes of 0 and 1. It poses a risk of information loss and may generate more contradictory configurations. Therefore, this paper uses the 95% and 5% percentile values as the qualitative anchor points for full membership and full non-membership. Meanwhile, this paper replaces the fuzzy set membership score of 0.5 with 0.501. The calibration anchor points for the variables are shown in Table 1.

4.2. Necessity Analysis of Individual Conditions

Before conducting the sufficiency analysis of configurational conditions for firms’ use of structural tools, this paper first performs a necessity test on each condition variable to identify whether there exists a single variable that has a decisive impact on the outcome variable. The table presents the consistency and coverage results of each condition variable under two outcomes. As shown in Table 2, when firms use structural tools, the consistency scores of each condition variable range from 0.217 to 0.882. In the context of firms not using structural tools, the consistency scores range from 0.114 to 0.886. The consistency values of all condition variables do not exceed the threshold of 0.9, indicating that no single necessary condition can independently determine the outcome, whether in the case of using or not using structural tools. This suggests that the differences in firms’ adoption behavior of structural tools are not driven by a single factor, but rather are the result of the interaction of multiple conditions.

4.3. Sufficiency Analysis

Sufficiency analysis identifies the minimal conditions sufficient for an outcome. Following established conventions, we set the consistency threshold at 0.8, the PRI threshold at 0.7, and the frequency threshold at 2 [63]. Using the fsQCA 3.0 software, we obtain three solution types: complex, parsimonious, and intermediate. We report the intermediate solution combined with the parsimonious solution as shown in Table 3 [13]. Conditions appearing in both solutions are “core conditions,” while those appearing only in the intermediate solution are “peripheral conditions.” It is important to note that fsQCA aims for configurational theorizing rather than variance explanation. Unlike regression analysis, fsQCA identifies sufficient causal pathways, not the proportion of variance explained. Therefore, consistency serves as the primary criterion for evaluating configurational sufficiency.
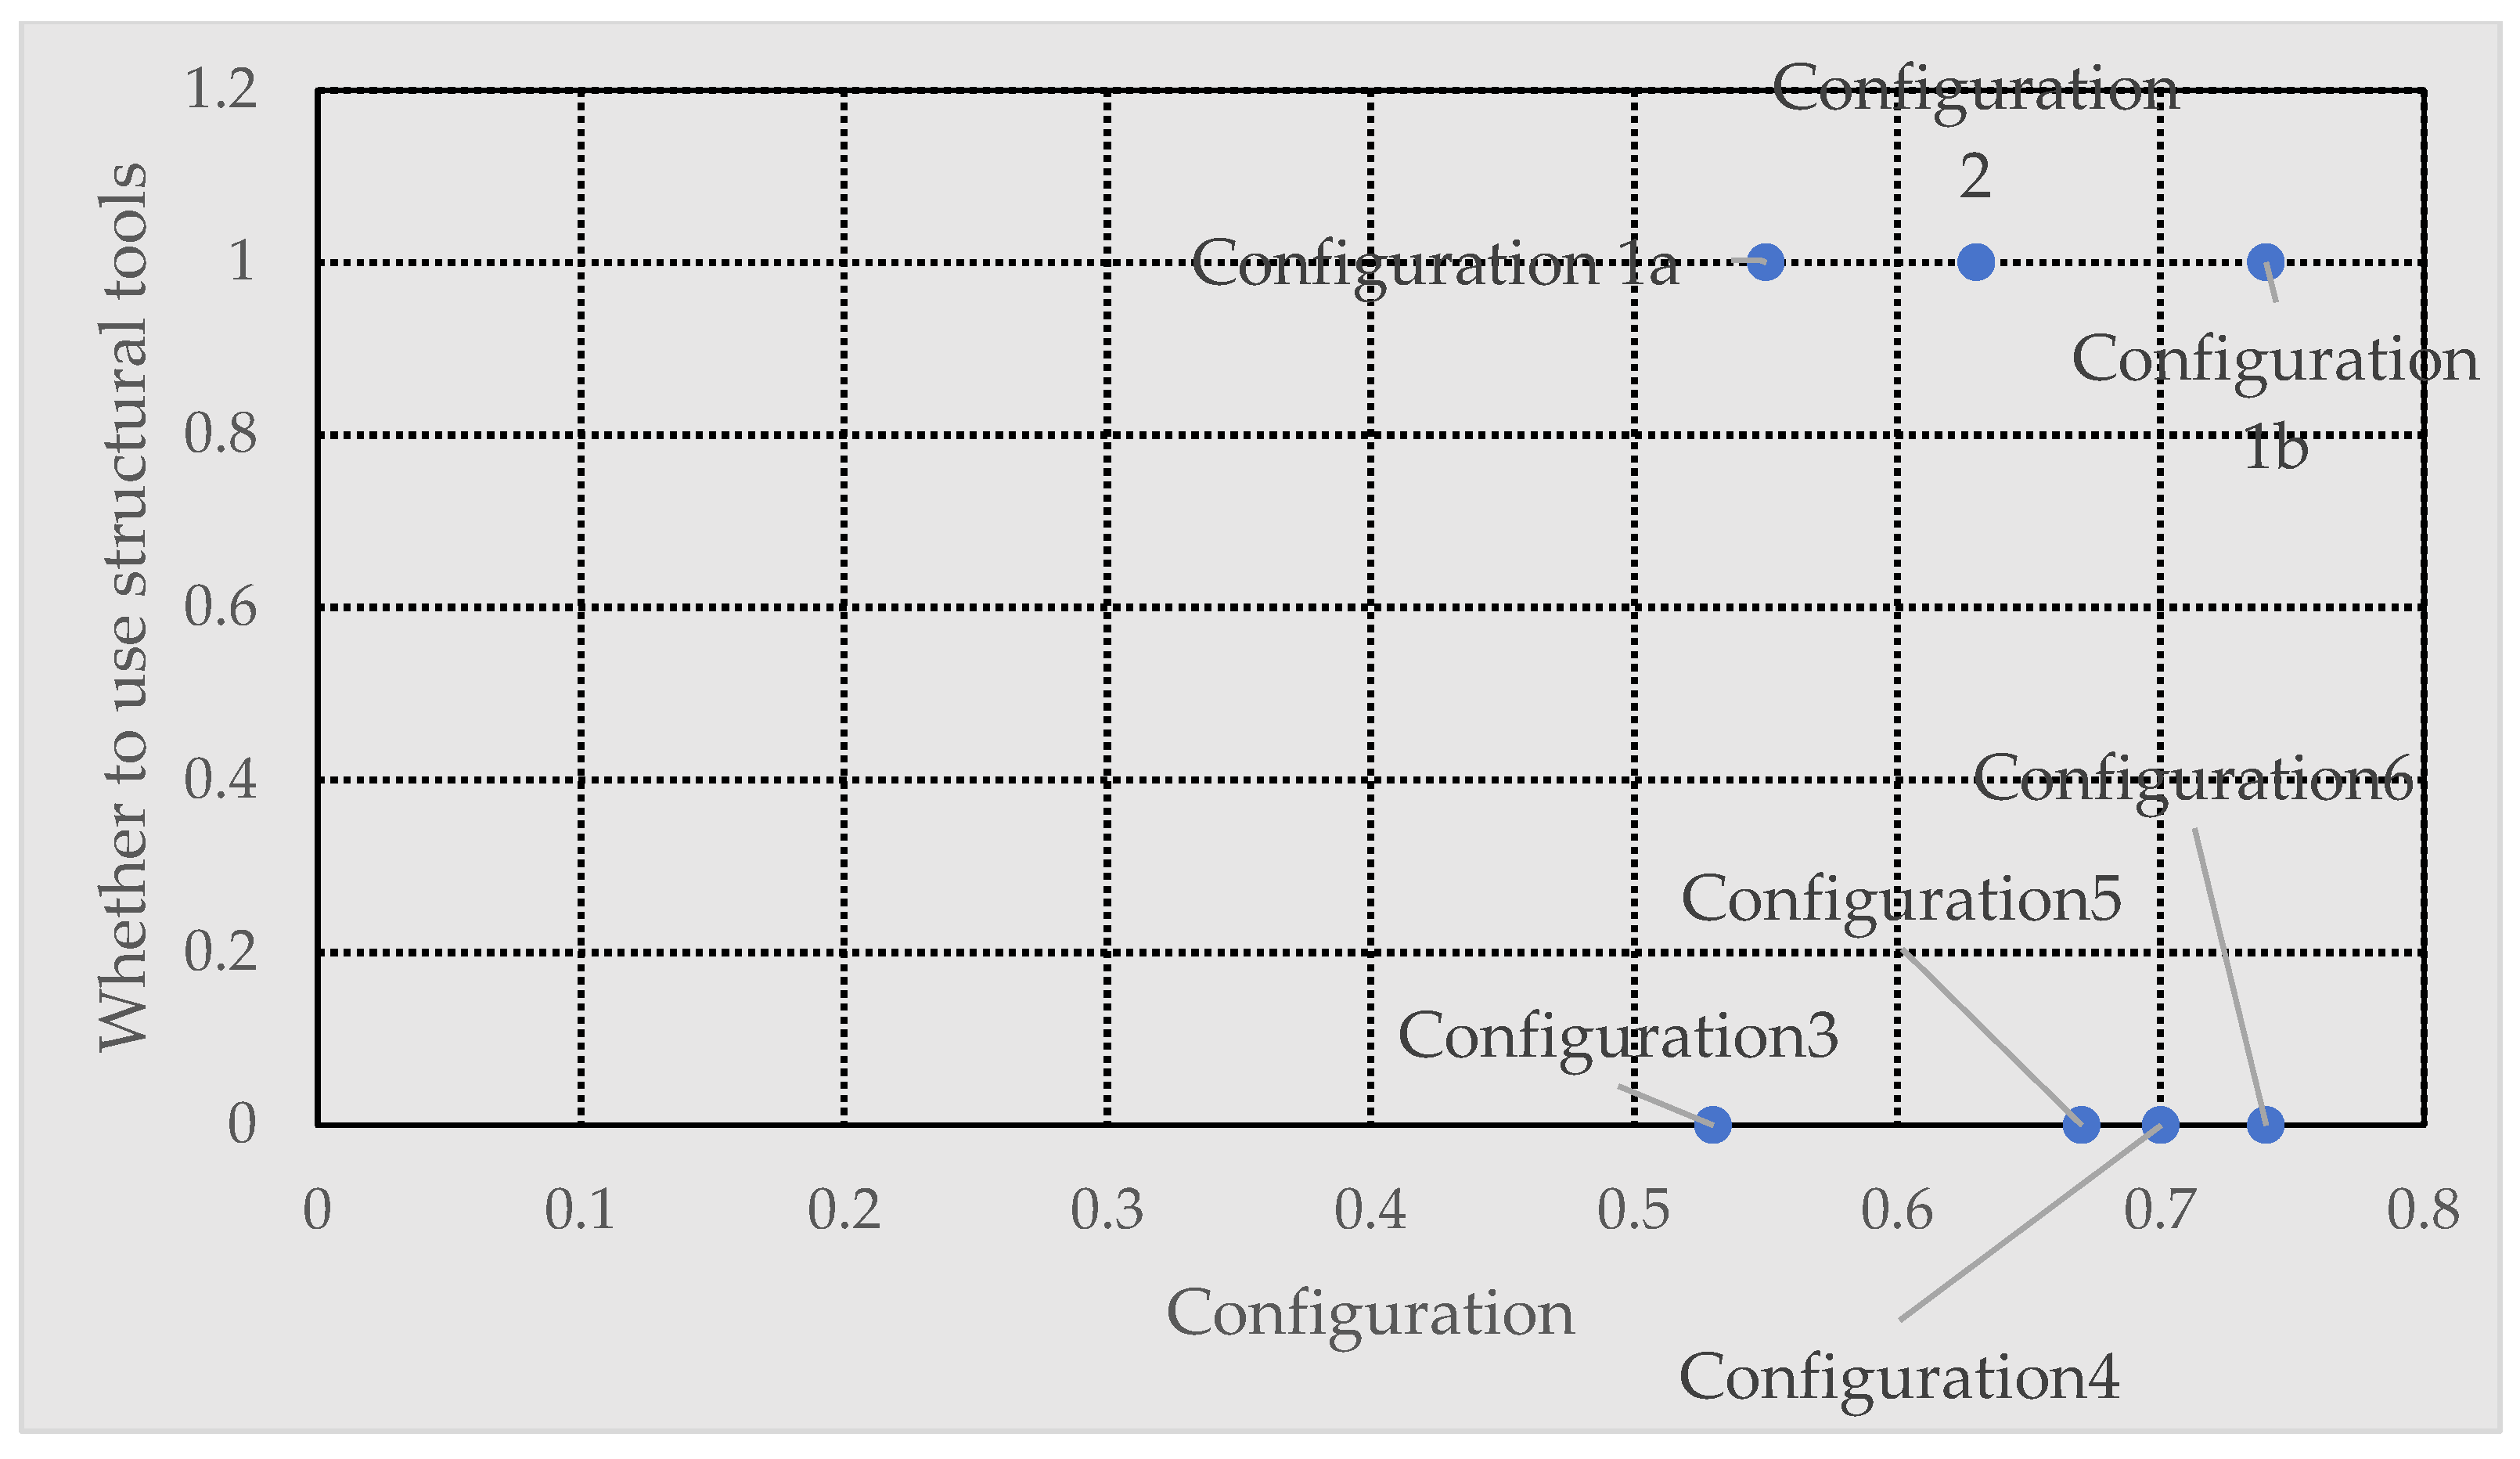
This study examines whether enterprises use structural tools, yielding seven configurations: M1a, M1b, M2, M3, M4, M5, and M6. All seven configurations show raw consistency exceeding 0.8. The overall solution consistency reaches 0.9015 and 0.8691, indicating that these configurations sufficiently explain structural tool adoption and non-adoption. Raw coverage shows the proportion of cases each configuration explains, while unique coverage shows the proportion explained exclusively by a single configuration. Although the solution coverage is small, Ragin (2009) [45] suggests that configurations with coverage above 0.01 are substantively meaningful, particularly when accompanied by high consistency. Our configurations clearly exceed this threshold, so our coverage values are sound. In addition, this study has drawn typical case diagrams for the seven configurations, as shown in Figure 2.

4.3.1. Driving Configurations for Firms’ Use of Structural Tools

1. Formal Institution-Dominated Configurations.
Configuration M1a “Legal-Authority Dual-Driven Type”: This configuration supports the sustainable development of family firms through the adoption of structural tools. It consists of three core conditions: a high-quality legal environment, long leadership tenure, and relatively dispersed equity. A strong legal system provides the institutional foundation for implementing structural tools that help secure intergenerational control [64], ensure long-term continuity, and establish a credible framework for meeting formal ESG commitments [39]. The leadership’s extended tenure reinforces informal authority and family cohesion, facilitating the firm’s sustainability. Dispersed equity creates a practical need to adopt structural tools. This consolidates control and prevents fragmentation [2]. This configuration shows how formal and informal institutions complement each other to promote structural tool adoption, thereby enhancing the firm’s sustainable development and its capacity to address ESG expectations.
Configuration M1b “Legal-Authority Internalized Type”: This configuration builds on M1a by adding weak corporate peer effects as a peripheral condition. A strong legal system and sustained leadership authority provide institutional and relational backing for adopting structural tools, including those that embed ESG oversight. Active family involvement in management further ensures the effective implementation and oversight of these tools. This aligns the firm’s sustainability practices with family values and facilitates long-term stewardship [57]. The absence of corporate peer effects indicates that the adoption of structural tools is not driven by mimetic pressures from other firms. Instead, it stems primarily from internal family initiative and institutional requirements [41]. This internalized approach strengthens control consolidation. It also aligns family and business interests and helps preserve socioemotional wealth across generations [57]. This configuration achieves sustainable development by combining formal institutional safeguards with deep family engagement in operational management. This approach enhances accountability in ESG performance [60].
2. Informal Institution-Dominated Configuration.
Configuration M2 “Elite-Autonomy Driven Type”: This configuration supports the sustainable development of family firms through structural tool adoption. It is characterized by three core conditions: long leadership tenure, significant subsequent generations’ overseas experience, and weak long-term institutional investors. These factors help overcome deficiencies in formal legal institutions. The family primarily relies on its internal capabilities to promote the use of structural tools. This approach ensures continuity and control across generations [65]. The subsequent generation’s international exposure introduces advanced governance practices, including emerging global ESG standards, enhancing the perceived value of long-term sustainability [66]. In the absence of strong institutional investor oversight, the family proactively adopts structural tools. It ensures alignment between family interests and long-term sustainability objectives. This approach demonstrates how family firms leverage human and social capital to adopt structural tools [21]. The configuration reflects a strategic shift toward professionalized governance driven by family initiative rather than external pressure. It strengthened the firm’s capacity for sustainable development and its alignment with broader ESG expectations.

4.3.2. Driving Configurations for Firms’ Non-Use of Structural Tools

1. Institutional Weakening Inhibition Configuration.
Configuration M3 “Centralized-Closed Type”: This configuration inhibits the sustainable development of family firms by preventing the adoption of structural tools. It is characterized by high equity concentration, along with the absence of strong leadership tenure, subsequent generations’ overseas experience, corporate peer effects, and family involvement in management. High equity concentration leads the family to rely solely on ownership for control, believing structural tools are unnecessary [30]. However, weak formal institutions reduce the legitimacy and feasibility of such tools [62]. Additionally, limited exposure to advanced governance practices diminishes the family’s understanding of their value for intergenerational continuity. This limited exposure results from short founder tenure and a lack of international experience [67]. The absence of strong peer effects or business guild culture further isolates the firm from external influence. This closed, equity-reliant model creates a governance gap. The resulting insularity also limits the firm’s engagement with evolving ESG expectations and reduces the adoption of structural tools; the absence of structural tools can undermine long-term family firm sustainability.
2. Formal Institution Inhibition Configurations.
Configuration M4 “Institution-Culture Insulation Type”: This configuration shows that family firms may choose not to adopt structural tools. This occurs even when conditions would normally encourage their use. Such a choice may create potential risks for sustainable development. The core conditions include high subsequent generations’ overseas experience, a strong legal environment, prominent business guild culture, weak long-term institutional investors, relatively dispersed equity, and weak corporate peer effects. Strong formal institutions provide a supportive legal framework [62]. Internationally exposed successors may also recognize the value of structural tools [65]. However, the absence of external investor pressure removes a key catalyst for formal governance modernization. At the same time, the persistence of a strong business guild culture creates institutional tension. This culture prioritizes relational and trust-based governance [30], which may conflict with the formal and legalistic approach embodied by structural tools. Without institutional investors to champion formal governance mechanisms, the firm may rely entirely on established informal networks and relational capital. As a result, formal structural tools may be perceived as redundant [30]. This configuration illustrates how deeply embedded informal institutions can dominate governance choices. When not counterbalanced by external investor influence, they may override both formal institutional pressures and successor internationalization, leading to a decision not to adopt structural tools. Reliance on informal mechanisms may hinder the systematic management of ESG risks and constrain the firm’s capacity to meet sustainability expectations.
Configuration M5 “Institution-Centralization Conflict Type”: This configuration shows that family firms may choose not to adopt structural tools, even in a strong formal legal environment. In such cases, control is maintained through highly concentrated equity and founder authority. A strong legal system theoretically supports the adoption of formal governance mechanisms [39]. High equity concentration combined with long founder tenure creates a powerful and centralized control structure [30]. This structure reduces the need for additional structural tools to manage family interests or succession. The firm may regard concentrated ownership and founder influence as sufficient to ensure continuity. At the same time, limited family involvement in management indicates reliance on professional managers. This creates a separation between ownership and control. Although professional management can provide expertise, it may weaken the informal governance mechanisms that support long-term ESG commitment. Despite the presence of conditions that could encourage modernization, such as subsequent generations’ international experience [65] and strong peer influence [41], the firm prioritizes centralized, equity-based control over formalized structural arrangements. This configuration suggests that a reliance on ownership concentration and founder centrality, even within a supportive formal institutional context, can lead to the underutilization of structural tools. This may constrain the firm’s capacity to systematically integrate ESG considerations into its governance. It may also hinder the firm’s adaptability to evolving sustainability expectations.
Configuration M6 “Institution-Control Sufficiency Type”: This configuration shows that family firms may choose not to adopt structural tools. This occurs when they are already supported by a strong combination of formal and informal governance resources. A strong legal environment provides external institutional support [39], while high equity concentration supplies substantial internal relational and cultural governance capital [59,65]. The absence of family involvement in management indicates a clear separation between ownership and operational control. This reduces the perceived need for additional structural tools to define professional management boundaries. At the same time, weak corporate peer effects limit exposure to mimetic pressures. As a result, the firm faces less encouragement to adopt structural tools [41]. Together, these conditions create a robust governance framework that substitutes for the need for additional structural tools [68]. The firm views its existing formal and informal mechanisms as sufficient. These mechanisms are considered adequate to ensure control continuity and intergenerational sustainability. As a result, the firm sees no need to adopt formalized structural tools. Introducing structural tools in such a context could result in governance redundancy, raising costs.

4.4. Robustness Test

To ensure the reliability and stability of our findings, this paper conducts systematic robustness tests by adjusting key analytical thresholds in the fsQCA method. Specifically, we increase the PRI threshold from 0.7 to 0.75 and raise the consistency threshold from 0.8 to 0.83. The PRI threshold serves as a filter to exclude configurations with high levels of contradiction, where cases sharing the same condition pattern produce different outcomes. By raising this threshold from 0.7 to 0.75, we impose a more stringent criterion that retains only configurations with minimal internal contradictions, thereby enhancing the interpretability and reliability of our results. Similarly, the consistency threshold measures the degree to which cases within a configuration consistently lead to the same outcome, functioning as an indicator of configurational fit [45]. Increasing this threshold from 0.8 to 0.83 ensures that only configurations with very high within-group homogeneity are included in the final solution, reducing the risk of including poorly fitting or ambiguous patterns. After applying these more conservative thresholds, we re-estimate the configurational models for both outcomes: firms using structural tools and firms not using structural tools. As shown in Table 4 and Table 5, the resulting configurations remain identical to those identified in the baseline analysis. All seven configurations (M1a, M1b, M2, M3, M4, M5, M6) are preserved without any additions or deletions. Moreover, the core conditions and peripheral conditions within each configuration remain unchanged, and the consistency and coverage values show only minimal variation compared to the baseline results. These robustness checks provide strong evidence that our research conclusions are reliable.

5. Further Test

The preceding fsQCA analysis and the following regression analysis serve complementary purposes and follow different analytical logics. FsQCA identifies sufficient configurations, combinations of conditions that consistently lead to structural tool adoption, revealing multiple equifinal pathways to the outcome. It answers the question: “What combinations of institutional conditions enable firms to adopt structural tools?” In contrast, regression analysis estimates average net effects across the full sample, answering: “To what extent do structural tools enhance sustainable development outcomes?” These two approaches address different but related questions. FsQCA uncovers the causal pathways (the “how”), while regression quantifies the magnitude of impact (the “how much”). Together, they provide a more comprehensive understanding of the phenomenon. FsQCA reveals diverse routes firms can take depending on their institutional context, while regression demonstrates that regardless of the pathway taken, structural tools systematically improve sustainable development capacity and ESG performance. This dual-method design combines configurational theorizing with average-effect estimation, offering both theoretical depth and practical guidance.

5.1. Model Construction

To further support the argument that structural tool adoption promotes firms’ sustainable development, this study conducts additional analysis using the Chinese family business cases discussed above. Two outcome variables are examined: sustainable development capacity and ESG performance. Sustainable development capacity reflects internal governance quality and long-term operational resilience, while ESG performance represents firms’ external accountability in environmental, social, and governance practices. Together, they provide a comprehensive assessment of how structural tools contribute to sustained value creation. Sustainable development capacity is measured using a composite index constructed with the entropy method, which integrates multiple sustainability dimensions. Detailed variable definitions are provided in Table 6. The empirical model is specified as follows:
S D C i = j = 1 m W j × X i j ,
where, S D C i represents the sustainable development capacity score for firm i, m denotes the total number of indicators (m = 12 in this study), W j is the weight assigned to indicator j determined by the entropy method, and X i j is the standardized value of indicator j for firm i. The SDC score ranges from 0 to 1, with higher values indicating stronger sustainable development capacity.
ESG performance is measured using ratings from Huazheng and Wind, two leading Chinese ESG rating agencies. Annual ESG scores are constructed by first converting the original ordinal ratings into numerical values based on a unified cardinal scale. Each rating is assigned an equal weight of 0.5, as there is no clear theoretical basis to favor one system over the other in the Chinese context. Combining both sources helps reduce individual rating bias and improves measurement reliability, resulting in a more robust composite ESG score. The empirical analysis employs two-way fixed-effects regression models with standard control variables, including management shareholding ratio (Mashare), current ratio (CR), quick ratio (Quick), firm age (Firmage), and Tobin’s Q (TobinQ). Province and industry fixed effects are included to account for regional and sectoral heterogeneity. The results are reported in Table 7.

5.2. Mean Difference Tests

5.2.1. Sustainable Development Capacity

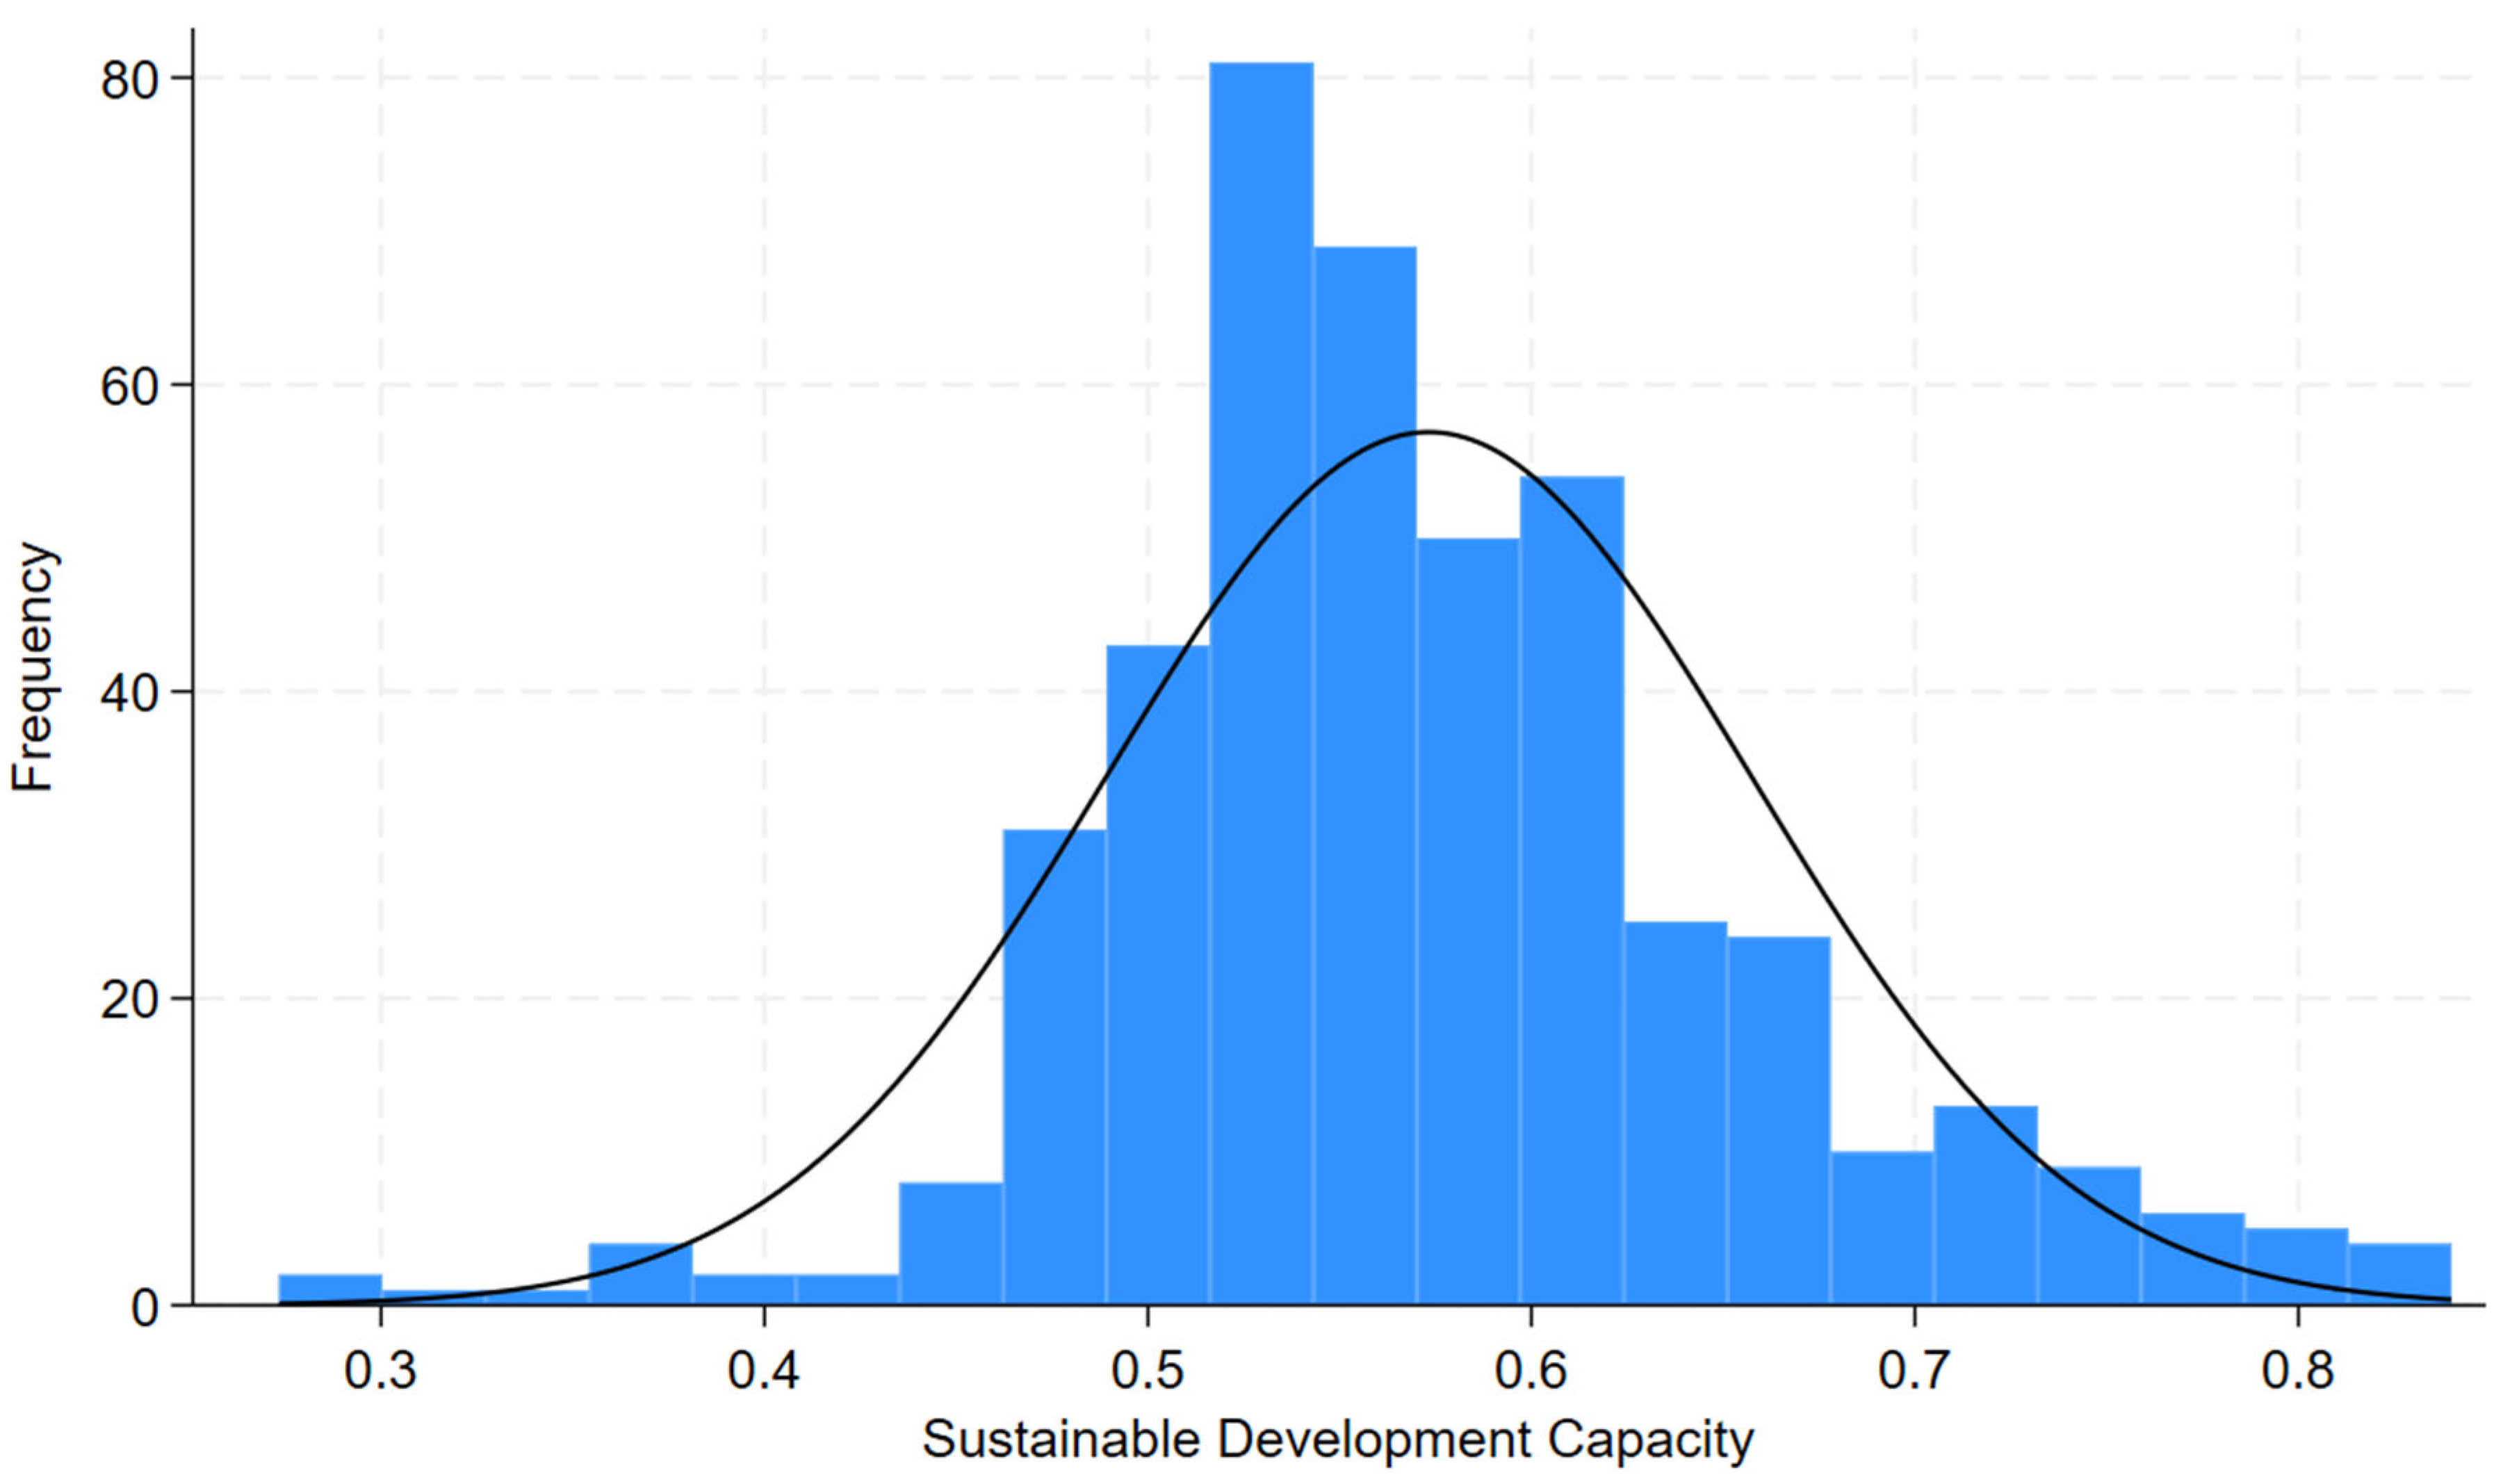
Figure 3 indicates that sustainable development capacity is approximately normally distributed, satisfying the normality assumption for the mean difference test. Accordingly, a mean difference test is conducted to examine the relationship between structural tool adoption and firms’ sustainable development capacity (Table 8). Among the 444 family firms in the sample, 216 adopt structural tools, and 228 do not. Firms using structural tools exhibit a higher mean sustainable development capacity (0.581) than non-adopting firms (0.566). The mean difference of −0.015 is statistically significant. The one-tailed test yields a p-value of 0.031 (5% level), while the two-tailed test yields a p-value of 0.062 (10% level), indicating robust results across test specifications. These findings suggest that structural tool adoption is positively associated with firms’ sustainable development capacity.
This evidence supports the study’s theoretical argument that structural tools facilitate long-term sustainability. Consistent with the configurational analysis, the results highlight the importance of formal institutional arrangements in strengthening governance stability, embedding long-term strategic orientation, and reducing transition-related risks. Together, these mechanisms contribute to sustained organizational growth and intergenerational value creation.

5.2.2. ESG Performance

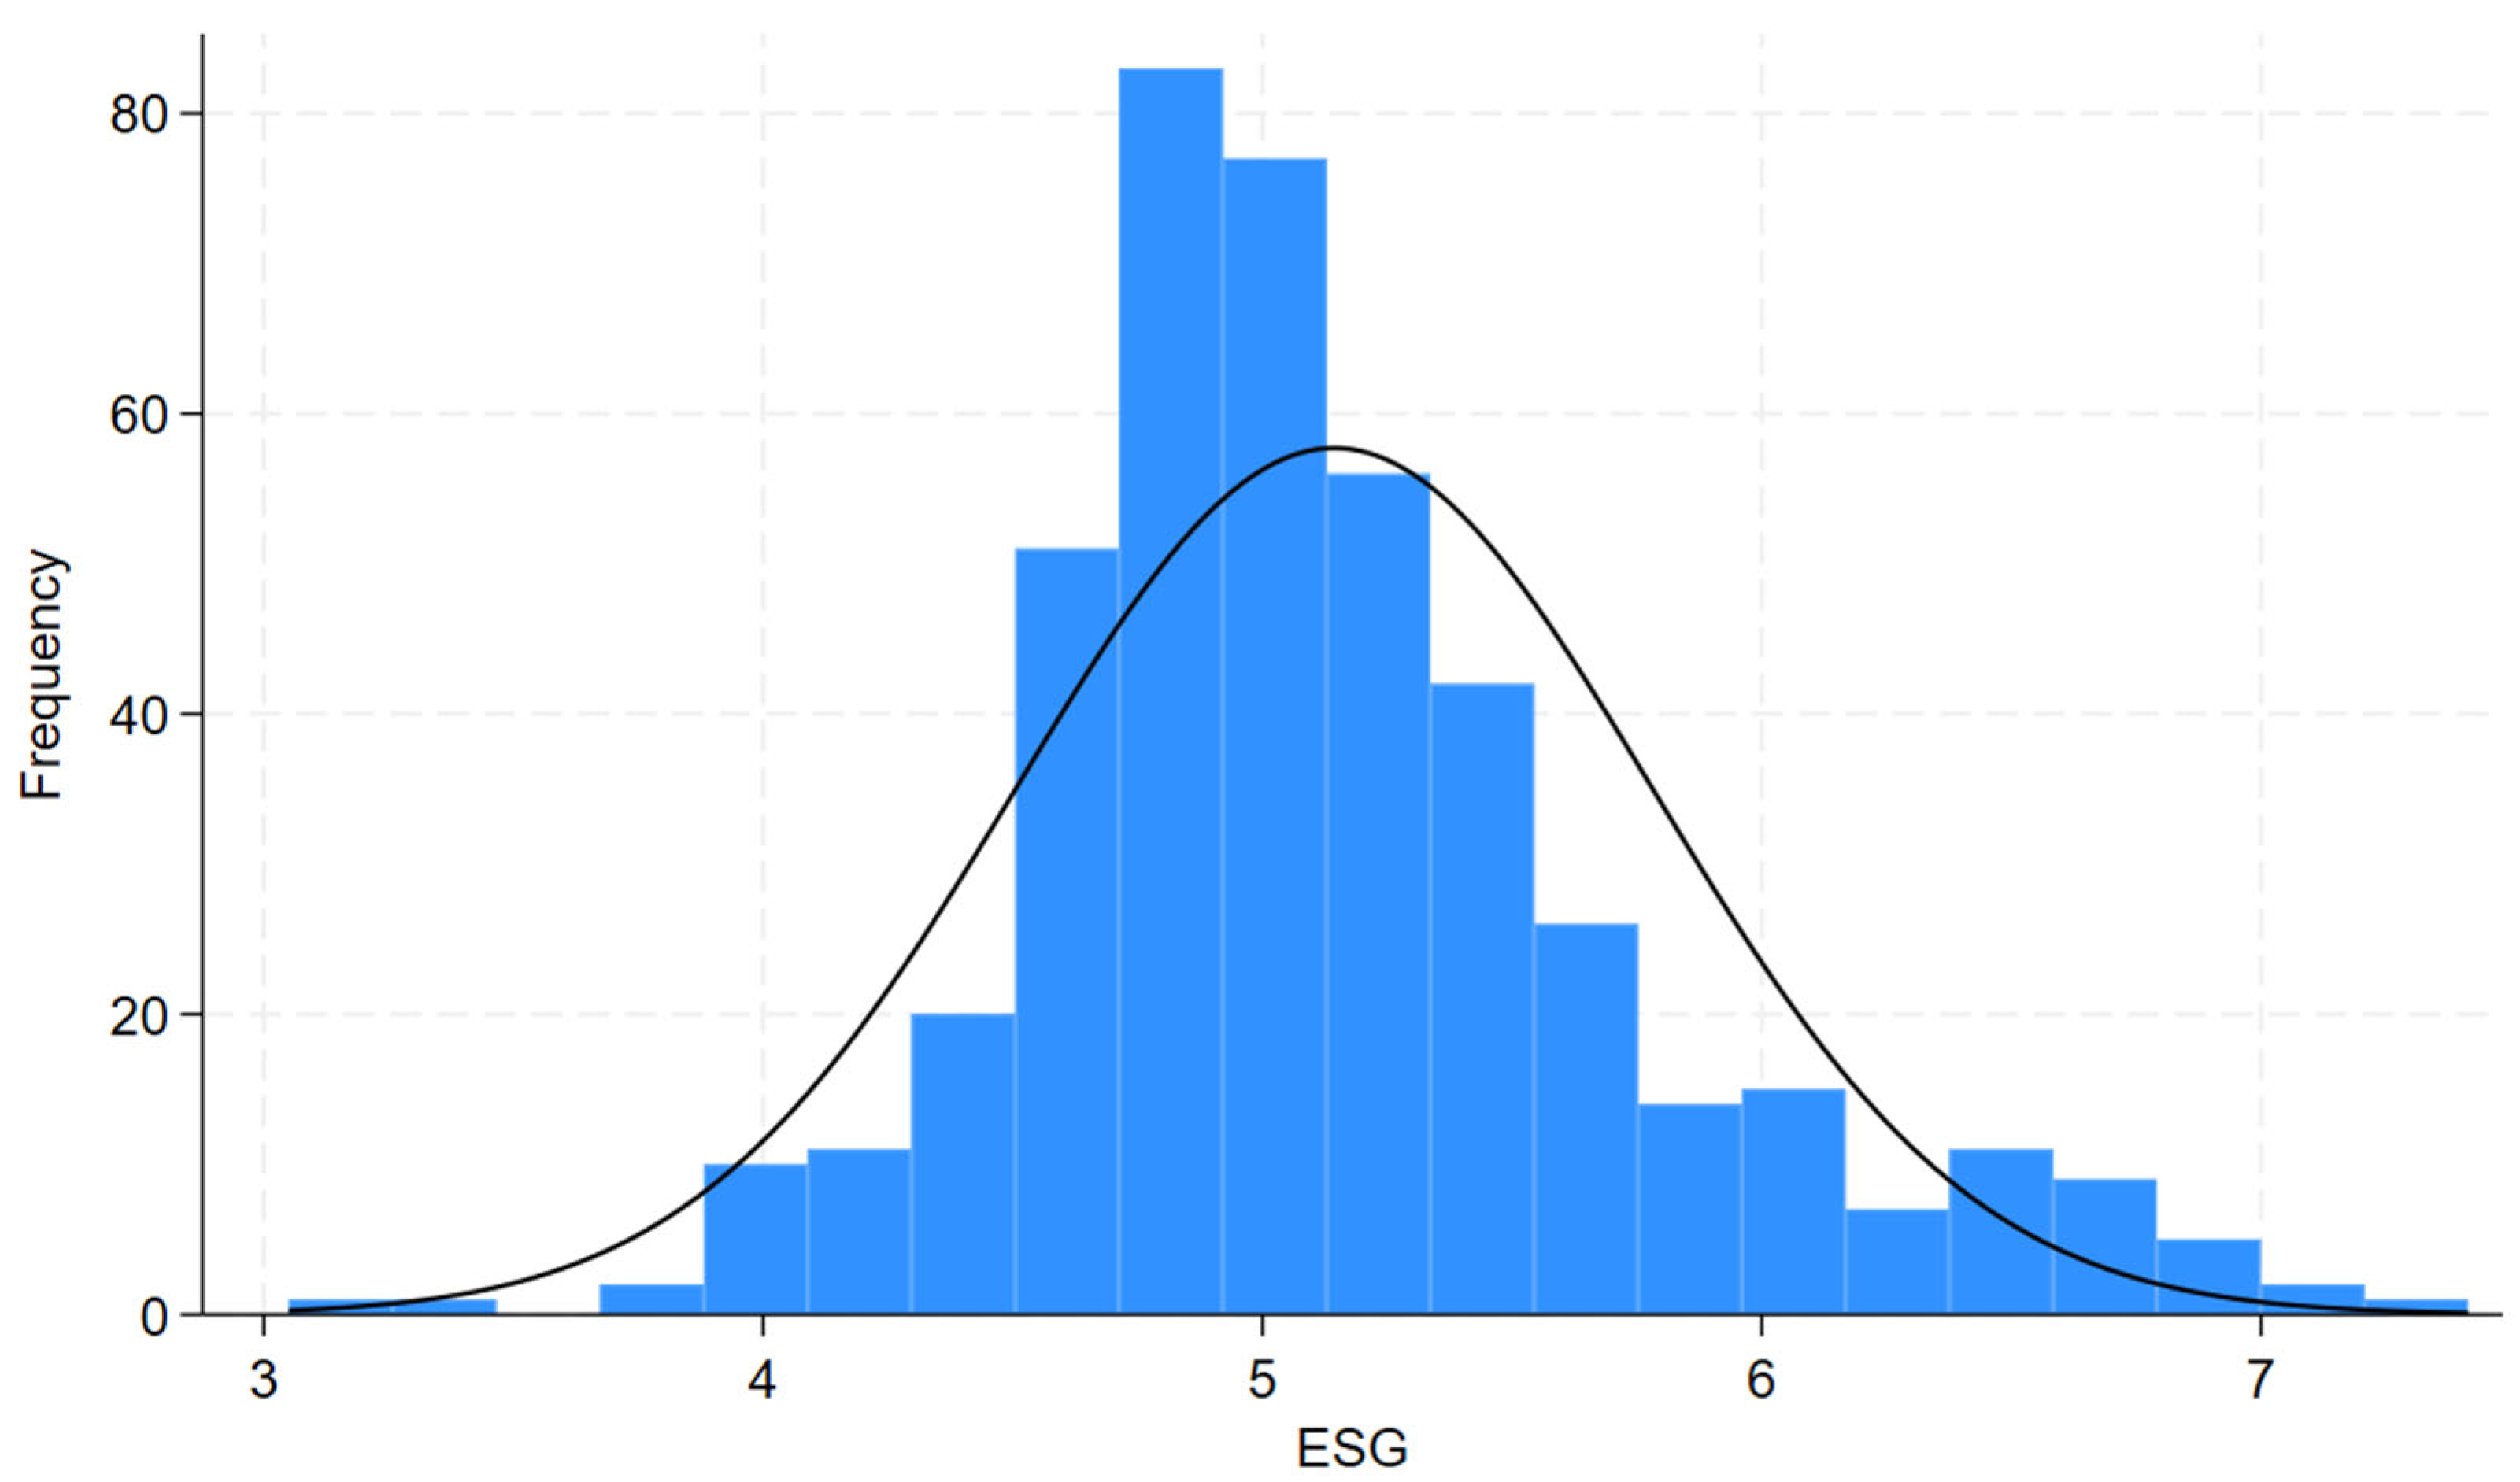
The second outcome variable, ESG performance, captures firms’ engagement in environmental, social, and governance practices, which are central to sustainable development. As shown in Figure 4, ESG scores in the sample are approximately normally distributed, satisfying the normality assumption for comparative analysis. A mean difference test is therefore conducted to examine the relationship between structural tool adoption and ESG performance, with results reported in Table 9. Among the 444 sample firms, those adopting structural tools (N = 216) exhibit a higher mean ESG score (5.197) than those not adopting such tools (N = 228; mean = 5.094). The mean difference of −0.103 indicates superior ESG performance among adopting firms. Robustness is confirmed through both one-tailed and two-tailed tests. The one-tailed test (H1: diff < 0) yields a p-value of 0.044, significant at the 5% level, while the two-tailed test yields a p-value of 0.089, significant at the 10% level. These results consistently suggest that structural tool adoption is positively associated with ESG performance. From a sustainable development perspective, these findings indicate that structural tools contribute to improved ESG outcomes. By institutionalizing governance through mechanisms such as trusts and holding companies, firms strengthen governance structures and allocate greater attention to environmental and social responsibilities. Such formal arrangements enhance institutional stability and facilitate the systematic integration of sustainability considerations into strategic decision-making. Taken together, the results for sustainable development capacity and ESG performance provide evidence that structural tools are important for promoting sustainability.

5.3. Two-Way Fixed Effects Regressions

Table 10 reports two-way fixed-effects regression results examining the association between structural tool adoption and two sustainability indicators: Sustainable Development Capacity and ESG Performance. These are cross-sectional OLS regressions with province and industry dummy variables. The analysis uses the listed firms after winsorizing extreme values at 5%. To strengthen identification, the models control for both province and industry fixed effects simultaneously. Province fixed effects absorb all time-invariant provincial characteristics (e.g., regional economic development, local institutional quality) that might correlate with both structural tool adoption and outcomes. Industry fixed effects absorb all industry-specific factors (e.g., capital intensity, competitive dynamics) that could confound the relationship. By including both sets of fixed effects, we isolate variation in structural tool adoption independent of these major confounding sources. This procedure automatically excludes firms that are the only observations in a given province-industry cell to avoid perfect collinearity. Consequently, the final estimation sample consists of 432 firms.
The results in Table 10 show a consistent positive association between structural tools and sustainable development. For sustainable development capacity, the adoption of structural tools is positively related to firm performance. After controlling for province and industry fixed effects, the coefficient is 0.017 and significant at the 5% level. When additional control variables are included, the coefficient increases to 0.022 and remains significant. These results indicate that firms using structural tools tend to exhibit stronger sustainable development capacity. A real-world case illustrates this mechanism. The founders of Longhu Properties, Wu Yajun and Cai Kui, established family trusts. Following their divorce in 2012, the trust arrangement helped preserve stable ownership and protected the firm from internal disputes [69].
Similar results are observed for ESG performance. With province and industry fixed effects, structural tool adoption is positively associated with ESG outcomes, with a coefficient of 0.135, significant at the 5% level. After adding control variables, the coefficient rises to 0.153 and remains significant. This suggests that firms employing structural tools tend to achieve better ESG performance. An illustrative example is Midea Group. In July 2017, the founder established a perpetual charitable trust. The trust supports social initiatives and is closely aligned with Midea’s overall ESG strategy. Through sustained ESG engagement, Midea was recognized on the 2025 Fortune China ESG Impact List [70]. This case further demonstrates how structural tools can facilitate ESG improvements.

5.4. Robustness Tests and Endogeneity Treatment for Two-Way Fixed Effects Regressions

5.4.1. Instrumental Variables (IV) Approach

To address potential endogeneity in the core explanatory variable, we employ an internal IV method based on heteroskedasticity following Lewbel (2012) [71]. This approach helps mitigate endogeneity concerns by using the model’s own heteroskedasticity to construct valid instruments. While it does not eliminate all sources of bias, it strengthens confidence in our findings. The procedure works as follows. First, we estimate a fixed-effects model regressing the core explanatory variable on all controls and extract the residuals. Following Lewbel (2012) [71], we select variables with pronounced heteroskedasticity to construct instruments. We then calculate each control variable’s deviation from its sample mean and multiply it by the residual to form each instrument. This uses the model’s own heterogeneity to strengthen instrument relevance while preserving exogeneity.
In the IV regression, province and industry fixed effects are fully absorbed, so the constant is not separately reported. The effective sample size (N = 296) is smaller due to stricter data requirements. To construct valid internal instruments and meet exogeneity assumptions, observations with only one firm in a province-industry group are automatically removed. The baseline reghdfe model only drops observations with missing variables, while the IV method also filters out observations without within-group variation. This ensures instrument strength and estimate consistency. Tests confirm this filtering does not bias key variable distributions or affect our conclusions.
Column “IV Approach” of Table 11 reports the results. After controlling for province and industry fixed effects, the coefficient on SDC is 0.026, significant at the 10% level, and the coefficient on ESG is 0.196, significant at the 10% level. Table 12 shows diagnostic tests. The Kleibergen-Paap rk LM statistic is 79.069 (p = 0.000), rejecting underidentification. The Kleibergen-Paap rk Wald F statistic is 62.403, well above the Stock-Yogo critical value of 10.27 at 10%, suggesting no weak instrument problem [54,55]. The Hansen J statistic is 5.401 (p = 0.1447), indicating instrument exogeneity [56]. Overall, these tests confirm that the internal instruments satisfy relevance and exogeneity conditions. After addressing potential endogeneity, our main findings remain consistent.

5.4.2. Substitution of Dependent Variables

To further verify robustness, we replace the original continuous dependent variables with discrete ordinal variables based on quartile rankings. For both SDC and ESG, we classify the sample into four levels: values below the 25th percentile equal 1; those at or above the 25th percentile but below the 50th percentile are set to 2; those at or above the 50th percentile but below the 75th percentile are set to 3; and values at or above the 75th percentile equal 4. We then re-estimate the model with these transformed variables. Column “Substitution of Dependent Variables” of Table 11 shows the coefficient on SDC is 0.237, significant at the 10% level, and the coefficient on ESG is 0.312, significant at the 5% level. Thus, our main findings are robust to alternative ordinal specifications.

5.4.3. Alternative Model Specifications

To further examine robustness, we replace the fixed-effects model with a Tobit model. This accounts for potential censoring or corner solutions in SDC and ESG that may not be captured under linear fixed-effects estimation. In this specification, the Tobit model uses maximum likelihood estimation, so the traditional R-squared does not apply (indicated by “-“ in the table). The Tobit model in Stata 18 creates dummy variables even for provinces or industries with only one firm. However, these observations remain in the sample and contribute to the estimation of other parameters. As a result, the Tobit regression retains the full sample of 444 firms. Column “Alternative Model Specifications” of Table 11 shows the coefficient of Structural Tools on SDC is 0.022, significant at the 5% level, and the coefficient on ESG is 0.153, significant at the 5% level. These results remain consistent in magnitude and significance with our baseline and other robustness checks. Our findings are not sensitive to the estimation method, strengthening the reliability.

6. Conclusions and Discussion

6.1. Research Conclusions

Grounded in institutional theory and using fuzzy-set Qualitative Comparative Analysis (fsQCA), this study examines how multiple conditions jointly shape firms’ adoption of structural tools to support sustainable development. Based on data from 444 Chinese listed family firms, three main conclusions emerge.
First, the adoption of structural tools is driven by combinations of institutional conditions rather than any single necessary factor. Neither formal nor informal institutions alone are sufficient. This finding highlights the complexity and context dependence of governance decisions related to sustainable development, which are influenced by family governance characteristics, intergenerational heterogeneity, institutional and cultural environments, and market and mimetic pressures.
Second, formal and informal institutions interact in complementary, substitutive, and sometimes conflicting ways, shaping diverse governance pathways. The analysis identifies three configurations that promote structural tool adoption (M1a, M1b, M2) and four that inhibit it (M3–M6), reflecting heterogeneity across institutional contexts. For example, when formal institutions are weak, firms may rely on informal or external mechanisms—such as strong founder authority, internationally experienced successors, or long-term institutional investors—to facilitate structural tool adoption and support stable intergenerational transition.
Third, adopting structural tools significantly enhances firms’ sustainable development capacity and ESG performance. Additional t-tests and fixed-effects regressions show that family firms using structural tools outperform those that do not in both sustainability and ESG outcomes. These results confirm that structural tools, as formal institutional arrangements, strengthen governance stability, improve long-term competitiveness, and support intergenerational continuity, thereby serving as key mechanisms for sustainable development in family firms.
Generalizability: Our core theoretical insight—that firms strategically combine formal and informal institutions to build sustainable governance—applies broadly to contexts with institutional pluralism. This includes emerging economies, transition economies, and developed economies. However, the specific configurations we identify reflect China’s unique institutional history and may not directly transfer elsewhere. The configurational logic and importance of institutional fit are generalizable; the specific condition combinations are context-dependent. Researchers and practitioners should adapt our framework to local institutional realities rather than mechanically applying our findings.

6.2. Practical Implications

Drawing on these findings, we offer three-level recommendations that address universal challenges in building sustainable governance systems while acknowledging context-specific implementation.
First, for firms: Adopt configurational governance strategies. Firms should not rely on a single governance mechanism. Instead, they should flexibly combine formal and informal governance tools based on their institutional environment, ownership structure, and generational stage. This principle applies universally, though specific tool choices vary by context. For example, in China, listed companies originating as Township and Village Enterprises (TVEs) navigate informal customary practices, resource constraints, and complex succession planning simultaneously. Globally, family firms transitioning between generations face similar challenges but draw on different institutional resources (e.g., common law trusts in the UK, foundations in Germany, holding companies in Japan). The universal principle is early structural planning for governance continuity. The specific tools—trusts, holding companies, foundations, or hybrid arrangements—should fit local institutional infrastructure and regulatory frameworks. Timely adoption strengthens governance stability, protects assets, and enhances capacity for managing long-term ESG commitments across diverse contexts.
Second, for policymakers: Build institutional infrastructure for governance innovation. This includes improving legal systems for trust and holding company arrangements, enhancing property rights protection, and reducing regulatory uncertainties. Clear, stable regulations lower institutional costs and enable firms to adopt structural tools more easily. Policymakers should also align governance regulations with ESG requirements to create synergies. This recommendation generalizes broadly to emerging and transition economies where formal institutional development lags behind economic growth. However, developed economies also benefit from updating legacy regulations to accommodate new governance forms (e.g., benefit corporations, social enterprises). The core insight is that formal institutional quality directly affects firms’ capacity to build sustainable governance, regardless of developmental stage.
Third, for industry associations and professional networks: Reduce information asymmetries through knowledge sharing. Through case sharing, best practice documentation, and peer learning platforms, these organizations can reduce information asymmetries about structural tools. Educational initiatives should clarify how different governance mechanisms support ESG integration and long-term value creation. This builds collective knowledge that helps entrepreneurs make informed governance choices. Knowledge diffusion creates normative pressure and social recognition that encourage sustainable governance practices. This mechanism operates in any context where professional networks and industry associations exist, though the specific knowledge transferred reflects local institutional conditions.

Author Contributions

Conceptualization, J.S. and M.S.; methodology, M.S.; software, M.S.; validation, M.S., H.Y.; data curation, M.S., H.Y.; writing, M.S.; investigation, M.S.; supervision, J.S.; funding acquisition, J.S. All authors have read and agreed to the published version of the manuscript.

Funding

Research on the A Case Study Approach to Innovation and Entrepreneurship under the Rural Revitalization Strategy (Project No. H20240073) and the Research on the Current Professional Status and Development of Maintenance Practitioners in China’s New Energy Vehicle Industry (Project No. H20250057).

Institutional Review Board Statement

Not applicable.

Informed Consent Statement

Not applicable.

Data Availability Statement

The data presented in this study are available on request from the corresponding author.

Conflicts of Interest

The authors declare no conflicts of interest.

References

  1. EcoVadis. A Comparison of CSR Performance: UN Global Compact Signatories vs. Non-Signatories; EcoVadis Research Report; EcoVadis: Paris, France, 2019; Available online: https://resources.ecovadis.com/sustainable-procurement/comparison-csr-performance-un-global-compact-signatories-non-signatories (accessed on 1 February 2026).
  2. Anderson, R.C.; Reeb, D.M. Board composition: Balancing family influence in S&P 500 firms. Adm. Sci. Q. 2004, 49, 209–237. [Google Scholar] [CrossRef] [Scilit]
  3. Aguilera, R.V.; Crespi-Cladera, R. Firm family firms: Current debates of corporate governance in family firms. J. Fam. Bus. Strategy 2012, 3, 66–69. [Google Scholar] [CrossRef] [Scilit]
  4. 20 Years of UN Global Compact: How Sustainability Ratings Help Companies Kick-Start the Decade of Action. Available online: https://ecovadis.com/blog/20-years-of-un-global-compact-how-sustainability-ratings-help-companies-kick-start-the-decade-of-action/ (accessed on 15 June 2020).
  5. Aguilera, R.V.; Crespi-Cladera, R. Global corporate governance: On the relevance of firms’ ownership structure. J. World Bus. 2016, 51, 50–57. [Google Scholar] [CrossRef] [Scilit]
  6. Aguilera, R.V.; Jackson, G. The cross-national diversity of corporate governance: Dimensions and determinants. Acad. Manag. Rev. 2003, 28, 447–465. [Google Scholar] [CrossRef] [Scilit]
  7. IKEA Invests EUR 1.5 Billion to Accelerate Phase out of Fossil Fuels. Available online: https://www.ingka.com/newsroom/ikea-invests-eur-1-5-billion-to-accelerate-phase-out-of-fossil-fuels/ (accessed on 14 November 2024).
  8. The Climate Footprint Across the IKEA Value Chain. Available online: https://www.ikea.com/global/en/our-business/sustainability/value-chain-climate-footprint/ (accessed on 13 December 2024).
  9. Ikea Reports 30% Emissions Reduction Since 2016. Available online: https://real-economy-progress.com/ikea-reports-30-emissions-reduction-since-2016/ (accessed on 31 January 2025).
  10. Yu, V.; Cheng, J. Legal Battle Among ‘Secret’ Family of Wahaha Founder Exposes China’s Wealth Succession Crisis. South China Morning Post, 9 September 2025. Available online: https://www.scmp.com/business/china-business/article/3324534/legal-battle-among-secret-family-wahaha-founder-exposes-chinas-wealth-succession-crisis (accessed on 1 February 2026).
  11. North, D.C. Institutions, Institutional Change and Economic Performance; Cambridge University Press: Cambridge, UK, 1990. [Google Scholar]
  12. Peng, M.W.; Sun, W.; Vlas, C.; Minichilli, A.; Corbetta, G. An institution-based view of large family firms: A recap and overview. Entrep. Theory Pract. 2018, 42, 187–205. [Google Scholar] [CrossRef] [Scilit]
  13. Fiss, P.C. Building better causal theories: A fuzzy set approach to typologies in organization research. Acad. Manag. J. 2011, 54, 393–420. [Google Scholar] [CrossRef] [Scilit]
  14. La Porta, R.; Lopez-De-Silanes, F.; Shleifer, A.; Vishny, R. Investor Protection and Corporate Valuation. J. Financ. 2002, 57, 1147–1170. [Google Scholar] [CrossRef] [Scilit]
  15. Helmke, G.; Levitsky, S. Informal Institutions and Comparative Politics: A Research Agenda; Edward Elgar Publishing: Cheltenham, UK, 2012. [Google Scholar]
  16. Nahapiet, J.; Ghoshal, S. Social capital, intellectual capital, and the organizational advantage. Acad. Manag. Rev. 1998, 23, 242–266. [Google Scholar] [CrossRef] [Scilit]
  17. Peng, M.W. Institutional transitions and strategic choices. Acad. Manag. Rev. 2003, 28, 275–296. [Google Scholar] [CrossRef] [Scilit]
  18. Furnari, S.; Misangyi, V.F.; Fiss, P.C.; Crilly, D.; Aguilera, R.V. Capturing causal complexity: Heuristics for configurational theorizing. Acad. Manag. Rev. 2021, 46, 778–799. [Google Scholar] [CrossRef] [Scilit]
  19. Williamson, O.E. The new institutional economics: Taking stock, looking ahead. J. Econ. Lit. 2000, 38, 595–613. [Google Scholar] [CrossRef] [Scilit]
  20. DiMaggio, P.; Powell, W.W. The iron cage revisited: Institutional isomorphism and collective rationality in organizational fields. Am. Sociol. Rev. 1983, 48, 147–160. [Google Scholar] [CrossRef] [Scilit]
  21. Pichault, F. The management of politics in technically related organizational change. Organ. Stud. 1995, 16, 449–476. [Google Scholar] [CrossRef] [Scilit]
  22. Berger, P.; Luckmann, T. The social construction of reality. In Social Theory Re-Wired; Routledge: New York, NY, USA, 2023; pp. 92–101. [Google Scholar]
  23. Gedajlovic, E.R.; Shapiro, D.M. Management and ownership effects: Evidence from five countries. Strateg. Manag. J. 1998, 19, 533–553. [Google Scholar] [CrossRef] [Scilit]
  24. Stafford, K.; Duncan, K.A.; Dane, S.; Winter, M. A research model of sustainable family businesses. Fam. Bus. Rev. 1999, 12, 197–208. [Google Scholar] [CrossRef] [Scilit]
  25. Sharma, P.; Chrisman, J.J.; Chua, J.H. Strategic management of the family business: Past research and future challenges. Fam. Bus. Rev. 1997, 10, 1–35. [Google Scholar] [CrossRef] [Scilit]
  26. Bennedsen, M.; Nielsen, K.M.; Pérez-González, F.; Wolfenzon, D. Inside the family firm: The role of families in succession decisions and performance. Q. J. Econ. 2007, 122, 647–691. [Google Scholar] [CrossRef] [Scilit]
  27. Chirico, F.; Salvato, C. Knowledge integration and dynamic organizational adaptation in family firms. Fam. Bus. Rev. 2008, 21, 169–181. [Google Scholar] [CrossRef] [Scilit]
  28. Suess, J. Family governance: Literature review and the development of a conceptual model. J. Fam. Bus. Strategy 2014, 5, 138–155. [Google Scholar] [CrossRef] [Scilit]
  29. Burch, G.F.; Batchelor, J.H.; Burch, J.J.; Heller, N.A. Rethinking family business education. J. Fam. Bus. Manag. 2015, 5, 277–293. [Google Scholar] [CrossRef] [Scilit]
  30. La Porta, R.; Lopez-De-Silanes, F.; Shleifer, A. Corporate ownership around the world. J. Financ. 1999, 54, 471–517. [Google Scholar] [CrossRef] [Scilit]
  31. Claessens, S.; Laeven, L. A Reader in International Corporate Finance, Vol. 2; World Bank Publications: Washington, DC, USA, 2006. [Google Scholar]
  32. Villalonga, B.; Amit, R. How do family ownership, control and management affect firm value? J. Financ. Econ. 2006, 80, 385–417. [Google Scholar] [CrossRef] [Scilit]
  33. Carney, M.; Gedajlovic, E.; Yang, X. Varieties of Asian capitalism: Toward an institutional theory of Asian enterprise. Asia Pac. J. Manag. 2009, 26, 361–380. [Google Scholar] [CrossRef] [Scilit]
  34. Allen, F.; Qian, J.; Qian, M. Law, finance, and economic growth in China. J. Financ. Econ. 2005, 77, 57–116. [Google Scholar] [CrossRef] [Scilit]
  35. Barbera, F.; Hasso, T.; Schwarz, T.V. Family governance and firm performance: Exploring the intermediate effects of family functioning and competitive advantage. J. Fam. Bus. Manag. 2023, 13, 1085–1103. [Google Scholar] [CrossRef] [Scilit]
  36. Berrone, P.; Cruz, C.; Gomez-Mejia, L.R.; Larraza, M. Socioemotional wealth and corporate responses to institutional pressures. Adm. Sci. Q. 2010, 55, 82–113. [Google Scholar] [CrossRef] [Scilit]
  37. Gómez-Mejía, L.R.; Haynes, K.T.; Núñez-Nickel, M.; Jacobson, K.J.L.; Moyano-Fuentes, J. Socioemotional wealth and business risks in family-controlled firms: Evidence from Spanish olive oil mills. Adm. Sci. Q. 2007, 52, 106–137. [Google Scholar] [CrossRef] [Scilit]
  38. Fama, E.F.; Jensen, M.C. Separation of ownership and control. J. Law Econ. 1983, 26, 301–325. [Google Scholar] [CrossRef] [Scilit]
  39. Djankov, S.; La Porta, R.; Lopez-De-Silanes, F.; Shleifer, A. The law and economics of self-dealing. J. Financ. Econ. 2008, 88, 430–465. [Google Scholar] [CrossRef] [Scilit]
  40. Greif, A. Contract enforceability and economic institutions in early trade. Am. Econ. Rev. 1993, 83, 525–548. [Google Scholar]
  41. Haunschild, P.R.; Miner, A.S. Modes of interorganizational imitation: The Effects of Outcome Salience and Uncertainty. Adm. Sci. Q. 1997, 42, 472–502. [Google Scholar] [CrossRef] [Scilit]
  42. Lieberman, M.B.; Asaba, S. Why do firms imitate each other? Acad. Manag. Rev. 2006, 31, 366–385. [Google Scholar] [CrossRef] [Scilit]
  43. Deephouse, D.L.; Carter, S.M. An Examination of Differences Between Organizational Legitimacy and Organizational Reputation. J. Manag. Stud. 2005, 42, 329–360. [Google Scholar] [CrossRef] [Scilit]
  44. Pappas, I.O.; Woodside, A.G. Fuzzy-set Qualitative Comparative Analysis (fsQCA): Guidelines for research practice in Information Systems and marketing. Int. J. Inf. Manag. 2021, 58, 102310. [Google Scholar] [CrossRef] [Scilit]
  45. Ragin, C.C. Redesigning Social Inquiry: Fuzzy Sets and Beyond; University of Chicago Press: Chicago, IL, USA, 2009. [Google Scholar]
  46. Misangyi, V.F.; Greckhamer, T.; Furnari, S.; Fiss, P.C.; Crilly, D.; Aguilera, R.V. Embracing Causal Complexity: The Emergence of a Neo-Configurational Perspective. J. Manag. 2017, 43, 255–282. [Google Scholar] [CrossRef] [Scilit]
  47. Gomez-Mejia, L.R.; Nunez-Nickel, M.; Gutierrez, I. The role of family ties in agency contracts. Acad. Manag. J. 2001, 44, 81–95. [Google Scholar] [CrossRef] [Scilit]
  48. Villalonga, B.; Amit, R. Family control of firms and industries. Financ. Manag. 2010, 39, 863–904. [Google Scholar] [CrossRef] [Scilit]
  49. Chua, J.H.; Chrisman, J.J.; Sharma, P. Defining the family business by behavior. Entrep. Theory Pract. 1999, 23, 19–39. [Google Scholar] [CrossRef] [Scilit]
  50. Basco, R.; Calabrò, A.; Campopiano, G. Transgenerational entrepreneurship around the world. J. Fam. Bus. Strategy 2019, 10, 100249. [Google Scholar] [CrossRef] [Scilit]
  51. Poza, E.J. Family Business, 3rd ed.; South-Western Cengage Learning: Boston, MA, USA, 2010. [Google Scholar]
  52. Arzubiaga, U.; Kotlar, J.; De Massis, A.; Maseda, A.; Iturralde, T. Entrepreneurial orientation and innovation in family SMEs: Unveiling the (actual) impact of the Board of Directors. J. Bus. Ventur. 2018, 33, 455–469. [Google Scholar] [CrossRef] [Scilit]
  53. Miller, D.; Minichilli, A.; Corbetta, G. Is family leadership always beneficial? Strateg. Manag. J. 2013, 34, 553–571. [Google Scholar] [CrossRef] [Scilit]
  54. Bennedsen, M.; Nielsen, K. The Family Behind the Family Firm; Working Paper; Copenhagen Business School (CBS): Frederiksberg, Denmark, 2004; Available online: https://swopec.hhs.se/cbsnow/abs/cbsnow2004_003.htm (accessed on 1 May 2025).
  55. Le Breton–Miller, I.; Miller, D. The Arts and Family Business: Linking Family Business Resources and Performance to Industry Characteristics. Entrep. Theory Pract. 2015, 39, 1349–1370. [Google Scholar] [CrossRef] [Scilit]
  56. Arregle, J.-L.; Chirico, F.; Kano, L.; Kundu, S.K.; Majocchi, A.; Schulze, W.S. Family firm internationalization. J. Int. Bus. Stud. 2021, 52, 1159–1198. [Google Scholar] [CrossRef] [Scilit]
  57. Fan, J.P.H.; Wong, T.J.; Zhang, T. Institutions and organizational structure. J. Law Econ. Organ. 2013, 29, 1217–1252. [Google Scholar] [CrossRef] [Scilit]
  58. Hilary, G.; Hui, K.W. Does religion matter in corporate decision making? J. Financ. Econ. 2009, 93, 455–473. [Google Scholar] [CrossRef] [Scilit]
  59. Kalnins, A.; Chung, W. Social Capital, Geography, and Survival: Gujarati Immigrant Entrepreneurs in the U.S. Lodging Industry. Manag. Sci. 2006, 52, 233–247. [Google Scholar] [CrossRef] [Scilit]
  60. Hagelin, N.; Holmén, M.; Pramborg, B. Family ownership, dual-class shares, and risk management. Glob. Financ. J. 2006, 16, 283–301. [Google Scholar] [CrossRef] [Scilit]
  61. Bushee, B.J. The influence of institutional investors on myopic R&D investment behavior. Account. Rev. 1998, 73, 305–333. [Google Scholar]
  62. Yang, M.; Hyland, M.A. Who do firms imitate? A multilevel approach to examining sources of imitation in the choice of mergers and acquisitions. J. Manag. 2006, 32, 381–399. [Google Scholar] [CrossRef] [Scilit]
  63. Greckhamer, T.; Furnari, S.; Fiss, P.C.; Aguilera, R.V. Studying configurations with qualitative comparative analysis: Best practices in strategy and organization research. Strateg. Organ. 2018, 16, 482–495. [Google Scholar] [CrossRef] [Scilit]
  64. Peng, M.W.; Sun, S.L.; Pinkham, B.; Chen, H. The institution-based view as a third leg for a strategy tripod. Acad. Manag. Perspect. 2009, 23, 63–81. [Google Scholar] [CrossRef] [Scilit]
  65. Arregle, J.; Duran, P.; Hitt, M.A.; Van Essen, M. Why is family firms’ internationalization unique? Entrep. Theory Pract. 2017, 41, 801–831. [Google Scholar] [CrossRef] [Scilit]
  66. Custódio, C.; Metzger, D. How do CEOs matter? The effect of industry expertise on acquisition returns. Rev. Financ. Stud. 2013, 26, 2008–2047. [Google Scholar] [CrossRef] [Scilit]
  67. Habbershon, T.G.; Williams, M.L. A resource-based framework for assessing the strategic advantages of family firms. Fam. Bus. Rev. 1999, 12, 1–25. [Google Scholar] [CrossRef] [Scilit]
  68. Schneider, C.Q.; Wagemann, C. Set-Theoretic Methods for the Social Sciences: A Guide to Qualitative Comparative Analysis; Cambridge University Press: Cambridge, UK, 2012. [Google Scholar]
  69. China Business Law Journal. Why Chinese Entrepreneurs Reject Family Trusts—Part II. 18 May 2022. Available online: https://law.asia/reject-family-trusts-2/ (accessed on 1 February 2026).
  70. China Development Brief. Gao Chuanjie: Charitable Trusts Are Not Exclusively for the Wealthy. 2018. Available online: https://chinadevelopmentbrief.org/reports/gao-chuanjie-charitable-trusts-are-not-exclusively-for-the-wealthy/ (accessed on 1 February 2026).
  71. Lewbel, A. Using heteroscedasticity to identify and estimate mismeasured and endogenous regressor models. J. Bus. Econ. Stat. 2012, 30, 67–80. [Google Scholar] [CrossRef] [Scilit]
Figure 1. Research Framework for Firms’ Adoption of Structural Tools.
Sustainability 18 01736 g001
Figure 2. Typical Examples of Each Configuration. Note: The vertical axis represents the membership degree of typical case firms in the set of using structural tools, and the horizontal axis represents the membership degree of typical cases in the set of key elements contained in configurations M1a–M6. M1a and M1b denote two variants that share the same core conditions but differ in their peripheral conditions.
Sustainability 18 01736 g002
Figure 3. Normal distribution map with sustainable development capacity.
Sustainability 18 01736 g003
Figure 4. Normal distribution map with ESG performance.
Sustainability 18 01736 g004
Table 1. Calibration Results of Variables.
Variables Full Non-MembershipCrossover PointFull Membership
Condition
Variables
Family Governance StructureFIMFamily Involvement in Management0-1
ECEquity concentration0-1
Intergenerational HeterogeneityLTDLeadership tenure duration0 1
SGOESubsequent Generation’s overseas experience0-1
Institutional and Cultural ContextLELegal Environment0-1
BGCBusiness Guild Culture0.00840.08810.6154
Market-driven and Mimetic ForcesLTIILong-Term Institutional Investors0.06640.00510
CPECorporate Peer Effects01677
Outcome
Variables
STAdoption of Structural Tools0-1
Note: BGC uses reversed anchors because it measures geographic distance—smaller values indicate stronger business guild influence, thus the 5th percentile represents full membership and the 95th percentile represents full non-membership. All other variables follow conventional calibration, where higher values indicate stronger membership.
Table 2. Results of the Necessary Conditions Analysis.
Condition VariablesFirms Using Structural ToolsFirms Not Using Structural
ConsistencyCoverageConsistencyCoverage
FIM0.8820.4910.8860.509
~FIM0.1180.50.1140.5
EC0.4290.4230.5660.577
~EC0.5710.560.4340.44
LTD0.4620.5190.4160.481
~LTD0.5380.4710.5840.53
SGOE0.3540.4750.3790.525
~SGOE0.6460.5020.6210.498
LE0.2170.4180.2920.582
~LE0.7830.5170.7080.483
BGC0.5330.480.560.521
~BGC0.4670.5070.440.493
LTII0.4170.50.4040.5
~LTII0.5830.4860.5960.514
CPE0.4260.460.4840.54
~CPE0.5740.5190.5160.481
Note: The tilde symbol“ ~ “denotes the logical “NOT”. It indicates the state where a given condition is false or a variable does not hold.
Table 3. Configurational Analysis.
Condition VariablesFirms Using Structural ToolsFirms Not Using Structural Tools
M1aM1bM2M3M4M5M6
FIMSustainability 18 01736 i003Sustainability 18 01736 i003Sustainability 18 01736 i002Sustainability 18 01736 i002Sustainability 18 01736 i003Sustainability 18 01736 i002Sustainability 18 01736 i002
ECSustainability 18 01736 i002Sustainability 18 01736 i002Sustainability 18 01736 i002Sustainability 18 01736 i001Sustainability 18 01736 i002Sustainability 18 01736 i003Sustainability 18 01736 i001
LTDSustainability 18 01736 i001Sustainability 18 01736 i001Sustainability 18 01736 i001Sustainability 18 01736 i002Sustainability 18 01736 i004Sustainability 18 01736 i003Sustainability 18 01736 i003
SGOESustainability 18 01736 i004Sustainability 18 01736 i004Sustainability 18 01736 i001Sustainability 18 01736 i002Sustainability 18 01736 i001Sustainability 18 01736 i003Sustainability 18 01736 i003
LESustainability 18 01736 i001Sustainability 18 01736 i001Sustainability 18 01736 i002Sustainability 18 01736 i004Sustainability 18 01736 i001Sustainability 18 01736 i001Sustainability 18 01736 i001
BGCSustainability 18 01736 i004 Sustainability 18 01736 i002Sustainability 18 01736 i004Sustainability 18 01736 i001Sustainability 18 01736 i004Sustainability 18 01736 i003
LTIISustainability 18 01736 i003Sustainability 18 01736 i003Sustainability 18 01736 i002Sustainability 18 01736 i004Sustainability 18 01736 i002Sustainability 18 01736 i004Sustainability 18 01736 i004
CPE Sustainability 18 01736 i004Sustainability 18 01736 i002Sustainability 18 01736 i002Sustainability 18 01736 i002Sustainability 18 01736 i003Sustainability 18 01736 i002
Raw Consistency0.95660.842310.85640.85370.96130.8241
Coverage0.01870.01760.00690.00740.01150.00790.0075
Unique Coverage0.00570.00460.00690.00740.01150.00550.0051
Solution Consistency 0.9015 0.8691
Solution Coverage 0.03023 0.0318
Note: Sustainability 18 01736 i001 = core condition present; Sustainability 18 01736 i002 = core condition absent; Sustainability 18 01736 i003 = peripheral condition present; Sustainability 18 01736 i004 = peripheral condition absent; blank space presents condition may be present or absent. Core conditions appear in both intermediate and parsimonious solutions; peripheral conditions appear only in intermediate solutions.
Table 4. Configurational Analysis with PRI 0.75.
Condition VariablesFirms Using Structural ToolsFirms Not Using Structural Tools
M1aM1bM2M3M4M5M6
FIMSustainability 18 01736 i003Sustainability 18 01736 i003Sustainability 18 01736 i002Sustainability 18 01736 i002Sustainability 18 01736 i003Sustainability 18 01736 i002Sustainability 18 01736 i002
ECSustainability 18 01736 i002Sustainability 18 01736 i002Sustainability 18 01736 i002Sustainability 18 01736 i001Sustainability 18 01736 i002Sustainability 18 01736 i003Sustainability 18 01736 i001
LTDSustainability 18 01736 i001Sustainability 18 01736 i001Sustainability 18 01736 i001Sustainability 18 01736 i002Sustainability 18 01736 i004Sustainability 18 01736 i003Sustainability 18 01736 i003
SGOESustainability 18 01736 i004Sustainability 18 01736 i004Sustainability 18 01736 i001Sustainability 18 01736 i002Sustainability 18 01736 i001Sustainability 18 01736 i003Sustainability 18 01736 i003
LESustainability 18 01736 i001Sustainability 18 01736 i001Sustainability 18 01736 i002Sustainability 18 01736 i004Sustainability 18 01736 i001Sustainability 18 01736 i001Sustainability 18 01736 i001
BGCSustainability 18 01736 i004 Sustainability 18 01736 i002Sustainability 18 01736 i004Sustainability 18 01736 i001Sustainability 18 01736 i004Sustainability 18 01736 i003
LTIISustainability 18 01736 i003Sustainability 18 01736 i003Sustainability 18 01736 i002Sustainability 18 01736 i004Sustainability 18 01736 i002Sustainability 18 01736 i004Sustainability 18 01736 i004
CPE Sustainability 18 01736 i004Sustainability 18 01736 i002Sustainability 18 01736 i002Sustainability 18 01736 i002Sustainability 18 01736 i003Sustainability 18 01736 i002
Raw Consistency0.95660.842310.85640.85370.96130.8241
Coverage0.01870.01760.00690.00740.01150.00790.0075
Unique Coverage0.00570.00460.00690.00740.01150.00550.0051
Solution Consistency 0.9015 0.8691
Solution Coverage 0.03023 0.0318
Note: Sustainability 18 01736 i001 = core condition present; Sustainability 18 01736 i002 = core condition absent; Sustainability 18 01736 i003 = peripheral condition present; Sustainability 18 01736 i004 = peripheral condition absent; blank space presents condition may be present or absent. Core conditions appear in both intermediate and parsimonious solutions; peripheral conditions appear only in intermediate solutions.
Table 5. Configurational Analysis with Consistency Threshold 0.83.
Condition VariablesFirms Using Structural ToolsFirms Not Using Structural Tools
M1aM1bM2M3M4M5M6
FIMSustainability 18 01736 i003Sustainability 18 01736 i003Sustainability 18 01736 i002Sustainability 18 01736 i002Sustainability 18 01736 i003Sustainability 18 01736 i002Sustainability 18 01736 i002
ECSustainability 18 01736 i002Sustainability 18 01736 i002Sustainability 18 01736 i002Sustainability 18 01736 i001Sustainability 18 01736 i002Sustainability 18 01736 i003Sustainability 18 01736 i001
LTDSustainability 18 01736 i001Sustainability 18 01736 i001Sustainability 18 01736 i001Sustainability 18 01736 i002Sustainability 18 01736 i004Sustainability 18 01736 i003Sustainability 18 01736 i003
SGOESustainability 18 01736 i004Sustainability 18 01736 i004Sustainability 18 01736 i001Sustainability 18 01736 i002Sustainability 18 01736 i001Sustainability 18 01736 i003Sustainability 18 01736 i003
LESustainability 18 01736 i001Sustainability 18 01736 i001Sustainability 18 01736 i002Sustainability 18 01736 i004Sustainability 18 01736 i001Sustainability 18 01736 i001Sustainability 18 01736 i001
BGCSustainability 18 01736 i004 Sustainability 18 01736 i002Sustainability 18 01736 i004Sustainability 18 01736 i001Sustainability 18 01736 i004Sustainability 18 01736 i003
LTIISustainability 18 01736 i003Sustainability 18 01736 i003Sustainability 18 01736 i002Sustainability 18 01736 i004Sustainability 18 01736 i002Sustainability 18 01736 i004Sustainability 18 01736 i004
CPE Sustainability 18 01736 i004Sustainability 18 01736 i002Sustainability 18 01736 i002Sustainability 18 01736 i002Sustainability 18 01736 i003Sustainability 18 01736 i002
Raw Consistency0.95660.842310.85640.85370.96130.8241
Coverage0.01870.01760.00690.00740.01150.00790.0075
Unique Coverage0.00570.00460.00690.00740.01150.00550.0051
Solution Consistency 0.9015 0.8691
Solution Coverage 0.03023 0.0318
Note: Sustainability 18 01736 i001 = core condition present; Sustainability 18 01736 i002 = core condition absent; Sustainability 18 01736 i003 = peripheral condition present; ⊗ = peripheral condition absent; blank space presents condition may be present or absent. Core conditions appear in both intermediate and parsimonious solutions; peripheral conditions appear only in intermediate solutions.
Table 6. Indicators of firms’ sustainable development capacity.
Variable NameIndictorMeasurement MethodWeights of Each Indicator
Employee QualityHighly Educated EmployeesHighly Educated Employees Percentage of employees with
postgraduate degrees or above
0.0617
Proportion of R&D PersonnelRatio of R&D personnel to
total employees
0.0307
Management QualityDigital Background of
the
Management Team
Whether the senior management team has a digital background0.2087
Future Development
Technological Labor Materials
Proportion of Fixed AssetsFixed assets/total assets0.0324
Robot Penetration RateFirm-level robot penetration rate0.0216
Enterprise Innovation LevelLn (number of patent applications + 1)0.0469
Green Labor MaterialsProportion of Green PatentsNumber of green patents
applications/total patent
applications
0.2676
Green Technology LevelLn (number of green patents)
applications + 1)
0.1524
Digital Labor MaterialsLevel of DigitizationLn (frequency of
digital-related terms + 1)
0.0979
Proportion of Digital AssetsDigital-related assets/total
intangible assets
0.0469
Supply ChainSupply Chain TransparencyThe number of major suppliers and customers whose specific names are explicitly disclosed by the listed company in its annual report.0.0332
Table 7. Variable Definitions.
Variable NameVariable TypeVariable SymbolVariable Description
Dependent VariableSustainable development capacitySDCFor details, please refer to the above text.
ESGESG0.5 × Huazheng ESG rating + 0.5 × Wind ESG rating
Independent VariableStructural toolsSTAssign a value of 1 when used and 0 when not used
Control VariablesManagement shareholding ratioMashareThe number of shares held by directors, supervisors and senior management/The total number of shares
Current ratioCRCurrent assets/current liabilities
Quick ratioQuick(Current Assets−Inventory)/Current liabilities
FirmageFirmageLn (Year of the current year−Year of company establishment + 1)
Tobin’s Q valueTobinQ(Market value of tradable shares + number of non-tradable shares×net asset value per share + book value of liabilities)/Total assets
Table 8. Mean difference tests with sustainable development capacity.
VariableGroupNMeanStd. Dev.Std. Err.95% Conf. Interval
Not Using2280.5660.0780.005[0.556, 0.576]
Using2160.581 **0.0900.006[0.569, 0.593]
Combined 4440.5730.0840.004[0.565, 0.581]
Difference −0.015 0.008[−0.031, 0.001]
Note: Difference = mean (Group Not Using)−mean (Group Using); t-statistic = −1.874; degrees of freedom = 442; p-value (one-tailed, H1: diff < 0) = 0.031 **; p-value (one-tailed, H1: diff > 0) = 0.969; ** denotes significance at the 5% level.
Table 9. Mean difference tests with ESG performance.
VariableGroupNMeanStd. Dev.Std. Err.95% Conf. Interval
Not Using2285.0940.6130.041[5.014, 5.174]
Using2165.197 **0.6600.045[5.108, 5.285]
Combined 4445.1440.6380.031[5.084, 5.203]
Difference −0.103 0.060[−0.222, 0.016]
Note: Difference = mean (Group Not Using)−mean (Group Using); t-statistic = −1.703; degrees of freedom = 442; p-value(one-tailed, H1: diff < 0) = 0.044 **; p-value (one-tailed, H1: diff > 0) = 0.956; ** denotes significance at the 5% level.
Table 10. Regression Results.
VariablesSustainable Development CapacityESG Performance
Structural Tools0.017 **0.022 **0.135 **0.153 **
(0.008)(0.009)(0.062)(0.071)
Control variablesNoYesNoYes
Province fixed effectsYesYesYesYes
Industry fixed effectsYesYesYesYes
Constant0.565 ***0.567 ***5.079 ***4.950 ***
(0.005)(0.048)(0.037)(0.394)
Observations432432432432
R-squared0.2140.2240.2190.225
Note: **, and *** denote significance at the 5% and 1% level, respectively.
Table 11. Robustness Tests and Endogeneity Treatment.
VariablesInstrumental Variables (IV) ApproachSubstitution of Dependent VariablesAlternative Model Specifications
SDCESGSDCESGSDCESG
Structural Tools0.026 *0.196 *0.237 *0.312 **0.022 **0.153 **
(0.014)(0.115)(0.137)(0.131)(0.009)(0.064)
Control variablesYesYesYesYesYesYes
Province fixed effectsYesYesYesYesYesYes
Industry fixed effectsYesYesYesYesYesYes
Constant--2.376 ***1.805 **0.541 ***5.089 ***
--(0.710)(0.764)(0.067)(0.558)
Observations296296432432444444
R-squared0.0280.0240.2420.250--
Note: *, **, and *** denote significance at the 10%, 5%, and 1% level, respectively.
Table 12. IV Diagnostic Test Results.
IV Diagnostic StatisticsStatistic
Kleibergen-Paap rk LM79.069 (p = 0.000)
Kleibergen-Paap rk Wald F62.403
Hansen J5.401 (p = 0.1447)
Disclaimer/Publisher’s Note: The statements, opinions and data contained in all publications are solely those of the individual author(s) and contributor(s) and not of MDPI and/or the editor(s). MDPI and/or the editor(s) disclaim responsibility for any injury to people or property resulting from any ideas, methods, instructions or products referred to in the content.