1. Introduction
As human society enters the digital age, advanced digital technologies such as artificial intelligence (AI) are propelling manufacturing enterprises toward high-end, intelligent, and digital transformation. In 2023, China’s digital economy accounted for approximately 43% of the nation’s GDP, indicating that digital transformation has become a vital engine for high-quality economic development. Consequently, an increasing number of manufacturing enterprises are actively advancing digital transformation, fundamentally reshaping their operational models and value creation pathways [
1,
2]. Against this backdrop, exploring how digital transformation promotes green development in manufacturing enterprises holds not only theoretical significance but also practical value.
Reviewing the existing literature, relevant studies can be categorized into three main types: The first type of literature focuses on revealing the economic consequences of digital transformation. Existing research predominantly examines the macro-level impacts of digital transformation on energy and the environment [
3], as well as its micro-level effects on corporate innovation [
4], market position [
5], and production performance [
6]. However, as indicated by the “Solow Paradox,” digital transformation exhibits both a “data-driven” effect and a “capability curse” effect on green innovation in heavily polluting industries [
7]. Specifically, as green technologies advance, the low-cost emission reduction opportunities available to firms in the early stages rapidly diminish, leading to a significant increase in the marginal cost of subsequent emissions reductions [
8]. This indicates that while digital transformation holds potential, a stable and coordinated symbiotic relationship between its technological empowerment and green outcomes has yet to be established. The specific pathways and mechanisms underlying its enabling effects require further examination. Therefore, exploring the enabling role of digital transformation in green development holds significant strategic value and practical relevance.
The second category of literature focuses on the drivers of corporate green development. Research in this field indicates that as market division of labor becomes increasingly refined and industrial linkages grow more complex, the identification of drivers for corporate green development has gradually shifted from macro-level institutional pressures [
9] and market incentives [
10] toward specific dimensions such as corporate low-carbon development and green innovation [
11,
12]. However, as the manufacturing sector serves as the main force in a nation’s energy transition, the critical importance of digital technology in empowering it has become evident. providing a natural entry point for this paper to systematically elucidate the intrinsic mechanisms through which digital transformation drives green development in manufacturing enterprises.
The third category of research focuses on measurement methods for key variables. Existing approaches to quantifying digital transformation primarily fall into three categories: word frequency measurement, entropy-based methods, and index-based measurement. Early studies predominantly employed word frequency analysis [
13], quantifying the emphasis on digital strategy by examining keyword frequencies in corporate annual reports and other textual sources. However, while this method reflects corporate rhetoric, it struggles to accurately depict the objective outcomes and actual capabilities of their digital initiatives. To address this limitation, some scholars have turned to entropy-based approaches [
14], attempting to construct multidimensional indicator systems for comprehensive evaluation. Yet, consensus remains elusive regarding indicator selection and weighting. Furthermore, from a research perspective, existing studies predominantly focus on the micro level of enterprises [
15] and concentrate on reflecting corporate economic outcomes [
16,
17,
18], exploring the economic consequences of digital transformation. However, they have not further investigated the relationship between digital transformation and green development. Overall, existing research is largely confined to single levels, failing to fully reveal the cross-level interactive mechanisms between industry digital characteristics and corporate digital behaviors. This hinders a systematic grasp of the overall landscape and structural impacts of digital transformation. Based on these considerations, this paper proposes to adopt a corporate digital index methodology that balances discourse and action. This approach aims to measure corporate digital transformation levels more comprehensively and objectively, while deeply examining its multi-level economic consequences.
In summary, existing research has yet to fully elucidate the intrinsic mechanisms through which manufacturing enterprises transform digital investments into green development via deep-level process evolution. Specifically, most of the existing literature treats digitalization as an exogenous technological tool, failing to deconstruct its core role in reshaping manufacturing quality and efficiency from the endogenous perspective of enterprise capability evolution. Furthermore, current research inadequately addresses how to synergistically advance digital efficiency gains and green quality improvements, nor does it systematically explore their collaborative effects in practice. To overcome this black-box challenge, this paper employs the dynamic and comprehensive Enterprise Digital Transformation Index [
19] as its core measurement tool. It constructs enterprise green development through two dimensions—green governance performance and green innovation efficiency—to systematically analyze the dual-drive effect, transmission pathways, and differentiated impact manifestations of digital transformation in empowering green development within manufacturing enterprises.
Unlike previous studies, this paper first notes that whether relying on a single measure of total factor productivity [
20] or examining composite indicators [
21], academia tends to assess the green development of manufacturing enterprises from an output perspective [
22]. The outcomes of these practical outputs can be regarded as green governance performance. For instance, the green value created through proactive practices such as clean production, process optimization, and green product design signifies a shift from passive compliance to active value creation. However, evaluating governance outcomes solely at the output end while neglecting input efficiency fails to comprehensively and accurately reveal the actual state of corporate green development. A singular output perspective may obscure resource misallocation issues, potentially creating an illusion of inefficient prosperity characterized by high input dependency and low innovation capacity. Given that innovation serves as the driving force behind corporate sustainability [
23], assessments of green development must further focus on the efficacy of the innovation process. This approach measures how effectively enterprises convert innovation resources into green outcomes [
24], characterizes the progression of green development, and ultimately reflects whether the costs incurred are justified and the pathways chosen are sustainable. Therefore, in terms of research content, this paper will interpret and construct the core essence of corporate green development from the dual-driver dimensions of green innovation efficiency and green governance performance. Furthermore, it will link green development with digital transformation, feeding the dual-dimensional interpretation of manufacturing enterprises’ green development back into the two driving pathways of digital transformation to explore breakthrough strategies for green development in manufacturing enterprises. In terms of research mechanisms, this study attempts to establish a theoretical framework for how enterprise digital transformation influences green development. It explores the impact pathways of digital transformation driving green development through the construction of new-quality productive forces and the entry of green investors, striving to deconstruct the black box of mechanisms for quality and efficiency enhancement. Simultaneously, this paper employs grouped regression analysis based on factors potentially influencing driving effects—such as corporate pollution levels, regional economic development, and corporate governance structures—to dissect the heterogeneous effects of digitalization driving greening. In terms of research expansion, it explores the moderating roles of corporate growth potential and financing constraints on digital transformation driving green development, aiming to provide valuable policy insights for advancing the greening growth of manufacturing enterprises under the vision of “digitalization driving greening.”
2. Methodology
In recent years, academic research on the impacts of digital transformation has grown increasingly abundant [
25,
26]. However, there remains insufficient attention to the governance effects of digital transformation in manufacturing enterprises, nor has there been in-depth analysis of the innovation efficiency issues associated with corporate digital transformation. In fact, as the core pillar of a nation’s economy, the green governance and innovation efficiency of the manufacturing sector are precisely two crucial dimensions for measuring its level of green development. This is because green development refers to enterprises achieving synergistic growth in economic profits and environmental benefits through green governance activities [
21].
In other words, this paper posits that green innovation efficiency constitutes the core productive capacity dimension of green development for manufacturing enterprises. It differs from the singular focus of traditional innovation efficiency, which prioritizes output while neglecting environmental considerations [
27], and also diverges from the formalistic approach to green innovation that emphasizes environmental protection at the expense of economic benefits [
28]. Its essence lies in measuring an enterprise’s intrinsic capability to achieve green value creation through minimal resource and environmental inputs and the lowest possible environmental externalities within its green innovation activities. Green governance, meanwhile, aims to drive the practical application of green innovation outcomes through incentive and constraint mechanisms [
29]. This includes integrating emission reduction targets and green innovation achievements into departmental and employee performance evaluations, imposing constraints on high-consumption and high-emission production practices, and ensuring, at the management level, that green innovation technologies are genuinely integrated into production and operations. Unlike formalistic green governance that “prioritizes systems over implementation,” the proposed green governance performance here constitutes an institutional safeguard for the sustained enhancement of green innovation efficiency [
30,
31]. Clarifying this perspective not only helps penetrate superficial formalities to identify the logic of corporate green development but also aligns with the requirements of supply-side structural reform and green quality-enhancement in manufacturing.
2.1. The Promoting Role of Digital Transformation in the Green Development of Manufacturing Enterprises
The connection between green development in manufacturing and digital transformation stems from the high alignment between the core attributes of digital technology and the fundamental requirements of green manufacturing development [
32]. At its core, digital transformation serves as the foundational support for manufacturing to overcome challenges in green development, while green development represents the ultimate objective of manufacturing’s digital transformation [
33,
34].
Digital technologies, with their inherent high-tech content and low environmental cost [
35,
36], possess a natural advantage in effectively addressing the challenges of long cycles, high risks, and uncertainties faced in green governance. Specifically, to address extended governance cycles, enterprises can leverage technologies like IoT and digital twins to enable real-time monitoring and visualization of key indicators such as energy consumption and emissions, significantly reducing response times from issue detection to optimization control [
37]. To mitigate high decision-making risks, big data analytics can provide precise return projections and risk assessments for energy-saving and carbon-reduction investments, minimizing blind decision-making and trial-and-error costs [
38]. To address operational uncertainty, artificial intelligence algorithms enable predictive maintenance and dynamic energy efficiency optimization, shifting from reactive responses to proactive prevention [
39]. This enhances the controllability and transparency of governance processes. Thus, digital transformation effectively mitigates key obstacles in corporate green governance by shortening cycles, optimizing decision-making, and enhancing foresight, thereby improving green governance performance.
Moreover, the creative and substitutive applications of digital technologies have accelerated the enhancement of green innovation efficiency in manufacturing enterprises. This acceleration primarily stems from the longstanding dual constraints of high costs and high risks that have historically hindered improvements in green innovation efficiency [
40]. On one hand, in terms of cost control, leveraging data insights and information integration enables manufacturing enterprises to more accurately identify technological trends and market demands. This reduces trial-and-error processes and resource misallocation during R&D, thereby effectively minimizing sunk costs and optimizing the allocation of innovation resources [
41]. On the other hand, in risk management, manufacturing enterprises leverage technologies such as the Internet of Things (IoT) and digital twins to facilitate real-time monitoring and dynamic optimization of production operations. This enables them to proactively avoid technical failures and process malfunctions, significantly reducing operational and systemic risks during the innovation process and the commercialization of outcomes [
40].
Therefore, interpreting and unveiling the veil of green development in manufacturing enterprises through the dual drivers of green innovation efficiency and green governance performance helps illuminate the enabling process of digital transformation driving green development in manufacturing. This perspective is grounded in the understanding that green development in manufacturing is not a simple superposition of technology and management, but rather a symbiotic relationship characterized by deep interembedding, mutual empowerment, and dynamic equilibrium.
2.2. The Mediating Role of Green Investors’ Entry
As is well known, green investors constitute a distinct category of institutional investors. Guided by sustainable investment objectives and aligned with sustainable development strategies, they comprehensively consider economic, social, and environmental factors. This approach encourages enterprises to actively fulfill corresponding social responsibilities while pursuing economic gains, ultimately achieving dual economic and social value [
42].
The resource-based view posits that a company’s competitive advantage stems from heterogeneous, difficult-to-imitate strategic resources. Digital transformation lays the foundation for manufacturing enterprises’ green development and attraction of green investors by accumulating two core types of resources: digital resources and green compliance resources. Considering that the core decision-making focus of green investors (such as green funds and ESG investment institutions) is to mitigate environmental risks and secure long-term green returns, according to signaling theory, explicit signals resulting from digital transformation—such as environmental information transparency—can enable green investors to accurately assess a company’s environmental management level and green investment returns. Typical examples include achieving carbon footprint traceability through blockchain technology and real-time disclosure of energy consumption data via digital platforms, thereby alleviating investment concerns caused by information asymmetry [
43]. Moreover, the very act of manufacturing enterprises advancing digital transformation unambiguously signals their strategic orientation toward embracing change, prioritizing long-term development, and possessing technological adaptability. This implicit signal aligns strongly with green investors’ long-termism and sustainable development investment philosophy, clearly bolstering investor confidence in the success of corporate green transformation. Stakeholder theory emphasizes that corporate development must balance the interests of shareholders, investors, governments, society, and other stakeholders. As a core stakeholder, green investors not only provide capital support but also drive corporate improvements in green governance structures and strengthened environmental responsibility fulfillment through board seats and the establishment of green strategy committees.
2.3. The Mediating Role of New Quality Productivity
Marxist theory of productive forces emphasizes that the development of productive forces constitutes a dialectical unity between the factors of production (means of labor, objects of labor, and laborers) and the mode of production. Moreover, the advancement of productive forces must be harmonized with the natural ecosystem. New-quality productive forces, characterized by digitalization, intelligence, and greening, represent an iterative upgrade of traditional productive forces [
44]. By reconstructing means of labor, expanding objects of labor, and enhancing worker quality through digital transformation, the production process shifts from resource-intensive to efficiency-driven and circular models, inherently aligning with the core imperatives of green development [
32].
Wen Ke pointed out that the primary characteristic of new-quality productive forces lies in innovation [
45]. Based on dynamic capability theory, new-quality productivity enhances manufacturing enterprises’ green innovation and adaptive capabilities because it centers on innovation as its core driver [
46]. Whether confronting green technological innovations—such as new energy and eco-friendly material R&D—or green model innovations—like circular economy and product lifecycle management—it strengthens manufacturing enterprises’ dynamic capacity to swiftly respond to environmental risks and seize green development opportunities, thereby providing sustained momentum for green growth. This synergistic effect of technological empowerment and capability upgrading clearly contributes to expanding the scope and boundaries of green development for manufacturing enterprises. Of course, companies that merely stop at tool digitization—such as the simple use of digital software—struggle to effectively cultivate new-quality productive forces. Only by deeply integrating digitization with green strategies and productivity upgrades, or by achieving full-process digitization across R&D, production, supply chains, and governance, can the enabling role of digital transformation for new-quality productive forces and green development be fully realized.
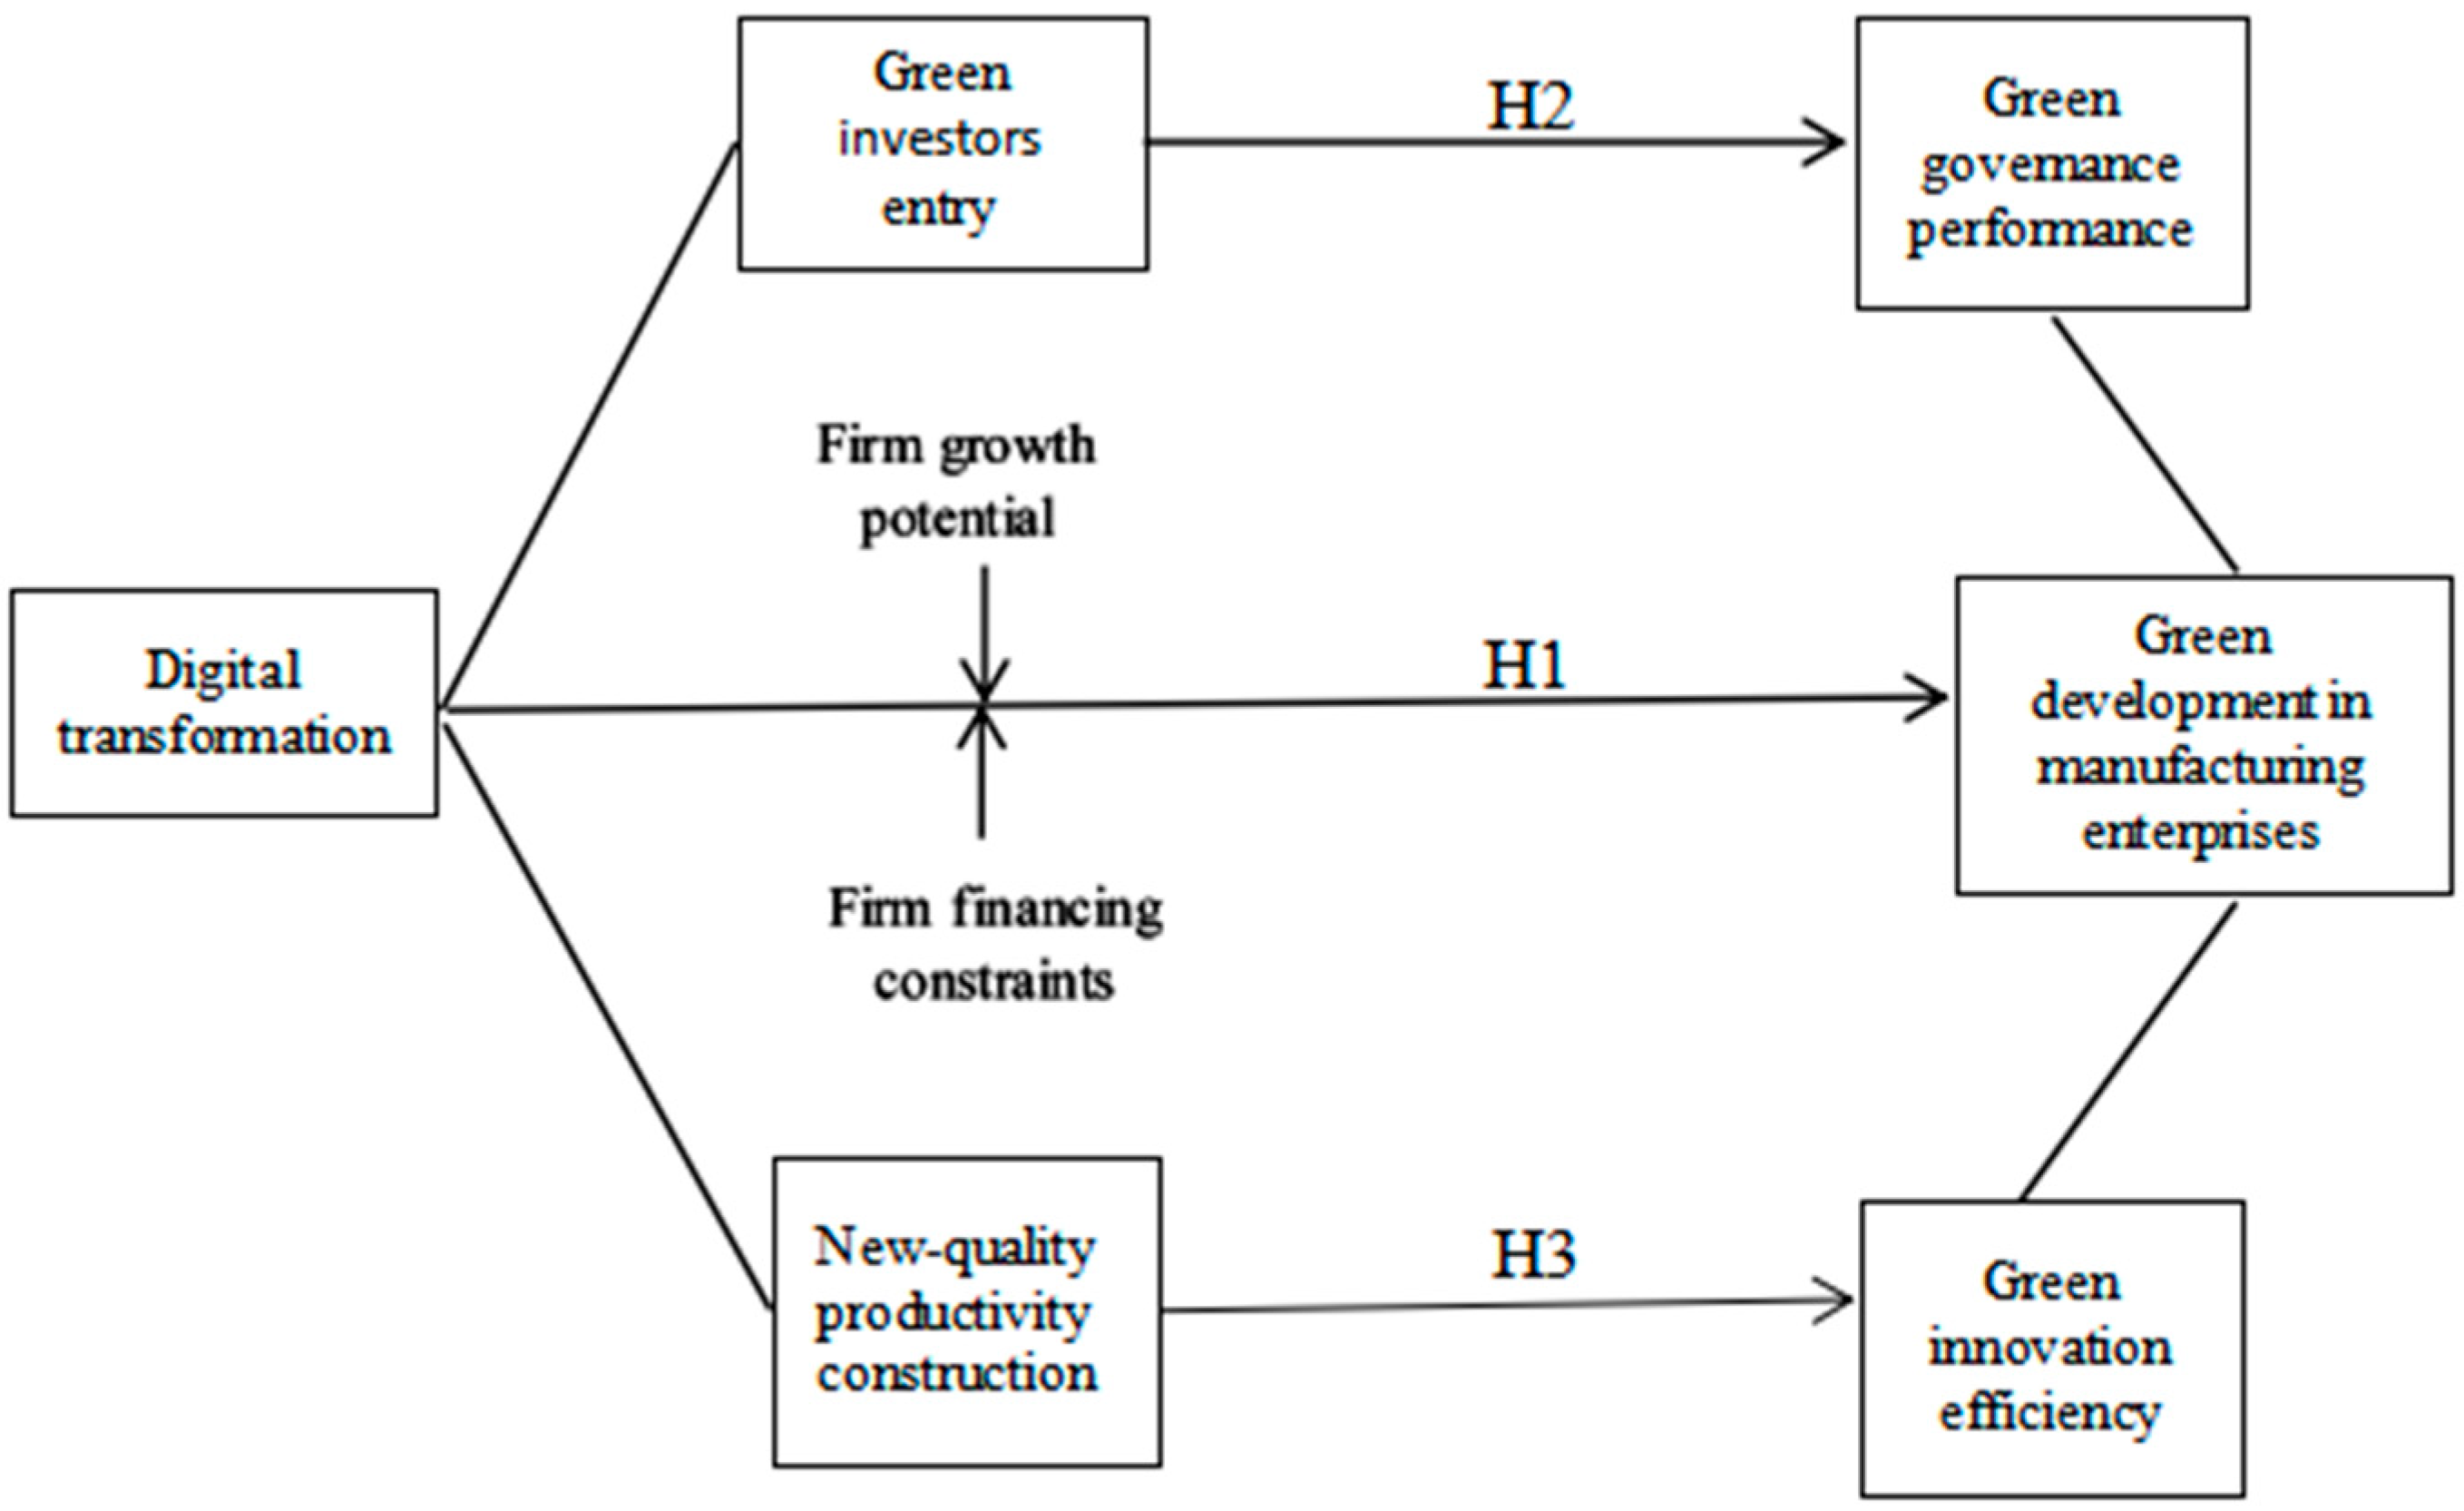
Based on the above analysis, this paper proposes the following research hypotheses:
H1. Digital transformation promotes green development in manufacturing enterprises.
H2. Digital transformation facilitates green development in manufacturing enterprises by attracting green investors.
H3. Digital transformation promotes green development in manufacturing enterprises by fostering new-quality productive forces.
The research framework diagram for this paper is shown below (as in
Figure 1).
3. Research Design
3.1. Data Sources and Processing
This study examines the effects and mechanisms of digital transformation on the green development of manufacturing enterprises, focusing on A-share listed manufacturing companies from 2012 to 2023. The measurement of digital transformation is derived from the China Securities Market Research Database (CSMAR). Data on green innovation efficiency and green innovation performance are sourced from the China National Research Data Service Platform (CNRDS) and CSMAR, while data on green investor entry originate from CSMAR. Data on variables such as new-type productive forces are sourced from the China National Research Data Service Platform (CNRDS) and the Guotai An database (CSMAR). To enhance data accuracy and validity, the following sample adjustments were implemented: (1) Selecting observable values from manufacturing firm samples; (2) Excluding observable values from listed companies classified as ST, *ST, or PT; (3) Removing samples with severe missing values in key variables. Additionally, to mitigate the impact of extreme values, continuous variables underwent trimming at the 1% and 99% tail levels.
3.2. Variable Selection
Dependent Variable: Green Development of Manufacturing Enterprises. Drawing on the methodology from [
47], we construct a dual-indicator framework comprising green innovation efficiency and green governance performance to represent the green development of manufacturing enterprises.
Independent Variable: Digital Transformation. Existing studies predominantly employ the Corporate Digital Transformation Index (CDTI) to measure digital transformation. Therefore, this paper adopts the research approach from [
19] and utilizes the CDTI to assess and reflect digital transformation.
Control variables: To eliminate the influence of other factors, this study adopts the following control variables from [
45]: Debt-to-Long-Term-Capital Ratio (DLCR), Firm Age (AGE), Debt-to-Asset Ratio (LEV), Return on Equity (ROE), Board Size (BSIZ), and Firm Size (SIZE).
Mediating Variable: New Quality Productivity. Drawing on the research approach in [
45], this study measures innovation performance by evaluating the average quality of patents obtained annually in key core technology fields, thereby reflecting the level of a firm’s new quality productivity.
Green Investor Entry. Drawing on the research approach in [
48], this study uses the number of green investors to represent green investor entry. For the definitions of each variable, see
Table 1.
3.3. Model Design
To examine the impact of digital transformation on the green development of manufacturing enterprises, the following econometric model is established:
Variable definitions in Equation (1):
CGP denotes green development in manufacturing enterprises (dependent variable);
DXI denotes digital transformation (independent variable);
Control represents a set of control variables;
i and t denote firm and year, respectively;
Year represents the year fixed effect, controlling for influences common to all samples within a given year;
City represents the city fixed effect, controlling for spatial factors that do not vary over time;
ε denotes the random error term.
4. Empirical Analysis
4.1. Descriptive Analysis
Table 2 presents the descriptive statistics for the entire sample. The mean score for digital transformation is 3.585, indicating an overall level of above-average development. The maximum score of 4.194 suggests that some manufacturing enterprises have achieved a relatively advanced stage of digitalization. The mean score for green development (CGP) among manufacturing enterprises is 0.884, with a maximum score of 4.293, reflecting significant disparities in green development across different enterprises. Notably, the CGP mean (0.884) substantially exceeds its median (0.213), indicating that most manufacturing enterprises exhibit low levels of green development. Only a minority demonstrate outstanding performance, successfully translating digital transformation into tangible green development outcomes. This pattern reveals an uneven distribution characterized by “majority lagging, minority leading.”
4.2. Baseline Regression Analysis
Table 3 presents the benchmark regression results for digital transformation and green development in manufacturing enterprises. Columns (1) to (4) show regression results incorporating control variables and fixed effects. The coefficient for the core explanatory variable, digital transformation, is statistically significant at the 1% level in all cases, indicating that digital transformation robustly promotes green development in manufacturing enterprises. In Model (1), which includes only core explanatory variables, the coefficient for ln_DXI is 1.005, significant at the 1% level (t = 30.75). After progressively adding control variables, year effects, and city fixed effects, the coefficient remained around 0.826 and consistently retained 1% significance (e.g., t = 23.20 in Model (4)). This indicates that a one-unit increase in digitalization levels leads to an average improvement of approximately 0.826 units in corporate green development, with this effect remaining robust across different settings. From Model (1) to Model (4), the adjusted R
2 progressively increased from 0.0531 to 0.1846. This indicates that incorporating control variables and two-way fixed effects significantly enhances the model’s explanatory power for green development, further supporting the reliability of the core findings.
The reasons may be twofold. On one hand, digital transformation expands the information boundaries and resource allocation efficiency of manufacturing enterprises. Through data integration and analysis, these companies can more accurately gauge market demand, track competitor dynamics, and optimize the allocation of production factors. On the other hand, in the face of increasing uncertainty in the business environment, digital transformation provides enterprises with systematic tools to manage complexity. By adopting digital technologies such as energy consumption monitoring and predictive maintenance, manufacturing enterprises can achieve refined management and dynamic optimization of production processes, effectively reducing energy consumption and emissions. Simultaneously, digital transformation drives the intelligent upgrading of production tools, enabling enterprises to more accurately identify the characteristics of work objects. This facilitates targeted resource allocation and precise process control, thereby enhancing operational efficiency while building green comparative advantages and continuously strengthening green development capabilities.
4.3. Mechanism Analysis
Mechanism Effect Model Design:
Variable definitions in the model:
M represents the mediating variables: NQPF (New Quality Productivity) and ln_NGI (Logarithm of the Number of Green Investors). Definitions of other variables are consistent with Model (1). Model (3) examines the impact of enterprise digital transformation (DXI) on the mediating variables, while Model (4) tests the mediating effect of these variables in the process where DXI influences the green development of manufacturing enterprises (CGP).
Drawing on the research approach in [
49], our benchmark regression analysis reveals that digital transformation significantly promotes green development in manufacturing enterprises. Mechanism analysis further uncovers the intrinsic pathway through which digital transformation drives green development in manufacturing enterprises. As shown in
Table 4,
Table 5,
Table 6 and
Table 7, this effect operates not through a single channel but via a dual-promotion model centered on enhancing new-quality productivity and attracting green investors.
4.3.1. Testing the Mechanism of Action of New Quality Productivity
The results in
Table 4 and
Table 5 show that the regression coefficients for digital transformation on new-quality productive forces range from 0.101 to 0.156, with high significance at the 1% level. This indicates that the deep application of digital technologies effectively cultivates enterprises’ new-quality productive forces. It suggests that manufacturing enterprises have systematically restructured the allocation of production factors through digital transformation. Specifically, intelligent production systems optimize energy consumption management through real-time data monitoring, vigorously driving green process innovation. Concurrently, industrial internet platforms facilitate the diffusion and sharing of green technology knowledge both within and outside enterprises, accelerating the transformation and application of green technological achievements. For example, taking Dasheng Group’s carbon-neutral smart spinning factory as a case study: by implementing IoT upgrades across all equipment and establishing a smart energy management platform, the enterprise achieved real-time data sensing and algorithmic optimization of energy consumption and production. This enhanced production efficiency and boosted the enterprise’s new-quality productive forces. Simultaneously, it realized emission reductions and efficiency gains throughout the production process, achieving the green development goal of near-zero carbon emissions.
Table 4 results indicate that the regression coefficient of the independent variable Digital Transformation (ln_DXI) on the mediating variable New Quality Productivity (NQPF) is significantly positive at the 1% level across all models (1) to (4). In Model 4, the coefficient is 0.101 with t = 19.00, demonstrating that digital transformation significantly enhances firms’ new quality productivity.
When the mediating variable NQPF and the core independent variable ln_DXI are simultaneously included in the regression on the dependent variable CGP, the coefficient for NQPF remains significantly positive at the 1% level (coefficient of 0.729, t = 14.03 in Model 4). Meanwhile, compared to the benchmark regression without the mediating variable, the coefficient of ln_DXI on CGP decreases but remains highly significant (coefficient of ln_DXI in Model (4) of
Table 5 is 0.753). This further indicates that new-quality productivity (NQPF) partially mediates the effect of digital transformation (ln_DXI) on green innovation performance (CGP).
4.3.2. Testing the Mechanism of Green Investor Entry
The results in
Table 6 and
Table 7 indicate that digital transformation exerts a significant positive influence on the number of green investors entering the market, suggesting that the application of digital technologies enhances the attractiveness of manufacturing enterprises to green investors. This may be attributed to two factors: on one hand, environmental information disclosure supported by digital platforms increases the transparency of corporate environmental performance, thereby reducing the information screening costs for green investors; on the other hand, the application of cutting-edge technologies such as digital twins enables green investors to track the environmental benefits of green investment projects in real time. For example, the Changzhou Surface Treatment Circular Industrial Park implemented a comprehensive green upgrade plan based on a digital platform for centralized pollution control and intelligent management. This established a highly transparent, verifiable, and actionable data management platform, significantly reducing assessment risks and oversight costs for external financial institutions. Consequently, it attracted capital injections from green investors, driving regional green development.
In
Table 6, the regression coefficient of the independent variable Digital Transformation Level (ln_DXI) on the mediator variable Number of Green Investors (ln_NGI) is significantly positive at the 1% level across all models (coefficient 0.072, t = 3.53 in Model (4)). This indicates that digital transformation effectively attracts more green investors.
In
Table 7, when the mediating variable ln_NGI and the core independent variable ln_DXI are simultaneously included in the regression for CGP, the coefficient for ln_NGI remains significantly positive at the 1% level (coefficient 0.109, t = 7.96 in Model (4)). Similarly, compared to the benchmark regression, the coefficient of ln_DXI decreases but remains significant (0.819 in Model (4) of
Table 7), confirming that green investors (NGI) also exert a partial mediating effect.
4.4. Bootstrap Test
4.4.1. Testing the Mediating Effect of New Quality Productivity
This study employed the Bootstrap method (with 5000 repeated samples) to examine the mediating role of new-type productivity between digital transformation and green development in manufacturing enterprises. Based on 16,830 valid observations, the analysis results (see
Table 8) indicate that the indirect effect of digital transformation on green development in manufacturing enterprises (mediated by new-type productivity) is 0.087302. with a 95% normal distribution confidence interval of [0.076636, 0.097967] and a 95% percentile confidence interval of [0.077032, 0.098147], neither of which includes zero. This indicates that the mediating effect of new-type productivity is highly statistically significant (
p < 0.001). Meanwhile, the direct effect of digital transformation on green development in manufacturing enterprises is 0.818676, with a 95% confidence interval under normal distribution of [0.748454, 0.888898] and a 95% percentile confidence interval of [0.748292, 0.889131], both of which also exclude zero. This confirms the significant existence of the direct effect.
In summary, new-type productive forces play a significant partial mediating role in the relationship between digital transformation and the green development of manufacturing enterprises. That is, digital transformation not only directly enhances the green development of manufacturing enterprises but also indirectly exerts a positive influence on green development through the intrinsic pathway of cultivating and promoting new-type productive forces.
4.4.2. Testing the Mediating Effect of Green Investor Entry
To examine the mediating role of green investors in the relationship between digital transformation and green development in manufacturing enterprises, this study employs Bootstrap sampling (5000 repeated samples) for mediation analysis. Based on 16,830 valid observations, the results (see
Table 9) indicate that the indirect effect of digital transformation on green development in manufacturing enterprises (mediated through attracting green investors) is 0.096868. with a 95% normal distribution confidence interval of [0.067349, 0.126386] and a 95% percentile confidence interval of [0.068541, 0.127324]. Neither interval includes zero, indicating that the mediating effect of green investors is highly statistically significant (
p < 0.001). Simultaneously, the direct effect of digital transformation on the green development of manufacturing enterprises is 0.114969, with a 95% confidence interval under normal distribution of [0.085210, 0.144727] and a 95% percentile confidence interval of [0.084761, 0.144962], both of which also exclude zero. This confirms the direct effect is also statistically significant.
In summary, the number of green investors plays a significant partial mediating role in the relationship between digital transformation and the green development of manufacturing enterprises. This implies that digital transformation not only directly enhances the green development of manufacturing enterprises but also indirectly promotes green development through the external financing pathway of attracting more green investors.
4.5. Heterogeneity Analysis
The heterogeneity test results in
Table 10 reveal significant group differences in the promotional effect of digital transformation on the green development of manufacturing enterprises, manifested in the following three aspects:
Heterogeneity test based on enterprise pollution levels: In the heavily polluting industry group, the regression coefficient for digital transformation is 0.598, significantly lower than the 1.164 observed in non-heavily polluting industries. This indicates that while environmental regulatory pressure drives green development in heavily polluting manufacturing enterprises, the marginal benefits of digital transformation may be relatively limited due to higher technological upgrading costs and stronger path dependence. The digital transformation coefficient for non-heavily polluting industries (1.164) exceeds that of heavily polluting industries (0.598), suggesting stronger green promotion effects from digitalization in the former. This disparity likely stems from the heavier environmental regulations and technological transition barriers faced by heavily polluting industries.
Heterogeneity Analysis Based on Regional Economic Development
Enterprises in eastern regions exhibit a regression coefficient of 1.085, significantly higher than the 0.873 observed in non-eastern regions. This confirms the impact of regional “digital divides” on green transition effectiveness. Eastern regions leverage superior infrastructure, high-quality talent pools, and vibrant regional innovation ecosystems to create more favorable external conditions for unlocking the green benefits of digital transformation. In contrast, non-eastern regions, constrained by digital access levels and innovation capabilities, have yet to fully realize the green efficiency gains from digital transformation.
- 3.
Heterogeneity Test Based on Corporate Governance Structure Characteristics
Analyzing two datasets differentiated by the degree of separation between ownership and management rights, no significant difference emerged based on the level of separation (high group coefficient: 1.015 vs. low group: 1.049), indicating that equity structure does not play a key moderating role in this relationship. Furthermore, the digitalization coefficients in all groups were statistically significant at the 1% level (all t-values exceeding 6), while the model fit (adjusted R2) was highest in the heavily polluting industries group (0.2253). This indicates stronger explanatory power for that group’s model, further corroborating the heterogeneous relationship between digitalization and green development across different contexts.
4.6. Moderation Effect Test
The variables in the moderation effect model are defined as follows:
MV denotes the moderator variables. Considering that Tobin’s Q ratio and financing constraints may exert a moderating effect on the relationship between digital transformation and green development in manufacturing enterprises, Tobin’s Q ratio and financing constraints are treated as moderator variables. An interaction term between the moderator variables and the core explanatory variable (NGI * MV) is constructed. The meanings of other variables remain consistent with Model (1).
The moderation effect test results in
Table 11 indicate that firm growth potential and financing constraints exert significant boundary effects on the influence of digital transformation on the green development of manufacturing enterprises. Drawing on the approach in [
41], on one hand, Tobin’s Q value represents growth potential: a higher Tobin’s Q implies greater future growth potential for the firm. In the process of digital transformation driving green development, enterprises with greater growth potential possess stronger motivation and capability to convert digital technologies into long-term green competitive advantages. Therefore, Tobin’s Q can test whether the green effects of digital transformation are more pronounced in growth-oriented enterprises. On the other hand, introducing financing constraints further examines whether the green effects of digital transformation are more easily realized in capital-rich enterprises, thereby revealing the critical role of resource availability in digital transformation and green development.
4.6.1. Positive Moderation by Firm Growth
The interaction term between digital transformation and Tobin’s Q (DXI_TQ) exhibits a coefficient of 0.060, significant at the 5% level. This indicates that firm growth enhances the promotional effect of digital transformation on green development. This may stem from the fact that high-growth enterprises typically possess stronger risk-bearing capacity and broader investment horizons, enabling them to support long-term green R&D investments aligned with digital transformation. Concurrently, they face stricter external oversight and environmental compliance pressures, driving them to actively leverage digital technologies to achieve synergies between environmental governance and business growth. Furthermore, to maintain market position, high-growth enterprises are more inclined to utilize digital means to develop green products and services, consolidating competitive advantages through ecological innovation.
4.6.2. Negative Moderation by Financing Constraints
The interaction term between digital transformation and financing constraints (DXI_FC) exhibits a coefficient of −0.743, significant at the 1% level, indicating that financing constraints significantly dampen the green efficiency gains from digital transformation. This may stem from two primary mechanisms: First, financing constraints limit manufacturing enterprises’ capacity to invest in green technological infrastructure—such as smart environmental protection equipment and digital monitoring systems—thereby hindering the deep implementation of digital transformation. On the other hand, financial pressures compel enterprises to prioritize short-term profitability goals, potentially reducing resource allocation for long-term value activities like environmental governance and green innovation. Furthermore, constrained capital inevitably limits talent recruitment and R&D capabilities, indirectly undermining overall efficiency in converting digital technologies into green performance.
4.7. Endogeneity Test
Table 12 employs a panel data model and instrumental variables approach to conduct endogeneity tests on the causal relationship between digital transformation and green development in manufacturing enterprises. This methodology effectively mitigates potential reverse causality and omitted variable issues, further enhancing the robustness of the research conclusions.
4.7.1. Instrumental Variables Test Results
To mitigate potential reverse causality and omitted variable issues, this study adopts the approach from [
50], using lagged digital transformation variables (L1.DXI, L2.DXI, L3.DXI) as instrumental variables to construct and estimate a two-stage least squares model. While past digitalization levels influence current green performance, they are not directly affected by the reverse impact of current green development. Therefore, in the first-stage regression, the F-statistics were all significantly greater than the critical value, indicating no weak instrumental variable problem. The second-stage results showed that the coefficients for digital transformation were 0.918, 0.987, and 1.062, respectively, all significant at the 1% level. This further demonstrates the promotional effect of digital transformation on the green development of manufacturing enterprises, reinforcing the robustness of the baseline conclusion.
4.7.2. Introduction of Lagged Terms
To further examine the long-term effects of digital transformation, this study constructed a dynamic panel model incorporating lagged terms of the dependent variable (green development) for estimation. Specifically, building upon the baseline model, we sequentially introduced lagged terms of the digital transformation variable (L1.DXI, L2.DXI, L3.DXI) to form dynamic models, respectively, to test for temporal lag and persistence in the effects. Results indicate that the green efficiency gains from digital transformation exhibit clear persistence: coefficients for the one-period lag (0.833), two-period lag (0.842), and three-period lag (0.866) remain highly significant and show an increasing trend over time. This suggests that the enhancement of green development through digital transformation is not immediately apparent; its benefits are released with a certain lag, making green development a gradual, cumulative, and continuously evolving long-term process.
4.8. Robustness Test
The robustness test results in
Table 13 and
Table 14 further validate the reliability of the research conclusions. By employing different variable measurement methods and sample periods, the promotional effect of digital transformation on the green development of manufacturing enterprises remains robustly established, reflecting the sound stability and sustainability of the research findings.
4.8.1. Variable Substitution Method
Table 13 reports the test results for replacing explanatory variables. Following the approach of this study [
39], a new digital transformation level indicator (DTL) was constructed as a substitute variable for regression analysis. Results indicate that DTL coefficients range from 0.816 to 0.974, all significant at the 1% level. These coefficients remain stable throughout the process of progressively adding control variables and incorporating fixed effects. This demonstrates that after changing the measurement approach, the positive impact of digital transformation on green development remains significant, further enhancing the reliability of the conclusions.
4.8.2. Replacement Time Cycle Method
After 2018, China’s manufacturing sector transitioned from initial digital transformation efforts to a critical phase of deep technological-business integration and accelerated value realization. Coinciding with the introduction of the “dual carbon” goals and the intensive release of digital transformation support policies at all levels, this period provided a clean scenario with strong policy intervention for research. During this time, both corporate digitalization and environmental information disclosure quality significantly improved, enhancing the accuracy of variable measurement. Therefore, this paper employs robust regression analysis using data from 2018 to 2023.
This study adopts the research approach outlined in [
45]. Results indicate that the coefficients for the core explanatory variable—digital transformation—range from 0.775 to 0.957, all statistically significant at the 1% level. This demonstrates that the green efficiency gains from digital transformation persist across different time periods, ruling out the possibility that findings are driven by specific period-specific factors. This further reinforces the robustness of the benchmark regression results.
5. Discussion and Main Research Conclusions
5.1. Discussion
The empirical findings of this study indicate that digital transformation can significantly promote green development in manufacturing enterprises. Further research reveals that digital transformation drives green development in manufacturing enterprises by fostering new productive forces and attracting green investors.
These conclusions align with relevant findings in [
51], further validating the crucial role digital transformation plays in the green development process of manufacturing enterprises. Compared to traditional technologies, the essence of digital transformation lies in its greater emphasis on data-driven intelligent decision-making and end-to-end resource optimization. Traditional technologies are often constrained by information silos, delayed responses, and localized optimization, making it difficult to achieve cross-process, full-cycle energy efficiency management and emissions control. Therefore, through technological integration and operational restructuring, digital transformation builds sustainable green competitiveness for manufacturing enterprises, whereas traditional models struggle to systematically incorporate environmental benefits into long-term strategies.
Compared to the existing literature, this study fully clarifies the internal mechanism through which manufacturing enterprises convert digital investment into green development via in-depth process evolution. Specifically, in terms of measuring the core independent variable, this paper adopts a dynamically integrated Enterprise Digital Transformation Index as the core measurement tool. This not only circumvents the subjective defects of the commonly used word frequency method and the heterogeneity in indicator selection of the entropy method, but also fully reveals the cross-level interaction mechanism between industry digital characteristics and enterprise digital behaviors. It facilitates capturing the overall landscape and structural impacts of digital transformation, thereby rendering the explanation of the enabling effect of digital transformation on the real economy more persuasive (see
Table 15 for details).
In the exploration of the explained variable, a framework for enterprise green development is constructed from the dual dimensions of green governance performance and green innovation efficiency, which breaks through the limitation of most of the existing literature that only focuses on evaluating governance outcomes from the output side while neglecting input efficiency, thus failing to fully and accurately reveal the actual state of enterprise green development (see
Table 16 for details).
Furthermore, this paper feeds back the dual-dimensional interpretation of green development in manufacturing enterprises into the dual-driving path of digital transformation, and analyzes the influencing effects of new productive forces and the entry of green investors in the process of digital transformation driving green development, as well as the heterogeneous effects of potential factors such as enterprise pollution levels and the moderating mechanisms of factors such as enterprise growth potential (see
Table 17 for details).
5.2. Implications for Management
First, managers should actively promote the comprehensive integration of digital technologies such as artificial intelligence and the Internet of Things throughout the entire process of R&D, production, and operations in manufacturing enterprises, establishing a digital environmental monitoring and management system. For instance, they can launch digital-based product carbon footprint tracking or regularly share real-time energy efficiency improvement reports through investor platforms. This approach attracts green investors focused on sustainable development, thereby introducing financial support for corporate green growth.
Second, managers should proactively lead the integration and innovative application of new productive forces across all stages of manufacturing enterprise development, systematically advancing their implementation throughout R&D, production, and operations. This includes deploying advanced technologies like artificial intelligence and smart manufacturing for both research and scenario implementation. Simultaneously, continuously share achievements in technological breakthroughs, industrial upgrades, and efficiency enhancements through professional channels. This attracts talent and partners focused on technological innovation and industrial transformation, injecting sustained momentum into cultivating and strengthening the enterprise’s new quality productive forces. Technological innovation thus drives the green development of manufacturing enterprises.
Third, effective green governance is the foundation for achieving performance. Managers can systematically build a governance framework across three levels—institutions, processes, and oversight—to enhance the standardization and precision of green management. In institutional development, refine green management systems by clarifying environmental responsibilities and standards across all stages, and integrate green performance into supplier evaluation frameworks to promote collaborative carbon reduction throughout the supply chain. For process optimization, advance clean production and resource recycling upgrades, promote short-process technologies and recycled materials, encourage green microgrid development, increase renewable energy usage, and reduce reliance on fossil fuels. For oversight and evaluation, establish a regular review mechanism to assess quarterly implementation progress and target achievement, developing remediation plans for non-compliant items. Simultaneously, implement a transparent disclosure system by publishing ESG reports aligned with international standards. Publicize green progress through official websites, industry conferences, and other channels to proactively accept oversight from all stakeholders, address societal concerns, and strengthen corporate credibility.
Fourth, managers should focus on technological breakthroughs as the core driver to build a green innovation system covering R&D, transformation, and iteration. First, increase R&D investment in cutting-edge green technologies such as low-carbon solutions, clean production, and recycling, while intensifying efforts in carbon capture and utilization. Establish collaborative platforms integrating industry, academia, and research to tackle key technological challenges with universities and research institutes, accelerating the conversion of scientific achievements into productive capacity. Second, focus on developing green products and establish a traceable carbon footprint mechanism to enhance market differentiation and competitiveness. Finally, establish a dedicated green innovation fund to incentivize breakthrough R&D by technical teams, while simultaneously implementing innovation risk assessment and control mechanisms to ensure steady progress in both technological advancement and industrialization.
5.3. Main Research Conclusions
This study uses a digital transformation index to measure the level of digital transformation and employs green innovation efficiency and green governance performance to assess the green development of manufacturing enterprises. It investigates the impact of digital transformation on the green development of manufacturing enterprises and its underlying mechanisms. With the rapid advancement of digital technologies, practical research on how digital transformation promotes green development in manufacturing enterprises holds significant implications for both manufacturing companies and the formulation of relevant government policies.
Key findings include: Digital transformation significantly enhances green development in manufacturing enterprises. Benchmark regression results demonstrate that digital transformation markedly boosts green development, a conclusion that remains robust after endogeneity tests and various robustness checks, including replacing the dependent variable. Adopting a micro-enterprise perspective, this study scientifically measures digital transformation and green development in manufacturing enterprises to analyze their relationship. This approach not only expands the theoretical framework on the economic effects of digital transformation but also provides feasible digital pathways for green development in manufacturing.
Mechanism analysis reveals that the entry of new-type productive forces and green investors mediates the relationship between digital transformation and green development in manufacturing enterprises. During digital transformation, manufacturing enterprises can advance their green development by attracting green investors and developing new-type productive forces. This mechanism analysis supplements existing research on how digital transformation influences green development in manufacturing enterprises by identifying specific pathways, while also offering new perspectives for understanding the drivers of green development in this sector.
Heterogeneity tests reveal that the impact of digital transformation on the green development of manufacturing enterprises is more pronounced in non-heavily polluting industries and among manufacturing firms located in eastern regions. This differentiated outcome emerged from heterogeneity analysis that distinguished industry attributes and geographic location. Consequently, the study further clarifies the applicable scenarios and scope where digital transformation exerts a green-promoting effect, thereby aiding manufacturing enterprises in effectively advancing their digital transformation initiatives.
Moderation tests reveal that the promotional effect of digital transformation on green development is significantly moderated by firm growth potential and financing constraints, with the former exerting a positive moderation effect and the latter a negative one. This finding not only expands our understanding of the contextual factors influencing these relationships but also provides practical evidence for government departments to refine institutional mechanisms. By alleviating financing pressures and similar measures, they can better leverage digital technologies to enhance green development in manufacturing enterprises.