1. Introduction
Sustainable governance of land resources is fundamental to global food security, climate stability, biodiversity, and equitable urban growth [
1,
2]. Effective stewardship hinges on the capacity of governments and agencies to accurately detect and swiftly respond to changes in land use and cover [
3,
4]. This need for timely insight is amplified by global sustainability commitments, including the UN Sustainable Development Goals on sustainable cities and terrestrial ecosystems [
5,
6]. Transitioning from periodic, backward-looking reports to continuous, near-real-time monitoring is therefore not merely beneficial—it is a practical necessity. Such a shift enables proactive interventions, from curbing unlawful deforestation and improving farmland use to guiding responsible urban development [
7,
8]. Furthermore, even legally sanctioned changes in land use are often approved and implemented at decentralized local levels (e.g., county or city). The collective impact of these dispersed decisions may not be immediately apparent to provincial planners, creating a critical information gap. This lack of a unified, real-time overview impedes strategic coordination and sustainable governance at the regional scale.
A persistent technological bottleneck underlies this limitation. Current systems for monitoring land change often suffer from fragmented workflows [
9,
10], a problem rooted in the parallel development of two largely separate technology strands. One strand focuses on high-performance geocomputation, employing parallel frameworks [
11], optimized algorithms [
12], and distributed data management [
13,
14,
15] to accelerate analytical processing. The other advances geospatial visualization through methods such as dynamic tiling [
16], enhanced web services [
17,
18], and efficient raster pyramids [
19,
20]. This divergence points to a deeper methodological split. Researchers often treat computational scalability and interactive visualization as separate goals [
21,
22]. While each has its strengths, the two remain disconnected in practice. Consequently, even fast analytical results must go through outdated map-serving pipelines. These pipelines rely on slow, preprocessing-intensive tile generation [
23,
24]. This creates a critical delay, often lasting hours or days, between completing an analysis and delivering it in a visual, actionable form to decision-makers [
25,
26]. Such latency undermines the responsiveness required for sustainable governance, where policies must adapt to rapidly changing conditions [
27,
28]. Moreover, most existing solutions are also generic; they fail to address the specific demands of land administration, which include complex parcel geometries, strict topological rules, and legally mandated workflows [
29,
30,
31].
To bridge this gap, we introduce and validate a Computational-Visualization Co-design (CVC) framework. This work moves beyond simply integrating two independent systems. Instead, we propose a new system design paradigm. In this paradigm, the basic units of computation, such as data shards, are simultaneously designed as the core indexing units for visualization. This architectural co-design eliminates the fundamental bottleneck of intermediate data reorganization, which plagues traditional “optimize-then-connect” approaches. The outcome is a seamless pipeline where analytical results become immediately visible for land-change verification.
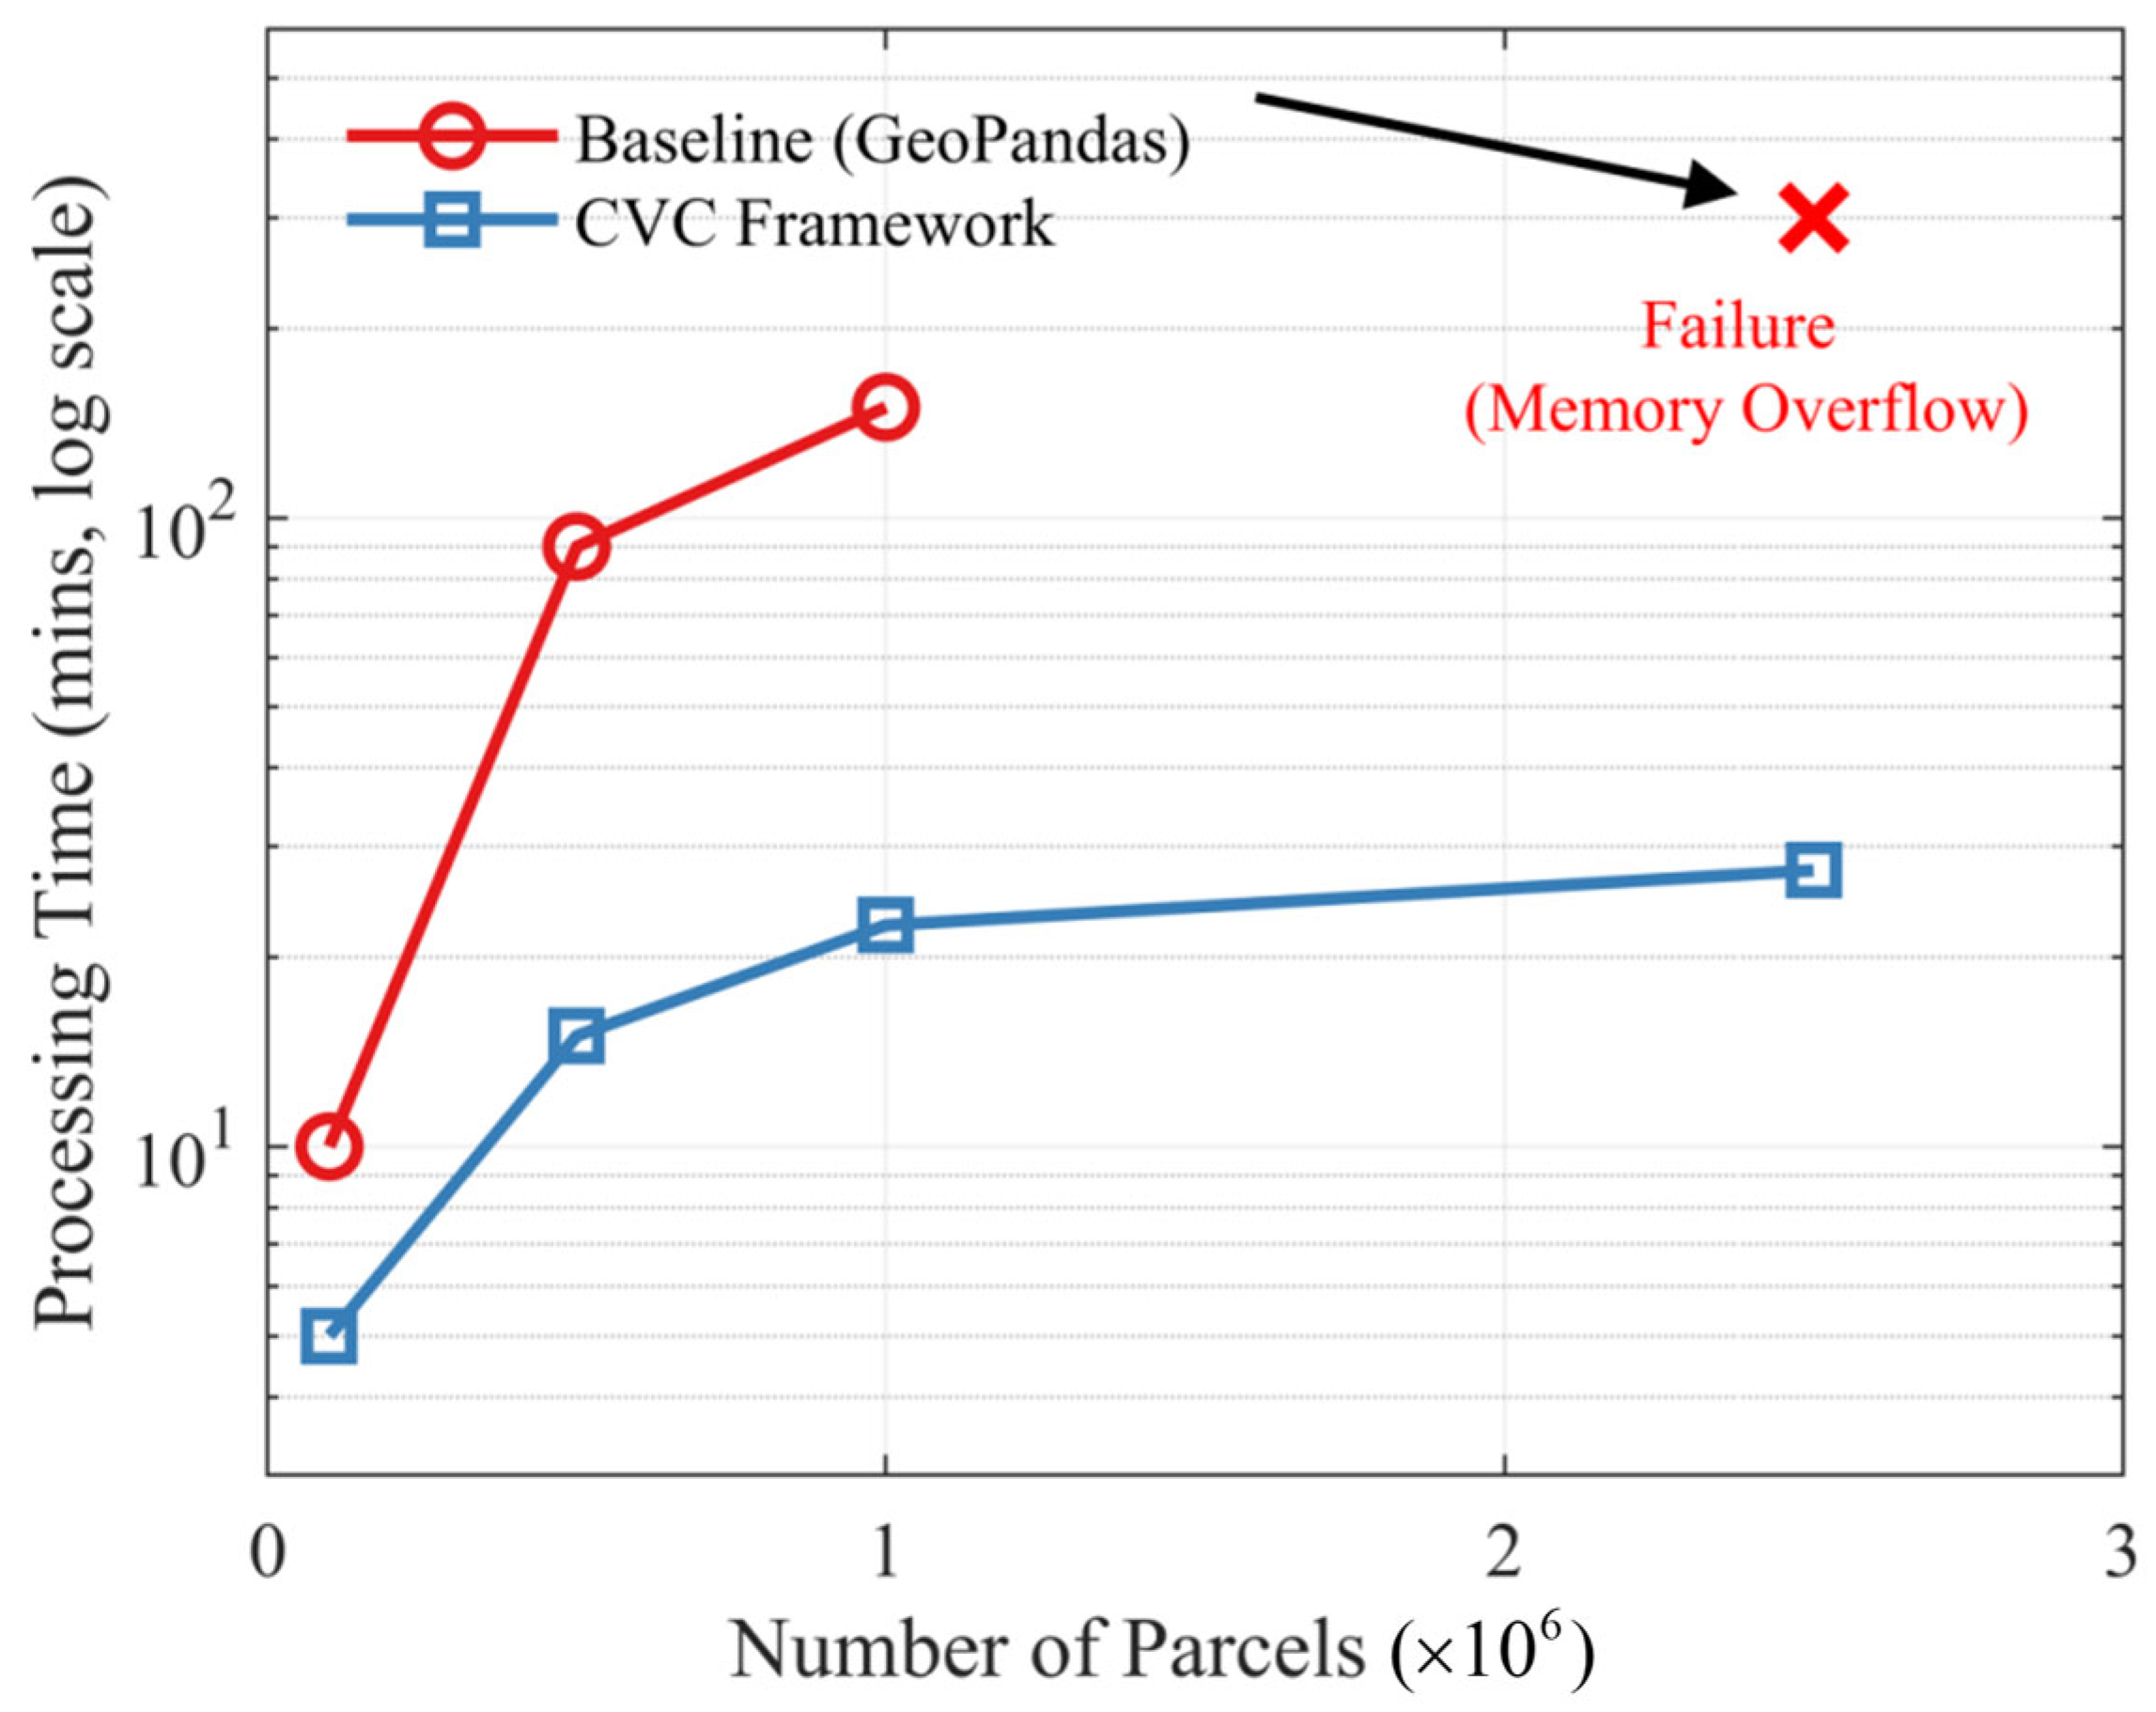
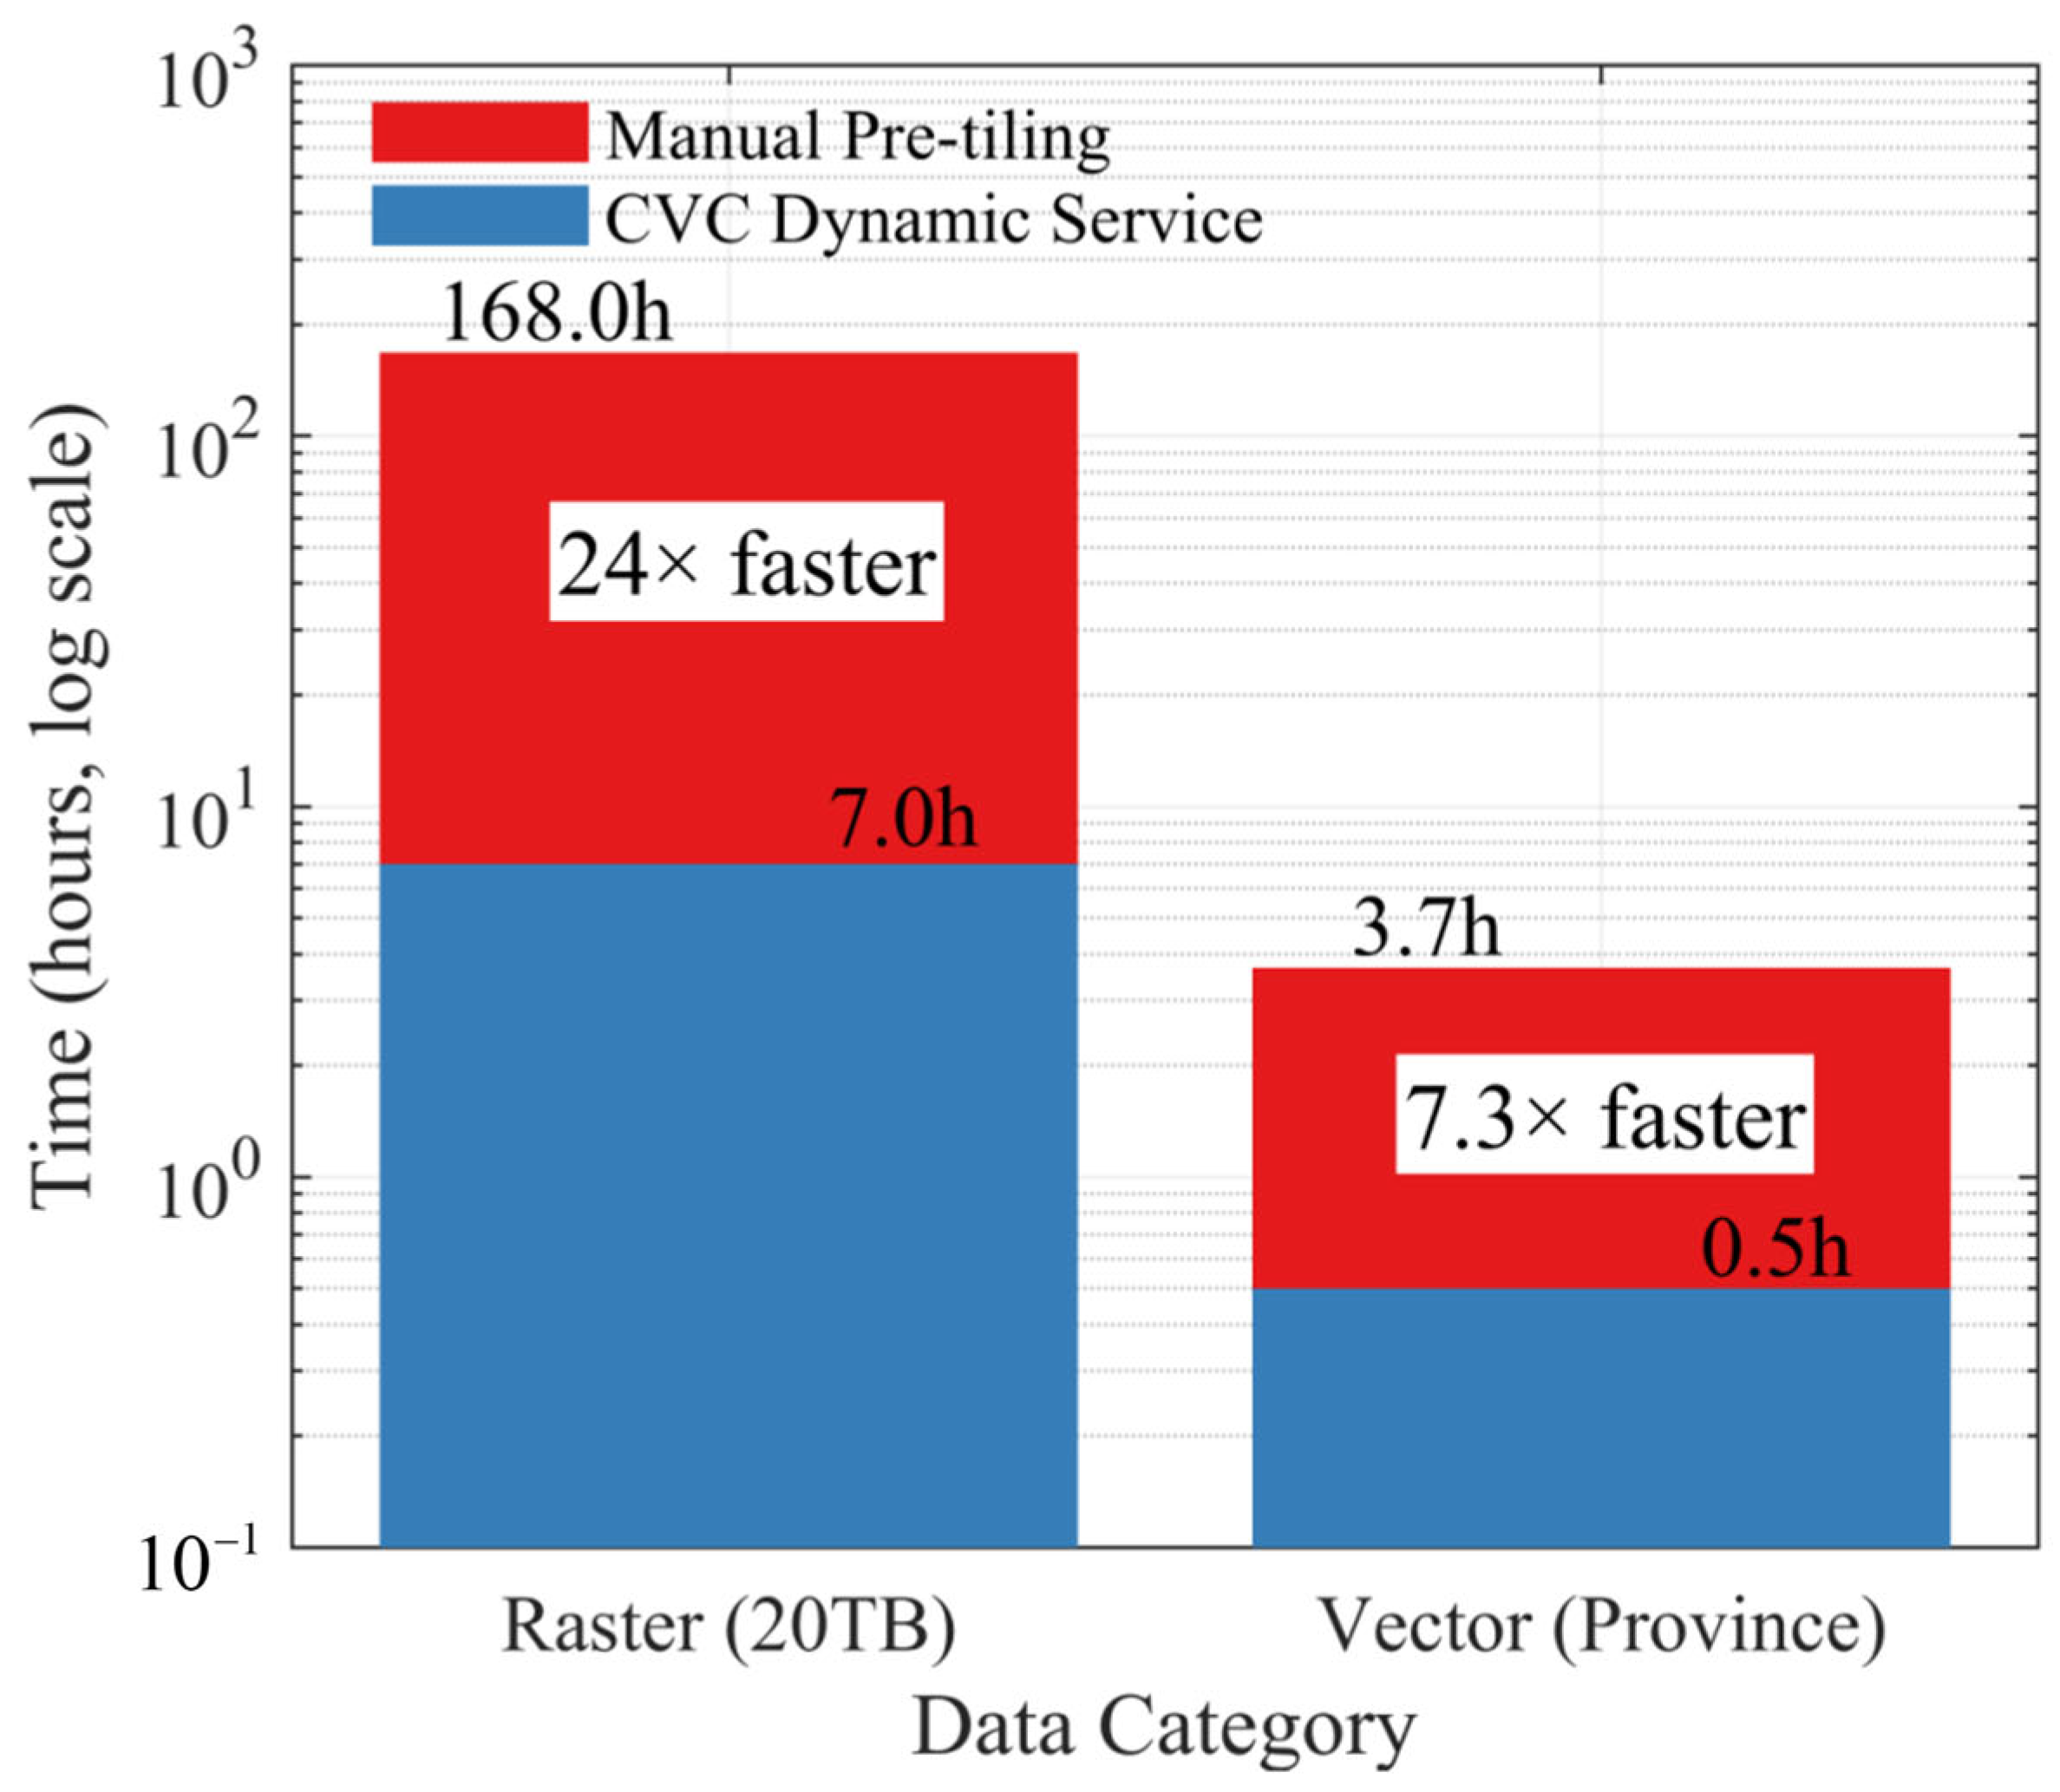
The primary contribution of this work is therefore a system-level architecture founded on a co-design principle. This principle ensures that computational and visual processes are mutually reinforcing from the ground up. We materialize this through three key advances: an adaptive computing engine whose data shards are visualization-ready; a real-time visualization engine that operates without preprocessing bottlenecks; and a rigorous validation using national-scale data. Together, they demonstrate a 5–9× speedup in processing and a 24× faster time-to-visualization. This work provides more than faster components; it offers a proven blueprint for a new, responsive paradigm in sustainable land governance.
2. Materials and Methods
Addressing the disconnect between geocomputation and decision support requires a fundamental re-engineering of the land verification workflow. This study presents an integrated framework that co-designs high-performance distributed computing with a real-time visualization system. The following sections detail this architecture, beginning with an overview of the unified pipeline before delving into its core computational and visual engines.
2.1. System Overview and Integrated Workflow
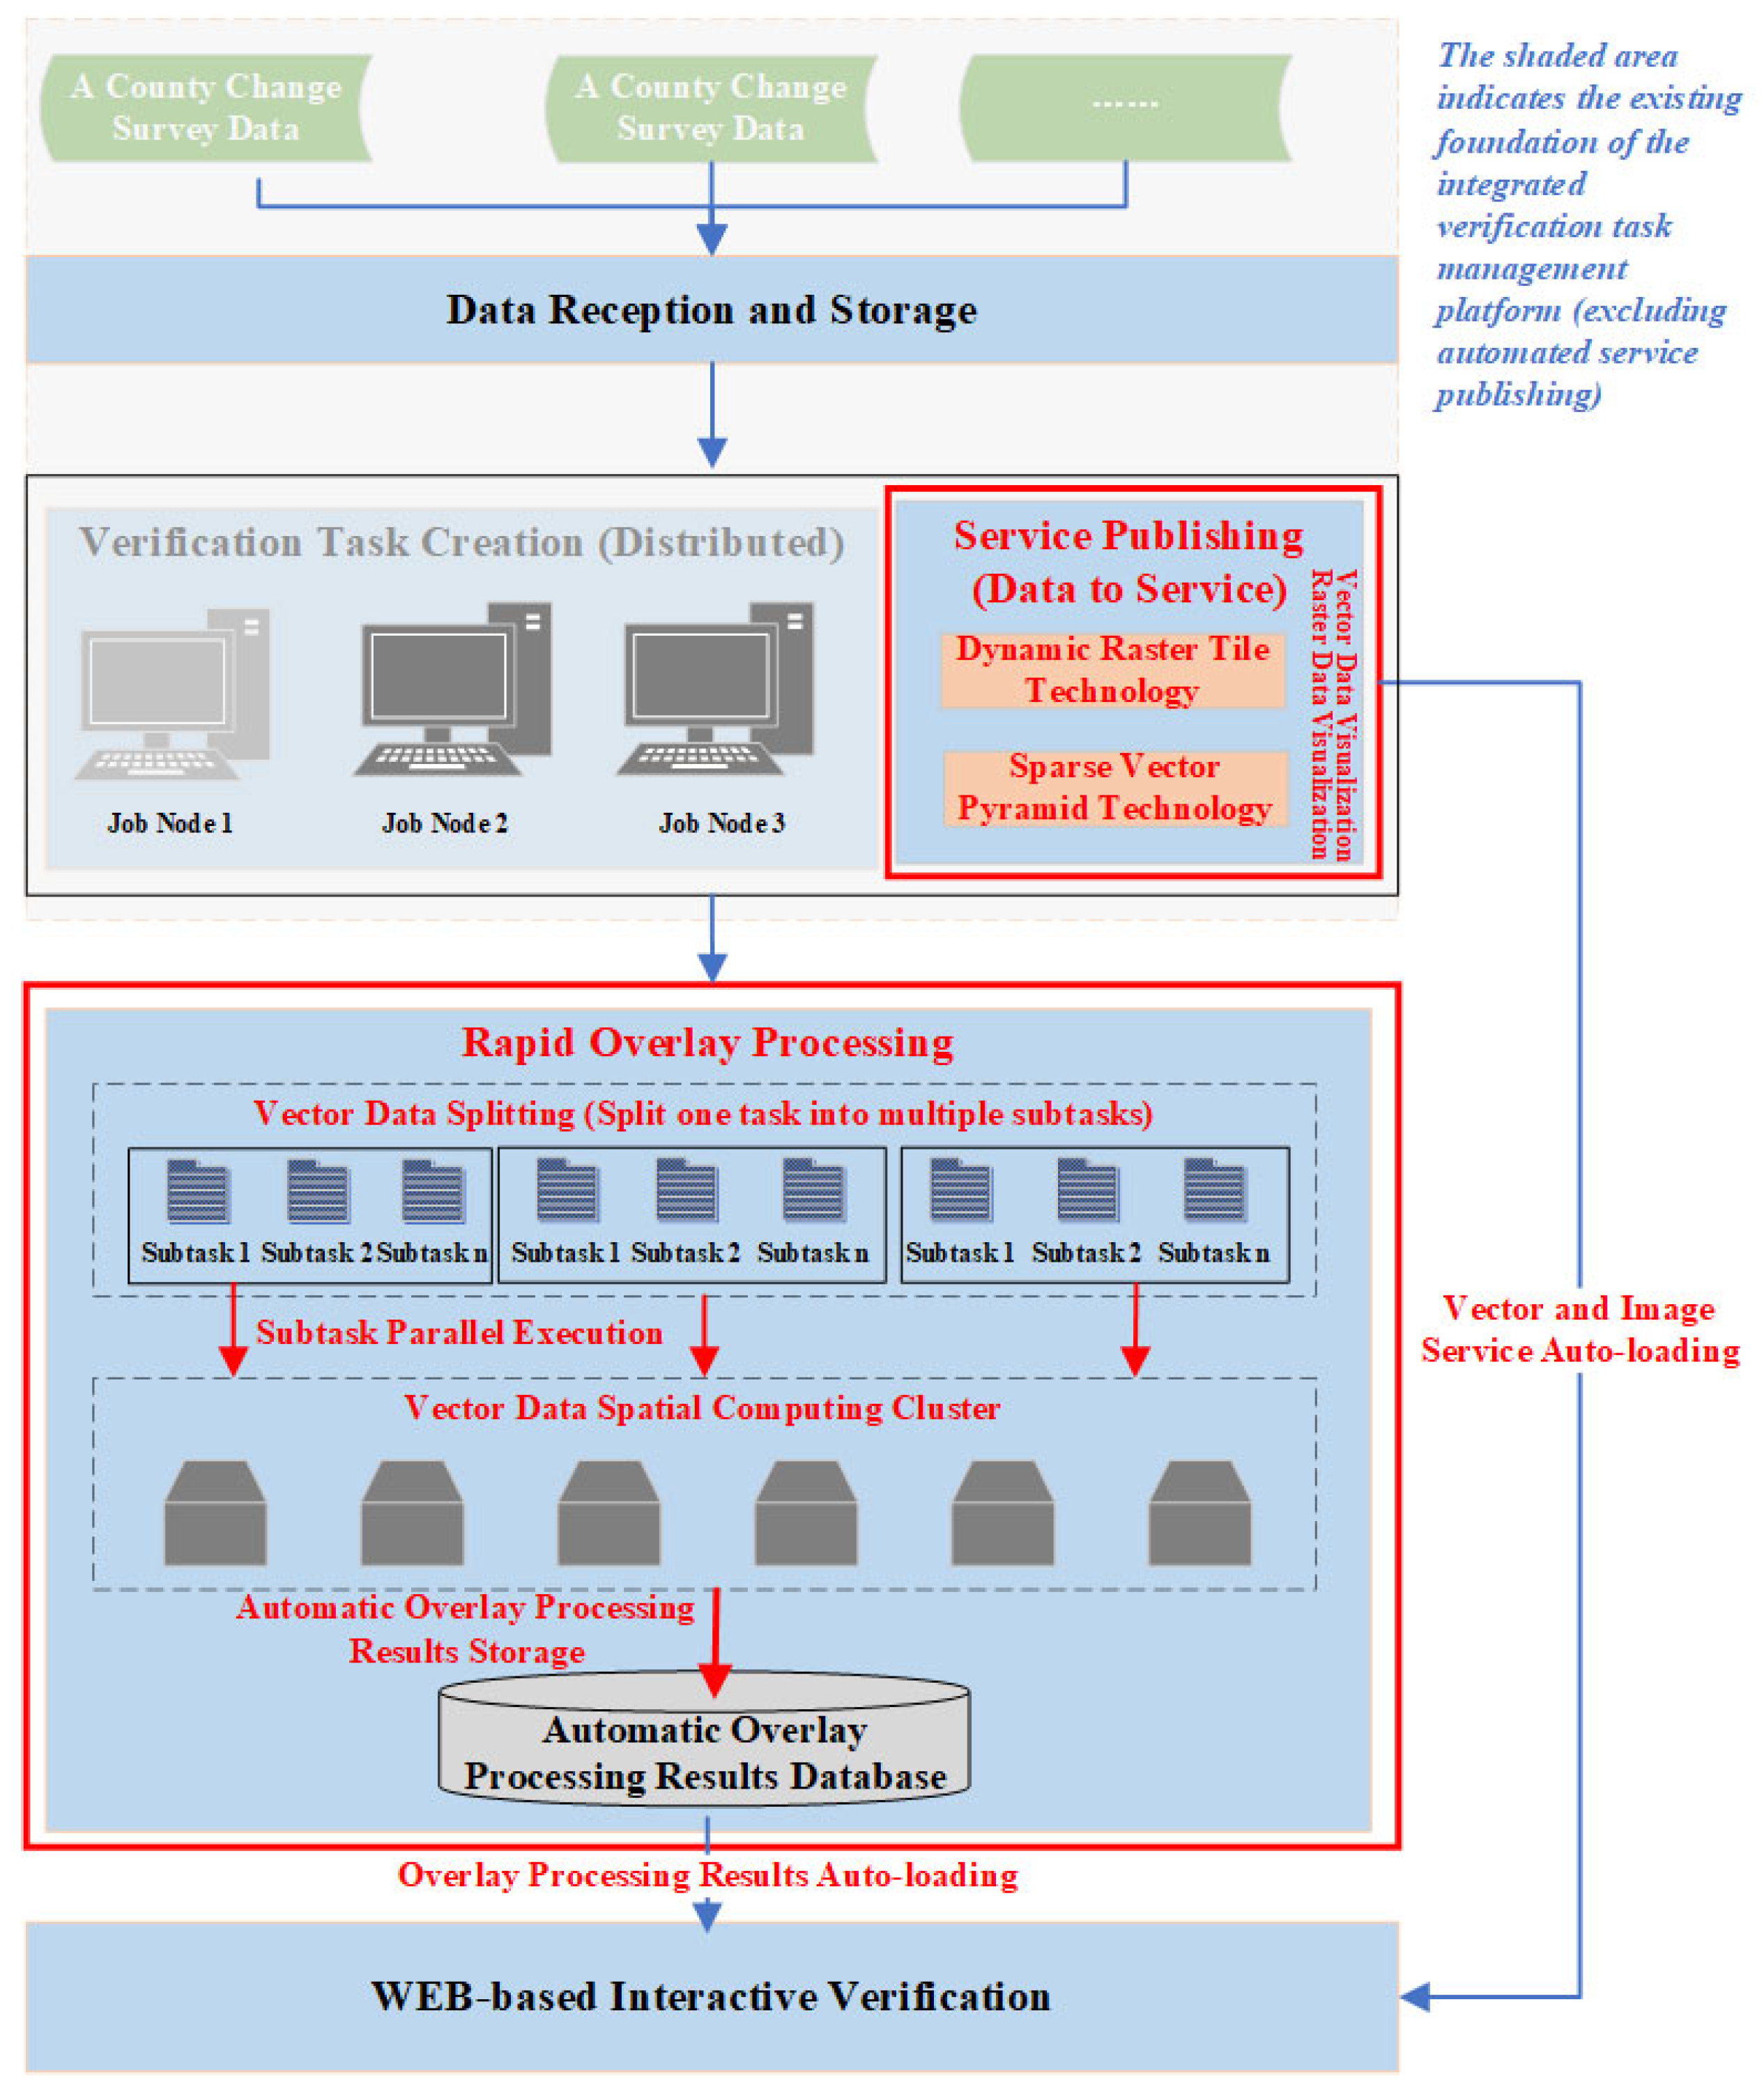
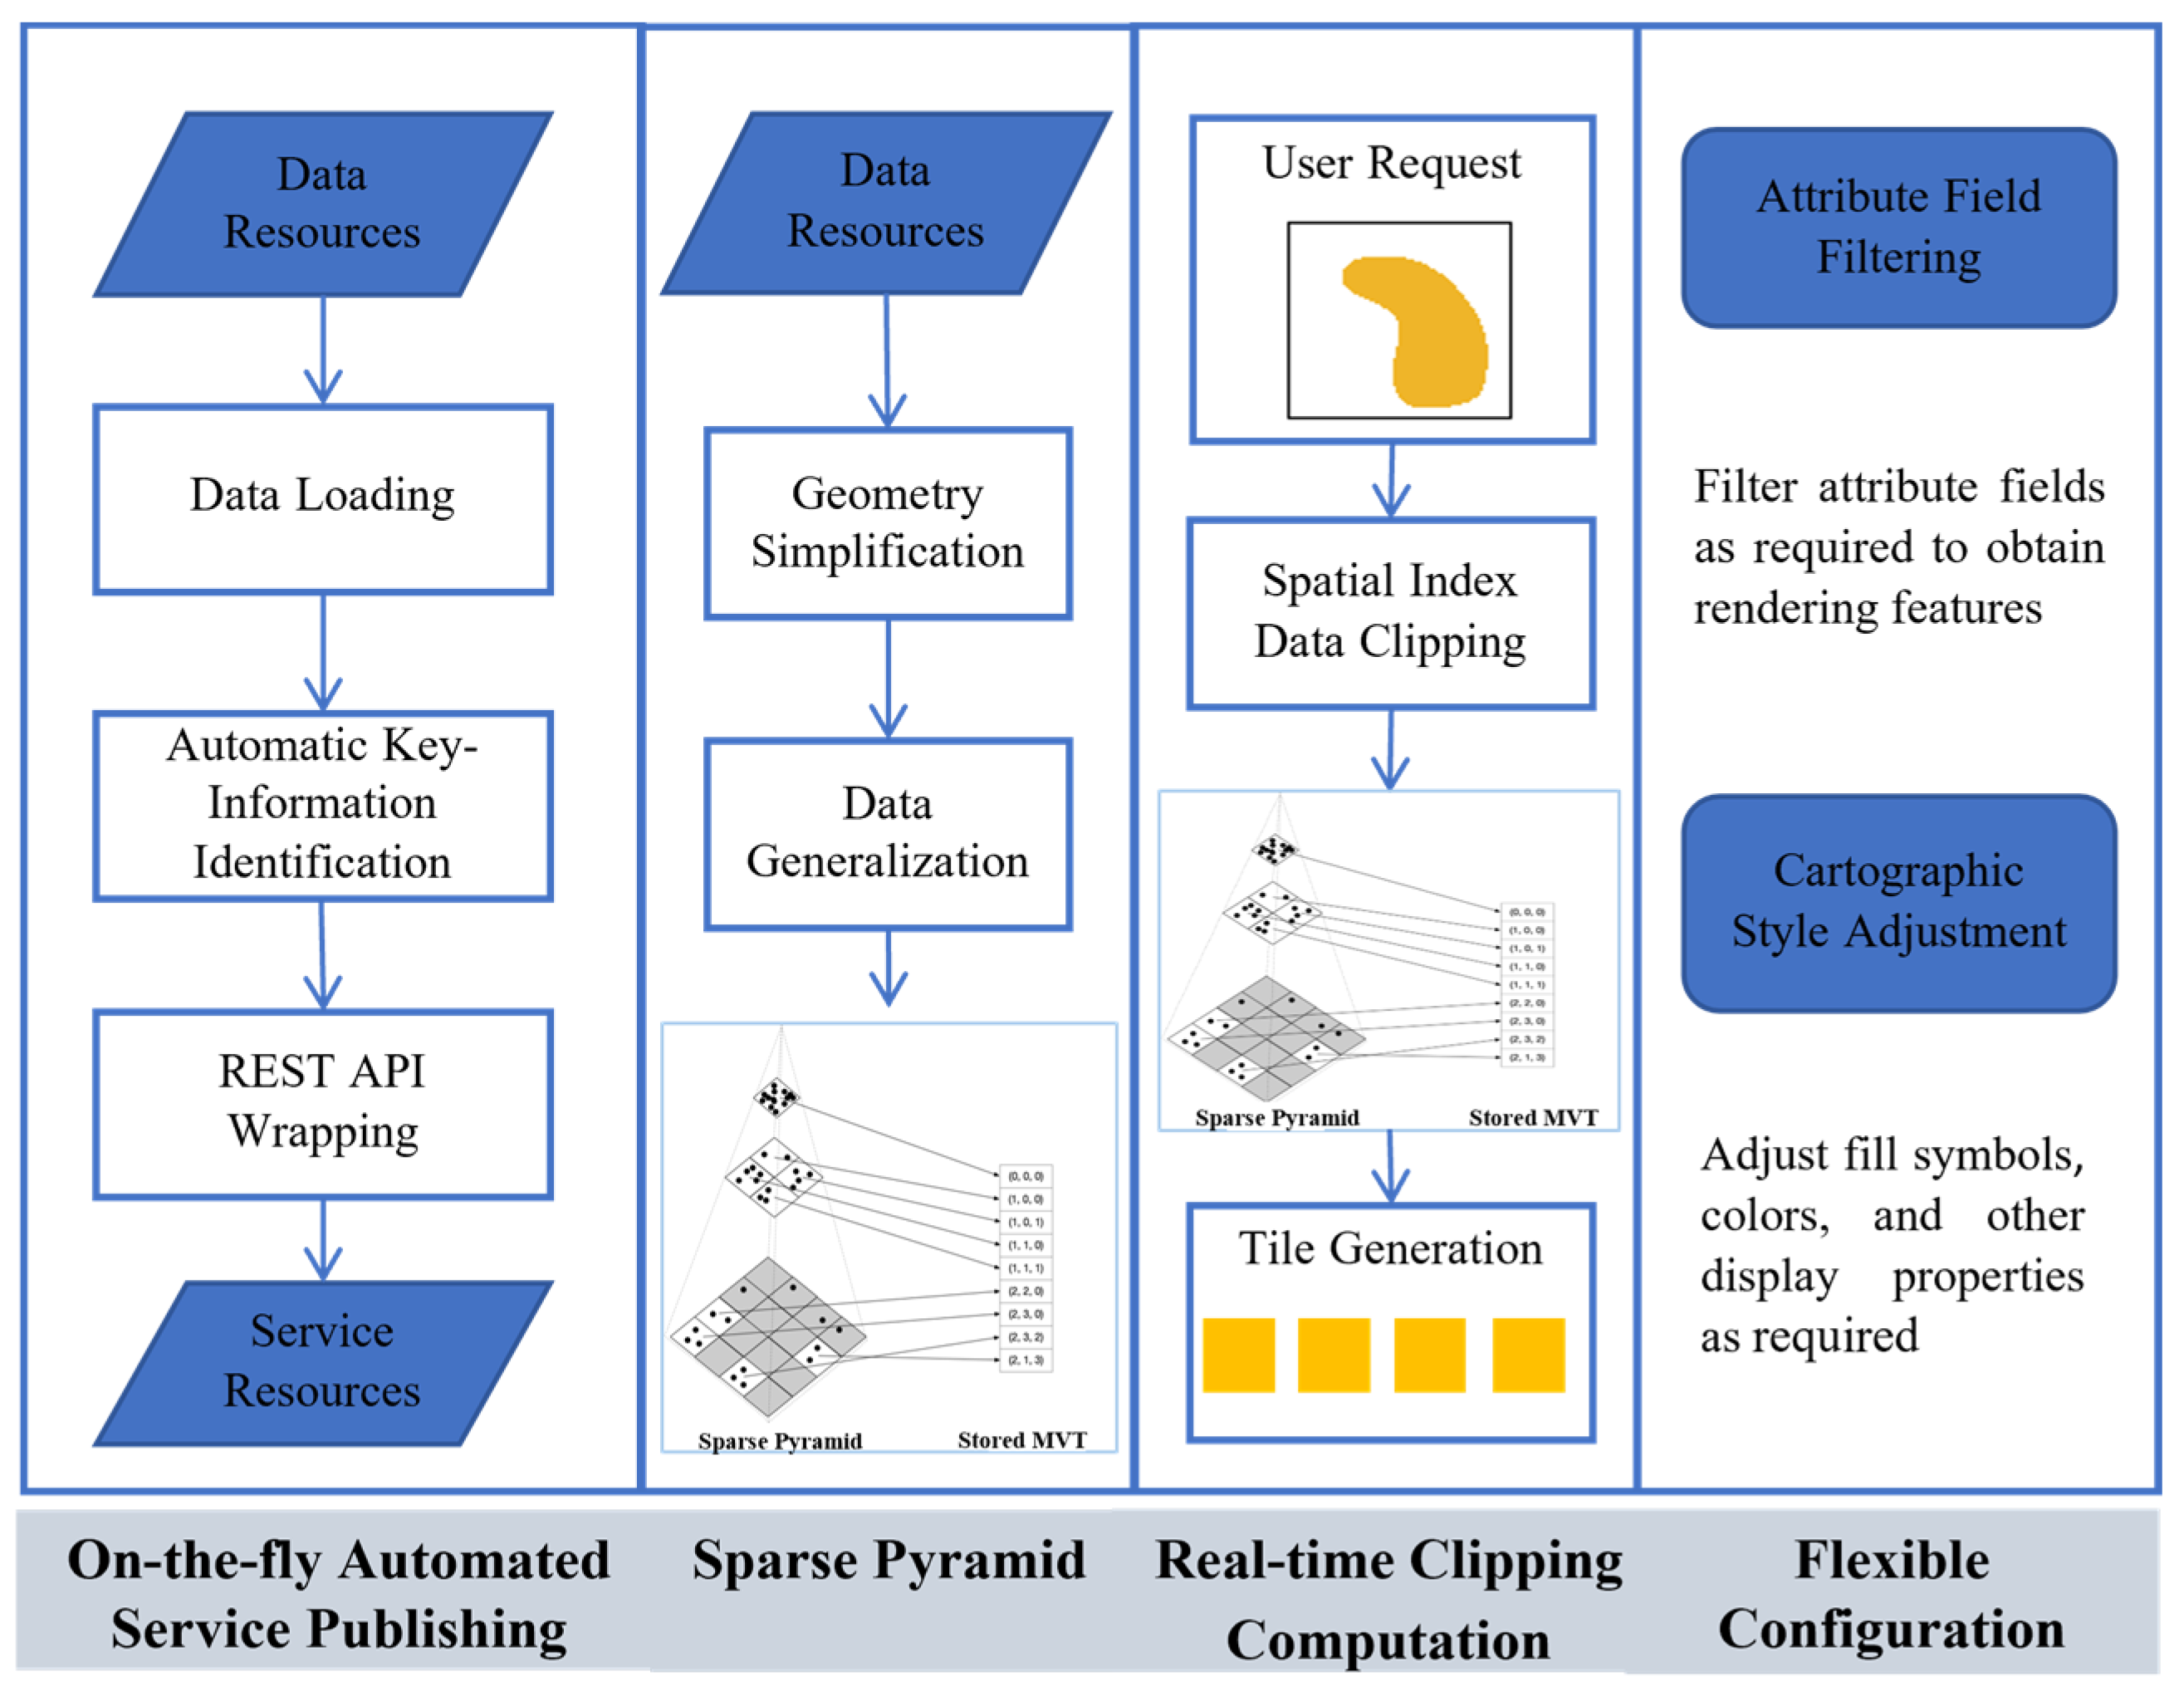
Conventional verification systems often compartmentalize data processing, analysis, and visualization into sequential, batch-oriented steps, creating latency at each stage. Our framework was designed to collapse these stages into a cohesive, near-real-time pipeline. As depicted in
Figure 1, the system architecture is built around a continuous flow from data ingestion to interactive decision support.
The process initiates with the automated ingestion and service publishing of incoming land survey data. Upon receipt, data are versioned and cataloged in a central repository. Critically, rather than relegating service creation to a later, manual step, the framework immediately publishes both raster imagery and vector parcels as standard web map services (WMS/WMTS). This “service-upon-ingestion” capability, driven by predefined metadata rules, ensures that the latest data are instantly discoverable and queryable, eliminating a traditional preprocessing bottleneck.
Once services are live, an automated task dispatch mechanism parcels the data and generates corresponding analysis jobs, distributing them across a distributed computing cluster. This automation ensures efficient resource allocation and sets the stage for large-scale processing.
The core analytical heavy lifting is performed by the distributed overlay processing engine. To manage datasets that would overwhelm single machines, the system employs an adaptive data sharding strategy, intelligently dividing large geographic layers into smaller, parallelizable units. A high-performance spatial cluster then processes these units concurrently, with all results being streamed back in real-time to a shared spatial database. This design not only accelerates computation but also makes results available the second they land for the next phase.
For the human-in-the-loop, a web-based interactive verification interface provides the front end. This interface automatically loads the processed verification targets from the shared database, presenting them clearly for expert review. To provide essential spatial context during this review, the system dynamically streams base map layers on demand. By leveraging dynamic tiling and sparse pyramid techniques (detailed in
Section 2.3), the system delivers current imagery and vector backgrounds without pre-generation delays, allowing inspectors to work with a complete, up-to-date visual picture.
In essence, this architecture integrates data management, parallel computation, and instant visualization into a fluid workflow. It transforms a traditionally fragmented, slow process into a responsive system where insights can be computed and visually accessed on operational timescales.
2.2. Distributed Parallel Computing Engine
Conventional GIS architectures struggle with the computational scale required for overlay analysis of land parcels, a core task in change verification that often involves millions of complex features. To meet the demands of operational workflows, we developed a dedicated distributed computing engine. Its design integrates three key components: a distributed storage backend, an adaptive data sharding strategy, and an intelligent task scheduler. Together, these components shift overlay analysis from a sequential, memory-limited process into a parallelized, cluster-scale operation.
We used GeoPandas [
32,
33] for core spatial operations, taking advantage of its combined support for tabular data handling via Pandas and geometric operations via Shapely. This allowed us to perform the necessary range of tasks, from simple spatial queries to compute-intensive overlays. To support distributed storage and execution, we implemented Citus 13.0 [
34], a PostgreSQL extension that partitions data horizontally across a cluster and provides the foundation for parallel processing. The choice of these tools was guided by several critical factors. GeoPandas delivers a mature and expressive framework for spatial operations in Python 3.8, effectively combining the geometric processing capabilities of Shapely with Pandas’ data analysis features. This integration makes it well-suited for developing and implementing complex spatial overlay workflows. We selected Citus as our distributed PostgreSQL extension due to its full support for SQL and GIS standards, along with its ability to transparently shard data across a cluster—ensuring strong consistency while building upon the reliable PostgreSQL foundation. For orchestrating distributed tasks, PowerJob provided a comprehensive open-source platform equipped with dynamic load balancing and robust fault tolerance. Its architecture demonstrated greater flexibility in managing our heterogeneous spatial task dependencies compared to conventional queue-based systems. Together, these components established an integrated and production-capable stack that optimizes development agility, operational stability, and horizontal scalability.
2.2.1. Adaptive Data Sharding
Traditional systems often process data as large, monolithic units. A common example is processing all parcels within an entire county at once. This approach can cause memory overflow and severe slowdowns during complex overlay analyses. Our approach proactively breaks these large spatial datasets into smaller, independent units called shards. During analysis, each node loads only the shards relevant to its assigned computation, significantly reducing memory and processing load per node. All results from parallel subtasks are written simultaneously to a shared database, which maintains data consistency while avoiding the limitations of single-node systems.
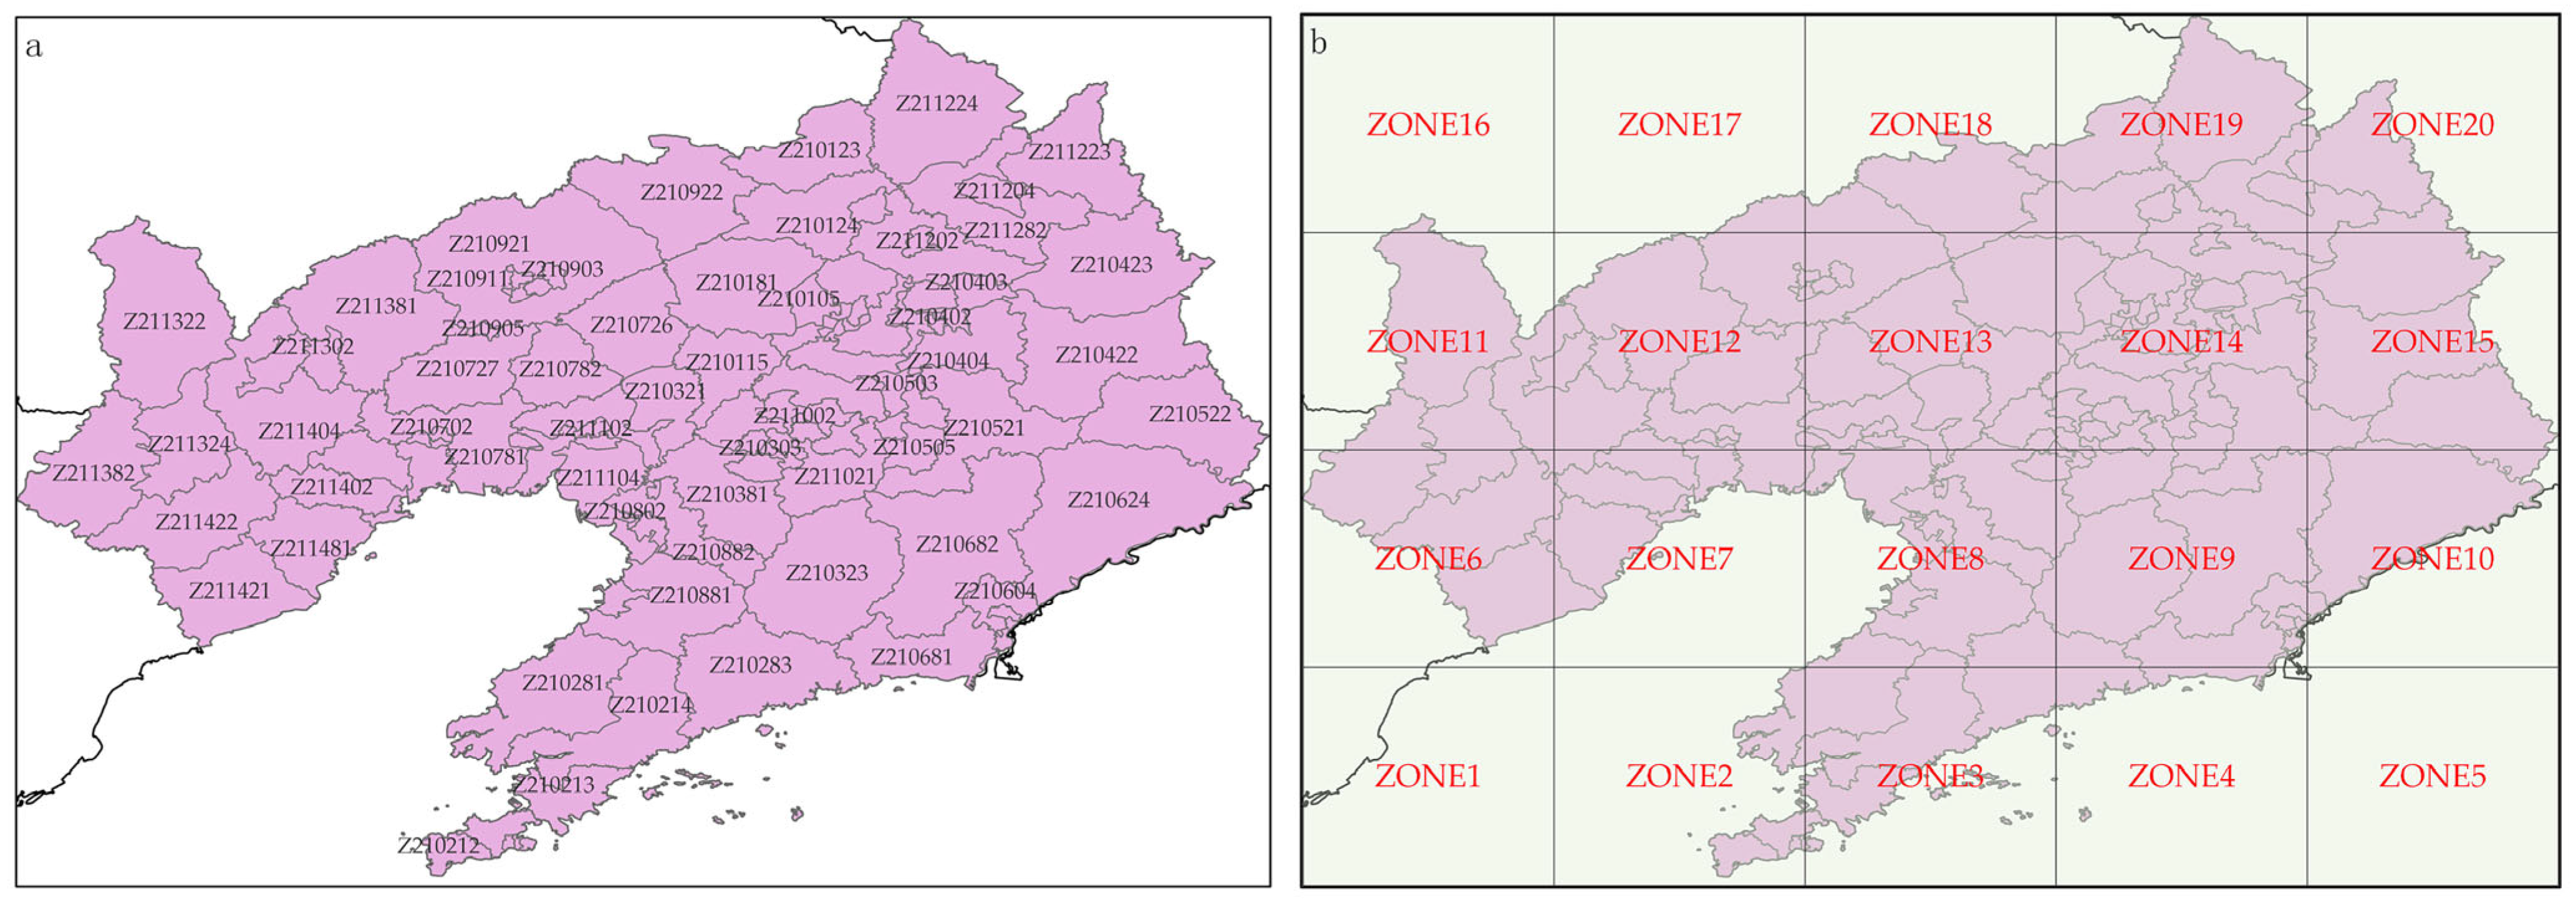
To further improve efficiency, the framework selects between two partitioning methods based on the analysis context. For tasks that follow administrative reporting lines, a hierarchical administrative division split is applied (
Figure 2a). For analyses where boundaries are not meaningful, a regular grid-based partition is used (
Figure 2b). This hybrid strategy balances managerial relevance with spatial efficiency.
2.2.2. Intelligent Distributed Scheduling
Effectively processing a large number of shards requires capable scheduling. We integrated an intelligent distributed scheduler that moves the workload from a single machine to a multi-node cluster. A dynamic load-balancing mechanism [
35] lies at the center of this scheduler, continuously tracking CPU, memory, and I/O usage across all nodes in real time. It assigns tasks by considering both the computational difficulty of the job and the size of each shard, which helps avoid bottlenecks and idle resources, thus improving overall throughput.
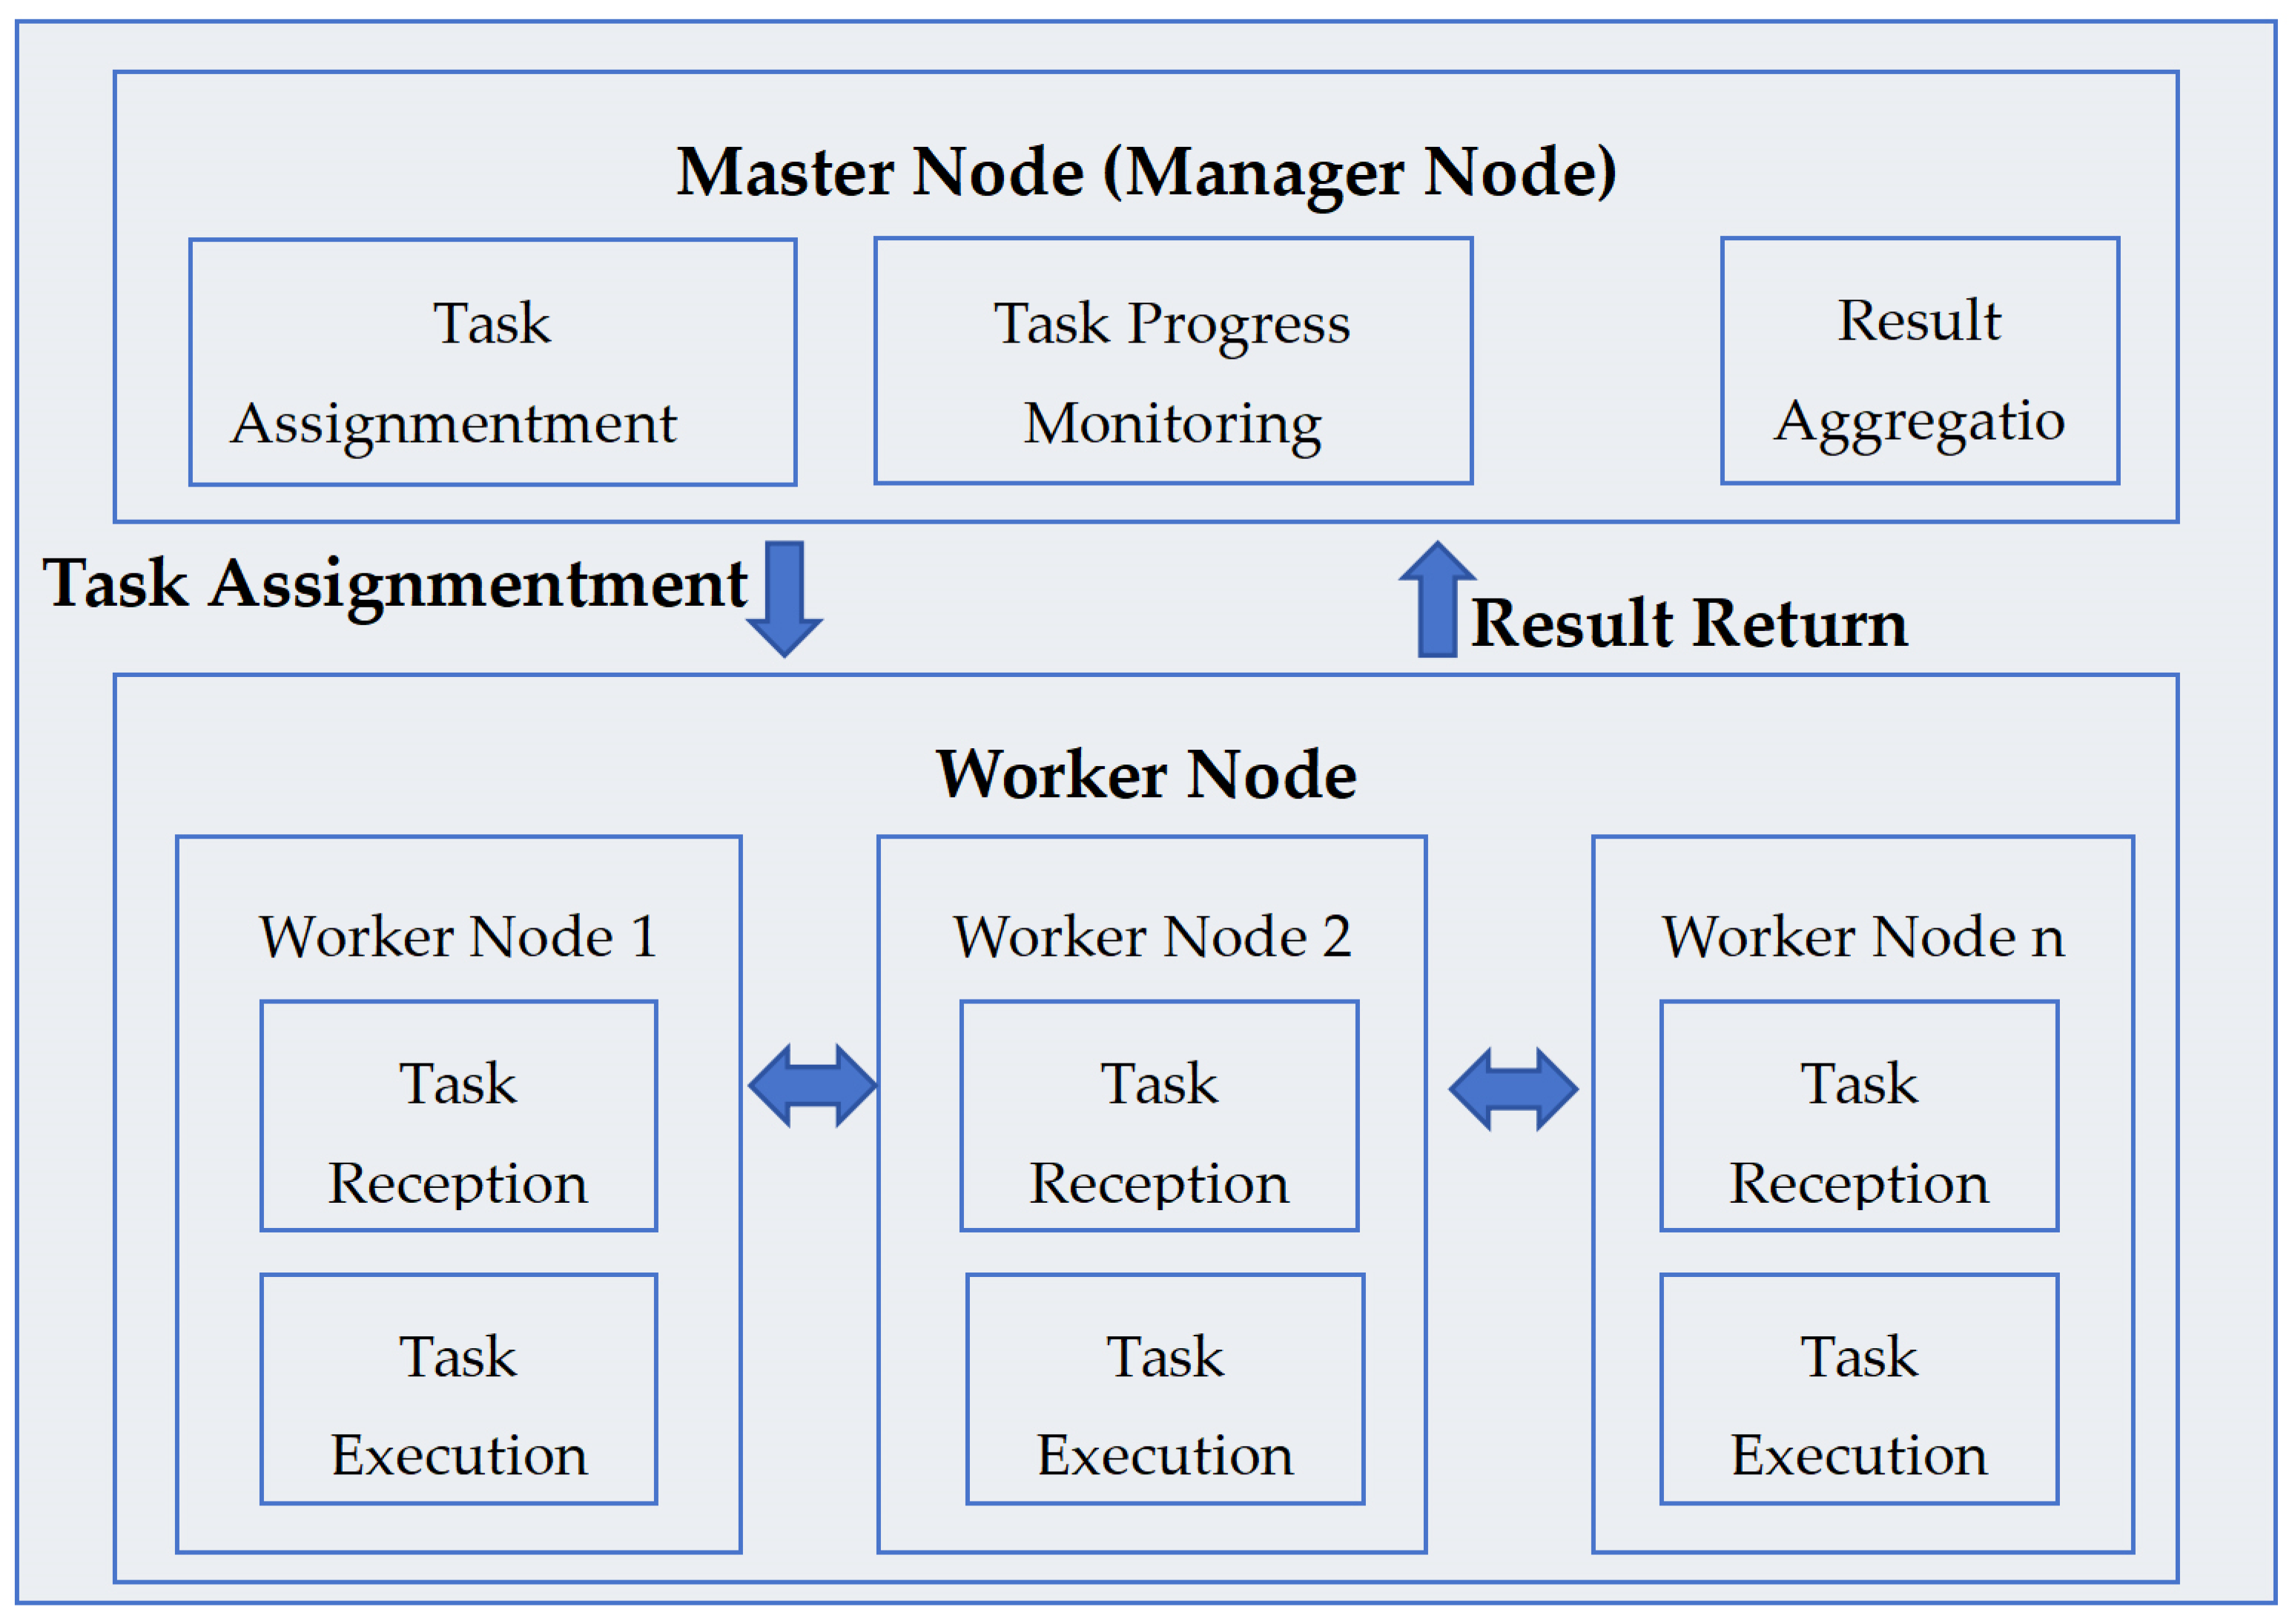
The scheduler follows a centralized-decentralized model. A master node holds a global task queue and monitors worker nodes through persistent heartbeat signals. A dynamic scoring algorithm evaluates node readiness several times per second, allowing efficient management of billions of spatial shards. If a task fails, a layered retry process first attempts it again on the same node; if it continues to fail, the task is automatically moved to another available node. This ensures completion without manual intervention. Once processing is done, all worker nodes return their results to the master, where a streamlined aggregation algorithm merges them into a unified, decision-ready geospatial dataset, as shown in
Figure 3.
2.3. Rapid Visualization Engine
A key challenge in operational land change monitoring is the delay between updating data and making it visually available. Traditional map-serving systems depend on pre-generated, static tile pyramids. Any change to the underlying data forces a complete regeneration of these tiles, a process that is time-consuming, storage-intensive, and prevents users from seeing updates right away [
36]. To support instantaneous visualization, we developed a dynamic tile service based on a “service-upon-ingestion” model. This is paired with a sparse vector pyramid designed for the efficient display of very large parcel datasets.
2.3.1. Dynamic Raster Tiles for Instant Data Display
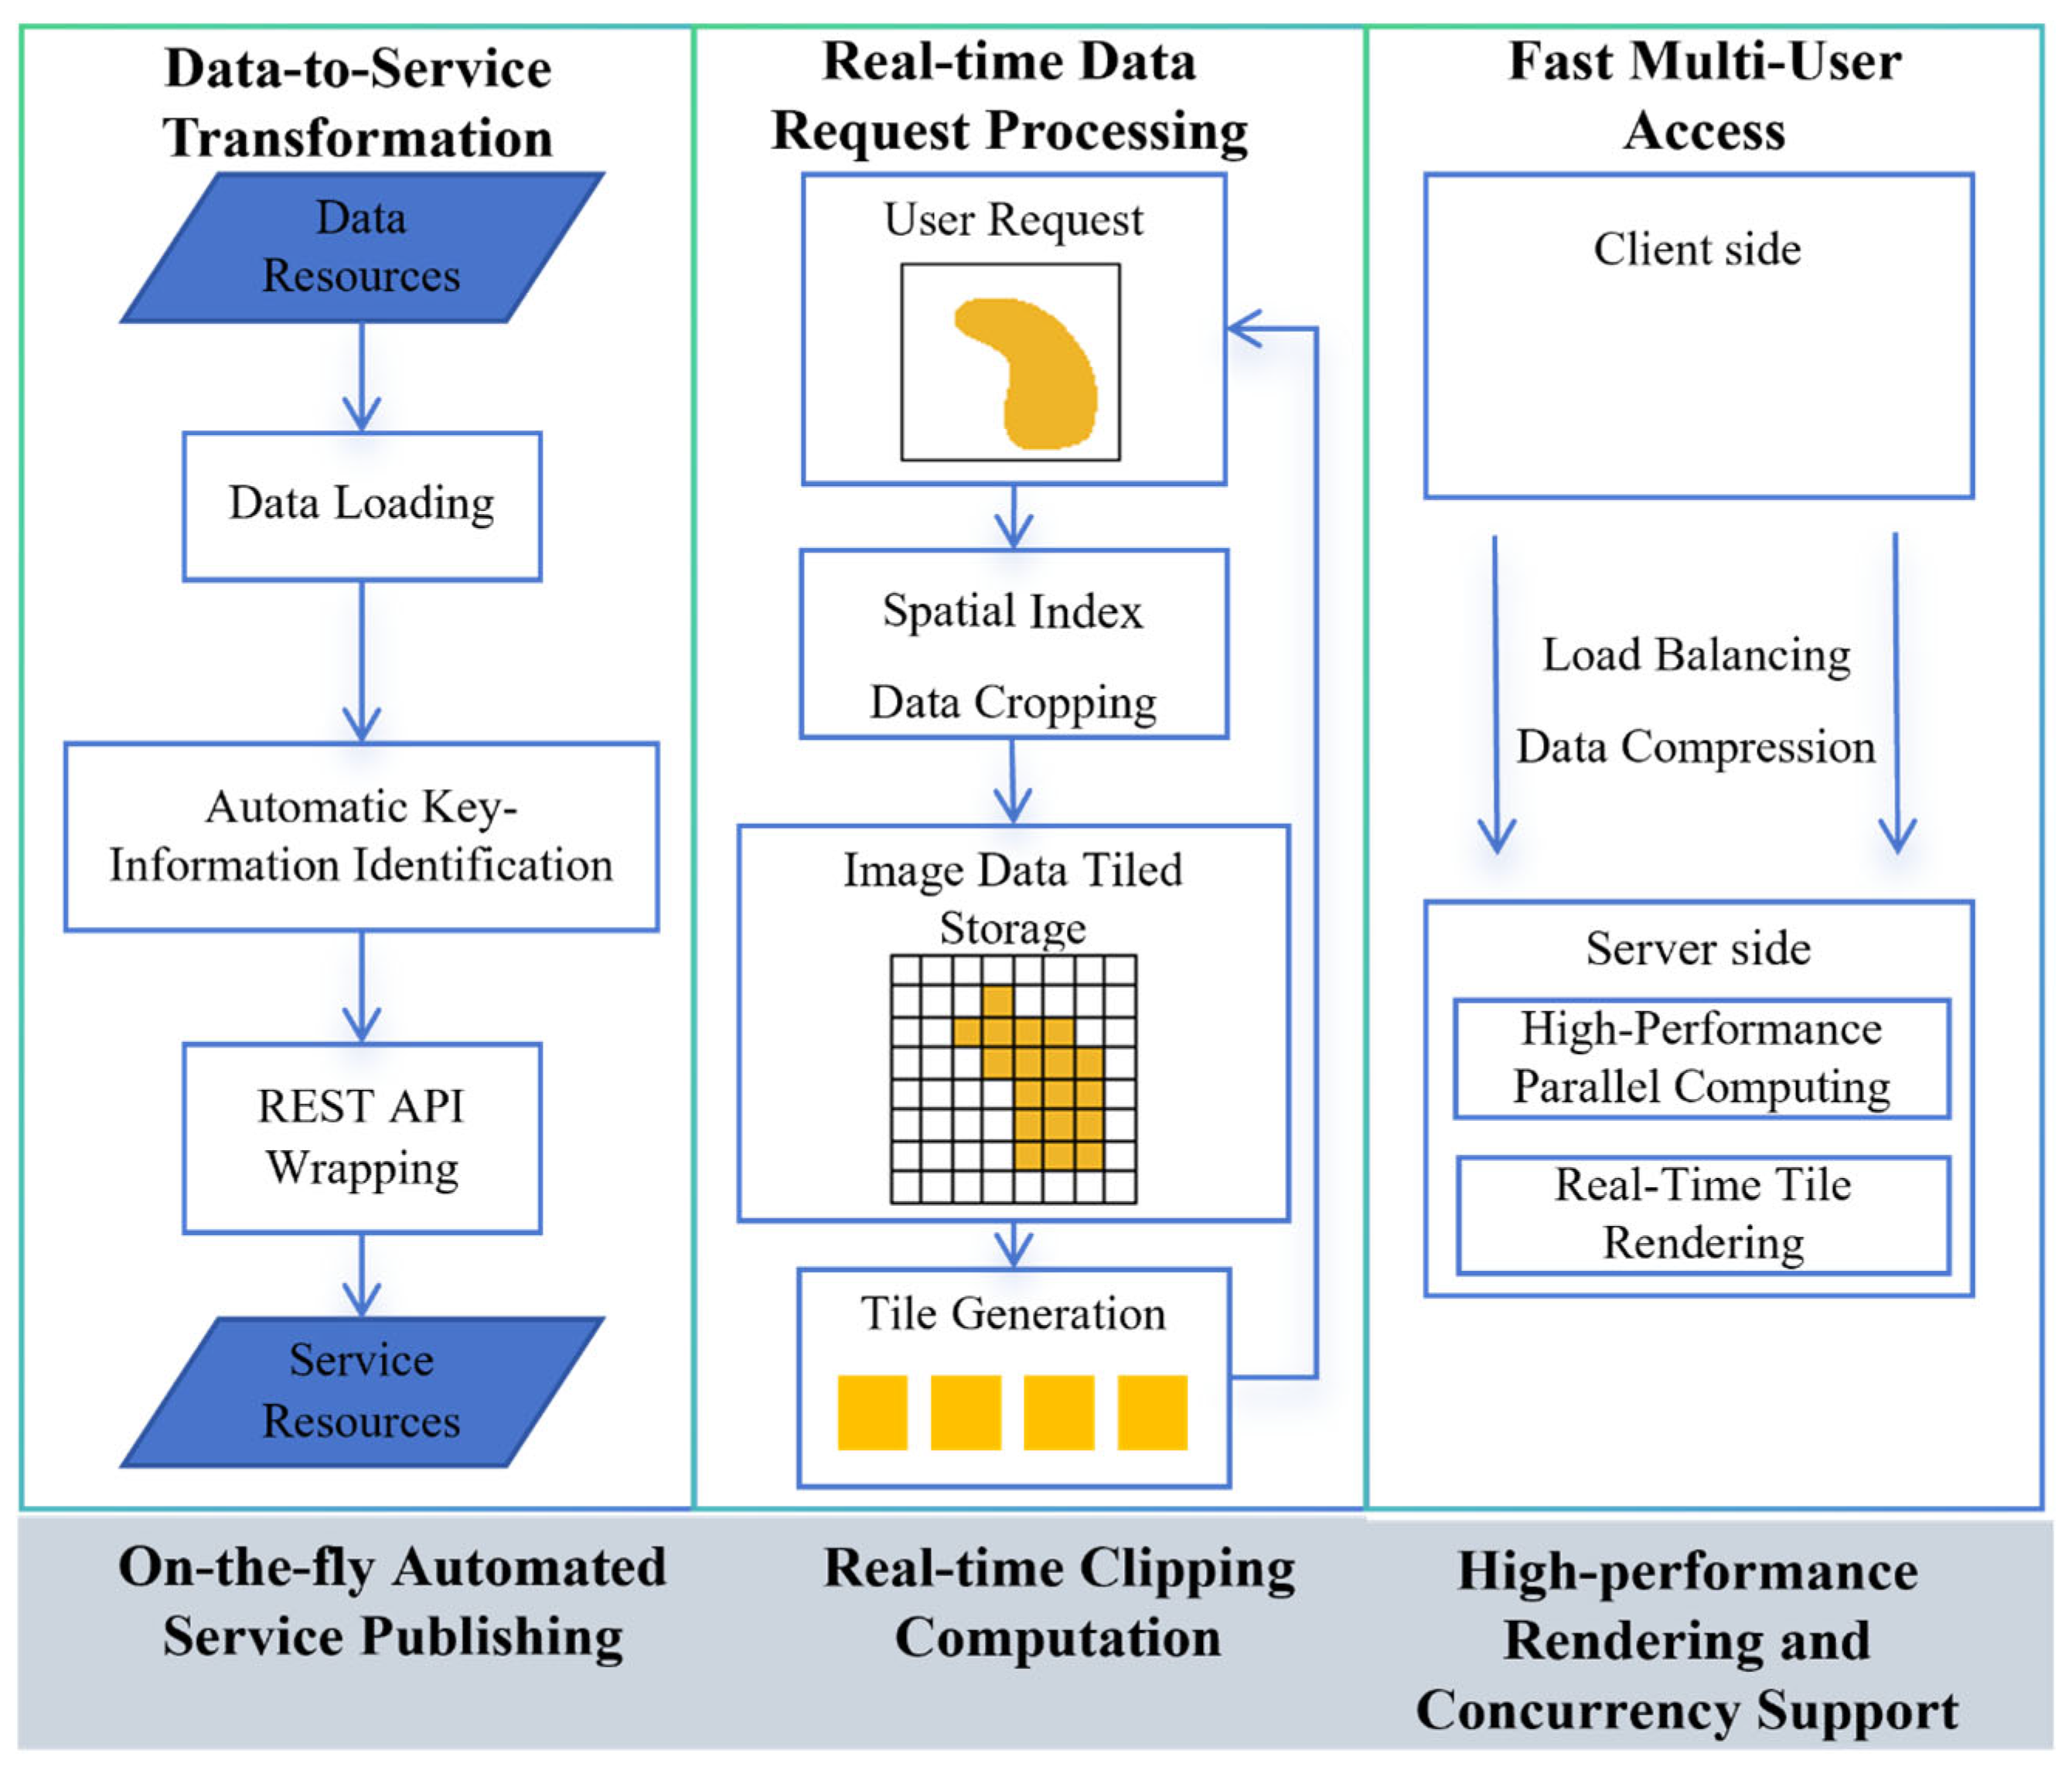
Our dynamic raster tile system reconstructs the serving pipeline by integrating on-demand tile generation, real-time spatial cropping, and parallelized rendering. As shown in
Figure 4, the system works through three coordinated components. First, an automated service publisher creates standard WMS/WMTS interfaces directly during data ingestion, using predefined rules to make new imagery instantly discoverable. Second, a real-time cropping engine stores source raster data in efficiently partitioned blocks. When a user requests a map view, it dynamically retrieves and crops only the imagery within the requested extent and zoom level. Third, a high-performance rendering layer uses server-side parallel computing, load balancing, and on-the-fly compression to serve many concurrent requests without lag.
In practice, this means that new imagery can be served as soon as it arrives. As users pan or zoom, tiles are computed in real time for their viewport and streamed directly. This removes the need for large stores of pre-computed tiles, cuts storage requirements, and—most importantly—eliminates the re-tiling step from the update cycle. Land inspectors thus gain immediate visual access to the most current landscape, enabling decisions based on timely and accurate information.
2.3.2. Fast Vector Data Visualization Based on Sparse Vector Pyramids
Visualizing the vast number of parcels in national surveys requires an approach that balances detail with performance [
37]. Following the same design philosophy as our raster system, we implemented sparse vector pyramid technology to enable instant display of hundreds of millions of parcels (
Figure 5). Conventional vector tiling pre-generates uniform tiles for an entire region. This creates substantial data redundancy in areas with sparse parcel distribution, forcing clients to load unnecessary data and degrading overall performance [
38].
Our sparse vector pyramid overcomes this by intelligently organizing data based on spatial density. During pyramid construction, a spatial indexing scheme first analyzes the distribution pattern of parcels. It then applies an adaptive tiling strategy: in high-density urban areas, it creates smaller, detailed tiles to preserve resolution, whereas in sparsely parceled rural or mountainous regions, it aggregates data into larger tiles to minimize the total tile count. This density-differentiated approach typically reduces the required tile generation and subsequent client-side processing load by approximately 50% compared to conventional uniform tiling.
The construction of the sparse pyramid is highly optimized, leveraging fully parallel processing [
39] to build a hierarchical index for 100 million parcels in approximately ten minutes. For rendering, a client-side visual occlusion culling algorithm enhanced with Z-Order sorting [
40] efficiently identifies and removes parcels outside the viewport or occluded by others. This ensures that only visibly relevant data is processed for drawing. When users zoom or pan, the system dynamically fetches only the necessary, non-redundant tiles from the sparse pyramid, enabling sub-second rendering and a smooth interactive experience even with continent-scale datasets.
5. Conclusions
In summary, this study proposes and rigorously validates a co-designed high-performance computing and visualization framework that effectively addresses the persistent issue of workflow fragmentation in operational land-change monitoring. By architecturally integrating distributed computation with dynamic, on-demand visualization, we establish a new paradigm in which analytical outcomes become directly and immediately visible. This transforms land monitoring from a traditionally slow, batch-processed task into an interactive, near-real-time operation. We achieved speedups of 5× to 24× across the entire pipeline. This was done without compromising usability. This outcome clearly underscores the effectiveness of our synergistic co-design approach. Beyond land change verification, this work offers a practical and scalable blueprint applicable to other domains that demand rapid analysis and dissemination of large-scale, dynamic geospatial data, such as smart-city digital twins and emergency response systems.




 ,
,