3.1. Results of Process Simulation
Table 3 summarizes the electricity, cooling water, and products for both study cases. As previously presented, the Santander biomass has an unusually high elemental hydrogen content (9.42%) compared to Bolivar (6.58%). Theoretically, a higher H/C ratio in the feedstock should facilitate higher hydrogen yields and lower reforming energy requirements. Still, the results show that, although the Bolivar plant processes 5.8 times more biomass, it produces 7.1 times more Hydrogen. This non-linearity indicates that the efficiency gap is not merely a simulation artifact but a thermodynamic consequence of the feedstock properties and process scale. Specifically, the Santander biomass contains nearly four times as much ash (5.69%) as the Bolívar sample. Mechanistically, this inert fraction acts as a thermal sink inside the reactor, absorbing sensible heat and lowering the effective reaction temperature. Since steam methane reforming is strongly endothermic (ΔH°298 K = +206 kJ/mol), even small decreases in temperature shift the chemical equilibrium toward the reactants, thereby preventing the complete liberation of the feedstock’s hydrogen. To improve performance in the Santander scenario, two operational adjustments are recommended: (1) implementing a rigorous Heat Exchanger Network (HEN) to recover the 3.47 kW/kg of thermal energy currently dissipated in the cooling train, recycling it to preheat the feed; and (2) adopting an auto-thermal gasification strategy. By introducing a controlled oxidant stream (air or oxygen), the process could generate in situ heat via partial oxidation, thereby compensating for the thermal inertia of the ash and sustaining the high temperatures required for optimal reforming kinetics.
By normalizing energy consumption against the input mass flow, we can assess the efficiency of the equipment handling the solid biomass. The cooling duty of 3.47 kW/kg of biomass is extraordinarily high. This suggests that the Santander gasifier or reformer is operating at excessively high temperatures without heat recovery, or that the syngas cooling train is oversized and inefficient. In contrast, Bolivar’s 0.39 kW/kg indicates a tightly integrated Heat Exchanger Network (HEN) in which hot syngas preheats the feed or steam.
The Aspen Plus® simulation indicates that the higher ash content of Santander biomass (5.69 wt% vs. 1.39 wt% in Bolívar) requires greater sensible heat to raise the solids to the gasification temperature. This results in an 8–12% increase in the reactor’s thermal load. However, this alone cannot explain why the electricity consumption per kilogram of biomass processed is about 3.2 times higher in Santander (3.82 kWh/kg versus 1.22 kWh/kg in Bolívar).
First, the high cooling duty calculated in the simulation (13,612 kW) points to a lack of effective heat integration. In a well-optimized gasification–steam methane reforming (SMR) system, typically 45–55% of the sensible heat in the hot syngas (800–900 °C) is recovered internally, for example, to preheat the biomass, generate process steam, or raise the reformer inlet temperature. In contrast, the Santander model discharges almost all this heat to coolers, resulting in a specific cooling demand of 3.47 kW per kilogram of biomass. This is nearly nine times the value seen in the Bolívar simulation (0.39 kW/kg). This suggests that the Santander process relies heavily on electrical heaters rather than on internally recovered heat to achieve the necessary operating temperatures for the gasifier and reformer. Since electric heating is generally 2–4 times less efficient than heat recovery or combustion-based heating, this aligns with the elevated power demand predicted by Aspen. Second, the syngas composition predicted by the Aspen model after gasification shows lower-than-expected yields of CO and H2. This implies suboptimal operating conditions, such as an improper steam-to-biomass ratio or inadequate temperature control in the gasifier. The resulting incomplete carbon conversion forces the system to handle larger volumes of syngas, thereby increasing both compression and cooling duties and raising overall energy use.
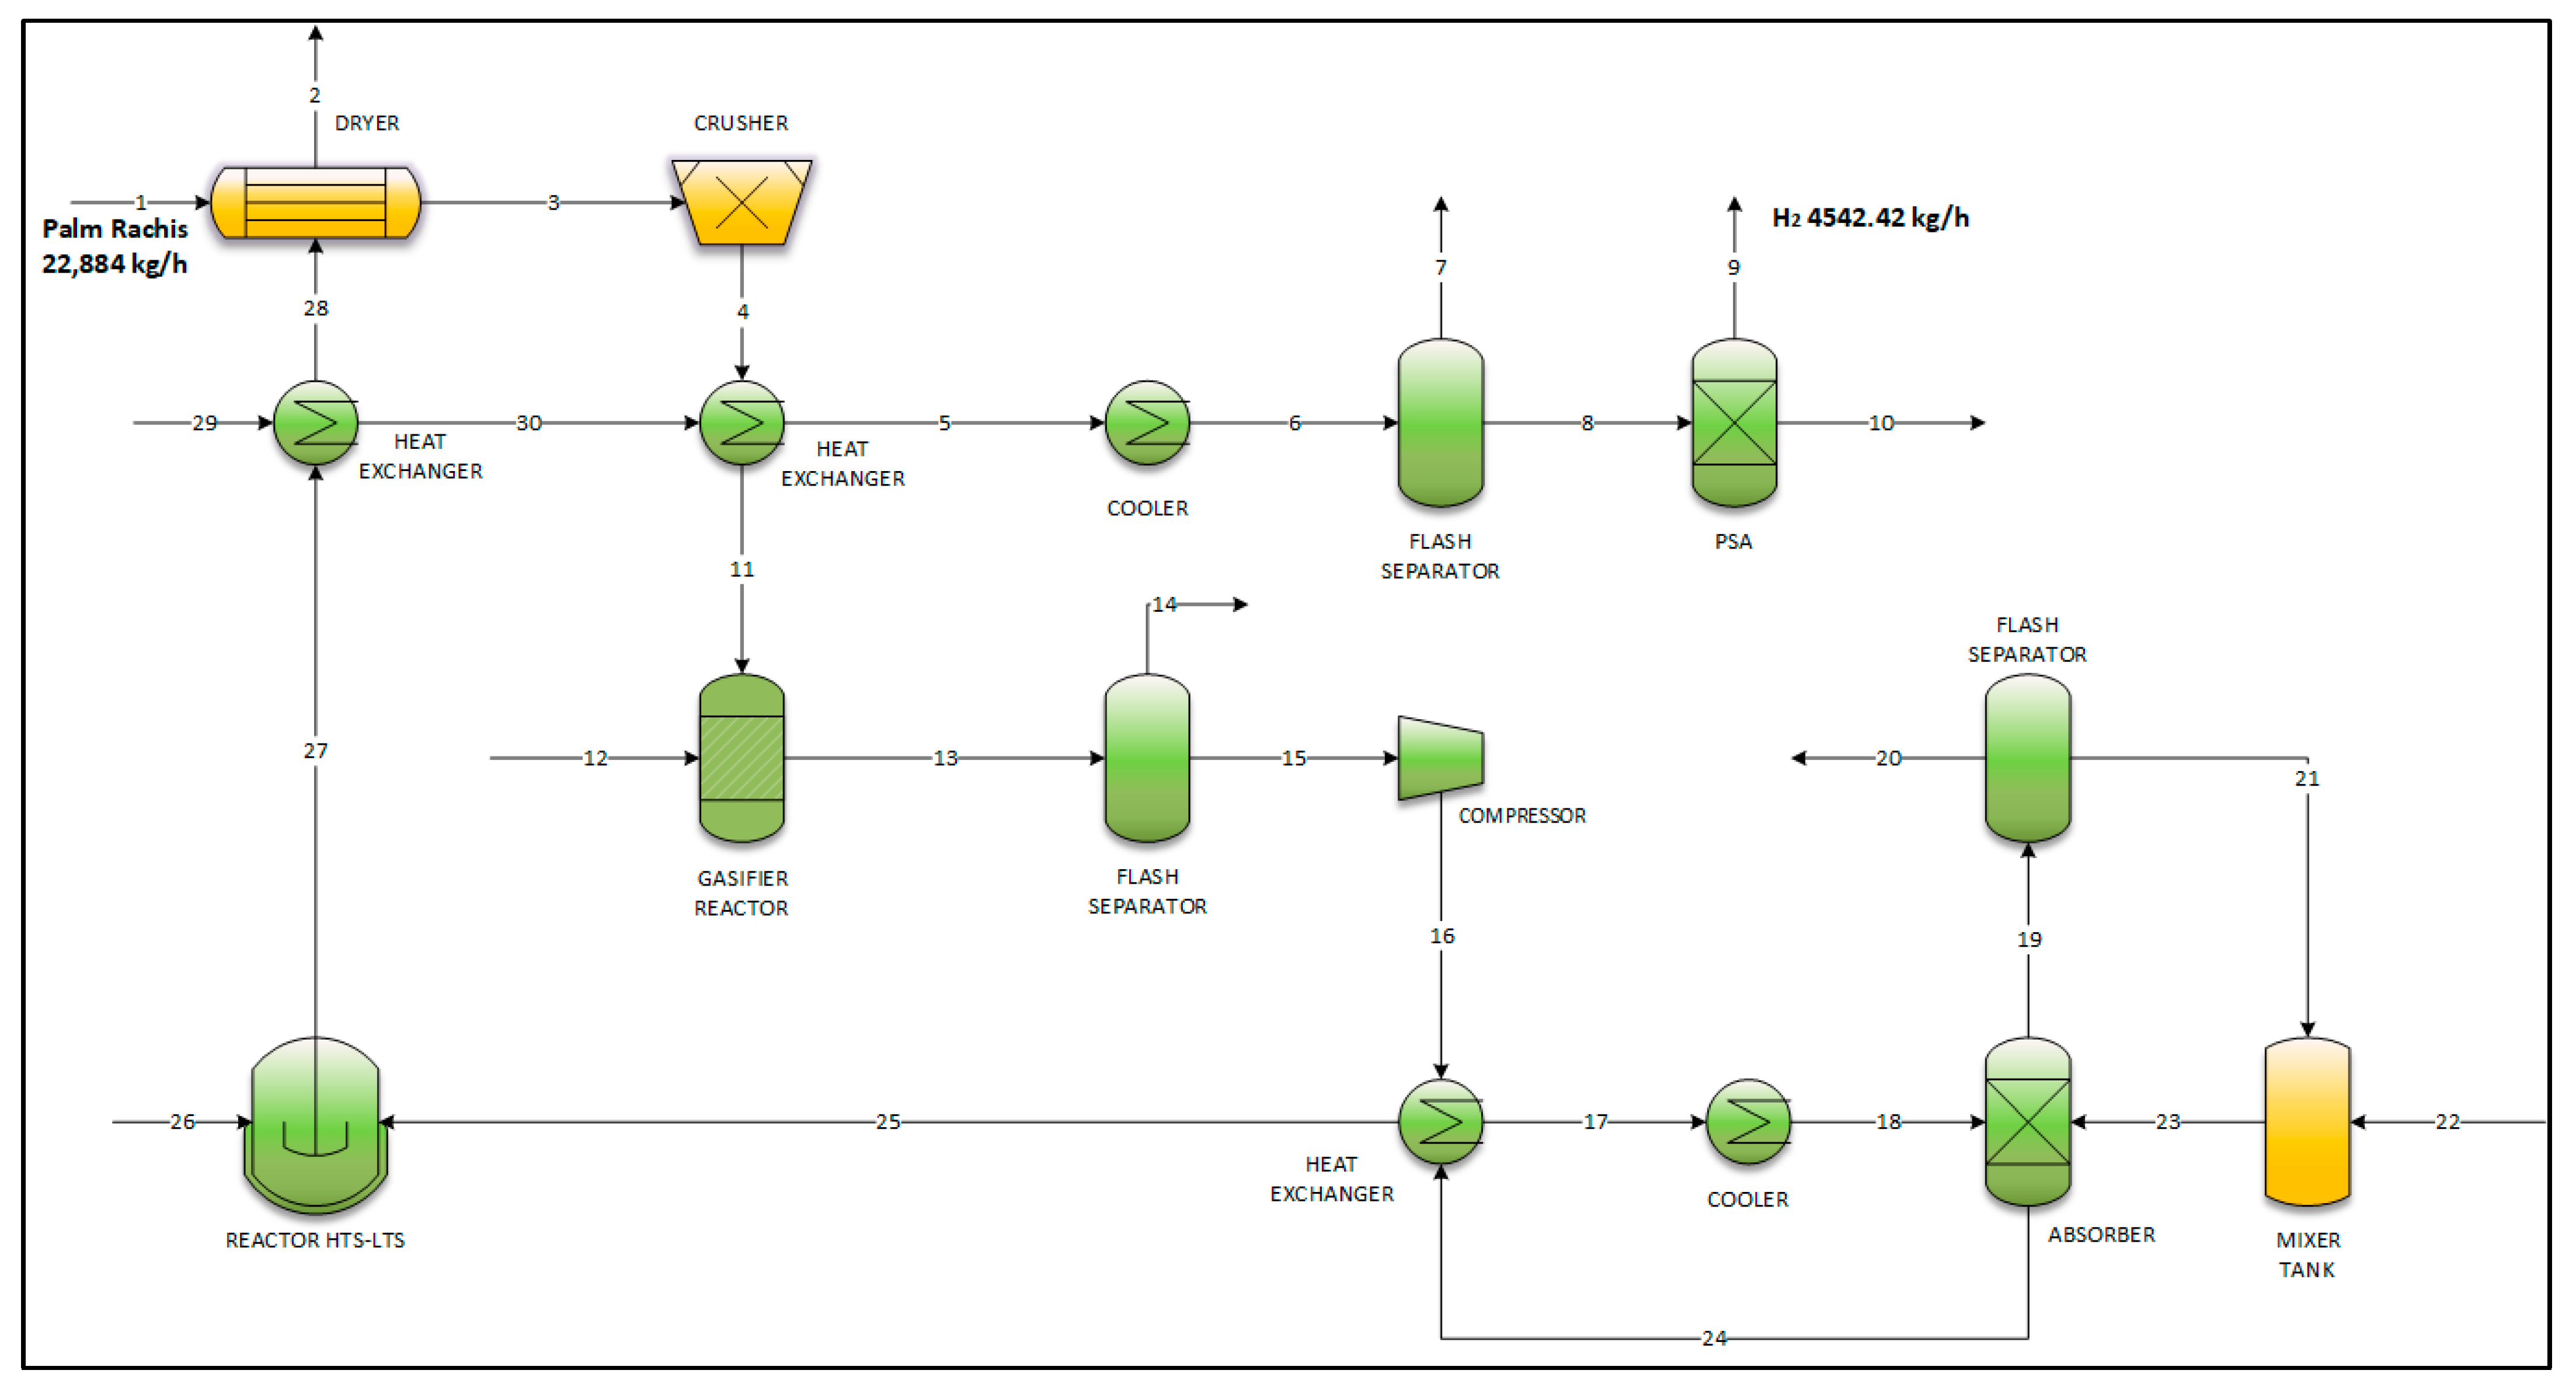
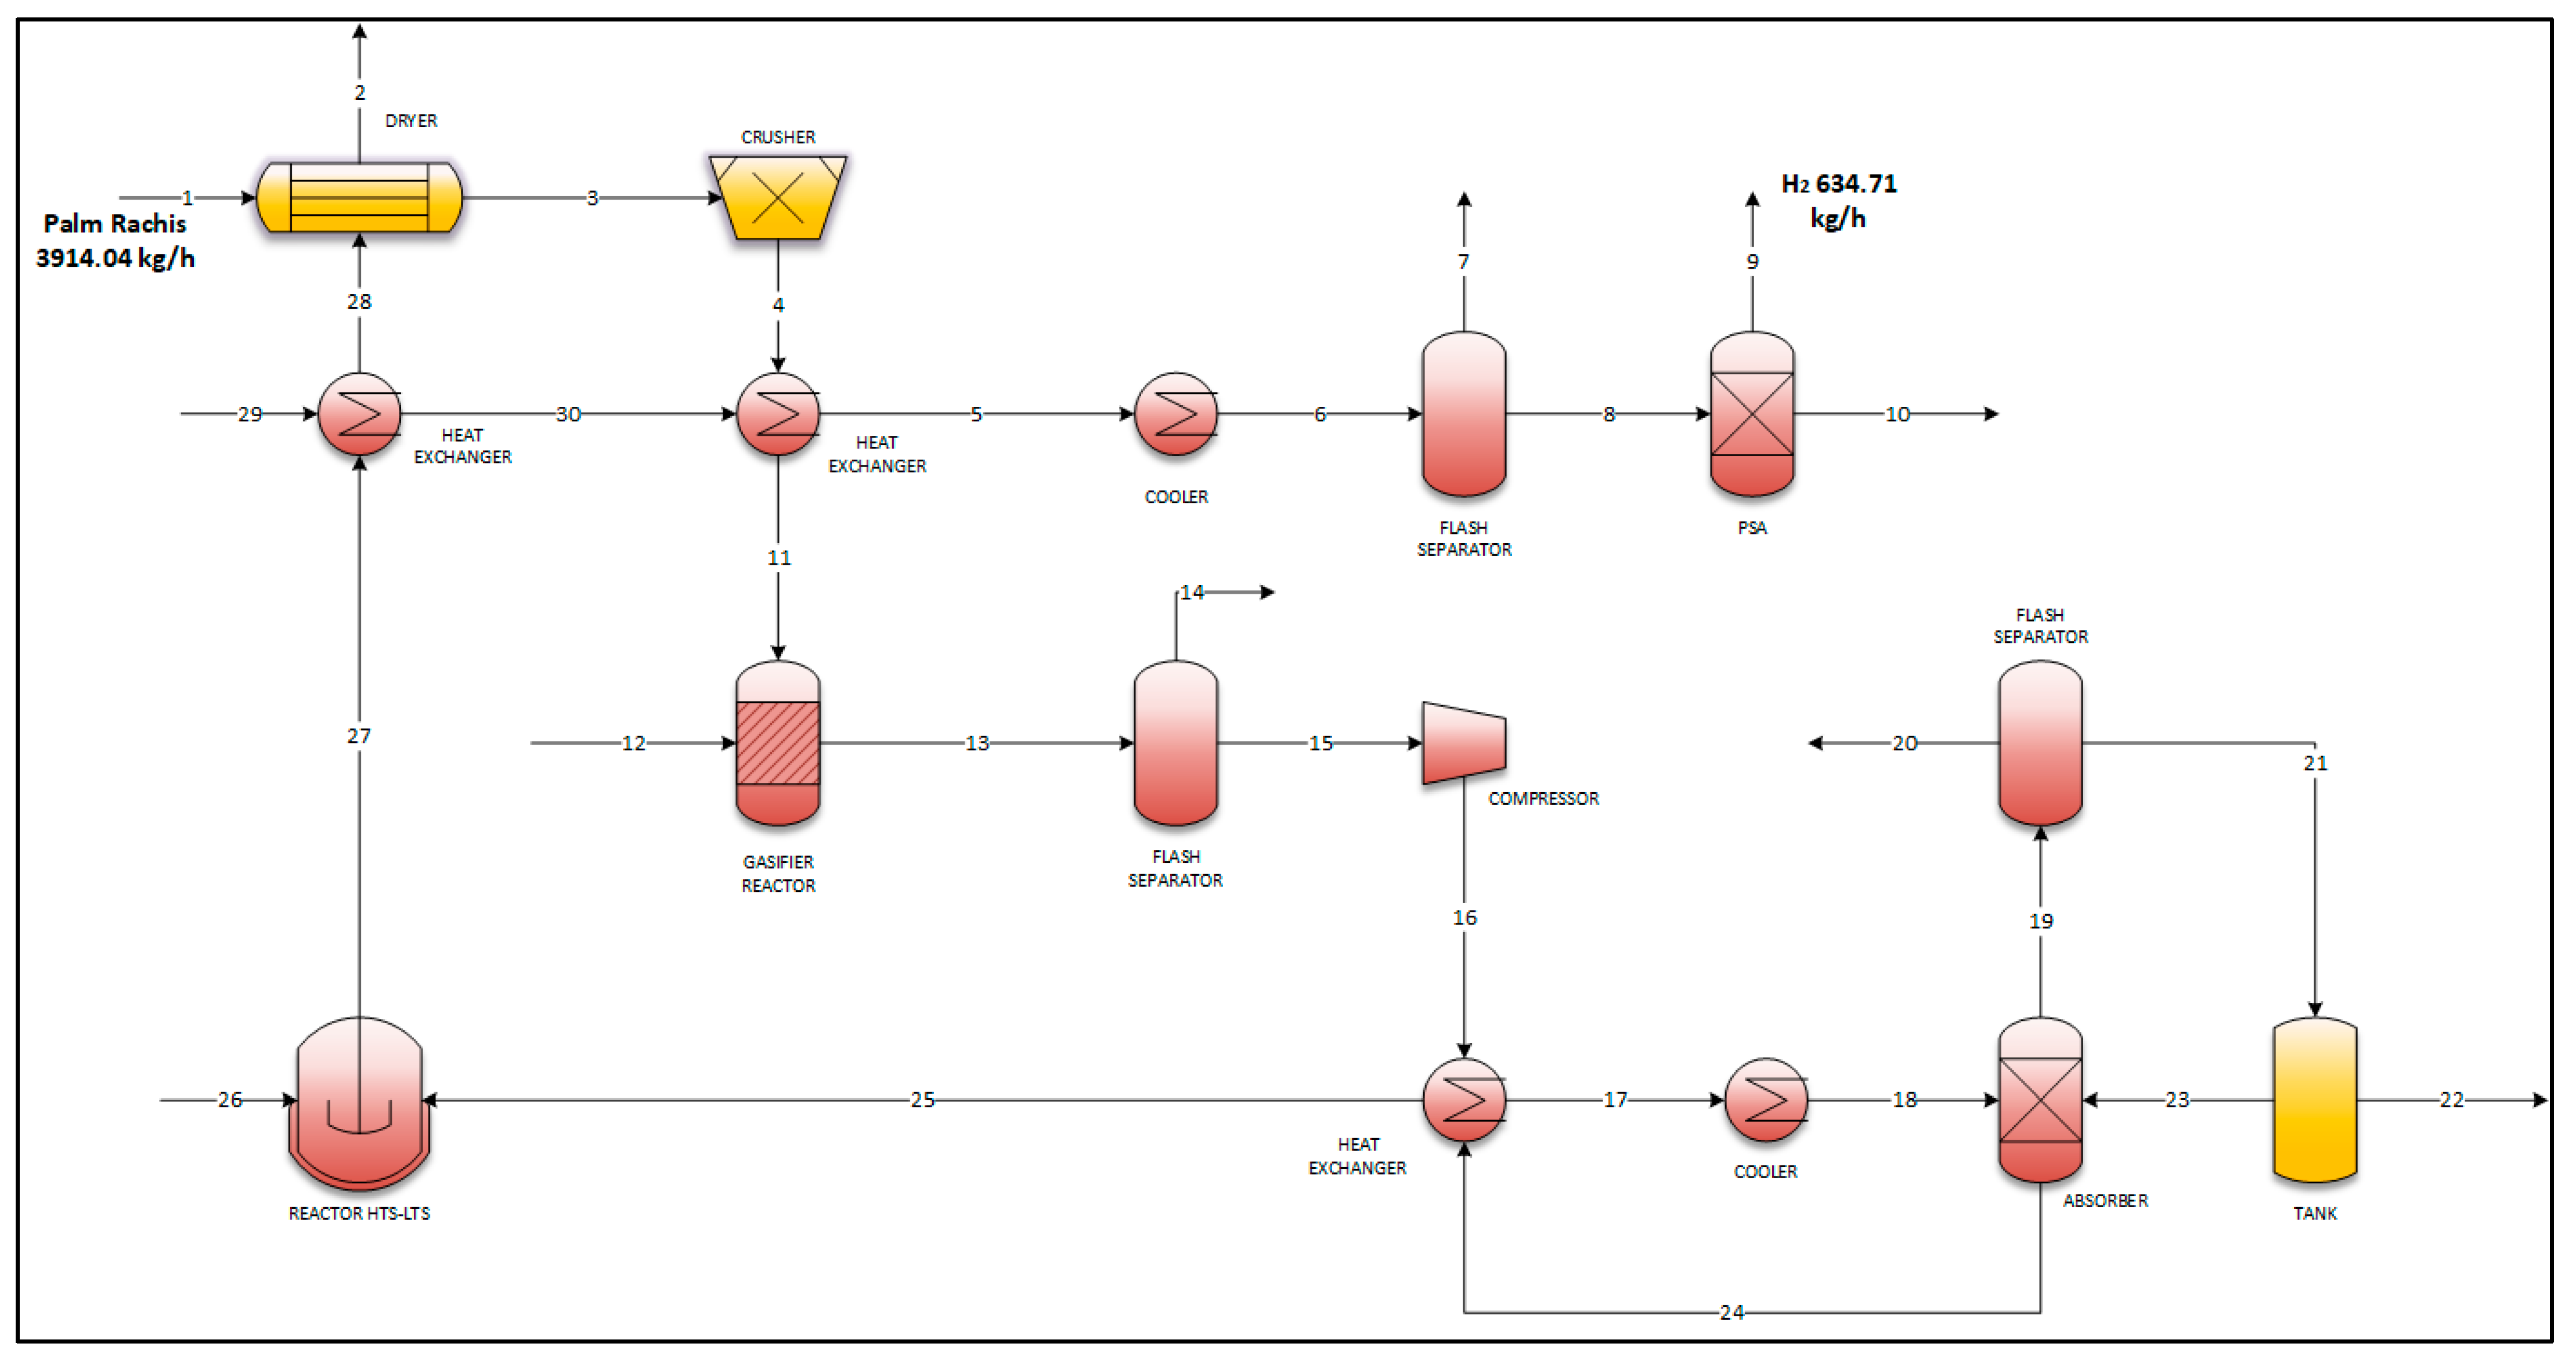
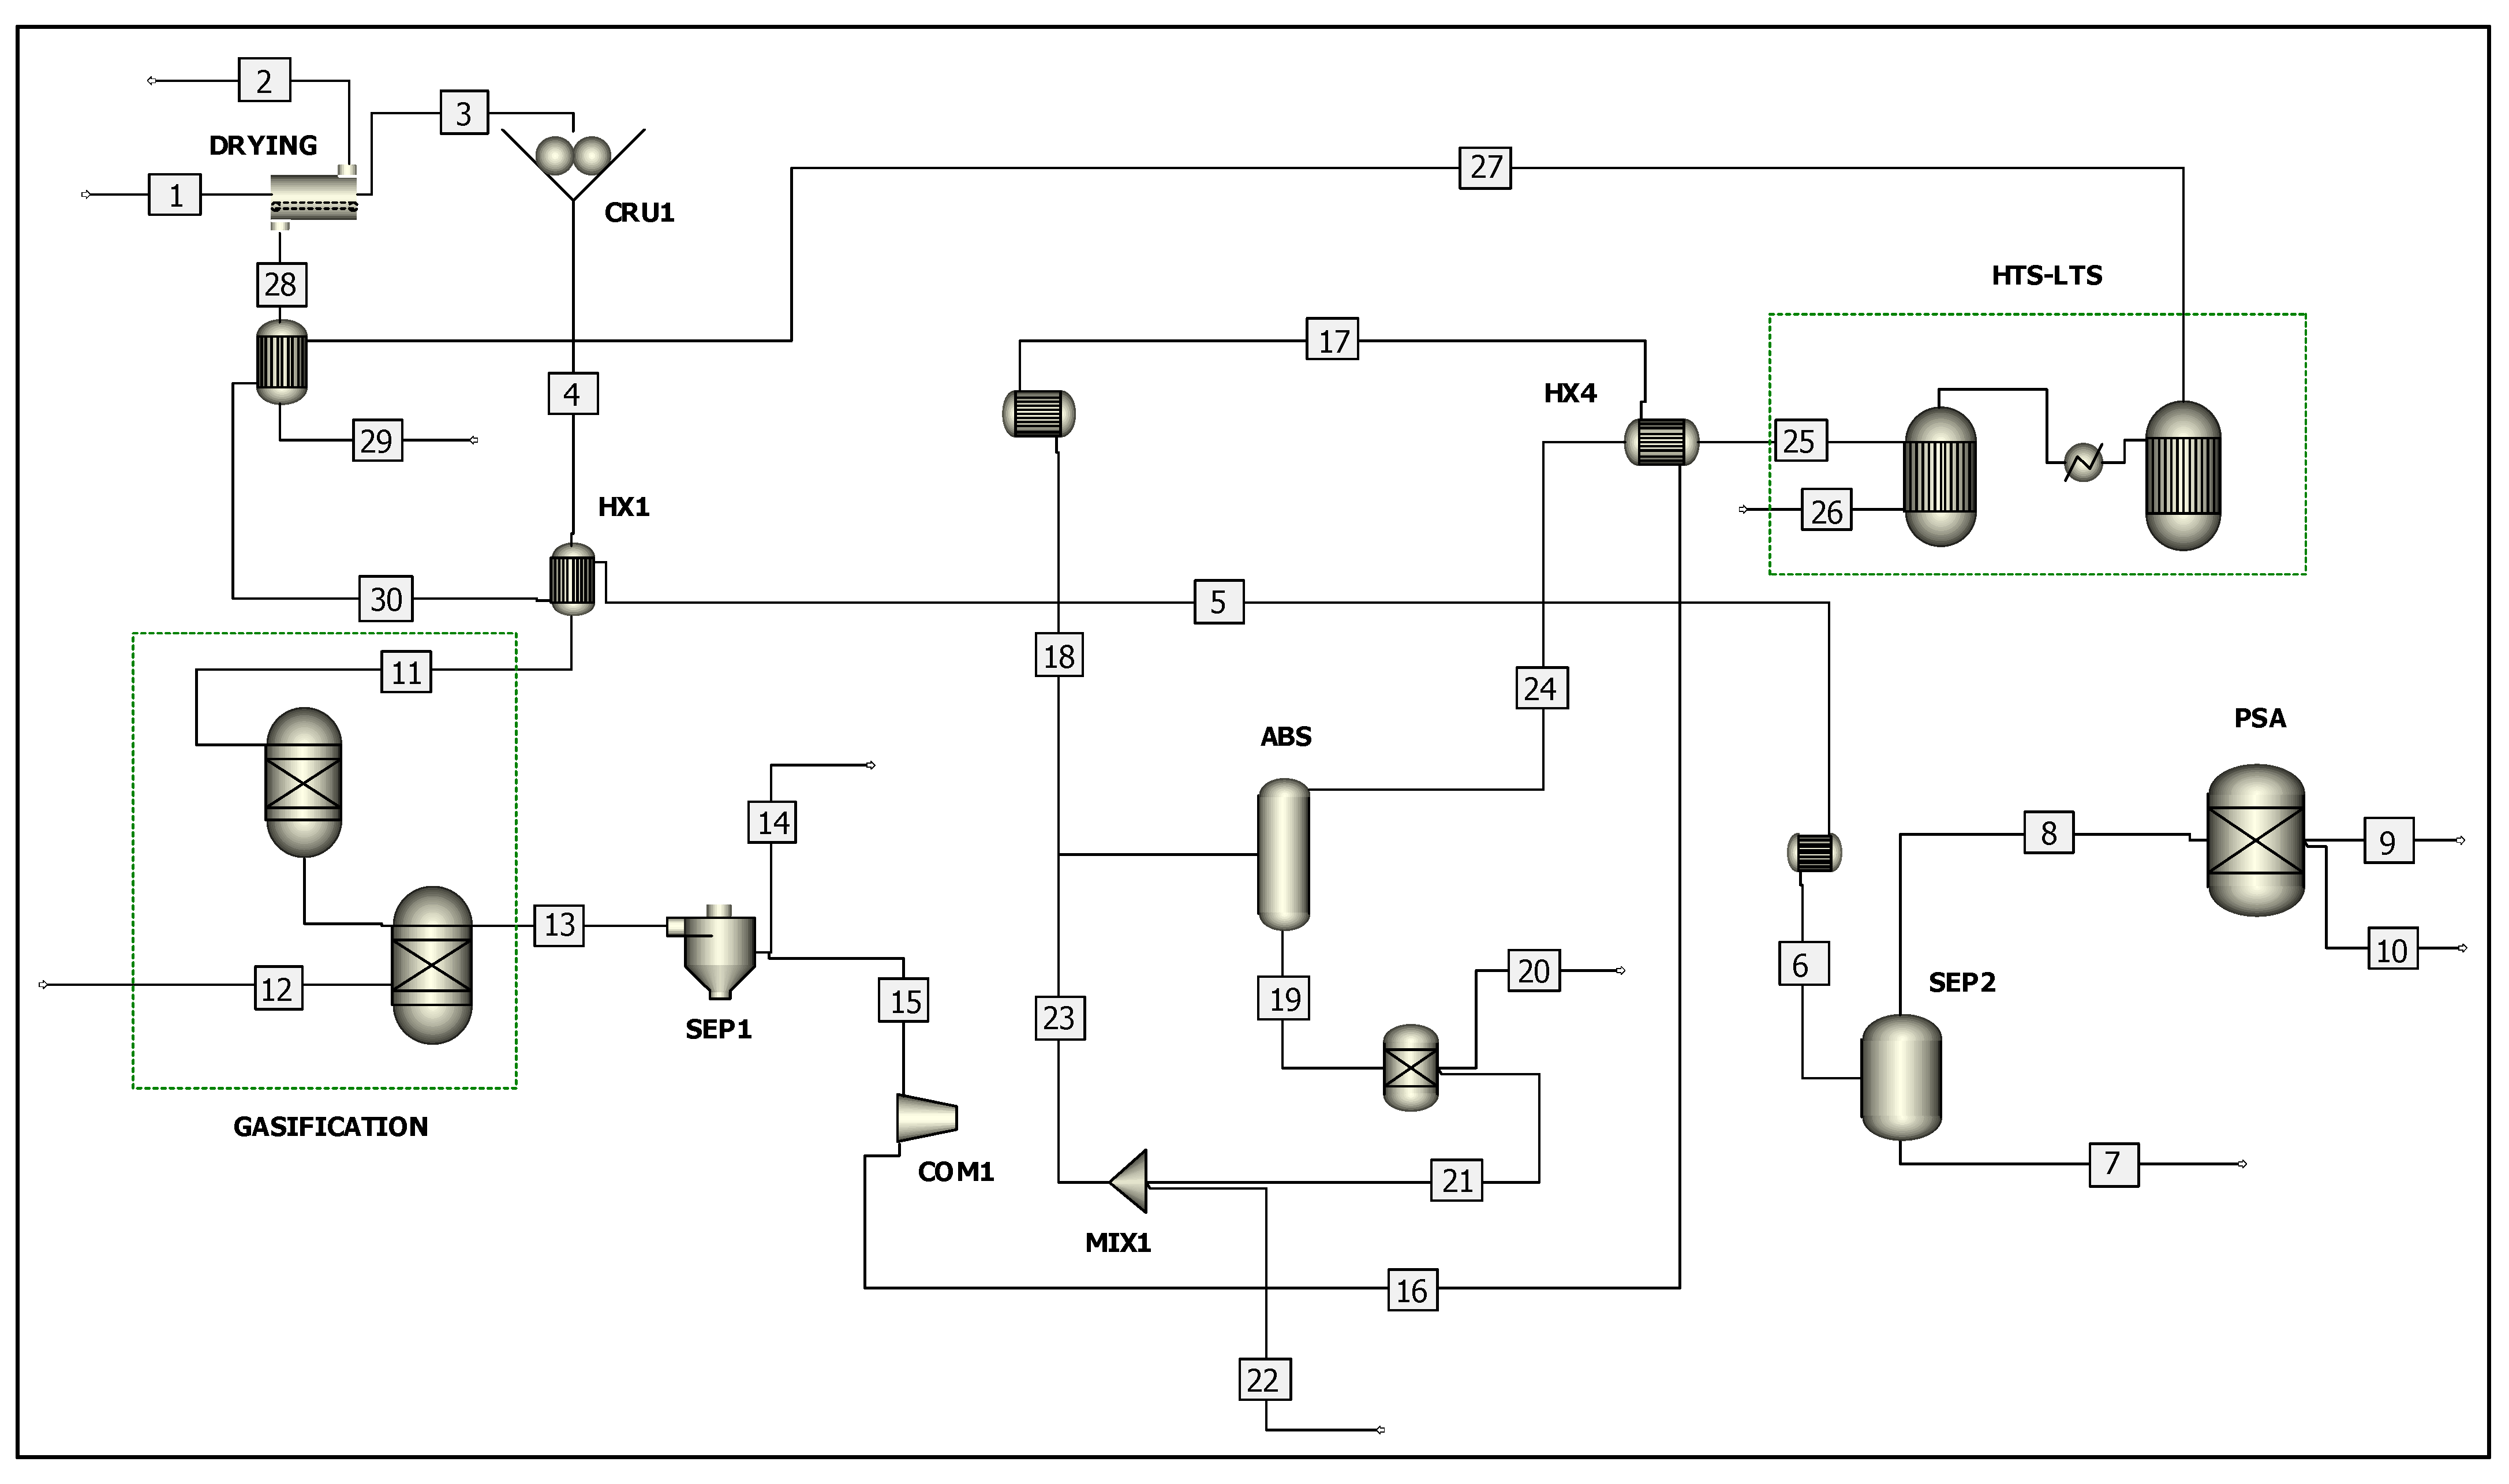
Figure 4 shows the simulation workflow for the two processes analyzed. Because raw materials differ by the extraction technologies implemented at the plants, the quantity of rachis available for hydrogen production varies across plants. The rachis production rate at the Bolivar plant is 22,884 kg/h, whereas at Santander it is 3919.04 kg/h.
Methane production: Since it was not possible to establish a reliable reaction equation to describe the decomposition of biomass in the first gasifier, whose primary objective is to generate methane (CH
4) as a precursor for subsequent synthesis, a non-stoichiometric RYield reactor was selected. The decomposition yields were taken from Macdonald et al. [
38], enabling the disaggregation of biomass into its fundamental constituents. At this initial stage, the primary products formed were solid carbon (C), hydrogen gas (H
2), ash (ASH), and elemental sulfur (S). No significant formation of methane (CH
4), carbon monoxide (CO), carbon dioxide (CO
2), or water (H
2O) was observed, consistent with the characteristic behavior of an elemental decomposition reactor and confirming that methane must be produced in a subsequent gasification step.
The solid and gaseous products from the decomposition stage were subsequently routed to a second gasifier. This unit was modeled following the approach proposed by Stefano Lange et al. [
3] and operated with superheated steam at a flow rate of 4600 kg/h and a temperature of 900 °C. Under these high-temperature steam gasification conditions, the reactor generated product streams enriched in key combustible species, particularly carbon monoxide (CO), methane (CH
4), and carbon dioxide (CO
2), along with water vapor (H
2O), sulfur dioxide (SO
2), and ash (ASH). In contrast, the flows of hydrogen (H
2), oxygen (O
2), and nitrogen (N
2) remained negligible.
These results demonstrate that the second-stage gasifier effectively converts solid carbon into synthesis gases, including methane, thus fulfilling its intended role within the hydrogen production pathway [
39]. The reactor operated at approximately 900 °C, 60 bars, and a steam-to-biomass molar ratio of 1.2:1, parameters widely recognized for promoting methane formation and improving syngas quality [
40,
41]. Under these operating conditions, the simulation predicted a methane yield of approximately 0.33 mol CH
4 per mole of Rachis fed, resulting in a high-calorific syngas composition [
42,
43]. This conversion performance corresponds to a Cold Gas Efficiency (CGE) of 60% for the Santander scenario and 78% for the Bolívar scenario. While the Santander result aligns perfectly with the validated range of 50–60% reported in the literature for similar steam-blown fluidized-bed gasifiers processing lignocellulosic biomass [
42,
44], the Bolívar scenario exhibits superior energy recovery. This higher efficiency is attributable to the significantly lower ash content of the Bolívar feedstock (1.39% vs. 5.69%), which minimizes thermal inertia in the reactor. Consequently, these quantitative indicators confirm that the proposed design maximizes energy transfer to the gas phase while minimizing carbon losses to char.
Washing and product separation process: After leaving the gasifier, the gaseous stream is directed to a separation unit modeled using the RadFrac block in Aspen Plus. At this stage, a freshwater stream at 30 °C is introduced at a molar ratio of 0.5:1 relative to the incoming gas flow. The purpose of this operation is to promote the absorption of condensable species and acid gases present in the syngas, while allowing non-condensable gases, such as methane, carbon monoxide, and carbon dioxide, to proceed to subsequent stages of the process. The column was configured with 10 theoretical stages, providing adequate mass transfer and ensuring stable composition profiles throughout the equipment. Under these operating conditions, the absorption step removes approximately 30% of the CO2 and 26% of the SO2 from the incoming stream. A controlled purge stream is withdrawn from the bottom of the absorber to remove accumulated contaminants and the solvent.
The RadFrac block represents the most rigorous Aspen Plus model for equilibrium-based column operations, as it simultaneously solves the material balance, energy balance, phase equilibrium, and Equations of State, collectively known as the MESH equations [
45]. This approach enables an accurate representation of vapor–liquid mass-transfer phenomena and allows prediction of the distribution of each component across all stages of the column. In this configuration, the column operates in absorption mode, meaning neither a condenser nor a reboiler is specified, since the objective is physical removal of contaminants rather than fractional distillation. To accurately represent the system’s thermodynamic behavior, an activity coefficient-based model, such as NRTL, was selected for its ability to describe highly nonideal systems comprising water, sulfur dioxide, carbon dioxide, and residual organic compounds [
46]. The use of such a model is essential for capturing the critical intermolecular interactions present in aqueous mixtures containing acid gases [
47]. During the simulation, Aspen Plus computes phase equilibrium at each theoretical stage, enabling precise predictions of temperature, composition, and internal flow profiles. As a result, the overhead stream of the RadFrac column is enriched in methane and carbon monoxide, making it suitable for subsequent conversion or purification steps within the hydrogen production pathway. In contrast, the bottom stream concentrates the absorbed species primarily water, sulfur dioxide, soluble carbon, and other compounds with a higher affinity for the liquid phase.
Methane reforming to hydrogen: The final stage of the process is carried out using two equilibrium reactors modeled in Aspen Plus through the REquil block. This reactor type employs a rigorous equilibrium-based formulation in which the outlet stream composition is determined by minimizing the system’s Gibbs free energy at the specified temperature and pressure [
48]. Rather than requiring predefined stoichiometric equations, the REquil model identifies all feasible reactions among the defined chemical species and calculates the equilibrium composition that satisfies the laws of mass action and thermodynamic consistency [
48]. This makes the model particularly suitable for high-temperature reforming systems in which multiple reactions co-occur, such as steam methane reforming, Water–Gas Shift, and methane cracking [
49]. In Aspen Plus, the REquil reactor solves the equilibrium state by performing a global energy and mass balance and applying equilibrium constants derived from the selected thermodynamic property method. For methane reforming, the model accounts for key reactions including CH
4 + H
2O ⇌ CO + 3H
2 and CO + H
2O ⇌ CO
2 + H
2, ensuring that the thermodynamic limits at the chosen operating conditions govern all conversions [
50]. In this process configuration, a gas-to-steam molar ratio of 1:5 was used, with the reforming reactors operating at approximately 1000 °C, conditions that strongly favor endothermic methane reforming. Under these high-temperature, steam-rich conditions, the system achieves a methane conversion of 91.3%, a value observed consistently across both scenarios evaluated. This high conversion efficiency is characteristic of equilibrium-limited reforming processes. It indicates that the operational parameters—temperature, steam ratio, and reactor configuration—are appropriate for maximizing hydrogen production while minimizing residual methane.
Supplementary Equipment: A fundamental part of the process, thermal conditioning is performed using heat exchangers modeled with the HeatX block in Aspen Plus. This model rigorously solves the energy balances between two streams without mass transfer, computing thermal profiles and heat duties using global heat-transfer coefficients and thermodynamic properties calculated at each operating point [
51]. For equipment sizing and energy integration, the overall heat-transfer coefficients (U) were estimated based on the fluid phases and stream properties. A coefficient of 500 W/(m
2 K) was applied to water-cooled coolers and steam heaters, whereas 50 W/(m
2 K) was used for gas-gas heat exchangers. For the compression stages, the units were modeled with an isentropic efficiency of 0.75 and a mechanical efficiency of 0.95, typical of centrifugal compressors in industrial gas-processing applications [
40]. This configuration allows the system to recover thermal gradients generated during critical stages, such as gasifier outlet cooling, the high-temperature shift reactor (HTS), and subsequent purification steps [
52]. The recovered heat is transferred to the water and steam streams feeding the methane reforming reactors, significantly reducing external energy demand and improving the overall energetic efficiency of the process. Heat exchangers such as HX1 and HX4, and the coolers associated with streams 18 and 23, play a central role in this thermal circuit, conditioning the process streams to prevent overheating of sensitive equipment and to ensure suitable conditions for absorption and downstream separation operations.
In addition to the heat exchangers, the process incorporates compressors, with COM1 being the most relevant. These units were modeled as polytropic compressors, using the polytropic work equation coupled with energy balance equations that account for predefined mechanical and adiabatic efficiencies. The compressors increase the gas pressure before it enters units that are highly sensitive to operating pressure, such as the HTS reactor, the absorption columns, and the PSA unit. Maintaining the process stream within the optimal pressure range is critical to favor the kinetics of the Water–Gas Shift (WGS) reaction and ensure effective separation in the Pressure Swing Adsorption (PSA) unit. To achieve this, the compression stages were modeled in Aspen Plus using a rigorous isentropic compression method. The simulation assumed an isentropic efficiency of 75% and a mechanical efficiency of 95%, values that adhere to standard heuristics for industrial centrifugal compressors. Subsequently, the PSA unit was modeled to enable hydrogen purification, considering a multilayer adsorbent bed composed of activated carbon and zeolites, designed to selectively adsorb impurities from the synthesis gas while allowing hydrogen to pass through. The PSA design criteria focused on achieving a hydrogen purity of 99.9%, with an overall hydrogen recovery between 80 and 90%, in accordance with industrial practice and the performance reported in the literature [
53].
The process also includes several separation vessels, such as SEP1, SEP2, and the auxiliary separators associated with streams 6, 7, 14, and 15. These units are modeled in Aspen Plus using Flash2 separators, in which vapor–liquid equilibrium is solved using the selected thermodynamic model, enabling accurate prediction of phase distribution and stream compositions. SEP1 plays a critical role by removing condensed water, fine carbonaceous particles, and heavy compounds formed after the gasifier cooling step. SEP2, in turn, handles the liquid stream enriched in CO2, SO2, and other soluble compounds generated during the absorption stage. The presence of multiple separation drums stabilizes intermediate flows and prevents droplet or mist carryover that could compromise compressor operation and PSA performance. To ensure correct integration of the process flows, mixers such as MX1 and mixing nodes represented by streams 5, 17, and 19 are included. These units are simulated using isobaric mixing blocks that solve algebraic mass and energy balances, without chemical kinetics or phase-equilibrium calculations. Their function is to homogenize recycled, conditioned, or purged flows before they enter reactors and separation units, ensuring that each section receives streams with stable temperatures, compositions, and flow rates.
Additionally, stable operation of the water and steam circuits is maintained through internal recirculations implemented using Design Specs and Adjust Blocks in Aspen Plus V14. These tools automatically adjust operating variables, such as water flow rate, recycle fraction, or heat duty, to meet specific process criteria (e.g., setting the reformer inlet temperature or controlling the steam-to-gas ratio). This configuration ensures that the system operates within the desired thermodynamic boundaries, compensating for fluctuations in composition or flow rate of the principal streams.
3.2. LCA
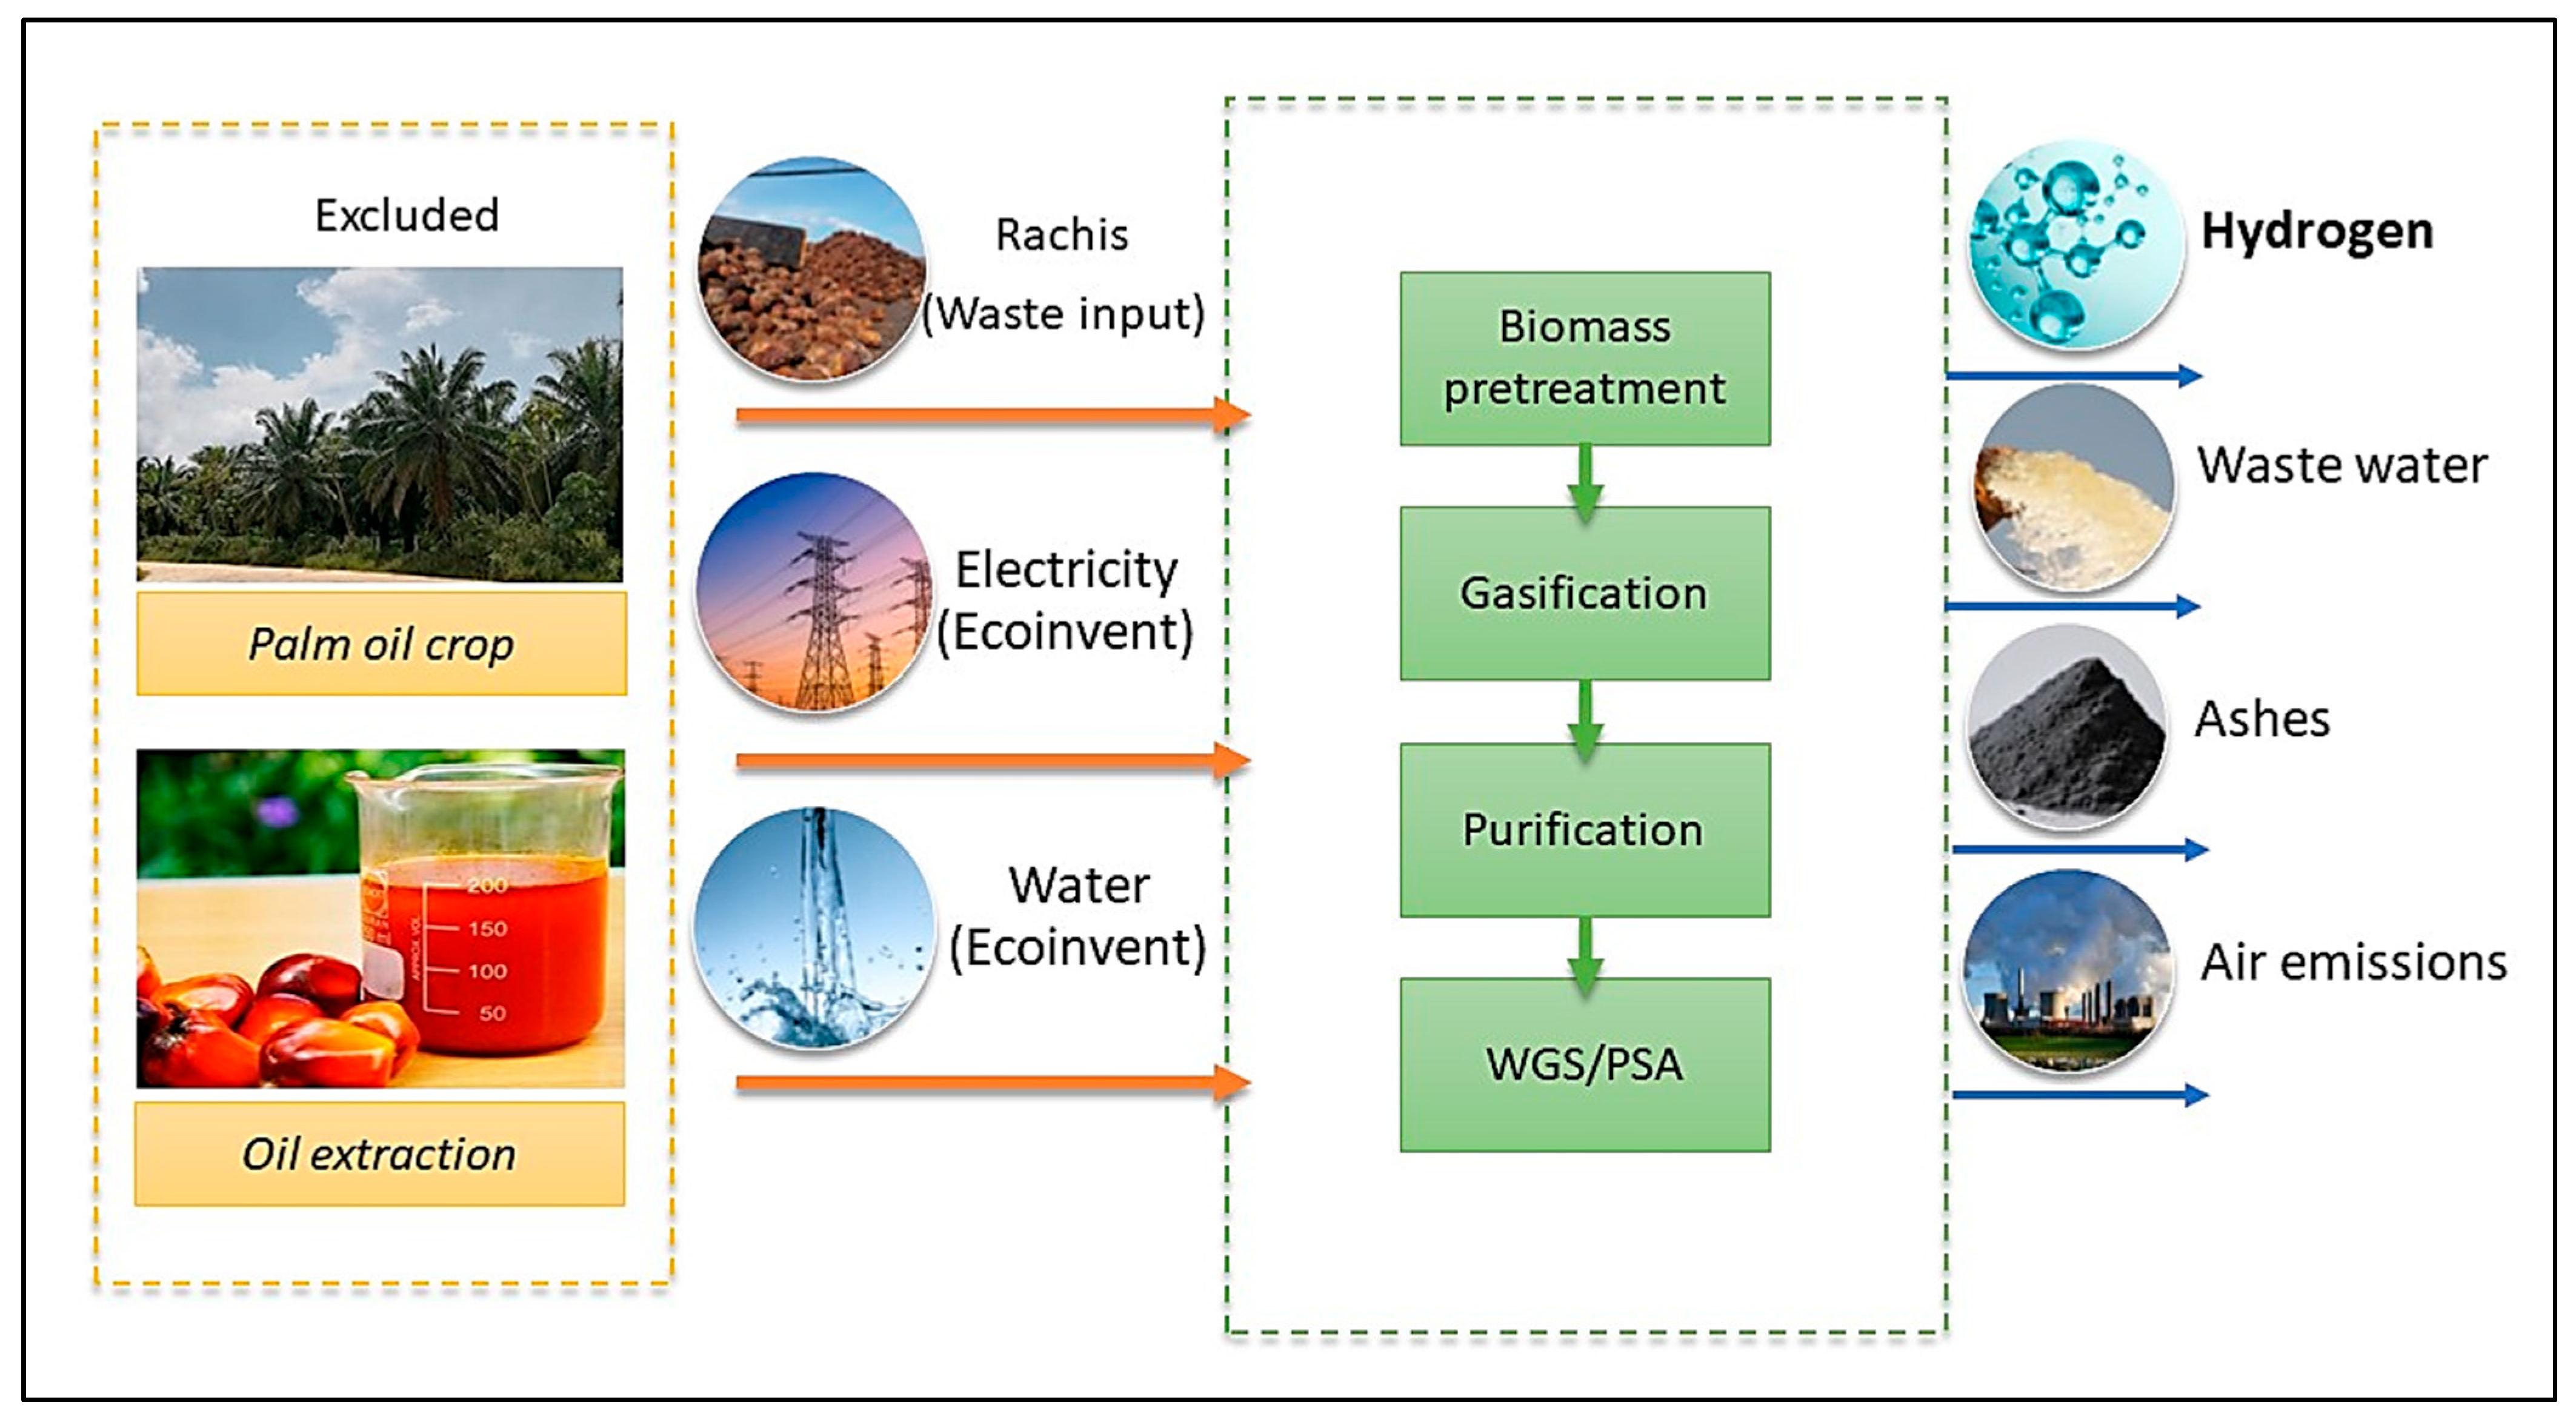
The objective of the LCA was to evaluate environmental indicators for the two processes and compare the results of both methods with data reported in the literature and in the Ecoinvent database. The functional unit selected was 1 kg of hydrogen, and the system boundaries set were “gate to gate”. The allocation method used was mass allocation; the impact assessment methodology was Recipe; and the categories measured were global warming potential, fine particulate matter formation, terrestrial acidification, freshwater eutrophication, freshwater ecotoxicity, water consumption, and fossil resource scarcity. Although the study excludes upstream biomass production and downstream hydrogen use, the gasification stage involves energy inputs, air emissions, effluents, and auxiliary resource consumption that are effectively captured through these categories under the ReCiPe Midpoint 2016 (H) methodology.
Table 4 and
Table 5, contain the mass and energy balances results obtained from the Aspen Plus simulations. These data were then entered into SimaPro 10.2 to model inventory analysis and conduct impact category evaluation.
During the inventory analysis in SimaPro 10.2, the steam, cooling-water, and electricity flows were modeled using the Ecoinvent 3 database. For the steam flow, the selected option was Steam in the chemical industry, RoW, cut-off system. For cooling water, the process used was
Tap water,
CO,
cut-off system. Finally, for electricity consumption, the chosen option was
Electricity,
low voltage,
CO,
cut-off system. The Cut-off system model was selected over the Cut-off unit model because it aligns more closely with the methodological principles of attributional life cycle assessment (A-LCA), which focuses on describing the environmental burdens directly associated with the product system under study. Under the Cut-off system approach, recycled materials and wastes enter the system without burden. At the same time, the environmental impacts of recycling processes are allocated to the product that generates the recyclable material. This treatment avoids double-counting of impacts and provides a transparent representation of material flows. For these reasons, the use of the Cut-off system ensures methodological consistency, transparency in burden allocation, and greater comparability with other studies using Ecoinvent 3. The results for the impact evaluation are shown in
Table 6.
Considering the lower heating value of hydrogen (33.3 kWh/kg H
2), the GWP expressed per unit of energy corresponds to 74.15 kg CO
2-eq/MWh for the Bolívar case and 451.38 kg CO
2-eq/MWh for the Santander case. Studies indicate that biohydrogen produced via biomass gasification can exhibit substantially lower GWP values than fossil pathways, often resulting in net negative emissions when biogenic carbon uptake during biomass growth is appropriately accounted for, and Carbon Capture and Storage (CCS) technologies are applied [
54]. For scenarios that integrate Carbon Capture and Storage (CCS), the absorption unit was modeled assuming a carbon capture efficiency of 90%. This value represents the standard performance for commercial-scale chemical absorption systems using monoethanolamine (MEA) or activated methyldiethanolamine (MDEA) as the solvent. While higher capture rates are theoretically feasible, standard techno-economic guidelines for hydrogen production with CCS recommend a 90% baseline to balance energy penalties with environmental benefits [
55,
56]. Furthermore, some innovative configurations—such as integrating waste biomass from municipal solid waste (MSW)—have demonstrated climate-change benefits of approximately −419 kg CO
2-eq./MWh from avoided emissions relative to conventional incineration [
23]. Conversely, scenarios without CCS or those that neglect biogenic carbon yield positive GWP figures, highlighting the sensitivity of LCA outcomes to assumptions about feedstock quality and process integration [
23].
Table 7 presents a benchmarking analysis of the palm rachis gasification process. The results indicate that the Bolívar scenario achieves hydrogen yield and energy efficiency comparable to the upper tier of reported values for agricultural residues, likely due to the optimized feedstock quality (low ash content). Environmentally, both scenarios demonstrate a substantial reduction in carbon footprint relative to the fossil-based Steam Methane Reforming (SMR) benchmark (~11 kg CO
2/kg H
2), validating the decarbonization potential of the proposed pathway. Economically, although the LCOH is higher than that of fossil hydrogen, it remains competitive with reported bio-hydrogen production costs, particularly for the large-scale scenario.
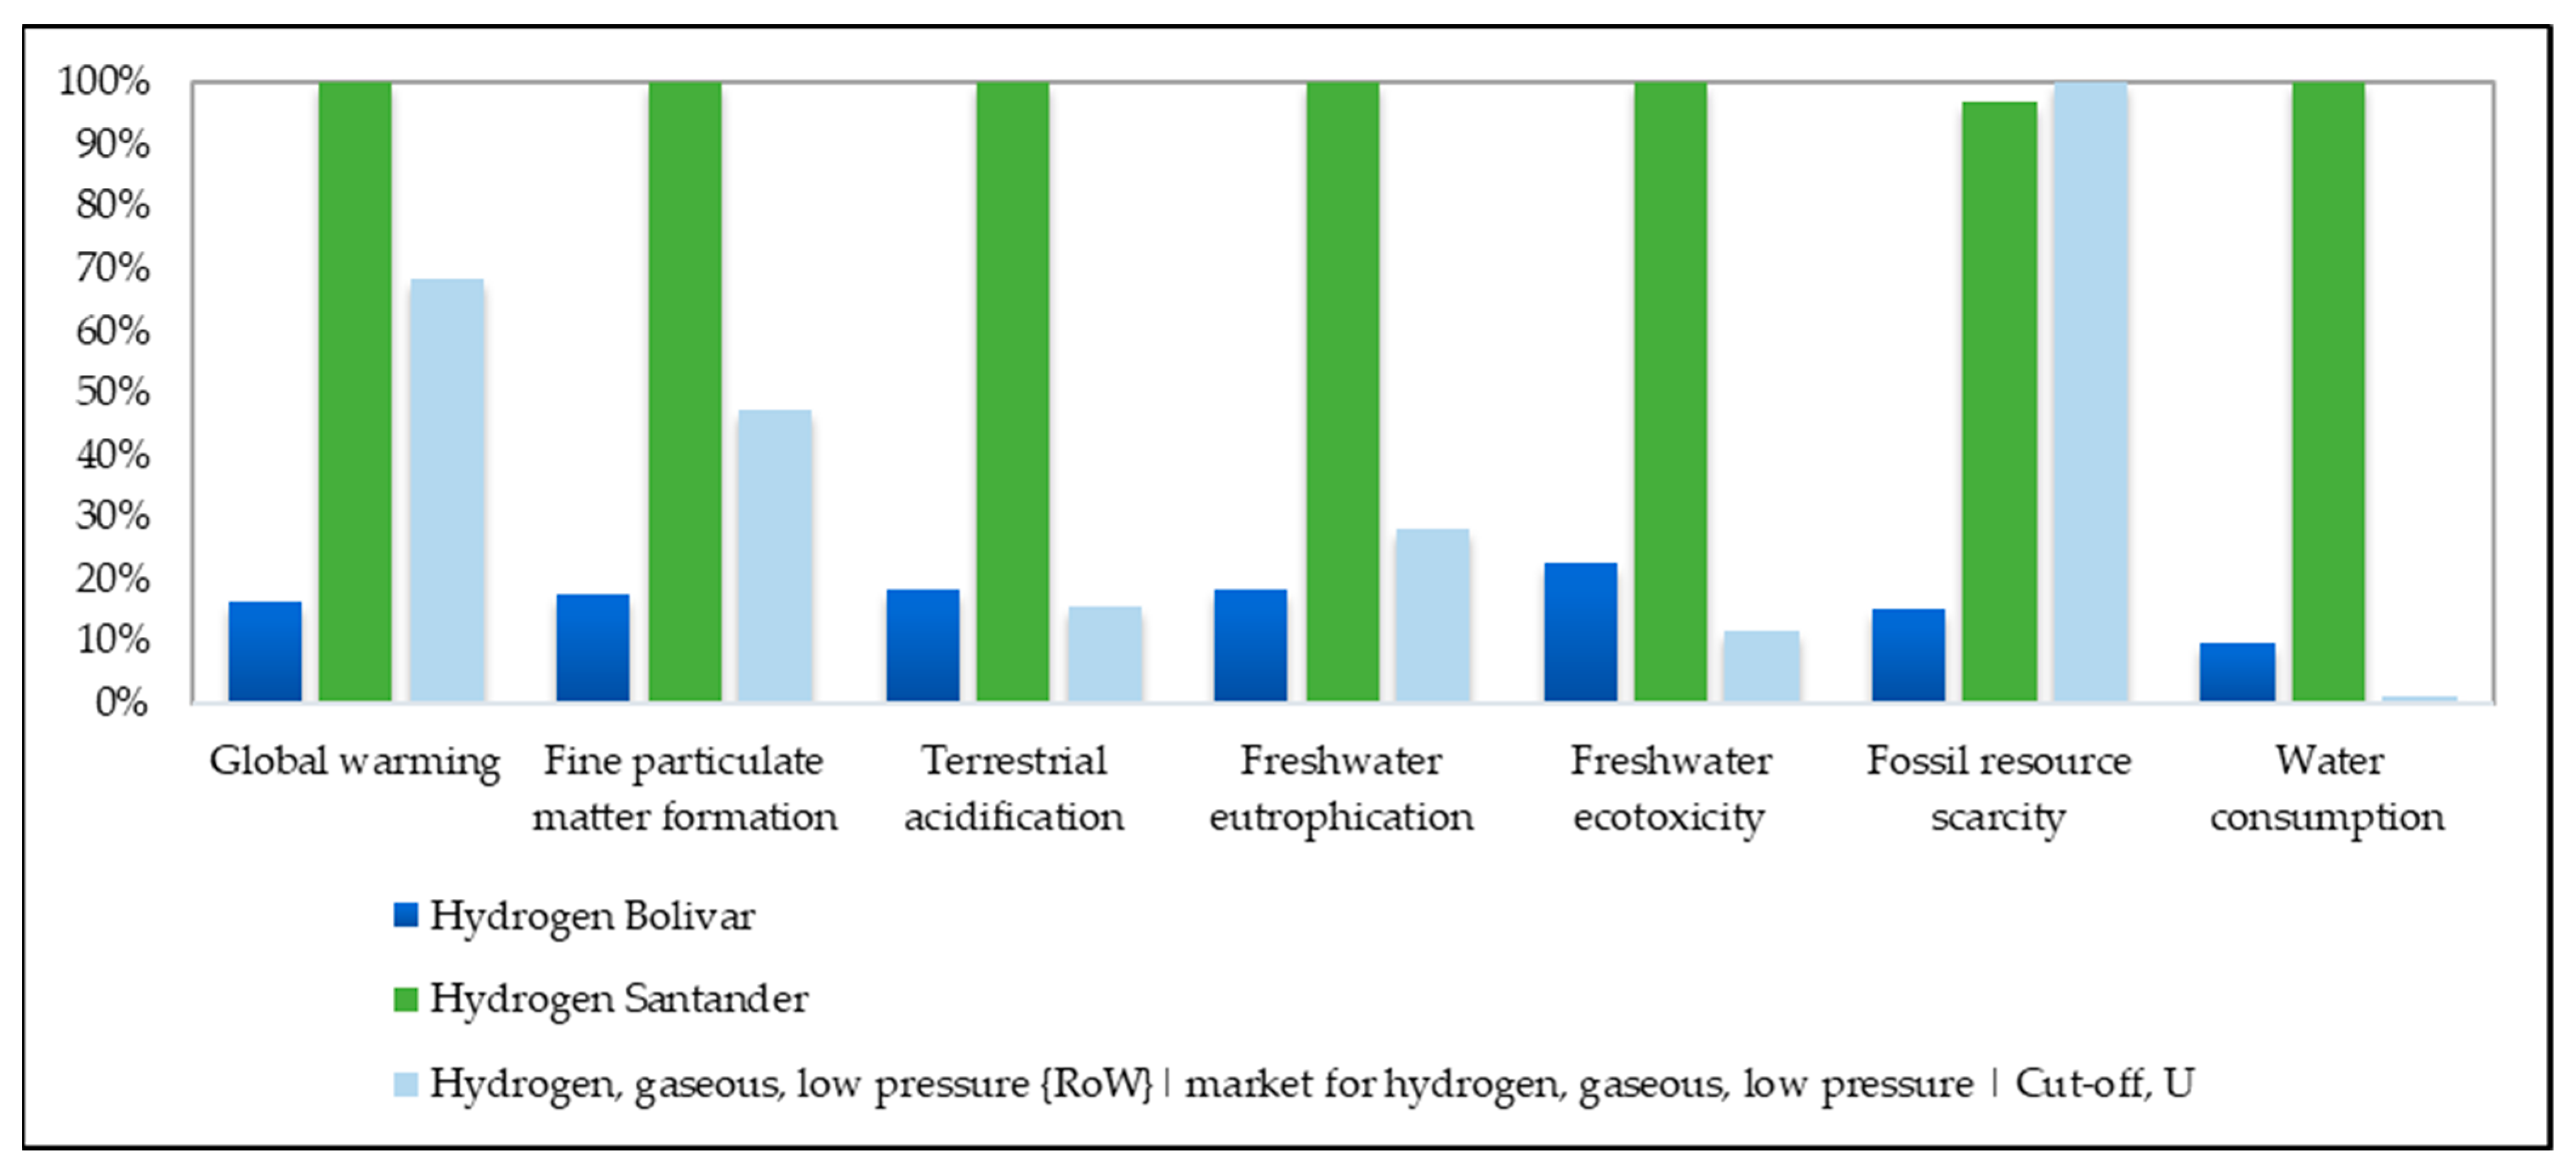
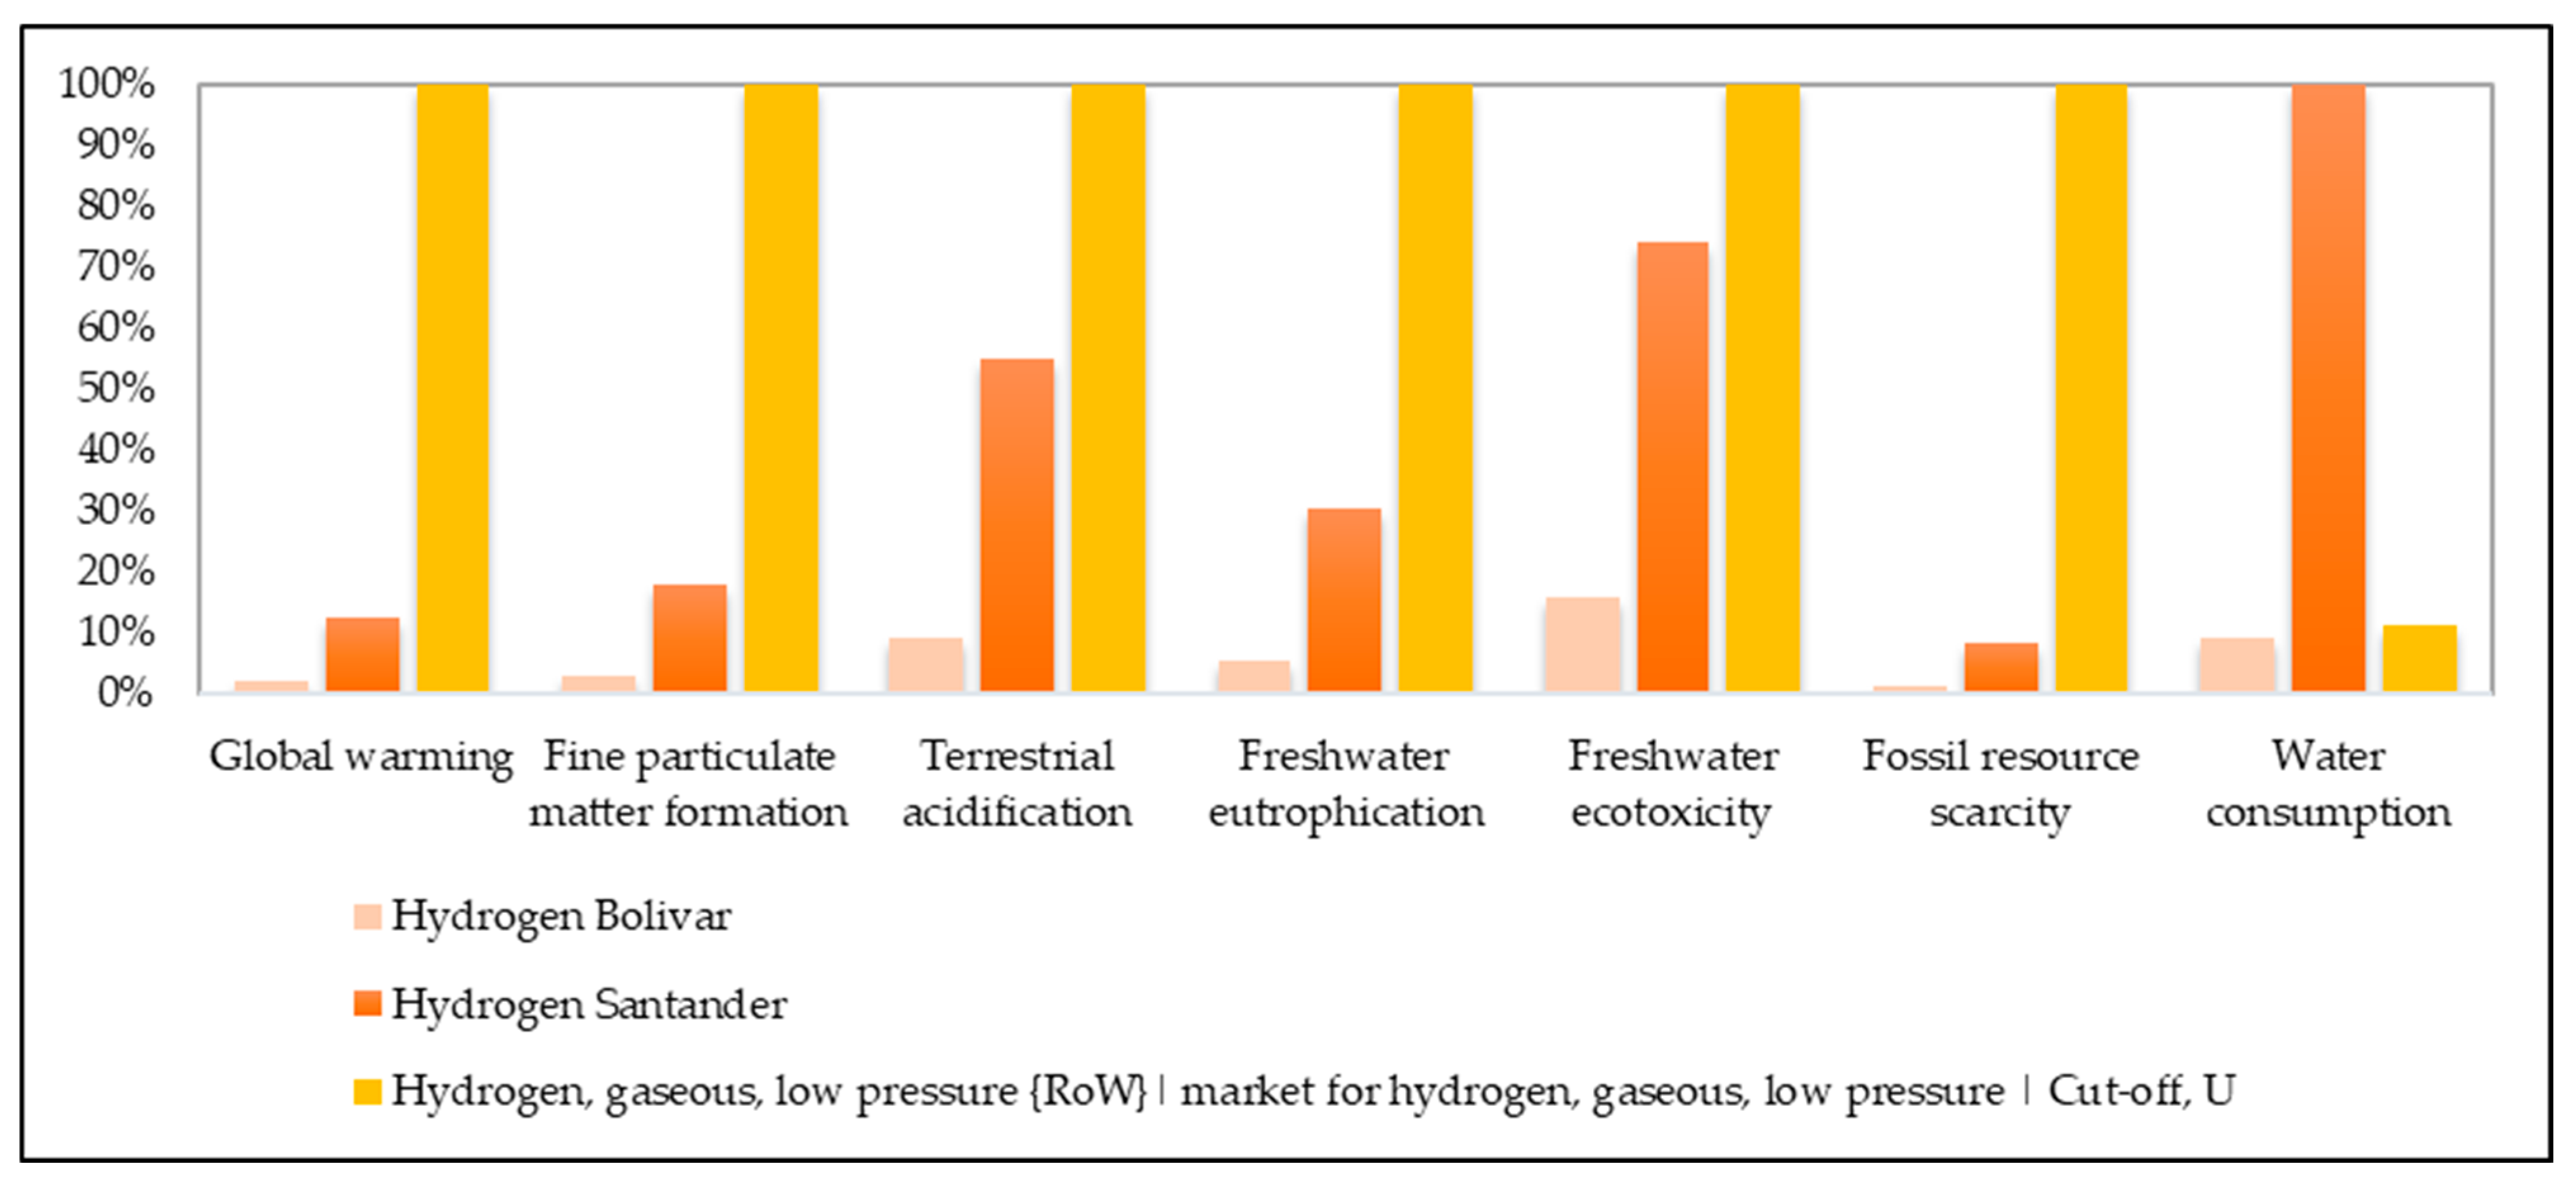
Fine Particulate Matter Formation and Terrestrial Acidification are strongly influenced by gaseous emissions (NO
x, SO
2, particulates) associated with thermochemical conversion. For both categories, Bolívar shows an impact lower than Ecoinvent’s, whereas Santander consistently performs worse (see
Figure 5). This pattern indicates that, in the Santander case, emissions control or operating conditions result in greater atmospheric impacts. These categories are significant for gasification projects because air emissions represent a key environmental concern for thermochemical systems.
Eutrophication potential quantifies the risk of nutrient enrichment in aquatic ecosystems, typically expressed in kg P equivalents. In biohydrogen LCAs from biomass gasification, eutrophication impacts are influenced by upstream inputs, such as fertilizer use during biomass cultivation, as well as by combustion-related emissions [
54,
57]. While some pathways, particularly those using waste feedstocks, may indirectly benefit from avoided impacts associated with conventional waste treatment, the overall eutrophication potential can remain significant, necessitating careful management of nutrient releases [
54]. In the freshwater eutrophication indicator, Bolívar again outperforms Ecoinvent, whereas Santander exceeds both Bolívar and the reference value. Given that gasification may involve condensates and water-based cleaning systems, this indicator is relevant for assessing local water-quality risks.
Ecotoxicity impacts are assessed in the freshwater compartment and are often expressed as comparative toxic units (e.g., CTUe or kg 1,4-DCB equivalents). The ecotoxicity potential of biohydrogen production processes is strongly influenced by the release of toxic substances during biomass pretreatment, gasification, and syngas cleaning; for instance, emissions of chemicals used in scrubbers and filters (e.g., sodium hypochlorite) are of particular concern [
26]. Furthermore, studies have indicated that although the direct toxicity of the hydrogen product may be minimal, indirect contributions from upstream emissions associated with the processing of MSW or agricultural residues can increase ecotoxicity scores [
58,
59]. In the present research, freshwater ecotoxicity shows the most pronounced deviations. The Bolívar case more than doubles the Ecoinvent value, and the Santander case exceeds it by nearly an order of magnitude. This suggests that the handling of tars, trace metals, or wastewater streams in both case studies—particularly in Santander—may impose significant ecotoxicological burdens. For biomass gasification, this category is essential because contaminants from syngas cleaning can substantially influence freshwater ecosystems if not properly managed.
In contrast, Fossil Resource Scarcity performs better than Ecoinvent in both case studies, with Bolívar showing the lowest impact. Since the feedstock is a residual biomass and energy inputs may be lower or partially renewable, this result indicates a reduced dependency on fossil resources, reinforcing the attractiveness of biomass-based hydrogen pathways. Water management is an increasingly pertinent issue in LCAs, particularly for processes with high steam and cooling demands such as biomass gasification. Biohydrogen LCAs have quantified the water consumption potential (WCP) and water scarcity footprints (WSF), which account for regional water resource availability [
54]. While gasification generally requires less freshwater than biological processes such as dark fermentation, substantial water inputs for drying, steam generation, and cooling can still be significant, particularly if water recycling is not optimally implemented [
44]. Santander’s water demand is substantially higher than the Ecoinvent benchmark, while Bolívar performs moderately above the reference value. Because gasification requires water for steam generation, cooling, and cleaning stages, this indicator is crucial for assessing the feasibility of deployment in regions with water constraints. The results suggest that water management strategies in Santander may require optimization.
While numerous LCA studies consistently demonstrate that biohydrogen produced via biomass gasification can achieve significant benefits, including reduced GWP and lower fossil resource consumption, compared with conventional hydrogen production methods, these benefits often come with trade-offs. The acidification potential and ecotoxicity impacts tend to be higher in some configurations, particularly when the gasification process involves extensive syngas cleaning and the use of chemicals in filters and scrubbers [
26]. The energy inputs required to attain high operating temperatures (typically 700–1200 °C) and to drive separation and purification processes can increase the cumulative non-renewable energy demand if not managed through integrated heat-recovery systems [
56]. Moreover, environmental performance is sensitive to key process parameters, including feedstock moisture content, biomass composition (e.g., the biogenic carbon fraction, which can vary between 40 and 60%), and the efficiency of CO
2 capture and utilization methods. Sensitivity analyses in these studies underscore that improvements in process efficiency, optimization of operating conditions, and substitution of fossil-based energy inputs with renewable sources can effectively mitigate several of the observed environmental burdens [
23].
Several LCAs have benchmarked biohydrogen produced via biomass gasification against other low-carbon hydrogen production pathways, such as blue hydrogen via steam methane reforming with CCS and green hydrogen from water electrolysis powered by renewable energy sources. In many comparative studies, biohydrogen offers a distinct advantage for climate change mitigation, owing to its net-negative or highly reduced GWP when biogenic carbon is accounted for [
23]. However, while biohydrogen tends to perform well on GWP metrics, its acidification potential and specific ecotoxicity parameters sometimes remain comparable to, or even slightly exceed, those of its fossil-based counterparts. For example, studies indicate that acidification potentials in biohydrogen routes can be up to 4–22% higher than those for blue or green hydrogen, largely due to the indirect environmental burdens introduced by syngas cleaning processes [
60]. Other impact categories, such as cumulative non-renewable energy demand and resource depletion, also display favorable performance in biohydrogen systems when energy recovery measures are integrated and when the renewable character of the feedstock is effectively harnessed [
60]. Overall, the comparative LCAs reinforce the view that, while biohydrogen from biomass gasification is a desirable option for climate change mitigation, concerted efforts to optimize processes are essential to mitigate residual impacts across other environmental domains [
54].
A recurring theme in LCA studies of biohydrogen production via biomass gasification is the considerable uncertainty surrounding metering and system boundaries. Variations in biomass moisture content, feedstock composition (particularly the biogenic carbon fraction), energy supply mix, and the efficiency of process units such as gasifiers and syngas cleaning systems can lead to a wide range of reported environmental impact values [
23]. Sensitivity analyses are thus critical tools that enable researchers to explore the effects of these variables and identify environmental hotspots in which process improvements will yield the greatest benefits [
44]. Furthermore, integrating multifunctional LCA approaches—where co-products such as recovered metals, biochar, and excess electricity are credited—can improve the apparent eco-efficiency of the system but requires careful justification and transparent methodological choices [
53,
60].
The previous LCIA results were calculated without mass allocation to co-products, as the primary product and motivation of the processes is hydrogen production.
Table 8 presents the results for a more favorable process scenario, with two co-products: char coal and a CO
2-rich stream. The allocation method used is based on mass. In this new scenario, both processes have better environmental indicators than the hydrogen reference selected from the Ecoinvent database. Within the water consumption category, hydrogen from Santander still has the highest impact indicator (see
Figure 6).
3.3. Techno-Economic Evaluation
A cost of 50 USD/t was considered for palm rachis, and a price of 3100 USD/t for hydrogen [
61]. Since the process does not use reagents to produce hydrogen, no other raw materials were considered. Regarding industrial utilities, the process primarily consumes water, steam, electricity, and compressed air.
Table 9 outlines the key considerations for installing a hydrogen production plant using palm rachis in the Department of Bolívar, specifically in María La Baja, and a second plant in the Department of Santander, located in Sabana de Torres. This biomass is typically used for energy generation. Furthermore, a plant service life of 15 years was established, with a tax rate of 35% [
62] and an interest rate of 10% [
63] for the year 2025. Additionally, a contingency value of 36% was set, representing funds reserved for strikes, design changes, price fluctuations, and floods.
A computer-aided techno-economic assessment was conducted using the techno-economic analysis methodology developed by Romero et al. [
35]. The Total Capital Investment was calculated, along with Economic Potentials (EP), Cumulative Cash Flow (CCF), Payback Period (PBP), Return on Investment (ROI), Net Present Value (NPV), and the annual Benefit–Cost Ratio.
Table 10 presents a detailed report on the total investment items for the hydrogen production plant in 2025, including equipment installation costs, piping, electrical systems, and other components. Equipment prices for the processes were obtained from supplier quotations (
www.alibaba.com) during the research.
Table 11 presents the total operating costs associated with implementing the palm rachis-based hydrogen production plant in 2025. These costs encompass labor, maintenance, raw materials, taxes, and industrial utilities, among others. The operating costs account for Direct Production Costs (DPC), Fixed Charges (FCH), Plant Overhead (POH), and General Expenses (GE). Specifically, this includes operation-related expenses contingent on production capacity; expenses independent of operations or production capacity, such as taxes, security services, general engineering, internal transport, and medical services; and administrative, marketing, and research and development expenses, among others.
The profitability analysis was driven by the revenue obtained from the sale of biohydrogen. Consequently, after deducting the Annual Operating Costs (AOC) and applying a 35% corporate tax rate, the resulting net cash flow enables recovery of the initial capital investment in 4.54 years. This relatively short payback period is attributed to the low cost of the feedstock (residue) and the high energy efficiency of the gasification process, which minimizes utility expenses.
Table 12 displays the economic and profitability indicators. A Net Present Value (NPV) of USD 25.01 million and a Benefit–Cost Ratio of 3.29 were obtained. The Benefit–Cost Ratio serves as a key indicator of project feasibility; in this instance, the project is deemed viable because the indicator exceeds 1.
It is relevant to consider the implications of an alternative scenario in which the process is terminated at the methane production stage (Synthetic Natural Gas, SNG), bypassing the conversion to hydrogen. From a capital investment perspective, excluding the Steam Methane Reforming (SMR), Water–Gas Shift (WGS), and PSA units would reduce the Fixed Capital Investment (FCI) by approximately 30–40%, as gas conditioning and separation are capital-intensive operations. However, this reduction in CAPEX does not necessarily translate into higher profitability. The market price of natural gas (methane) is substantially lower than that of high-purity hydrogen on an energy-equivalent basis. Moreover, producing SNG would align the project with fossil fuel substitutes rather than the high-value decarbonization market. Therefore, while the ‘methane-only’ route offers a lower barrier to entry in terms of investment, the proposed ‘hydrogen pathway’ maximizes both the specific revenue per ton of biomass and the environmental value added.
To evaluate how the process responds to potential changes in key economic parameters, a techno-economic resilience analysis was performed. This approach enables assessment of hydrogen production from palm rachis under scenarios with increased feedstock prices and varying plant performance conditions. It also provides insight into the operational thresholds at which the process becomes economically infeasible.
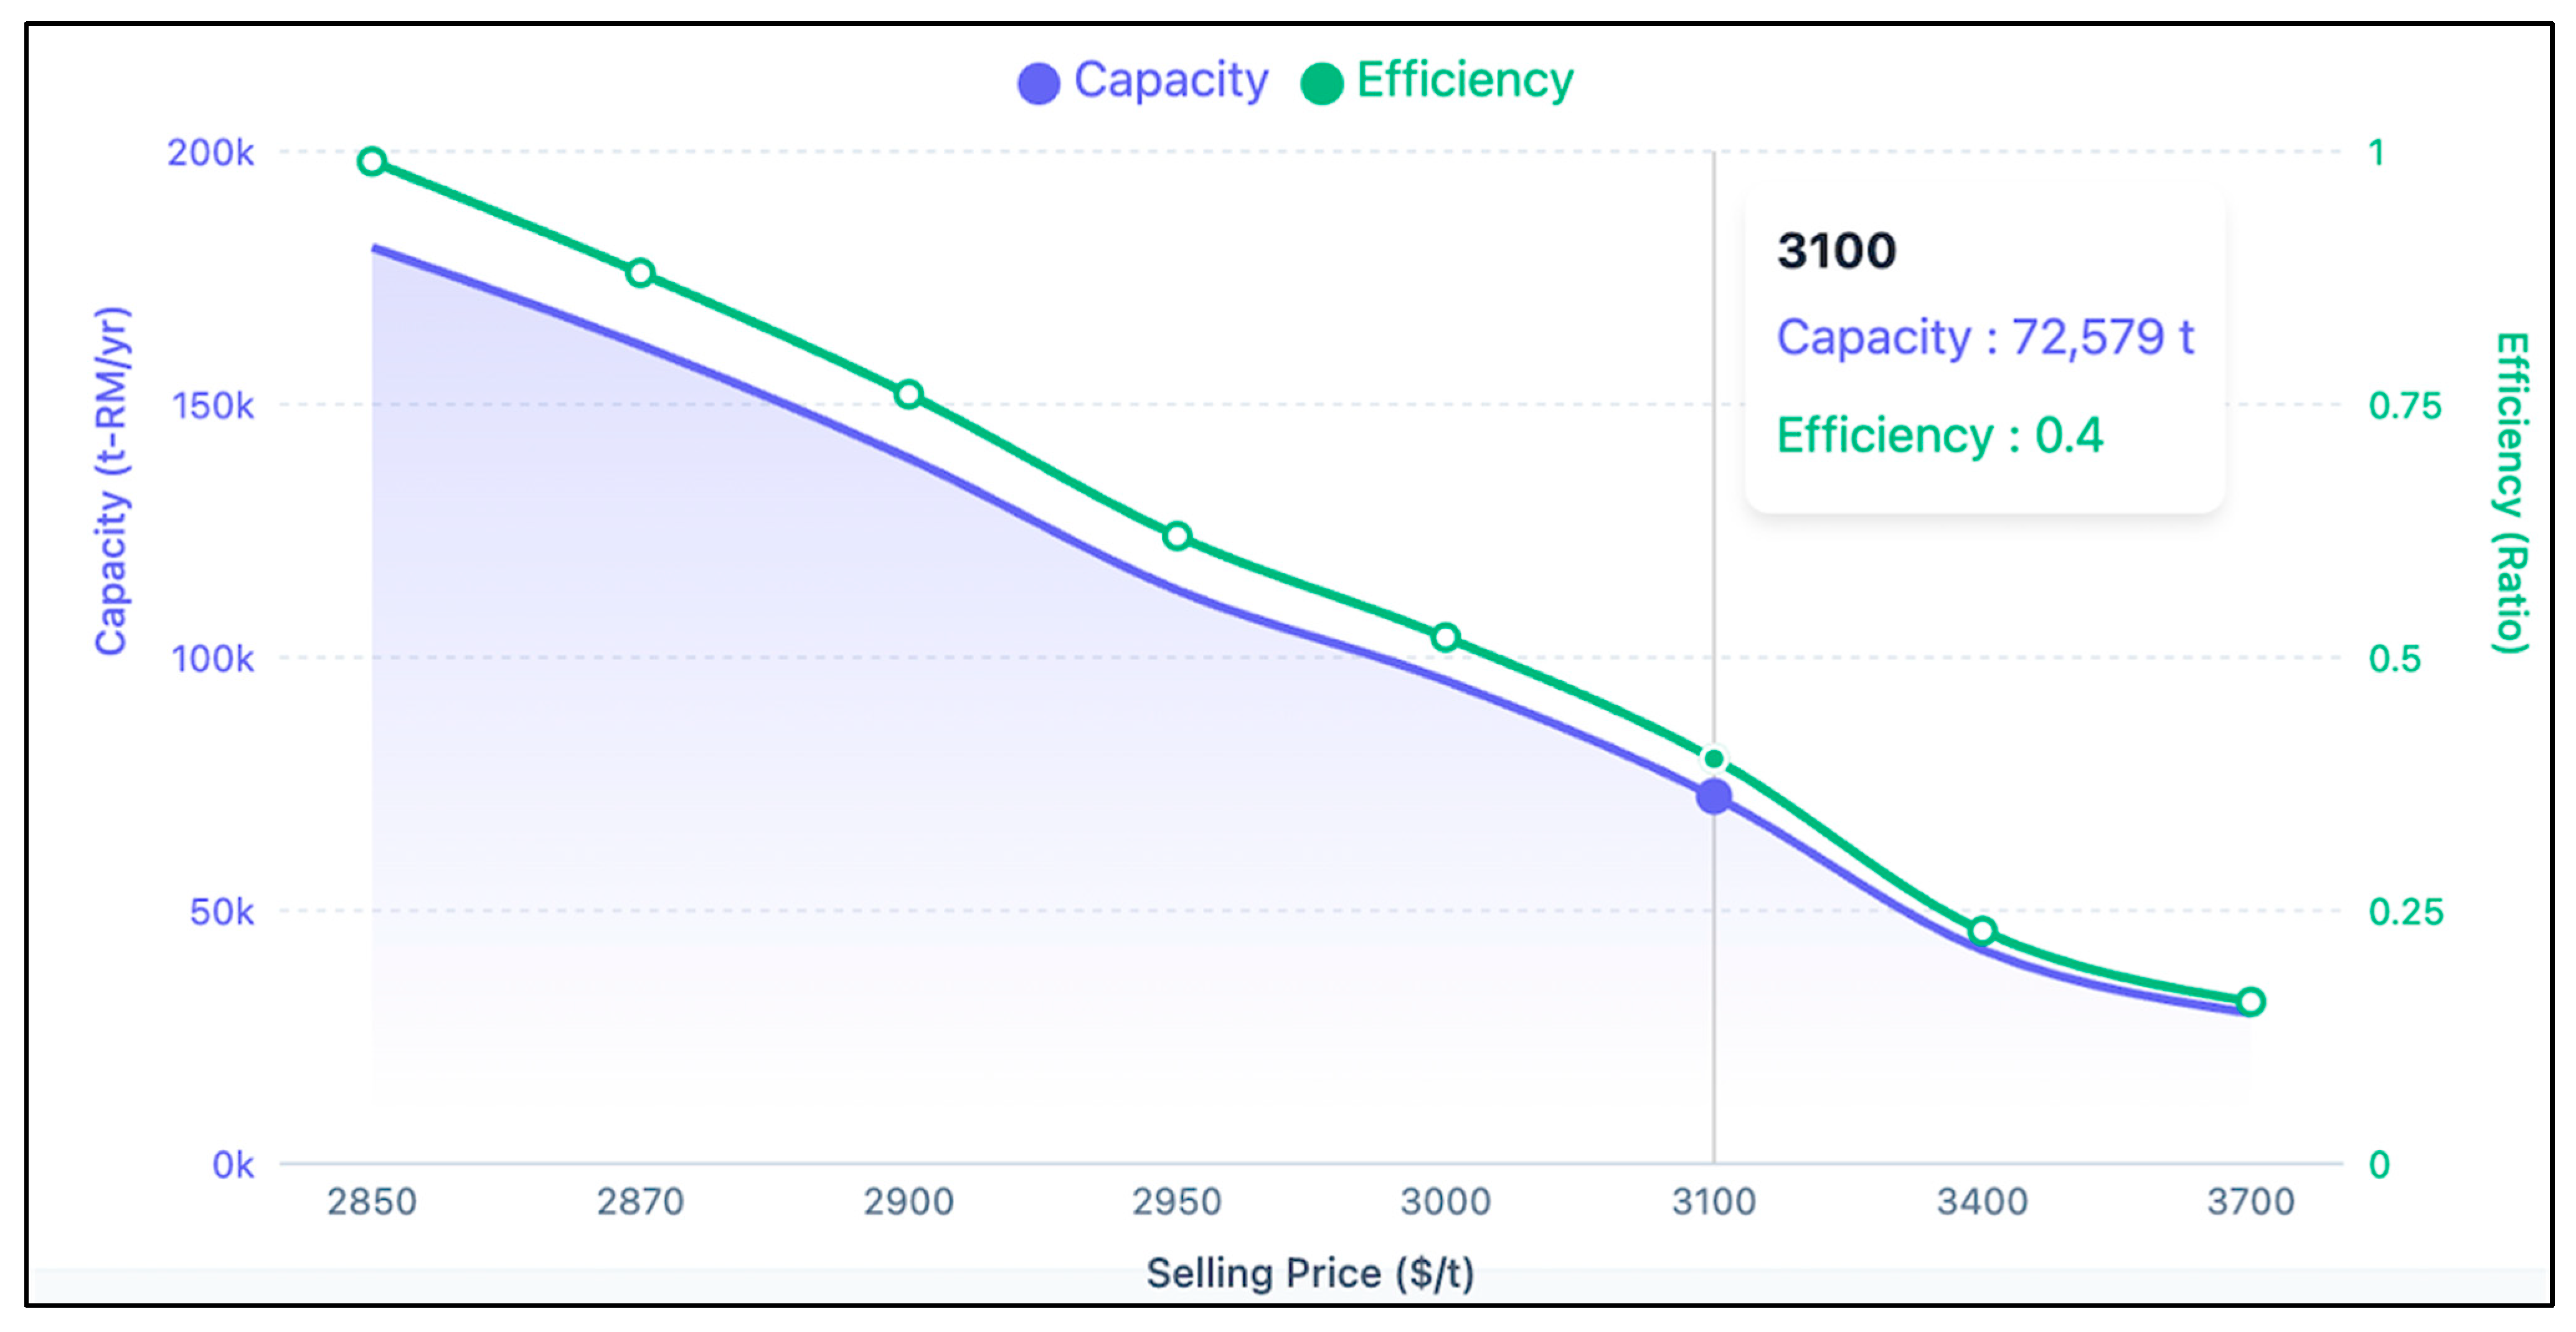
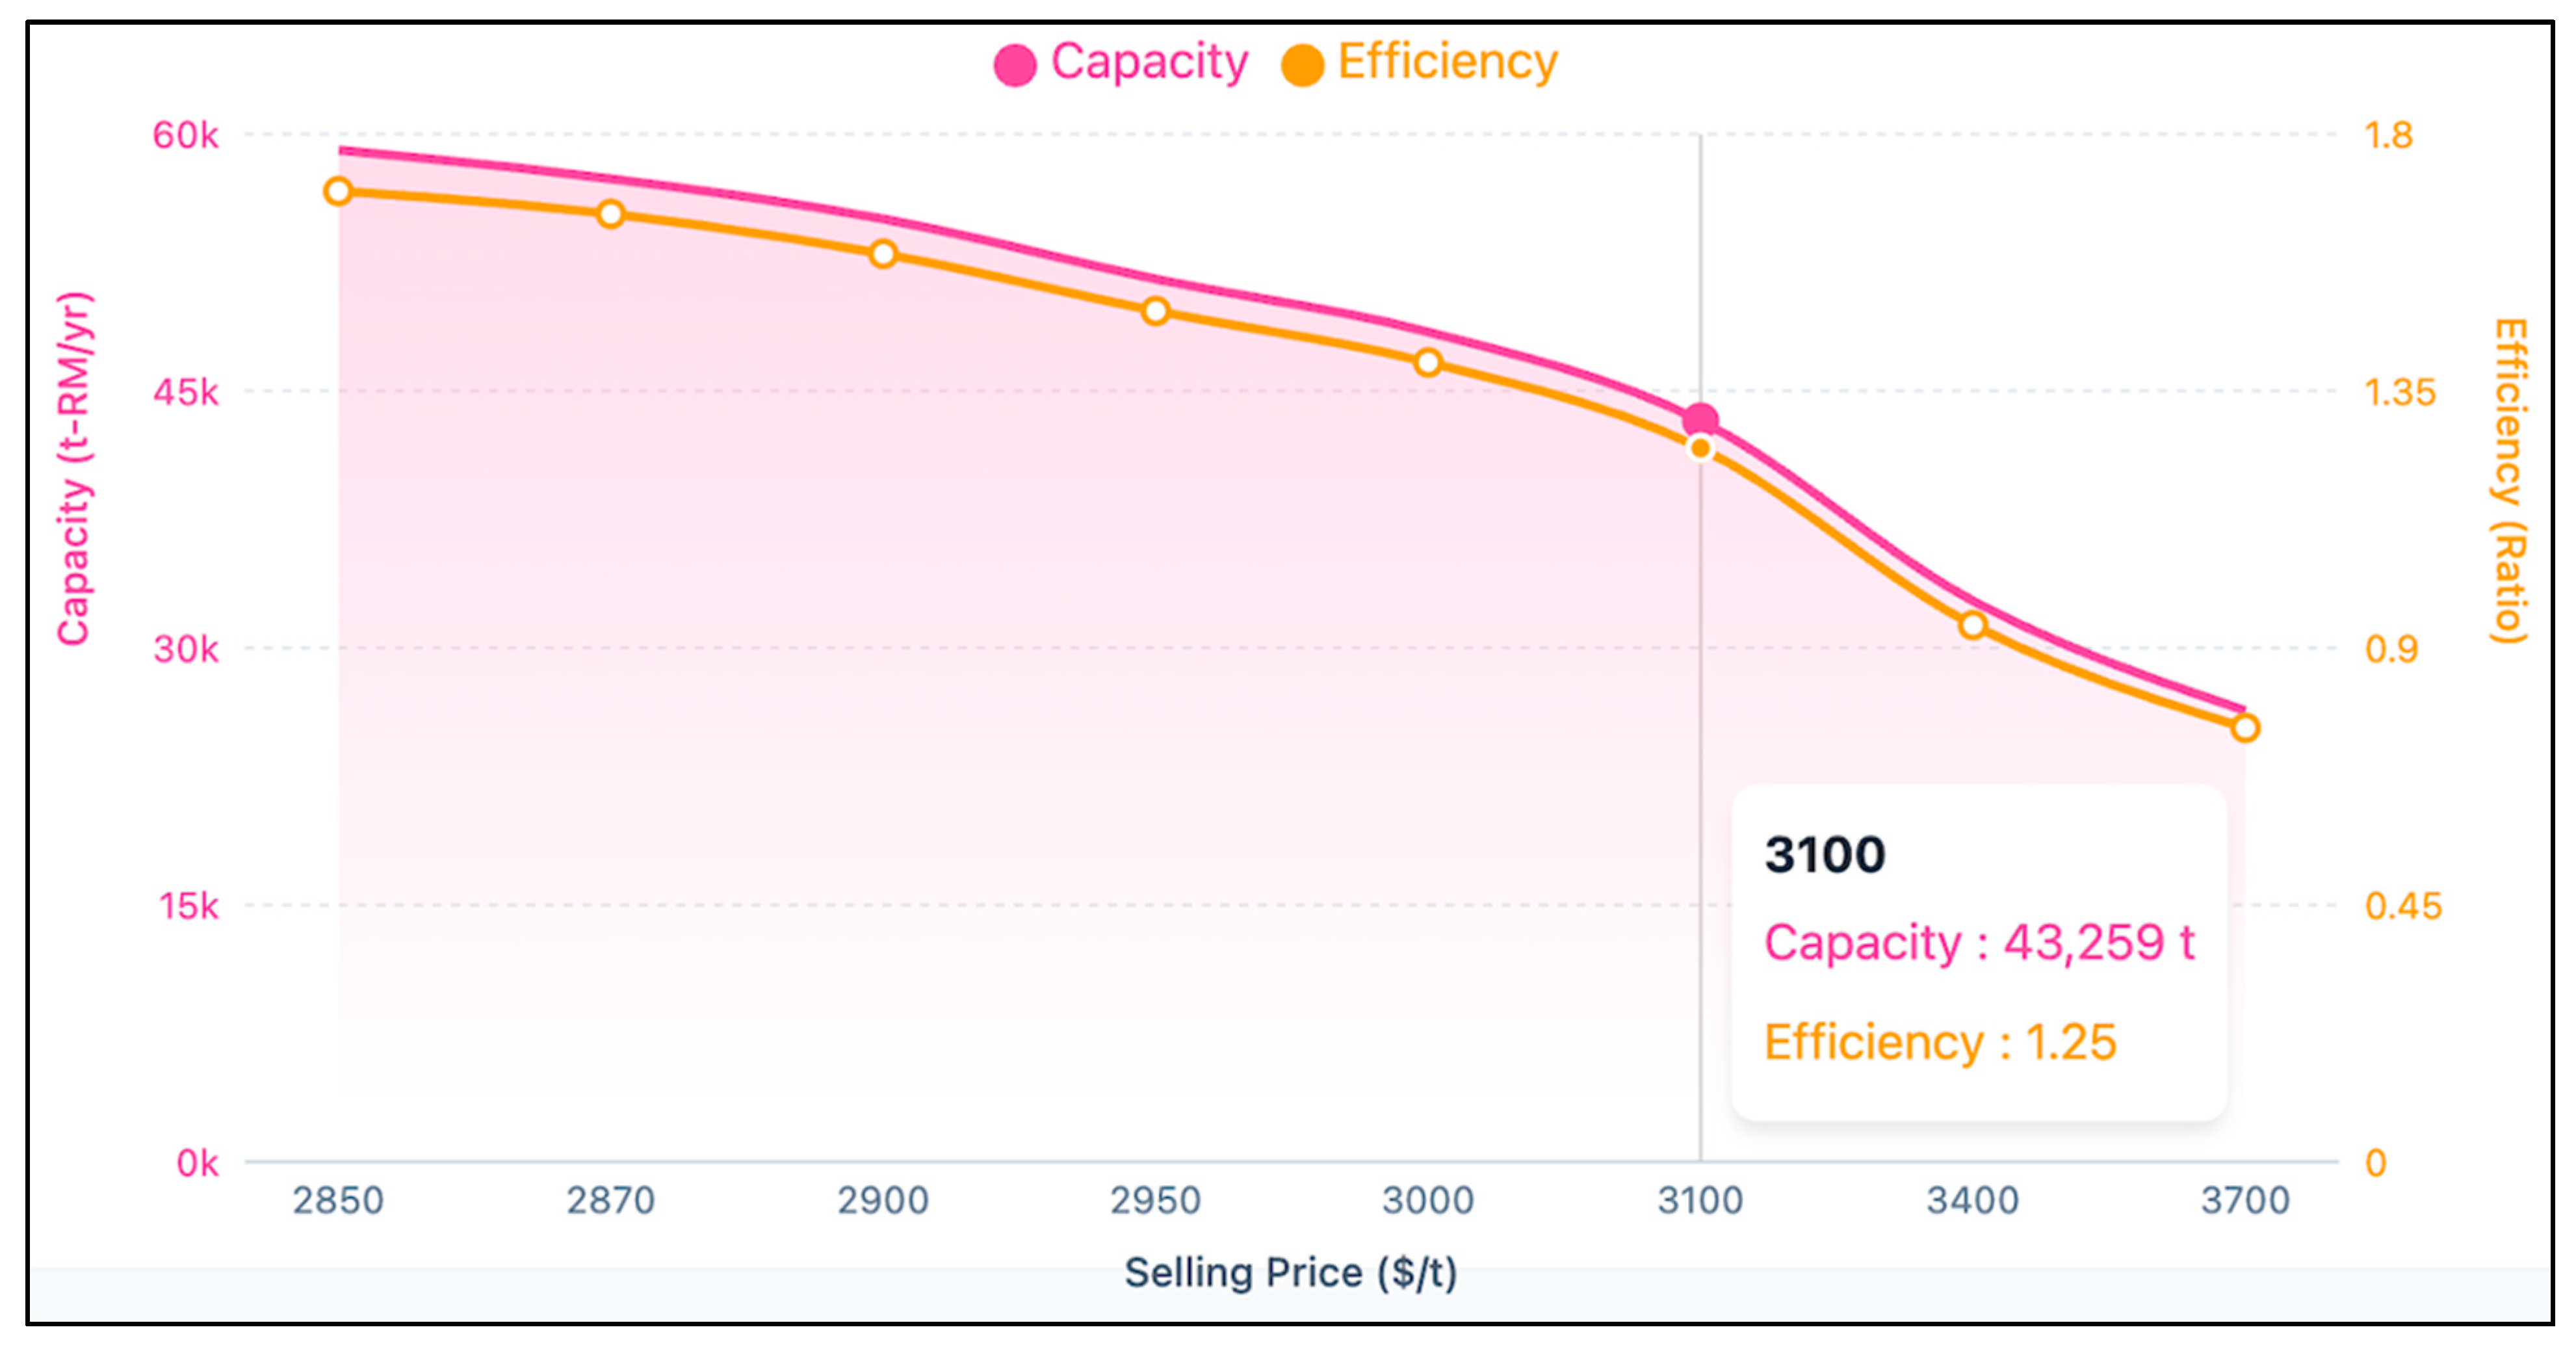
Figure 7 and
Figure 8 present the sensitivity analysis of economic stability by plotting the On-Stream Efficiency at the Break-Even Point (BEP) against the hydrogen selling price for both case studies. In both cases, the curves exhibit an explicit inverse, non-linear relationship: as the selling price of hydrogen increases, the minimum on-stream efficiency required to cover total costs decreases. In other words, higher product prices confer greater economic flexibility, whereas lower prices require stricter operational performance.
For the Bolívar plant (
Figure 7), the base-case selling price of USD 3100 per t corresponds to a required on-stream efficiency of 39.65% to reach the BEP. This relatively low value indicates a robust operational margin, suggesting the plant can remain economically viable even with moderate reductions in availability, downtime, or performance.
In contrast, the Santander plant (
Figure 8) exhibits a markedly less favorable resilience profile. At the same selling price of USD 3100/t, the required on-stream efficiency rises to 125.17%, a physically unattainable level. This result highlights the economic vulnerability of the Santander configuration: even under optimistic selling-price conditions, the process cannot achieve cost recovery without substantial improvements in technology performance, operational conditions, or economic assumptions. Overall, the comparison underscores that hydrogen production from palm rachis is economically promising in regions with conditions like Bolívar—where biomass availability, logistics, and operational parameters are favorable—while regions resembling the Santander scenario face substantial barriers that must be addressed before such projects can be considered feasible.




 ,
,