Article

The Impact of National Modern Agricultural Industrial Parks on Rural Residents’ Income: Evidence from China

1
College of Economics and Management, South China Agricultural University, Guangzhou 510642, China
2
School of Public Administration, Guangdong University of Finance, Guangzhou 510521, China
*
Author to whom correspondence should be addressed.
Sustainability 2026, 18(3), 1499; https://doi.org/10.3390/su18031499
Submission received: 23 November 2025 / Revised: 4 January 2026 / Accepted: 13 January 2026 / Published: 2 February 2026

Abstract

Agricultural industrial parks have been promoted as a key instrument for agricultural modernization, yet causal evidence of their impact on raising rural residents’ income remains limited. This study evaluates the income effects of National Modern Agricultural Industrial Parks (NMAIPs) in China, clarifying the transmission mechanisms and distributional consequences for rural households and the urban–rural income gap. Using county- and household-level panel data (2014–2022), we exploit the staggered rollout of NMAIPs as a quasi-natural experiment and employ a staggered Difference-in-Differences (DID) design with two-way fixed effects, complemented by event-study analysis. Results show that NMAIP establishment raises rural residents’ income by approximately 1.83% on average. Mechanism analysis indicates that this gain operates primarily through employment expansion, technological upgrading, and capital agglomeration. At the household level, NMAIPs significantly increase wage and operating income but have limited effects on property and transfer income, reflecting constraints in rural asset markets. Furthermore, NMAIPs reduce intra-rural inequality and moderate the urban–rural income gap following an inverted U-shaped path (initial widening followed by narrowing), as benefits diffuse through value chains. We conclude that NMAIPs are an effective policy lever for inclusive rural growth, yet their distributive outcomes could be enhanced by supporting reforms in rural factor markets and public service delivery.

1. Introduction

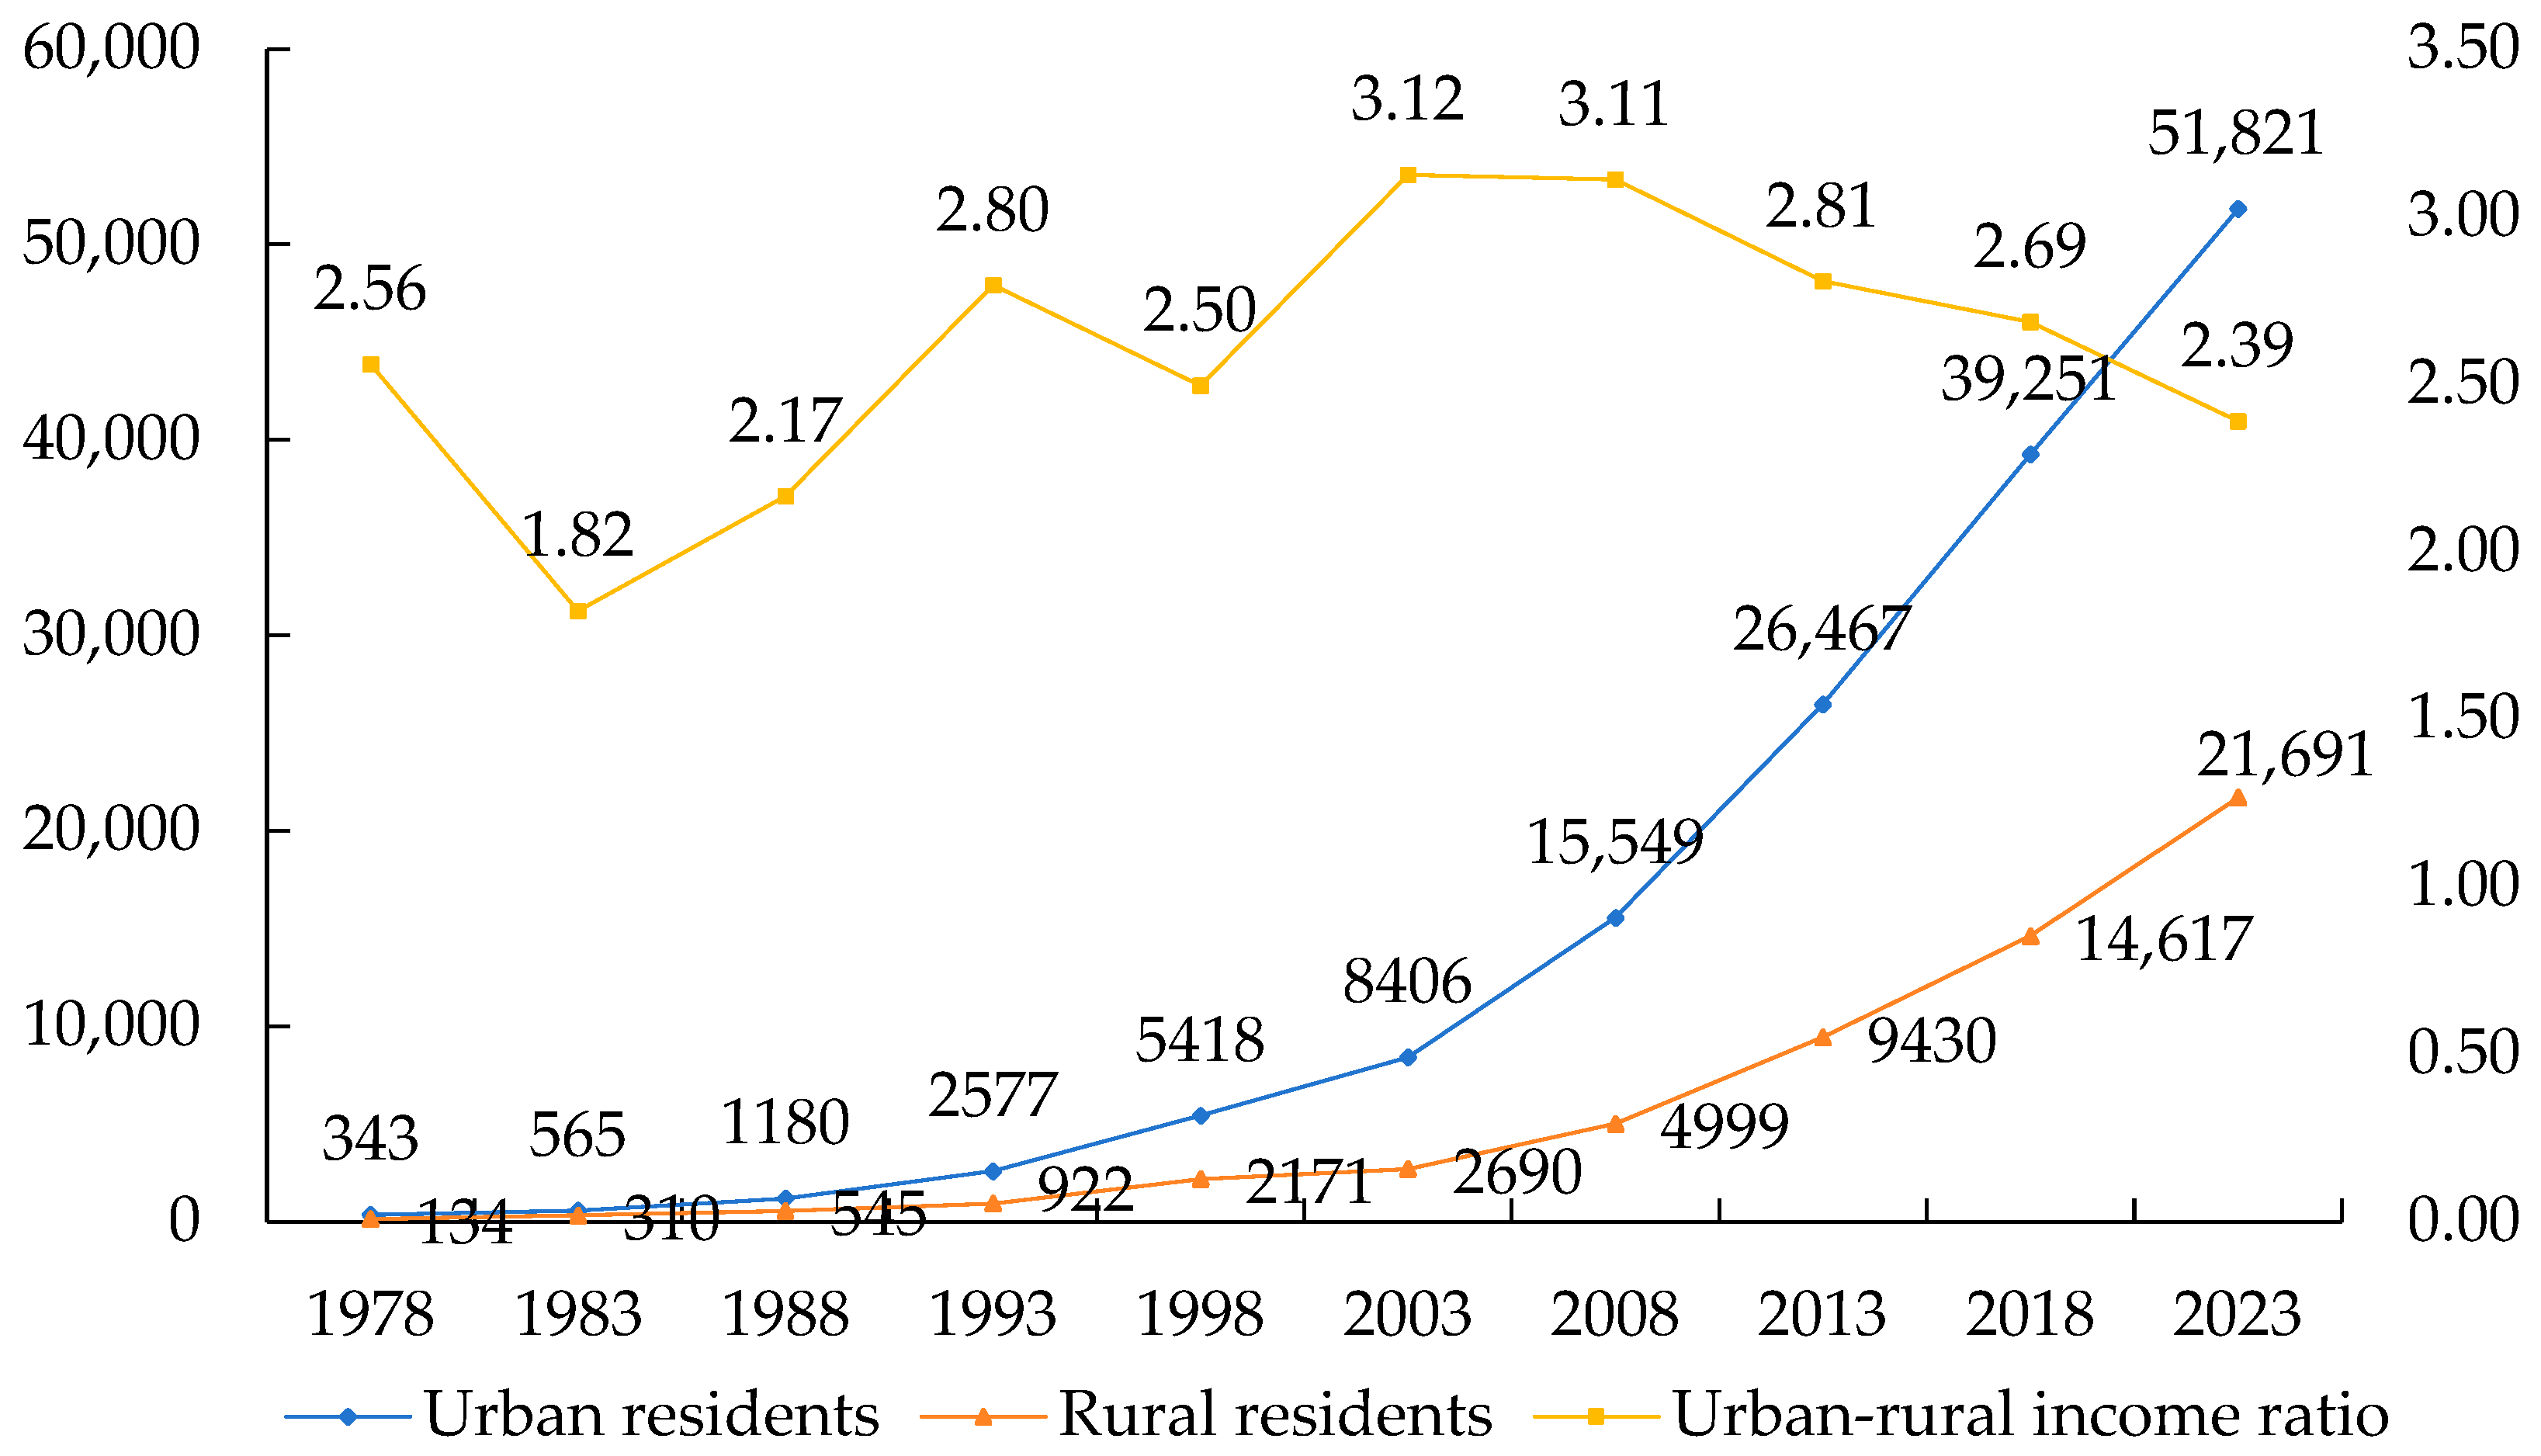
Since the onset of reform and opening-up, China has experienced rapid economic growth, leading to a substantial rise in residents’ income levels. According to national statistics, the country’s per capita disposable income soared from CNY 171 in 1978 to CNY 39,218 in 2024—an increase of more than 229-fold over 45 years. Despite this remarkable progress, rural development has lagged behind and is increasingly characterized by three closely related challenges: relatively low income levels, a highly unbalanced income composition, and widening intra-rural inequality [1,2,3]. First, rural residents’ per capita disposable income reached CNY 21,691 in 2023 (Figure 1), yet urban residents’ per capita disposable income had already exceeded CNY 24,000 as early as 2012, underscoring the persistent gap in absolute income levels.
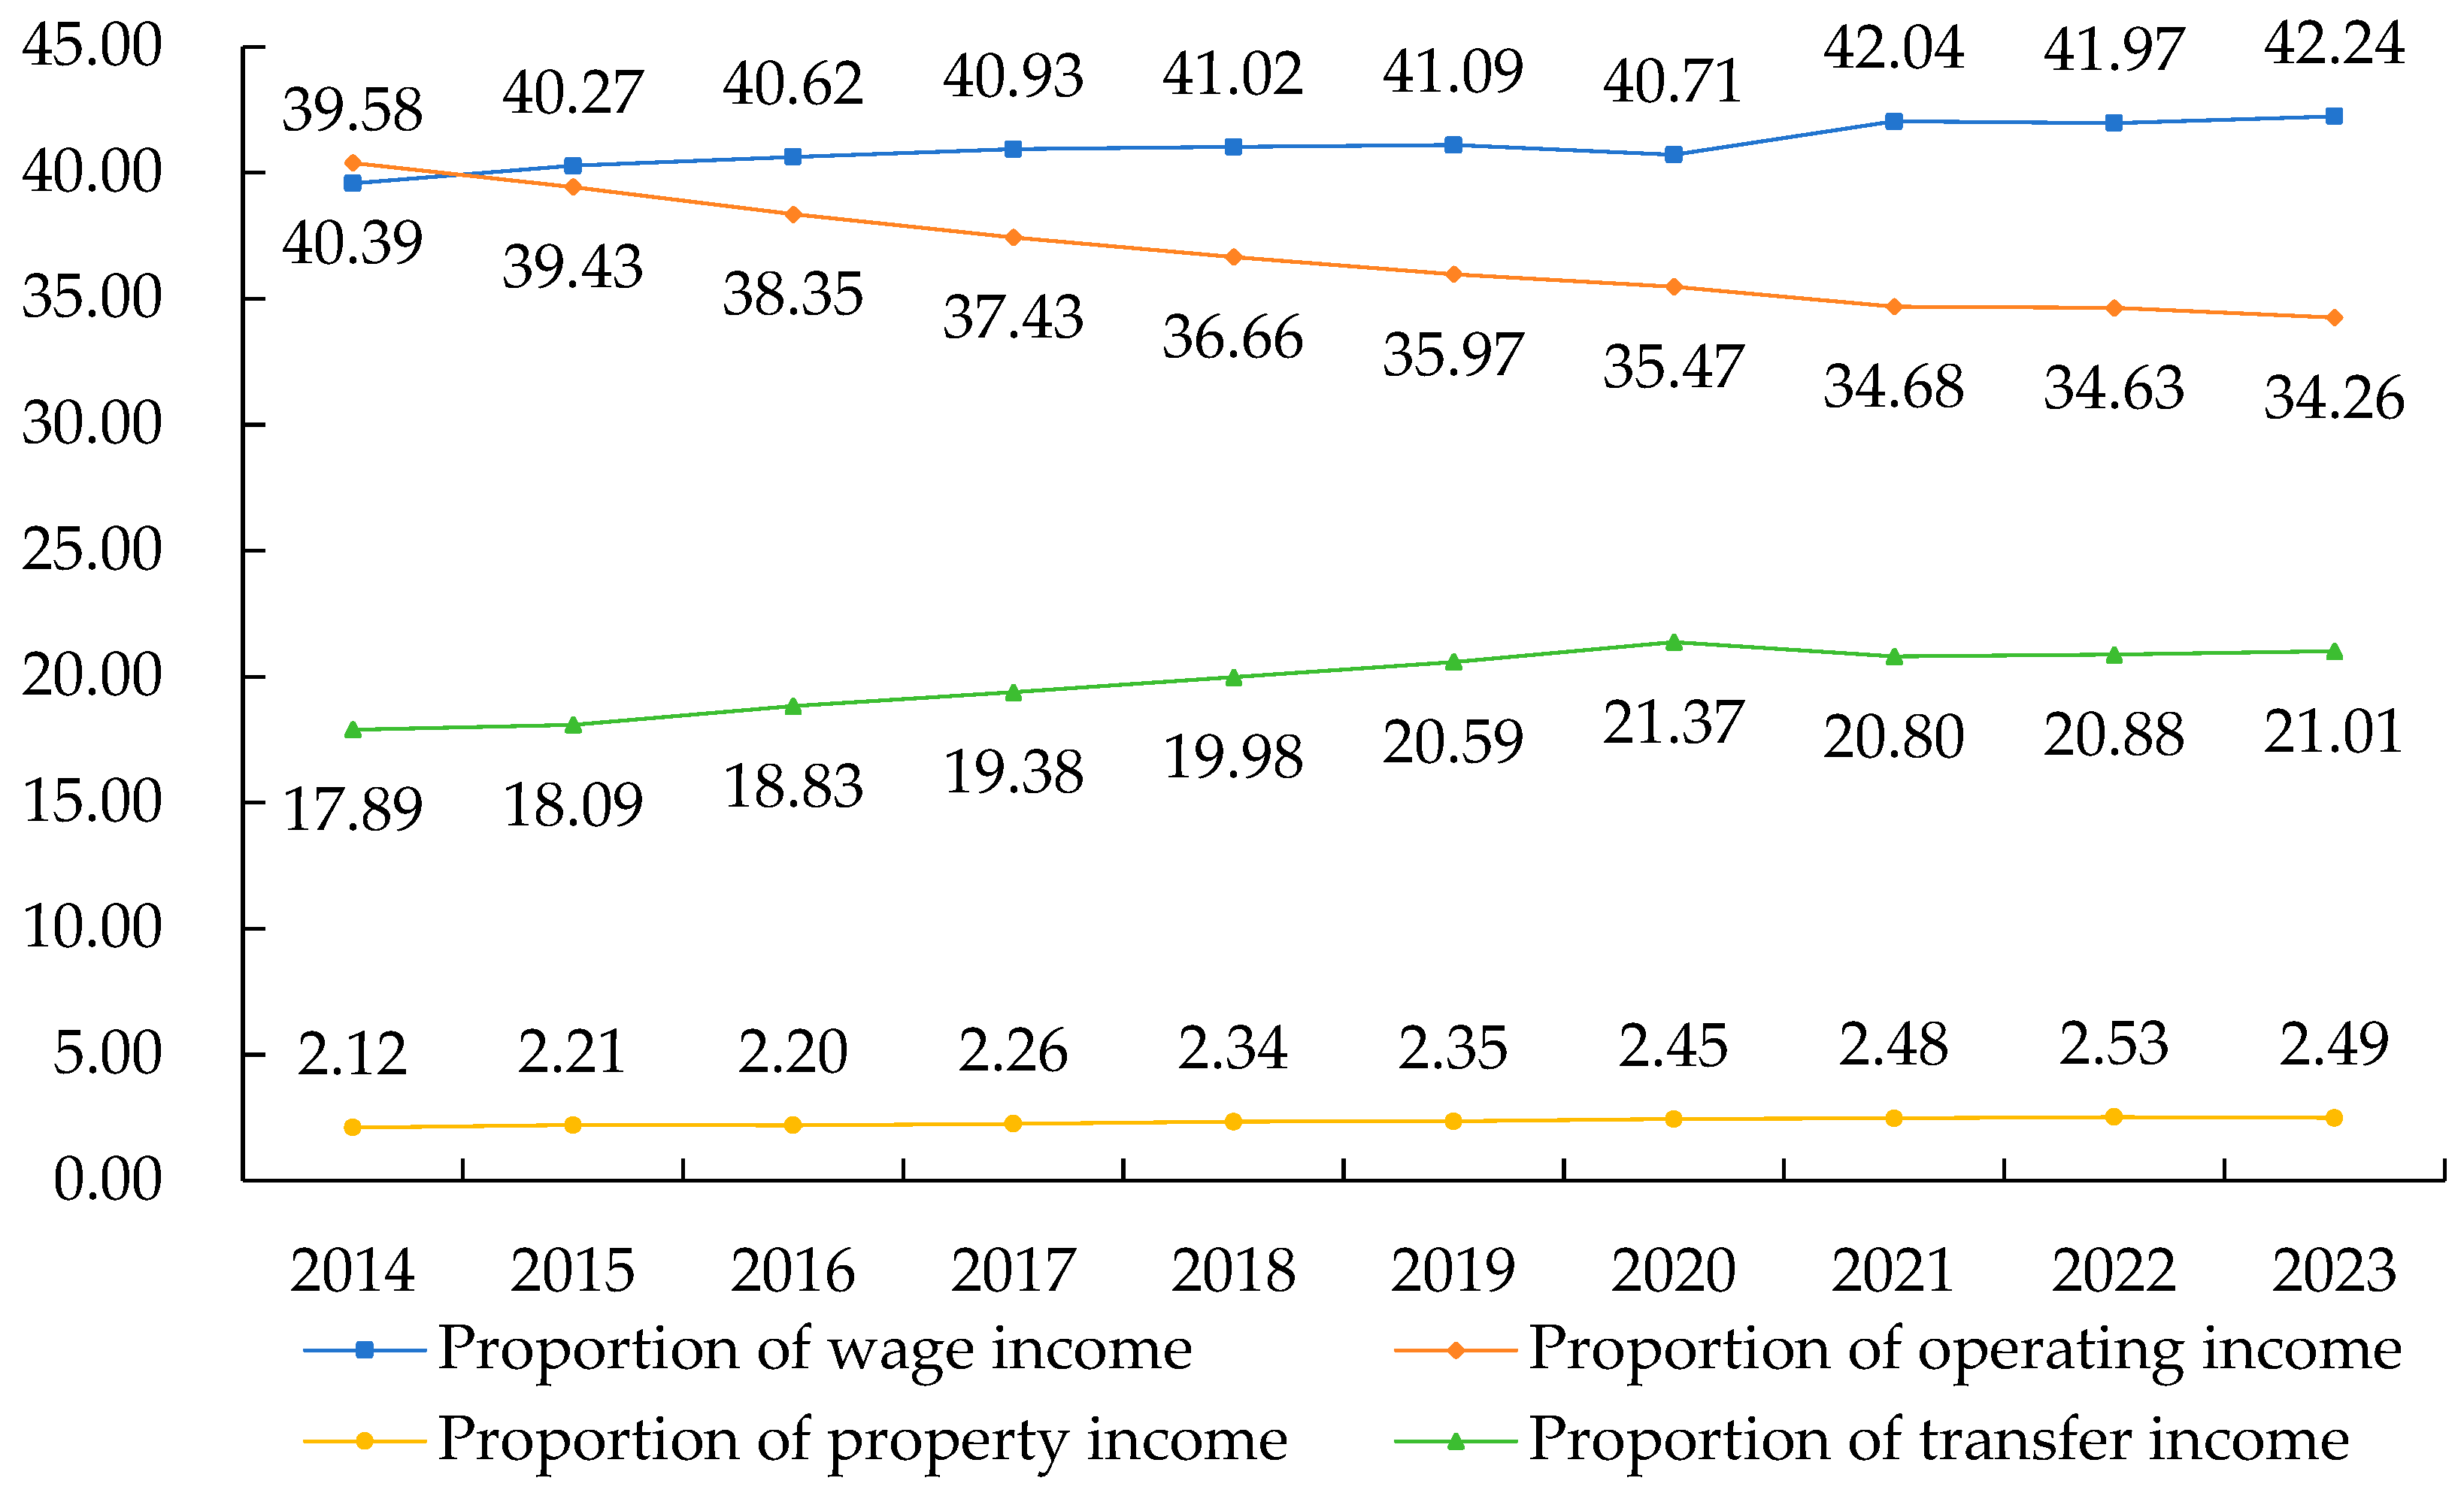
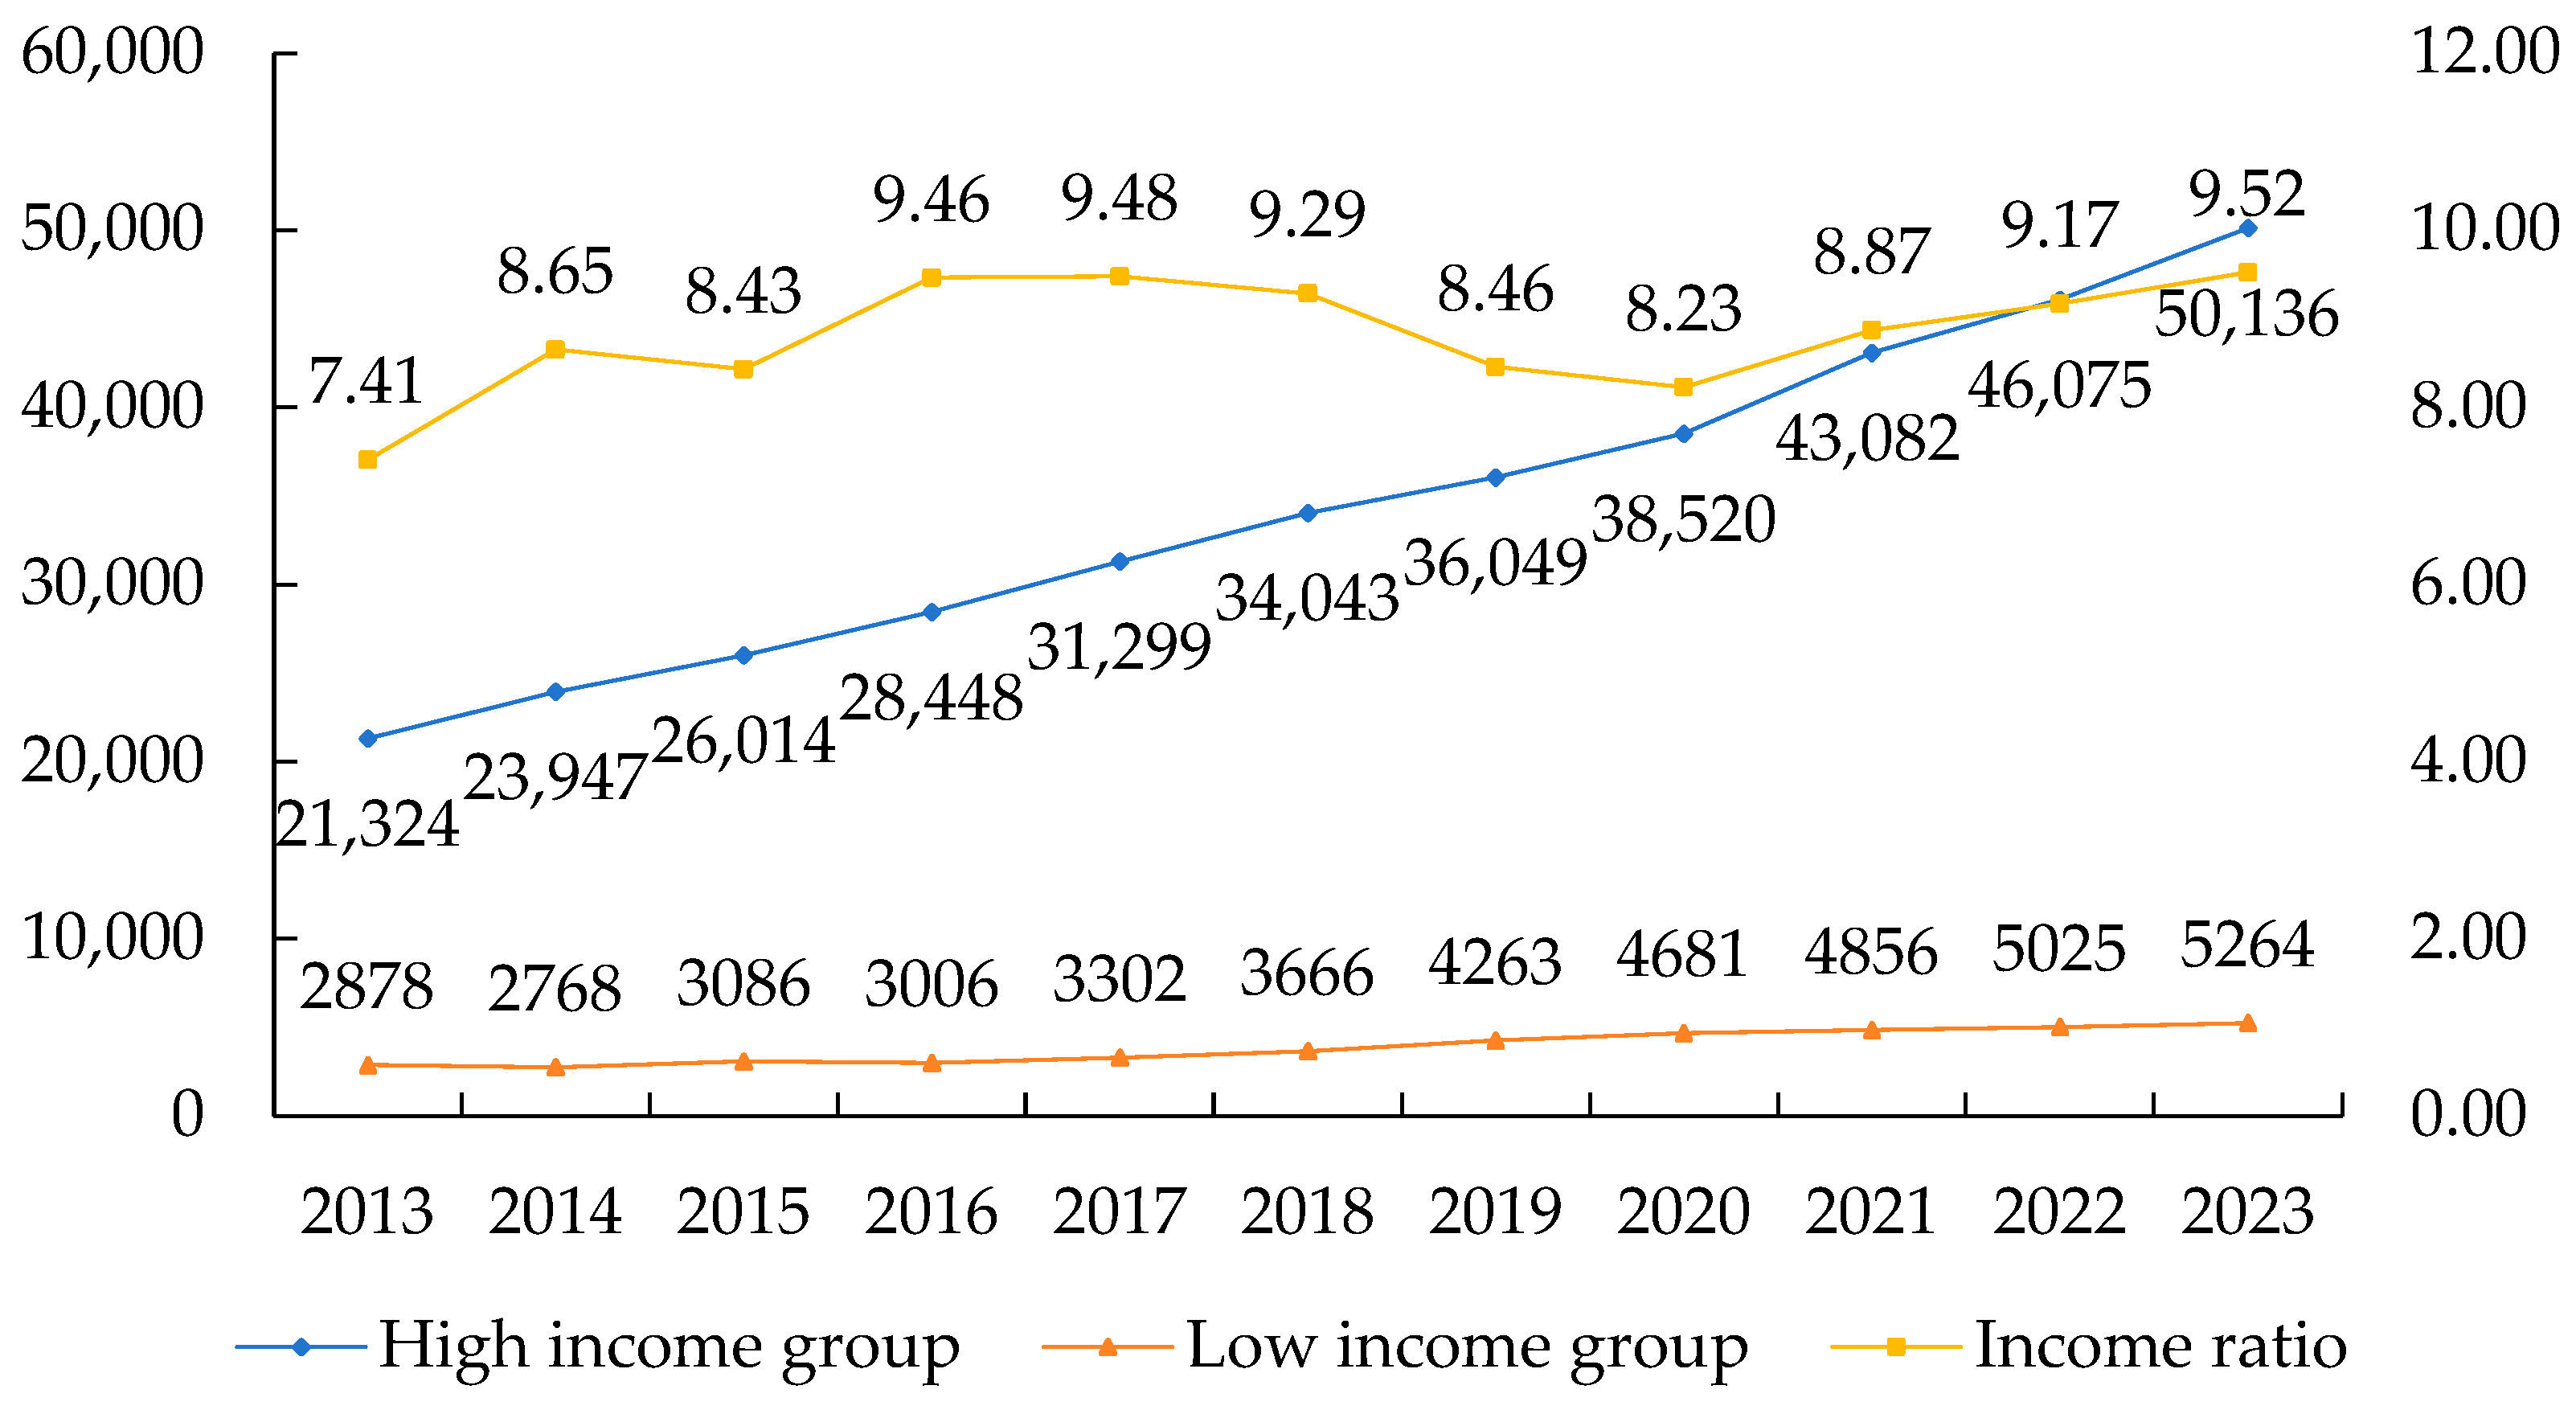
Second, the rural residents’ income structure remains skewed (Figure 2): wage and operating incomes consistently account for more than 70% of total income, whereas property income has long constituted below 3%, limiting wealth accumulation and inter-temporal income smoothing. Third, inequality within rural areas has intensified (Figure 3), with the income ratio between the highest and lowest rural quintiles increasing from 7.41 in 2013 to 9.52 in 2023. In the context of common prosperity and Chinese modernization, mitigating these interconnected income constraints has become a pressing policy priority.
Given China’s fundamental national condition of being a “large agricultural country with small-scale farming,” advancing agricultural modernization represents a vital pathway for raising rural residents’ income. On the one hand, limited arable land per capita means that Chinese agriculture remains predominantly small-scale and fragmented. Data from the Third National Agricultural Census show that around 210 million farming households operate plots smaller than 10 mu (approximately 0.67 ha), accounting for over 98% of all agricultural operators [4]. Promoting agricultural modernization can facilitate moderate-scale land transfer, mitigate land fragmentation, and realize economies of scale, thereby enabling rural households to earn higher returns from agriculture [5]. On the other hand, modernization-driven productivity improvements transform rural production relations, releasing a large surplus labor force from the land. This reallocation supports the shift of rural households into higher paying non-agricultural jobs, creating an additional channel for sustained income growth [6].
Existing research has mainly explored how agricultural technological progress, fiscal support, and rural financial development affect rural residents’ income [7,8,9]. However, relatively little attention has been paid to the role of agricultural industrial parks in shaping rural residents’ income, despite their growing recognition as a key vehicle for agricultural modernization and high-quality agricultural growth [10,11]. A significant portion of the existing literature, particularly in the Chinese context, is descriptive or policy-oriented, lacking rigorous causal inference on their income effects. In the international literature, while the role of agricultural clusters in rural development is acknowledged, comprehensive empirical evaluations that specifically quantify their impact on farm household income remain limited [12].
The mechanisms through which agricultural industrial parks or clusters influence rural incomes have been theorized and examined in various contexts. Studies suggest they can boost income by enhancing market access and value chain integration for smallholders, facilitating technology adoption and knowledge spillovers, and creating local off-farm employment opportunities [13]. Industrial parks have long played an important role in the economic and industrial development of high-income countries. It also known as industrial estates or business parks, are purposefully planned and managed geographic areas that provide integrated infrastructure, shared facilities, and a conducive policy environment to attract and concentrate firms, thereby fostering industrial clustering, innovation, and economic growth [14]. Notable examples include Silicon Valley in the United States, Tsukuba Science City in Japan, and the Cambridge Science Park in the United Kingdom. In the agricultural domain, empirical case studies from developing regions offer valuable insights. For instance, research on the integrated agro-industrial park in Ethiopia highlights its potential to increase smallholder farmers’ income by linking them to processors and export markets, though success heavily depends on supportive contract farming arrangements and infrastructure [15,16]. In contrast, agricultural industrial parks—a specialized variant focused on the agro-food sector—emerged later, arising in the late 19th and early 20th centuries in response to the Industrial Revolution and subsequent socio-economic transformations. These parks facilitated the rise of large-scale, concentrated agricultural enterprises [17,18].
By applying industrial principles and advanced technologies to agriculture, developed countries have modernized agricultural production and spurred the establishment of specialized agricultural industrial parks. However, the international literature also cautions that the benefits are not automatic. Evaluations of cluster programs in countries like Kenya point to challenges, including the risk of excluding the poorest farmers, exacerbating local inequalities, or creating enclaves with limited positive spillovers to the surrounding rural economy [19,20]. The continued evolution of agricultural industrial parks responds to growing demand for agricultural products, which increasingly depends on the adoption of new technologies, improved processing methods, and higher agricultural productivity [21].
Such parks typically bring together geographically clustered businesses within the same or related sectors, providing essential infrastructure—such as roads, electricity, communications, storage, packaging, wastewater treatment, logistics, and laboratory facilities—that supports production, processing, and sales. This concentration enables economies of scale, fosters industrial agglomeration, and stimulates regional economic development [22]. Methodologically, the most robust evidence on the causal impact of such place-based policies comes from studies employing quasi-experimental designs like the Difference-in-Differences (DID) method. While widely applied to evaluate general industrial parks in China [23,24], its rigorous application to assess the specific income effects of agricultural industrial parks, especially from a comparative international perspective, is an emerging and critical area for research. This gap underscores the contribution of the present study. In developed economies, agricultural industrial parks have matured into diverse models, including demonstration farms that promote advanced technologies, leisure farms that integrate agriculture with tourism, educational farms that offer learning experiences, and science parks dedicated to agricultural innovation [25].
Since the 1990s, the Chinese government has increasingly prioritized agricultural industrial parks as a strategy to transition from traditional to modern agriculture, raise rural incomes, and improve living standards. However, many early initiatives were constrained by a narrow focus on specific segments of agricultural value chains or on regional development, limiting their broader impact on rural economies and residents’ incomes. In contrast, the launch of the National Modern Agricultural Industrial Parks (NMAIP) program in March 2017 marked a shift toward a more integrated and sustainable approach to agricultural modernization. By August 2022, 250 NMAIPs had been established nationwide, underscoring the program’s strategic importance [10].
The existing literature on agricultural industrial parks primarily focuses on their theoretical frameworks, such as the formation models of agricultural industry organizations and their broader social effects [26]. Among the studies specifically addressing NMAIPs, topics include the effectiveness of park construction [25], the challenges associated with park development, and the influence of various construction models on park outcomes [27]. However, empirical research directly investigating how NMAIP construction influences rural residents’ income remains sparse. This study aims to fill this gap by analyzing the impact of NMAIP development on rural residents’ income using county and household-level panel data from 2014 to 2022 and employing a staggered DID model.
This paper makes three main contributions to the literature. First, it introduces a new perspective by identifying and empirically analyzing multiple channels through which rural residents’ income is influenced. While prior studies have emphasized the direct role of rural industrial integration and agricultural clustering on income growth [28,29,30,31,32,33,34], less attention has been paid to the specific function of NMAIP. Our findings reveal that NMAIP construction not only directly raises rural residents’ incomes but also does so indirectly by expanding employment, stimulating technological innovation, and attracting capital inflows. This multi-dimensional analysis fills an important gap in the literature and clarifies the broader economic effects of NMAIP development.
Second, by leveraging the establishment of NMAIP as an exogenous policy shock, this study provides a rigorous empirical examination of their specific impact on rural residents’ income, mitigating endogeneity concerns common in traditional quantitative analyses. The relationship between agricultural industrial park construction and income is often bidirectional: income growth can spur park development, while parks can, in turn, accelerate income growth [35,36]. To address this simultaneity, we treat NMAIP construction as a quasi-natural experiment and apply a staggered DID model to identify the causal effect of NMAIP on income. This methodology enhances the reliability of our findings and offers robust evidence for evaluating NMAIP policy effectiveness.
Finally, this study enriches understanding of the economic impacts of agricultural industrial parks, particularly within China’s unique socio-economic context. The effectiveness of such parks varies across regions due to differences in construction models, industrial features, and resource allocation [10,21], yet existing research has largely overlooked this heterogeneity. Our study categorizes park types and examines how the income effects of NMAIP construction vary according to local agricultural conditions. This nuanced analysis provides a theoretical basis for local governments to design more targeted agricultural policies and offers practical insights for optimizing the development strategies of agricultural industrial parks.

2. Policy Background and Theoretical Mechanisms

2.1. The NMAIP Policy

Beginning in the 1990s, China has pursued the development of agricultural industrial parks as a strategic measure to modernize traditional agriculture and raise rural incomes through industrial chain extension. Over time, these initiatives have evolved into a multi-level and diversified system, culminating in the establishment of NMAIP—distinguished by their well-defined objectives and distinctive characteristics. Unlike earlier models, NMAIPs emphasize integrated production systems and industrial chain elongation, aiming to deepen the convergence of agriculture with secondary and tertiary industries. This integrated approach is designed to strengthen the sector’s market competitiveness and vitality through cross-sectoral linkages [21].
In 2017, the Chinese government elevated NMAIP development to a national priority through its No. 1 Central Document, which called for accelerated park construction [37]. This policy commitment was reinforced by a series of directives issued by the State Council and relevant ministries, underscoring the need to comprehensively integrate primary, secondary, and tertiary industries in rural areas. A key milestone was the Notice on the Creation of National Modern Agricultural Industrial Parks, jointly released in March 2017 by the Ministry of Agriculture and Rural Affairs (MARA) and the Ministry of Finance (MOF) [38]. This document delineated the objectives, tasks, and selection criteria for NMAIPs and introduced a competitive application process to incentivize local governments. The resulting policy framework established strong institutional support for park construction, ensuring that agricultural restructuring and rural economic transformation were underpinned by robust governmental backing [10].
The policy sets stringent standards for NMAIP approval, prioritizing quality over quantity. Approved parks become eligible for financial support under a “rewards-in-lieu-of-subsidies” mechanism, which encourages efficient and sustainable resource use. Parks that fail to meet performance benchmarks risk disqualification and the withdrawal of government funding. This reward-penalty system motivates local governments to pursue sustainable park development and quality improvement, rather than short-term expansion.
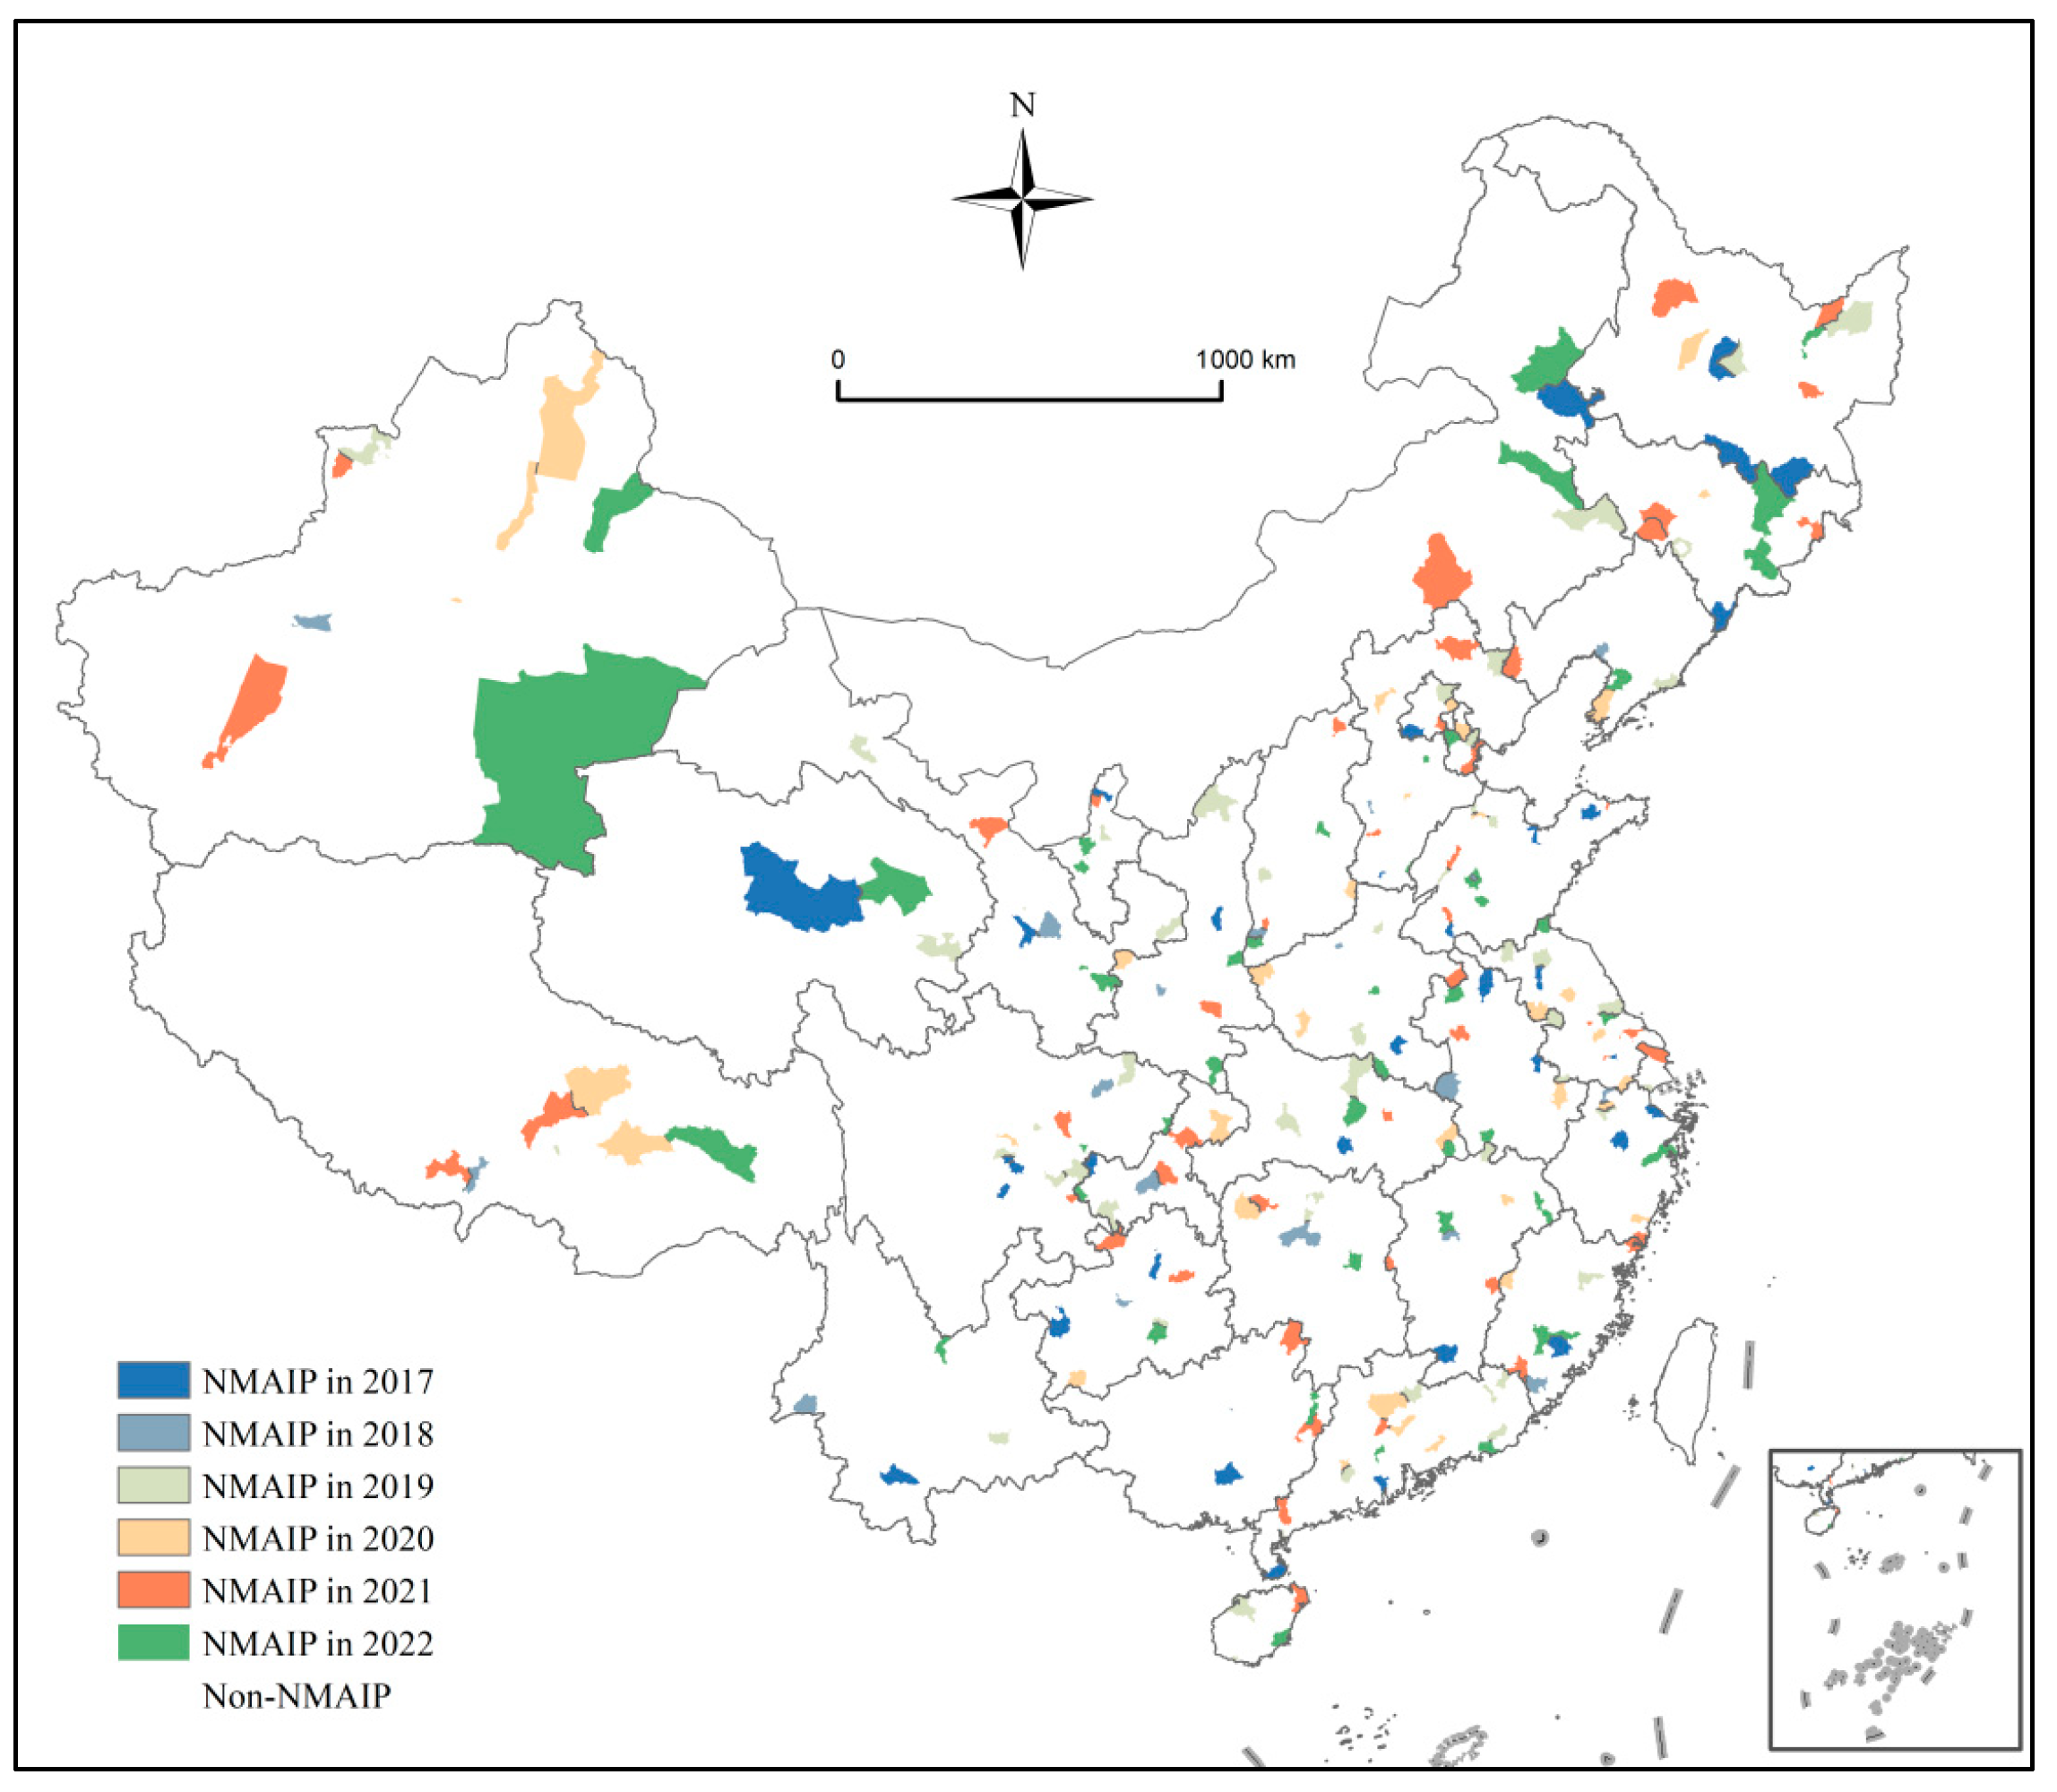
Between 2017 and August 2022, China launched seven batches of NMAIPs, approving 250 parks in total. As the program has expanded, these parks have become instrumental in driving rural economic transformation, enhancing agricultural productivity, and raising rural households’ income. The temporal and spatial distribution of NMAIPs, illustrated in Table 1 and Figure 4, reflects the growing scale and geographical spread of the initiative. By fostering stronger inter-industry linkages and supporting rural revitalization goals, NMAIP construction has not only advanced agricultural integration but also played a pivotal role in strengthening the economic foundation of rural areas and improving residents’ livelihoods.

2.2. Theoretical Mechanisms

2.2.1. Employment Expansion

Traditional agriculture is often characterized by seasonality, which leads to unstable income streams for rural residents. To supplement their earnings during off-seasons, many seek non-agricultural employment [39]. The development of NMAIPs has transformed this dynamic by modernizing production systems and stimulating the broader rural economy. Empirical evidence confirms that such place-based agricultural interventions drive income growth by fostering industrial integration and structural transformation. A rigorous evaluation of China’s Specialty Agricultural Products Advantageous Zones (AZs) revealed that the policy acts as a catalyst for broadening rural economic opportunities. It significantly increases the number of new agricultural operating entities participating in industrial integration, value chain extension, and multifunctional expansion. This shift from simple production to diversified, high-value-added economic activities within the agricultural sector itself creates diverse employment pathways and enhances rural residents’ income [40]. Through industrial clustering and technological innovation, NMAIPs create diverse employment opportunities, thereby significantly raising rural residents’ income [31,41]. For instance, studies using multi-period DID models have found that NMAIP construction effectively increases farmers’ total income, wage income, and operating net income, with the effect being persistent and lagged [42]. This underscores the employment and income effects of industrial agglomeration.
First, NMAIPs leverage agglomeration effects to achieve economies of scale and specialization. The integration of agriculture with related industries improves production efficiency and optimizes the allocation of rural factors of production through technology diffusion [29]. This not only enhances agricultural productivity and reduces labor intensity but also frees up rural labor to engage in non-agricultural sectors, diversifying household income sources. For example, the adoption of modern agricultural technologies reduces the labor required for farming, redirecting workers to emerging sectors within the parks—such as food processing, services, and logistics. This shift not only alleviates agricultural burdens but also raises overall income levels. Technological progress and industrial upgrading thus broaden employment options and stimulate further income growth.
Second, NMAIP construction facilitates the development of integrated agricultural value chains, expanding rural industries and creating diverse jobs that attract workers with varying skills and resources [43]. Research on rural industrial convergence in China has empirically shown that industrial agglomeration significantly promotes farmers’ income growth, with urbanization serving as a key mediating and threshold variable in this process [44]. Rural residents can participate in different segments of the value chain—from production and processing to logistics and sales—according to their competencies. Concretely, the value-chain employment system typically operates as an interconnected sequence of tasks and firms. Upstream, parks promote standardized production through contract farming, cooperatives, or enterprise-led bases, generating jobs in seedling cultivation, input supply, machinery operation, pest control, and on-farm technical services. Midstream, as raw products enter aggregation and processing, NMAIPs create positions in sorting, grading, cleaning, cold storage, primary processing, deep processing, quality inspection, packaging, and by-product utilization. Downstream, the expansion of circulation capacity produces employment in cold-chain transport, warehousing, distribution, order management, digital traceability, brand marketing, and retail channels, including community group buying and e-commerce operations. These segments are linked through standardized procurement and service outsourcing: smallholders may supply products, local workers may be hired by processing firms, and specialized service teams may provide machinery and technical support across multiple villages, forming a dense local labor market around the park.
This chain matters because it creates layered employment ladders rather than a single type of job. Low-skill workers can enter through seasonal harvesting, sorting, or packaging, while semi-skilled workers can transition into machinery operation, warehouse management, or quality control after short training. More skilled workers can access roles in food safety management, digital operations, product design, and marketing. In this way, NMAIPs convert agricultural seasonality into more stable year-round labor demand by distributing work across production, processing, and circulation phases, reducing income volatility for rural households. Moreover, value-chain integration raises the local value-added share captured within the county: instead of exporting raw agricultural products and importing processed goods and services, rural areas retain more processing and service activities locally, which increases wage income opportunities and strengthens the resilience of rural employment to price shocks. Through industrial integration and value chain development, rural workers gain access to employment in agricultural services and manufacturing, substantially improving household income [32].
Finally, NMAIPs serve as platforms for entrepreneurship, particularly for youth and returning migrants [45]. Beyond creating jobs, the parks function as business incubators, providing advanced technologies, financial support, and professional training to help entrepreneurs scale their ventures efficiently. The co-location of upstream and downstream industries within the parks reduces startup costs, mitigates market risks, and strengthens competitiveness [46]. Industrial integration also forges stronger linkages between production, processing, and marketing, creating a synergistic ecosystem. Through collaboration, rural entrepreneurs can pool resources, lower operational costs, and expand market share [47]. These clustering effects enable participants to leverage collective resources, realize mutual gains, and access improved entrepreneurial opportunities. However, the international literature also offers a critical perspective, suggesting that the net employment effect of large-scale agro-industrial projects should be carefully evaluated against potential job displacement in pre-existing family farming systems [48]. This highlights the importance of inclusive park design. Accordingly, we propose:
Hypothesis 1.
NMAIP construction expands employment opportunities for rural residents and significantly raises their income.

2.2.2. Technological Progress

As a cornerstone of agricultural modernization, NMAIP construction plays a critical role in advancing agricultural technology and raising rural incomes [49]. In the context of supply-side agricultural reforms, NMAIPs have become key platforms for innovation, aggregating essential production factors—including land, capital, technology, talent, and information. Empirical studies from comparable settings support this view. For instance, an analysis of the Shouguang vegetable cluster in Shandong, China, demonstrated that local enterprise networks and global linkages within an agricultural cluster serve as crucial channels for innovation diffusion and resource absorption, significantly promoting cluster-wide innovation [50]. Through multiple mechanisms, these parks facilitate technological advancement and contribute to rural residents’ income growth [11].
First, NMAIPs promote technological progress by attracting and concentrating advanced production factors. As hubs for agricultural resources, they bring together firms and industries, generating economies of scale while introducing modern technologies and management practices. This agglomeration enables enterprises within the parks to implement technological innovations more effectively and accelerates the adoption of advanced agricultural technologies [51]. Specialization and collaboration among park enterprises help concentrate and refine innovations at each production stage, improving the overall efficiency of technological progress. This cluster-based innovation model optimizes resource allocation and facilitates deeper technological breakthroughs, providing strong support for systemic advances in agriculture.
Moreover, NMAIPs function as vital platforms for agricultural research and development (R&D) and innovation, offering centralized environments for the application and transformation of research outcomes [52]. They foster close partnerships among universities, research institutes, and agricultural enterprises, bridging the gap between research and practice. Such collaborations not only accelerate the development of new technologies but also promote the dissemination of innovative varieties, equipment, and methods, leading to fundamental changes in agricultural production. Through cross-sector cooperation, the parks provide rural residents with training and skill-building opportunities, enabling them to master modern agricultural technologies and enhance the technical content of their production activities.
In addition, NMAIPs generate significant technology spillover effects, raising the agricultural skill levels of rural residents [53]. Research on scientific and technological innovation in agriculture has quantified such spatial spillovers, finding that innovation effects have a significant impact within a radius of approximately 420 kilometers, following an inverted U-shaped pattern [54]. This provides empirical support for the geographical reach of technology diffusion from innovation hubs like NMAIPs. Advanced technologies and management practices adopted within the parks benefit not only park-based enterprises but also spread to surrounding areas through demonstration and imitation. As rural residents learn and apply these improved methods, they achieve higher productivity [55]. This process enhances production efficiency and strengthens market competitiveness, thereby contributing to income growth. Mechanism analyses further indicate that agricultural industrial upgrading is a key pathway through which scientific and technological innovation influences local high-quality agricultural development [54]. Based on this reasoning, we propose:
Hypothesis 2.
NMAIP construction promotes technological progress, which in turn drives stable growth in rural residents’ income.

2.2.3. Capital Inflows

Imbalances in capital supply and demand have long constrained rural economic development and income growth in China. As a top-down policy initiative, NMAIPs offer an effective channel for directing diverse forms of capital into rural areas, demonstrating strong advantages in capital attraction [56]. This capital inflow is intrinsically linked to and facilitates industrial agglomeration—the geographic concentration of interconnected businesses. Empirical research confirms that industrial agglomeration itself is a significant driver of rural income growth. For example, a study on Jiangsu Province found that the development of primary and secondary industries effectively suppressed the widening of the urban–rural income gap, though the impact exhibited regional heterogeneity [57].
In terms of fiscal capital, since the program’s launch in 2017, the central government has allocated over 20 billion yuan in rewards and subsidies, supporting 300 NMAIPs. This national designation also incentivizes local governments to increase fiscal support for regional modern agricultural industrial parks, substantially alleviating rural capital shortages. Importantly, fiscal funds play a catalytic role, leveraging additional inflows of social capital.
Specifically, NMAIPs use fiscal instruments—such as subsidies, tax incentives, and performance-based rewards—to attract agribusinesses and new agricultural operators. The clustering of these entities naturally channels capital, technology, and talent into rural areas. Thus, the parks use public agricultural spending as a multiplier to mobilize large-scale social capital investment. Beyond social capital, NMAIPs also improve access to financial capital. Historically, agricultural investment has been limited by high risks, low returns, and structural constraints, leading financial institutions to favor non-agricultural sectors. NMAIPs create new opportunities to reorient financial resources toward the “Sannong” (agriculture, rural areas, and farmers). Policy support strengthens loan subsidy mechanisms for park operators, encouraging financial institutions to expand rural credit supply. Moreover, as emerging growth poles with significant economic returns, the parks positively influence financial institutions’ perceptions of Sannong-related investments, attracting commercial funding into all aspects of park development.
Capital inflows profoundly reshape the structure of rural residents’ income [46,58,59]. For operational income, capital enables technological innovation, raising productivity and facilitating the transition from smallholder farming to large-scale, specialized, and standardized production. For wage income, capital accumulation expands rural industries, creating more local non-agricultural jobs [30]. This generates a labor reservoir effect, absorbing surplus agricultural labor and raising local wages through increased demand. For property income, two pathways are evident: capital concentration and scale operations promote land transfers, allowing farmers to earn rental income, while strengthened rural collective economies indirectly augment residents’ property-based earnings [60,61]. The synergy between capital and agglomeration is further evidenced by research showing that NMAIP construction promotes rural common prosperity not only by improving agricultural total factor productivity but also by facilitating the transfer of employment from the primary to the tertiary sector [62].
Hypothesis 3.
NMAIP construction attracts capital inflows, which significantly contribute to rural residents’ income.

3. Research Design

3.1. Data Sources

This study draws on a comprehensive county-level panel dataset spanning 2014 to 2022, covering 2423 counties across 27 provinces in China. The use of county-level panel data to evaluate regional development policies in China is well established in the literature, as counties represent a critical administrative unit for policy implementation and economic data reporting [63]. The resulting dataset is unbalanced in structure. To ensure comparability and consistency over time, key economic variables—including rural residents’ per capita disposable income and country’s gross domestic product (GDP)—were adjusted for inflation using the consumer price index (CPI), thereby enabling cross-year analysis at constant prices. Geographic distances from each county’s administrative center to the nearest provincial capital and major coastal port were computed in R based on geographic coordinates, with port locations sourced from China’s National Coastal Port Layout Plan. All continuous variables were winsorized at the 1% level to mitigate the influence of extreme values and enhance the robustness of the empirical analysis, a common practice in applied econometric studies [64]. The list of NMAIPs was compiled from official announcements published by the MARA. Other socio-economic and county-level variables were directly extracted from the China County Statistical Yearbook for the corresponding years, a principal and widely used data source in research on China’s regional economy.

3.2. Variable Selection

3.2.1. Dependent Variable

The dependent variable, rural residents’ income (RRI), is measured as rural residents’ per capita disposable income. To ensure cross-year comparability, all income values are adjusted for inflation using the CPI, with 2014 serving as the base year. This measure is the standard metric for assessing rural welfare and the primary outcome variable in studies evaluating the impact of rural development policies in China [65].

3.2.2. Core Independent Variable

The construction of NMAIP serves as the core independent variable. Following a staggered DID design, the variable is assigned a value of 1 for counties in the year an NMAIP is established and for all subsequent years, and 0 otherwise. This binary, time-varying treatment indicator construction is the conventional approach for evaluating staggered policy interventions in a DID framework [66].

3.2.3. Control Variables

This study incorporates a set of control variables, selected based on existing literature [7,8,9], to strengthen the model’s explanatory power and account for potential confounding factors affecting rural residents’ income. The selection is informed by established models of regional income determination.
First, we control for county-level economic development (per capita GDP), a fundamental determinant of income levels in regional studies. Fixed asset investment is also included, given that infrastructure enhancement and business investments can stimulate regional economic vitality, create employment, and thereby raise household incomes. The role of public and private investment in driving rural income growth is well documented [67]. Financial development constitutes another key control variable, since a robust financial system improves access to capital, facilitating both business operations and individual economic activities that contribute to income growth [68].
Additionally, local fiscal revenue serves as an indicator of governmental financial capacity. Higher fiscal revenue generally enables better public services and infrastructure spending, which may further promote economic development and income growth. Industrial structure is incorporated due to its significant role in shaping regional economic trajectories and income distribution. Human capital, reflected in educational attainment, is also controlled for, as a more skilled workforce tends to drive economic development and income growth.
We further account for the level of information technology, which enhances productivity, optimizes resource allocation, and elevates living standards in modern economies—all of which may influence rural residents’ income. Finally, public service provision and population density are included. Improved public services can raise living standards and expand economic opportunities, while population density may affect both resource allocation and the extent of income inequality.

3.2.4. Mechanism Variables

This paper analyzes the channels through which NMAIP construction affects rural residents’ income via factor allocation, focusing on employment expansion, technological progress, and capital inflows. The investigation of these specific mechanisms is motivated by both theoretical frameworks on agricultural transformation and prior empirical findings on place-based policies [40]. For each mechanism, we employ specific measures: the employment rate and business startup activity capture employment expansion. New business registration is a commonly used proxy for entrepreneurial dynamism and job creation in local economies [69]. Technological progress is assessed by agricultural production efficiency—a key driver of modern agriculture and income growth—and the number of patents granted, which directly reflects innovation activity [70].
For capital inflows, we use total tax revenue and per capita retail sales of consumer goods as proxy indicators. Conceptually, capital inflows associated with NMAIP construction (including new firm entry, expansion of incumbent firms, and upstream-downstream clustering) should enlarge the local tax base through increases in value-added tax, corporate income tax, and other local fiscal revenues, making total tax revenue a plausible outcome-based signal of an expanded scale of economic activity and capital deployment. Compared with directly observing capital flows (which are typically unavailable at the county level), total tax revenue provides a comprehensive and timely measure that aggregates firm production, transactions, and investment-related activity that is likely to rise when external capital and industrial projects locate in the park and surrounding areas. The use of local tax revenue as a proxy for economic activity and investment scale has precedent in studies of industrial zones and regional development [71]. In parallel, higher capital availability and business density can relax liquidity constraints and improve market access, which should translate into stronger local demand; therefore, per capita retail sales of consumer goods are used to reflect the consumption-side manifestation of capital-driven market expansion and improved circulation capacity [72].
At the same time, these proxies have limitations that warrant caution. First, total tax revenue does not exclusively measure “capital inflows”: it may also increase due to tax policy adjustments, changes in collection intensity, or shifts in industrial structure unrelated to new capital entering the county. Second, because tax revenue reflects realized economic activity rather than the direction of funding sources, it captures the scale effect of capital utilization more than the pure inflow of external investment. Third, retail sales may be influenced by population mobility, e-commerce substitution, or consumption preferences, and thus may not map one-to-one into local capital inflows. Accordingly, our mechanism interpretation emphasizes that these variables capture the local economic expansion and market activation consistent with capital agglomeration around NMAIPs, rather than a direct accounting measure of financial capital flows.
All variables are defined and summarized in Table 2.

3.2.5. Descriptive Analysis

Table 2 provides descriptive statistics that help interpret the empirical context and the magnitude of key variables. Panel A shows that the average real rural disposable income is 1.527 (in 10,000 yuan), with substantial dispersion, indicating meaningful cross-county and over-time variation to be explained. The mean of the treatment indicator implies that NMAIP county-years account for about 2.9% of all county-year observations in the 2014–2022 panel, which is consistent with the policy’s phased rollout and the fact that only a subset of counties receive national-level designation during our sample window.
Panel B suggests considerable heterogeneity in county fundamentals. For example, the variation in logged per capita GDP and infrastructure investment intensity indicates that counties differ markedly in development level and investment environment, reinforcing the need to control for time-varying local conditions. The industrial structure variable (primary industry share) also varies widely, reflecting differences in agricultural dependence that may shape both baseline income levels and the responsiveness to NMAIP construction.
Panel C summarizes the mechanism proxies and clarifies sample availability. Employment scale and agricultural productivity are observed for nearly the full panel, whereas entrepreneurial activity, tax revenue, and patent licenses have smaller sample sizes due to data coverage limitations in administrative or statistical reporting. This implies that some mechanism regressions are estimated on reduced samples, and those results should be interpreted as supportive evidence rather than as perfectly comparable estimates to the full-sample baseline. Overall, the descriptive patterns in Table 2 confirm that the dataset contains substantial variation in outcomes, policy exposure, and local covariates, providing a suitable basis for the staggered DID identification strategy.

3.3. Empirical Strategy

To identify the causal effect of NMAIPs on rural residents’ income, this study exploits the staggered rollout of NMAIP establishment as a quasi-natural experiment [73]. We employ a staggered DID design, which compares income trends between counties that received the policy treatment (i.e., NMAIP establishment) at different times and those that never received it. The DID framework is the predominant method for evaluating the causal impact of place-based policies in settings where treatment assignment is not random but varies across units and time [74].
This empirical strategy is particularly suitable for our study area and sample of Chinese counties for three reasons. First, NMAIPs are implemented as a nationally standardized program, but their establishment occurs at different points in time across counties due to administrative approval cycles, local project readiness, and phased policy rollout. This generates substantial within-county policy variation over 2014 to 2022, allowing us to leverage pre- and post-establishment changes in the same county rather than relying only on cross-sectional differences. This staggered adoption pattern is precisely the setting for which modern staggered DID estimators were developed [75]. Second, counties constitute the core administrative and economic unit for rural development policy implementation in China: key outcomes such as rural residents’ income, industrial park construction, land use coordination, and fiscal support are largely organized and reported at the county level. Therefore, applying a county-level panel DID framework directly matches the policy’s operational scale and the level at which outcomes and covariates are observed. Numerous studies evaluating China’s regional policies, including those on agricultural demonstration zones and specialty zones, employ county-level DID designs for this reason [40]. Third, the sample includes both treated and never-treated counties within the same national institutional environment, which helps ensure that the treated and control groups are comparable in terms of macro policy context, while county fixed effects further absorb time-invariant regional characteristics such as geography, historical development paths, and baseline agricultural endowments. The use of fixed effects to control for unobserved heterogeneity is standard in panel data policy evaluation [76].
The baseline specification is given by the following equation:
R R I i , t = α 0 + α 1 N M A I P i , t + α n X i , t + μ i + δ t + ε i , t
In this model, RRIi,t denotes the per capita disposable income of rural residents in county i and year t. NMAIPi,t is a binary treatment variable that equals 1 if county i has established an NMAIP in or after year t, and 0 otherwise. The coefficient α1 is the key parameter of interest, capturing the average effect of NMAIP construction on rural residents’ income. The vector Xi,t includes a set of time-varying control variables, with αn representing their corresponding coefficients. We also include county fixed effects (μi) to account for time-invariant county-level heterogeneity, and year fixed effects (δt) to control for common temporal shocks. The idiosyncratic error term is denoted by εi,t.

4. Results

4.1. Baseline Regression

Table 3 reports the baseline regression estimates of the impact of NMAIP construction on rural residents’ income. Column (1) presents a parsimonious specification that includes only county and year fixed effects. The coefficient on the NMAIP variable is positive and statistically significant at the 1% level, providing preliminary evidence that the establishment of NMAIP is associated with higher rural residents’ income.
To address potential omitted variable bias and improve the robustness of the estimates, we progressively incorporate additional control variables in Columns (2) to (4). The estimated coefficient of NMAIP remains positive and statistically significant across all specifications, reinforcing the finding that NMAIP development contributes to rural residents’ income growth.
In the fully saturated model (Column (4)), the coefficient on the core independent variable is 0.028 and significant at the 1% level. Given that the sample average of rural residents’ income (in 10,000 yuan) is 1.527 (Table 2), this estimate implies that counties with NMAIPs exhibit, on average, approximately 1.83% higher rural residents’ income than those without such parks.
Notably, GDP enters with a statistically significant negative coefficient in Columns (2) to (4). This result should be interpreted with caution and does not imply that economic growth mechanically reduces rural residents’ income. Under county and year fixed effects, the GDP coefficient reflects within-county changes over time after netting out common shocks and time-invariant county characteristics, and it is estimated conditional on a rich set of covariates (e.g., fiscal revenue, financial development, industrial structure, population density). In this setting, a negative partial correlation may arise when increases in county GDP are primarily driven by non-agricultural expansion and rapid urbanization, which can be accompanied by land conversion, rising local costs, and a reallocation of labor away from agriculture, potentially compressing agricultural operating income for remaining rural households and changing the composition of the rural population.

4.2. Robustness Tests

4.2.1. Parallel Trend Test

The validity of the staggered DID estimator hinges on the parallel trends assumption, which requires that treatment and control groups would have followed similar trajectories in the absence of an intervention. In our setting, this implies that rural residents’ income in counties with and without NMAIPs should exhibit comparable trends prior to policy implementation.
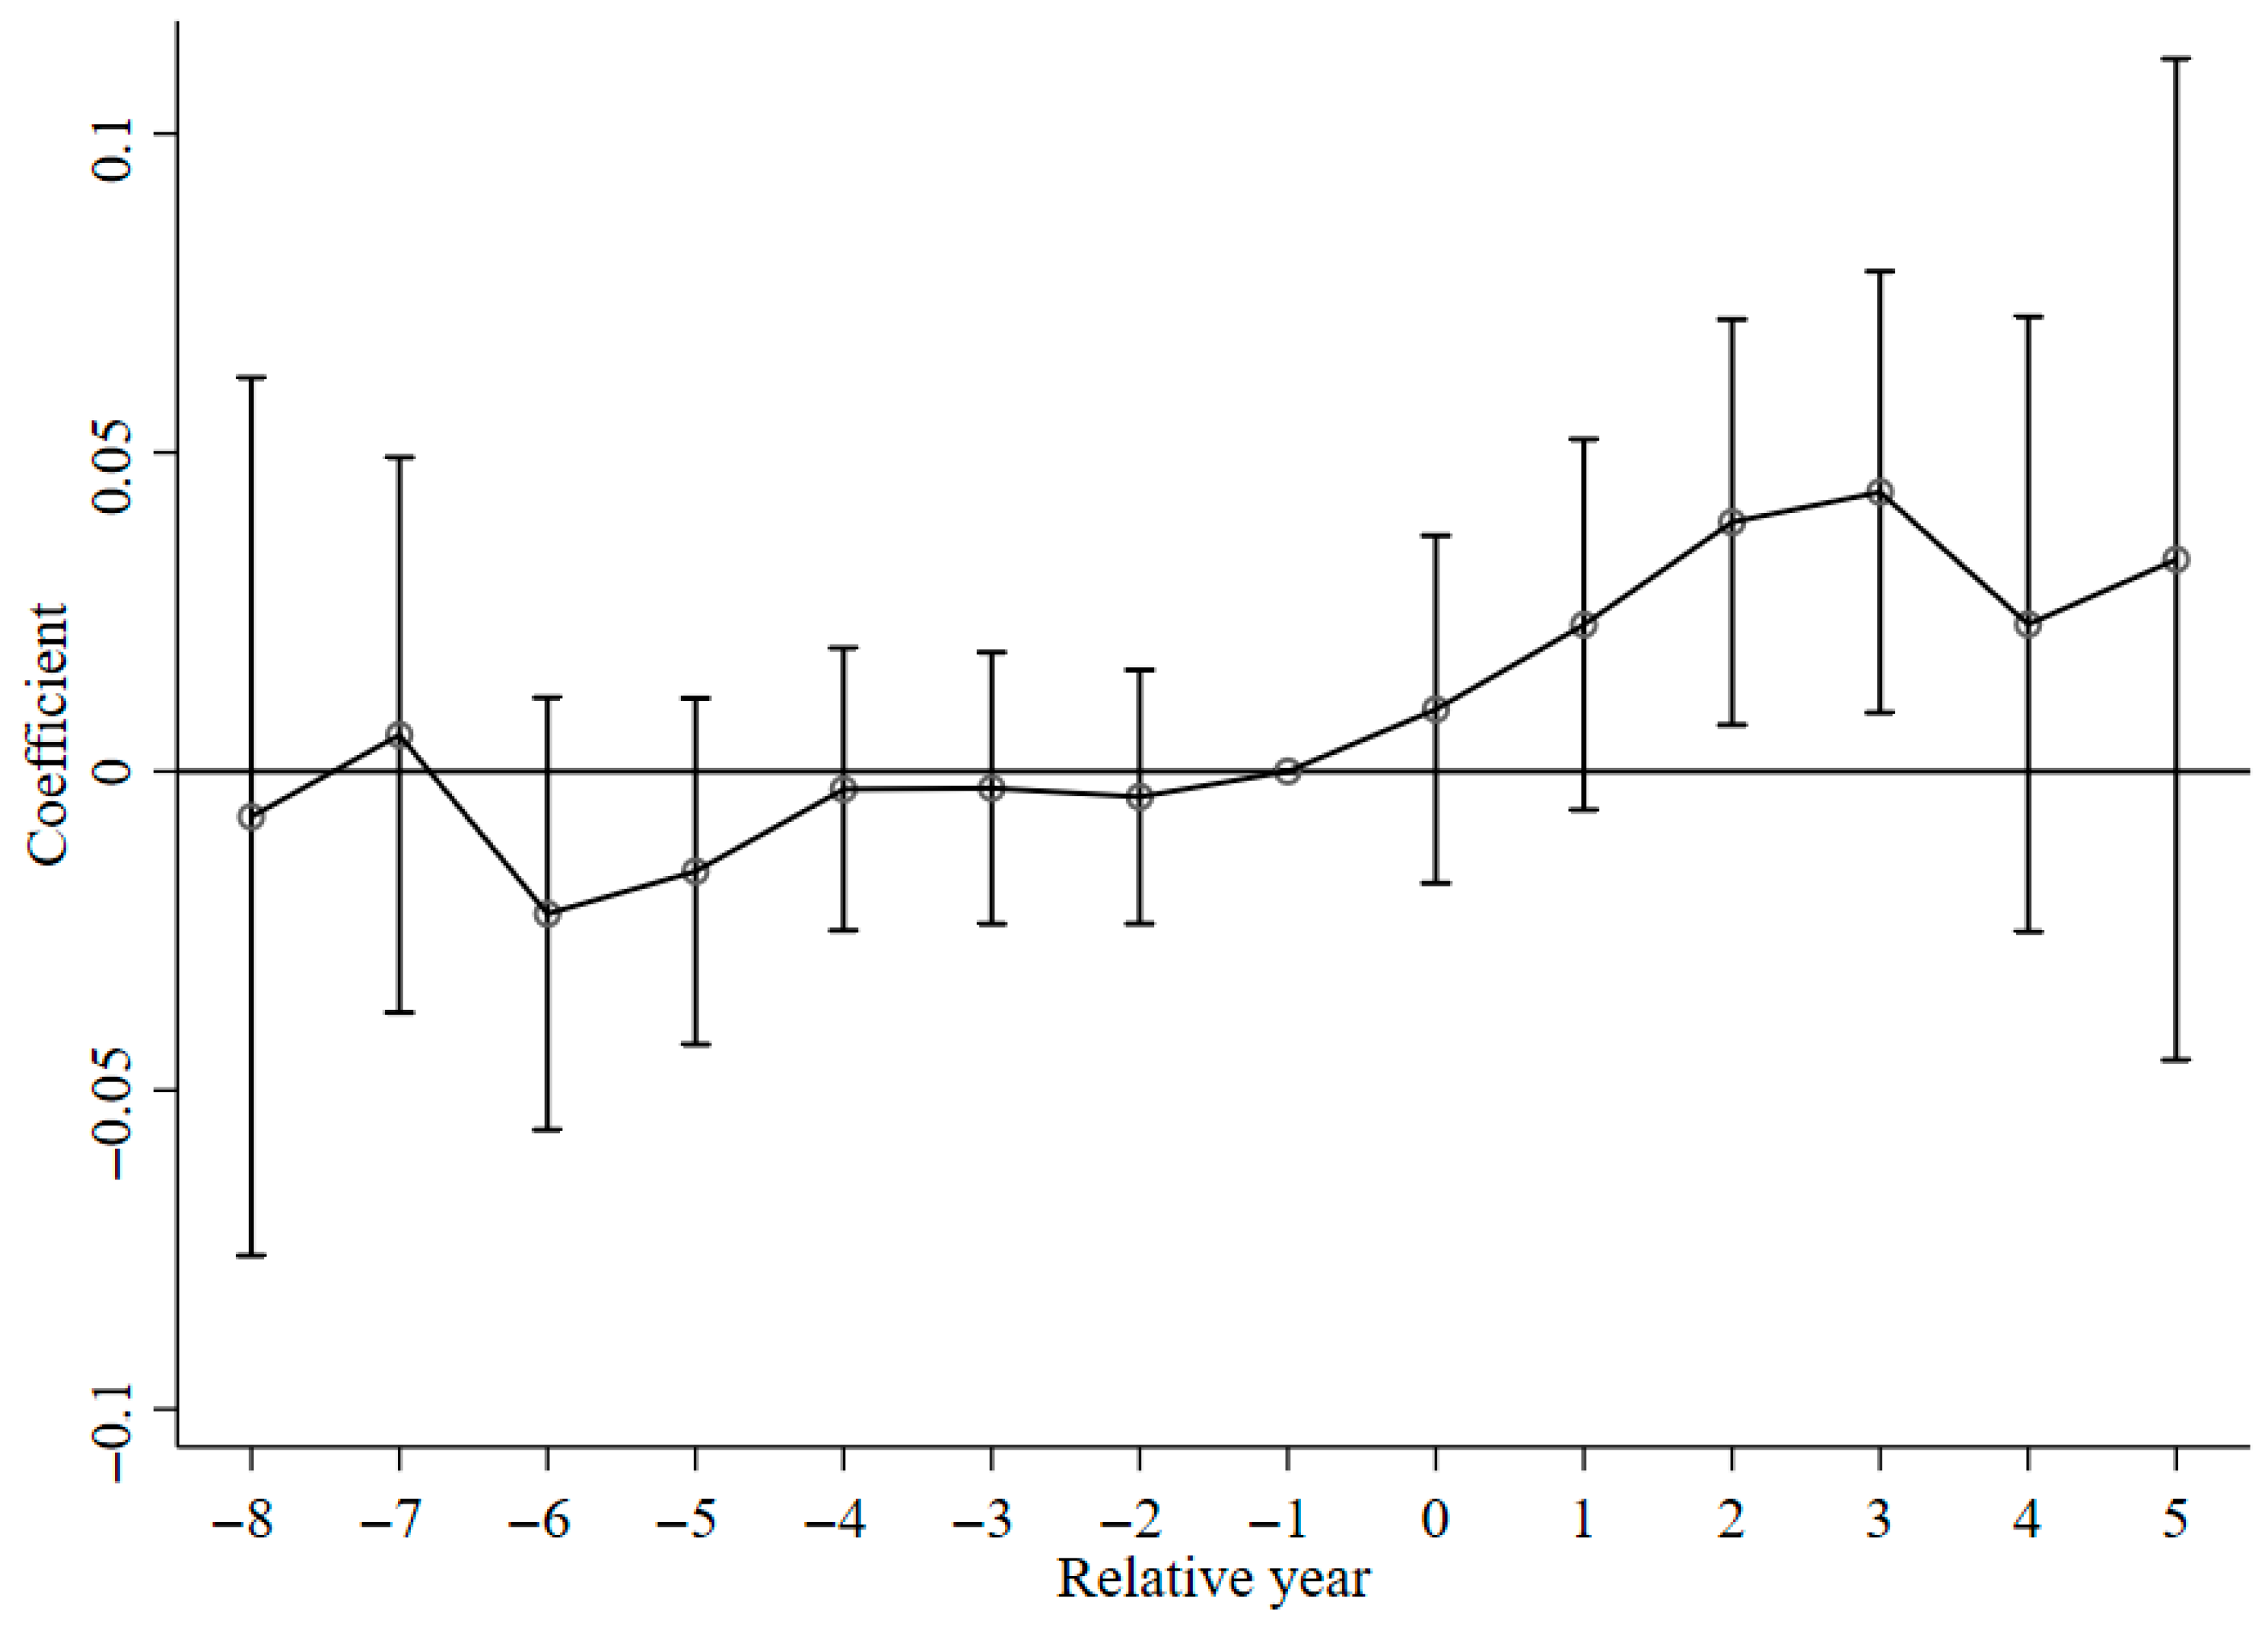
We test this assumption using an event-study design, with results visualized in Figure 5. The estimated coefficients for the pre-treatment periods are statistically indistinguishable from zero, indicating no systematic differences in income trends between the two groups before the establishment of NMAIP. At the same time, the pre-treatment coefficients exhibit visible fluctuations around zero rather than lying perfectly flat. We do not interpret these oscillations as evidence of systematic anticipation or a sustained pre-trend for two reasons. First, the signs of the pre-treatment estimates alternate and do not display a monotonic pattern or persistent drift in a single direction; instead, they appear to vary around zero, which is more consistent with idiosyncratic shocks or short-run noise than with a structural divergence in income trajectories. Second, county-level rural income measures may contain non-trivial measurement error and transitory variation arising from agricultural shocks, reporting differences, or compositional changes in rural populations, any of which can generate small year-to-year movements even when underlying trends are parallel.
Therefore, our assessment does not rely solely on p-values. Substantively, the lack of a clear directional pattern in the pre-treatment coefficients suggests that any deviations from zero are mild and likely reflect measurement noise or temporary shocks rather than a violation of the identifying assumption. In the post-treatment period, however, a significant positive treatment effect emerges, particularly from the second year onward. This dynamic pattern supports a causal interpretation: the observed income growth in treated counties can be plausibly attributed to the NMAIP policy rather than pre-existing differential trends.
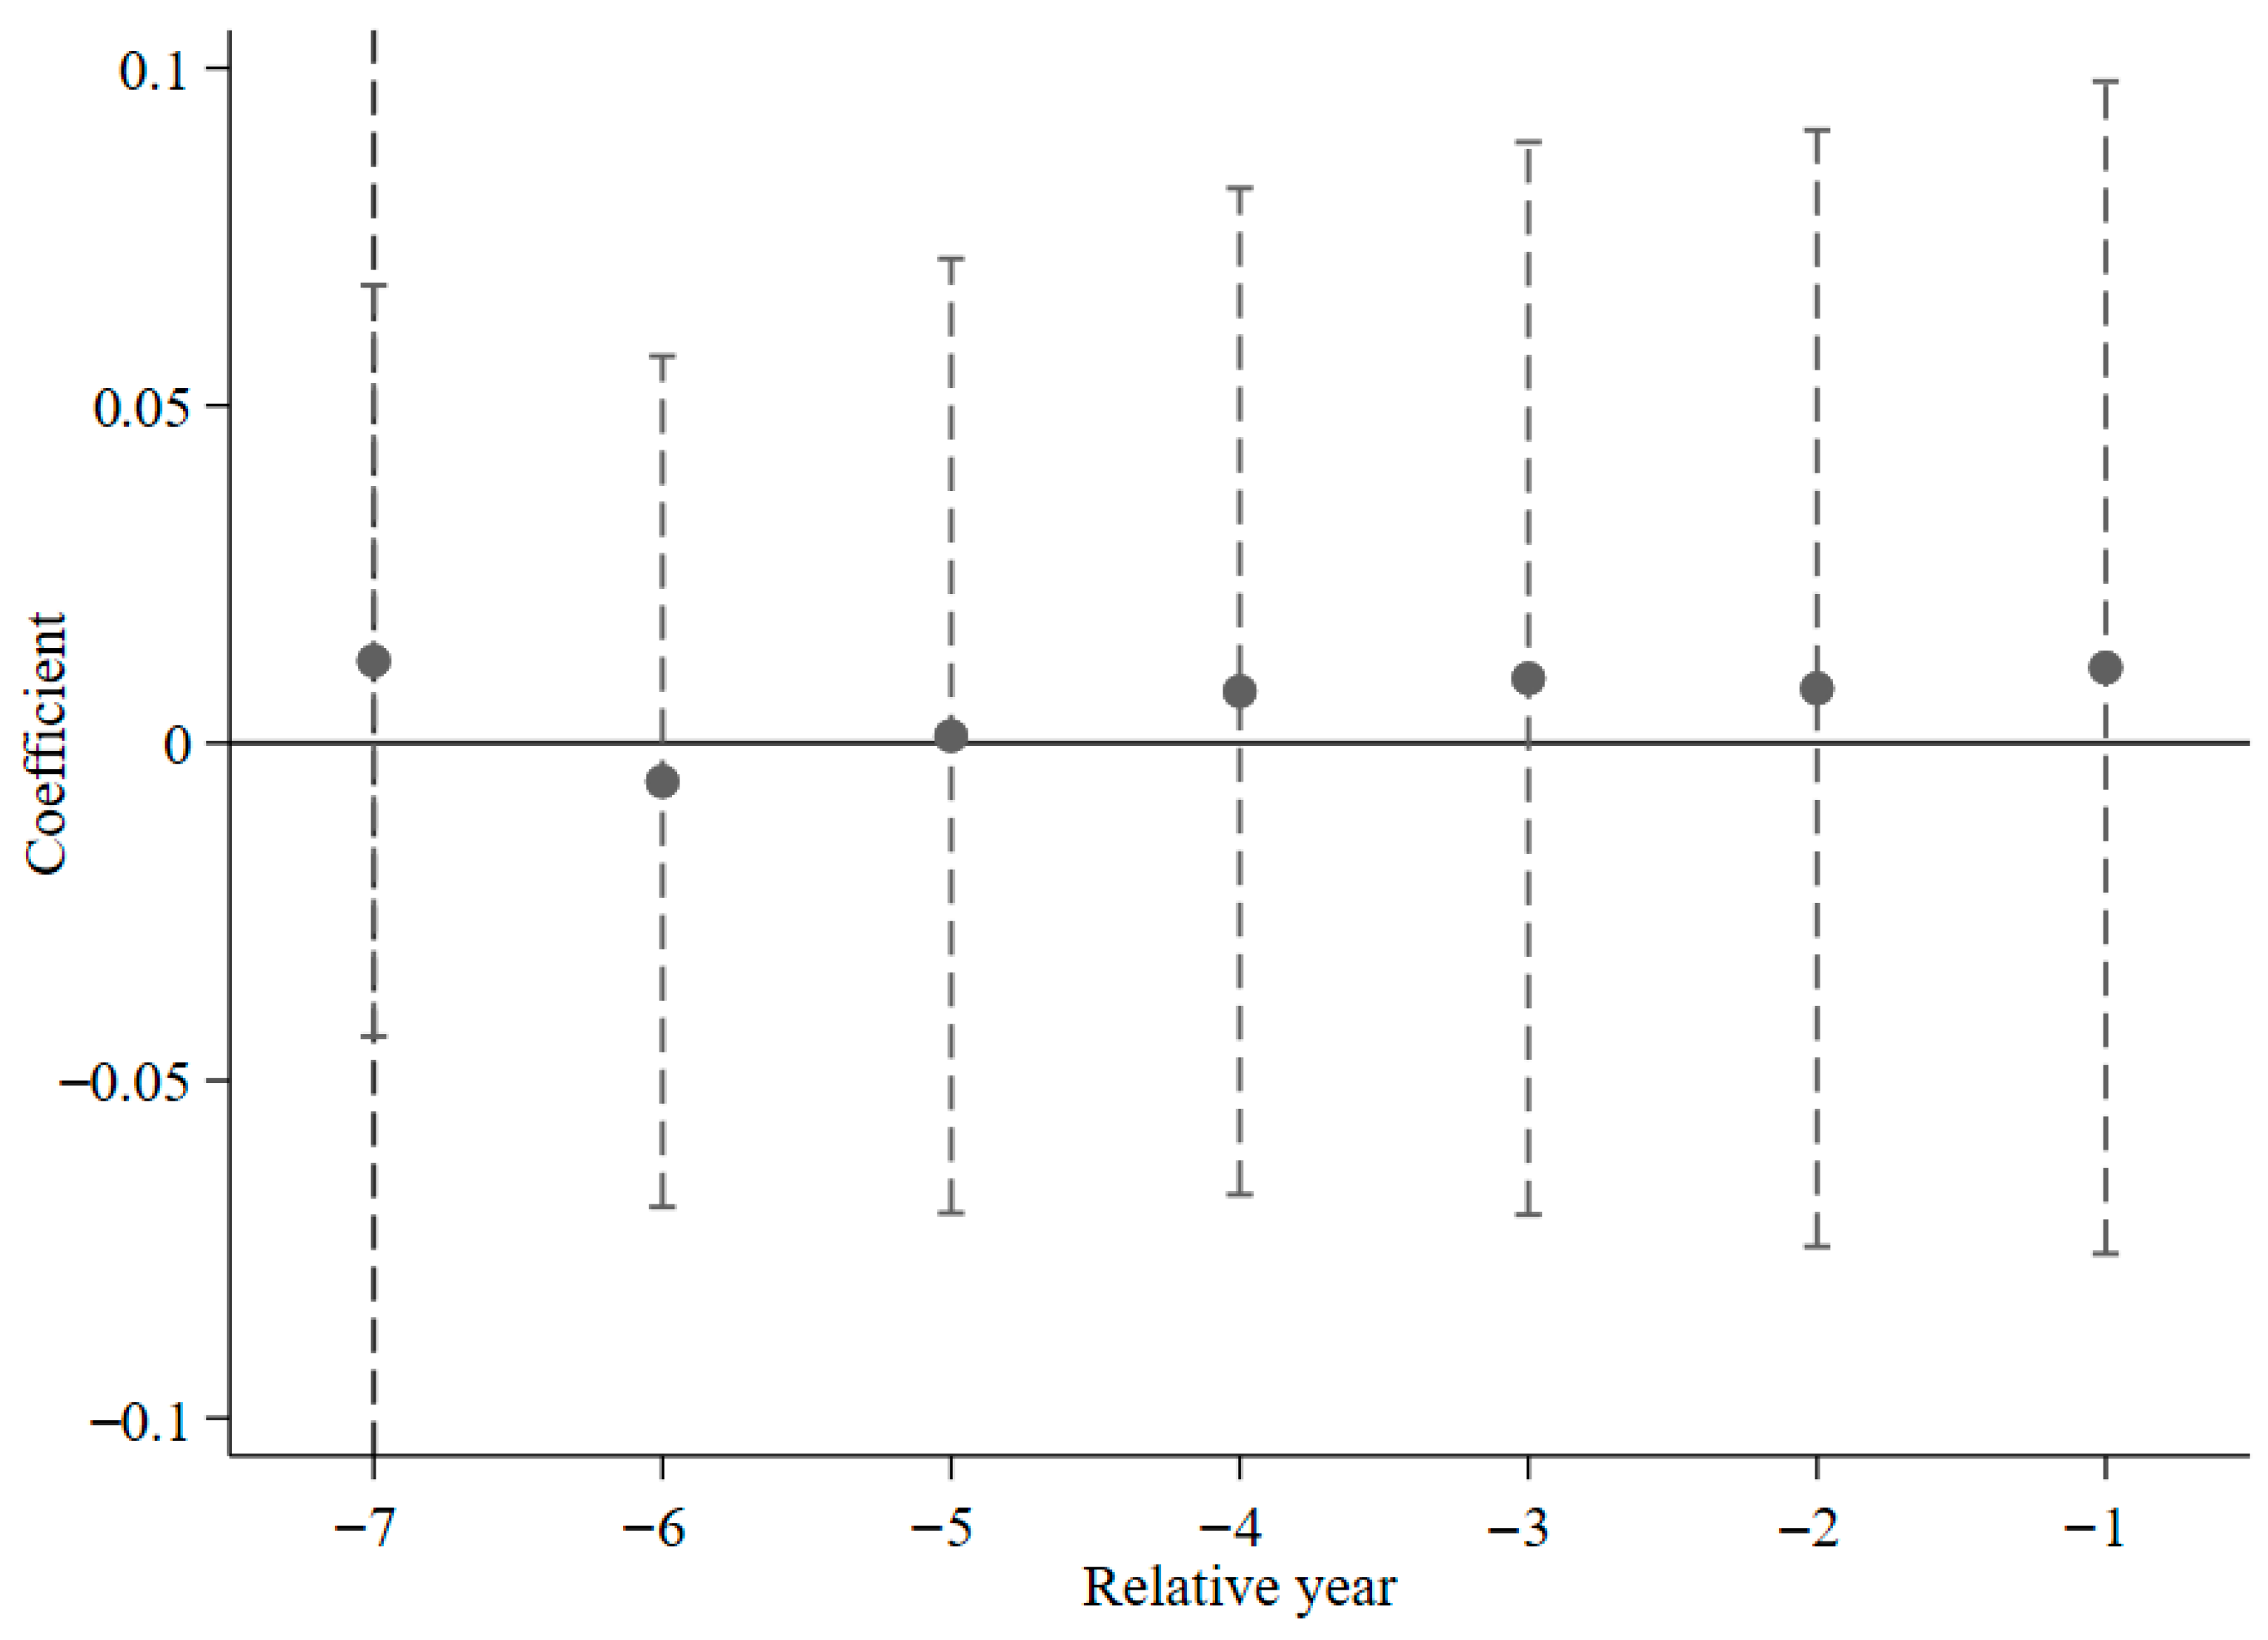
Conventional tests for parallel trends often suffer from limited statistical power in detecting pre-existing divergences between treatment and control groups. Roth et al. (2023) [77] note that even when the parallel trends assumption is violated, conventional estimators may fail to detect statistically significant pre-trends due to low power. To mitigate this concern, we employ the robust diagnostic approach proposed by Borusyak et al. (2024) [78], which explicitly separates the assessment of pre-treatment trends from the estimation of post-treatment effects, thereby reducing potential bias in the causal estimates. As shown in Figure 6, the estimated differences between future treatment and control counties during the eight-year baseline period are statistically insignificant and exhibit no systematic trend, providing further support for the validity of the parallel trends assumption in our setting.

4.2.2. Bacon Decomposition

In staggered DID designs with two-way fixed effects (TWFE), estimates may be biased if later-treated units serve as controls for earlier-treated ones, thereby “contaminating” the control group with treatment effects [79]. To assess the potential influence of such bias, we apply the Bacon decomposition method proposed by Goodman-Bacon (2021) [80], which breaks down the TWFE estimate into weighted averages of all possible pairwise DID comparisons.
As reported in Table 4, the weight assigned to comparisons that are most likely to generate timing-related bias is minimal. Specifically, comparisons in which already-treated counties are used, implicitly or explicitly, as controls for counties treated at different times receive very small weights in our setting. Because the overall TWFE coefficient is a weighted average of all underlying 2 × 2 DID comparisons, any potentially problematic comparison can affect the final estimate only in proportion to its weight. Here, the dominant contribution comes from comparisons between treated counties and never-treated counties (weight = 0.967), which are not subject to the “treated-as-control” contamination mechanism. In contrast, the combined weight on cross-treated timing comparisons (early-treated vs. later-treated and later-treated vs. early-treated) is only 0.033, and the most problematic component is particularly small. Therefore, even if those timing comparisons were partially biased due to treatment effect heterogeneity over time, their mechanical influence on the aggregate TWFE estimate would be negligible, implying that treatment timing bias is not a first-order concern in this application. Accordingly, we conclude that the estimated effect of NMAIP construction on rural residents’ income is robust to concerns related to staggered treatment adoption.

4.2.3. Placebo Test

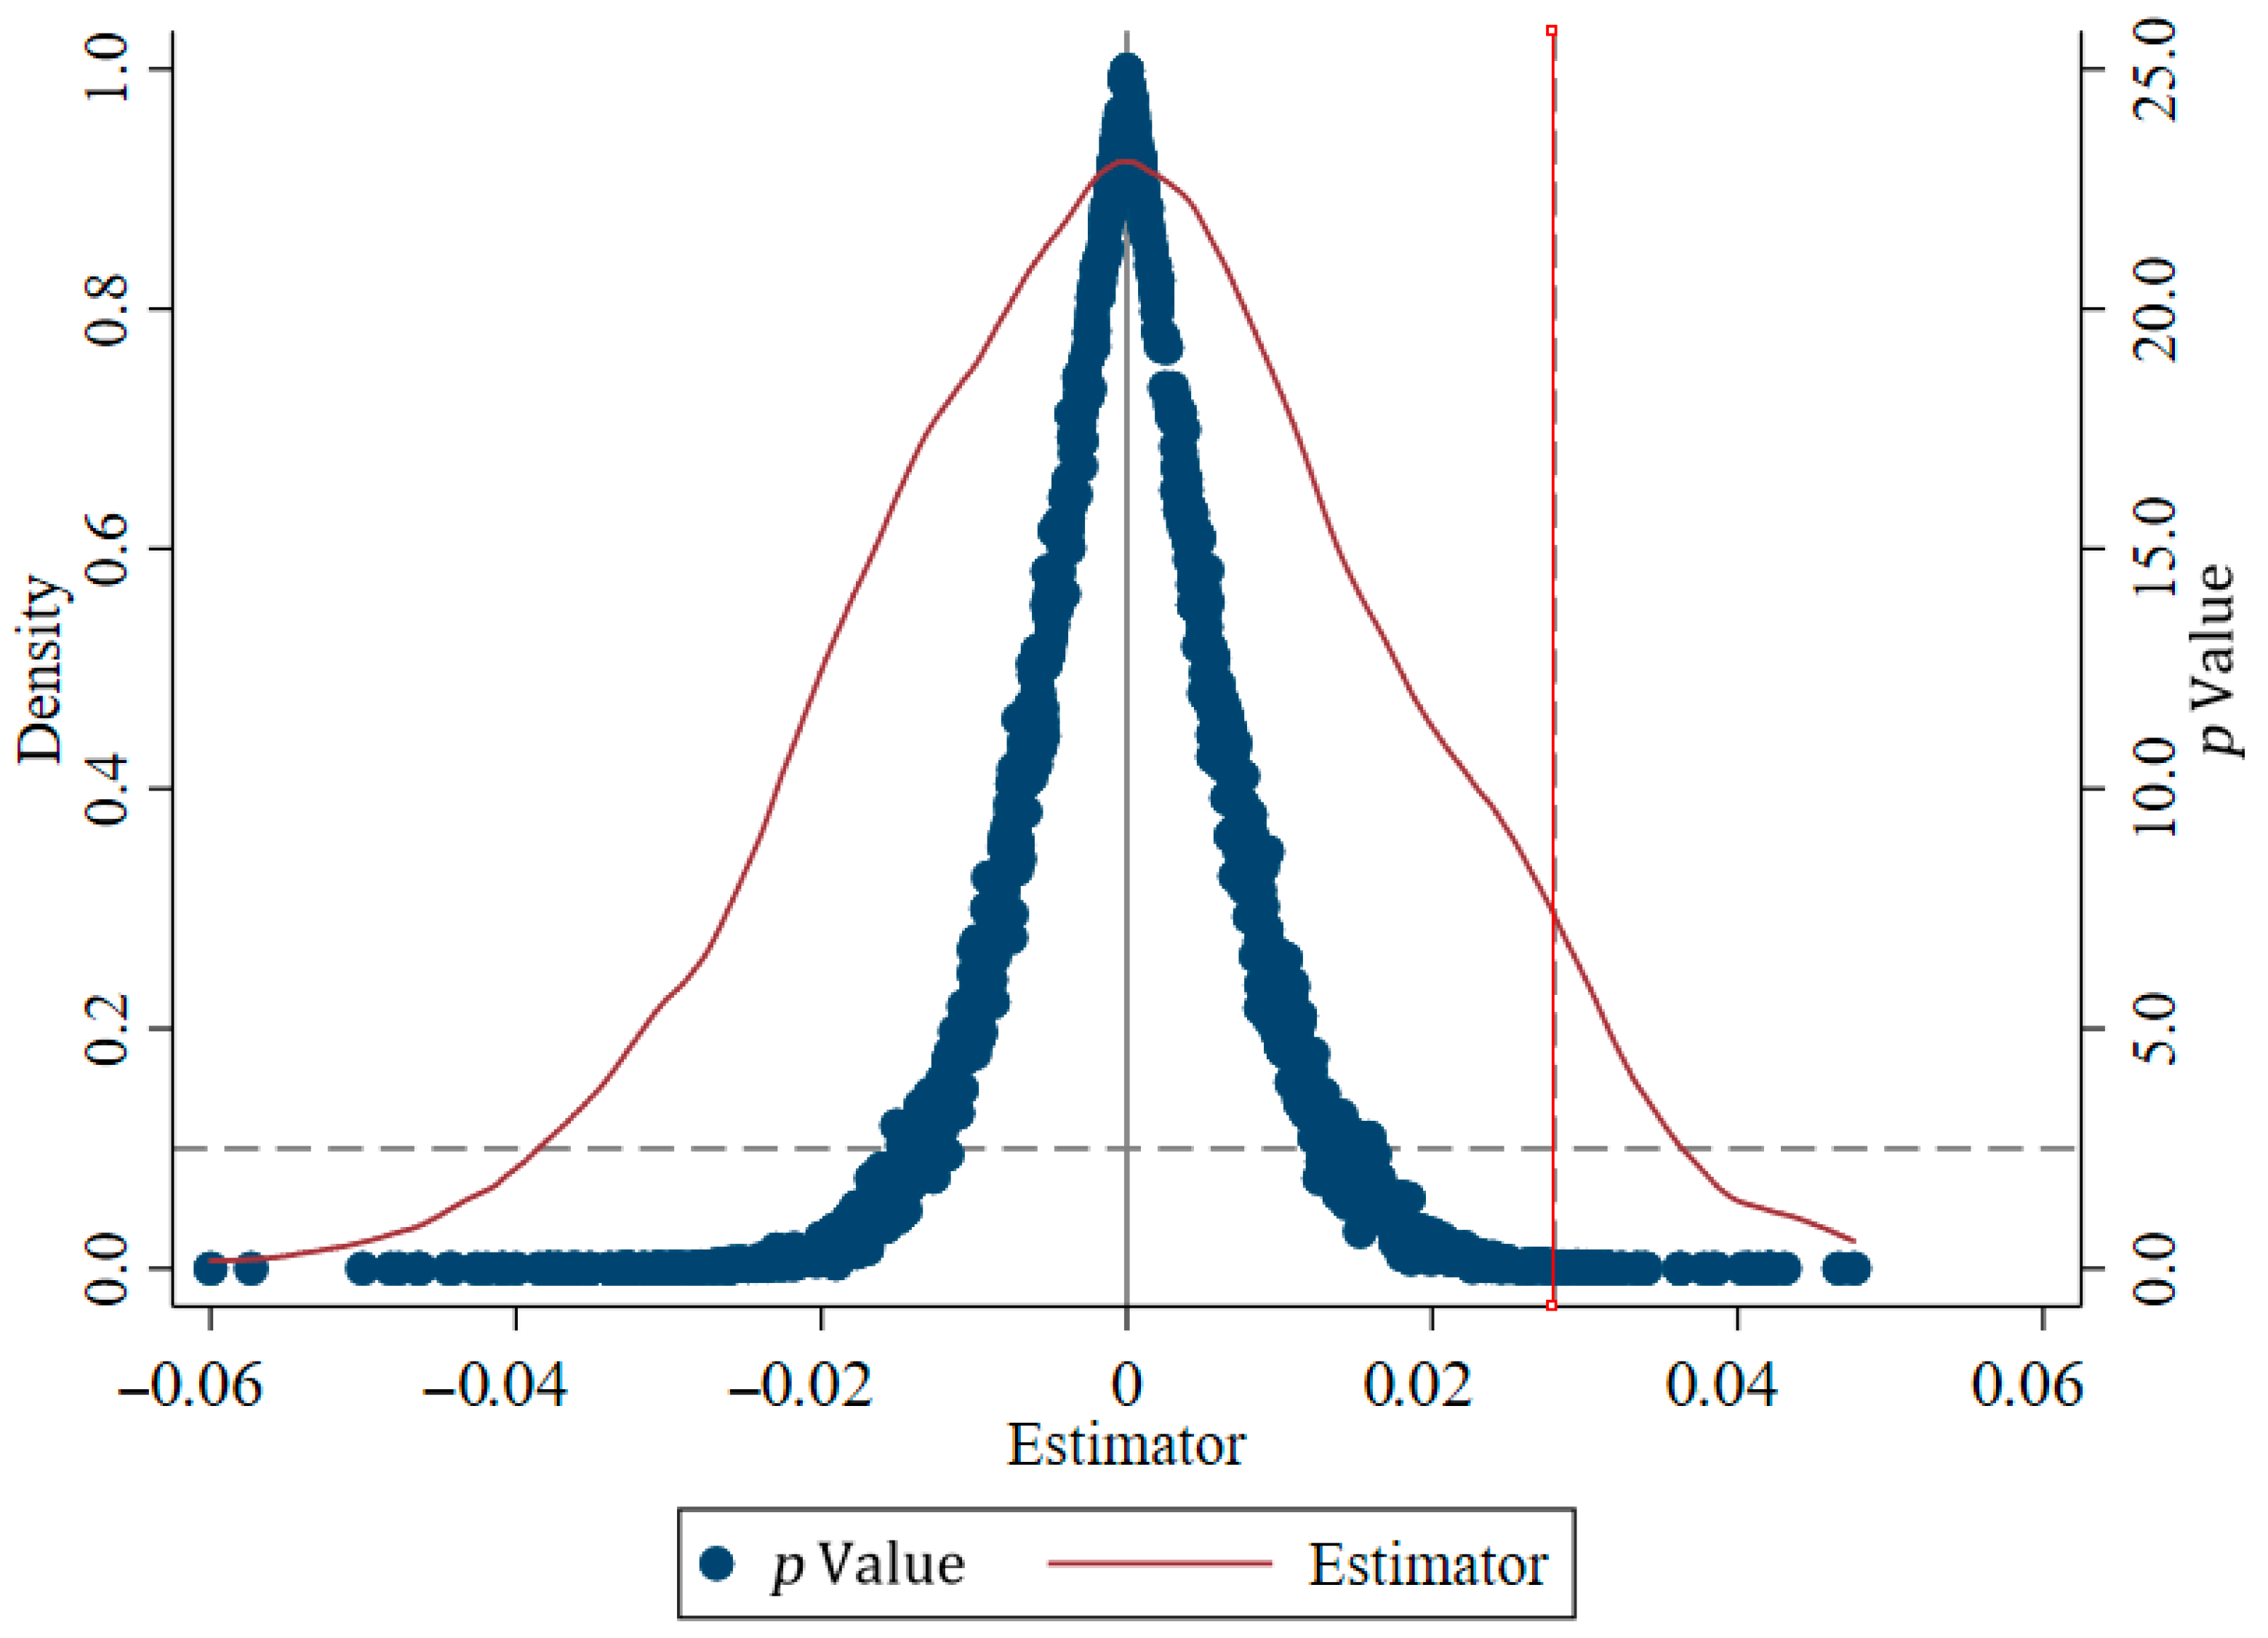
To further validate the robustness of our findings and rule out spurious effects driven by unobserved confounders or non-random policy placement, we performed a permutation-based placebo test. Specifically, we randomly reassigned the NMAIP treatment status and its timing across counties while preserving the actual distribution of the outcome and control variables. The interaction between the simulated treatment indicator and the artificially generated treatment time was then used to re-estimate the model. This procedure was iterated 1000 times to construct a distribution of placebo coefficients under the null hypothesis of no treatment effect.
As shown in Figure 7, the resulting coefficients are densely distributed around zero and clearly deviate from the actual estimate observed in the baseline model. Most simulated p-values exceed the 0.1 threshold, indicating no systematic effect in the placebo samples. These results suggest that it is unlikely that the positive impact of NMAIP construction on rural residents’ income is driven by unobserved confounders or chance variation.

4.2.4. Addressing Sample Self-Selection

Systematic pre-existing differences between counties with and without NMAIPs may bias the estimation of policy effects. To mitigate this concern, we employ a Propensity Score Matching and Difference-in-Differences (PSM-DID) approach, which helps reduce selection bias by constructing a more comparable control group [3]. As shown in Panel A of Table 5, the coefficient of the NMAIP variable remains positive and statistically significant across various matching methods. This consistency suggests that the income-enhancing effect of NMAIP is robust to potential sample self-selection, reinforcing the credibility of our baseline regression results.

4.2.5. Controlling for Concurrent Policies

To isolate the effect of NMAIP construction from other contemporaneous rural development initiatives, we incorporate controls for several major national policies implemented during the study period. These include the Rural Homestead Reform (RHR), Integrated Urban–Rural Transportation Construction (IURTC), Information to Villages and Households (IVH), E-commerce into Rural Areas (ERA), and the Broadband China Strategy (BCS) [2,73,81,82]. Panel B of Table 5 reports the results after including these policy controls. The coefficient on NMAIP construction remains positive and statistically significant, indicating that its estimated impact is not confounded by other relevant policy interventions.

4.2.6. Additional Robustness Checks

To strengthen the validity of our findings, we conducted a series of additional robustness tests to address potential sources of bias.
First, we excluded counties from major municipalities, as their elevated administrative status and political influence during NMAIP evaluations could disproportionately affect the results. This step ensures our estimates are not driven by these unique cases.
Second, to mitigate the impact of the COVID-19 pandemic—which significantly disrupted agricultural production and rural residents’ incomes starting in 2020—we excluded data from the 2021–2022 period. This helps isolate the policy effect from the pandemic’s unique economic disruptions.
Finally, to address potential selection bias arising from the non-random designation of NMAIP counties, we controlled for factors influencing selection, such as distance to provincial capitals and ports, and whether a county was ranked among the Top 100. These factors may correlate with both selection and development potential.
The results, presented in Panel C of Table 5, show that our core variable remains positive and statistically significant across all these checks. This consistency confirms that the positive effect of NMAIP construction on rural residents’ income is robust to various potential confounders.

4.3. Mechanism Tests

This section empirically examines the three theoretical mechanisms through which NMAIP construction may influence rural residents’ income: employment expansion, technological progress, and capital inflows.

4.3.1. Facilitating Employment Expansion

We first test whether NMAIPs raise rural residents’ income by facilitating employment opportunities. To capture this mechanism, we use two proxy variables: local employment rate (Employment scale) and the number of newly registered businesses (Entrepreneurial activity). As shown in columns (1) and (2) of Table 6, the coefficients on the NMAIP variable are positive and statistically significant, indicating that NMAIP construction has increased both local employment rates and entrepreneurial activity. On average, NMAIP establishment is associated with a 0.1-percentage-point rise in the employment rate and the creation of approximately 710 new enterprises.
We note an important identification issue regarding causal ordering: employment rates and business registrations are not predetermined covariates but plausible post-treatment outcomes that may themselves be affected by NMAIP establishment. Accordingly, in this section we do not treat these variables as standard controls that must be held fixed; instead, we interpret them as intermediate outcomes that can be influenced by the treatment and that potentially transmit part of the policy effect to rural income. This conceptual ordering is consistent with our theoretical framework: NMAIP construction first changes local labor demand, enterprise entry, and value-chain organization, and these shifts then translate into higher household wage and operating income.
To avoid bad control concerns, our baseline income regressions do not condition on these mechanism proxies. The mechanism regressions in columns (1) and (2) of Table 6 are designed to test whether NMAIPs move these intermediates in the expected direction. Likewise, the interaction specifications in columns (3) and (4) are interpreted as heterogeneity tests of the income effect along dimensions of employment expansion and entrepreneurial dynamism, rather than as attempts to isolate a net direct effect of NMAIP after controlling away post-treatment variation. In this sense, the interaction terms indicate that the income gains are larger in county-years where the policy is associated with stronger labor market and business formation responses, which is consistent with an employment-based transmission mechanism.
To further validate that employment expansion serves as a transmission channel, we estimate models that include interaction terms between the NMAIP indicator and the two mechanism variables. The significantly positive interaction terms in columns (3) and (4) suggest that the income effect of NMAIP is stronger in counties with higher employment growth or more vibrant business formation. These results provide robust evidence that facilitating employment expansion is an important mechanism behind the income benefits of NMAIP, thus supporting Hypothesis 1.

4.3.2. Enhancing Technological Progress

To examine whether technological advancement serves as a transmission channel, we employ two proxy variables: agricultural productivity and the number of patent grants per 10,000 people. As reported in columns (1) and (2) of Table 7, the coefficients on the NMAIP variable are positive and statistically significant at the 1% level, indicating that the establishment of NMAIP is associated with both higher agricultural efficiency and greater innovation output. In particular, NMAIP counties exhibit an average increase of 0.20 patent grants per 10,000 people relative to non-NMAIP counties.
A practical data limitation is that patent information is not available for all county-year observations in our panel. Compared with agricultural productivity and other county-level controls, patent grants are compiled from specialized administrative or statistical sources, and at the county level some observations are missing due to incomplete reporting coverage, occasional changes in statistical calibers, and the fact that a subset of counties record very low innovation activity that is not consistently captured year by year. As a result, the patent-based regressions in columns (2) and (4) rely on a smaller sample (N = 16,700) than the full baseline panel (N = 23,140). In other words, we can only collect patent data for this subset of county-year observations, and the reduced sample reflects data availability rather than additional sample screening choices.
Importantly, missing patent data may not be purely random. Counties with weaker administrative capacity, lower economic development, or smaller innovation bases may be more likely to have incomplete patent records, which could affect external validity if the patent sample is systematically more developed than the full sample. To address this concern, we examine whether patent data availability is correlated with observable county characteristics by comparing key baseline covariates between the full sample and the patent available subsample. The differences are modest, suggesting that the patent subsample is broadly comparable to the full panel on observables. Nevertheless, we acknowledge that some residual selection on unobservables may remain, and thus the patent-based mechanism evidence should be interpreted as supportive rather than definitive.
To further mitigate this concern, we emphasize two points: (i) the agricultural productivity channel is estimated on the full sample and yields consistent results; and (ii) the sign and significance of the NMAIP coefficient in the patent regressions remain stable under the same fixed-effects structure and control set, indicating that the main inference is not driven by the reduced sample alone. We further test whether technological gains moderate the income effect of NMAIP by including interaction terms between the treatment indicator and the two mechanism variables. The significantly positive interaction terms in columns (3) and (4) suggest that the income benefits of NMAIP are more pronounced in counties with stronger technological performance. These results consistently support the view that technological progress is an important mechanism through which NMAIP construction raises rural residents’ income, confirming Hypothesis 2.

4.3.3. Attracting Capital Inflows

Capital infusion is a key driver of rural residents’ income growth, and NMAIP construction is expected to facilitate such inflows. We test this mechanism using two proxy variables: total tax revenue and per capita retail sales of consumer goods. As shown in columns (1) and (2) of Table 8, the coefficients on the NMAIP variable are positive and statistically significant at the 1% level, indicating that the establishment of NMAIP is associated with increased local fiscal resources and consumption capacity—both reflecting enhanced capital inflows. The NMAIPs attract capital by improving infrastructure and offering supportive policy packages, including tax incentives, land use concessions, and fiscal subsidies. These measures lower operational costs for firms, strengthen market competitiveness, and draw enterprises and investment into rural areas, thereby accelerating local industrial development [58].
To further verify that capital inflows mediate the income effect of NMAIP, we incorporate interaction terms between the treatment indicator and the two mechanism variables. The significantly positive coefficients in columns (3) and (4) suggest that the income benefits of NMAIP are stronger in counties with greater capital accumulation. These results provide empirical support for the role of capital attraction in raising rural residents’ income, confirming Hypothesis 3.

4.4. Heterogeneity Analysis

The income effects of NMAIP construction are likely to vary depending on park type and local agricultural conditions. We thus examine heterogeneous treatment effects using group regression analysis.

4.4.1. Park Types

The economic impact of NMAIP may differ systematically across park types, as their dominant industries, production features, market structures, and technological capacities vary considerably. We classify NMAIPs into two categories based on their primary specialization: Bulk commodity parks and specialty high-value commodity parks. Bulk commodity parks focus on staple crops such as grains, oilseeds, and cotton, with an emphasis on securing national food supply. In contrast, specialty high-value commodity parks produce distinctive, high-margin products such as premium fruits, specialty livestock, and medicinal herbs.
As shown in columns (1) and (2) of Table 9, bulk commodity parks exert a significantly stronger positive effect on rural residents’ income than specialty high-value commodity parks. This pattern may be attributed to economies of scale, which allow bulk commodity parks to reduce unit costs through concentrated production and large-scale processing. In addition, these parks often receive stronger governmental support—including fiscal transfers, policy incentives, and resource allocations—given their strategic role in food security. Stable and broad-based demand for staple products also ensures more predictable income streams. By comparison, specialty high-value commodity parks face greater market constraints. Although their products command higher prices, they target narrower consumer segments and often rely on specific regional markets. Income growth in these parks is thus more susceptible to limitations in market access and brand development.
We further distinguish parks by their functional scope, classifying them as single-function or integrated-function parks. Single-function parks specialize in one agricultural industry, whereas integrated-function parks combine multiple industries to exploit synergies and complementary advantages.
Regression results in columns (3) and (4) reveal that integrated-function parks have a stronger income effect than single-function parks. This advantage stems from cross-industry synergies: integrated parks link agriculture with higher-value sectors such as processing, logistics, tourism, and services, diversifying income sources and raising returns to labor and land. In contrast, single-function parks remain concentrated on a single commodity, making them more vulnerable to output shocks and market fluctuations. Thus, the integrated model appears more effective in boosting rural residents’ income.

4.4.2. Agricultural Development Foundations

The impact of NMAIP construction on rural residents’ income is likely to vary with regional agricultural development foundations. We examine this heterogeneity along three dimensions: production specialization, mechanization level, and unique resource endowment [83]. Production specialization is defined based on whether a county is designated as a major grain-producing area, reflecting a higher degree of agricultural specialization. Mechanization level is measured as the total agricultural machinery power per unit of sown crop area at the county level, with samples split by the median value. Specialized resource endowment is proxied by the number of nationally recognized geographical indication (GI) agricultural products in each county, indicating regions with distinctive agro-ecological advantages.
As shown in columns (1)–(6) of Table 10, the income-enhancing effect of NMAIP construction is more pronounced in regions with weaker agricultural foundations. These areas often face more binding constraints—such as limited access to technology, capital, and markets—which hinder the transition to modern agriculture. Agricultural production in these regions also tends to rely on traditional practices with low productivity and weak market competitiveness. The introduction of NMAIP helps alleviate these structural constraints by disseminating advanced technologies, modern management models, and efficient production methods, thereby enhancing local specialization and mechanization, and ultimately raising rural residents’ income.

5. Further Analysis

5.1. Impact on the Urban–Rural Income Gap

While the preceding analyses establish that NMAIP construction raises rural residents’ income through employment creation, technological upgrading, and capital attraction, its broader distributional consequences—particularly for urban residents and the urban–rural income gap—remain unclear. To examine these effects, we introduce two additional outcome variables: urban residents’ income and the urban–rural income gap [1].
Column (1) of Table 11 shows that the coefficient on the NMAIP variable is 0.094 and statistically significant at the 1% level, implying that urban residents in counties with NMAIPs experience an average annual income increase of approximately 940 yuan. Column (2) further indicates that NMAIP construction is associated with a significant widening of the urban–rural income gap. This dynamic is theoretically consistent with an agglomeration then diffusion logic widely discussed in development and regional economics: in the early stage, new growth poles tend to concentrate higher-return factors and high value-added activities, raising inequality, whereas in the later stage, production linkages, technology spillovers, and market integration gradually extend benefits to lagging areas, allowing disparities to narrow. In other words, NMAIPs may generate a county-level distributional path resembling an urban–rural Kuznets-type pattern, where structural transformation initially favors better-endowed urban and peri-urban groups but becomes more inclusive as the park and its value chain mature.
Several mechanisms can account for early widening. First, NMAIPs often attract capital intensive processing, logistics, and business services that are complementary to skilled labor and formal employment, which are disproportionately concentrated in urban areas. This skill and capital complementarity can raise urban wages and business income faster than rural income in the initial years. Second, the early phase of park development typically concentrates infrastructure upgrading, public investment, and industrial land allocation around county seats or peri-urban zones where connectivity and administrative support are stronger, enabling urban residents and firms to capture larger rents from land appreciation, procurement, and service outsourcing. Third, value-added segments such as branding, marketing, certification, cold-chain logistics, and finance are often located closer to urban markets and institutions, so the first-round gains accrue more to urban households even when agricultural production expands. Together, these channels imply that the distributional impact can be urban-biased in the short run, leading to a temporary widening of the urban–rural income gap.
Over time, however, the gap may narrow as NMAIPs shift from construction and clustering to consolidation and outward linkage. As the park becomes operationally mature, downstream processing and market access can raise farm-gate prices and stabilize demand through contract farming, standardized procurement, and integrated supply chains, increasing returns to rural land and labor. At the same time, technology extension, training, and demonstration effects diffuse to surrounding villages, improving productivity and enabling rural households to participate in higher-value activities such as specialized production, sorting and packaging, and local agricultural services. Moreover, as employment expands beyond core firms to supporting rural services and satellite workshops, rural non-farm income opportunities rise and become less concentrated near the county seat. These diffusion and linkage effects imply that rural income growth can accelerate relative to urban income growth in the later stage, gradually compressing the urban–rural income gap.
To test whether the distributional effect evolves with policy duration, we include both the number of years since NMAIP establishment and its square term in the model. As shown in column (3), the linear term is positive and significant, while the square term is negative and significant. This pattern indicates an inverted U-shaped relationship: the urban–rural income gap initially widens due to early-stage agglomeration and urban-biased capture of high-return activities, but later narrows as value-chain linkages, technology diffusion, and broader rural participation expand the income gains of rural households.

5.2. Impacts on Rural Residents’ Income Structure

Rural households typically rely on multiple income sources, and the construction of NMAIP may differentially affect these various channels, thereby altering the overall composition of rural residents’ income. To examine this, we draw on household-level data from the China Family Panel Studies (CFPS) from 2014 to 2022 [84,85]. Table 12 reports the estimated effects of NMAIP construction on four income categories: operating income, wage income, property income, and transfer income.
As shown in column (1) of Table 12, the coefficient on the NMAIP variable is positive and statistically significant at the 5% level, indicating that NMAIP construction raises rural residents’ operating income. This result is consistent with the introduction of advanced agricultural technologies, equipment, and management practices within these parks, which help improve productivity and strengthen the market competitiveness of agricultural products. Column (2) shows that NMAIP construction also has a positive and significant effect on wage income at the 1% level. Beyond technological upgrading, NMAIP development creates substantial non-agricultural employment in processing, manufacturing, and service sectors located within or around these parks. This diversification of local employment structures provides stable wage-earning opportunities, thereby boosting wage income.
In contrast, columns (3) and (4) show positive but statistically insignificant coefficients for property and transfer income. Rather than being surprising, this pattern is consistent with the institutional setting of rural factor markets and fiscal redistribution in China, where the channels that generate property and transfer income are less directly connected to localized industrial park policies and often face structural constraints.
For property income, the key barrier is that the assetization and marketization of rural resources remain incomplete. Rural households’ largest “asset” is typically land use rights, but constraints on land transactions, limited standardization of contracts, and frictions in scaling up and monetizing land rights restrict the extent to which NMAIP-driven demand can be translated into stable rental income for ordinary households. In many places, land consolidation and scale operation linked to NMAIPs are implemented through village-level coordination or enterprise-led arrangements, which may raise agricultural efficiency without necessarily generating broad-based, measurable rental returns captured in household property income. Moreover, rural financial assets and formal investment opportunities are still limited, and many households have low initial asset holdings; therefore, short- to medium-term park development is more likely to affect labor and operating returns than to materially increase interest, dividends, or other financial property income. These features imply that even if NMAIPs improve local economic vitality, the gains may not immediately appear as household-level property income in survey data.
For transfer income, a major explanation is the limited degree to which local industrial policies can reshape redistribution mechanisms in the short run. Transfer income in rural China is dominated by nationally or provincially standardized programs such as pensions, medical insurance reimbursements, minimum living allowances, and other social assistance schemes. These are primarily determined by eligibility rules, demographic structure, and higher-level fiscal arrangements rather than by county-level industrial upgrading initiatives. In addition, county governments often face hard budget constraints, and the fiscal space created by industrial development does not automatically translate into higher transfers to rural households unless accompanied by explicit redistribution policies and earmarked funding. Therefore, while NMAIPs may expand the local tax base or economic activity, the pass-through to household transfer income can be weak and delayed because it depends on broader intergovernmental fiscal systems and program design rather than market-mediated income generation.
Taken together, the absence of statistically significant effects on property and transfer income suggests that, at least during our sample period, NMAIPs mainly operate through production and labor-market channels, while asset-return and redistribution channels remain constrained by land market frictions and the limited responsiveness of fiscal transfer mechanisms. Consequently, while NMAIPs effectively raise income from agricultural operations and local employment, their impact on property and transfer income remains marginal.

5.3. Impact on Rural Internal Income Inequality

Although NMAIP construction raises rural residents’ income on average, its benefits may be unevenly distributed across households, potentially altering the degree of income inequality within rural areas. To examine this distributional effect, we again draw on CFPS household survey data from 2014 to 2022 and measure inequality using the Kakwani index [3].
As reported in column (1) of Table 13, the coefficient on the NMAIP variable is negative and statistically significant at the 1% level, indicating that NMAIP development significantly reduces overall rural income inequality. We further explore how this equalizing effect varies across income sources. Columns (2) to (5) present results for inequality in operating, wage, property, and transfer income, respectively. Column (2) shows a significant reduction in operating income inequality, likely because NMAIPs broaden access to modern agricultural technologies, market opportunities, and productive resources. This allows lower-income households engaged in traditional farming to raise their operating income, thereby narrowing the gap with higher-earning counterparts. Column (3) indicates that NMAIP construction also significantly reduces wage income inequality. These parks create a wide range of employment opportunities in agriculture, processing, and services, improving job access and wage levels for a broad segment of the rural labor force, which helps compress the wage distribution. In contrast, column (4) shows no statistically significant effect on property income inequality. While NMAIPs may eventually influence asset accumulation through mechanisms such as land transfer or collective economic development, such effects appear limited in the short term, possibly due to slow-moving asset valuation, underdeveloped rural capital markets, or institutional constraints. Finally, column (5) reports a significant negative coefficient at the 5% level for transfer income inequality. This may reflect improved local fiscal capacity and social security systems accompanying NMAIP development, which reduce households’ dependence on transfers while strengthening their self-earning capacity through employment. As NMAIPs raise local living standards and strengthen social welfare institutions, disparities in transfer income reliance tend to decline.

6. Conclusions and Discussion

6.1. Main Findings

Against the backdrop of China’s Rural Revitalization Strategy, NMAIPs have become a prominent place-based policy instrument for promoting agricultural modernization and rural income growth. Using county- and household-level panel data from 2014 to 2022 and a staggered DID framework, this study evaluates the impacts of NMAIP establishment on the level, structure, and distribution of rural residents’ income. We find that NMAIP construction significantly increases rural residents’ income by about 1.83%, and the result remains robust across alternative specifications.
Our empirical evidence provides direct support for the hypotheses: the estimated income gains are explained by employment expansion (supporting Hypothesis 1), productivity and innovation improvement (supporting Hypothesis 2), and strengthened local economic activity consistent with capital agglomeration (supporting Hypothesis 3). At the same time, the insignificant effects on property and transfer income indicate that the capital-related channel mainly materializes through operating and wage income within our sample period, rather than via asset returns or fiscal redistribution, which refines the scope of Hypothesis 3.
The household analysis further shows that NMAIPs mainly raise wage and operating income, while the effects on property and transfer income remain limited, which is consistent with institutional constraints in rural asset monetization and the relatively weak responsiveness of redistribution channels to localized industrial initiatives.
Beyond average effects, the distributional results imply a dynamic adjustment process. Although NMAIPs also raise urban residents’ income, the urban–rural income gap displays an inverted U-shaped trajectory, widening in the early stage when higher value-added segments and supporting services tend to concentrate in county seats and peri-urban areas, and narrowing as procurement linkages, technology diffusion, and employment spillovers extend more broadly into surrounding villages. At the same time, NMAIPs are associated with reduced intra-rural income inequality, suggesting that job creation and productivity improvements can generate relatively inclusive gains when rural households are able to participate in multiple segments of the local value chain. Taken together, these findings support the view that NMAIPs are an effective lever for rural income growth, but their longer-run inclusiveness depends on whether park benefits diffuse beyond the core area and whether complementary institutional reforms strengthen factor mobility, rural services, and household participation.

6.2. Policy Implications

The findings of this study offer several important policy implications.
First, policy support should be strengthened to accelerate the development of NMAIPs. As an important instrument for advancing agricultural and rural modernization in China, NMAIPs contribute to rural residents’ income growth through capital inflows, technological upgrading, and the creation of non-agricultural employment. Therefore, governments should take concrete steps to establish more NMAIPs that exemplify strong industrial leadership, concentrated resources, and broad-based benefits for farmers, thereby generating new momentum for modernization and sustained income growth. As a top-down national strategy, NMAIP construction requires substantial public financial support. In addition to central fiscal incentives, local governments should adopt proactive fiscal policies and establish coordinated funding mechanisms across central, provincial, municipal, and county levels to maximize the catalytic role of public investment. Furthermore, since NMAIPs fundamentally operate through agribusiness clustering, complementary policies—such as preferential tax treatment and streamlined farmland transfer procedures—are essential to attract enterprises and facilitate development.
Second, deepening market-oriented reforms in rural factor allocation is necessary to sustain the income-enhancing effects of NMAIPs. Empirical evidence confirms that NMAIPs raise rural residents’ income primarily by optimizing the allocation of capital, technology, and labor. However, since the start of China’s reforms and opening-up, progress in factor market reforms has lagged behind that in product markets, resulting in persistent inefficiencies in resource allocation. Therefore, further reforms should aim to facilitate more efficient factor allocation in rural areas. These reforms should systematically integrate capital, land, technology, and labor markets, while also incorporating emerging production factors such as data. Importantly, policymakers should ensure coordination between factor markets and complementary institutions—including fiscal and taxation systems, and rural social security schemes—to enhance policy synergy.
Third, targeted efforts are needed to manage the urban–rural income gap during the high-quality development of NMAIPs. Income gains induced by NMAIPs inevitably influence this disparity, with effects that vary across implementation stages. In the initial phase of park development, a “trickle-down” effect may disproportionately benefit urban residents, who typically possess superior factor endowments. This may temporarily widen the income gap, as rural incomes grow at a slower pace. As NMAIP systems mature, this imbalance tends to weaken significantly, enabling rural residents to capture more benefits and gradually narrow the gap. Accordingly, governments should adopt phased interventions: during early development, they should mitigate gap-widening forces, and during maturity, they should actively reinforce gap-narrowing trends to accelerate progress toward common prosperity.

6.3. Limitations and Future Research

This study has several limitations that should be acknowledged to provide a balanced interpretation of the findings. First, data availability constraints may affect both mechanism identification and external validity. For example, the patent indicator is not observed for all county-year observations, which reduces the sample size in the innovation-related mechanism regressions. Although the key results remain consistent across alternative mechanism measures, the patent-based evidence should be interpreted as supportive rather than definitive, and future research could integrate more complete administrative innovation records or alternative innovation proxies to improve coverage. More broadly, due to data availability, our observation window and mechanism measures remain imperfect proxies for deeper structural processes; future work could build longer time series panels to track whether income gains persist, accumulate, or fade as parks transition from construction to maturity. Such longitudinal designs would also help assess whether delayed channels, including asset returns and social protection, become more salient over a longer horizon.
Second, although we treat NMAIP establishment as a quasi-natural experiment and employ a staggered DID framework with extensive fixed effects and robustness checks, policy placement may still be influenced by time-varying local development strategies and administrative capacity. Counties selected into the program could differ in unobserved trajectories related to governance quality, investment promotion efforts, or industrial foundations. Such selection dynamics may generate residual bias even after controlling for observables and fixed effects, suggesting that future work could further strengthen identification by combining staggered DID with designs that exploit more granular program rules, discontinuities, or matched policy evaluation frameworks. In addition, future research could conduct comparative evaluations across policy systems, for example by examining similar agricultural industrial park programs in other developing economies, which would clarify the extent to which our findings depend on China’s specific institutional context and rural governance structure. Cross-country comparisons would also allow researchers to test whether the same mechanisms operate under different land regimes, fiscal systems, and market integration levels.
Third, measurement issues may influence the magnitude of estimated effects. County-level indicators such as GDP and fiscal variables can be correlated with each other and may be measured with error, which could contribute to coefficient instability in high-dimensional specifications. Likewise, household survey measures of rural income components may contain reporting errors and compositional changes over time, potentially attenuating estimated impacts for categories such as property and transfer income. Future research could triangulate survey-based outcomes with administrative income records, incorporate price deflators and alternative scaling choices, and explore additional micro mechanisms such as land rent capture and social security participation to better track how policy gains are distributed.
Finally, a notable limitation is that our analysis cannot meaningfully engage with the architectural and spatial design of parks. Because systematic county-level data on internal park layout and spatial planning are unavailable, we are unable to evaluate how design features such as functional zoning, the placement of processing and logistics nodes, transport connectivity within the park, or the spatial organization of service facilities shape resource circulation and employment accessibility. Future research could integrate geospatial data, remote sensing, and detailed park-level planning documents to quantify spatial configurations and then examine whether more connected and well-zoned layouts facilitate factor mobility, shorten supply chain distances, and strengthen spillovers to surrounding villages.


Author Contributions

Conceptualization, X.L. and W.H.; methodology, X.L.; software, X.L.; validation, X.L.; formal analysis, X.L. and W.H.; investigation, X.L., W.H. and J.L.; resources, X.L. and W.H.; data curation, X.L.; writing—original draft preparation, X.L. and W.H.; writing—review and editing, W.H. and J.L.; visualization, X.L.; supervision, W.H. and J.L.; project administration, J.L.; funding acquisition, W.H. and J.L. All authors have read and agreed to the published version of the manuscript.

Funding

This research was funded by the Project of Guangdong Philosophy and Social Science Foundation, grant number GD25ZX13, and the Special Funds for the Cultivation of Guangdong College Students Scientific and Technological Innovation Climbing Program, grant number pdjh2025ac038, the Project in Key Areas of General Universities in Guangdong Province, grant number 2023ZDZX4037, and the Project of Henan Philosophy and Social Sciences Planning, grant number 2022CJJ125.

Institutional Review Board Statement

Not applicable.

Informed Consent Statement

Not applicable.

Data Availability Statement

The original contributions presented in this study are included in the article. Further inquiries can be directed to the corresponding author.

Conflicts of Interest

The authors declare no conflicts of interest.

References

  1. Zhou, Y.; Liu, Z.; Wang, H.; Cheng, G.Q. Targeted poverty alleviation narrowed China’s urban-rural income gap: A theoretical and empirical analysis. Appl. Geogr. 2023, 157, 103000. [Google Scholar] [CrossRef] [Scilit]
  2. Liu, Y.; Zhang, H.Y.; Ning, M.X.; Wang, L.P. Has digital village construction narrowed the urban–rural income gap: Evidence from Chinese counties. Sustainability 2024, 16, 5330. [Google Scholar] [CrossRef] [Scilit]
  3. Wei, B.H.; Luo, M.Z.; Zhao, C.K. Bridging the gap: The effect of rural e-commerce development on internal income inequality in China. Appl. Econ. 2025, 57, 3776–3795. [Google Scholar] [CrossRef] [Scilit]
  4. National Bureau of Statistics. Available online: https://www.stats.gov.cn/sj/tjgb/nypcgb/qgnypcgb/202302/t20230206_1902101.html (accessed on 20 October 2025).
  5. Wang, H.H.; Wang, Y.B.; Delgado, M.S. The transition to modern agriculture: Contract farming in developing economies. Am. J. Agric. Econ. 2014, 96, 1257–1271. [Google Scholar] [CrossRef] [Scilit]
  6. Wang, X.B.; Herzfeld, T.; Glauben, T. Labor allocation in transition: Evidence from Chinese rural households. China Econ. Rev. 2007, 18, 287–308. [Google Scholar] [CrossRef] [Scilit]
  7. Jeanneney, S.G.; Kpodar, K. Financial development and poverty reduction: Can there be a benefit without a cost? J. Dev. Stud. 2011, 47, 143–163. [Google Scholar] [CrossRef] [Scilit]
  8. Yang, D.T.; Zhu, X.D. Modernization of agriculture and long-term growth. J. Monet. Econ. 2013, 60, 367–382. [Google Scholar] [CrossRef] [Scilit]
  9. Khan, N.; Ray, R.L.; Zhang, S.M.; Osabuohien, E.; Ihtisham, M. Influence of mobile phone and internet technology on income of rural farmers: Evidence from Khyber Pakhtunkhwa Province, Pakistan. Technol. Soc. 2022, 68, 101866. [Google Scholar] [CrossRef] [Scilit]
  10. Ling, L.L.; Chen, X.Y.; Wu, Y.C.; Li, S.W.; Wei, J.J.; Zhou, Q. National modern agricultural industrial parks: Development characteristics, regional differences, and experience inspiration—Case study of 200 NMAIPs in China. Agronomy 2023, 13, 653. [Google Scholar] [CrossRef] [Scilit]
  11. Yu, Q.; Wu, Y.C.; Chen, X.Y.; Zhang, L.; Liang, Y.W. Do China’s national agricultural science and technology parks promote county economic development? An empirical examination based on multi-period DID methods. Agriculture 2023, 13, 213. [Google Scholar] [CrossRef] [Scilit]
  12. Saidalievich, S.S. The role of agro-clusters in agricultural economics. J. Mod. Educ. Achiev. 2025, 1, 187–191. Available online: https://scopusacademia.org/index.php/jmea/article/view/1200 (accessed on 12 January 2026).
  13. Stiglitz, J.; Lin, J.Y.; Monga, C.; Zhao, C.W.; Kanbur, R.; Zhang, X.B.; Lee, K.; Page, J.; Oqubay, A.; Bhorat, H.; et al. Industrialize Africa: Strategies, Policies, Institutions, and Financing; African Development Bank Group: Tunis, Tunisia, 2017; Available online: https://www.newsghana.com.gh/wp-content/uploads/2017/11/industrialize_africa_report-strategies_policies_institutions_and_financing.pdf (accessed on 12 January 2026).
  14. Gao, Y.; Cheng, L.; Ren, Y.N.; Hu, Y.C.; Chen, L.J.; Tian, J.P. High-quality development in industrial parks: New narrative and pathway to sustainable development from a policy perspective in China. Resour. Conserv. Recycl. 2025, 215, 108111. [Google Scholar] [CrossRef] [Scilit]
  15. Guteta, G.; Worku, H. Sustainable industrial parks development in Ethiopia: Analysis of policy framework gaps. Sustain. Prod. Consum. 2023, 38, 210–224. [Google Scholar] [CrossRef] [Scilit]
  16. Boru, E.M.; Hwang, J.; Ahmad, A.Y. Understanding the drivers of agricultural innovation in Ethiopia’s integrated agro-industrial parks: A structural equation modeling and qualitative insights approach. Agriculture 2025, 15, 355. [Google Scholar] [CrossRef] [Scilit]
  17. Beghin, J.C.; Bureau, J.C.; Park, S.J. Food security and agricultural protection in South Korea. Am. J. Agric. Econ. 2003, 85, 618–632. [Google Scholar] [CrossRef] [Scilit]
  18. Jiang, D.W.; Gao, H.J.; He, S.J.; Huang, Y.; Liu, J.Y. A negative-carbon planning method for agricultural rural industrial park integrated energy system considering biomass energy and modern agricultural facilities. J. Clean. Prod. 2024, 479, 143837. [Google Scholar] [CrossRef] [Scilit]
  19. Jenane, C.; Ulimwengu, J.M. Agro-parks as drivers of the African food processing sector: Review of conditions for success. In 2022 Annual Trends and Outlook Report: Agrifood Processing Strategies for Successful Food Systems Transformation in Africa; Jenane, C., Ulimwengu, J.M., Tadesse, G., Eds.; ReSAKSS: Kigali, Rwanda, 2022; Chapter 8; pp. 92–106. Available online: https://www.resakss.org/sites/default/files/2022_ator_individual_chapters/Chapter%208_ReSAKSS_AW_ATOR_2022.pdf (accessed on 12 January 2026).
  20. Otsuka, K.; Ali, M. Strategy for the development of agro-based clusters. World Dev. Perspect. 2020, 20, 100257. [Google Scholar] [CrossRef] [Scilit]
  21. Moratalla, A.Z.; Paül, V. What is an agricultural park? Observations from the Spanish experience. Land Use Policy 2022, 112, 105584. [Google Scholar] [CrossRef] [Scilit]
  22. Klerkx, L.; Leeuwis, C. Matching demand and supply in the agricultural knowledge infrastructure: Experiences with innovation intermediaries. Food Policy 2008, 33, 260–276. [Google Scholar] [CrossRef] [Scilit]
  23. Li, X.L.; Huang, W.T.; Liu, J.L. The impact of China’s national modern agricultural industrial parks on fertilizer use from the perspective of food security. Sustainability 2025, 17, 11227. [Google Scholar] [CrossRef] [Scilit]
  24. Ke, R.J.; Chen, J.S. The impact of modern agricultural parks on regional agricultural economic growth: A case study of modern agricultural parks in Southwest China. Agric. Sci. 2025, 7, 36. [Google Scholar] [CrossRef] [Scilit]
  25. Zhang, S.D.; Wang, H.Q.; Bi, X.T.; Clift, R. Synthesis and assessment of a biogas-centred agricultural eco-industrial park in British Columbia. J. Clean. Prod. 2021, 321, 128767. [Google Scholar] [CrossRef] [Scilit]
  26. Jang, W.; Klein, C.M. Supply chain models for small agricultural enterprises. Ann. Oper. Res. 2011, 190, 359–374. [Google Scholar] [CrossRef] [Scilit]
  27. Spagnoli, L.; Mundula, L. Between urban and rural: Is agricultural parks a governance tool for developing tourism in the periurban areas? Reflections on two Italian cases. Sustainability 2021, 13, 8108. [Google Scholar] [CrossRef] [Scilit]
  28. Barkley, D.L.; Henry, M.S.; Kim, Y. Industry agglomerations and employment change in non-metropolitan areas. Rev. Urban Reg. Dev. Stud. 1999, 11, 168–186. [Google Scholar] [CrossRef] [Scilit]
  29. Khuntonthong, P.; Chakpitak, N.; Neubert, G.; Wiboonpongse, A. Development of a high-value agricultural product cluster to increase income for rural farmers: Case study of bresse chicken cluster in northern Thailand. Kasetsart, J. Soc. Sci. 2013, 34, 550–561. Available online: https://so04.tci-thaijo.org/index.php/kjss/article/view/247125 (accessed on 12 January 2026).
  30. Artz, G.M.; Kim, Y.; Orazem, P.F. Does agglomeration matter everywhere: New firm location decisions in rural and urban markets. J. Reg. Sci. 2016, 56, 72–95. [Google Scholar] [CrossRef] [Scilit]
  31. De Groot, H.L.; Poot, J.; Smit, M.J. Which agglomeration externalities matter most and why? J. Econ. Surv. 2016, 30, 756–782. [Google Scholar] [CrossRef] [Scilit]
  32. Guo, D.; Jiang, K.; Xu, C.G.; Yang, X.Y. Industrial clustering, income and inequality in rural China. World Dev. 2022, 154, 105878. [Google Scholar] [CrossRef] [Scilit]
  33. Wu, J.Z.; Ge, Z.M.; Han, S.Q.; Xing, L.W.; Zhu, M.S.; Zhang, J.; Liu, J.F. Impacts of agricultural industrial agglomeration on China’s agricultural energy efficiency: A spatial econometrics analysis. J. Clean. Prod. 2020, 260, 121011. [Google Scholar] [CrossRef] [Scilit]
  34. Zhang, H.; Wu, D.L. The impact of rural industrial integration on agricultural green productivity based on the contract choice perspective of farmers. Agriculture 2023, 13, 1851. [Google Scholar] [CrossRef] [Scilit]
  35. Lu, J.Y.; Tao, Z.G. Trends and determinants of China’s industrial agglomeration. J. Urban Econ. 2009, 65, 167–180. [Google Scholar] [CrossRef] [Scilit]
  36. Zhang, S.H.; Bani, Y.; Selamat, A.I.; Ghani, J.A. Exploring the effect of industrial agglomeration on income inequality in China. PLoS ONE 2023, 18, e0287910. [Google Scholar] [CrossRef] [Scilit]
  37. Opinions of the Central Committee of the Communist Party of China and the State Council on Deepening the Supply-Side Structural Reform in Agriculture and Accelerating the Cultivation of New Growth Drivers for Agricultural and Rural Development. Available online: http://www.moa.gov.cn/ztzl/yhwj2017/zywj/201702/t20170206_5468567.htm (accessed on 20 October 2025).
  38. Notice of the Ministry of Agriculture and the Ministry of Finance on Carrying out the Work of Establishing National Modern Agricultural Industrial Parks. Available online: http://www.moa.gov.cn/gk/tzgg_1/tz/201704/t20170401_5548300.htm (accessed on 20 October 2025).
  39. Haggblade, S.; Hazell, P.; Reardon, T. The rural non-farm economy: Prospects for growth and poverty reduction. World Dev. 2010, 38, 1429–1441. [Google Scholar] [CrossRef] [Scilit]
  40. Luo, C.; Du, Y.; Xia, Y.; Yan, Z. Place-based policies, new agricultural operating entities development, and structural transformation in China. Agric. Econ. 2025, 56, 1042–1057. [Google Scholar] [CrossRef] [Scilit]
  41. Kijima, Y.; Otsuka, K.; Sserunkuuma, D. An inquiry into constraints on a green revolution in Sub-Saharan Africa: The case of nerica rice in Uganda. World Dev. 2011, 39, 77–86. [Google Scholar] [CrossRef] [Scilit]
  42. Wan, J.Y.; Han, L.; Xu, J. How can the construction of modern agricultural industrial park promote the increase of farmers’ income—Based on the dual perspective of industrial agglomeration and structural upgrading. Rural Econ. 2024, 119–131. [Google Scholar] [CrossRef]
  43. Yang, X.Z.; Wen, J. The impact of national-level modern agricultural industrial parks on county economies: The analysis of lag effects and impact pathways. Agriculture 2025, 15, 1773. [Google Scholar] [CrossRef] [Scilit]
  44. Yang, J.; Chen, L.M.; Zhang, Y.D. Rural industrial convergence, urbanization development, and farmers’ income growth—Evidence from the Chinese experience. Front. Sustain. Food Syst. 2023, 7, 1237844. [Google Scholar] [CrossRef] [Scilit]
  45. Ding, Y. The impact of agricultural industrial agglomeration on farmers’ income: An influence mechanism test based on a spatial panel model. PLoS ONE 2023, 18, e0291188. [Google Scholar] [CrossRef] [Scilit] [PubMed]
  46. Yao, R.K.; Ma, Z.S.; Wu, H.T.; Xie, Y.F. Mechanism and measurement of the effects of industrial agglomeration on agricultural economic resilience. Agriculture 2024, 14, 337. [Google Scholar] [CrossRef] [Scilit]
  47. Kawasaki, K. The costs and benefits of land fragmentation of rice farms in Japan. Aust. J. Agric. Resour. Econ. 2010, 54, 509–526. [Google Scholar] [CrossRef] [Scilit]
  48. Palliere, A.; Cochet, H. Large private agricultural projects and job creation: From discourse to reality. Case study in Sella Limba, Sierra Leone. Land Use Policy 2018, 76, 422–431. [Google Scholar] [CrossRef] [Scilit]
  49. Dorosh, P.; Thurlow, J. Agglomeration, growth and regional equity: An analysis of agriculture-versus urban-led development in Uganda. J. Afr. Econ. 2012, 21, 94–123. [Google Scholar] [CrossRef] [Scilit]
  50. Li, E.L.; Xu, Y.N.; Ren, S.X.; Lee, J. Spin-offs, innovation spillover and the formation of agricultural clusters: The case of the vegetable cluster in Shouguang City, Shandong Province, China. Land 2022, 11, 279. [Google Scholar] [CrossRef] [Scilit]
  51. Luo, J.L.; Huang, M.M.; Hu, M.J.; Bai, Y.H. How does agricultural production agglomeration affect green total factor productivity?: Empirical evidence from China. Environ. Sci. Pollut. Res. 2023, 30, 67865–67879. [Google Scholar] [CrossRef] [Scilit]
  52. Wang, F.T.; Wang, H.; Liu, C.; Xiong, L.C.; Kong, F.B. Does economic agglomeration improve agricultural green total factor productivity? Evidence from China’s Yangtze river delta. Sci. Prog. 2023, 105, 1–27. [Google Scholar] [CrossRef] [Scilit]
  53. Lu, H.; Chen, Y.J.; Luo, J.W. Development of green and low-carbon agriculture through grain production agglomeration and agricultural environmental efficiency improvement in China. J. Clean Prod. 2024, 442, 10. [Google Scholar] [CrossRef] [Scilit]
  54. Qin, S.; Chen, H. Scientific and technological innovation effects on high-quality agricultural development: Spatial boundaries and mechanisms. Agriculture 2024, 14, 1575. [Google Scholar] [CrossRef] [Scilit]
  55. Wang, Z.; Zhang, X.Y.; Lu, H.; Kang, X.L.; Liu, B. The effect of industrial agglomeration on agricultural green production efficiency: Evidence from China. Sustainability 2023, 15, 12215. [Google Scholar] [CrossRef] [Scilit]
  56. Zhang, H.R.; Zhang, J.W.; Song, J.F. Analysis of the threshold effect of agricultural industrial agglomeration and industrial structure upgrading on sustainable agricultural development in China. J. Clean. Prod. 2022, 341, 130818. [Google Scholar] [CrossRef] [Scilit]
  57. Jin, T. Industrial Structural Change, the Urban-Rural Income Gap, and Its Regional Heterogeneity: Based on Panel Data from Thirteen Prefecture-Level Cities in Jiangsu Province, 2006–2019. In Proceedings of the 2024 14th International Conference on Information Science and Technology (ICIST), Chengdu, China, 6–9 December 2024. [Google Scholar] [CrossRef] [Scilit]
  58. Chen, C.L. The impact of foreign direct investment on urban-rural income inequality. China Agric. Econ. Rev. 2016, 8, 480–497. [Google Scholar] [CrossRef] [Scilit]
  59. Kumar, A.; Dash, P. Sectoral capital flows and income inequality. Financ. Res. Lett. 2024, 66, 105625. [Google Scholar] [CrossRef] [Scilit]
  60. Wang, J.B. Drivers of the sustainable development of agro-industrial parks: Evidence from Jiangsu Province, China. SAGE Open 2022, 12, 21582440221144415. [Google Scholar] [CrossRef] [Scilit]
  61. Su, D.; Cao, Y.; Fang, X.Q.; Wang, J.Y.; Cao, Y. Regional integration, agricultural production, and their heterogeneous interaction in the classic urban agglomeration of China. J. Clean. Prod. 2024, 464, 142806. [Google Scholar] [CrossRef] [Scilit]
  62. Wang, S.Z.; Yang, X.R. Construction of national modern agricultural industrial park and common prosperity. S. China J. Econ. 2022, 115–133. [Google Scholar] [CrossRef]
  63. Wang, J.Y.; Peng, L.; Chen, J.C.; Deng, X.Z. Impact of rural industrial integration on farmers’ income: Evidence from agricultural counties in China. J. Asian Econ. 2024, 93, 101761. [Google Scholar] [CrossRef] [Scilit]
  64. Leone, A.J.; Minutti-Meza, M.; Wasley, C. Influential observations and inference in accounting research. Account. Rev. 2019, 94, 337–364. [Google Scholar] [CrossRef] [Scilit]
  65. Ji, Q.; Yang, J.P.; Chu, Y.N.; Chen, H.J.; Guo, X.Y. Inequality of rural residents’ income in China since the targeted poverty alleviation strategy: New trends, causes, and policy implications. Res. Cold Arid Reg. 2024, 16, 201–213. [Google Scholar] [CrossRef] [Scilit]
  66. Li, Q.Q.; Zhao, Z.T.; Chen, T.T. The effect of public pension insurance integration on income disparities between urban-rural households: Evidence from a quasi-experiment in China. Financ. Res. Lett. 2024, 66, 105662. [Google Scholar] [CrossRef] [Scilit]
  67. Yuan, S.C.; Wang, X.Z. Increase or reduce: How does rural infrastructure investment affect villagers’ income? Agriculture 2024, 14, 2296. [Google Scholar] [CrossRef] [Scilit]
  68. Qian, Z.X.; Tu, Y.H.; Zhou, Z.A. The impact of financial development on the income and consumption levels of China’s rural residents. J. Asian Econ. 2022, 83, 101551. [Google Scholar] [CrossRef] [Scilit]
  69. Baptista, R.; Preto, M.T. New firm formation and employment growth: Regional and business dynamics. Small Bus. Econ. 2011, 36, 419–442. [Google Scholar] [CrossRef] [Scilit]
  70. Li, X.L.; Huang, W.T.; Liu, J.L. The impact of digital governance on energy efficiency: Evidence from e-government pilot city in China. Sustainability 2025, 17, 10475. [Google Scholar] [CrossRef] [Scilit]
  71. Xu, X.Y.; Yang, X.B.; Lian, H.P. How does tax revenue sharing affect local government governance?—Empirical evidence from Chinese cities. Financ. Res. Lett. 2024, 64, 105473. [Google Scholar] [CrossRef] [Scilit]
  72. Wang, Z.X.; Wu, J.M.; Zhou, C.J.; Li, Q. Identifying the factors of China’s seasonal retail sales of consumer goods using a data grouping approach-based GRA method. Grey Syst. 2020, 10, 125–143. [Google Scholar] [CrossRef] [Scilit]
  73. Li, S.S.; Shen, S.P.; Hu, Y.; Sun, R.Q. The impact of government intervention in rural tourism development on residents’ income: A quasi-natural experiment from China. Agriculture 2025, 15, 1269. [Google Scholar] [CrossRef] [Scilit]
  74. Cui, J.H.; Zou, T.S.; Zhao, H.Y.; Zhang, X.D.; Li, G.W.; Gao, S.W.; Lv, C.J.; Zhu, Q.H.; Zhang, L.Y.; Li, H.S. A holistic approach to evaluating environmental policy impact using a difference-in-differences model. Environ. Sci. Ecotechnol. 2025, 24, 100523. [Google Scholar] [CrossRef] [Scilit]
  75. Egami, N.; Yamauchi, S. Using multiple pretreatment periods to improve difference-in-differences and staggered adoption designs. Political Anal. 2023, 31, 195–212. [Google Scholar] [CrossRef] [Scilit]
  76. Fredriksson, A.; Oliveira, G.M.D. Impact evaluation using difference-in-differences. RAUSP Manag. J. 2019, 54, 519–532. [Google Scholar] [CrossRef] [Scilit]
  77. Roth, J.; Sant’Anna, P.H.C.; Bilinski, A.; Poe, J. What’s trending in difference-in-differences? A synthesis of the recent econometrics literature. J. Econom. 2023, 235, 2218–2244. [Google Scholar] [CrossRef] [Scilit]
  78. Borusyak, K.; Jaravel, X.; Spiess, J. Revisiting event-study designs: Robust and efficient estimation. Rev. Econ. Stud. 2024, 91, 3253–3285. [Google Scholar] [CrossRef] [Scilit]
  79. De Chaisemartin, C.; D’Haultfoeuille, X. Two-way fixed effects estimators with heterogeneous treatment effects. Am. Econ. Rev. 2020, 110, 2964–2996. [Google Scholar] [CrossRef] [Scilit]
  80. Goodman-Bacon, A. Difference-in-differences with variation in treatment timing. J. Econom. 2021, 225, 254–277. [Google Scholar] [CrossRef] [Scilit]
  81. Lu, H.Y.; Zhao, P.J.; Hu, H.Y.; Zeng, L.G.; Wu, K.S.; Lv, D. Transport infrastructure and urban-rural income disparity: A municipal-level analysis in China. J. Transp. Geogr. 2022, 99, 103292. [Google Scholar] [CrossRef] [Scilit]
  82. Jiao, M.; Xu, H.Z. How do collective operating construction land (COCL) transactions affect rural residents’ property income? Evidence from rural Deqing County, China. Land Use Policy 2022, 113, 105897. [Google Scholar] [CrossRef] [Scilit]
  83. Zhang, S.H.; Wen, X.W.; Sun, Y.; Xiong, Y.L. Impact of agricultural product brands and agricultural industry agglomeration on agricultural carbon emissions. J. Environ. Manag. 2024, 369, 122238. [Google Scholar] [CrossRef] [Scilit] [PubMed]
  84. China Family Panel Studies. Available online: https://www.isss.pku.edu.cn/cfps/en/index.htm (accessed on 20 October 2025).
  85. Li, Q.Q.; Liu, Q.L. Impact of digital financial inclusion on residents’ income and income structure. Sustainability 2023, 15, 2196. [Google Scholar] [CrossRef] [Scilit]
Figure 1. Urban–rural disparity in per capita disposable income in China, 1978–2023. Data source: China Statistical Yearbook, 2024.
Sustainability 18 01499 g001
Figure 2. Income structure of rural residents in China, 2014–2023. Data sources: China Statistical Yearbook, 2015–2024.
Sustainability 18 01499 g002
Figure 3. Intra-rural income inequality in China, 2013–2023. Data sources: China Statistical Yearbook, 2015–2024.
Sustainability 18 01499 g003
Figure 4. Geographic distribution of NMAIP batches.
Sustainability 18 01499 g004
Figure 5. Dynamic effects of NMAIP construction on rural residents’ income.
Sustainability 18 01499 g005
Figure 6. Assessment of pre-treatment trends using the Borusyak et al. (2024) [78] methodology.
Sustainability 18 01499 g006
Figure 7. Distribution of placebo estimates from 1000 simulations.
Sustainability 18 01499 g007
Table 1. Batches and time of NMAIPs.
BatchTimeNMAIP Quantity
1June 201711
2September 201730
3June 201821
4June 201945
5April 202031
6April 202150
7April 202250
Table 2. Variable definitions and descriptive statistics.
VariablesDefinitionsNMeanS.D.
Panel A. Key variables
Rural residents’ incomePer capita disposable income of rural residents (10,000 yuan)23,1581.5270.649
NMAIP construction=1 if the county implemented the NMAIP policy, 0 otherwise23,1580.0290.168
Panel B. Control variables
GDPThe gross domestic product per capita, logarithmic23,1401.4420.701
InfrastructureTotal investment in fixed assets as a share of GDP23,1581.1590.914
Financial developmentBalance of loans to financial institutions as a share of GDP23,1580.8050.635
Financial revenueGeneral budget income as a share of GDP23,1580.0710.074
Industrial structurePrimary industry added value as a share of GDP23,1580.1650.123
Human capitalStudents enrolled in general secondary schools as a percentage of the total population23,1400.0480.020
Information infrastructurePercentage of broadband users in the total population23,1400.3020.659
Public serviceHospital beds per 10,000 population23,14051.03134.472
Population densityTotal population/administrative area23,1580.0710.257
Panel C. Mechanism variables
Employment scalePercentage of total population employed in the sector23,1400.0760.048
Entrepreneurial activityTotal number of new business registrations20,3970.6490.724
Agricultural productivityTotal output value of agriculture/Total number of people employed in agriculture23,1584.9165.417
Patent licensesNumber of patents granted per 10,000 people16,7901.0953.334
Tax revenueTotal tax revenue, logarithmic22,39110.9401.275
ConsumptionTotal social consumption per capita, logarithmic23,1400.9840.538
Table 3. Baseline regression results: the effect of NMAIP construction on rural residents’ income.
(1)(2)(3)(4)
VariablesRRIRRIRRIRRI
NMAIP0.027 ***0.027 ***0.028 ***0.028 ***
(0.009)(0.009)(0.009)(0.009)
GDP −0.058 ***−0.065 ***−0.055 ***
(0.008)(0.011)(0.011)
Infrastructure −0.010 ***−0.008 ***−0.008 **
(0.003)(0.003)(0.003)
Financial development 0.015 **0.018 ***0.021 ***
(0.006)(0.007)(0.007)
Financial revenue 0.073 *0.081*
(0.044)(0.043)
Industrial structure −0.234 ***−0.222 **
(0.091)(0.087)
Human capital −0.315 **−0.144
(0.146)(0.015)
Information infrastructure −0.003
(0.003)
Public service −0.000 ***
(0.000)
Population density 0.091 ***
(0.020)
County FEYesYesYesYes
Year FEYesYesYesYes
Constant1.526 ***1.610 ***1.6631.650 ***
(0.001)(0.015)(0.028)(0.027)
N23,15823,14023,14023,140
Note: The significance levels of 1%, 5%, and 10% are denoted by ***, **, and *, respectively. Robust standard errors are reported in parentheses.
Table 4. Bacon decomposition results.
EstimatesWeight
Early treatment vs. Later control0.0040.010
Later treatment vs. Early control0.0210.023
Treatment vs. Never treated0.0270.967
Table 5. Results of other robustness tests.
Test MethodsCoefficients on NMAIPStandard ErrorsN
Panel A. PSM-DID model
Kernel matching0.028 ***0.00922,862
Radius matching0.027 ***0.00921,471
Nearest neighbor matching0.026 ***0.00921,970
Local linear regression matching0.029 ***0.00922,828
Panel B. Controlling for concurrent policies
Controlling for the RHR policy0.027 ***0.00923,140
Controlling for the IURTC policy0.027 ***0.00923,140
Controlling for the IVH policy0.028 ***0.00923,140
Controlling for the ERA policy0.028 ***0.00923,140
Controlling for the BCS policy0.027 ***0.00923,140
Controlling for all the above policies0.026 ***0.00923,140
Panel C. Additional robustness checks
Excluding samples located in special cities0.021 **0.00922,460
Deleting the 2021–2022 sample0.025 ***0.00918,084
Adding the pre-variables0.023 **0.00923,140
Note: The dependent variable is rural residents’ income. The significance levels of 1% and 5% are denoted by *** and **, respectively. Robust standard errors are reported.
Table 6. Mechanism test: Facilitating employment expansion.
(1)(2)(3)(4)
VariablesEmployment ScaleEntrepreneurial ActivityRRIRRI
NMAIP0.001 *0.071 ***−0.063 ***−0.009
(0.001)(0.027)(0.018)(0.014)
NMAIP × Employment scale 1.220 ***
(0.200)
NMAIP × Entrepreneurial activity 0.035 ***
(0.010)
Control variablesYesYesYesYes
County FEYesYesYesYes
Year FEYesYesYesYes
N23,14020,38923,14020,389
Note: The significance levels of 1% and 10% are denoted by *** and *, respectively. All primary terms are controlled in columns (3) and (4). Robust standard errors are reported in parentheses.
Table 7. Mechanism test: Enhancing technological progress.
(1)(2)(3)(4)
VariablesAgricultural ProductivityPatent LicenseRRIRRI
NMAIP0.347 ***0.196 ***−0.0120.007
(0.098)(0.059)(0.016)(0.011)
NMAIP × Agricultural productivity 0.006 ***
(0.002)
NMAIP × Patent license 0.021 ***
(0.008)
Control variablesYesYesYesYes
County FEYesYesYesYes
Year FEYesYesYesYes
N23,14016,70023,14016,700
Note: The significance levels of 1% is denoted by ***. All primary terms are controlled in columns (3) and (4). Robust standard errors are reported in parentheses.
Table 8. Mechanism test: Attracting capital inflows.
(1)(2)(3)(4)
VariablesTax RevenueConsumptionRRIRRI
NMAIP0.031 **0.047 ***−0.549 ***−0.039 **
(0.014)(0.010)(0.099)(0.019)
NMAIP × Tax revenue 0.051 ***
(0.009)
NMAIP × Consumption 0.056 ***
(0.015)
Control variablesYesYesYesYes
County FEYesYesYesYes
Year FEYesYesYesYes
N22,37323,14022,37323,140
Note: The significance levels of 1% and 5% are denoted by *** and **, respectively. All primary terms are controlled in columns (3) and (4). Robust standard errors are reported in parentheses.
Table 9. Heterogeneity by type of NMAIP.
(1)(2)(3)(4)
VariablesRRIRRIRRIRRI
Bulk commodity parks0.069 ***
(0.018)
Specialty high-value commodity parks 0.014
(0.010)
Single-function parks 0.014
(0.011)
Integrated-function parks 0.054 ***
(0.016)
Control variablesYesYesYesYes
County FEYesYesYesYes
Year FEYesYesYesYes
N23,14023,14023,14023,140
Note: The significance levels of 1% is denoted by ***. Robust standard errors are reported in parentheses.
Table 10. Heterogeneity by agricultural development foundation.
Production SpecializationMechanization LevelUnique Resource Endowment
AverageHighAverageHighAverageHigh
(1)(2)(3)(4)(5)(6)
VariablesRRIRRIRRIRRIRRIRRI
NMAIP0.069 ***−0.0060.068 ***−0.0110.026 *0.020
(0.014)(0.011)(0.013)(0.013)(0.015)(0.013)
Control variablesYesYesYesYesYesYes
County FEYesYesYesYesYesYes
Year FEYesYesYesYesYesYes
N10,15212,98811,42511,604958813,409
Note: The significance levels of 1% and 10% are denoted by *** and *, respectively. Robust standard errors are reported in parentheses.
Table 11. Impacts of NMAIP construction on urban residents’ income and urban–rural income gap.
(1)(2)(3)
VariablesUrban Residents’ IncomeUrban–Rural Income GapUrban–Rural Income Gap
NMAIP0.094 ***0.060 ***
(0.019)(0.008)
NMAIP implementation years 0.050 ***
(0.010)
NMAIP implementation years square term −0.005 *
(0.003)
Control variablesYesYesYes
County FEYesYesYes
Year FEYesYesYes
N23,14023,14023,140
Note: The significance levels of 1% and 10% are denoted by *** and *, respectively. Robust standard errors are reported in parentheses.
Table 12. Impacts of NMAIP construction on rural residents’ income structure.
(1)(2)(3)(4)
VariablesOperating IncomeWage IncomeProperty IncomeTransfer Income
NMAIP0.059 **0.126 ***0.0030.013
(0.024)(0.044)(0.004)(0.021)
Control variablesYesYesYesYes
Household FEYesYesYesYes
Year FEYesYesYesYes
N19,25018,97919,49019,089
Note: The significance levels of 1% and 5% are denoted by *** and **, respectively. Robust standard errors are reported in parentheses.
Table 13. Impact of NMAIP construction on rural internal income inequality.
(1)(2)(3)(4)(5)
VariablesInternal Income InequalityOperating Income InequalityWage Income InequalityProperty Income InequalityTransfer Income Inequality
NMAIP−0.030 **−0.028 ***−0.055 ***0.004−0.024 **
(0.013)(0.013)(0.016)(0.008)(0.010)
Control variablesYesYesYesYesYes
Household FEYesYesYesYesYes
Year FEYesYesYesYesYes
N19,11919,18318,89419,29019,068
Note: The significance levels of 1% and 5% are denoted by *** and **, respectively. Robust standard errors are reported in parentheses.
Disclaimer/Publisher’s Note: The statements, opinions and data contained in all publications are solely those of the individual author(s) and contributor(s) and not of MDPI and/or the editor(s). MDPI and/or the editor(s) disclaim responsibility for any injury to people or property resulting from any ideas, methods, instructions or products referred to in the content.