Article

Research on Key Influencing Factors and Path Mechanisms of Urban Resilience Construction

Department of Safety Engineering, School of Built Environment Engineering, Zhengzhou University of Light Industry, Zhengzhou 450001, China
*
Author to whom correspondence should be addressed.
Sustainability 2026, 18(2), 943; https://doi.org/10.3390/su18020943
Submission received: 15 December 2025 / Revised: 8 January 2026 / Accepted: 14 January 2026 / Published: 16 January 2026

Abstract

With socioeconomic development, cities face increasingly complex and diverse disaster risks, making the construction of resilient cities an inevitable choice. However, the driving forces and tactical approaches behind urban resilience development remain unclear for urban safety development, thus posing challenges to cities urgently needing to enhance their resilience. Therefore, this paper investigates this issue, covering the following aspects: (1) Eighteen influencing factors within the complex system of urban resilience were identified and summarized from five perspectives: Economic, Social, Environmental, Infrastructure, and Organizational & Institutional. The attributes of the influencing factors were analyzed using the Decision-Making Experimentation and Evaluation Laboratory (DEMATEL) method, and key factors were identified accordingly. (2) The Total Adversarial Interpretive Structure Model (TAISM) method was applied to construct a multi-perspective adversarial recursive structural model with integrated impact values. This model illustrates the interrelationships among the influencing factors and clarifies their hierarchical structure. (3) A Fuzzy Reachability Matrix (FR) was introduced to handle uncertain relationships between factors in the comprehensive influence matrix, enabling an explicit analysis of the hierarchical structure of the urban resilience complex coupling giant system, clearly showing the impact of factor hierarchical changes on the system structure. (4) Building upon the analysis of factors affecting urban resilience, the specific pathways and mechanisms were articulated, followed by recommended measures formulated from both internal (governmental) and external (community) perspectives. The results can provide theoretical support for resilient city construction and serve as a practical cornerstone.

1. Introduction

With the intensification of global extreme climate change, cities, as important economic activity hubs, are under increasing pressure from disasters. How to rescue cities from these pressures is a crucial issue in current disaster management, urban planning, and sustainable development. United Nations data indicate that over the past decade, economic losses due to disasters in urban areas accounted for more than 70% of global total losses [1]. This global challenge is particularly prominent in China, where rapid urbanization is underway. With an urbanization rate exceeding 66%, economic losses from urban disasters in China account for 75% of the national total, echoing global statistics. China’s resilience-building pathway, grounded in its national reality of multiple disaster types and high population density, also serves as a typical demonstration for global cities facing similar challenges. Against this backdrop, building resilient cities is not only a necessity for disaster prevention and mitigation, but also an inevitable choice for achieving sustainable urban development. In November 2020, the Chinese government document “The CPC Central Committee’s Proposal on Formulating the 14th Five-Year Plan for National Economic and Social Development and the Long-Range Objectives Through the Year 2035” for the first time included the “resilient city” in the national strategic planning system, highlighting the importance of building resilient cities. Enhancing the comprehensive capacity of cities is the fundamental strategy for coping with risk shocks, and building resilient cities is integral to this.
As an important guiding tool for resilient city construction, the practical value of urban resilience assessment has been widely recognized [2]. However, academia has not yet formed a unified standard or mature paradigm regarding the construction path and core elements of a scientific assessment system [3]. It is worth noting that in terms of the framework and indicator system for resilience assessment, the academic community has reached a relatively unified understanding and standard. Representative indicator systems, such as those by Feng, X. [4] and Wu, C. [5], explore urban resilience assessment indicators from economic, ecological, social, and infrastructure aspects. Cutter, S. L. [6] posits that urban resilience assessment indicators include climate disaster resilience, economic resilience, community resilience, organizational resilience, and infrastructure resilience. Hong H. [7] argues that urban resilience assessment includes macro, meso, and micro scales. Wang W. [8] and Dong, W. [9] constructed an evaluation system for urban economic resilience development level from five aspects: industrial agglomeration degree, economic growth level, wealth gap, urban industrial structure optimization, and urban economic sensitivity. It is evident that scholars’ evaluation systems for urban resilience development levels mostly encompass economic, ecological, social, infrastructure, and other aspects. In summary, scholars have conducted multi-dimensional explorations around core issues such as the conceptual deconstruction and assessment system construction of urban resilience. Relevant achievements have not only enriched the theoretical system in the field of urban resilience, but also provided a solid literature foundation and methodological reference for this study. However, there is currently no unified consensus in academia on key issues, such as the key driving factors and path mechanisms of urban resilience, which provides ample space for this research.
In summary, researching quantitative assessment methods for urban resilience and its key driving factors and path mechanisms is crucial and has gained unanimous recognition from scholars. The predominant research method for studying factors influencing urban resilience is qualitative analysis based on specific cases [10,11,12,13,14]. Although this method is easy to operate, the results are relatively abstract and have limited adaptability. In the construction of urban resilience, qualitative assessment is prone to subjective judgment, leading to ambiguous assessment results and making it difficult to compare the temporal and spatial differences in regional resilience. Quantitative assessment, on the other hand, relies on data modeling to quantify indicators such as disaster resistance and recovery capacity, providing a scientific basis for precise planning in resilience building. Quantitative investigations into the determinants of urban resilience remain scarce, with only a limited number of studies adopting such approaches [15,16,17,18]. Moreover, existing research typically examines influencing factors in isolation, often neglecting the complex interdependencies and systemic interactions among them [13,16,19,20]. A major limitation lies in the lack of rigorous and systematic methodological frameworks capable of uncovering the underlying mechanisms and driving forces that govern urban resilience. This methodological gap underscores the need for more integrative and analytically robust approaches to advance theoretical understanding and empirical modeling in this field. Therefore, certain deficiencies still exist in understanding and promoting urban resilience construction. The entire research field remains in an early exploratory stage. The institutional mechanisms for urban resilience construction are still incomplete and insufficiently comprehensive, posing significant challenges to understanding the driving forces and path mechanisms of urban resilience across multiple dimensions.
This paper indicatively introduces the hybrid method DEMATEL-FR-TAISM into the field. The DEMATEL-FR-TAISM method is a scientific tool for analyzing hierarchical relationships and feedback mechanisms among factors in complex systems. This method combines the advantages of the Decision-Making Experimentation and Evaluation Laboratory method in quantifying causal relationships with the strengths of the Total Adversarial Interpretive Structure Model in visualizing hierarchical structures, and introduces a fuzzy reachability matrix to handle uncertain relationships. However, existing applied research has mostly focused on fields such as safety management and causal analysis of water seepage accidents, and has not yet involved risk management for urban disaster resilience. Based on this, this paper views urban disaster resilience as a dynamically evolving complex system and constructs an identification model for key influencing factors of urban disaster resilience based on DEMATEL-FR-TAISM, aiming to provide theoretical support and a methodological foundation for substantively improving urban resilience levels and risk prevention and control capabilities.

2. Materials and Methods

2.1. Indicator System Construction

To identify urban resilience influencing factors, this study performed a PRISMA-compliant systematic review using WOSCC. With keywords (“urban resilience”, “influencing factors”) and retrieval period 2010–2025, 1342 articles were initially obtained; 28 core ones were selected after removing duplicates and full-text screening, based on inclusion (English peer-reviewed empirical/theoretical papers) and exclusion (non-empirical, rural/regional-focused works) criteria. Key factors are linked to specific studies: infrastructure robustness [21], governance capacity [22], social [23], ecological quality [24] and environmental carrying capacity [25]. While core factors are widely recognized, gaps in cross-scale interactions and dynamic mechanisms motivate this research.
Firstly, this paper utilizes databases such as Web of Science to search for keywords like “urban resilience,” “urban resilience indicators,” and “resilience measurement,” to explore factors influencing the quantitative measurement of urban resilience [26,27,28]. Based on the hierarchical characteristics of China’s administrative division system and regional development disparities, this paper constructs a multi-level urban resilience evaluation indicator system that is both open and systematic. It is vertically divided into five core dimensions: economic resilience, social resilience, ecological resilience, infrastructure resilience, and organizational & institutional resilience, comprising a total of 18 specific indicators. This indicator system serves as the foundation for subsequent analysis using the combined DEMATEL-FR-TAISM method. By quantifying causal relationships between indicators and dividing the hierarchical structure (underlying driving layer, intermediate transmission layer, target layer), key driving factors and path mechanisms for resilient city construction are ultimately identified, providing data support for policy formulation.

2.2. DEMATEL-FR-TAISM Combined Model Analysis Method

The Decision-Making Trial and Evaluation Laboratory (DEMATEL) is a system factor analysis method grounded in expert judgment, designed to address uncertain relational factors [29]. By employing matrix and graph theory, it quantifies inter dependencies among elements to pinpoint key factors and causal relationships within complex systems [30]. Complementarily, the Interpretive Structural Model (ISM), introduced by Warfield in 1973, finds extensive application in systems engineering and artificial intelligence [31]. ISM employs a result-first hierarchical extraction process, arranging elements to derive a definitive hierarchical diagram [32,33].
The DEMATEL-FR-TAISM method features a unique advantage of balancing causal intensity and hierarchical structure. It has been widely applied to clarify the causal intensity and hierarchical structure among various factors within the complex system of resilience recovery [34]. By introducing the fuzzy reachability matrix (FR) into the combined model of the DEMATEL and the ISM, a new DEMATEL-FR-TAISM model is formulated. Utilizing this model enables a more comprehensive analysis of the constructed system. The DEMATEL-FR-TAISM approach first employs DEMATEL to allow experts to score the degree of influence, and then derives the reachability matrix for TAISM based on the quantified matrix. This process reduces subjective judgment errors stemming from binary (all-or-nothing) determinations, resulting in a hierarchical classification that more accurately reflects the actual strength of interrelationships.
Two adversarial multi-level recursive causal structure models can be derived via this method. It enables the identification of a more comprehensive and persuasive factor hierarchical structure, and provides an intuitive visualization of the influence degree and hierarchical structure of the relationships between factors [35]. Therefore, the DEMATEL-FR-TAISM model can be used to identify and evaluate potential causal components of complex systems and specify their structural hierarchy [36]. Compared to a single DEMATEL or a single TAISM, the combined method can simultaneously answer questions of who is more important and who influences whom at which stage, making it particularly suitable for complex systems with multiple factors and strong interconnections [37].
A city is a highly complex coupled giant system, and there exist complex connections among factors influencing urban resilience. A model for identifying key driving factors and mechanisms of urban resilience was constructed based on the DEMATEL-FR-TAISM method. This model, based on the principle of system integrity in systems science, integrates the DEMATEL method and the FR-TAISM method. This model can effectively depict the complex interrelationships among factors influencing urban resilience, forming a comprehensive understanding of the overall characteristics of the urban resilience system, providing theoretical support and a methodological foundation for substantively improving urban resilience levels and risk prevention and control capabilities.
To analyze the complex coupled mechanisms of the urban resilience system, we directly model the indicators using the DEMATEL-FR-TAISM method [38]. The unique strength of this methodology is its capacity to deconstruct interactive influences [39], effectively differentiating between core driving factors and dependent outcomes, thus providing a holistic visualization of the system’s architecture. The DEMATEL-FR-TAISM hybrid model offers distinct advantages over conventional approaches. Unlike Bayesian Networks, it does not rely on prior probabilities, thus simplifying data acquisition. Furthermore, in contrast to Structural Equation Modeling (SEM)—which requires the pre-specification of complex measurement and structural models, placing high demands on the operator’s expertise—the hybrid model does not require predefined factor attributes. Instead, it endogenously derives these attributes through computation, enhancing its generalizability. This capability is particularly pertinent given the nature of urban resilience as a complex ‘giant system’ characterized by non-linear causalities and hierarchical structural jumps. Consequently, this study adopts the DEMATEL-FR-TAISM model to explicitly analyze the hierarchical structure of this complex coupled system, thereby clearly elucidating the interrelationships between factors and the system’s architecture.
The DEMATEL-FR-TAISM method inherits the Total Adversarial Interpretive Structural Model method; through a fuzzy adversarial multi-level recursive structural model, it helps elucidate the interrelationships and hierarchical structure of influencing factors. The innovations of this paper are as follows: (1) Regarding factors influencing urban resilience, five dimensions and 18 representative factors were comprehensively considered and selected. The DEMATEL-FR-TAISM method was used to study the interaction relationships among these factors, rather than the independent analysis of influencing factors in the past, thereby deriving key factors for enhancing urban resilience and a more scientific and reasonable analysis. (2) Improvements were made to the traditional ISM method, forming the TAISM, and DEMATEL-FR-TAISM was applied to the complex system analysis of urban resilience. This method can provide an entire framework for complex system hierarchical analysis, publicly and clearly representing the structural relationships within the system hierarchy from the perspectives of result and cause. (3) Based on the results of the DEMATEL-FR-TAISM analysis, the evolutionary path mechanisms of urban resilience were elucidated, thereby providing more comprehensive suggestions and strategies for urban resilience construction from both external and internal perspectives.

2.3. Construction of the DEMATEL-FR-TAISM Model

2.3.1. DEMATEL for Identifying Risk Influencing Factors

1.
Determine the Initial Direct Influence Matrix O:
Utilizing data gathered from departmental visits and statistical yearbooks, the mutual influence relationships among the 18 selected factors within the multidimensional system were quantified and scored. The survey targeted a diverse range of respondents, comprising construction entities, operation and maintenance managers, government officials, and researchers in academia. The strength of influence between two factors was scored from 0 to 10, where 0 indicates no influence, 5 indicates general influence, and 10 indicates strong influence. The scoring sheets provided by the experts were compiled, and the cumulative sum for each quantified influence relationship was calculated. This process yielded the multi-factor direct influence matrix O, defined as:
O   =   ( O i j ) n × n
where O i j represents the degree of influence of S i on S j , n is the number of influencing factors. S i is the i-th indicator. S j is the j-th indicator 1 ≤ in, 1 ≤ jn.
2.
Determine the Synthesis Influence Matrix T:
The direct influence matrix O is first normalized using Equation (2) to yield the normalized matrix N. Subsequently, matrix N is processed with Equation (3) to calculate the synthesis influence matrix T. The calculation formulas are as follows:
N = ( O i j M a x a i 2 + b i 2 ) n × n
T = ( t i j ) n × n = N + N 2 + N 3 + + N k = k = 1 N k T = N ( I N ) 1
where k is the number of iterations, i.e., the number of layers or steps of influence transmission; I is the identity matrix; N k is the indirect influence generated through transmission via k 1 intermediate factors; a i is the set of sums of each row; b j is the set of sums of each column; I is the identity matrix, representing the influence of the factor itself.
3.
Determine Factors of Influence-Related Indicators:
Using the synthesis influence matrix T, the influence degree (Di), influenced degree (Ci), centrality degree (Mi), and cause degree (Ri) for each factor are calculated using the following formulas:
D i = i = 1 n t i j         ( i = 1,2 , 3 , , n )
C i = j = 1 n t i j         ( j = 1,2 , 3 , , n )
M i = D i + C i
R i = D i C i
where the influence degree Di is defined as the sum of the i-th row elements, quantifying the total influence exerted by factor i on all other factors in the system. Conversely, the influenced degree Ci is the sum of the i-th column elements, representing the total influence received by factor i from all others. Each element tij within the matrix depicts the comprehensive influence of factor i on factor j.
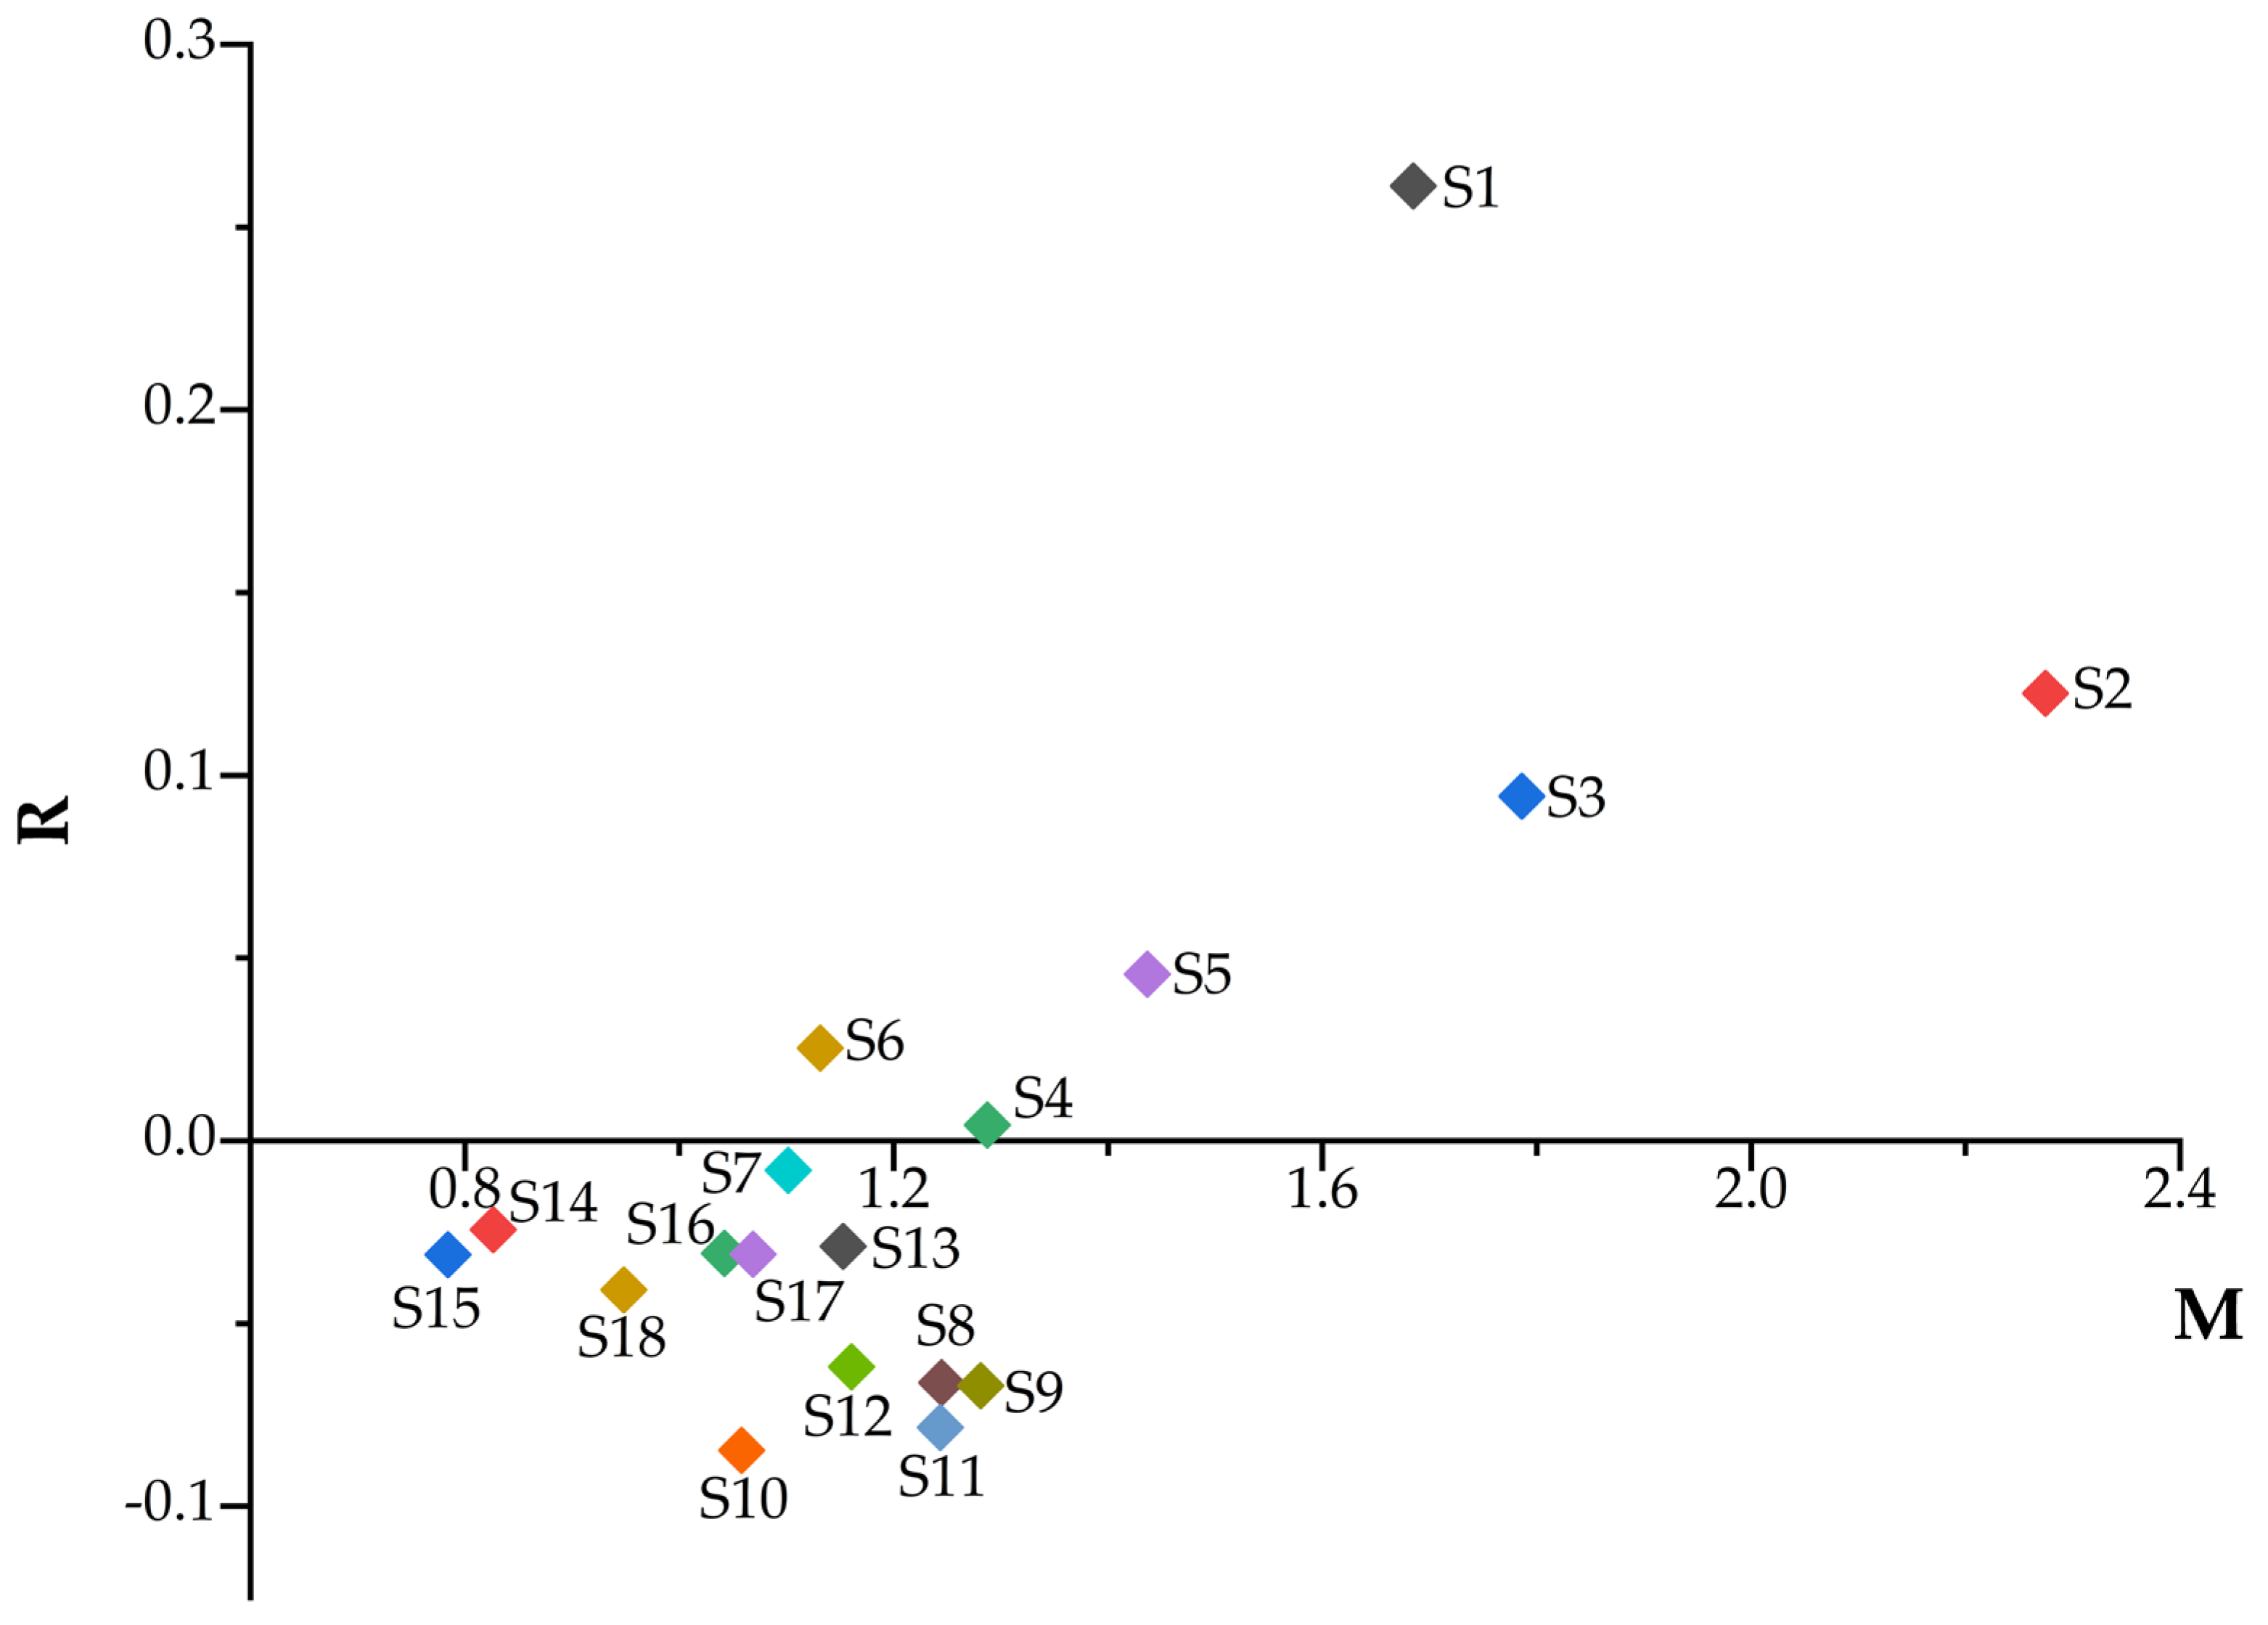
To visually analyze the importance of each factor, a cause-and-effect diagram is constructed using centrality degree Mi and cause degree Ri as the horizontal and vertical coordinates, respectively. Each constraint is plotted accordingly. Among the 18 resilience factors, any factor with Ri > 0 is classified as a cause factor. otherwise, it is deemed a result factor.

2.3.2. Parsing Relationship Risk Factors Based on FR-TAISM

1.
Calculate the Fuzzy Reachability Matrix FR:
The fuzzy multiplication matrix FB is calculated using Equation (8). The fuzzy multiplication matrix FB has the characteristic of having all 1 s on its main diagonal. The fuzzy multiplication matrix is multiplied using the Zadeh operator (max-min) until the matrix no longer changes, yielding the fuzzy reachability matrix FR. Then, combining with Equation (9), the fuzzy reachability matrix FR is obtained.
F B = T + I
F R = F B ( k + 1 ) = F B k F B ( k 1 )
where F B k is the result after k 1 iterations of the Zadeh operator on matrix FB; F B ( k 1 ) is the result after k iterations of the Zadeh operator on matrix FB; F B ( k + 1 ) is the result after k + 1 iterations of the Zadeh operator on matrix FB.
Let F C = F B × F B
F C = [ c i j ] n × n
F B = [ b i j ] n × n
The fuzzy operator adopts the Zadeh operator, i.e., the max-min operator, in the following format:
c i j = k = 1 n b i k b k j = ( b i 1 b 1 j ) ( b i 2 b 2 j ) ( b i 3 b 3 j ) ( b i n b n j )
2.
Determine the Fuzzy Reachable Matrix Threshold Set Φ:
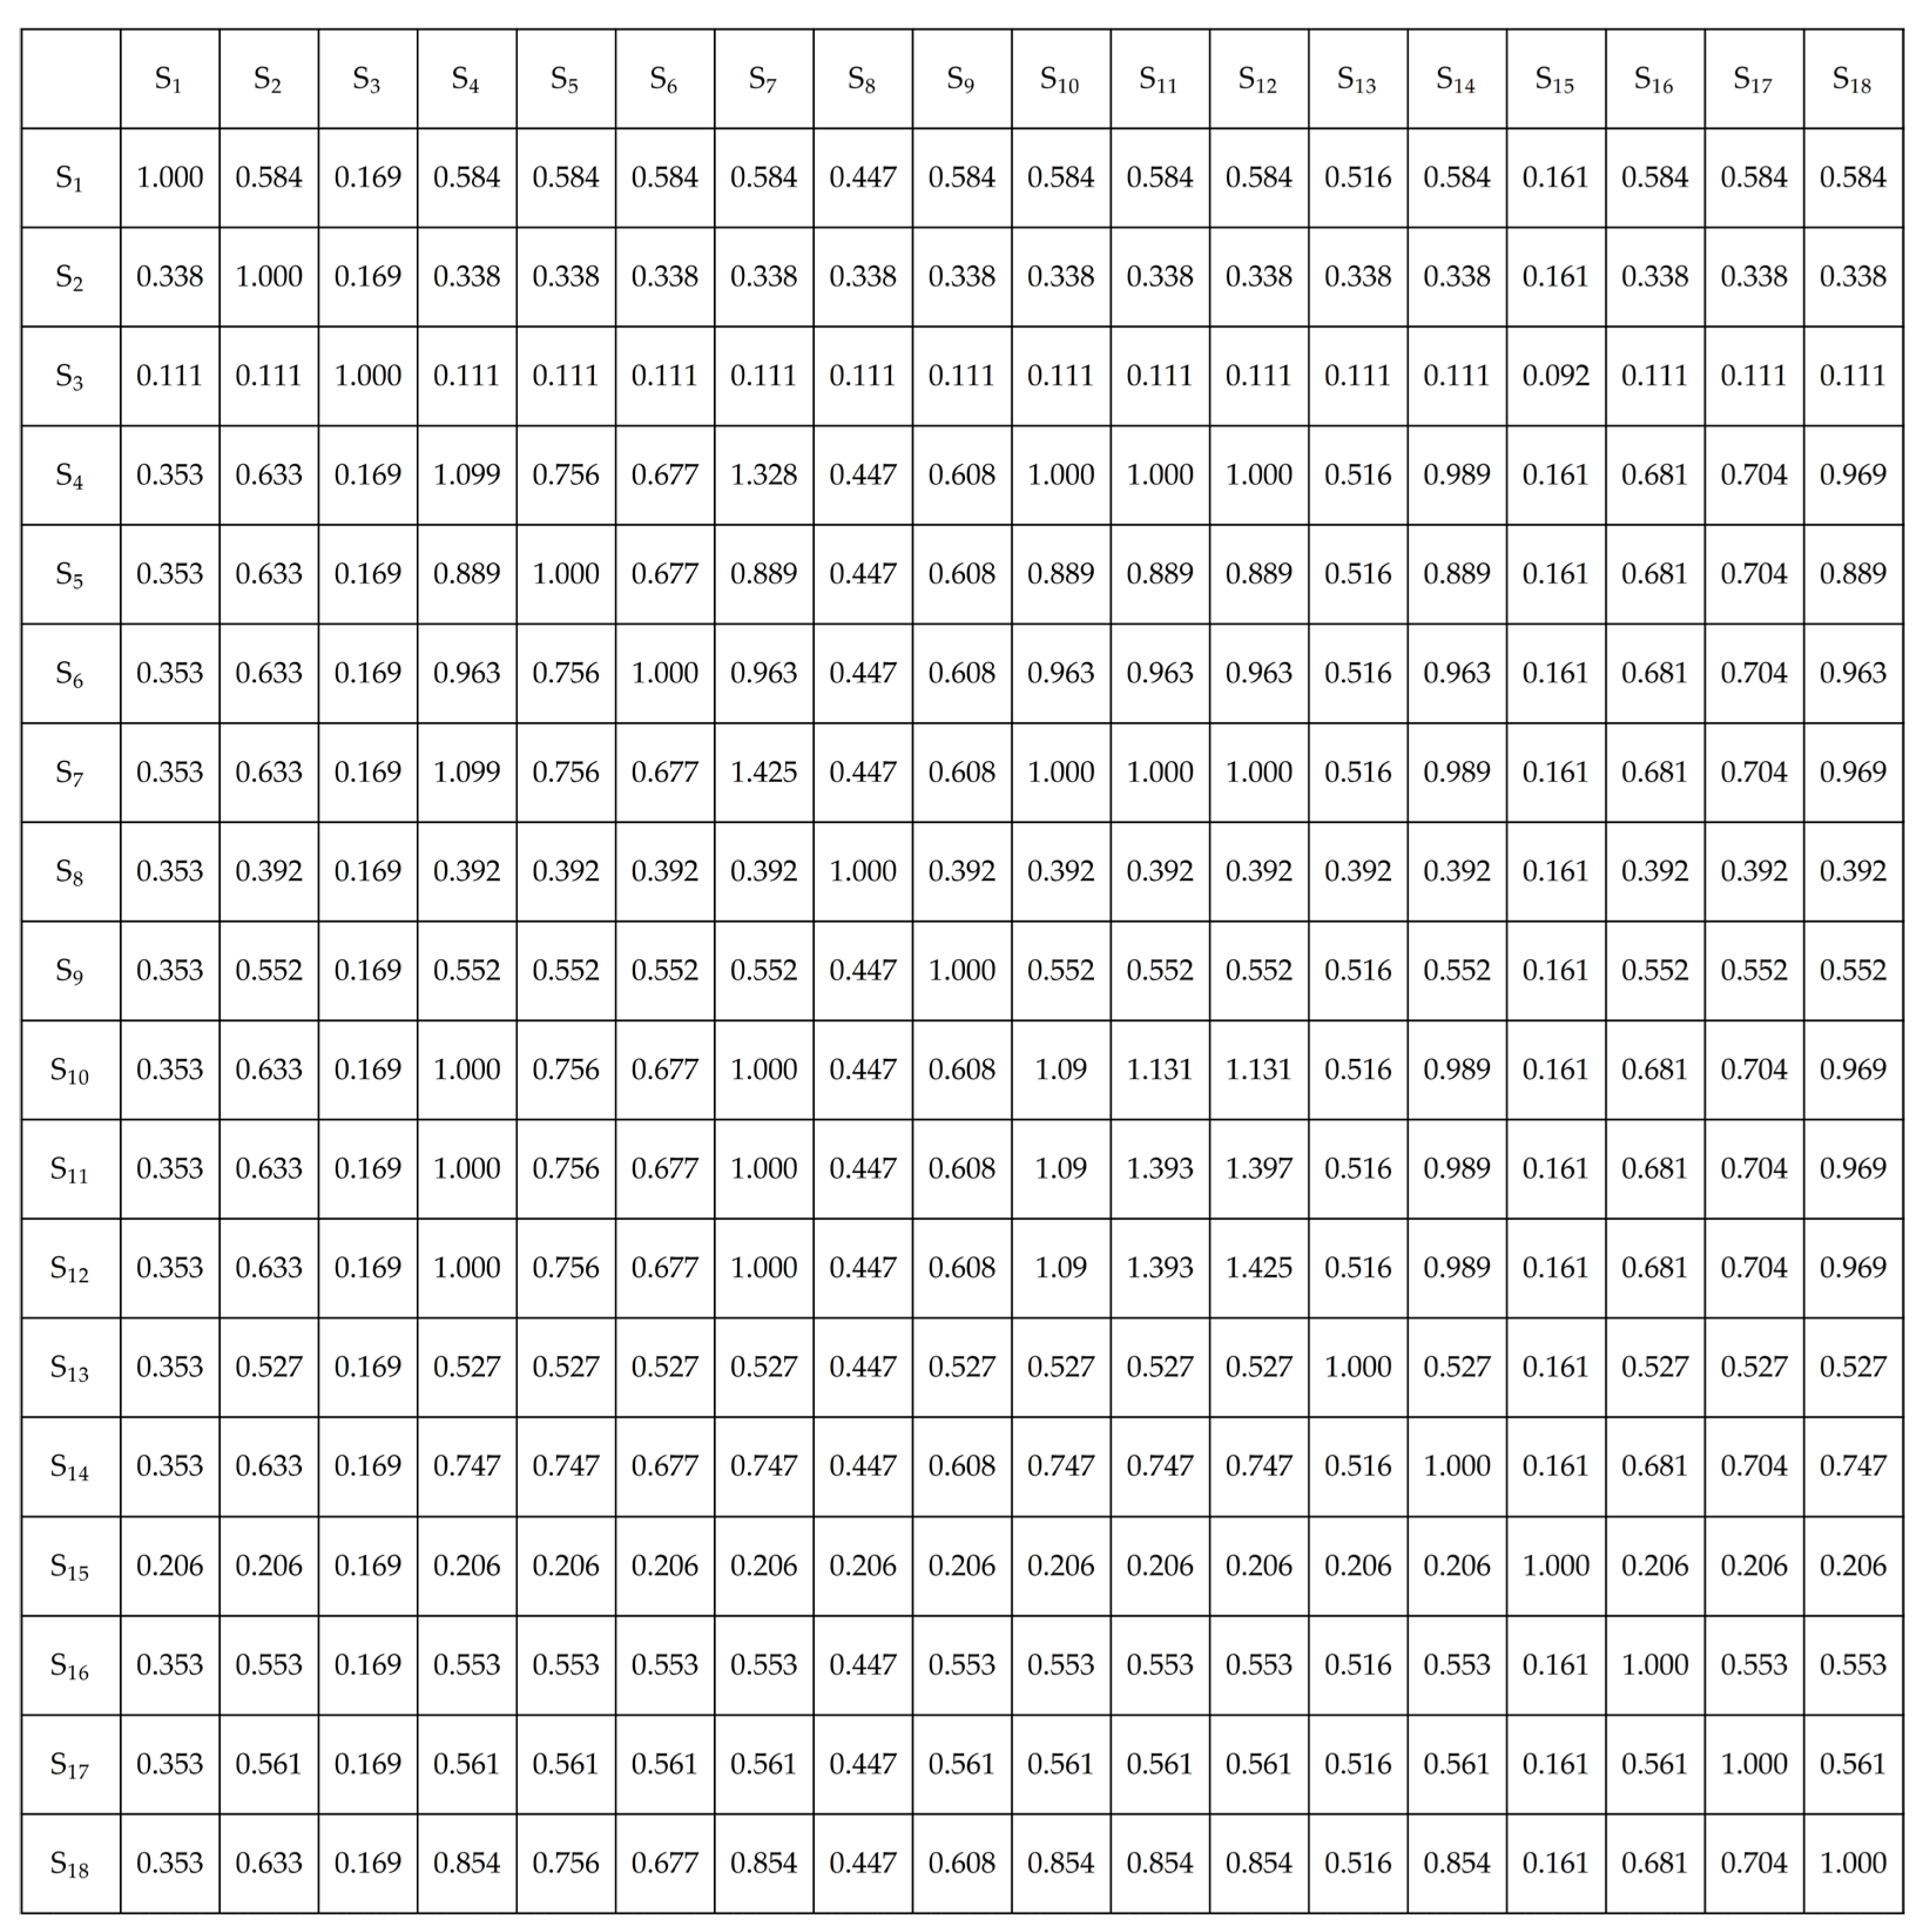
The fuzzy reachable matrix threshold set Φ can be obtained by removing duplicate element values from the FR. Each threshold corresponds to one characteristic structure, and different threshold cut-offs will generate different reachable matrix sets.
3.
Calculate the Reachable Matrix R :
The fuzzy reachable matrix FR is taken with a cutoff k ( k     [ 0, 1]), and the resulting cutoff matrix is the reachable matrix R .
Then the matrix value r i j of the reachable matrix R is as follows:
r i j = { 1 , f r i j k 0 , f r i j < k
where r i j is the element value in the i row and j column of the reachable matrix R ; f r i j is the element value in the i row and j column of the fuzzy reachable matrix F R ; k is the cutoff value.
4.
Calculate the General Skeleton Matrix S:
The reachable matrix is processed through point and edge reduction to derive the minimally connected general skeleton matrix. This involves two key operations. First, in point reduction, circuits (loops) are treated as single elements; herein, the Tarjan algorithm is employed for circuit detection. Subsequently, edge reduction is performed on the reachable matrix to examine relationships among strongly connected factors, specifically by deleting skip-level binary relationships where adjacent binary relationships exist, resulting in the edge-reduced distance matrix S′. Finally, loop factors are substituted back to obtain the general skeleton matrix S.
Its mathematical expression is as follows:
S = R ( R I ) 2 I
where R is the reduction point matrix obtained after performing reduction point operations on the reachable matrix R.
5.
Calculate the Comprehensive Influence Skeleton Matrix W S :
Replace the value ‘1’ in the general skeleton matrix S with the corresponding synthesis influence value, re-mark the feedback edges, and the remaining edges with influence values are cross-level edges. The resulting matrix with influence values is W S .
6.
Analyze and Determine the Characteristic Structure:
Perform hierarchical analysis on the system. Different reachable matrices are obtained based on different thresholds. Boolean algebra operations on them can yield different hierarchical structural characteristics, enabling explicit analysis of all structural forms of the urban resilience complex system. During the explicit analysis process, result-priority hierarchical division structure (UP-type) and cause-priority hierarchical structure (DOWN-type) can be obtained according to extraction rules. Up-type and down-type belong to a set of opposing hierarchical division results. Elements in the adjacency matrix are the evaluation objects, and causal relationships between evaluation objects are represented by directed line segments, with the result object element placed at the topmost layer, hence the topmost element is the final result.
7.
Draw UP/DOWN-Type Adversarial Directed Hierarchical Topology Diagrams with Influence Values:
Substitute the values from the WS matrix into the already obtained element hierarchies of UP-type and DOWN-type, adding connecting lines. The Up-type and down-type form a set of topological hierarchy diagrams, also called adversarial hierarchical topology diagrams. They have the following characteristics: (1) Directed line segments have numerical values representing the magnitude of influence between elements. (2) Directed line segments are labeled, and line segments on loops are no longer labeled with influence values. Since feedback edges within a loop are at the same hierarchy, the influence values in the final adversarial hierarchical topology diagram are the influence values between hierarchical elements.
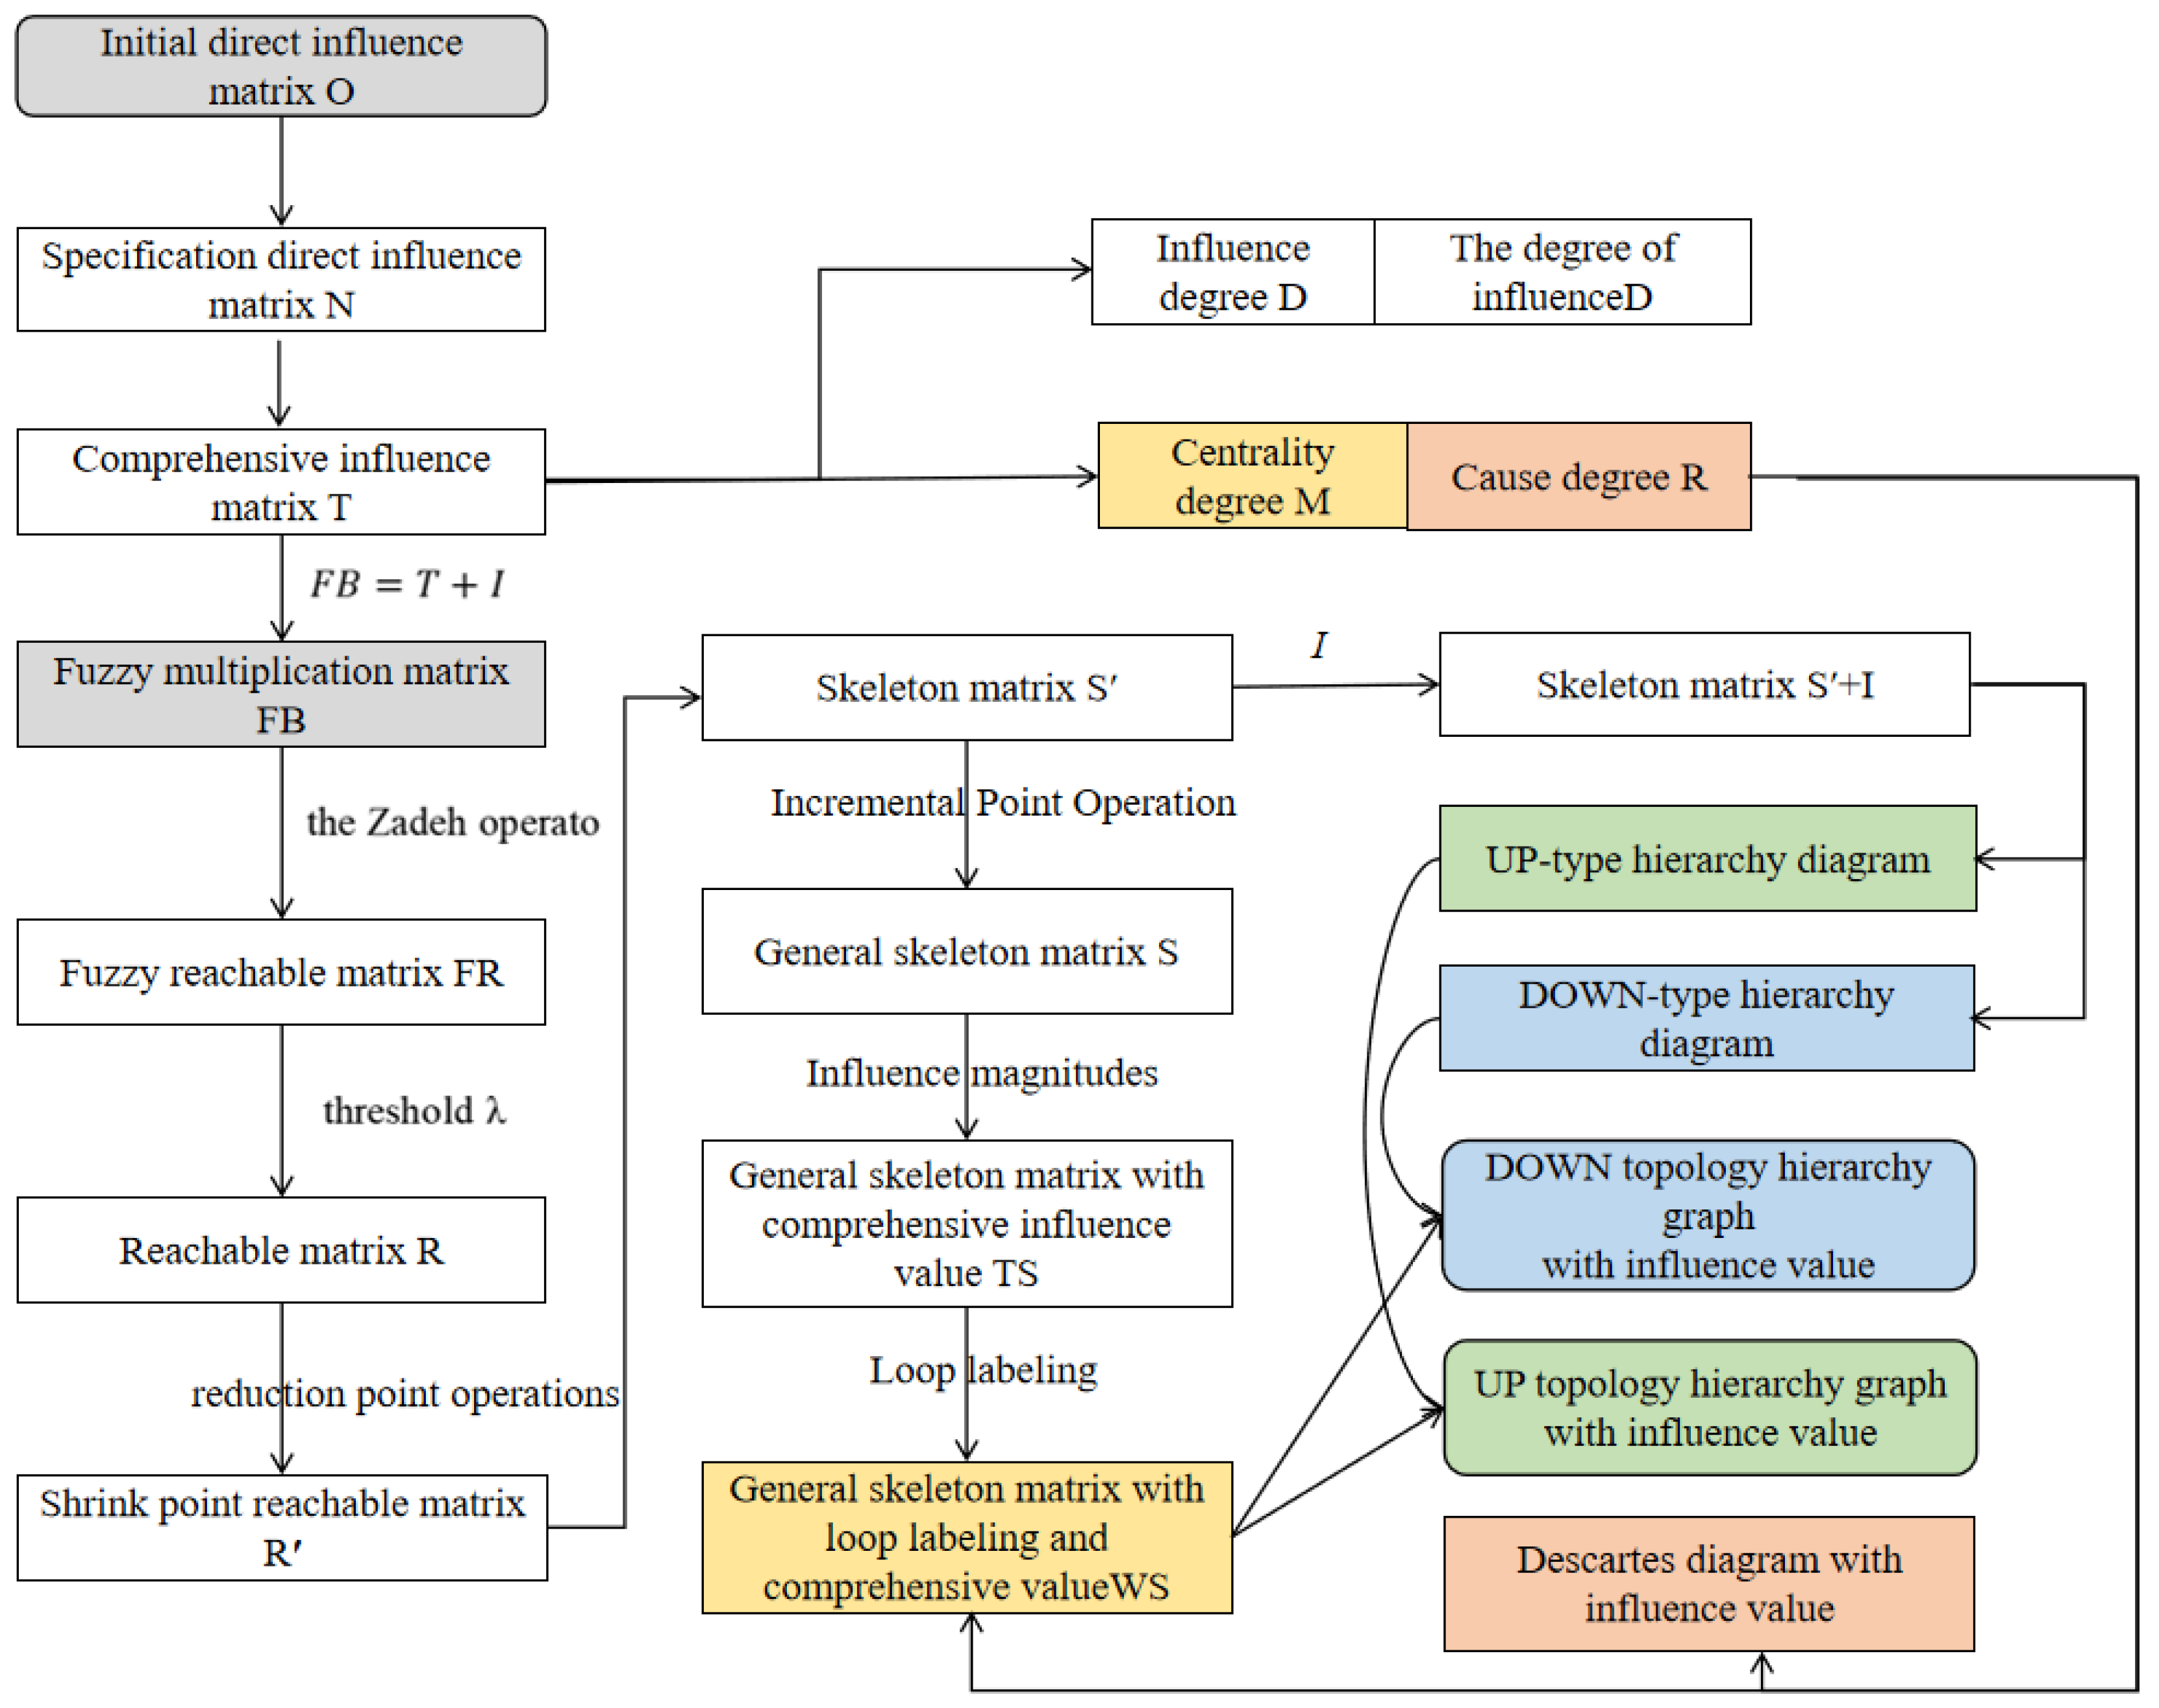
The model framework is shown in Figure 1.

3. Results

3.1. Factors Influencing City Resilience

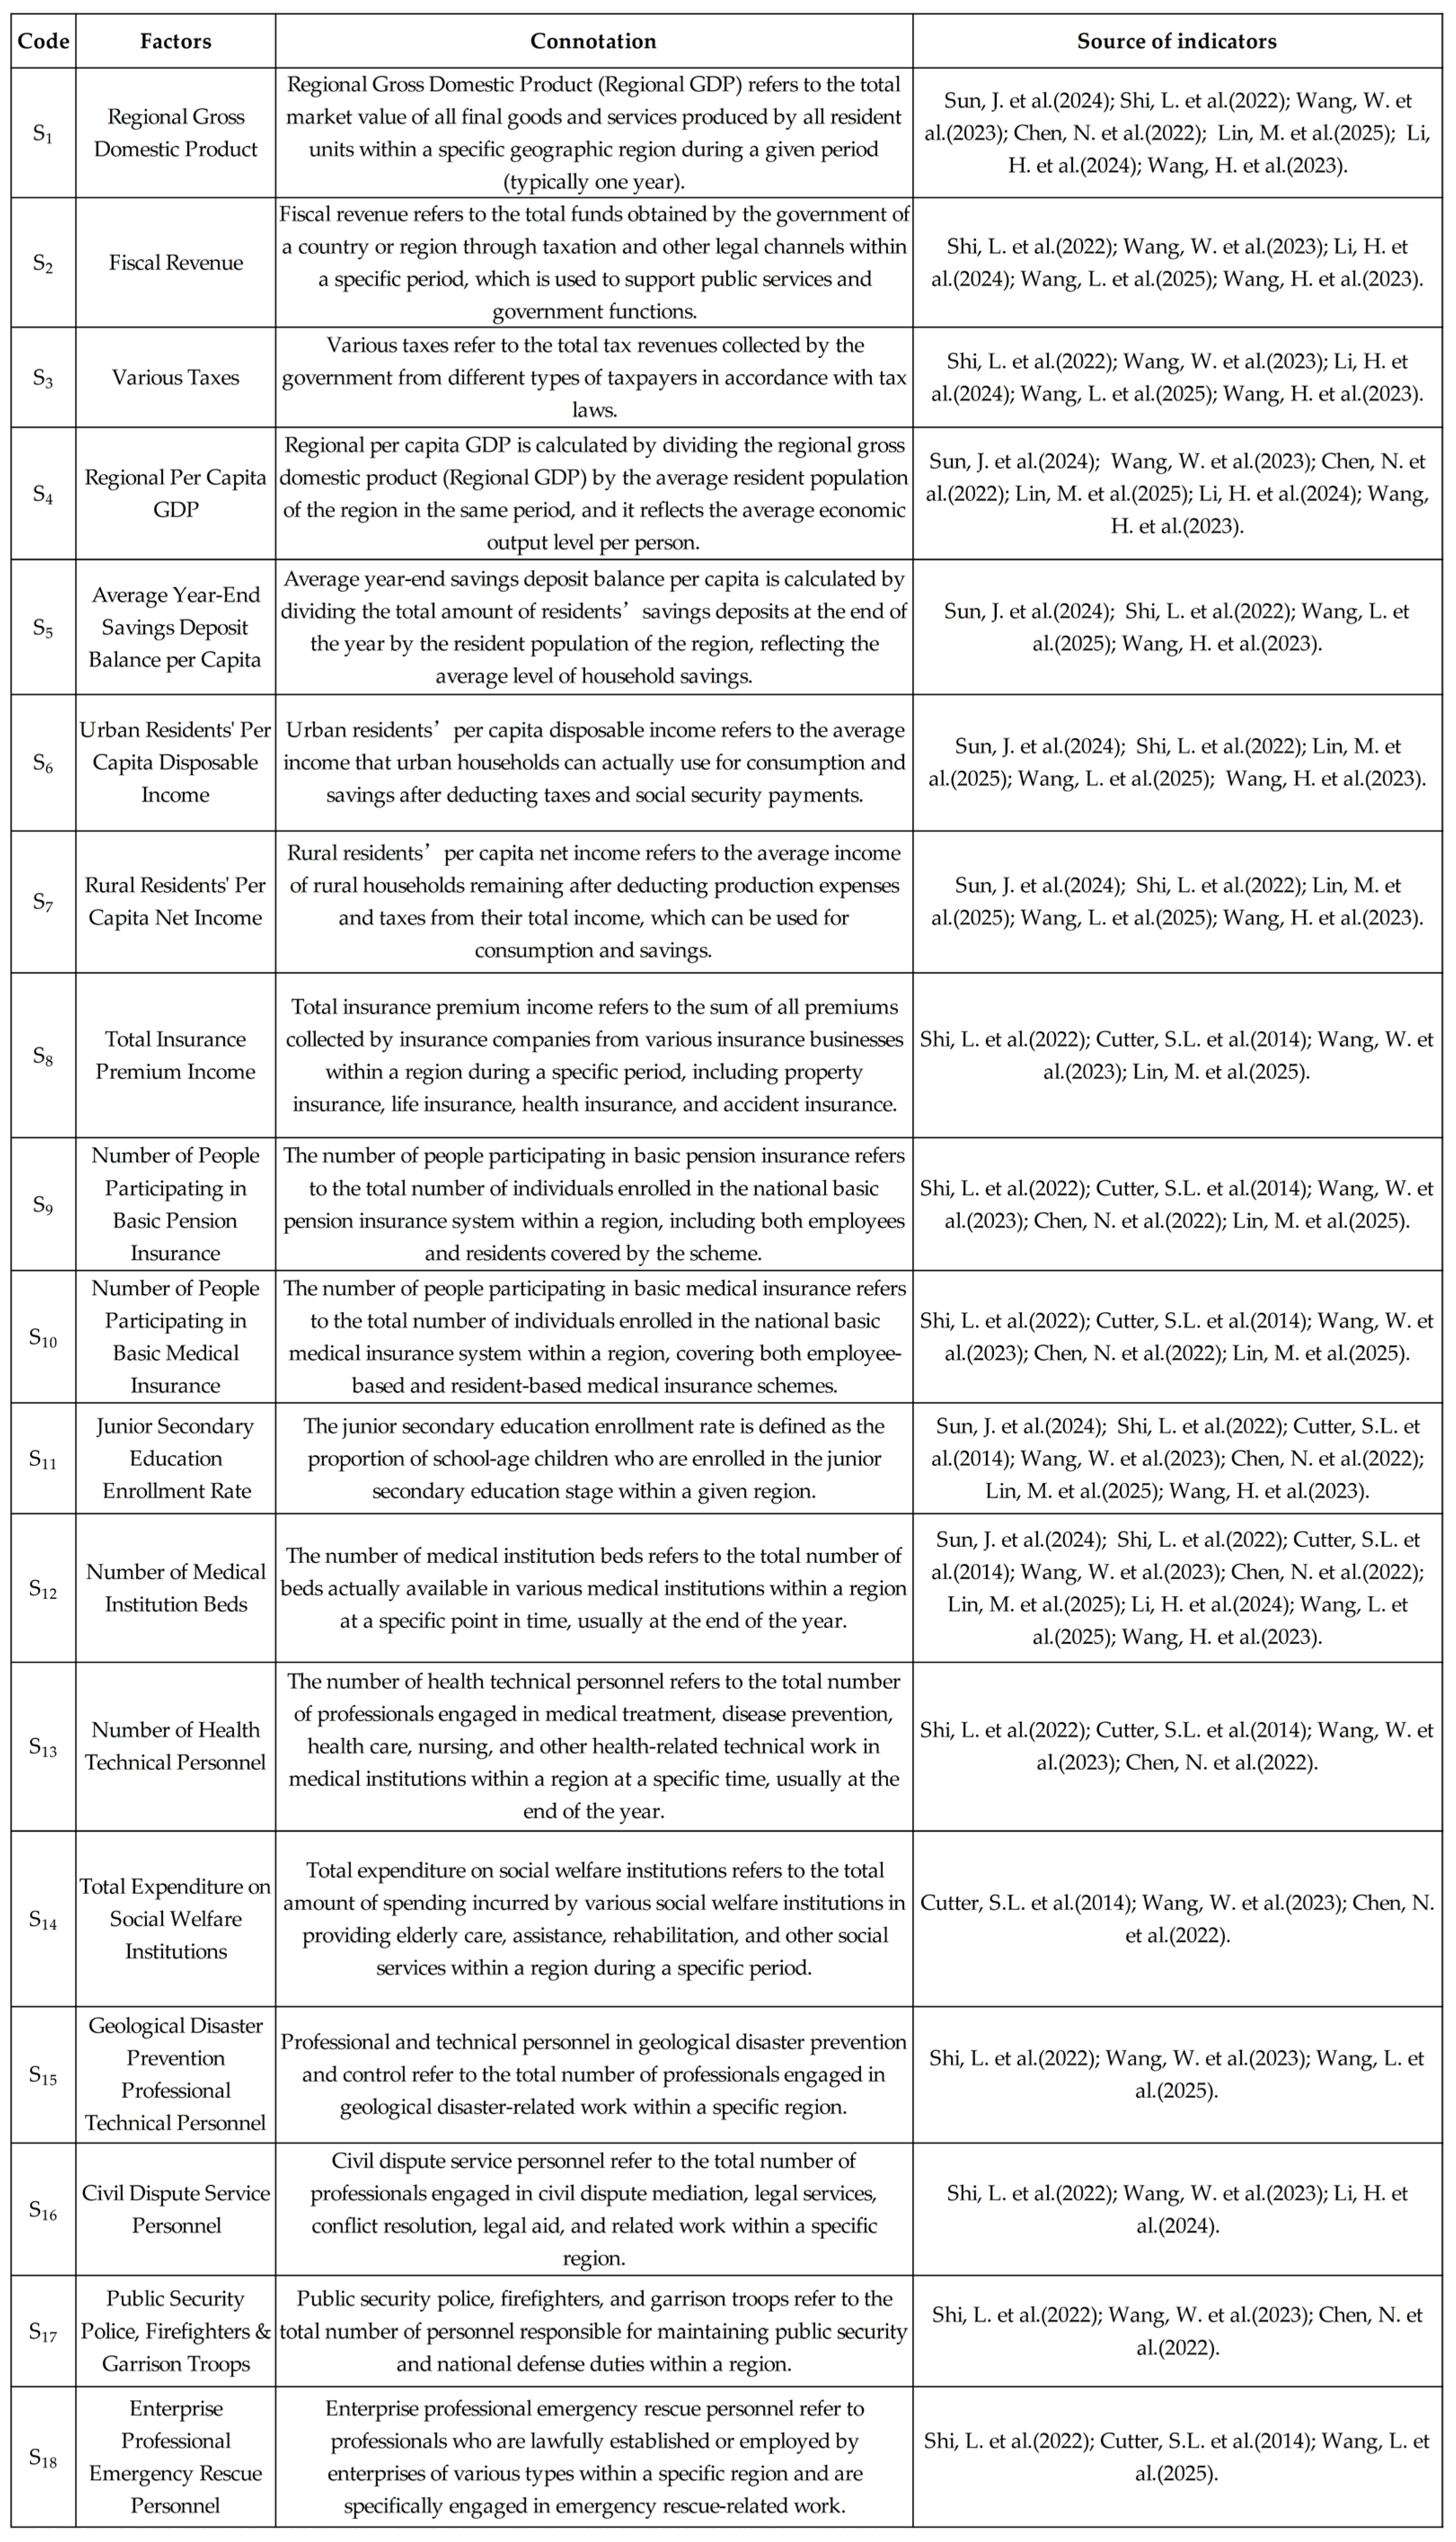
Based on the hierarchical characteristics of China’s administrative division system and regional development disparities, this paper constructs a multi-level urban resilience evaluation indicator system that is both open and systematic. This indicator system encompasses five subsystems: “Economy, Society, Ecology, Infrastructure, Organization & Institutions,” aligning with the essence of cities as highly complex coupled giant systems and avoiding the limitations of single-dimensional analysis. All data were determined through expert scoring. Finally, during the design process, this indicator system pays attention to both the disaster resistance foundation of the resilience system (e.g., per capita GDP, number of medical beds, etc.) and the system’s recovery capacity (e.g., insurance income, emergency rescue personnel, etc.), conforming to the core logic of resilient cities: “withstand shock—rapid response—recover and rebuild.” A total of 18 representative key influencing factors across five dimensions were screened, as shown in Figure 2:

3.2. DEMATEL-FR-TAISM Model Calculation

3.2.1. Results of Applying the DEMATEL Method

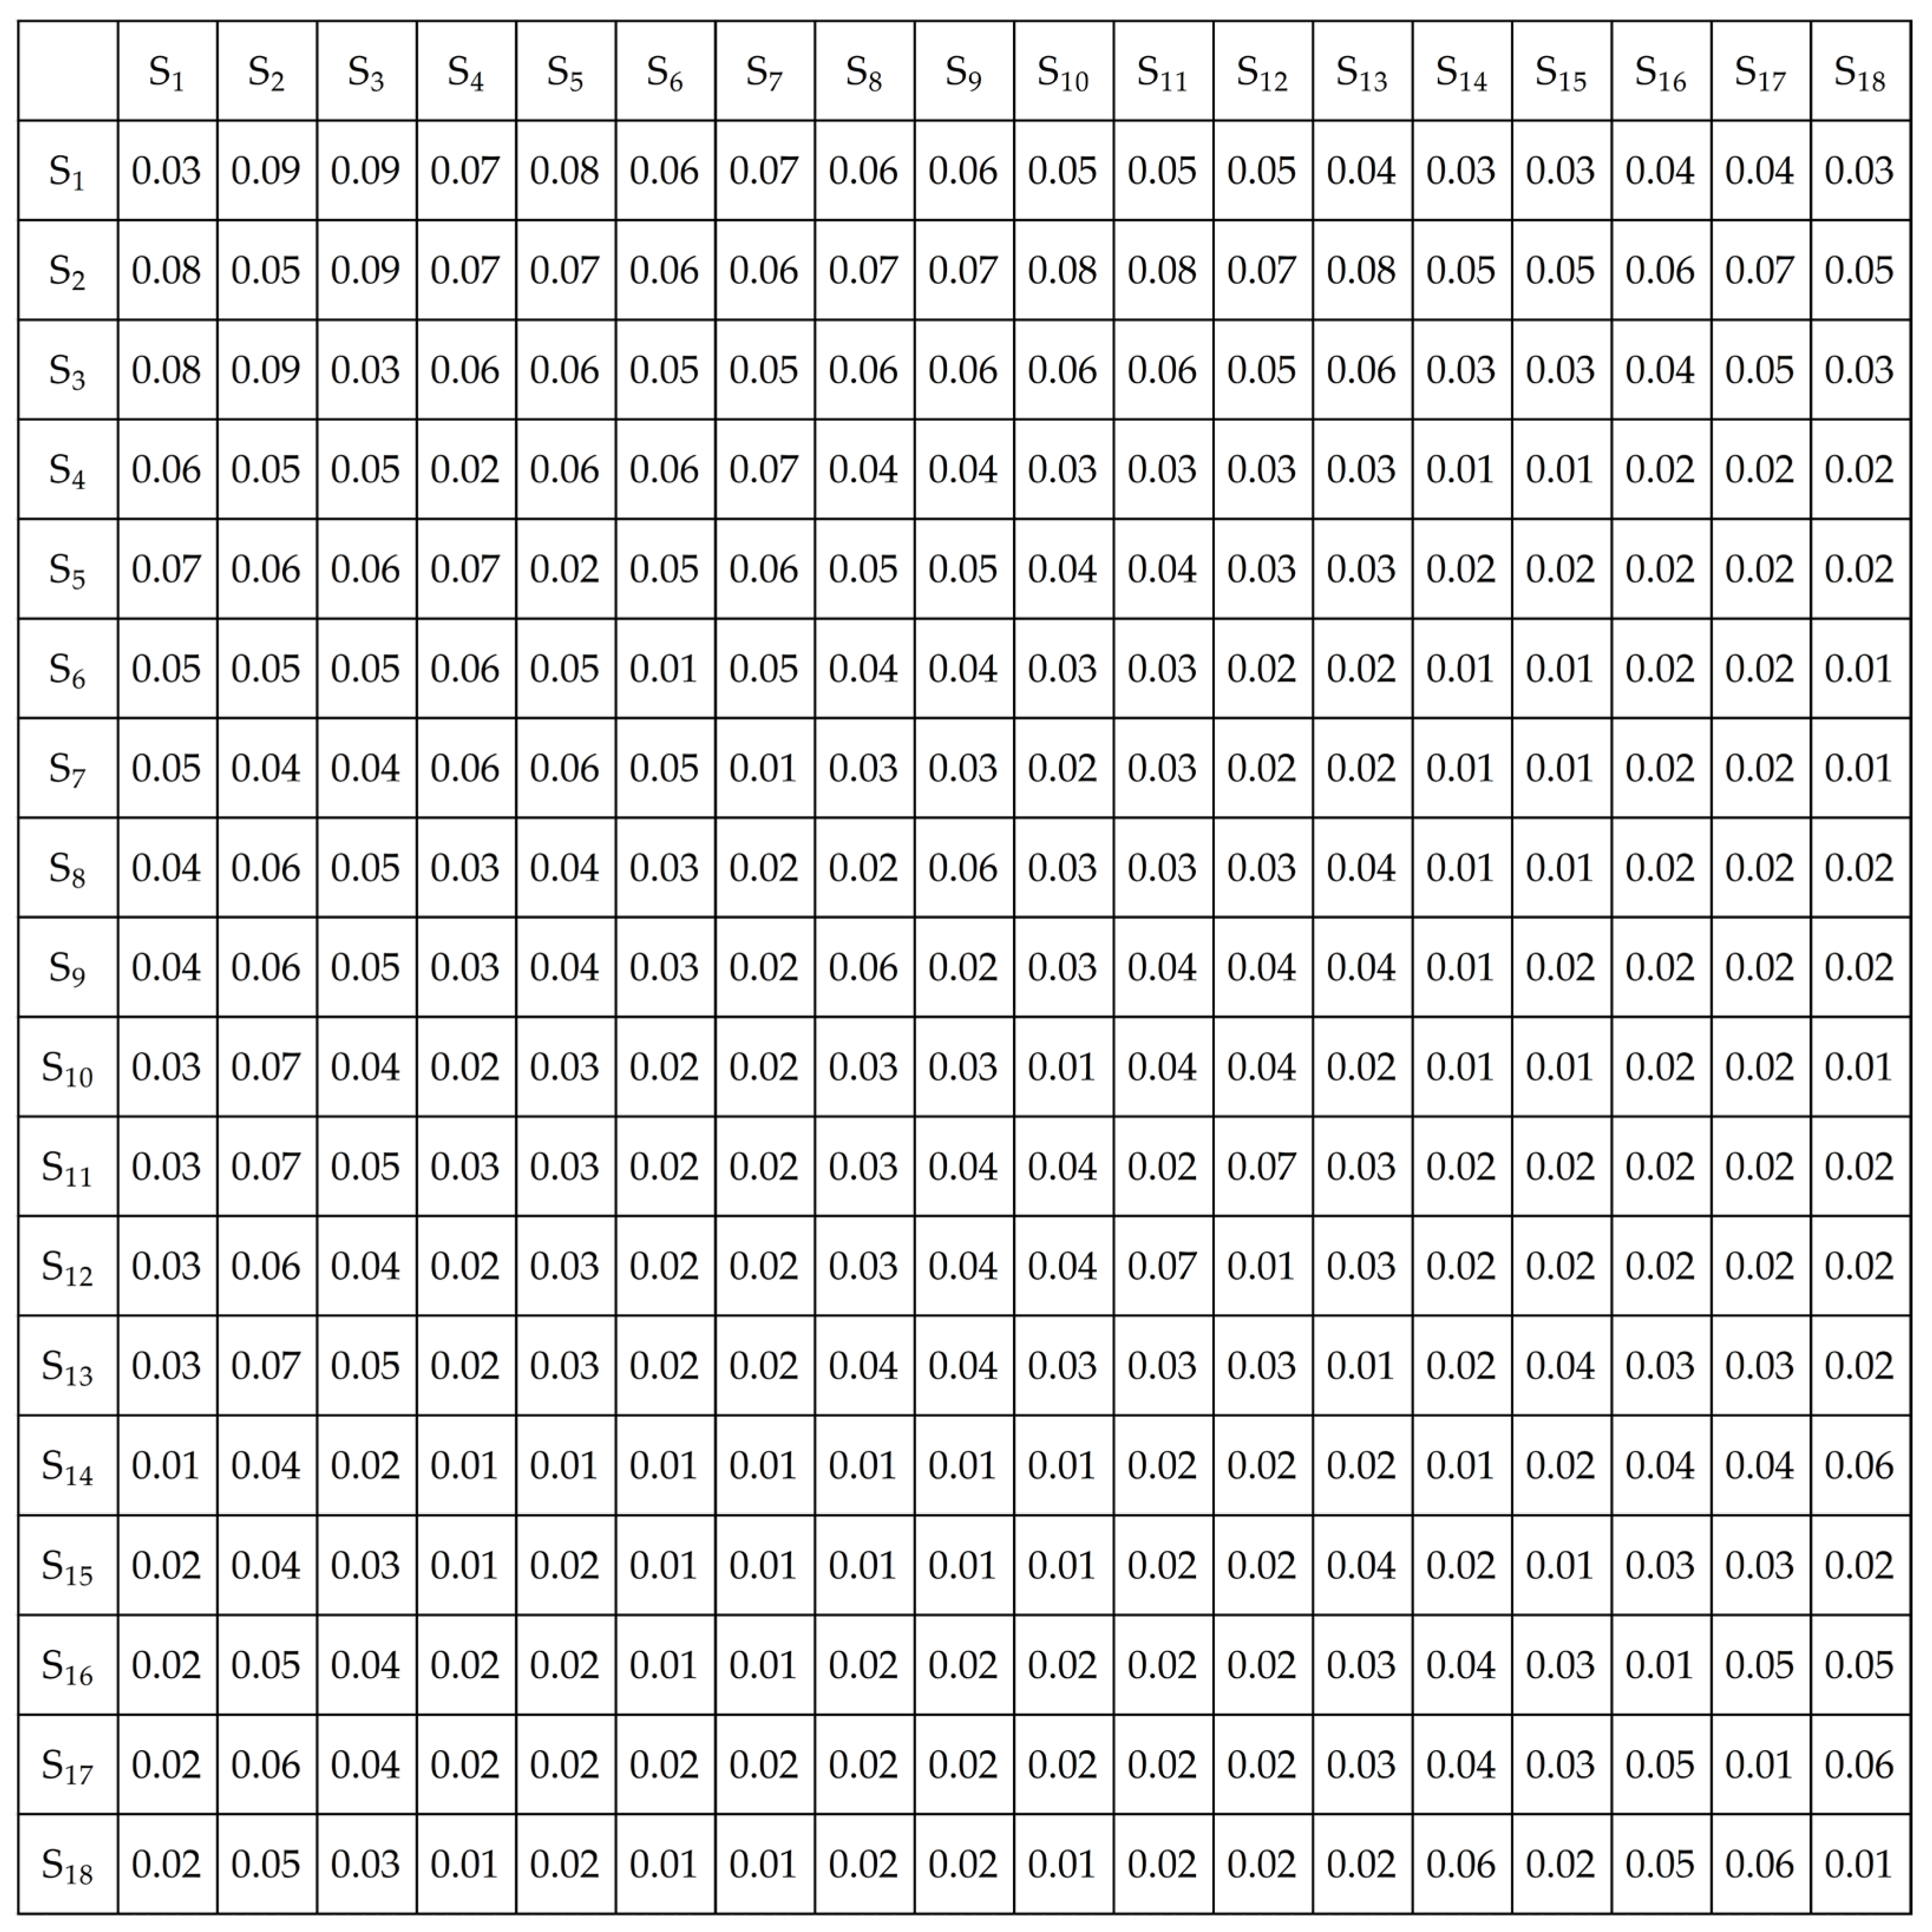
The multi-factor direct influence matrix O was constructed by aggregating the expert scores, specifically through calculating the cumulative sum for each quantitative influence relationship. We obtained the normative influence matrix by normalizing the direct influence matrix O with Equations (1) and (2). The synthesis influence matrix T was obtained using Equation (3), as shown in Figure 3.
The values for each factor’s influence degree (Di), influenced degree (Ci), centrality degree (Mi), and cause degree (Ri), calculated based on Equations (4)–(7), are listed in Table 1. In the table, OF (outcome factor) and CF (cause factor) are used as abbreviations.
To more clearly and intuitively display the attributes and characteristics of each factor, a diagram was drawn as shown in Figure 4.

3.2.2. Results of Applying FR-TAISM Calculations

Leveraging the shared basis of DEMATEL and TAISM, the reachability matrix R is calculated from matrix T. This requires determining a threshold λ (set here to 0.56 via Equations (8) and (9) to simplify the system. Finally, Equation (10) is applied to obtain matrix R, presented in Figure 5.
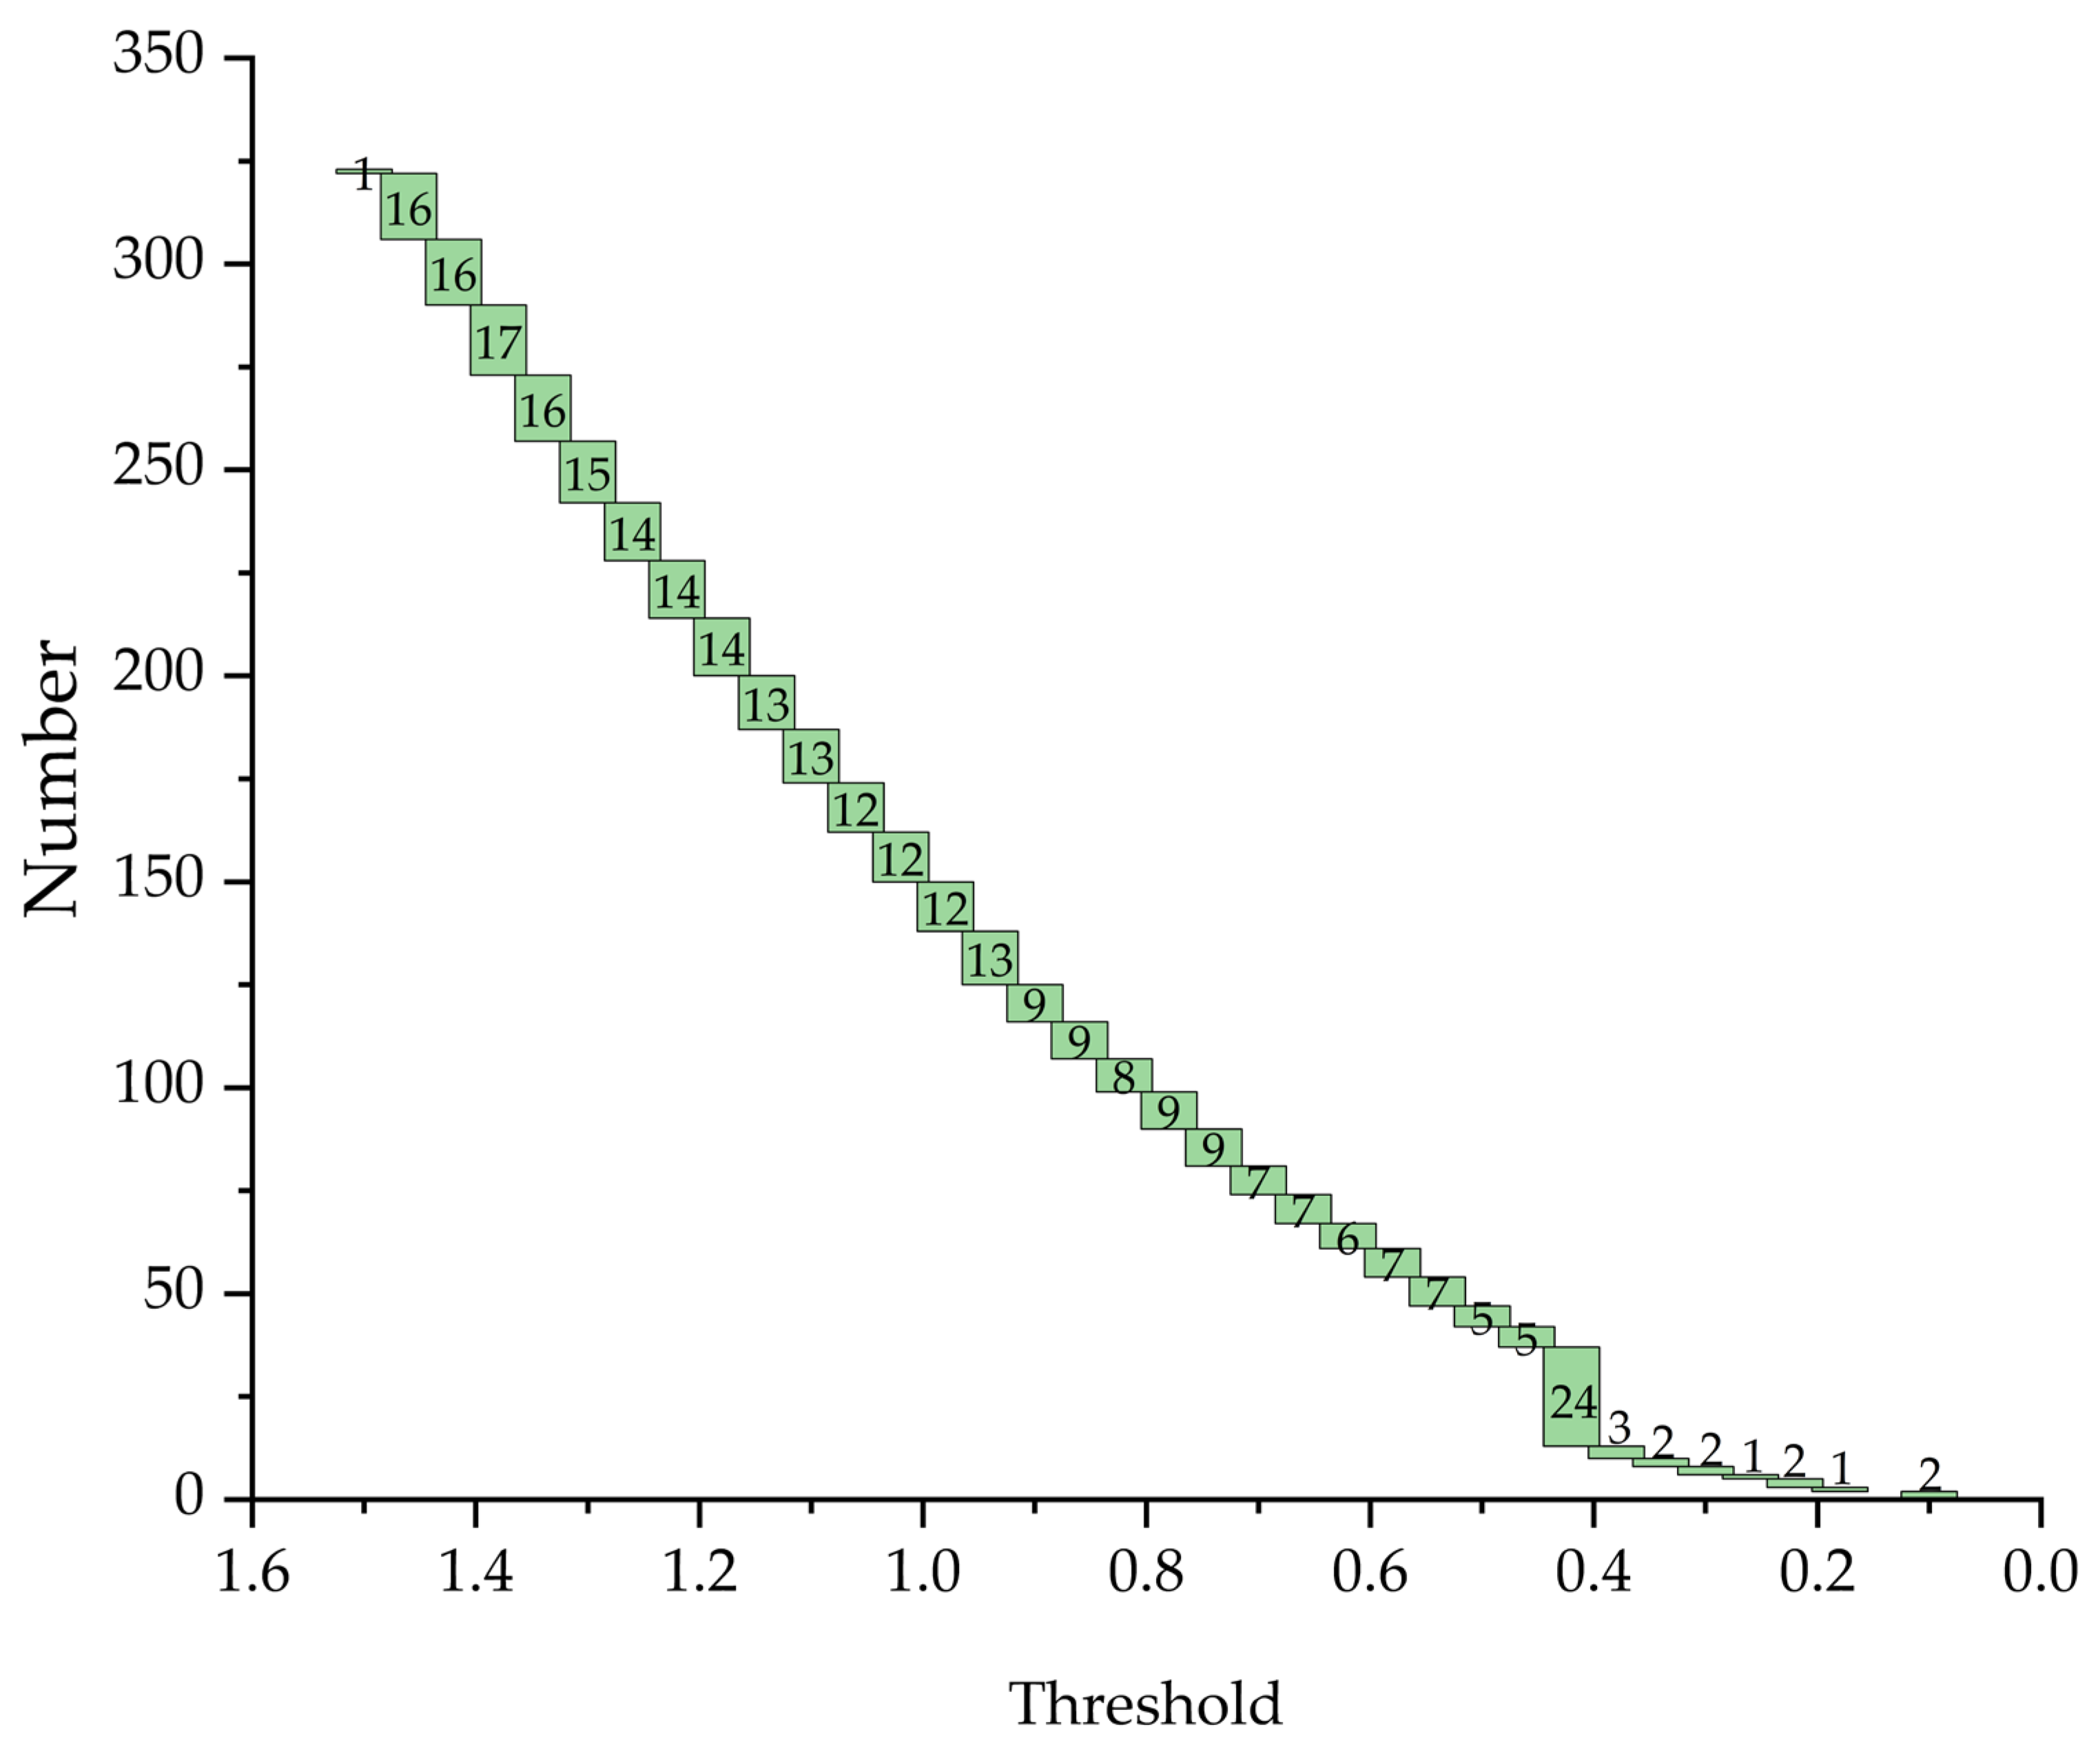
Determine the fuzzy reachability matrix threshold set Φ. By removing duplicates and sorting in ascending order the element values in the FR matrix, a threshold set Φ containing 35 elements was obtained, where Φ ∈ (0, 1], as shown in Figure 6. The numbers in the figure indicate the quantity of each threshold. Each threshold corresponds to one system characteristic structure, and different cutoff matrices will generate different reachability matrix sets.
Determine the optimal characteristic structure. When selecting the characteristic structure, the following five principles are followed: priority on number of levels, priority on fewer connected domains, priority on number of loops, priority on the fewest number of factors contained in the largest loop, and priority on the number of characteristic structures under a specific threshold.
Guided by both the preceding computational steps and the characteristic selection criteria, the structural model best aligned with reality was selected, corresponding to a λ value of 0.56. λ is obtained from the general skeleton row matrix. It is calculated by adding the mean and the standard deviation of the elements of the general skeleton matrix.
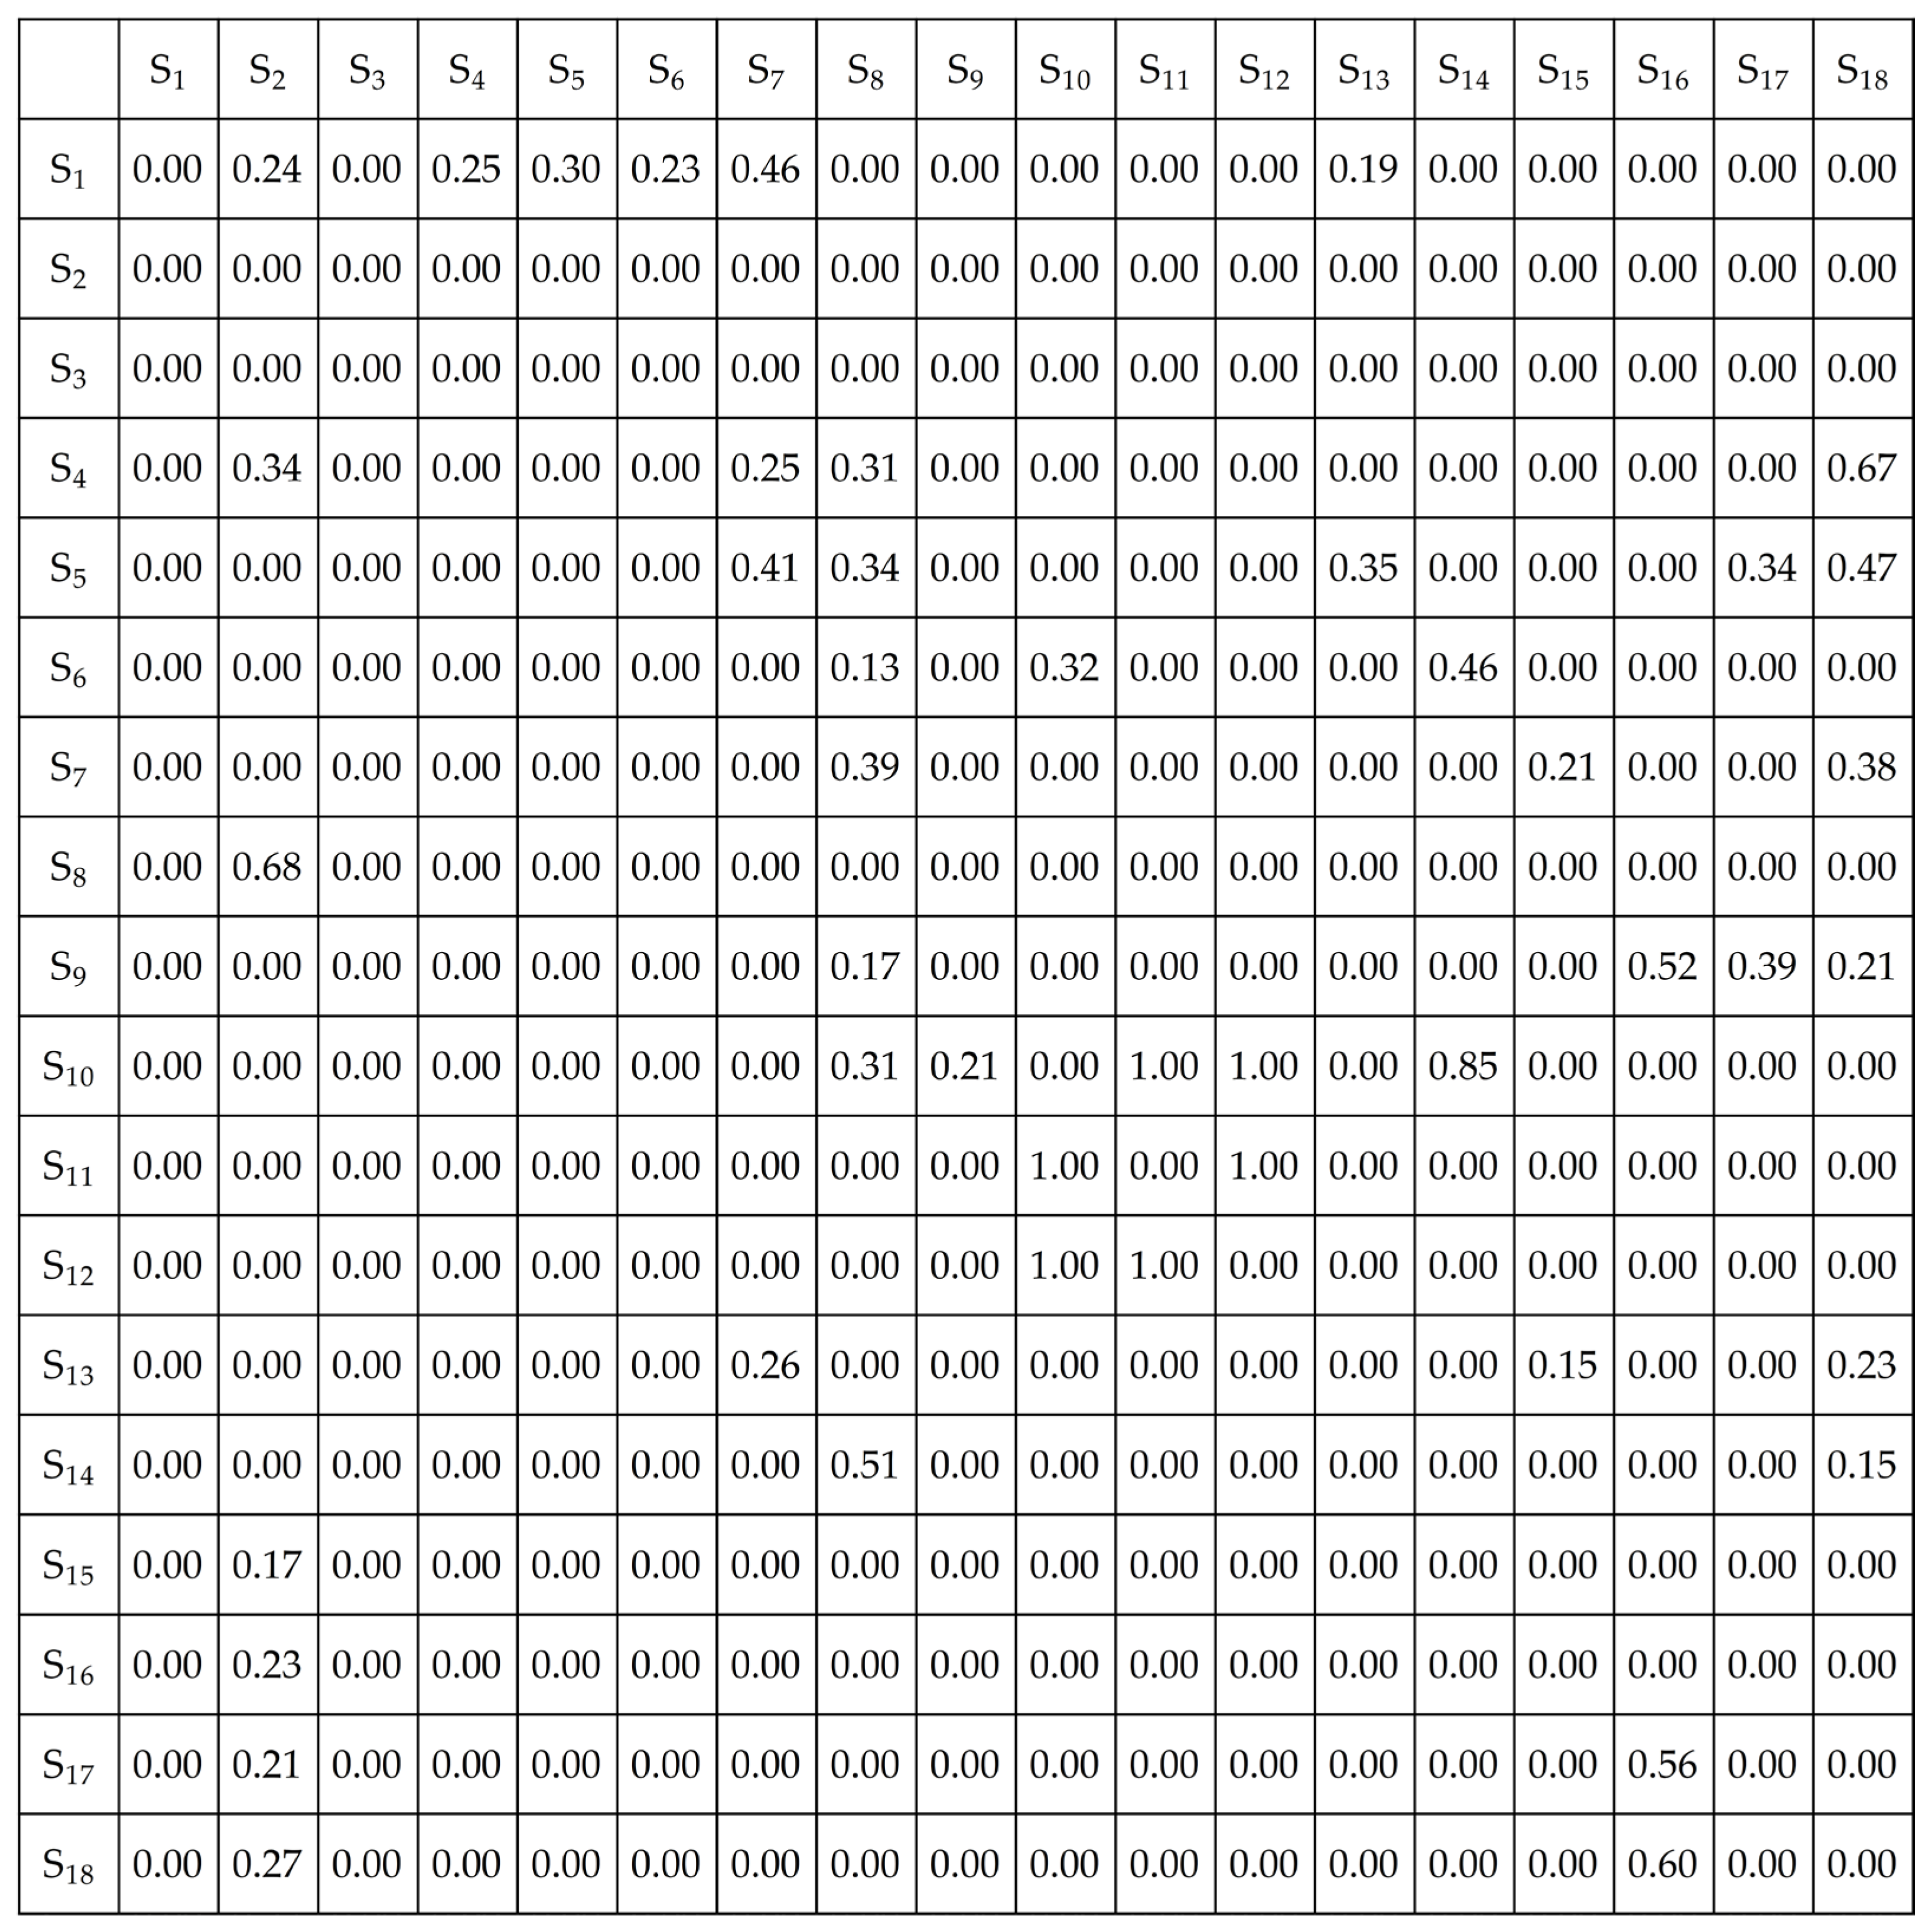
The 1 value in the general skeleton matrix S was replaced with the synthesis influence value, and WS is the matrix with influence values that can be obtained by step (5), as shown in Figure 7.

3.2.3. Draw UP/DOWN-Type Adversarial Directed Hierarchical Topology Diagrams with Influence Values

1.
Draw UP-type/DOWN-type hierarchical diagrams:
For a Boolean square matrix, there are the reachable set R s , the antecedent set Q s , and the common set T s , where T s = R s Q s . Taking factor e i in the matrix as an example, the UP-type extraction rule is extract the factors common to the reachable set R s ( e i ) and the common set T s ( e i ) of e i and arrange them from top to bottom. The DOWN-type extraction rule is extract the factors common to the antecedent set Q s ( e i ) and the common set T s ( e i ) of e i and arrange them from bottom to top. Based on the determined λ value, factors in matrix S + I are extracted to form UP/DOWN-type adversarial topological hierarchy diagrams.
2.
Draw UP/DOWN-type adversarial directed hierarchical topology diagrams with influence values:
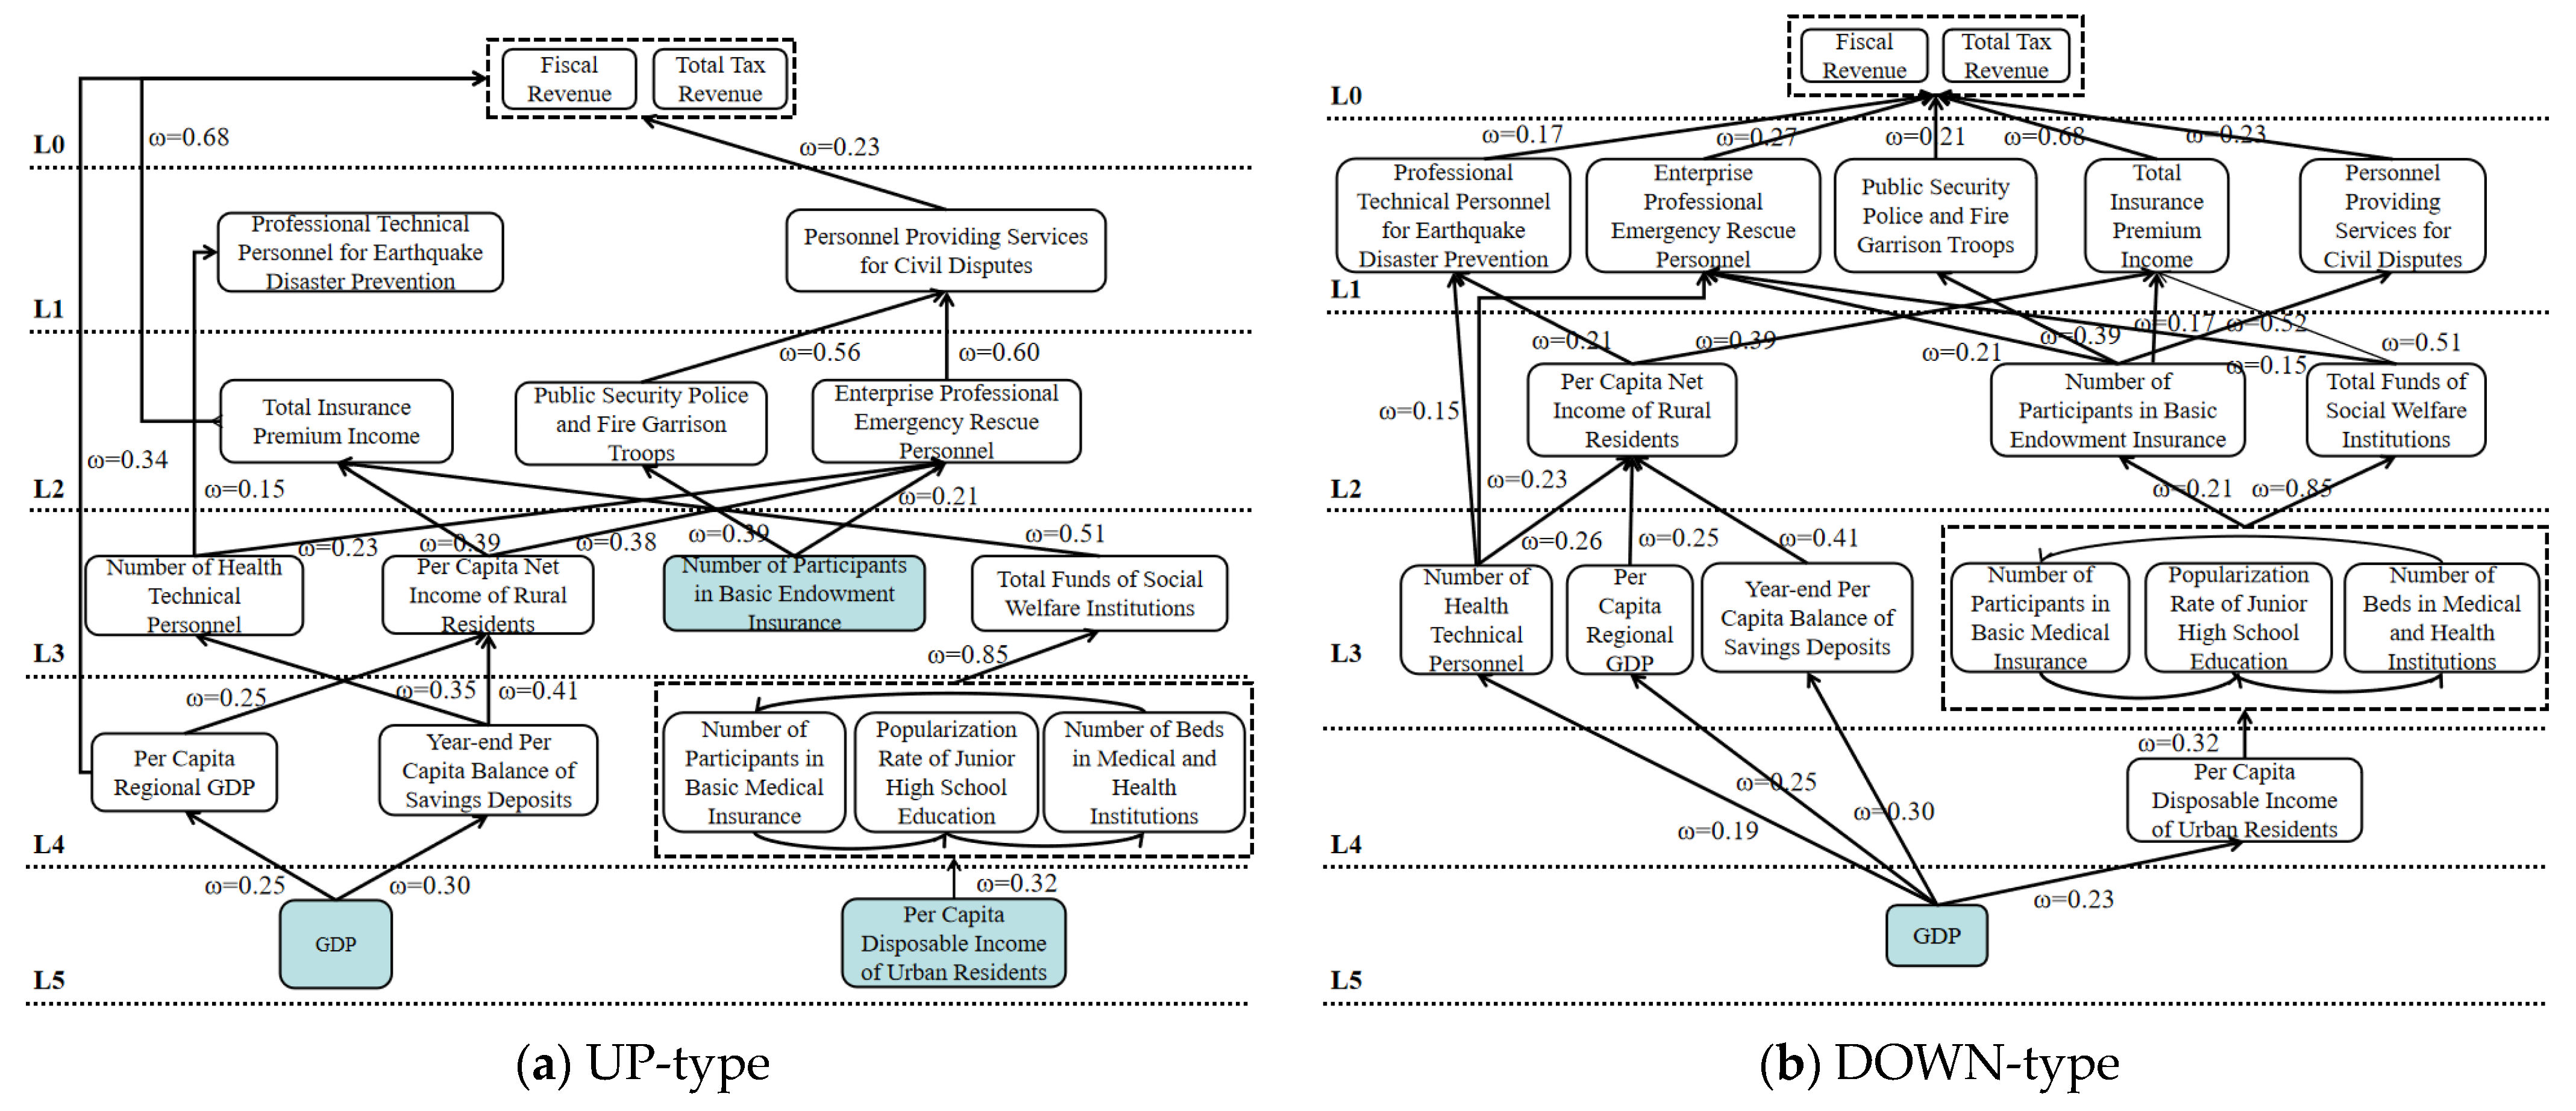
Integrate the element values of matrix W s into the UP/DOWN-type hierarchical diagrams. Based on the centrality and cause degree ranking results, adversarial directed topological hierarchy diagrams with comprehensive influence values are drawn, as shown in Figure 8.

4. Discussion

4.1. DEMATEL Analysis Results

The cause degree is used to quantify the effect of a single factor on other factors within the system. When the influence degree indicator R i > 0 , the factor is defined as a cause factor (CF, Cause Factor), and the larger the value of R i , the stronger the driving effect this factor receives from other factors within the system. When R i < 0 , the factor is defined as an outcome factor (OF, Outcome Factor), and the smaller the value of R i (the larger the absolute value), the more significantly it is constrained and influenced by other factors. Centrality is the core indicator characterizing the strength of a measured factor’s influence on the overall system, with its numerical value positively correlated with the factor’s importance in the system. A higher centrality value indicates that the factor occupies a more critical position in the system structure, and its regulatory capacity and influence on the system’s overall function and evolutionary process are also stronger.
As can be seen from Figure 8 (UP-type), among the factors influencing urban resilience, the top five factors in terms of centrality are Total Insurance Premium Income S8, Number of People Participating in Basic Pension Insurance S9, Number of People Participating in Basic Medical Insurance S10, Junior Secondary Education Enrollment Rate S11, and Number of Medical Institution Beds S12. The above factors play an important role in urban resilience construction. The top five factors in terms of influence degree are: Enterprise Professional Emergency Rescue Personnel S18, Total Expenditure on Social Welfare Institutions S14, Average Year-End Savings Deposit Balance per Capital S5, Urban Residents’ Per Capital Disposable Income S6, and Rural Residents’ Per Capital Net Income S7, which have a significant influence on other factors. By cross-verifying the results obtained in this study with existing relevant research findings [40], the universality and importance of the identified key factors are further corroborated. On this basis, this study clarified the influence strength and influenced degree of each factor through quantitative analysis, and systematically defined the attribute characteristics of different factors within the research system, providing a key basis for subsequent in-depth analysis of system mechanisms.
Notably, the five most central influencing factors identified are all classified as outcome factors (OFs). This finding reveals that despite their key systemic roles, these factors are highly dependent on and susceptible to the drive and constraint exerted by other elements within the system. This conclusion provides an important insight for urban resilience construction practice: to promote the steady progress and efficient implementation of the resilience construction process, it is necessary to further explore the deep-rooted factors affecting resilience, strengthen the identification, regulation, and optimization of core cause factors (CFs), and enhance the stability and accountability of the urban resilience system through targeted intervention.

4.2. FR-TAISM Analysis Results

1.
The entire system is an active, topologically mutable system:
A topological active system refers to a system characterized by both a collection of adversarial topological hierarchies and the presence of active factors within its multiple structural levels. In contrast, if a rigid constraint that “all factors must belong to the same level” is imposed on the system, the resulting topological system can be defined as a rigid topological system. The factors marked in green in this study, corresponding to the activity factors shown in Figure 8 (Up-type and Down-type), possess the characteristic of dynamic migration across levels. Based on this core feature, the research on key influencing factors and driving paths for urban resilience essentially constitutes a typical topological active system.
2.
Loop analysis:
In adversarial hierarchy diagrams, causal relationships are depicted by straight lines. Bidirectional connections—also referred to as loop connections or high connectivity—serve as core identifiers of interaction between system components, fundamentally reflecting the bidirectional feedback mechanisms present among them. As can be seen from the topological structure shown in Figure 8, there are two types of closed loops in the system: one is the ternary loop consisting of Number of People Participating in Basic Medical Insurance (S10), Junior Secondary Education Enrollment Rate (S11), and Number of Medical Institution Beds (S12); the other is the binary loop consisting of Regional Per Capital GDP (S4) and Rural Residents’ Per Capital Net Income (S7). Factors within both types of loops exhibit coupled causal relationships, possessing significant strong connectivity and co-evolution attributes. Therefore, such closed loops can be defined as relatively independent functional subsystems within the system, whose operational state directly affects the structural stability and functional effectiveness of the entire system [41].
3.
Hierarchical analysis:
As seen from the topological analysis results shown in Figure 8, the system of factors influencing urban resilience presents a six-level topological structure. Among them, directed line segments represent cause elements pointing to outcome factors (OFs). The two complete causal transmission sequences do not completely overlap, a feature highly consistent with the core attributes of a topological active system. The topological structure comprises three functional levels: the substantive layer (L5), the transitional layer (L2–L4), and the surface level (L0, L1).
(1)
Substantive Layer (L5)
Regional Gross Domestic Product S1, as the core deep-seated fixed factor in the system, exerts a fundamental driving effect on urban resilience construction. Its topological characteristic is that it only emits directed influence paths pointing to factors in other levels. This finding corroborates the conclusions of literature [42,43]. Regional GDP is proven to be the underlying core influencing factor for urban resilience. In terms of the mechanism of action, this factor can regulate the intensity of social demand for urban resilience construction and the orientation of urban strategic planning, further transmitting to associated dimensions such as organizational structure optimization and technological support capacity enhancement of resilient cities. Therefore, in promoting the practical process of urban resilience construction, it is necessary to focus on regional economic development as a root driving factor, laying a solid economic foundation for enhancing system resilience.
(2)
Surface Level (L0, L1)
Surface-level core influencing factors include Fiscal Revenue S2, Various Taxes S3, Geological Disaster Prevention Professional Technical Personnel S15, and Civil Dispute Service Personnel S16 [44]. Such factors serve as direct carriers for urban resilience construction, having significant immediacy and efficiency in enhancing the construction process. It is worth noting that surface-level factors have strong external dependency, and their state is easily affected by transmission from factors at other levels within the system [45]. Therefore, when regulating surface-level factors, it is necessary to establish a collaborative governance mechanism of “surface-level factors-antecedent factors”. By tracing and optimizing their upstream driving factors, the stability and long-term effectiveness of surface-level intervention measures can be guaranteed.
(3)
Transitional Layer (L2–L4)
The transitional layer factor set includes Regional Per Capital GDP S4, Average Year-End Savings Deposit Balance per Capital S5, Urban Residents’ Per Capital Disposable Income S6, Rural Residents’ Per Capita Net Income S7, Total Insurance Premium Income S8, Number of People Participating in Basic Pension Insurance S9, Number of People Participating in Basic Medical Insurance S10, Junior Secondary Education Enrollment Rate S11, Number of Medical Institution Beds S12, Number of Health Technical Personnel S13, Total Expenditure on Social Welfare Institutions S14, Public Security Police, Firefighters & Garrison Troops S17, and Enterprise Professional Emergency Rescue Personnel S18.
Factors at this level perform the core function of bidirectional transmission within the topological structure. On the one hand, they act on surface-level factors through upward influence pathways, providing indirect support for urban resilience building. On the other hand, their own states are significantly constrained by deep-seated factors (e.g., gross regional product, junior high school education popularization rate, etc.). This forms a multi-level transmission chain of “deep-seated layer—transitional layer-surface-level layer”. In addition, factors in the transitional layer possess the dual attributes of being both an influence transmitter and an influence generator. They are not only capable of undertaking and transmitting the effects of upstream and downstream factors, but can also become new driving sources through changes in their own attributes. Acting as a critical hub, they maintain the structural integrity and functional coherence of the urban resilience system through their radiating influence on other factors.
Compared with the application paradigm of the traditional ISM in existing research [34], the FR-TAISM integrates the core of adversarial game theory to realize the synchronous construction of recursive structural models from the dual perspectives of the cause dimension and the result dimension. It provides a more scientific model support and methodological innovation for the systematic analysis of issues related to urban resilience construction.
Based on the above quantitative calculation and in-depth analysis results, to efficiently promote the urban resilience construction process, it is necessary to establish an internal and external governance mechanism with synergistic linkage between government and community (individuals). Specifically, the government should provide fundamental external guidance and institutional constraints, which must function in complementarity with the community’s endogenous motivation. Together, these interdependent mechanisms constitute a synergistic framework for enhancing urban resilience [43]. Accordingly, this paper proposes targeted optimization paths and practical countermeasures for urban resilience construction in light of the system topological structure characteristics and factor mechanisms, providing a theoretical reference and decision-making support for relevant policy formulation and practical advancement.

5. Conclusions and Suggestions

Urban sustainable development has entered a new stage, driving corresponding transformations in the fields of disaster management and urban planning [46]. Traditional disaster management and urban planning models are no longer adequate to meet the core demands of urban safety and resilience construction moving towards superior quality and sustainable growth [47]. In response to the practical needs for rapid improvement of urban safety resilience levels and deep integration with the real economy, urban disaster management is gradually entering a critical development period for safety and resilience transformation [48]. Currently, the core driving forces and strategic implementation paths supporting the transformation of urban resilience construction remain unclear, and related research has not yet formed a systematic understanding. Based on this, this study constructed a framework for an indicator system of factors influencing urban resilience construction. The enhanced DEMATEL-FR-TAISM integrated method was implemented to systematically identify and conduct a comprehensive analysis of the pivotal influencing elements and their dynamic interplay in the system. Compared to the traditional ISM framework, this integrated method generates reverse-extracted hierarchical representations through graphical techniques and embeds influence coefficient quantification indicators within the comprehensive system model. It significantly enhances the ability to visually describe interrelationships among system elements and the persuasiveness of results. It provides effective support for accurately depicting the influence paths and hierarchical distribution characteristics of the urban resilience construction transformation system. Finally, this study constructed a three-level recursive structural model comprising substantive, transitional, and surface layers, clearly revealing the multi-dimensional influence mechanisms of urban resilience construction.
Research indicates that sufficient Regional Gross Domestic Product S1 is the fundamental catalytic factor driving urban resilience construction. Fiscal Revenue S2, Various Taxes S3, Geological Disaster Prevention Professional Technical Personnel S15, and Civil Dispute Service Personnel S16 constitute the direct influencing factors driving urban resilience transformation. Factors such as Regional Per Capital GDP S4 and Urban Residents’ Per Capital Disposable Income S6 lie between foundational and direct factors, forming the transitional layer of the system by receiving the driving effects of lower-level factors and transmitting them upwards. From the perspective of the mechanism of action, sufficient Regional GDP and Urban Residents’ Per Capital Disposable Income can be regarded as deep-seated external guiding factors, capable of providing official fiscal guarantees and a market environment supportive of residents’ safety needs for urban resilience construction. Meanwhile, internal mechanisms such as urban economic resilience, social resilience, ecological resilience, infrastructure resilience, and organizational & institutional resilience collectively constitute the endogenous driving force for urban resilience construction. Based on the above research conclusions, this study proposes targeted optimization countermeasures from the dual dimensions of government governance and community (individual) participation, aiming to establish a synergistic force mechanism from the outside to the inside, providing theoretical basis and practical guidance for promoting high-quality and sustainable development of urban resilience construction.
Therefore, the advancement of urban resilience construction can proceed from the following aspects.
(1)
Strengthen Government Top-Level Design and Guiding Efficacy
Urban resilience development is characteristically a public good with systemic complexity, making it difficult to rely solely on market-driven mechanisms. The government must assume a central role in strategic planning and resource coordination. Establishing an “incentive–constraint” dual policy framework can break down collaboration barriers through targeted policy interventions, thereby activating market entities’ motivation to participate. Taking the Shanghai Master Plan as an example, policies should clearly prioritize safety risk prevention and resilience enhancement, promote differentiated strategies across regions, improve cross-regional policy integration, and facilitate the systematic transformation of organizational structures and resource allocation in urban resilience development.
(2)
Consolidate the Endogenous Resilience Foundation of Communities (Individuals)
Communities, as the smallest governance unit of urban resilience, need to strengthen their dual support. First, they should optimize the industrial structure to broaden income channels, increase the community’s per capital GDP, and ensure funding for the construction, operation, and maintenance of resilience facilities. Second, they should expand the number of geological disaster prevention professionals, increase medical beds, and cultivate emergency rescue capabilities to enhance disaster response capacity. At the individual level, a comprehensive cultivation system should be established. Stable employment can increase residents’ disposable income, strengthening the economic support for per-disaster investment and post-disaster recovery. We will expand medical insurance coverage and improve people’s livelihood security. Regular disaster science popularization and emergency drills should be carried out to enhance residents’ professional literacy and practical skills in disaster response, thereby constructing an all-people resilience building pattern characterized by “everyone sharing responsibilities and fulfilling obligations”.
This study identifies key factors and mechanisms of urban resilience construction but has limitations: lack of temporal–spatial heterogeneity analysis, insufficient verification of the indicator system and integrated method in diverse scenarios, and neglect of multi-stakeholder participation beyond government and community. Future research should explore temporal–spatial evolution of factors, validate and improve the analysis method, conduct typical case studies, and investigate multi-stakeholder collaborative governance mechanisms.

Author Contributions

Conceptualization, J.Y.; Methodology, J.Y.; Software, J.Y.; Validation, F.L.; Formal analysis, J.Y.; Investigation, J.Y.; Resources, J.Y.; Data curation, F.L.; Writing—original draft, F.L.; Writing—review & editing, S.L.; Visualization, J.Y.; Project administration, F.L.; Funding acquisition, F.L. All authors have read and agreed to the published version of the manuscript.

Funding

This works is supported by the Youth Cultivation Fund of Zhengzhou University of Light Industry (No. 2024XNQNPY48), the Doctoral Research Fund of Zhengzhou University of Light Industry (No. 2022BSJJZK22), Key Research and Promotion Project (Science and Technology Research) of Henan Province (No. 252102320044).

Institutional Review Board Statement

Not applicable.

Informed Consent Statement

Not applicable.

Data Availability Statement

The original contributions presented in this study are included in the article. Further inquiries can be directed to the corresponding author.

Conflicts of Interest

The authors declare no conflict of interest.

References

  1. Munich Re Group. Natural Catastrophe Yearbook 2021; Munich Re Group: Munich, Germany, 2021; Available online: http://www.zaihai.cn/archive/6347d6535b6ae9ee6c9ab47b (accessed on 26 September 2025).
  2. Sun, J.; Zhai, N.; Mu, H.; Miao, J.; Li, W.; Li, M. Assessment of urban resilience and subsystem coupling coordination in the Beijing-Tianjin-Hebei urban agglomeration. Sustain. Cities Soc. 2024, 100, 105058. [Google Scholar] [CrossRef] [Scilit]
  3. Shi, L.; Zheng, Q.; Yang, M.; Liu, L. A review of definitions, influence factors and assessment of urban resilience. Acta Ecol. Sin. 2022, 42, 6016–6029. [Google Scholar] [CrossRef] [Scilit]
  4. Feng, X.; Xiu, C.; Bai, L.; Zhong, Y.; Wei, Y. Comprehensive evaluation of urban resilience based on the perspective of landscape pattern: A case study of Shenyang city. Cities 2020, 104, 102722. [Google Scholar] [CrossRef] [Scilit]
  5. Wu, C.; Cenci, J.; Wang, W.; Zhang, J. Resilient city: Characterization, challenges and outlooks. Buildings 2022, 12, 516. [Google Scholar] [CrossRef] [Scilit]
  6. Cutter, S.L.; Ash, K.D.; Emrich, C.T. The geographies of community disaster resilience. Glob. Environ. Change 2014, 29, 65–77. [Google Scholar] [CrossRef] [Scilit]
  7. Huang, H.; Li, R.; Wang, W.; Qin, T.; Zhou, R.; Fan, W. Concepts, models, and indicator systems for urban safety resilience: A literature review and an exploration in China. J. Saf. Sci. Resil. 2023, 4, 30–42. [Google Scholar] [CrossRef] [Scilit]
  8. Wang, W.; Zhang, L.; Peng, T. Evaluation of a safe resilient City: A comparison of Hangzhou and Shaoxing, China. Sustain. Cities Soc. 2023, 98, 104798. [Google Scholar] [CrossRef] [Scilit]
  9. Dong, W.; Zhou, Y.; Guo, D.; Chen, Z.; Wang, J. Evaluation of Urban Infrastructure Resilience Based on Risk–Resilience Coupling: A Case Study of Zhengzhou City. Land 2025, 14, 530. [Google Scholar] [CrossRef] [Scilit]
  10. Chen, N.; Guo, H.; Xiang, H. Evaluation of urban resilience level and analysis of obstacle factors: A case study of Hunan Province, China. Front. Earth Sci. 2022, 10, 1033441. [Google Scholar] [CrossRef] [Scilit]
  11. Almulhim, A.I. Building Urban Resilience Through Smart City Planning: A Systematic Literature Review. Smart Cities 2025, 8, 22. [Google Scholar] [CrossRef] [Scilit]
  12. Almulhim, A.I.; Cobbinah, P.B. Dammam metropolitan area: Advancing the pursuit of urban resilience. Habitat Int. 2025, 163, 103499. [Google Scholar] [CrossRef] [Scilit]
  13. Lin, M.; Peng, B. Does regional coordinated development enhance urban resilience? Evidence from China’s Beijing-Tianjin-Hebei region. Econ. Anal. Policy 2025, 87, 1232–1261. [Google Scholar] [CrossRef] [Scilit]
  14. Xinghua, F.E.N.G.; Meihai, X.U.; Qiyue, L.I.; Becky, P.Y.; Chunliang, X.I.U. Urban resilience and panarchy: Insights from Nanchang City, China. Cities 2025, 162, 105934. [Google Scholar] [CrossRef] [Scilit]
  15. Feng, X.; Xiu, C.; Li, J.; Zhong, Y. Measuring the evolution of urban resilience based on the Exposure–Connectedness–Potential (ECP) approach: A case study of Shenyang city, China. Land 2021, 10, 1305. [Google Scholar] [CrossRef] [Scilit]
  16. Yin, Y.; Gu, J.; Li, M. Sustainability-Oriented Urban Resilience Assessment: The Case of China’s Yangtze River Delta Region. J. Clean. Prod. 2025, 514, 145835. [Google Scholar] [CrossRef] [Scilit]
  17. Li, H.; Wang, Y.; Zhang, H.; Yin, R.; Liu, C.; Wang, Z.; Zhao, J. The spatial-temporal evolution and driving mechanism of Urban resilience in the Yellow River Basin cities. J. Clean. Prod. 2024, 447, 141614. [Google Scholar] [CrossRef] [Scilit]
  18. Yao, J.; Chen, G.; Yao, B.; Wu, J. Urban resilience assessment matrix considering spatiotemporal processes: Model proposal and application. Sustain. Cities Soc. 2025, 135, 106988. [Google Scholar] [CrossRef] [Scilit]
  19. Wang, L.; Li, F.; Li, X.; Zhou, S. Assessing Smart Cities Policy on Urban Green Growth in China: The Mediating Effect of Urban Resilience. Sustain. Cities Soc. 2025, 128, 106471. [Google Scholar] [CrossRef] [Scilit]
  20. Salvo, G.; Karakikes, I.; Papaioannou, G.; Polydoropoulou, A.; Sanfilippo, L.; Brignone, A. Enhancing Urban Resilience: Managing Flood-Induced Disruptions in Road Networks. Transp. Res. Interdiscip. Perspect. 2025, 31, 101383. [Google Scholar] [CrossRef] [Scilit]
  21. Wang, J.; He, W.; Huang, J. Towards a new normal? Deconstructing travel behaviour resilience in the urban transport system. Transp. Rev. 2025, 1–27. [Google Scholar] [CrossRef] [Scilit]
  22. Chen, J.; Guo, X.; Pan, H.; Zhong, S. What determines city’s resilience against epidemic outbreak: Evidence from China’s COVID-19 experience. Sustain. Cities Soc. 2021, 70, 102892. [Google Scholar] [CrossRef] [Scilit]
  23. Wang, H.; Liu, Z.; Zhou, Y. Assessing urban resilience in China from the perspective of socioeconomic and ecological sustainability. Environ. Impact Assess. Rev. 2023, 102, 107163. [Google Scholar] [CrossRef] [Scilit]
  24. Wang, H.; Qi, G. Ecological resilience of three major urban agglomerations in China from the “environment–society” coupling perspective. Ecol. Indic. 2024, 169, 112944. [Google Scholar] [CrossRef] [Scilit]
  25. You, X.; Sun, Y.; Liu, J. Evolution and analysis of urban resilience and its influencing factors: A case study of Jiangsu Province, China. Nat. Hazard. 2022, 113, 1751–1782. [Google Scholar] [CrossRef] [Scilit]
  26. Wu, P.; Duan, Q.; Zhou, L.; Wu, Q.; Deveci, M. Spatial-temporal evaluation of urban resilience in the Yangtze River Delta from the perspective of the coupling coordination degree. Environ. Dev. Sustain. 2025, 27, 409–431. [Google Scholar] [CrossRef] [Scilit]
  27. Liu, X.; Li, S.; Xu, X.; Luo, J. Integrated natural disasters urban resilience evaluation: The case of China. Nat. Hazards 2021, 107, 2105–2122. [Google Scholar] [CrossRef] [Scilit]
  28. Wang, D.; Song, M.; Chen, S.; Du, H. The impact of the global 100 resilient cities strategy on urban resilience under climate change. Cities 2025, 167, 106370. [Google Scholar] [CrossRef] [Scilit]
  29. Li, H.; Han, Z.; Zhang, J.; Philbin, S.P.; Liu, D.; Ke, Y. Systematic identification of the influencing factors for the digital transformation of the construction industry based on LDA-DEMATEL-ANP. Buildings 2022, 12, 1409. [Google Scholar] [CrossRef] [Scilit]
  30. Chen, H.; Liu, S.; Wanyan, X.; Pang, L.; Dang, Y.; Zhu, K.; Yu, X. Influencing factors of novice pilot SA based on DEMATEL-AISM method: From pilots’ view. Heliyon 2023, 9, 13425. [Google Scholar] [CrossRef] [Scilit]
  31. Zhou, F.; Wang, X.; Lim, M.K.; He, Y.; Li, L. Sustainable recycling partner selection using fuzzy DEMATEL-AEW-FVIKOR: A case study in small-and-medium enterprises (SMEs). J. Clean. Prod. 2018, 196, 489–504. [Google Scholar] [CrossRef] [Scilit]
  32. He, J.; Zhu, J. Key drivers of the emergency capabilities of integrated elderly services supply chains. Inf. Resour. Mang. J. 2022, 35, 1–20. [Google Scholar] [CrossRef] [Scilit]
  33. Pandey, P.; Agrawal, N.; Saharan, T.; Raut, R.D. Impact of human resource management practices on TQM: An ISM-DEMATEL approach. TQM J. 2022, 34, 199–228. [Google Scholar] [CrossRef] [Scilit]
  34. Chen, J.K. Improved DEMATEL-ISM integration approach for complex systems. PLoS ONE 2021, 16, e0254694. [Google Scholar] [CrossRef] [Scilit]
  35. Cheng, L.; Miao, Y.; Guo, H.; Ren, H.; Zhu, W. Research on Causes of Unsafe Behaviors Among Special Operations Personnel in Building Construction Based on DEMATEL-ISM-BN. Buildings 2025, 15, 4184. [Google Scholar] [CrossRef] [Scilit]
  36. Yang, X.; Xing, Q.; Yang, J.; Yao, Y.; Tian, K.; Cai, H. Research on influencing factors and mechanisms of human-machine safety collaboration behavior in coal mines based on DEMATEL-ISM. Sage Open 2024, 14, 21582440241239126. [Google Scholar] [CrossRef] [Scilit]
  37. Mehregan, M.R.; Hashemi, S.H.; Karimi, A.; Merikhi, B. Analysis of interactions among sustainability supplier selection criteria using ISM and fuzzy DEMATEL. Int. J. Appl. Decis. Sci. 2014, 7, 270–294. [Google Scholar] [CrossRef] [Scilit]
  38. Su, Z.; Peng, J.; Wang, M.; Gui, G.; Meng, Q.; Su, Y.; Xiao, Z.; Zhang, S. Circular Economy Innovation in Built Environments: Mapping Policy Thresholds and Resonant Resilience via DEMATEL–TAISM. Buildings 2025, 15, 2110. [Google Scholar] [CrossRef] [Scilit]
  39. Zhang, R.; Yan, H. Complex system risk assessment model based on improved cloud DEMATEL-TAISM. Civ. Eng. Environ. Syst. 2025, 42, 32–55. [Google Scholar] [CrossRef] [Scilit]
  40. Amegavi, G.B.; Nursey-Bray, M.; Suh, J. Exploring the realities of urban resilience: Practitioners’ perspectives. Int. J. Disast. Risk Reduct. 2024, 103, 10431. [Google Scholar] [CrossRef] [Scilit]
  41. Choudhury, M.; Wu, H.; Shahidullah, A.K.M. Improving the feedback loop between community- and policy-level learning: Building resilience of coastal communities in Bangladesh. Sustain. Dev. 2023, 32, 1508–1524. [Google Scholar] [CrossRef] [Scilit]
  42. Lan, Z.; Pau, K.; Mohd Yusof, H.; Huang, X. Hierarchical topological model of the factors influencing adolescents’ non-suicidal self-injury behavior based on the DEMATEL-TAISM method. Sci. Rep. 2022, 12, 17238. [Google Scholar] [CrossRef] [Scilit]
  43. Huang, G.; Li, D.; Zhu, X.; Zhu, J. Influencing factors and their influencing mechanisms on urban resilience in China. Sustain. Cities Soc. 2021, 74, 103210. [Google Scholar] [CrossRef] [Scilit]
  44. Tsiotas, D.; Katsaiti, M.S. A 3D index for measuring economic resilience with application to modern financial crises. J. Int. Dev. 2025, 37, 371–404. [Google Scholar] [CrossRef] [Scilit]
  45. Li, H.; Zhu, M.; Wang, Z.; Hong, J.; Wang, Y. Synergy level of urban resilience and urban land use efficiency in the Yellow River Basin: Spatial-temporal evolution characteristics and driving factors. Heliyon 2024, 10, e31456. [Google Scholar] [CrossRef] [Scilit] [PubMed]
  46. Ji, X.; Nie, Z.; Wang, K.; Xu, M.; Fang, Y. Spatiotemporal evolution and influencing factors of urban resilience in the Yellow River Basin, China. Reg. Sustain. 2024, 5, 100159. [Google Scholar] [CrossRef] [Scilit]
  47. Kong, L.; Mu, X.; Hu, G.; Zhang, Z. The application of resilience theory in urban development: A literature review. Environ. Sci. Pollut. Res. 2022, 29, 49651–49671. [Google Scholar] [CrossRef] [Scilit]
  48. Krishnan, S.; Aydin, N.Y.; Comes, T. TIMEWISE: Temporal Dynamics for Urban Resilience-theoretical insights and empirical reflections from Amsterdam and Mumbai. npj Urban Sustain. 2024, 4, 4. [Google Scholar] [CrossRef] [Scilit]
Figure 1. Framework for identifying key factors affecting city resilience based on DEMATEL-FR-TAISM.
Sustainability 18 00943 g001
Figure 2. Resilient City Indicator System Framework [2,3,6,8,10,13,17,19,23].
Sustainability 18 00943 g002
Figure 3. Synthesis Influence Matrix T.
Sustainability 18 00943 g003
Figure 4. Scatter diagram of centrality and causality.
Sustainability 18 00943 g004
Figure 5. Fuzzy Reachability Matrix FR.
Sustainability 18 00943 g005
Figure 6. Threshold distribution.
Sustainability 18 00943 g006
Figure 7. Matrix with influence values WS.
Sustainability 18 00943 g007
Figure 8. UP-type and DOWN-type directed hierarchical topological diagrams with influence values.
Sustainability 18 00943 g008
Table 1. The Results of Each Impact Factor Calculation.
Factors D i C i M i R i Attributes
S10.973 0.712 1.685 0.261 CF
S21.198 1.076 2.274 0.122 CF
S30.940 0.846 1.786 0.094 CF
S40.646 0.641 1.287 0.004 CF
S50.741 0.696 1.437 0.046 CF
S60.578 0.553 1.131 0.025 CF
S70.547 0.555 1.102 −0.008 OF
S80.589 0.656 1.245 −0.066 OF
S90.607 0.674 1.281 −0.067 OF
S100.487 0.571 1.058 −0.085 OF
S110.582 0.661 1.243 −0.078 OF
S120.549 0.611 1.161 −0.062 OF
S130.562 0.591 1.153 −0.029 OF
S140.401 0.425 0.827 −0.024 OF
S150.377 0.408 0.784 −0.031 OF
S160.506 0.537 1.042 −0.031 OF
S170.519 0.550 1.069 −0.031 OF
S180.454 0.495 0.948 −0.041 OF
Disclaimer/Publisher’s Note: The statements, opinions and data contained in all publications are solely those of the individual author(s) and contributor(s) and not of MDPI and/or the editor(s). MDPI and/or the editor(s) disclaim responsibility for any injury to people or property resulting from any ideas, methods, instructions or products referred to in the content.