1. Introduction
Promoting regional coordinated development is an important strategy for China to achieve modernization and advance sustainable urban development. Given China’s vast territory, significant disparities exist across regions in terms of development levels and innovation capacity. Cities serve as key carriers of innovation and industrial activities, while simultaneously facing constraints arising from limited resources. Cities in eastern, central, western, and northeastern China differ markedly in resource endowments, institutional environments, and research capacity. Achieving sustainable urban development therefore requires a more effective and balanced collaborative innovation system, making the promotion of cross-regional innovation cooperation a critical pathway toward sustainable urban development. In this context, university–industry collaboration is not only an important means of advancing technological progress but also a key mechanism for improving the efficiency of resource allocation, narrowing regional innovation disparities, and promoting urban sustainable development through cross-actor and cross-spatial cooperation.
Intercity university–industry collaboration constitutes an important component of cross-regional cooperation. From a sustainability perspective, cross-regional university–industry collaboration helps overcome the resource constraints of individual cities or regions. Through knowledge diffusion and capability complementarity, it strengthens the innovation absorptive capacity of less-developed cities and thereby fosters a more inclusive urban innovation system. In recent years, as global competition in innovation has intensified, firms have become increasingly reliant on external collaboration to maintain technological leadership under fierce market competition. This trend requires firms to continuously innovate and provide new products and services to meet growing market demand [
1]. In such an environment, collaboration has gradually emerged as a mainstream strategy for firms to adapt to new market conditions [
2]. In innovation activities, firms tend to generate patents by seeking collaborative partners [
3], and with respect to partner selection, firms often prefer joint research and development with universities to enhance production efficiency [
4]. At the same time, universities are also motivated to commercialize research outcomes through university–industry collaboration in order to realize social value [
5]. This interactive relationship forms the foundation of university–industry collaboration.
Existing academic research on university–industry collaboration can generally be divided into two strands. One strand focuses on the antecedents of collaboration, including characteristics of micro-level actors, collaboration motivations, and external environmental factors. Studies on micro-level characteristics examine which firms or projects are more likely to engage in university–industry collaboration [
6,
7,
8]. Research on collaboration motivations investigates academic, commercial, and hybrid motivations that facilitate collaboration [
9,
10,
11], while studies on external environments analyze factors such as geography and institutions that influence university–industry collaboration [
12,
13]. The other strand increasingly incorporates social network analysis (SNA) to examine relationships between firms and universities. From a social network perspective, university–industry collaboration can be observed at the organizational level in terms of its development and evolution [
14]. Specifically, SNA enables the characterization of structural features of collaboration networks, including density, paths, centrality, and community structures [
15,
16]. The quadratic assignment procedure (QAP) and multiple regression quadratic assignment procedure (MRQAP) further provide analytical tools for examining how similarity or proximity drives university–industry collaboration ties [
17,
18], while the temporal exponential random graph model (TERGM) allows for the analysis of the dynamic evolution mechanisms of university–industry collaboration relationships [
19].
By reviewing studies on university–industry collaboration in China that employ SNA methods, we find that although these studies have made important contributions to understanding collaboration networks, several limitations remain. First, existing studies either focus on static cross-sectional network structures without capturing the evolutionary characteristics of collaboration over time, or concentrate on specific regions or urban agglomerations, lacking a comprehensive analysis of university–industry collaborative innovation networks at the national city level; this, to some extent, limits our understanding of the sustainability and stability of urban innovation systems. Second, heterogeneity in university–industry collaboration across major regions has not been sufficiently explored, limiting the ability to provide regionally differentiated insights for sustainable urban development strategies.
To address these limitations, this study introduces the TERGM to empirically model the dynamic evolution of university–industry collaborative innovation networks among prefecture-level and above cities across China over multiple years. TERGM is a statistical modeling approach for analyzing dynamic networks and represents a temporal extension of the traditional exponential random graph model (ERGM). It enables the identification of how network structures evolve over time and uncovers the generative mechanisms underlying network changes [
19]. Compared with static ERGM (including valued ERGM) or conventional panel regression models, TERGM not only captures endogenous structural features of networks but also incorporates temporal dependence to reflect dynamic attributes such as tie persistence and path dependence, thereby providing a more accurate depiction of the temporal mechanisms driving network evolution. Existing studies have widely applied TERGM across various fields, including Belt and Road cross-national patent collaboration networks [
20], China–ASEAN science and technology collaboration networks [
21], international trade networks [
22], land leasing networks [
23], and climate technology collaboration networks [
24]. Although prior studies have examined university–industry collaboration within specific regions using patent data, no research has yet investigated intercity collaboration patterns and the evolutionary mechanisms of collaboration networks at the national level. Using TERGM, this study models university–industry collaboration networks among prefecture-level and above cities in China from 2004 to 2020, aiming to identify internal and external mechanisms shaping network evolution. This approach helps reveal the stability and expansibility of university–industry collaboration relationships and provides insights for sustainable urban innovation strategies.
Overall, this study adopts a nationwide city-level perspective and constructs a multi-year university–industry collaborative innovation network comprising 275 prefecture-level and above cities based on Chinese university–industry collaboration patent data. By integrating additional datasets, the study conducts descriptive statistical analysis, visualization, and TERGM-based modeling to examine the structural evolution and driving mechanisms of the network. Furthermore, heterogeneous samples are constructed based on collaboration intensity to analyze the respective roles of developed and less-developed cities in innovation collaboration. On the basis of empirical evidence, this study elucidates the evolutionary dynamics and mechanisms of intercity university–industry collaboration and explores regional differences under conditions of unbalanced development. From a sustainability perspective, this study helps elucidate how cities, under conditions of uneven regional development, enable the cross-regional flow and reallocation of innovation resources through university–industry collaboration networks, thereby providing empirical evidence for building a more balanced, inclusive, and resilient urban innovation system.
2. Theoretical Framework and Hypotheses
TERGM analyzes the dynamic evolution of networks through four categories of variables: endogenous structural terms, node attribute terms, exogenous network terms, and temporal dependence terms. Among these, endogenous structural terms and temporal dependence terms represent endogenous factors related to the formation and evolution of network ties, whereas exogenous network terms and node attribute terms constitute exogenous influences on the network. Together, these endogenous and exogenous factors jointly shape the formation and evolution of the network.
2.1. Endogenous Structural Effects
Endogenous network structures refer to the complex structural configurations inherent in network nodes, which mainly include the geometrically weighted degree (Gwdegree), geometrically weighted dyad-wise shared partners (Gwdsp), and geometrically weighted edge-wise shared partners (Gwesp). In undirected networks, the geometrically weighted degree represents a node’s tendency to form connections with other nodes, and is used to characterize the dispersion or concentration of node degrees. Geometrically weighted dyad-wise shared partners describe situations in which two nodes that are not directly connected establish indirect ties through a third intermediary node and are commonly used to capture the transitivity of information transmission among nodes. Geometrically weighted edge-wise shared partners refer to configurations in which three nodes are pairwise connected, indicating that two nodes with shared intermediary partners form direct ties with each other. By applying the TERGM to analyze endogenous structures in empirical networks, it is possible to observe the tendencies of these structural configurations to emerge in real-world networks and thereby examine their underlying network characteristics.
2.1.1. Diffusion Effects
A node’s degree reflects its centrality within the network. In university–industry collaborative innovation networks, nodes with high degrees typically represent “star cities” that have established extensive collaborative ties with many other cities. These cities occupy pivotal positions in innovation collaboration networks and therefore bear relatively high coordination and management costs associated with collaboration. Because both the establishment and maintenance of collaborative ties require resource inputs, high-degree cities face increasing marginal collaboration costs as the scale of their partnerships expands. Consequently, when existing partners are sufficient to meet a city’s innovation needs, these central cities tend to reduce or avoid forming new collaborative ties. This process encourages collaborative links to gradually diffuse toward cities with lower degrees, ultimately resulting in a diffusion tendency in the network [
25].
Based on the above analysis, this study proposes:
Hypothesis H1a: In university–industry collaborative innovation networks, as high-degree cities’ capacity to absorb new collaborative ties declines, collaborative relationships are more likely to form among low-degree cities, leading the network as a whole to exhibit diffusion effects.
2.1.2. Connectivity Effects
Connectivity refers to a situation in which two nodes establish indirect ties through one or more intermediary nodes without forming a direct connection between themselves, thereby creating an open triadic structure [
26]. In university–industry collaborative innovation networks, this is manifested when two cities do not directly establish collaborative relationships but instead engage in innovation collaboration through intermediary cities. The motivation for forming indirect ties in such networks arises from differences in resource endowments among actors. These disparities may hinder collaboration between actors with lower innovation capacity and those with higher innovation capacity, whereas seeking intermediary actors to establish indirect connections helps overcome collaboration barriers and facilitates access to knowledge resources for less innovative actors [
27]. Cities with high innovation capacity also have incentives to drive the development of surrounding cities; however, constrained by the costs of establishing direct collaborative ties, they tend to construct regional technological collaborative innovation networks in which surrounding cities serve as intermediaries [
28].
Based on the above analysis, this study proposes:
Hypothesis H1b: Connectivity effects exist in university–industry collaborative innovation networks, and open triadic structures promote the formation of collaborative ties between cities.
2.1.3. Closure Effects
Closure builds upon open triadic structures by connecting two nodes that were not directly linked, thereby forming closed triadic structures. This configuration indicates that nodes previously connected only through indirect ties establish direct connections, resulting in tightly connected clusters. In university–industry collaborative innovation networks, the formation of stable closed triadic structures among cities implies the flexible and sufficient circulation of innovation factors, which enhances innovation capacity. Moreover, the existence of shared collaborative partners between cities increases mutual trust and reduces uncertainty and risks associated with collaboration. Consequently, cities are more likely to select other cities with common partners as direct collaborators, leading to the formation of closed triadic structures.
Accordingly, this study proposes:
Hypothesis H1c: Closure effects exist in university–industry collaborative innovation networks, and closed triadic structures promote the formation of collaborative ties between cities.
2.2. Multidimensional Proximity Effects
Proximity analysis is widely used in studies of network evolutionary dynamics and refers to the degree of closeness between actors along certain dimensions [
29]. In university–industry collaborative innovation networks, similarities or differences between cities can influence the formation of collaborative ties. Given the inherent geographic attributes of cities, geographic proximity has been extensively applied in urban network analysis. Organizational proximity effectively reflects administrative relationships between cities. Although a city’s level of economic development is often incorporated into TERGM analysis as a node attribute, node attributes can only reveal a single node’s propensity to form ties and are insufficient for capturing dyadic collaborative relationships between cities. Therefore, this study constructs an economic similarity network to measure proximity between cities in terms of economic development levels. In summary, geographic proximity, organizational proximity, and economic proximity are employed to examine the effects of exogenous factors on intercity university–industry collaborative innovation ties.
2.2.1. Geographic Proximity
Geographic proximity reflects the spatial distance between actors. In university–industry collaborative innovation networks, spatial distance between cities is an important factor influencing collaborative innovation. An increase in geographic distance reduces the likelihood of innovation ties forming between actors [
30], whereas geographic closeness enables collaborating actors to share similar environments, promotes the frequency of communication and interaction, and accelerates the flow of knowledge, thereby facilitating knowledge creation and innovation [
31].
Based on the above analysis, this study proposes:
Hypothesis H2a: Geographic proximity facilitates the formation of university–industry collaborative ties between cities.
2.2.2. Organizational Proximity
Organizational proximity refers to situations in which actors are located within the same organization or in closely related organizations, thereby sharing common arrangements and governance structures [
30]. When cities are embedded within the same organizational framework, they can more effectively integrate their fragmented knowledge resources to engage in innovation activities. Moreover, organizational control mechanisms are better able to safeguard innovation activities from the high transaction costs and contractual incompleteness associated with market-based coordination [
32]. Consequently, organizational proximity facilitates collaborative innovation between cities.
Accordingly, this study proposes:
Hypothesis H2b: Organizational proximity promotes the formation of university–industry collaborative ties between cities.
2.2.3. Economic Proximity
Economic proximity refers to the degree of similarity between cities in terms of economic development levels and economic structures. Differences in economic development levels are important factors influencing cities’ knowledge innovation capacity and the flow of knowledge [
33]. When cities exhibit similar levels and structures of economic development, they tend to share comparable technological demands, which in turn provides greater scope for innovation collaboration.
Based on the above analysis, this study proposes:
Hypothesis H2c: Economic proximity promotes university–industry collaborative innovation between cities.
2.3. Temporal Stability
Compared with the ERGM, the advantage of the TERGM lies in its incorporation of temporal dependence terms, which enables the analysis of network evolution from a temporal perspective. Temporal stability refers to the tendency of a network to remain relatively stable over time rather than undergoing frequent changes. In university–industry collaborative innovation networks, establishing collaborative innovation ties between cities often entails costs, including the costs of searching for suitable partners and maintaining collaborative interactions. Replacing existing partners also requires additional costs. Moreover, established innovation collaboration relationships exhibit a certain degree of dependence, discouraging cities from readily abandoning existing ties. As a result, cities are unlikely to frequently alter established collaborative innovation relationships, and such relationships tend to display temporal stability.
Based on the above discussion, this study proposes:
Hypothesis H3: University–industry collaborative innovation networks exhibit temporal stability, such that network structures do not change easily over time.
3. Network Construction and Evolutionary Analysis
3.1. Construction of the Urban University–Industry Collaborative Innovation Network
Patents are widely used to analyze knowledge flows and innovation because they embody the knowledge elements involved in innovative activities. Collaborative patents involve two or more knowledge actors and are therefore well suited for the analysis of collaborative innovation. In China, patents are classified into utility model patents, invention patents, and design patents. It is generally believed that utility model patents and invention patents are better indicators of innovative activities in actual production. Additionally, using the application date of patents rather than the authorization date to determine the year of collaboration helps ensure that the innovation activities occurred closer to the actual time. First, collaborative patents with two or more applicants were retrieved from the China National Intellectual Property Administration (CNIPA). Patent records with application dates outside the period 2004–2020 were excluded, and joint application patents involving universities and enterprises were further identified. By examining the application addresses of patent applicants, the prefecture-level cities in which the applicants were located were determined and treated as nodes in the innovation collaboration network. Each cross-city collaborative patent was regarded as an instance of intercity innovation collaboration. After data processing, the university–industry collaborative patent network involved 275 prefecture-level cities, with a total of 166,113 valid patents obtained.
Because patent records by default report only the application address of the first applicant, while address information for the second applicant is often missing, we exploited the specific structural characteristics of patent address information and applied a field-extraction approach to construct a patent address matching database. This was combined with manual verification to supplement missing location information for second applicants. As a result, an overall matching rate of 74% was achieved, yielding 123,542 valid records. For the unmatched patent samples, we conducted further analyses and found that approximately 99.6% of the unmatched records were due to missing enterprise addresses, rather than university addresses. This proportion is broadly consistent with the structural fact that the number of enterprises is far larger than that of universities. Meanwhile, from a temporal perspective, the distribution of unmatched samples across years is consistent with that of the original patent dataset, showing no obvious concentration in particular years or any noticeable stage-specific deviation. The addresses of the first and second applicants were treated as the two city nodes of each collaborative patent and linked accordingly to generate the adjacency matrix of the university–industry collaborative innovation network, which was further used to construct the network. Overall, the urban university–industry collaborative innovation network is a valued undirected network comprising 275 nodes over the period 2004–2020.
3.2. Evolutionary Analysis of the Urban University–Industry Collaborative Innovation Network
Before applying the TERGM to analyze the evolutionary mechanisms of the urban university–industry collaborative innovation network, descriptive statistics and analysis of network evolutionary characteristics were conducted using indicators such as degree centralization, average degree, network density, global clustering coefficient, average path length, and network diameter. The formulas and interpretations of these indicators are introduced as follows.
3.2.1. Definitions and Formulas of Key Indicators for Network Evolutionary Analysis
Degree centralization measures the concentration of node connections and reflects the degree of resource concentration within the network. A higher degree centralization value indicates a greater concentration of resources. Here,
denotes the degree of node
, and
represents the total number of nodes in the network:
Average degree represents the overall level of connectivity in the network, with higher values indicating that nodes participate more actively in collaborative innovation:
Network density reflects the overall tightness of connections within the network, with higher values indicating denser collaborative relationships. Here,
denotes the actual number of edges in the network:
The global clustering coefficient is used to measure the level of clustering in a network; higher values indicate a stronger tendency for nodes to form tightly connected groups:
Average path length reflects the overall connectivity efficiency of the network; smaller values indicate more efficient transmission of information and resources. Here,
denotes the shortest path length from node
to node
:
Network diameter refers to the length of the shortest path between the two most distant nodes in the network and reflects the overall compactness of the network:
3.2.2. Descriptive Statistical Results of Network Evolutionary Characteristics
We used R to examine the evolution of various network indicators for all 275 nodes in the urban university–industry collaborative innovation network from 2004 to 2020, and analyzed changes in the network during this period based on these indicators. As shown in
Table 1, the number of network edges increased substantially year by year, indicating that cities nationwide established an increasing number of collaborative ties. The average degree increased from 3.18 to 12.84, meaning that, on average, each city node expanded its number of collaborative partners from approximately three to about thirteen, reflecting a significant increase in interactions among innovation resources. Meanwhile, network density rose from 0.036 to 0.050; although the network remained sparse, a slight upward trend is evident. Degree centralization increased from 0.377 to 0.532, suggesting that innovation resources gradually became concentrated in hub cities during network evolution. The clustering coefficient increased from 0.182 to 0.517, indicating that cities increasingly formed tightly connected triadic collaboration structures. The coexistence of high degree centralization and a high clustering coefficient implies that the university–industry collaborative innovation network exhibits a core–periphery structure, in which a small number of hub cities dominate the flow of innovation resources and foster numerous locally cohesive collaboration groups centered on these hubs. In addition, the average path length declined from 2.88 to 2.36, indicating a gradual improvement in the efficiency of university–industry collaboration. After 2013, the clustering coefficient increased steadily, while the average path length continuously declined from 2015 onward, revealing a strengthening of small-world characteristics in subsequent years. Small-world characteristics refer to a network structure that simultaneously exhibits two properties: a relatively high level of clustering and a relatively short average path length. This means that, on the one hand, cities are more likely to form stable collaborative communities; on the other hand, these communities are efficiently connected through a few bridge cities, enabling innovation factors to diffuse more rapidly across the network. This pattern suggests that network evolution simultaneously facilitates rapid knowledge diffusion and reduces collaborative innovation risks through tightly knit group structures, thereby enhancing the systemic resilience of university–industry collaborative innovation.
3.2.3. Visualization of the Urban University–Industry Collaborative Innovation Network
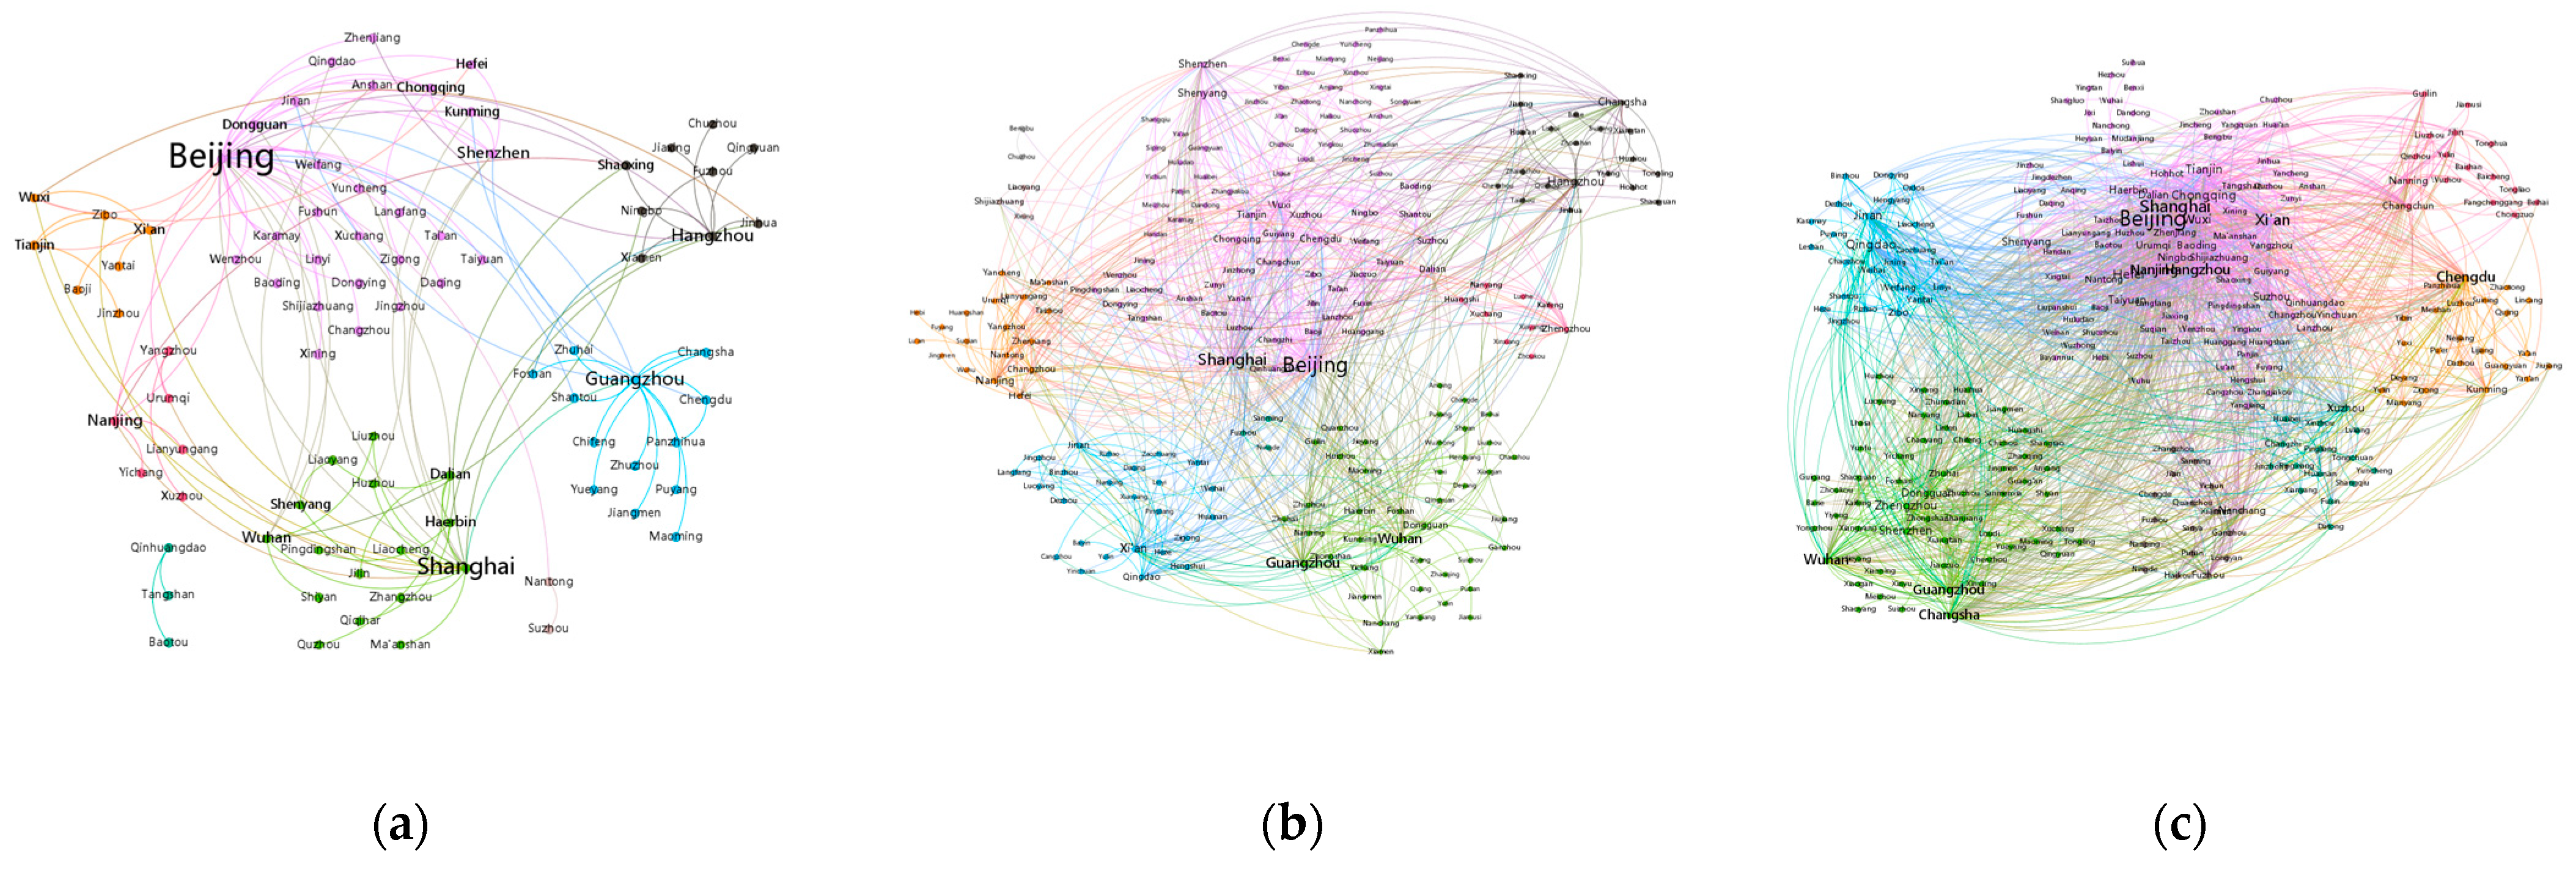
Using Gephi (v0.10.1), all non-isolated nodes in the urban university–industry collaborative innovation networks for the years 2004, 2012, and 2020 were subjected to community detection based on the modularity maximization algorithm, and the resulting communities were visualized. The resulting network graphs are shown in
Figure 1.
Nodes in different colors in the figure represent different communities, within which city nodes exhibit relatively high connection density and structural similarity. As shown by the network graphs, the urban university–industry collaborative innovation network was relatively sparse in 2004, with only 84 cities participating in collaborative innovation, Accordingly, there were 191 isolated nodes, which were not included in the visualization. Star cities such as Shanghai, Beijing, and Guangzhou belonged to different communities, and inter-community connectivity was weak. By 2012, network density had increased markedly. Many star cities completed collaboration integration and merged into the same community; meanwhile, as the number of non-isolated cities joining the university–industry collaborative innovation network increased to 202, the actual number of communities did not decline. By 2020, the urban university–industry collaborative innovation network had become highly developed, exhibiting a very dense network structure. In that year, 242 non-isolated cities were involved in university–industry collaboration. The number of star cities further increased and became more clustered in terms of community distribution. Collaborative ties between different communities increased significantly, while certain geographic spatial patterns remained evident. Specifically, there existed a core community centered on Beijing and Shanghai whose members were widely distributed geographically; a Shandong community centered on Jinan and Qingdao; a central and Guangdong community centered on Wuhan, Guangzhou, and Changsha; a southwestern community centered on Chengdu and Kunming; and three additional small communities lacking star cities. Together, these seven communities constituted the urban university–industry collaborative innovation network in 2020.
Regarding node degree distribution, this study counts high-degree cities using a degree threshold of 20. In 2004, only Shanghai and Beijing had degrees exceeding 20, making them the two principal high-degree cities in the early stage of university–industry collaboration. By 2012, the number of qualifying cities increased to 13, including eight cities in the eastern region (Beijing, Shanghai, Guangzhou, Shenzhen, Tianjin, Nanjing, Hangzhou, and Wuxi), two in the central region (Changsha and Wuhan), two in the western region (Chengdu and Xi’an), and only one in the northeastern region (Shenyang). The leading cities in university–industry collaborative innovation were predominantly concentrated in the eastern region, indicating that innovation resources first agglomerated in the east and then diffused inland. By 2020, the number of cities with degrees exceeding 20 rose to 36, including 20 in the eastern region, 5 in the central region, 6 in the western region, and 5 in the northeastern region. This suggests that while the eastern region continued to maintain a leading position in university–industry innovation, collaborative innovation activities in the central, western, and northeastern regions also developed substantially to a certain extent.
5. Empirical Results
5.1. Baseline Empirical Results
We used the btergm package in R (v4.3.3) to fit a TERGM to the urban university–industry collaborative innovation network from 2004 to 2020 using maximum pseudolikelihood estimation (MPLE), and employed bootstrapping to estimate standard errors and confidence intervals. This framework allows us to examine the formation mechanism of intercity university–industry collaboration ties; given the nature of TERGM, tie formation refers to whether cities (as nodes in the network) establish an edge—i.e., a change from 0 to 1. The results are reported in
Table 3. Model (1) includes only endogenous structural variables, namely network edges, geometrically weighted degree, geometrically weighted dyad-wise shared partners, and geometrically weighted edge-wise shared partners. Model (2) extends Model (1) by adding node attribute variables, including cities’ R&D expenditure, urbanization rate, and the level of digital economy development. Model (3) further incorporates exogenous network covariates, namely the geographic proximity network, the organizational proximity network, and the economic proximity network. Model (4) adds temporal covariates to the above specifications.
As shown in the table, the edge term (Edges) is negative and statistically significant at the 1% level across all four models, indicating that the urban university–industry collaborative innovation network is not formed randomly. The observed network density is much lower than that of a randomly generated network, suggesting that cities carefully select their collaboration partners and that examining the mechanisms underlying tie formation has clear practical relevance. The following analysis therefore focuses on the full specification in Model (4).
As shown in Model (4), the coefficient of the geometrically weighted degree term is significantly negative, indicating that the probability of nodes in the urban university–industry collaborative innovation network forming ties with other high-degree nodes is significantly reduced by approximately 0.665 times (A). This suggests that star cities in university–industry innovation tend to be more cautious in selecting collaboration partners, thereby supporting Hypothesis H1a.
The results indicate a strong tendency for cities to establish collaborative ties through intermediary nodes, forming open triadic structures. This tendency is supported by the significantly positive coefficient of the geometrically weighted dyad-wise shared partners term, suggesting that cities are more likely to engage in indirect knowledge collaboration via intermediary cities. This finding is consistent with Hypothesis H1b, which posits the existence of connectivity effects in university–industry collaborative innovation networks, whereby open triadic structures facilitate the formation of intercity collaborative ties.
Beyond indirect connections, the network further exhibits a clear tendency toward triadic closure. The significantly positive coefficient of the geometrically weighted edge-wise shared partners term indicates that cities tend to establish direct collaborative ties with partners connected through existing indirect relationships. This result supports Hypothesis H1c, confirming the presence of closure effects in university–industry collaborative innovation networks, in which closed triadic structures promote the formation of collaborative ties between cities.
The exogenous network covariates reported in Model (4) present the estimated coefficients and significance levels of multidimensional proximity networks. As shown in the table, the coefficient of geographic proximity is negative and statistically significant, indicating that a reduction in geographic distance increases the likelihood of tie formation between cities, whereas excessive distance hinders university–industry collaborative ties. This finding supports Hypothesis H2a, which posits that geographic proximity facilitates the formation of university–industry collaboration between cities. The coefficient of organizational proximity is significantly positive, suggesting that cities located within the same provincial-level administrative unit are more likely to establish collaborative ties, consistent with Hypothesis H2b that organizational proximity promotes university–industry collaboration between cities. The coefficient of economic proximity is also significantly positive, indicating that cities with similar levels of economic development are more inclined to form collaborative ties. This result supports Hypothesis H2c, which argues that economic proximity promotes university–industry collaborative innovation between cities.
Finally, the table reports the coefficient of the temporal dependence term in the urban university–industry collaborative innovation network. This coefficient is significantly positive, indicating that as the network evolves over time, it tends to preserve existing ties. In other words, cities make collaborative innovation decisions cautiously and are unlikely to change established collaborative relationships frequently. This finding supports Hypothesis H3, which posits that the university–industry collaborative innovation network exhibits temporal stability, such that its network structure does not change easily over time.
5.2. Robustness Checks
We conduct robustness checks on the baseline estimation results using two approaches. First, while the baseline results are estimated using the maximum pseudolikelihood estimation (MPLE) method, this section re-estimates Model (4) using the Markov chain Monte Carlo maximum likelihood estimation (MCMC-MLE) method. Second, whereas the original urban university–industry collaborative innovation network is a multi-period network covering 17 years from 2004 to 2020, we reselect the time periods and reconstruct a new network consisting of nine years by including only even-numbered years from 2004 to 2020, and re-estimate Model (4) accordingly. The results of these two robustness checks are reported as Model (5) and Model (6) in
Table 4, respectively. Compared with the baseline results, the estimation results remain largely unchanged after altering the estimation method and the network time structure, thereby confirming the robustness of the findings.
5.3. Heterogeneity Analysis
5.3.1. Heterogeneity Analysis by Collaboration Intensity
Using the baseline estimation model, we examine the probability of edge formation in the urban university–industry collaborative network, that is, the likelihood that patent collaboration relationships emerge between cities. In actual urban university–industry collaborative innovation networks, however, intercity collaborations vary in intensity, with both high-intensity and relatively low-intensity collaborative relationships coexisting. High-intensity collaboration involves substantial aggregation and flows of innovation factors, entails higher costs, and generates greater value. As a result, actors engaged in high-intensity collaboration tend to be more cautious in selecting partners and place greater emphasis on various forms of proximity. In contrast, low-intensity collaboration often represents low-cost, low-value exploratory or short-term interactions, in which the criteria for partner selection may be less stringent. Accordingly, proximity effects may be overstated in low-intensity collaboration settings, making it necessary to further investigate their influence from the perspective of different collaboration intensities. In summary, for urban university–industry collaborative innovation networks, it is necessary to differentiate intercity ties by the number of collaborative patents and conduct heterogeneity analysis to explore how variations in edge weights may shape collaboration dynamics.
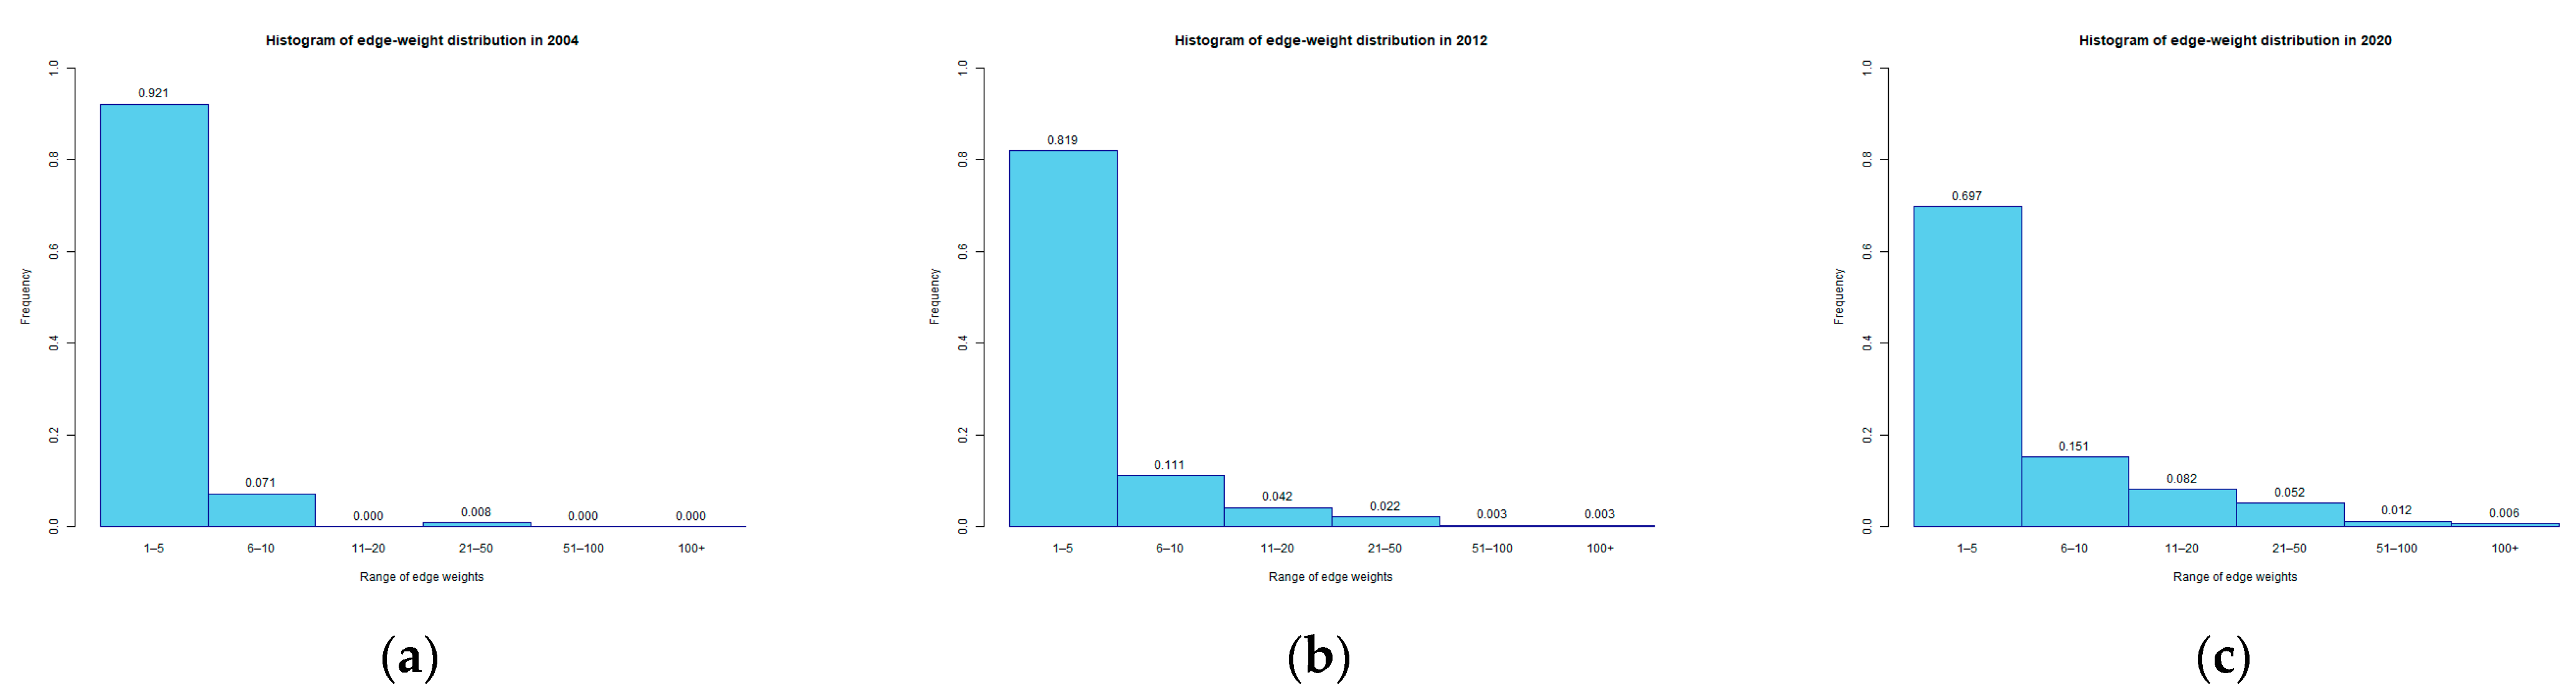
We classify the intensity of intercity collaboration based on node tie weights (i.e., edge weights). The procedure is as follows. First, histograms of edge-weight distributions for the urban university–industry collaborative innovation networks in 2004, 2012, and 2020 are plotted, and an appropriate classification threshold is selected according to the evolution of the edge-weight distributions. As shown in
Figure 2, the number of low-intensity intercity collaborations exhibits an overall declining trend over the observation period, with their share decreasing from 99.2% in 2004 to 84.8% in 2020. Based on these distributional results, and with reference to the edge-weight distribution in the most recent year of the dataset, a threshold of 15% is adopted. Specifically, for each year, edges in the urban university–industry collaborative innovation network are ranked in descending order by weight, with the top 15% classified as the high-intensity collaboration network and the remaining 85% classified as the low-intensity collaboration network.
Both networks are then estimated using the same parameter specification as Model (4). The results are reported as Models (7) and (8) in
Table 4, where Model (7) corresponds to the high-intensity collaboration network and Model (8) to the low-intensity collaboration network. A comparison of these two models with Model (4) shows that the parameter estimates for the high-intensity collaboration network are consistent with the baseline results. In contrast, the closure effect is not statistically significant in the low-intensity collaboration network, indicating that, relative to the full network, closure characteristics are weak: cities tend to maintain open connections and are less likely to form tightly knit groups. This may be attributable to the discretionary and low-cost nature of low-intensity collaboration, which does not require cities to consider the feasibility and cost commitments associated with long-term partnerships.
Regarding economic proximity, the coefficient is positive and statistically significant in the high-intensity collaboration network, whereas it is not significant in the low-intensity collaboration network. These results suggest that cities place greater emphasis on partners’ economic development levels when establishing high-intensity collaborations, and that the economic proximity effect for low-intensity ties is overestimated in the aggregate network estimation. In addition, differences in the coefficients for geographic proximity and organizational proximity further indicate that these forms of proximity are more strongly emphasized in high-intensity collaboration settings.
Building on the extraction of the high-weight collaboration network, we further construct a dummy variable indicating whether a city participates in high-intensity collaboration. This variable is interacted with a dummy for high economic development (defined as cities whose GDP ranks in the top 15% in a given year) to form an interaction term capturing the joint condition of high collaboration intensity and high economic development. This interaction term is then included as a node attribute in the baseline model for analysis.
Considering that including too many node attributes in the TERGM may affect the accuracy of other parameter estimates [
19], we use the interaction term as the sole node attribute (gdpcollab), replacing other node attributes in the model specification. This allows us to isolate and examine the behavioral tendencies of cities that simultaneously exhibit high collaboration intensity and high levels of economic development within the network. The results, reported as Model (9) in
Table 4, show that the coefficient of the interaction term is positive and statistically significant, while the geometrically weighted degree term remains significantly negative. This indicates that, even in the presence of diffusion effects, such cities are more likely to engage in collaborative innovation.
5.3.2. Inter-Regional Heterogeneity Analysis
Due to China’s vast territory, the country is also commonly divided into four major macro-regions—Eastern, Central, Western, and Northeastern China—which typically correspond to different levels of development. The eastern region was the first to benefit from the Reform and Opening-up policies and is therefore more developed, whereas the other regions are relatively less developed. Clearly, it is also important to examine the mechanisms of university–industry collaboration across regions.
Accordingly, we introduced additional region-related parameters into the TERGM based on each city’s regional affiliation, in order to test whether cities exhibit region-based tendencies in forming university–industry collaboration ties and whether collaboration propensities differ across region pairs. As reported in Model (10) of
Table 5, the estimate for nodematch (region) is not statistically significant. This indicates that, conditional on the model specification, cities within the same macro-region do not display a significantly higher propensity to collaborate. In other words, the four-way macro-regional classification has limited explanatory power for university–industry collaboration ties, which are more likely shaped by finer-grained proximity mechanisms.
Among the four macro-regions, the eastern region is widely recognized as the most active in university–industry collaboration. We therefore take within-region ties in the East as the reference category and further examine the relative propensity of university–industry collaboration across each region pair. Under this specification, there are nine region-pair terms to interpret: collaboration ties between every pair of regions, as well as within-region collaboration in the three non-eastern regions (Central, West, and Northeast). We report the region-pair estimates from the model separately in
Table 6. Note that, because the network is undirected, the corresponding off-diagonal entries in the table are symmetric (i.e., the two cells mirrored around the diagonal represent the same region pair).
As shown in
Table 6, taking within-region ties among eastern cities as the reference, the propensity for university–industry collaboration between eastern and western cities, as well as between eastern and northeastern cities, is significantly higher. Given the high overall level of university–industry collaboration activity in the East, this suggests that the eastern region plays a hub role in the city-level university–industry collaboration innovation network. By contrast, within-region ties in the Central region do not exhibit a significant preference beyond the baseline level. Collaboration between the Central and Western regions is significantly above the baseline, which is consistent with the idea that central cities receive collaboration linkages originating from the East and facilitate their gradual diffusion toward inland areas. The collaboration propensity between the Central and Northeastern regions does not significantly deviate from the baseline.
Both the Western and Northeastern regions display strong within-region collaboration tendencies. This pattern can be explained by the distinctive industrial structures in these two regions, as universities there typically place greater emphasis on industries with local comparative advantages. Finally, ties between the Western and Northeastern regions are also above the baseline level, indicating a pronounced—though not geographically adjacent—collaboration linkage between the two regions.
5.3.3. Intra-Regional Heterogeneity Analysis
In the overall university–industry collaborative innovation network, collaborative ties within the same region are interwoven with those across different regions. Building on the discussion of inter-regional heterogeneity, we further examine university–industry collaboration ties within each region. Accordingly, we divide the university–industry collaborative innovation network into four major regions—eastern, central, western, and northeastern China—and apply the TERGM to each regional network to analyze patterns of university–industry collaboration within these regions. The results of the regional heterogeneity analysis are reported in Models (11)–(14) of
Table 5.
In
Table 5, Models (11)–(14) report the estimation results for the university–industry collaborative innovation networks in the eastern, central, western, and northeastern regions, respectively. The results show that the core dependent variable is statistically significant across all four regions, indicating that the network structures in each region deviate significantly from randomly generated networks and exhibit pronounced non-random structural characteristics. Notably, the central region displays more ties than would be expected in a random network, suggesting a stronger tendency toward more frequent intraregional connections among cities in this region.
With respect to endogenous structural variables, the geometrically weighted degree and the geometrically weighted dyad-wise shared partners terms are statistically significant across all regional models and are consistent with the baseline model. By contrast, the geometrically weighted edge-wise shared partners term is not significant in all regions except the eastern region. This indicates that, outside the eastern region, city nodes do not tend to form closed triadic structures within their respective regions—that is, they are less inclined to establish collaborative ties through intermediary cities within the same region. A possible explanation is that the eastern region, being more economically developed, hosts a larger number of high-quality universities, research institutions, and innovative enterprises, which has fostered relatively mature university–industry collaboration mechanisms. As a result, the foundations for collaboration—particularly in cross-regional interactions—are more robust, and closed network structures among cities are easier to sustain. In contrast, university–industry collaborative innovation networks in the central, western, and northeastern regions are relatively less developed, with collaboration relying more heavily on non-economic factors such as administrative coordination, and thus lacking strong incentives for closure. This leads to the absence of a pronounced tendency toward closed triadic structures in these regions.
Regarding exogenous network covariates, the coefficient of economic proximity is positive and statistically significant in the eastern region, but negative and significant in the central and western regions. This suggests that cities in the eastern region tend to select collaboration partners with similar levels of economic development, whereas cities in the central and western regions are more inclined to collaborate with partners at different levels of economic development. This pattern may be attributable to the widespread structural disparities in economic development observed in the central and western regions. In regional economics, urban primacy measures the development gap between the largest city and the second-largest city within a region, typically using urban population as the primary indicator of size [
36]. In China, provincial capital cities exhibit substantial regional variation in urban primacy, with lower levels in coastal regions and higher levels in central and western regions. This distribution reflects a more pronounced “core–periphery” pattern of urban development in the central and western regions, where provincial capitals not only serve as political centers but also assume major economic functions. Consequently, collaborative innovation is more likely to occur between cities with markedly different levels of economic development in these regions.
Finally, with respect to geographic proximity and organizational proximity, all regional networks exhibit similar evolutionary tendencies, and networks in all regions demonstrate temporal stability over time.
5.4. Goodness-of-Fit Test
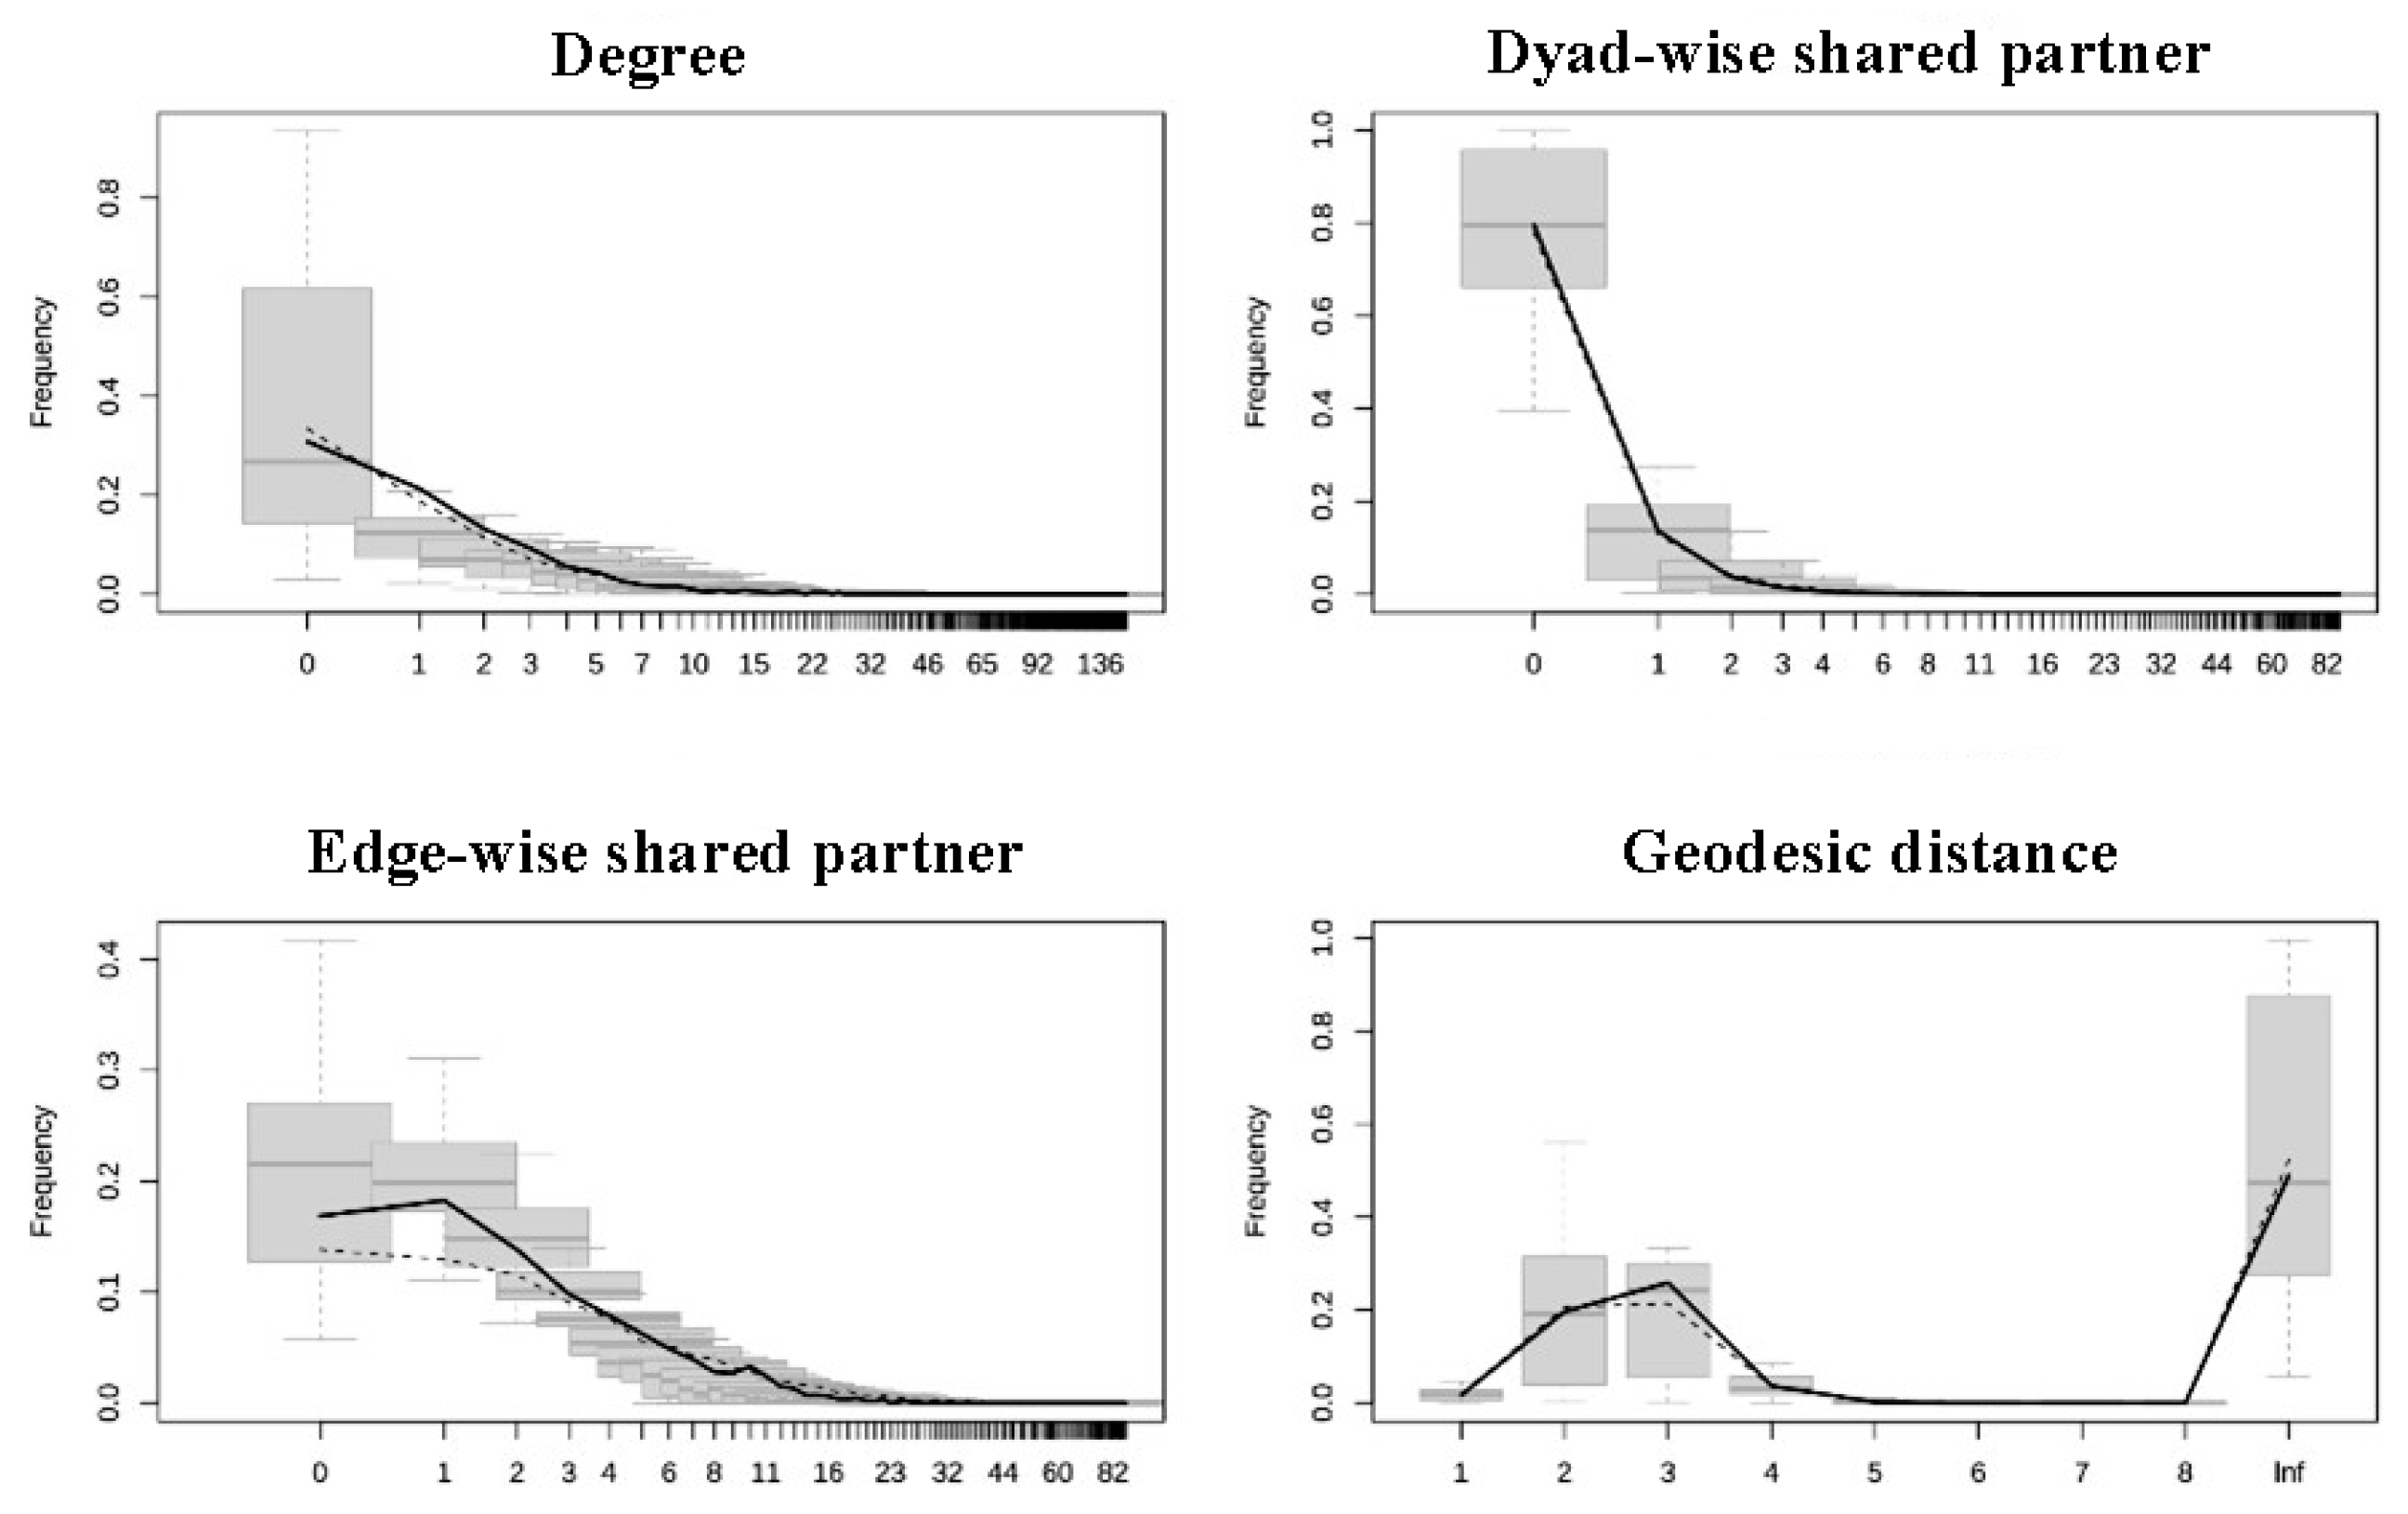
To assess the reliability of the urban university–industry collaborative innovation network model, we further conduct goodness-of-fit (GOF) tests for four representative statistics used in Model (4), namely degree centrality, geometrically weighted dyad-wise shared partners, geometrically weighted edge-wise shared partners, and geodesic distance. This test compares the observed network with multiple simulated networks generated from the model based on the selected statistics, thereby evaluating whether the model can accurately reproduce the structural characteristics of the empirical network. The GOF results are presented in
Figure 3.
The figure includes box plots for each statistic. The gray dashed area represents the distribution frequency of the statistics obtained from the simulated networks, while the black solid line represents the distribution of the corresponding statistic in the observed network. When the black solid line lies close to the median of the box plots, the model is considered to provide a good fit. Given the wide ranges and concentrated distributions of the network statistics, the x-axis is plotted on a logarithmic scale. As shown in the figure, the model exhibits a good fit overall, with the exception of some deviations in the geodesic distance distribution at larger distances.
6. Conclusions
Based on university–industry collaborative patent data for Chinese cities from 2004 to 2020, this study constructs an urban university–industry collaborative innovation network and systematically analyzes its evolutionary characteristics and underlying mechanisms using a TERGM. The results show that the network has continuously expanded, with increasing structural complexity, a growing number of star cities, and the gradual emergence of pronounced small-world characteristics in the later stages.
Network evolution exhibits clear non-random features, characterized by an overall diffusion trend as well as the coexistence of connectivity and closure effects. As collaboration scales expand, star cities become more cautious in selecting collaboration partners once their innovation demands approach saturation, and intercity collaboration increasingly expands through intermediary nodes. Network formation is influenced not only by endogenous structural mechanisms but also by exogenous proximity factors: economic and organizational proximity facilitate intercity collaboration, whereas increasing geographic distance inhibits cooperative ties. In addition, the network demonstrates strong temporal stability over time.
Further heterogeneity analyses indicate that low-intensity collaborative relationships are flexible and low-cost in nature and do not exhibit pronounced closure effects. In contrast, high-intensity collaboration places greater emphasis on similarity in economic development levels, and cities with higher levels of economic development that participate frequently in collaboration are more inclined to establish new innovation ties. At the regional level, the network exhibits only a weak within-region preference and instead appears more cross-region integrative. The eastern region acts as a collaboration hub, the central region plays a role in absorbing collaboration activities and facilitating their diffusion toward inland areas, and there is a pronounced cross-regional collaboration tendency between the western and northeastern regions. Moreover, both the western and northeastern regions show stronger within-region collaboration propensities. cities in the eastern region tend to collaborate with partners with similar levels of economic development, whereas cities in the central, western, and northeastern regions display a more pronounced core–periphery structure and relatively weaker endogenous momentum for forming tightly knit innovation collaboration networks.
Based on these findings, this study argues that urban sustainable development should be promoted from the perspective of coordinated innovation. First, the leading role of core cities in university–industry collaboration networks should be strengthened by improving cross-regional collaborative innovation platforms and enhancing the diffusion and spillover of innovation resources. Second, mechanisms for direct intercity collaboration should be optimized by reducing collaboration costs and risks, thereby promoting complementary partnerships among cities with different economic structures. Third, differentiated guidance for collaborations of varying intensity is necessary, balancing the stability of high-intensity collaborations with support for low-cost, exploratory forms of cooperation. Finally, institutional support and cross-regional collaboration should be strengthened to enhance the participation of cities in the central, western, and northeastern regions in innovation collaboration, thereby promoting more balanced regional innovation capacity and sustainable urban development.
Our study also has several limitations. To capture the temporal evolution of the city-level university–industry collaboration innovation network, we adopted the TERGM. However, constrained by the model framework, we are unable to directly examine the evolution of edge weights in the network—that is, whether city pairs tend to form more or fewer university–industry collaborations over time. In addition, during data collection and construction, the availability of patent data and the address-matching procedure may have led us to miss some small or newly established collaborating firms, as their addresses could not be reliably identified when they first appeared in joint patent applications. Moreover, heterogeneity in the “quality” of universities and firms likely exists across the sample; developing effective ways to identify and incorporate such actor-specific characteristics may reveal additional heterogeneity that is not captured in this study. Furthermore, administrative directives play a pronounced role in shaping the behavior of universities and firms in China—arguably to a greater extent than in many other countries and regions—and disentangling this influence may yield further insights. Finally, the relationship between the digital economy and innovation has long been an important research topic. In this paper, we treat the digital economy only as a control variable and do not further explore its underlying mechanisms.
Future research could extend this work by advancing models, methods, and data. For instance, more sophisticated models could be used to better capture the mechanisms governing the development of inter-city innovation collaboration; measurement approaches for patents and, more broadly, city-level collaborative innovation could be refined; and greater attention could be paid to differences in actor quality and other specific factors that shape university–industry collaboration or employ MCMC-MLE to conduct more fine-grained estimation for all aspects of the analysis. Progress along these directions would contribute further to research on urban sustainable development.