1. Introduction
In this paper, we address the problem of food distribution by the Food Bank of Bogotá, 1 of the 24 food banks in Colombia. This nongovernmental organization plays a critical role in addressing food insecurity by distributing donated food to vulnerable populations. Located in the center-west part of the city, the Bank annually benefits over 500,000 people across the city through 993 non-profit organizations (beneficiaries), distributing more than 10,000 tons of products nationwide [
1]. At the operational level, one of the most important activities that the Food Bank undertakes is the distribution of donated food products. The importance of optimizing food bank distribution has been highlighted in various studies, particularly in the wake of increased demand and supply chain disruptions caused by events such as the COVID-19 pandemic [
1,
2]. Efficient distribution not only reduces operational costs but also ensures equitable food delivery, which is critical for maintaining the trust and support of donors and beneficiaries alike [
3].
The logistics team at the Food Bank of Bogotá manages the product distribution of the daily delivery of donations. Currently, the process is carried out manually. The decisions on distribution routes start with the daily reception of customer orders starting at 6:00 a.m., serving more than 50 beneficiaries per day, with monthly, biweekly, and weekly frequencies. Although several performance measures are evaluated monthly, the current process does not include monthly planning. Instead, customer orders are prepared, dispatched, and distributed on the same day or the day after receiving.
There is evidence of inefficiency in the management of resources at the Food Bank. The current transport logistics and distribution process is encountering delays in deliveries, lack of coordination between actors (transporters, beneficiaries, and the Food Bank), unplanned trips, and a general lack of monitoring and control in operations. According to the head of the institution’s logistics department, this lack of planning and optimization, which has not yet been quantified, has led to the duplication of efforts and problems in demand and order management. For example, these practices have led to less-than-truck loads being dispatched along multiple routes in the same area, resulting in unnecessary redundancy, with trucks passing several times a day through the same locations. In addition, the Food Bank of Bogotá is currently dealing with several challenges related to limited information and technology (IT) infrastructure, also linked to a lack of transparency in the supply chain. This lack of IT infrastructure gives rise to organizational limitations in route planning, insufficient follow-up on deliveries, and scarcity of information for analysis.
In the literature, designing distribution routes is framed as a variant of the Vehicle Routing Problem (VRP), which is known to be a complex optimization problem. This research builds on the existing body of knowledge by applying Vehicle Routing Problem (VRP) models to the specific context of the Food Bank of Bogotá, one of the most congested cities in the world [
4]. The application of VRP solution algorithms in this context can potentially enhance operational efficiency, ensuring that more people receive the necessary aid in a timely manner [
3]. However, identifying the best algorithm or approach alternative in the real world involves finding not only the best solution in terms of computational efficiency but also considering maintainability and implementation costs.
The latter is crucial for a non-profit organization that does not have the resources for commercial software packages. After several meetings with the Food Bank logistics team, we all determined that a free or low-cost computer application in combination with a training plan could, or at least, mitigate the aforementioned problems. The application should use open and free-access computational tools.
This paper aims to explore the potential of VRP methodologies to improve the delivery process at the Food Bank of Bogotá, drawing on existing research and practical applications in similar settings. Previous studies have demonstrated the effectiveness of optimization methods in similar scenarios [
3]. By tailoring these approaches to the unique challenges faced by the Food Bank of Bogotá, actionable insights and recommendations for improving such delivery processes will be provided. The findings are expected to have broader implications for food banks locally and eventually globally, offering a framework that can be adapted to different operational environments and constraints.
Thus, we formulate the following research questions:
RQ1: What distribution logistics strategies can improve the current state of donation delivery at the Food Bank of Bogota?
RQ2: Which beneficiaries would be served every week, and which routes will be used to establish a basis for the monthly delivery schedule, considering the characteristics of the Food Bank of Bogota?
RQ3: Which algorithm for vehicle routing is the most appropriate to implement in the donation delivery process of the Food Bank of Bogota?
The goal of this research is to improve the logistical process of donation delivery through a routing model. To do so, a four-step approach is proposed. The first step defines clusters for the beneficiaries by geographic location. Next, for each cluster, deliveries are assigned to the weeks of the month based on the ordering frequency of each beneficiary. Then, for each week and each cluster, a Capacitated Vehicle Routing Problem (CVRP) is solved. With route durations, vehicle capacity, and current traffic and transport data for Bogota, the next step is to assign routes to days of the week. Finally, a monthly schedule for beneficiaries was computed. The remainder of the paper describes our approach.
2. Literature Review
The operations and logistics problems of food banks have been studied over the years. A good review of supply chain operations of food banks was presented in [
5]. Among the problems studied, donations [
6,
7,
8], network design [
9,
10], inventory management [
11,
12], food waste and circular economy [
13,
14], equitable distribution [
15,
16], and vehicle routing are the most popular [
17]. The latter problem is the focus of our study.
2.1. Classical Approaches
The VRP is a classical problem in operations research and consists of finding the best routes between a central depot and a set of delivery points, with one or more vehicles. All nodes must be visited exactly once by a vehicle. The first documented work addressing the VRP was presented by [
17]. When vehicles have limited capacity, the problem is known as the Capacitated Vehicle Routing Problem (CVRP) [
18]. Exact methods, such as branch-and-bound algorithms, have been documented in the literature (e.g., [
19]). However, these algorithms can be used only to solve small instances due to the explosion of the search space. In addition, these algorithms are difficult to implement and maintain, especially in cases where no trained personnel are available [
20].
In practice, heuristic algorithms are far more popular. These heuristics vary from simple constructive algorithms to sophisticated hybrid meta-heuristics. Examples of constructive heuristics are the K-Nearest Neighbor (KNN), Clarke and Wright Savings (CWS) [
21], and Best Insertion [
22]. To improve the solutions of these constructive methods, many meta-heuristics have been proposed. These include Tabu Search (TS) [
23,
24], Guided Local Search (GLS) [
25], Ant Colony Algorithm (ACO) [
26], Genetic Algorithms (GA) [
27], and many more. The literature on this topic is vast, and in this paper, we only scratch the surface in terms of variants and algorithms because this is not the purpose of this paper. The interested reader is referred to [
28] for more detailed information.
In the real world, applications do involve a large number of customers. The two-step “cluster-first, route-second” methodology is usually employed. In the first step of this methodology, the entire set of customer points is divided into smaller, more manageable groups or clusters. Clustering is typically based on geographical proximity or other criteria that make logistical sense. After the locations are clustered, the next step is to determine the best route within each cluster. Either exact or heuristic methods are often used in this phase. The authors in [
29] applied this method to solve a variant of the CVRP using K-means, K-medoids, and random clustering algorithms. Yuan and Yang [
30] also used this approach for a general VRP. Similarly, the authors in [
31] adopted this methodology, segmenting attention points to create routes using meta-heuristic methods such as Iterated Local Search (ILS) and Ant Colony Optimization (ACO). Other authors [
32,
33] implemented hierarchical clustering to streamline the distribution network in a Vehicle Routing Problem with Time Windows (VRPTWs).
A VRP variant related to this research is the Periodic Vehicle Routing Problem (PVRP). The PVRP involves determining the routes for a fleet of vehicles to serve a set of customers over a given period, typically a week or a month. Unlike the classic VRP, where each customer is serviced exactly once, the PVRP requires each customer to be serviced multiple times according to a predefined frequency. The most common objective is to minimize the total cost, which can include travel distance, time, and the number of vehicles used. A comprehensive review of the problem (PVRP) is described by [
34]. Some examples are found in [
35] who compared “cluster-first, route-second” and “route-first, cluster-second” methods. In both cases, solution methods included classical heuristics, such as CWS, and meta-heuristics, such as neighborhood-based and population-based algorithms. Other examples are the works of [
36], who used a TS meta-heuristic, and the work of [
37] who presented the heterogeneous site-dependent multi-depot Periodic Vehicle Routing Problem and solved it with meta-heuristics.
In food donations and related topics, the literature is rather scarce. For example, ref. [
38] studied the PVRP and Periodic Pickup and Delivery Vehicle Problem (P-PDVRP), focusing on the rescue and delivery of food. The authors in [
39] developed audit schedules for food banks in the United States. The problem was named the Vehicle Routing Problem with Multiple Time Windows (CVRPMTWs). They used constructive heuristics and integer programming. Finally, the authors in [
40] studied the problem of collecting donations and distributing food in a food bank in Saudi Arabia. They developed a Java-based mobile application to help a major food bank in the city of Mecca. In food collection, the authors in [
41] studied Vehicle Routing Problems with stochastic demand, service, and waiting times.
Although the literature on the VRP and its variants is extensive, its application to food bank logistics remains limited and fragmented. Most studies reviewed above focus on classical objectives such as minimizing distance or cost, without fully addressing the unique operational challenges of food banks. Indeed, these organizations face high variability in supply and demand, perishability of donated goods, and social objectives such as equitable distribution and waste reduction. For example, works like [
28,
30] provide insights into food rescue and distribution but rely on static routing assumptions and do not incorporate uncertainty in donation arrivals or perishability constraints. Similarly, ref. [
29] introduce time windows but do not consider dynamic donor behavior or multi-objective optimization.
Moreover, while the CVRP, VRPTW, and PVRP models are theoretically relevant to food bank operations (due to capacity limits, time-sensitive deliveries, and recurring service needs), existing applications rarely integrate these features in a holistic manner. Few studies combine periodic routing with perishability, real-time data, or equity-based objectives, leaving a significant gap between theoretical models and practical requirements.
To sum up, current research lacks integrated models that simultaneously address uncertainty in donations, perishability, and social objectives, as well as approaches that leverage dynamic or real-time routing for highly variable environments and solutions tailored to resource-constrained organizations where computational simplicity and ease of implementation are critical. This study fills these gaps by proposing a Capacitated Periodic Vehicle Routing Problem (CPVRP)-based framework, specifically designed for food bank logistics, incorporating perishability constraints and dynamic donation patterns while balancing efficiency and equity, thereby enhancing operational performance and reducing food waste, which underscores the necessity and innovation of this research.
2.2. Applications with Free or Commercial Open-Source Software
The use of open-source software and/or libraries for vehicle routing applications is less common in the literature than problem-specific algorithms. Some of the libraries documented in the reviewed papers are OR-Tools [
42] OptaPlanner [
43], and VRPLite [
44]. Other applications were developed using spreadsheet-based applications [
45,
46].
Table 1 shows a summary of the main findings of this review.
Some of the authors present their own algorithms and compare their results with such open-source tools. Among those, ref. [
47] studied the Cash-In-Transit VRP with an application in Chinese cities. They compared their own solution techniques with OR-Tools’ built-in simple constructive heuristics, such as Path Cheapest Arc (PCA) and the built-in meta-heuristics such as Guided Local Search (GLS). Another work is the one of [
50] who compared the execution times of OR-Tools’ GLS with other built-in algorithms for the CVRP. The authors in [
52,
53] proposed different variants of the Reinforcement Learning (RL) approach and compared their solutions with the many algorithms of OR-Tools. Finally, ref. [
56] studied a variant called the COMVRP (Closed–Open Mixed VRP) with different vehicle types for the collection of farms’ produce. They tested all OR-Tools’ algorithms and compared their performance. Other works extend or integrate these VRP tools into other computer systems; examples are [
49] who extended OR-Tools’ VRP module for robotics routing and planning and [
54] who integrated OR-Tools with the Google Maps API for several VRP problems.
In terms of real-life applications, ref. [
48] compared most of the meta-heuristics of OR-Tools on a problem of solid waste collection in Turkey; ref. [
55] presented a case study of the delivery of electronic vote machines in Brazil. These authors used the VRP module of the OptaPlanner tool. Ref. [
45] presented two case studies in the healthcare and tourism sectors using spreadsheet-based algorithms. Lastly, ref. [
51] presented another application in the case of the delivery of exam booklets to higher education institutions. The problem was characterized as a CVRP and was solved with the VRP module of OR-Tools’ library.
Several decision support systems have also been developed for practical applications. For instance, ref. [
57] applied a Spatial Decision Support System combining routing algorithms with Geographic Information Systems (GIS) data, emphasizing its benefit for handling complex path restrictions and multiple vehicles. Ref. [
58] created a software application using Delphi 5.0 integrated with the link libraries from LINGO v6, encompassing all aspects of route scheduling processes. Later, ref. [
59] created an API that manages complete routing problems, selecting optimal methods for resolution. It facilitates coordination between data provider software (Transport Management Software) and the Operational Research tool responsible for trip definition, addressing all constraints.
3. Materials and Methods
The methodology to develop and implement the application in this project was CRISP-DM, which has six stages: Business Understanding, Data Understanding, Data Preparation, Modeling, Evaluation, and Deployment [
60,
61]. Our initial focus was to gain an understanding of the daily functions of the Food Bank of Bogotá, and the various departments involved in their logistics operations. We interviewed personnel of the logistics, scheduling, and donor areas to characterize their workflow processes. Next, we analyzed core operational processes, prioritizing those of significant relevance and applicability. One critical point emerged from this analysis, characterized by inefficiencies such as delays, inadequate resource management, and escalated transportation costs. Consequently, we opted to concentrate on improving the donation delivery process managed within the logistics department, identifying short-term opportunities for enhancement. The CRISP-DM methodology was applied as follows [
60]:
- (A)
Business Understanding: Firstly, meetings with the logistics team were scheduled, where we gained insights into their workflow and operational challenges. In this stage, we identified that a critical problem was food distribution.
- (B)
Data Understanding: This phase consisted mainly of ETL (Extraction, Transformation, and Loading) of the datasets provided. This stage also involved descriptive analyses.
- (C)
Data Preparation: This step involved rectifying inconsistencies, addressing missing values through external sources, and defining the parameters necessary for subsequent analyses. Information regarding routes, beneficiary locations, fleet characteristics, and demands were extracted.
- (D)
Modeling: We developed a Vehicle Routing Model tailored to the Food Bank’s specific requirements. This model was aimed at optimizing the delivery routes and resource allocation.
- (E)
Evaluation: We conducted comparative analysis of the current operational process. Factors such as demand fulfillment, travel time efficiency, and resource utilization were evaluated to assess the proposed enhancements’ potential impact. At this stage, some corrections and additional considerations were raised by the logistics department of the Food Bank.
- (F)
Deployment: We presented our proposal to the relevant stakeholders within the Food Bank. We provided comprehensive explanations of the proposed tools, methodologies, and dataset requirements. We are in the follow-up process at this stage.
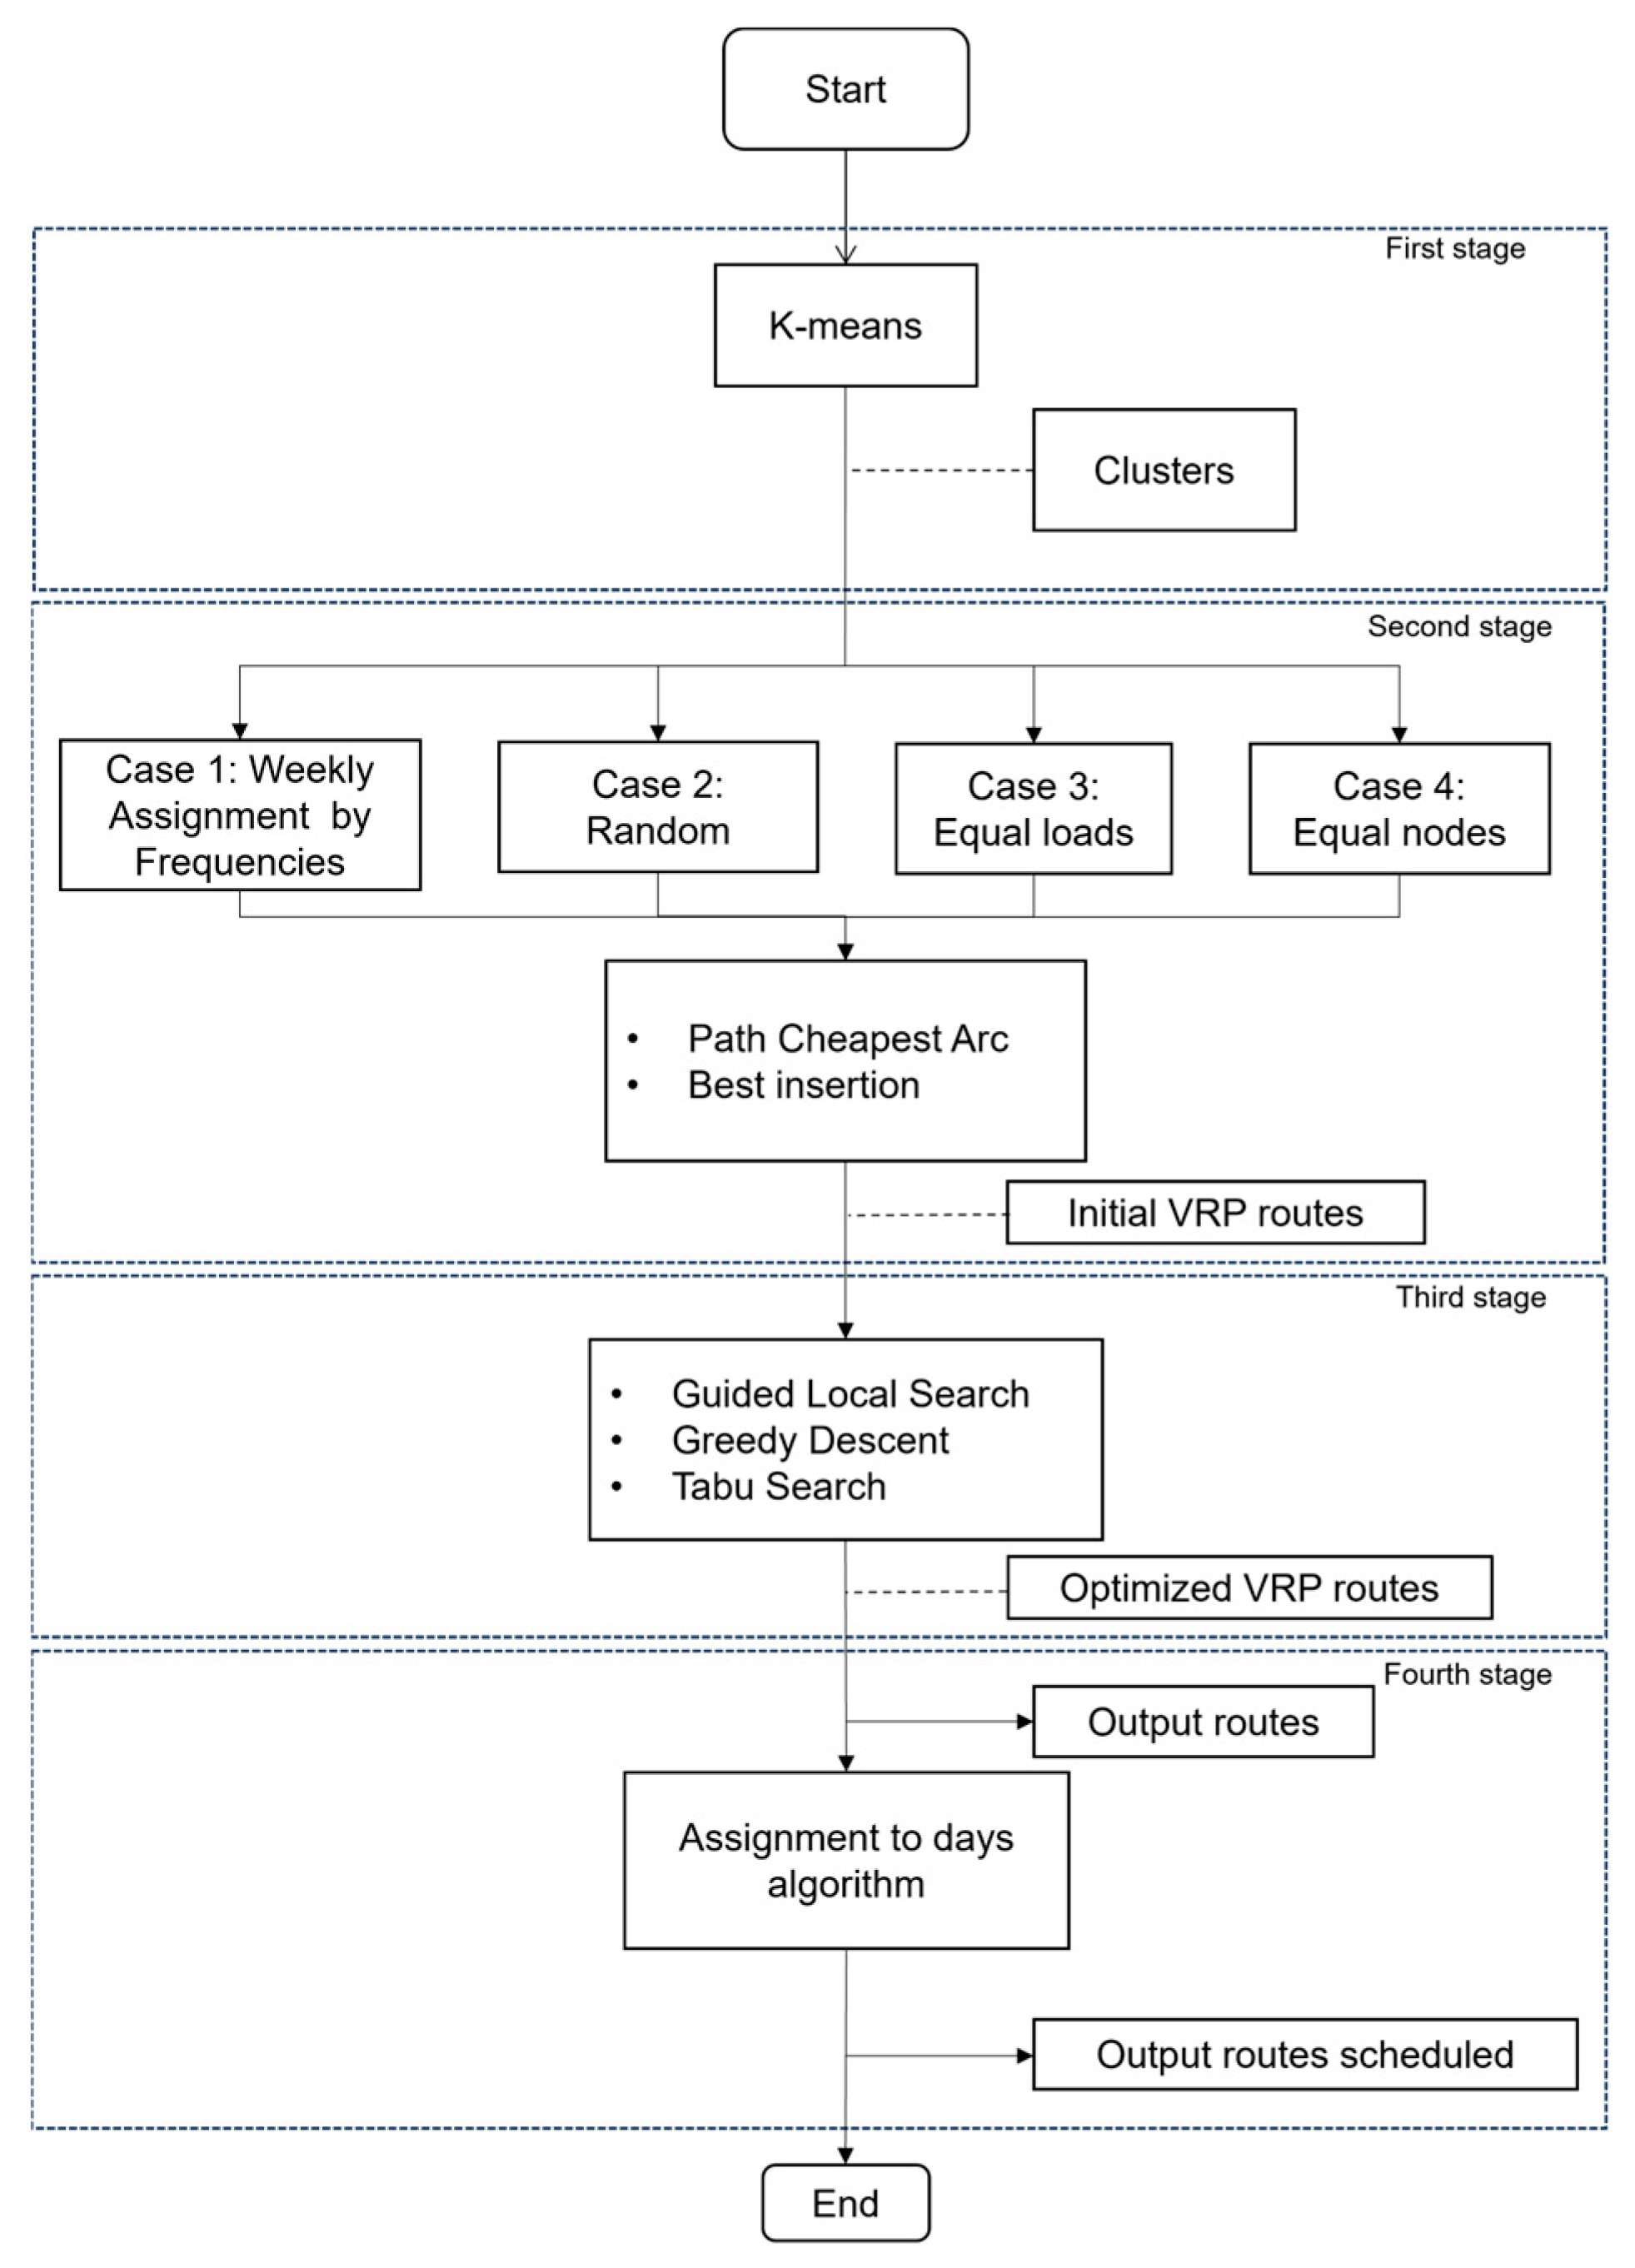
Figure 1 illustrates the solution method of the Food Bank CPVRP. The solution is described in four main phases. Firstly, we clustered beneficiaries according to their geographical location. Secondly, we established a weekly schedule according to the frequency of beneficiaries’ requests. Thirdly, we calculated the vehicle routes per cluster and per week. In this phase, we solved instances of the Capacitated Vehicle Problem (CVRP) with distance and time constraints. Finally, in the fourth phase, we allocated dispatch days according to traffic conditions.
The choice of the most appropriate computer framework involved several criteria as discussed with the Food Bank: the framework must (1) be either free or of very low cost, (2) require little or no maintenance, (3) be easy to use, (4) run on any computer system, and (5) can handle all the requirements in one single environment. Thus, all commercial software packages were discarded. Considering these constraints, we opted for the well-known Python-based Jupiter notebooks to run (1) the clustering, (2) weekly assignment of beneficiaries, and (3) the VRP algorithms and export them to Excel spreadsheets.
The algorithms that generate the weekly schedules and the day-of-the-week assignments were coded by us; for the VRP, we examined free open-source tools and opted for the OR-Tools library. This library, developed and maintained by Google, offers a high level of maturity and stability, supported by an active community and frequent updates, which ensures reliability for research and practical applications. OR-Tools can handle variants such as the Traveling Salesman Problem (TSP), the Capacitated Vehicle Routing Problem (CVRP), and the Vehicle Routing Problem with Time Windows (VRPTWs) [
42]. In terms of computational efficiency, OR-Tools provides optimized implementations of classical heuristics and meta-heuristics (e.g., Guided Local Search, Tabu Search) and supports large-scale instances, which are critical for food bank logistics involving numerous delivery points. Furthermore, its customization flexibility allows integration with external data sources and APIs (e.g., Google Maps, Open Street Maps), enabling adaptation to real-world constraints such as time windows and perishability. Compared to alternatives (e.g., Java-based and other tools primarily geared toward enterprise systems), OR-Tools offer broader algorithmic coverage and better performance benchmarks for PVRP problems, as documented in prior studies [
53,
54,
55,
56,
62,
63]. VRPLite, while lightweight, lacks advanced meta-heuristics and scalability features required for complex routing scenarios. Therefore, OR-Tools was selected as the most suitable platform for implementing the proposed framework, balancing efficiency, adaptability, and ease of deployment in resource-constrained environments.
The following sections provide in detail each phase.
3.1. Clustering
As a single routing problem was too large to be handled and maintained in the computer application, we opted to cluster the beneficiaries. The bottleneck, as documented in the literature, was the calculation of the distance matrix [
62]. We used Google’s geo-referencing Application Programming Interface (API) in the beneficiaries’ clustering phase. Once geo-referenced data was collected, we applied the classic K-means algorithm of the Python Sklearn library [
63] to cluster the beneficiaries according to their geographic location. The well-known silhouette method [
64] was used to determine the best number of clusters. This method compares the mean distances within the cluster with the mean distances to other clusters. The distribution of beneficiaries by different city zones was visualized using the free geographic information tool QGIS v3.32 [
65]. Once the clusters were defined, the road distances between pairs of beneficiaries belonging to the same cluster and the Food Bank of Bogotá were calculated using Python [
30] Geopy and OSMNX libraries. OSMNX is a Python package designed to retrieve, model, analyze, and visualize street networks from OpenStreetMap (OSM) data [
66]. The Python version was 3.11.
3.2. Weekly Scheduling
This section addresses the scheduling problem that assigns beneficiaries to the weeks of a month. To start, each beneficiary agrees with the Food Bank a fixed delivery frequency and then the Food Bank defines the month’s specific delivery week(s). For example, if a beneficiary receives donations twice a month, these donations can be delivered either in the first and third weeks or in the second and fourth weeks of the month. The idea is to balance loads across the weeks of the month to maximize the fleet utilization.
This problem can be formulated as a parallel machine scheduling problem with machine eligibility constraints and makespan as the objective function. The problem can be described as
according to the notation of Graham et al. [
67].
denotes an
-machine parallel machine problem,
is the set of eligible machines of job
, and
is the completion date of the last job (makespan). In this problem, machines correspond to weeks and jobs to customer orders. The processing time of job
(
) is the load in terms of weight and the set
corresponds to the set of weeks in which job
can be assigned. It is well known that a lower bound for the optimal schedule of this problem is
[
68]. This lower bound implies that all
machines have equal loads that are calculated as the total load divided by the number of machines. This scheduling problem can be formulated as follows:
Sets:
is the set of machines indexed in .
is the set of jobs indexed in .
is the set of eligible machines of job .
Parameters:
processing time of job .
Variables:
.
= maximum completion date.
Objective function Min
Constraint set (1) establishes that a job must be assigned to exactly one eligible machine. Constraint set (2) sets lower bounds for the value of makespan and constraint set (3) corresponds to the domains of the variables.
As this problem is strongly NP-Hard [
68], normally this is solved with heuristics. Within this weekly scheduling phase, four strategies were evaluated. The first is a frequency-based weekly allocation: schedules of all weekly and monthly deliveries in week 1; all weekly and biweekly deliveries in week 2; only weekly deliveries in week 3; and again, all weekly and biweekly deliveries in week 4. The second is random distribution, which iterates through the beneficiary list and assigns each beneficiary to a week at random while honoring the required delivery frequencies. The third strategy targets equal loads by adapting the classical list algorithm for parallel machine scheduling: sort beneficiaries in descending order of load and place each into the week with the smallest cumulative load. The fourth, equal number of nodes, mirrors the previous approach but sorts by delivery frequency rather than load.
3.3. Routing Model Formulation
In this section, we present a mathematical formulation of the Capacitated Periodic Vehicle Routing Problem (CPVRP) that was adapted from Francis et al. [
34]
The problem assumes that a Graph fully describes the network of customers. There exists a set of nodes , where 0 is the depot and is a set of customers such that . A set of arcs connect the nodes of the network. A set of vehicles indexed in visits the customers over a set of weeks indexed in . In this context, each vehicle has a capacity of C units. Each customer has a schedule of days on which he/she must be visited. The set indexed in contains all schedules. The set is the set of feasible visit schedules for customer . The number of days within the planning horizon that customer needs a visit (the frequency) is denoted as .
Parameters:
: Travel cost (or distance) from node to .
: Demand of customer .
Number of vehicles.
Maximum distance or cost of a route (optional).
Decision variables:
= if customer follows schedule ; 0 otherwise.
if customer is served on week ; 0 otherwise.
if vehicle travels from node to node week ; 0 otherwise.
Objective Function
Minimize total travel cost:
Constraints
1. Each customer is assigned exactly one schedule:
2. Daily service induced by chosen schedules:
7. Maximum route cost constraint:
This mathematical formulation can only be solved for small instances [
34] due to the inherent combinatorial nature of the problem. As mentioned, we opted for the heuristics of the OR-Tools library [
42].
Table 2 shows the heuristics we used as the first solution strategy and the combined meta-heuristics. We tested several combinations of heuristics and meta-heuristics.
The optimization process is as follows:
Beneficiaries are assigned to weeks according to the heuristics described below.
OR-Tools’ Guided Local Search, Greedy Descent, and Tabu Search algorithms were run for each of the clusters, together with each of the initial solutions generated by the constructive algorithms “Nearest Neighbor” (Path Cheapest Arc) and “Insertion” (Best Insertion). As said, the objective function was to minimize the total time, and the output of the algorithms is the distribution paths. The initial and local solution methods were combined to evaluate the results presented below.
The distribution routes are assigned to each day of the week according to the matrix of priorities and average speeds for each day of the week.
Section 4.4. describes this phase of the process.
We conducted extensive interviews with the Food Bank’s logistics team to understand their internal policies and practices. We determined that each stop includes a standard one-hour dwell time, covering parking, waiting, unloading, and paperwork. All trucks have the same capacity of 3 tons. Because of local traffic conditions during the off-peak hours, in which the speed is fairly constant [
69], we set an average driving speed of 25 km/h. The delivery window is a 10 h workday. All routes start from the Food Bank of Bogotá’s headquarters, which serves as the depot at coordinates (4.6207823, −74.0918951).
3.4. Dispatch Allocation
The next phase was to assign weekdays to each route. In the previous phase, routes were assigned to the weeks of the month; however, the exact day of the delivery must also be established. One important restriction is that the Food Bank trucks are not exclusively dedicated to deliveries; these trucks also collect food and other items from donors. Thus, these trucks will be assigned to food pickup, maintenance, and other tasks in the remaining days of the week. The Food Bank did not want to mix deliveries with pickups because of the uncertainty of the donations and the additional management that it involves. This problem can be modeled as an unrelated parallel machine scheduling problem [
68]. This problem consists of
-parallel machines indexed in
that process a set of jobs indexed on
. Each machine has a production rate
. The process time
of job
on machine
is defined as the length of the job (normally quantified as a batch size in units) divided by the production rate (in units per hour).
Jobs in this context are the routes, each with a length in kilometers and the machines are the days of the week, each with an average speed in kilometers per hour. The routes were assigned to each weekday using a scheduling algorithm described below. The input criteria for this algorithm are based on the prioritization of the week’s days, determined from an analysis of the traffic in Bogotá. The information of traffic by zones of the city can be found on the website of the Secretariat of Mobility of the Bogotá District [
69].
4. Results
4.1. Data Collection
The datasets provided by the logistics area were compiled and cleaned. This data included the current beneficiary schedule with attributes such as organization name, Tax Identification Number (TIN), contact details, frequency of service, and data on dispatches from September 2022 to January 2023. The study focused on beneficiaries that are periodically served, identifying 454 beneficiary organizations. The data raised served as input to model the food distribution problem as a Capacitated Periodic Vehicle Routing Problem (CPVRP) [
70].
The tests were run on a laptop computer with a 12th Gen Intel® Core™ i5-12500H (2.50 GHz) and 16 Gb RAM. All algorithms took less than 1 s to run except for the (1) distance matrices calculations that took in the largest cluster over 4 h to run and (2) the meta-heuristic VRP algorithms whose running time was set to 10 s.
4.2. Clusterization
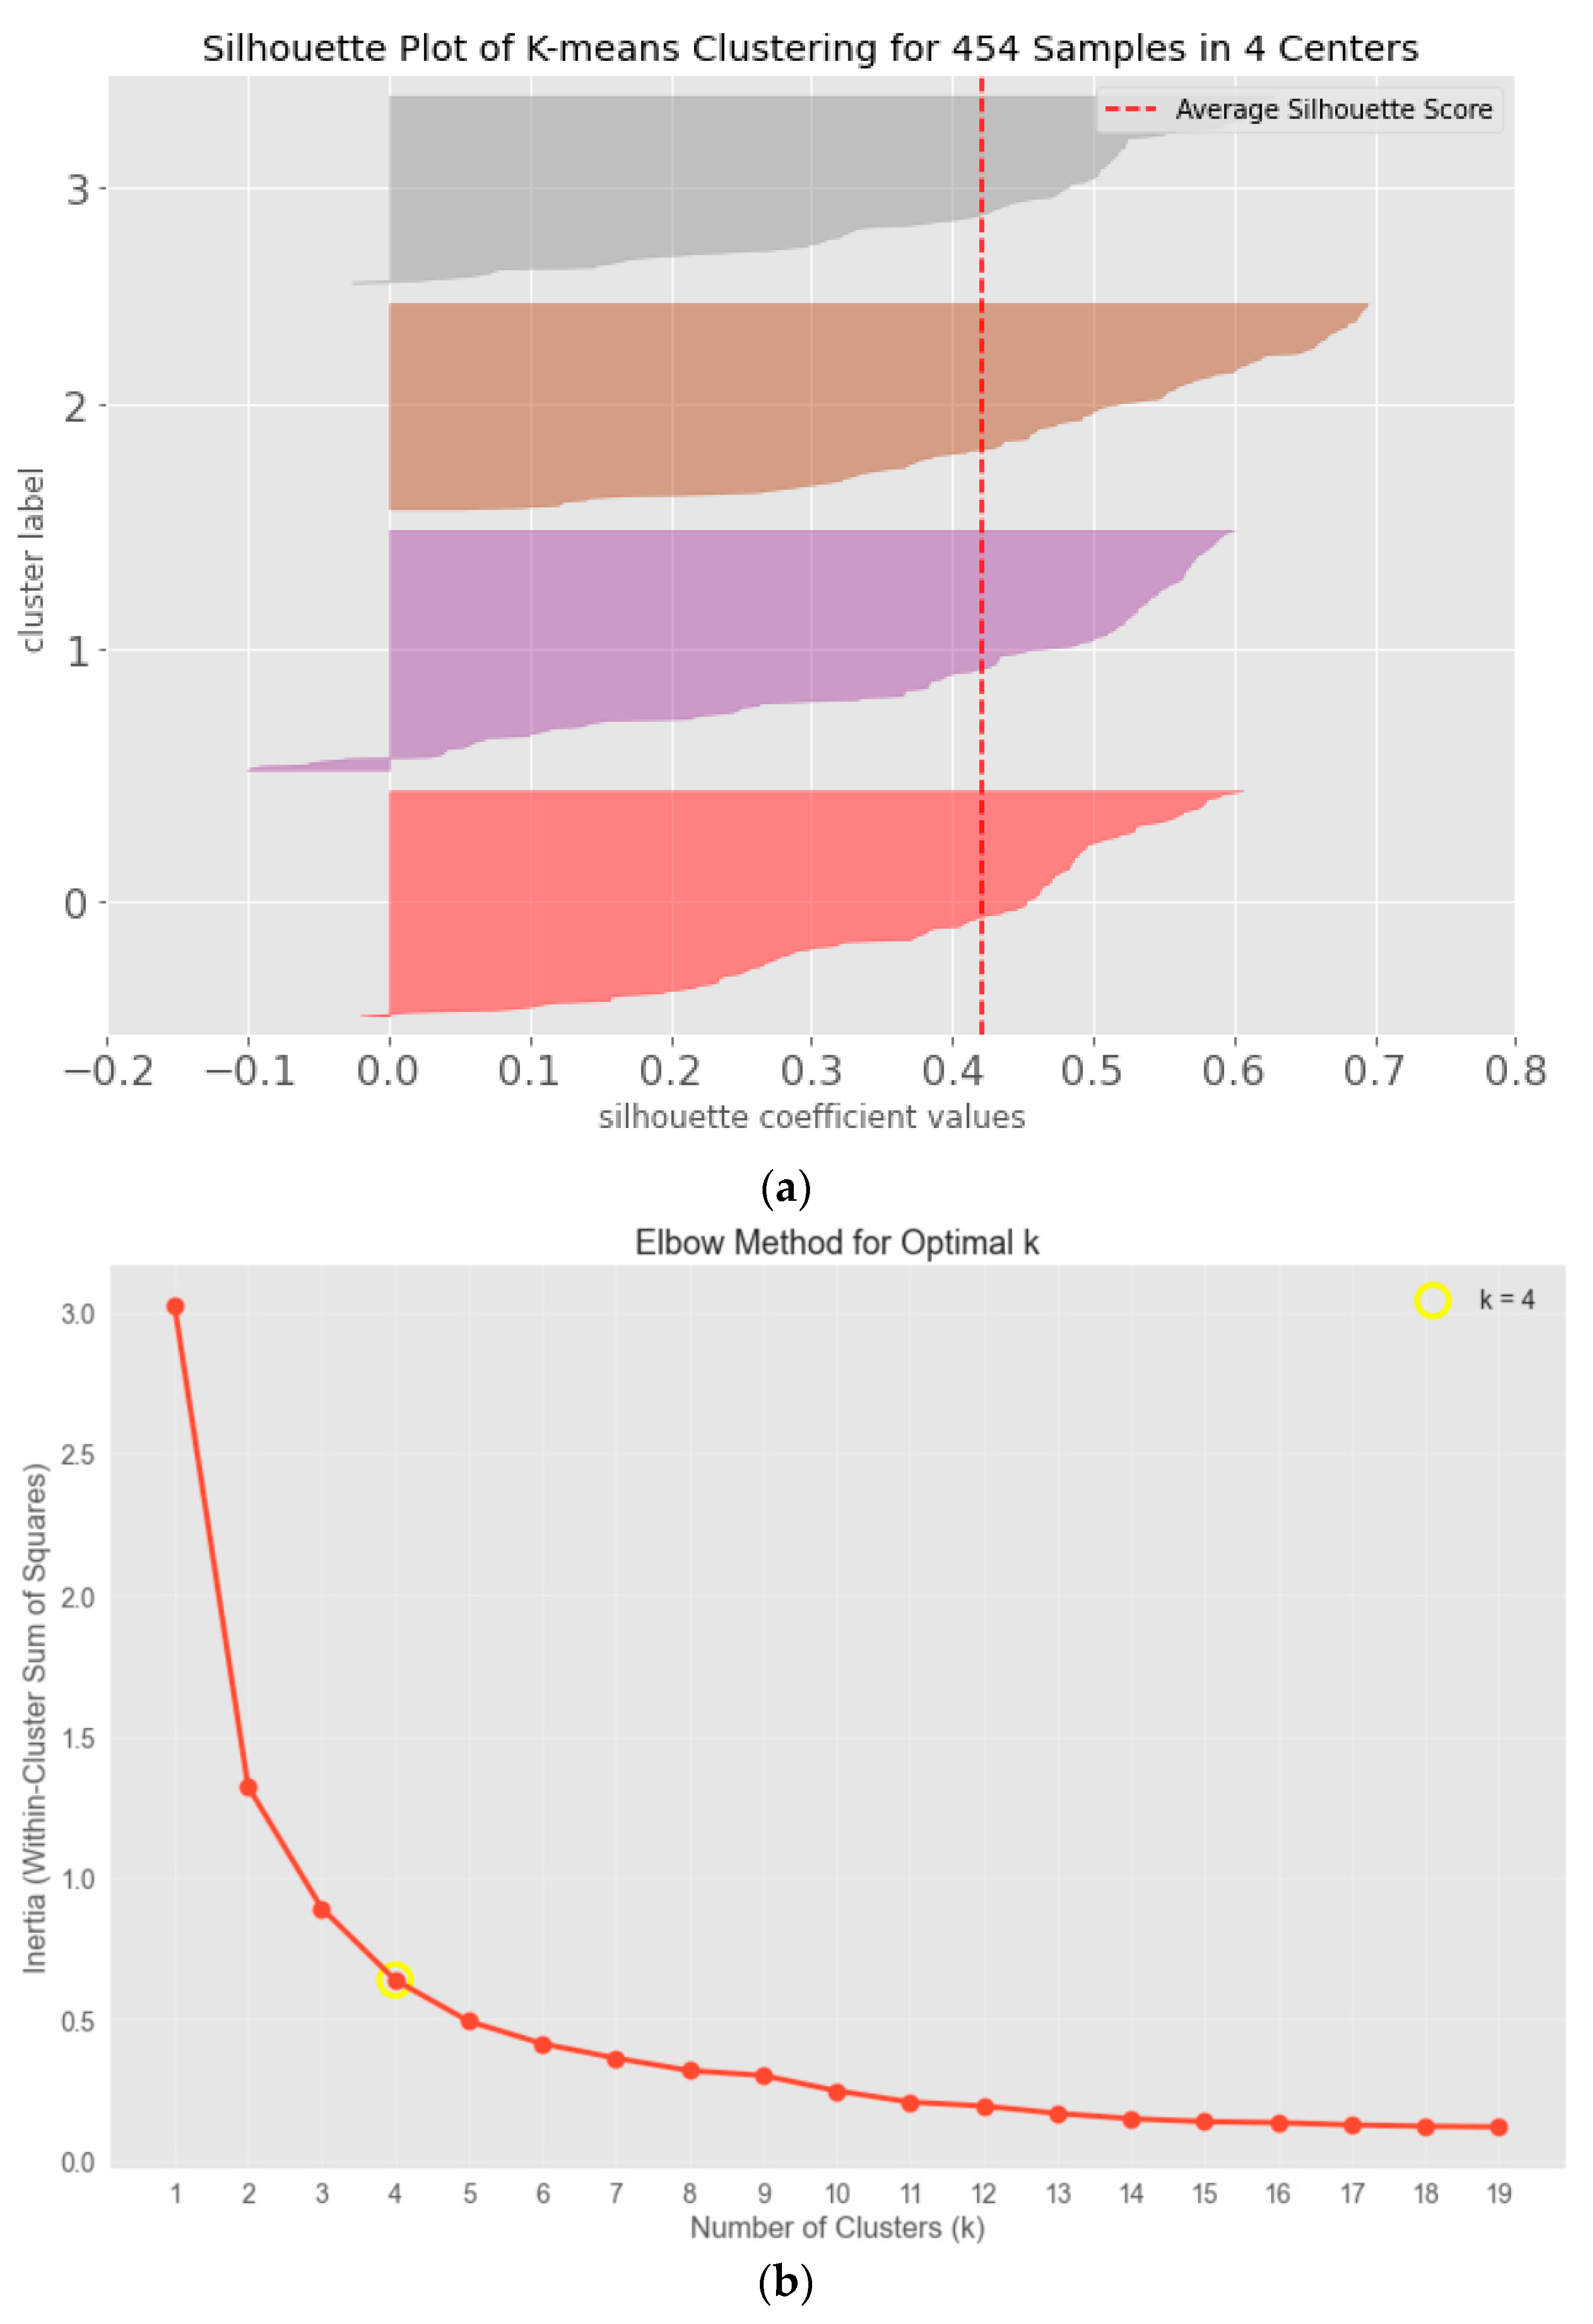
We tested different cluster numbers with the K-means algorithm in the clustering phase. We used classical elbow and silhouette scores to select the best number of clusters.
Figure 2 shows the final clusters selected. The silhouette range for them was between 0.4 and 0.5, which is considered an acceptable value. Although the silhouette coefficient values fall within a moderate range, this is deemed acceptable given the complexity and heterogeneity of real-world food bank delivery points, where perfectly separated clusters are rarely achievable. According to Rousseeuw [
64], silhouette values above 0.5 indicate reasonable clustering, while values around 0.4 can still be considered acceptable in practical applications with noisy or high-dimensional data. Recent studies (e.g., [
71]) also confirm that moderate silhouette scores are common and valid in complex datasets, reinforcing the robustness of this choice. To validate our selection, we also applied the elbow method, which indicated a similar optimal cluster number. Furthermore, alternative clustering approaches such as K-medoids and hierarchical clustering were tested but produced comparable or lower silhouette scores and less interpretable cluster structures for routing purposes. Therefore, the chosen configuration represents a practical balance between cluster quality and operational feasibility; see
Figure 1.
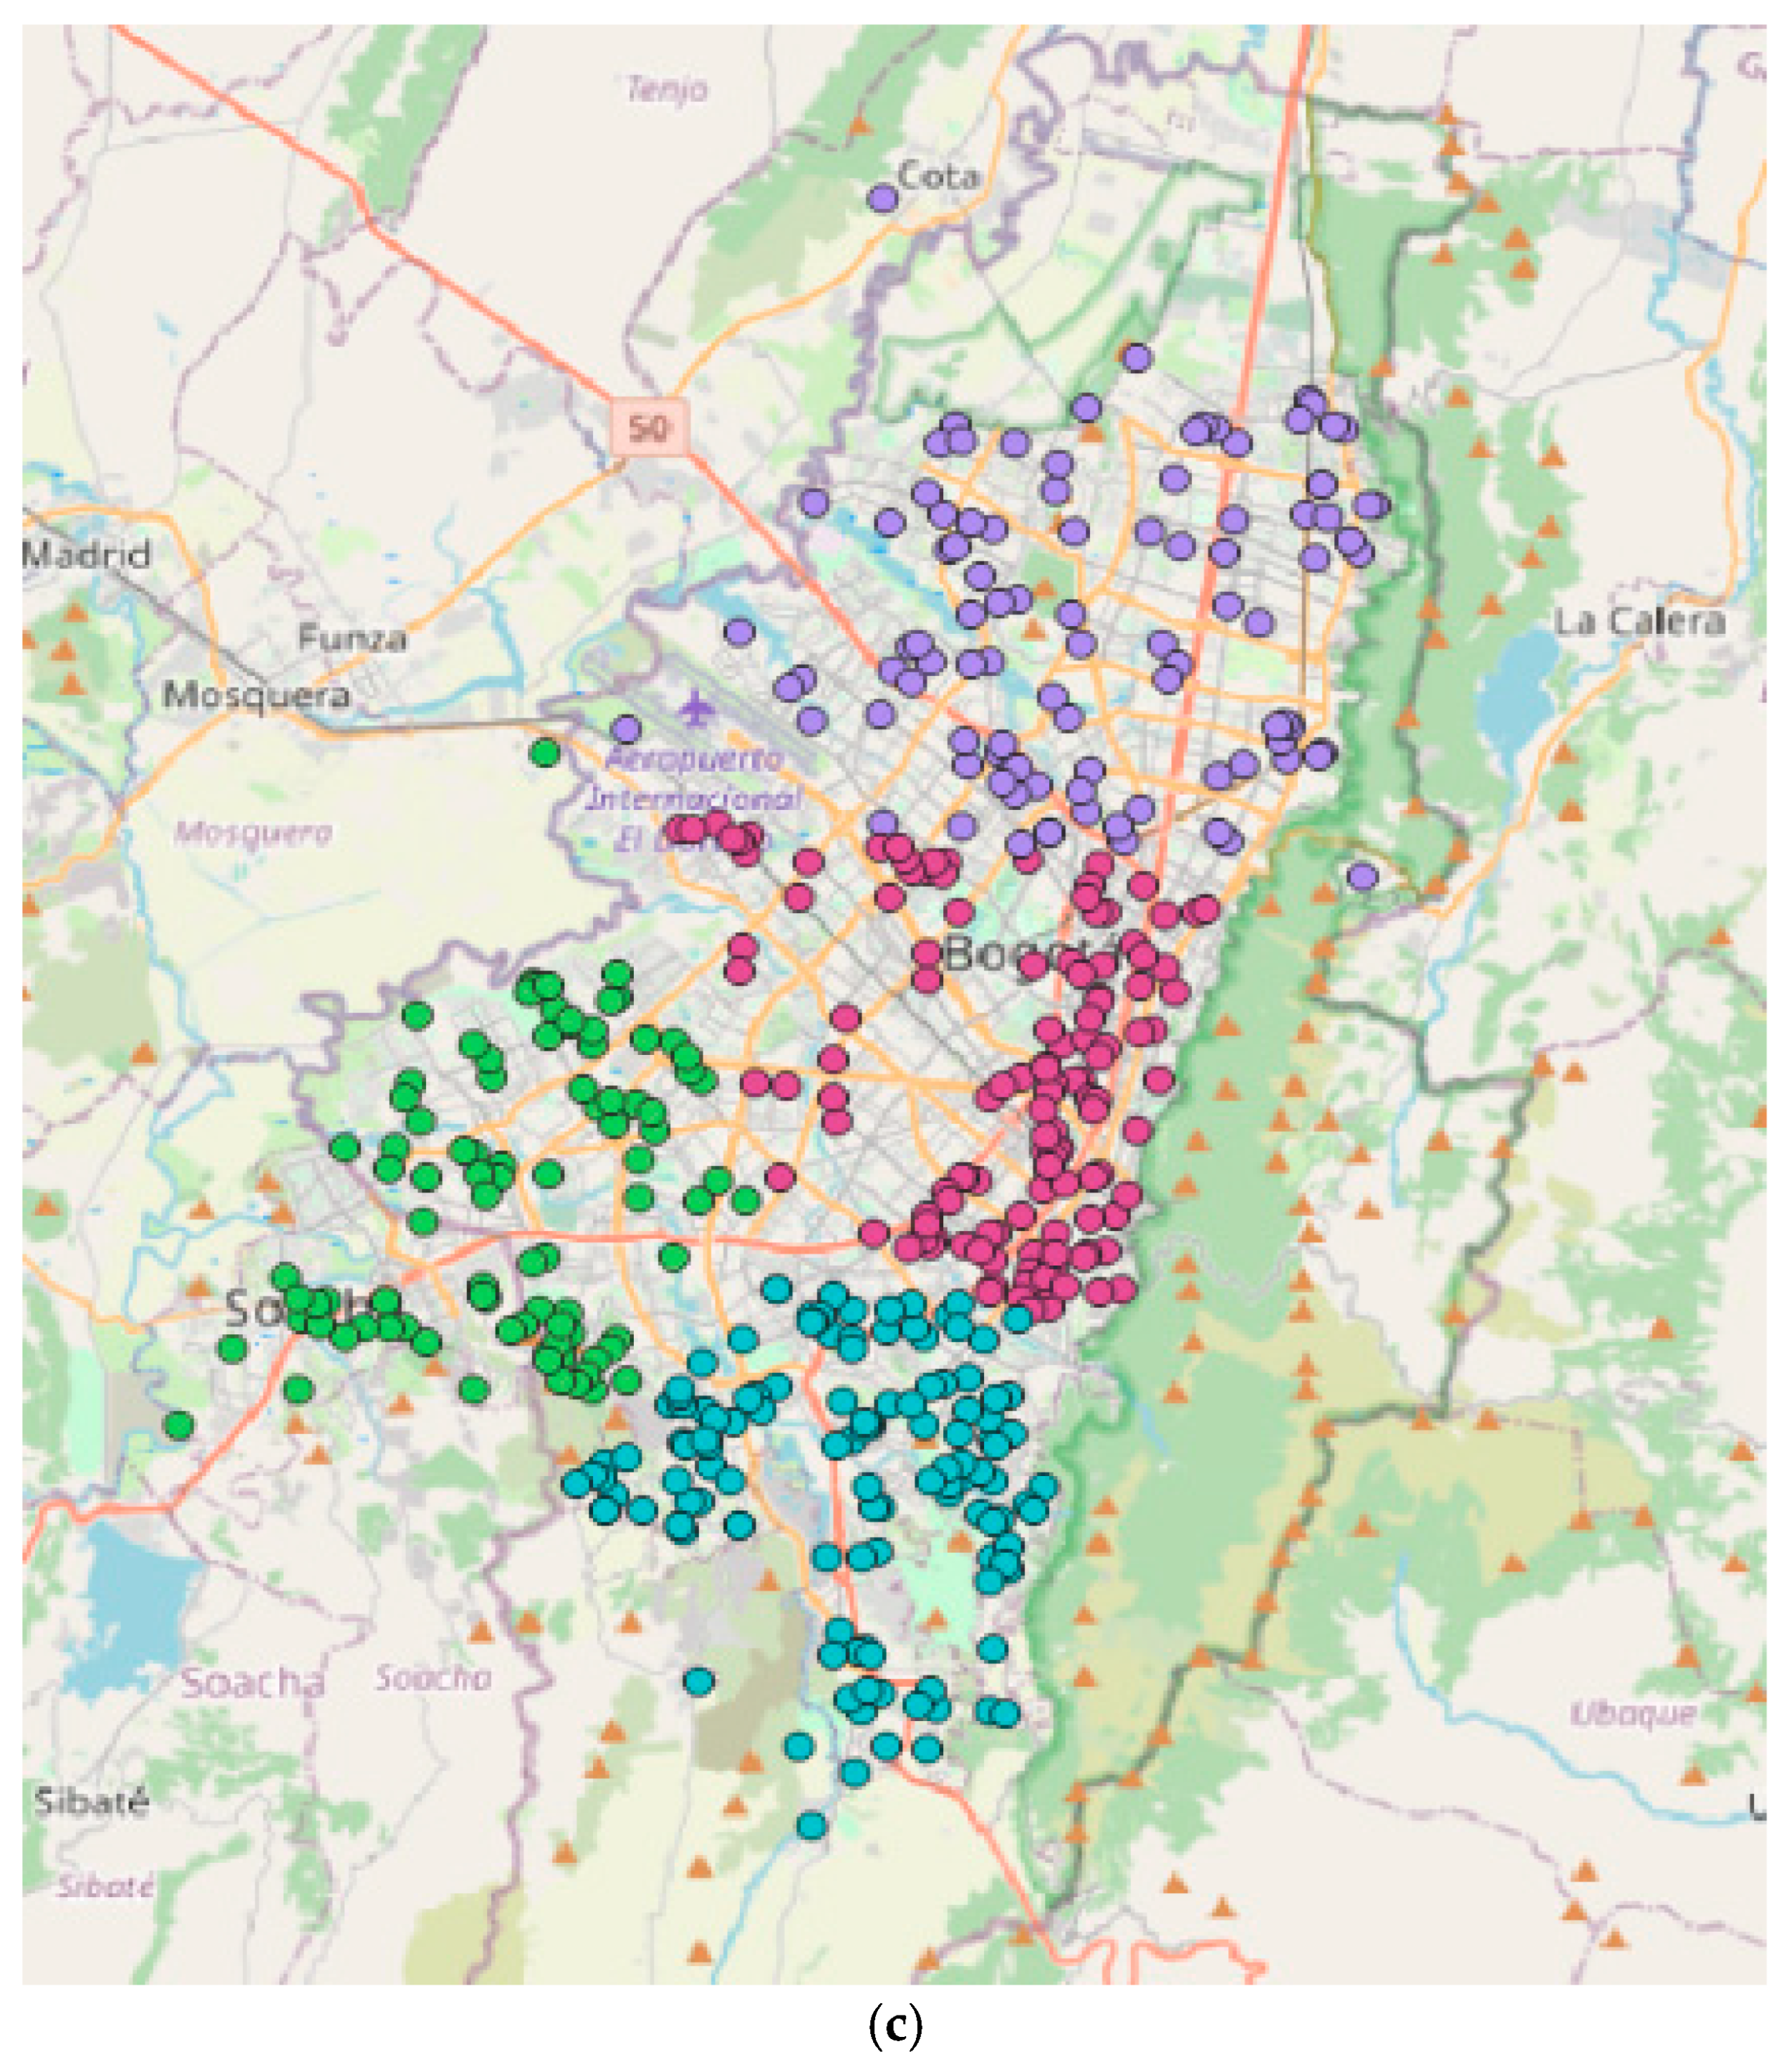
The results are as follows: the northern zone comprises 102 beneficiaries (purple), the central zone 133 (magenta), the southeastern zone 125 (blue), and the southwest zone 94 beneficiaries (green). These figures add up to 454 beneficiaries in the city. These zones were validated with the Food Bank, and some minor changes were suggested. For example, considerations such as driver familiarity with the zones and roads were considered for the new cluster assignments; see
Figure 2.
4.3. Weekly Schedule
After defining the clusters, the weekly schedule was established using the heuristics explained above.
Table 3 shows the distribution of beneficiaries per week and the total demand served for each case tested in the study. We can observe that for the case of equal loads and equal number of beneficiaries, the number of beneficiaries served is similar each week. On the other hand, in the case of weekly allocation by frequency, we can see that the number of beneficiaries and the total demand covered are very unbalanced between the weeks, with larger loads in the second and fourth week of the month. Finally, a similar allocation was observed for the random distribution for each week.
4.4. Routing Model
The next phase is the routing model. In this context, for all cases, each day has a limit of 13 trucks. The analysis was carried out cumulatively, where the maximum number of trucks per week was 78, assuming the use of all trucks per day. According to the evaluation of the four cases, balancing the number of beneficiaries and of loads of donations per week reduces trucks compared to the other cases, with similar travel times. In the “Equal Loads” case, presented in
Table 4, the combination of Best Insertion and Guided Local Search outperformed the other methods, although the differences were minimal. To ensure fair comparison among routing algorithms, all combinations of initial heuristics and local search strategies were applied to the identical four-week workload structure, using the same cluster definitions, distance matrices, vehicle constraints, and demand allocation (“Equal Loads” case). Each configuration was run independently, and OR-Tools was instructed to continue until they reached a relative optimality gap of ≤0.1. This guarantees that the small differences observed in
Table 4 reflect intrinsic algorithmic performance rather than variation in input conditions.
Among the six configurations, “Best Insertion + Guided Local Search” produced the lowest total travel time (1251 h) and the fewest required trucks (227). Although these improvements are modest, they were consistent across all four weeks. This consistency is supported by the suitability of Best Insertion for heterogeneous, cluster-based routing structures and by the strong diversification–intensification balance provided by Guided Local Search for asymmetric matrices derived from real road networks.
These results show that the routing algorithm per se does not influence much the total time and number of vehicles. However, the big improvement is the calculation of these routes with a computer application that can be run several times and adjusting the schedules on-the-go. These results also show that careful assignment of beneficiaries to each week is crucial for adequate planning of the routes.
4.5. Allocation of Delivery Day
Since the problem size is small, we used a simple greedy rule instead of a complex algorithm.
Table 5 below summarizes the average speed of each zone calculated from the data retrieved from the Secretariat of Mobility of Bogotá [
69]. In this context, we can deduct that Monday shows the best mobility conditions, reaching an average speed of around 31 km/h, with the northern zone being the fastest. On the other hand, Wednesdays and Thursdays report an average speed of 22 km/h, while Tuesdays and Fridays are the most congested days of the week. The Secretariat of Mobility report helped us identify traffic congestion by time of day.
Importantly, in our application, there are no hard zone–day eligibility constraints: any zone can be visited on any working day. The results of this analysis were used as the basis for creating a priority matrix, presented in
Table 6. In this matrix, scores were assigned to each zone on a scale of 1 to 6, where 1 denotes a high priority, while 6 indicates a low priority. These scores were agreed with the Food Bank. The “zone–day priority matrix” encodes soft preferences (e.g., “Tuesday is generally better for the North zone”) rather than feasibility restrictions, so our model does not include eligibility constraints, only different priorities and processing times by day.
This scheduling problem involves assigning routes to every day of the week to minimize the total travel time. The Food Bank has established that its trucks must visit only one or two zones daily. We used a simple heuristic scheduling algorithm for this purpose as described next.
Let
be the set of routes and
D the set of working days in the planning horizon. Each day
is modeled as a machine with capacity
(available driver hours), and each route
is a job with a day-dependent processing time
, obtained by dividing the nominal route length by the day-of-week average speed. We also now state explicitly the greedy rule used to assign routes to days. Firstly, for each route–day pair (
r,
d), we compute a priority score that combines the zone–day preference weight and the (inverse of the) processing time
. We then construct a list of routes ordered in non-increasing priority (ties broken by longer
first). Routes are processed in this order and each route
is assigned to the day
that (i) does not exceed the daily hours cap
, if possible, and (ii) yields the smallest increase in the total used hours for that day; if all days are at or near capacity, the route is assigned to the day with the smallest overload. This is a standard list scheduling-type heuristic with complexity
, which we now describe and reference in the methods section.
Table 7 shows the total demand and route times by zone.
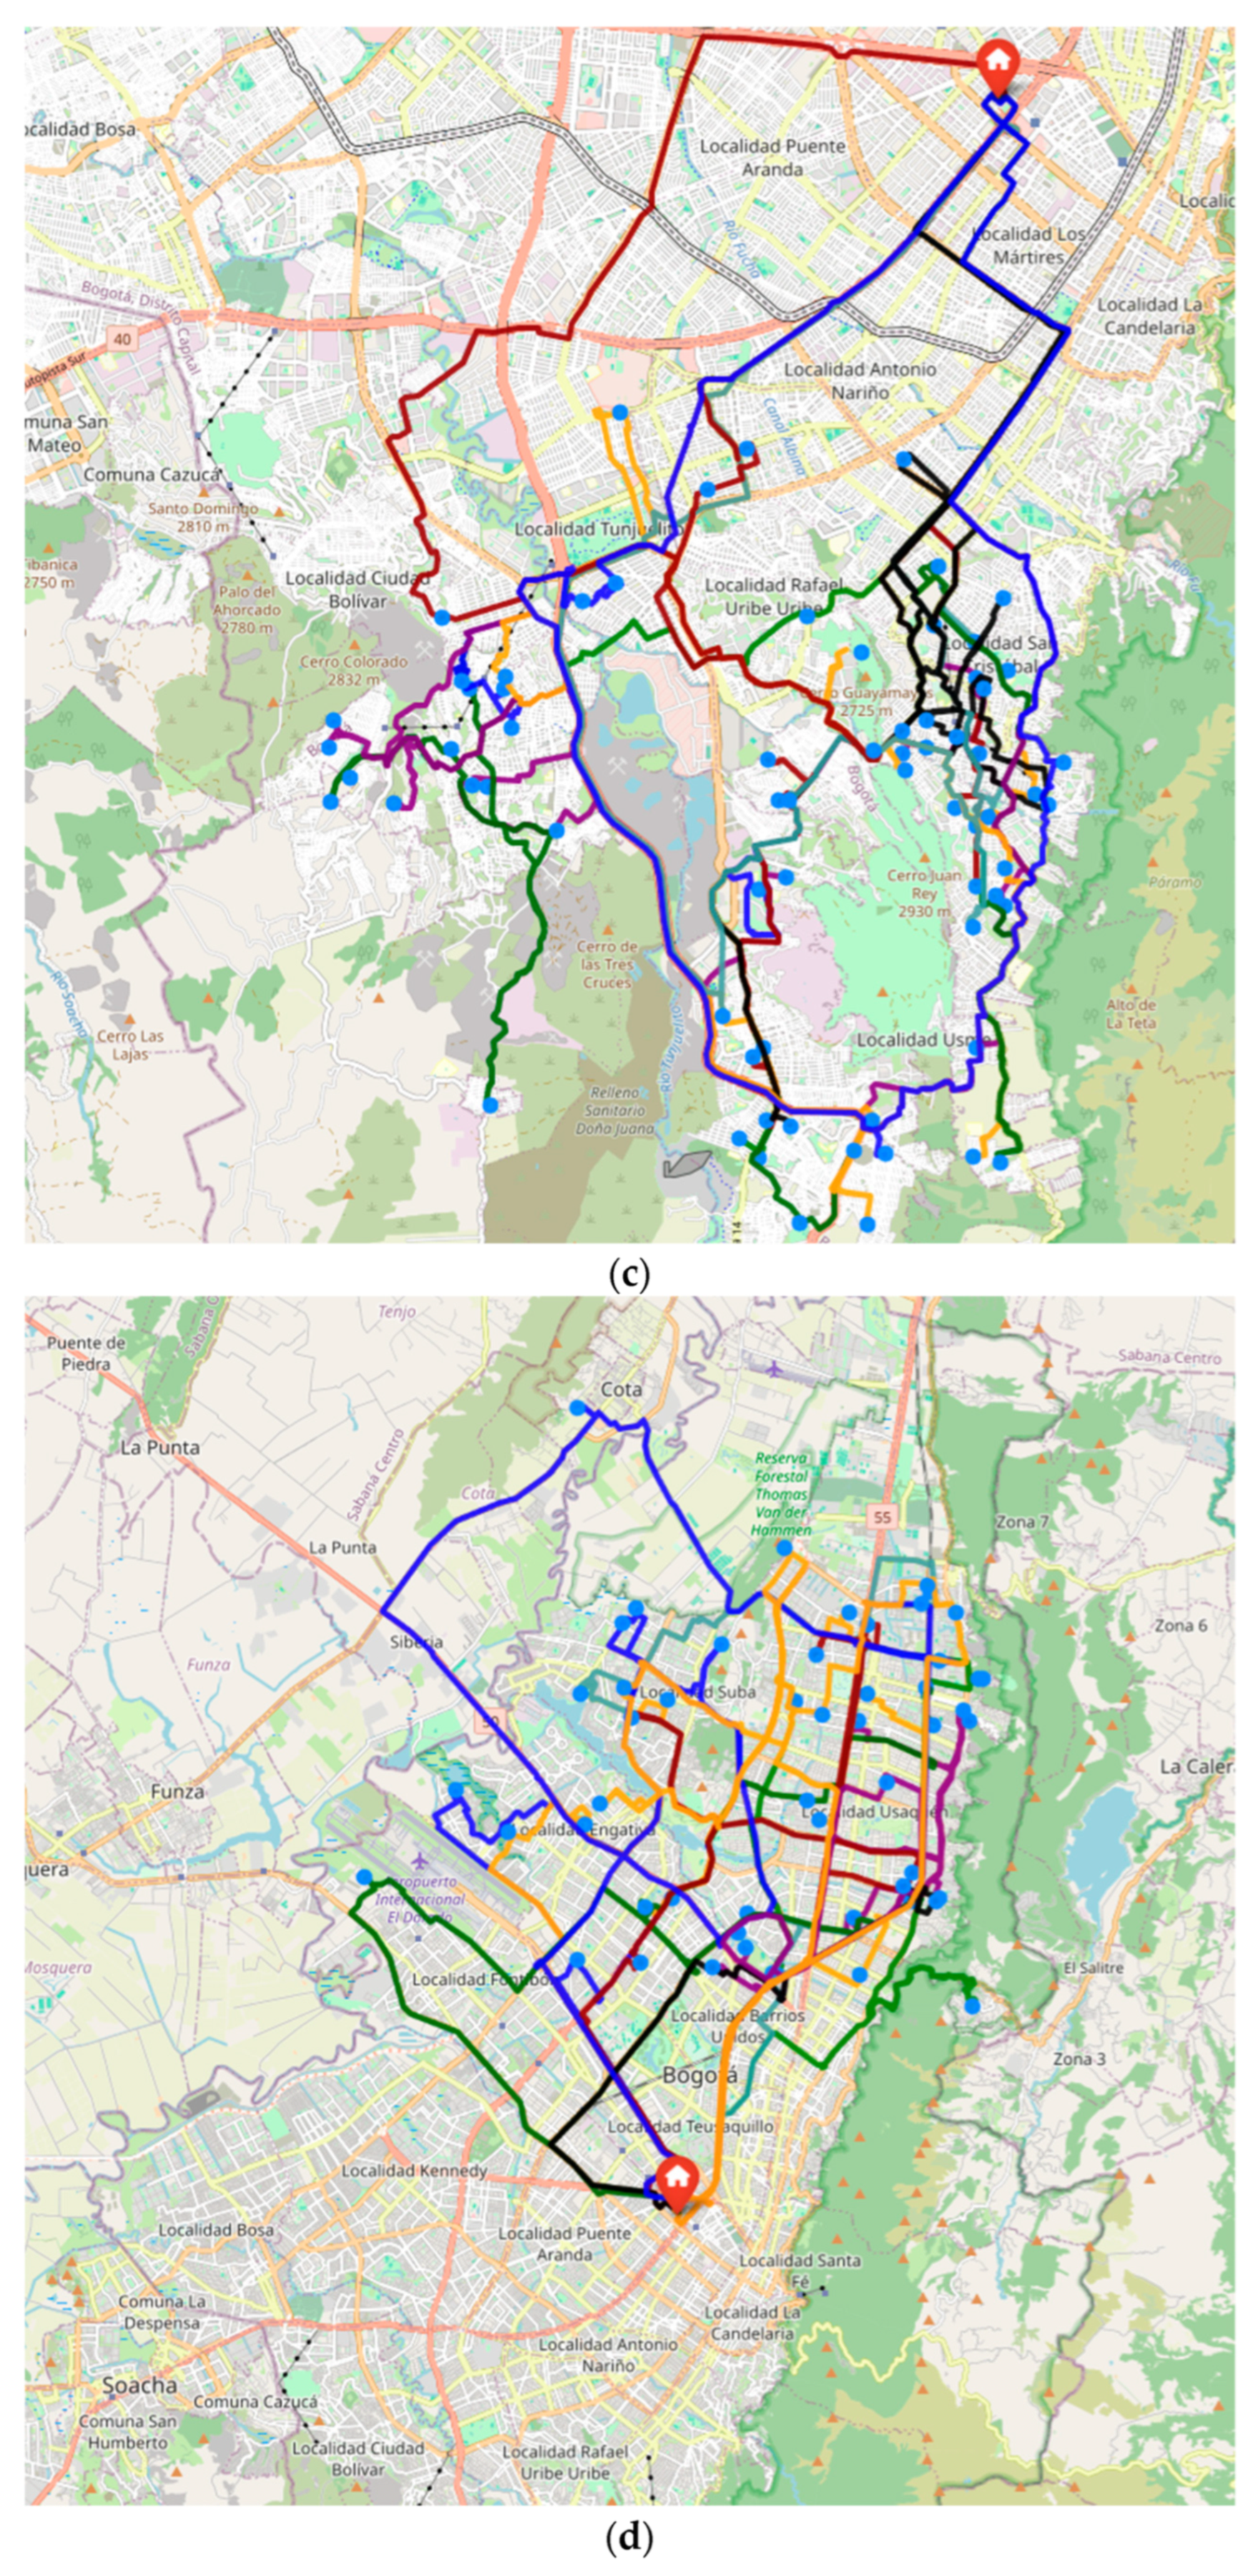
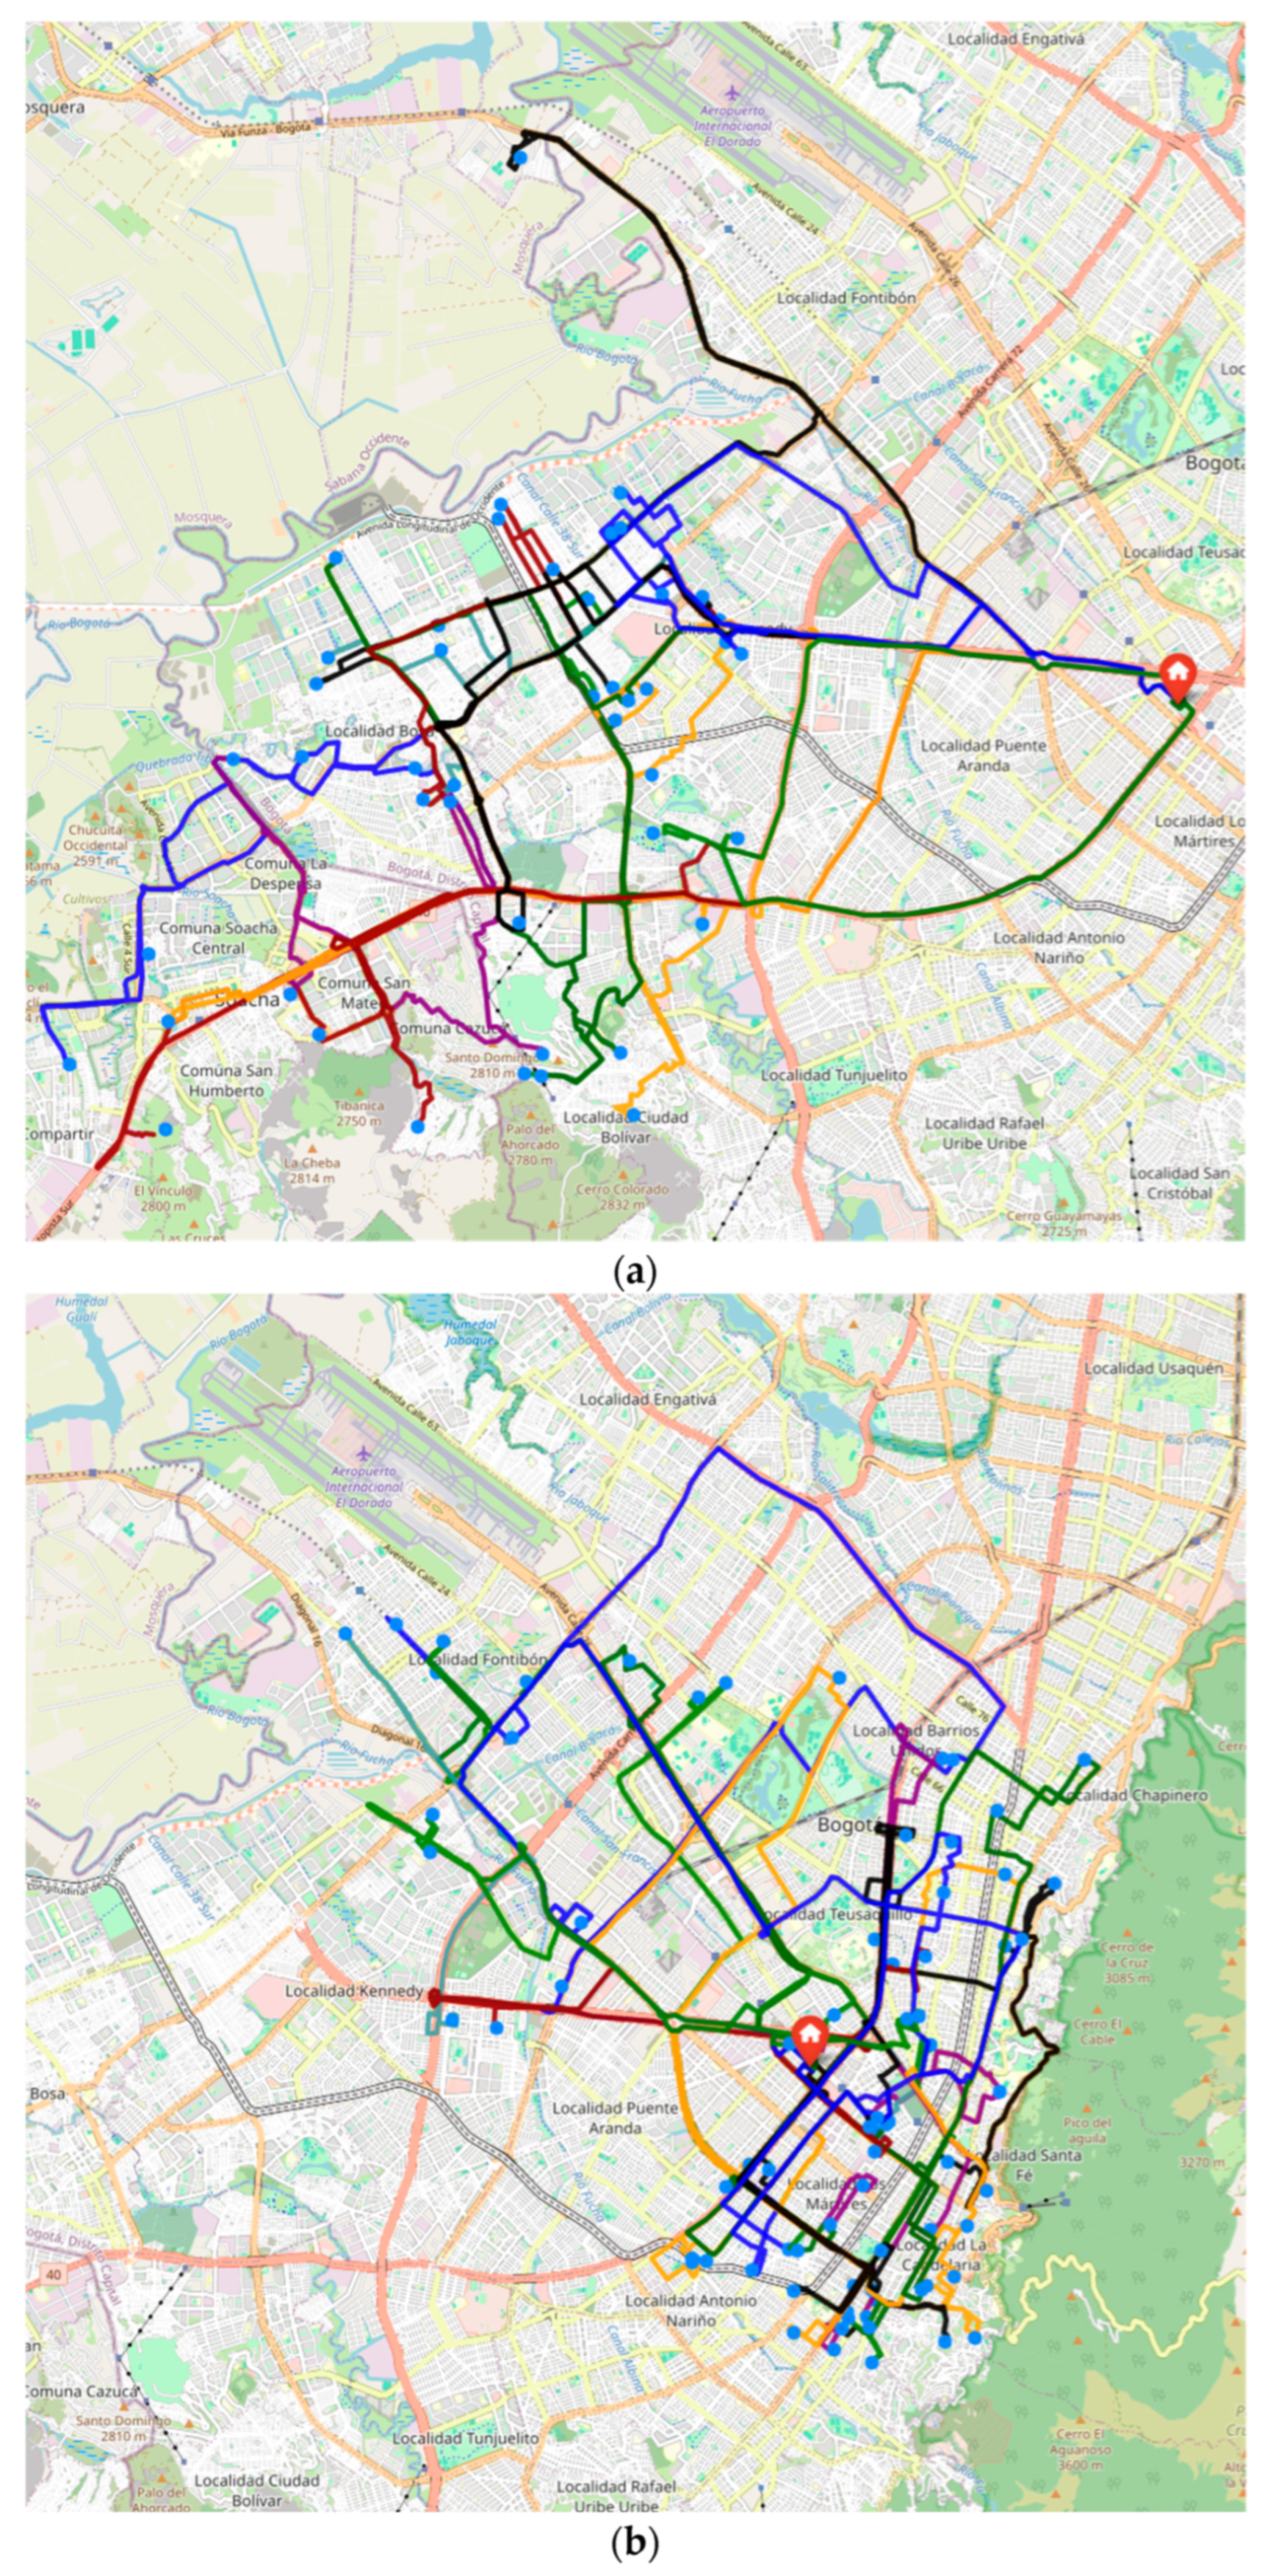
Figure 3a–d show the routes of the corresponding zones, in which each color denotes a route in the first week of the month. All routes start and end at the Food Bank of Bogotá (the red color marker).
The north and southwest zones could be fully serviced in one day since the beneficiaries’ demand does not exceed the daily limit set by the Food Bank. On the other hand, the southwest and central zones require two days to cover all their demand. The southeast zone has the highest demand during the week. In addition, the northern zone has the lowest number of beneficiaries per week, and its daily routes involve more travel compared to the southeastern and central zones.
While these routes are valid in terms of circulation restrictions, hours of operation, and delivery times, these maps illustrate how complex the distribution can be. A careful examination of the routes shows many dead-ends, especially in the southeastern part of Bogotá. In addition, in this area, the terrain is not only very hilly but also has very narrow roads. This implies lots of backtracking and maneuvering. Perhaps the northern zone of Bogotá is the “easiest” one in terms of road infrastructure and terrain, but includes some detours to the eastern hills that again complicate the food distribution.
4.6. Comparative Analysis
The logistics team of the Food Bank of Bogotá provided a two-week follow-up of the routing with the current methodology (Business as Usual, BaU). The BaU case was borrowed from the records of the Food Bank of September 2022 and were provided to us by the logistics department. The records contain the beneficiaries’ orders item by item along with the kilograms of food, the delivery date, and the billing information. The logistics supervisors also provided the start and end times of each trip. The details of the routes were not available. Normally, the drivers make these decisions on the go. It is important to note that although drivers have routing applications (e.g., Waze™ or Google Maps™) on their mobile phones, the trucks do not have GPS to track their routes. The results of this analysis are presented in
Table 8. Therefore, the exact figures of kilometers, route, and waiting times are missing. A notable difference was that the total route time was reduced by 21% with the proposed model. In addition, this approach also increased the amount of demand served in kilograms by 24%, resulting in the possibility of assisting a more significant number of beneficiaries. At the same time, the number of vehicles used was reduced by 8%. The comparisons were made according to the best available information.
While these results imply significant improvements, it is important to note that they are based on a two-week observation period provided by the Food Bank of Bogotá. This timeframe reflects typical operational conditions but does not capture seasonal variations or long-term fluctuations in donation patterns and beneficiary demand. Therefore, the findings should be interpreted as indicative rather than definitive. Future developments might incorporate extended monitoring periods or multiple case studies to validate the consistency and generalizability of these improvements across different operational contexts.
5. Discussion
Our results show that optimization can help the Food Bank perform better planning, but the real value emerges only if the day-to-day data that feeds the model is consistent and timely. In practice, this means improving how beneficiary orders are captured, cleaned, and shared across areas, and aligning expectations so the logistics area can act on a monthly plan rather than reacting hour by hour. We also learned that behaviors at delivery points matter: late confirmations, ad hoc requests, and limited receiving windows ripple through the schedule and amplify congestion challenges in Bogotá.
This technological solution requires the Food Bank to improve the collection and management process of the data that feeds the model. To achieve a monthly schedule, the beneficiaries and the different areas of the Food Bank must be aware of the possible actions that the logistics area can take. On the other hand, individual beneficiaries must realize that poor order placement may result in delays for other links of the supply chain. Some areas of the Food Bank point out that the algorithms do not consider time windows or that certain beneficiaries place orders on the very same delivery day and therefore the delivery schedules must be adjusted in real time. Clearly, these practices complicate delivery in a city that is known for congestion and lack of parking spaces.
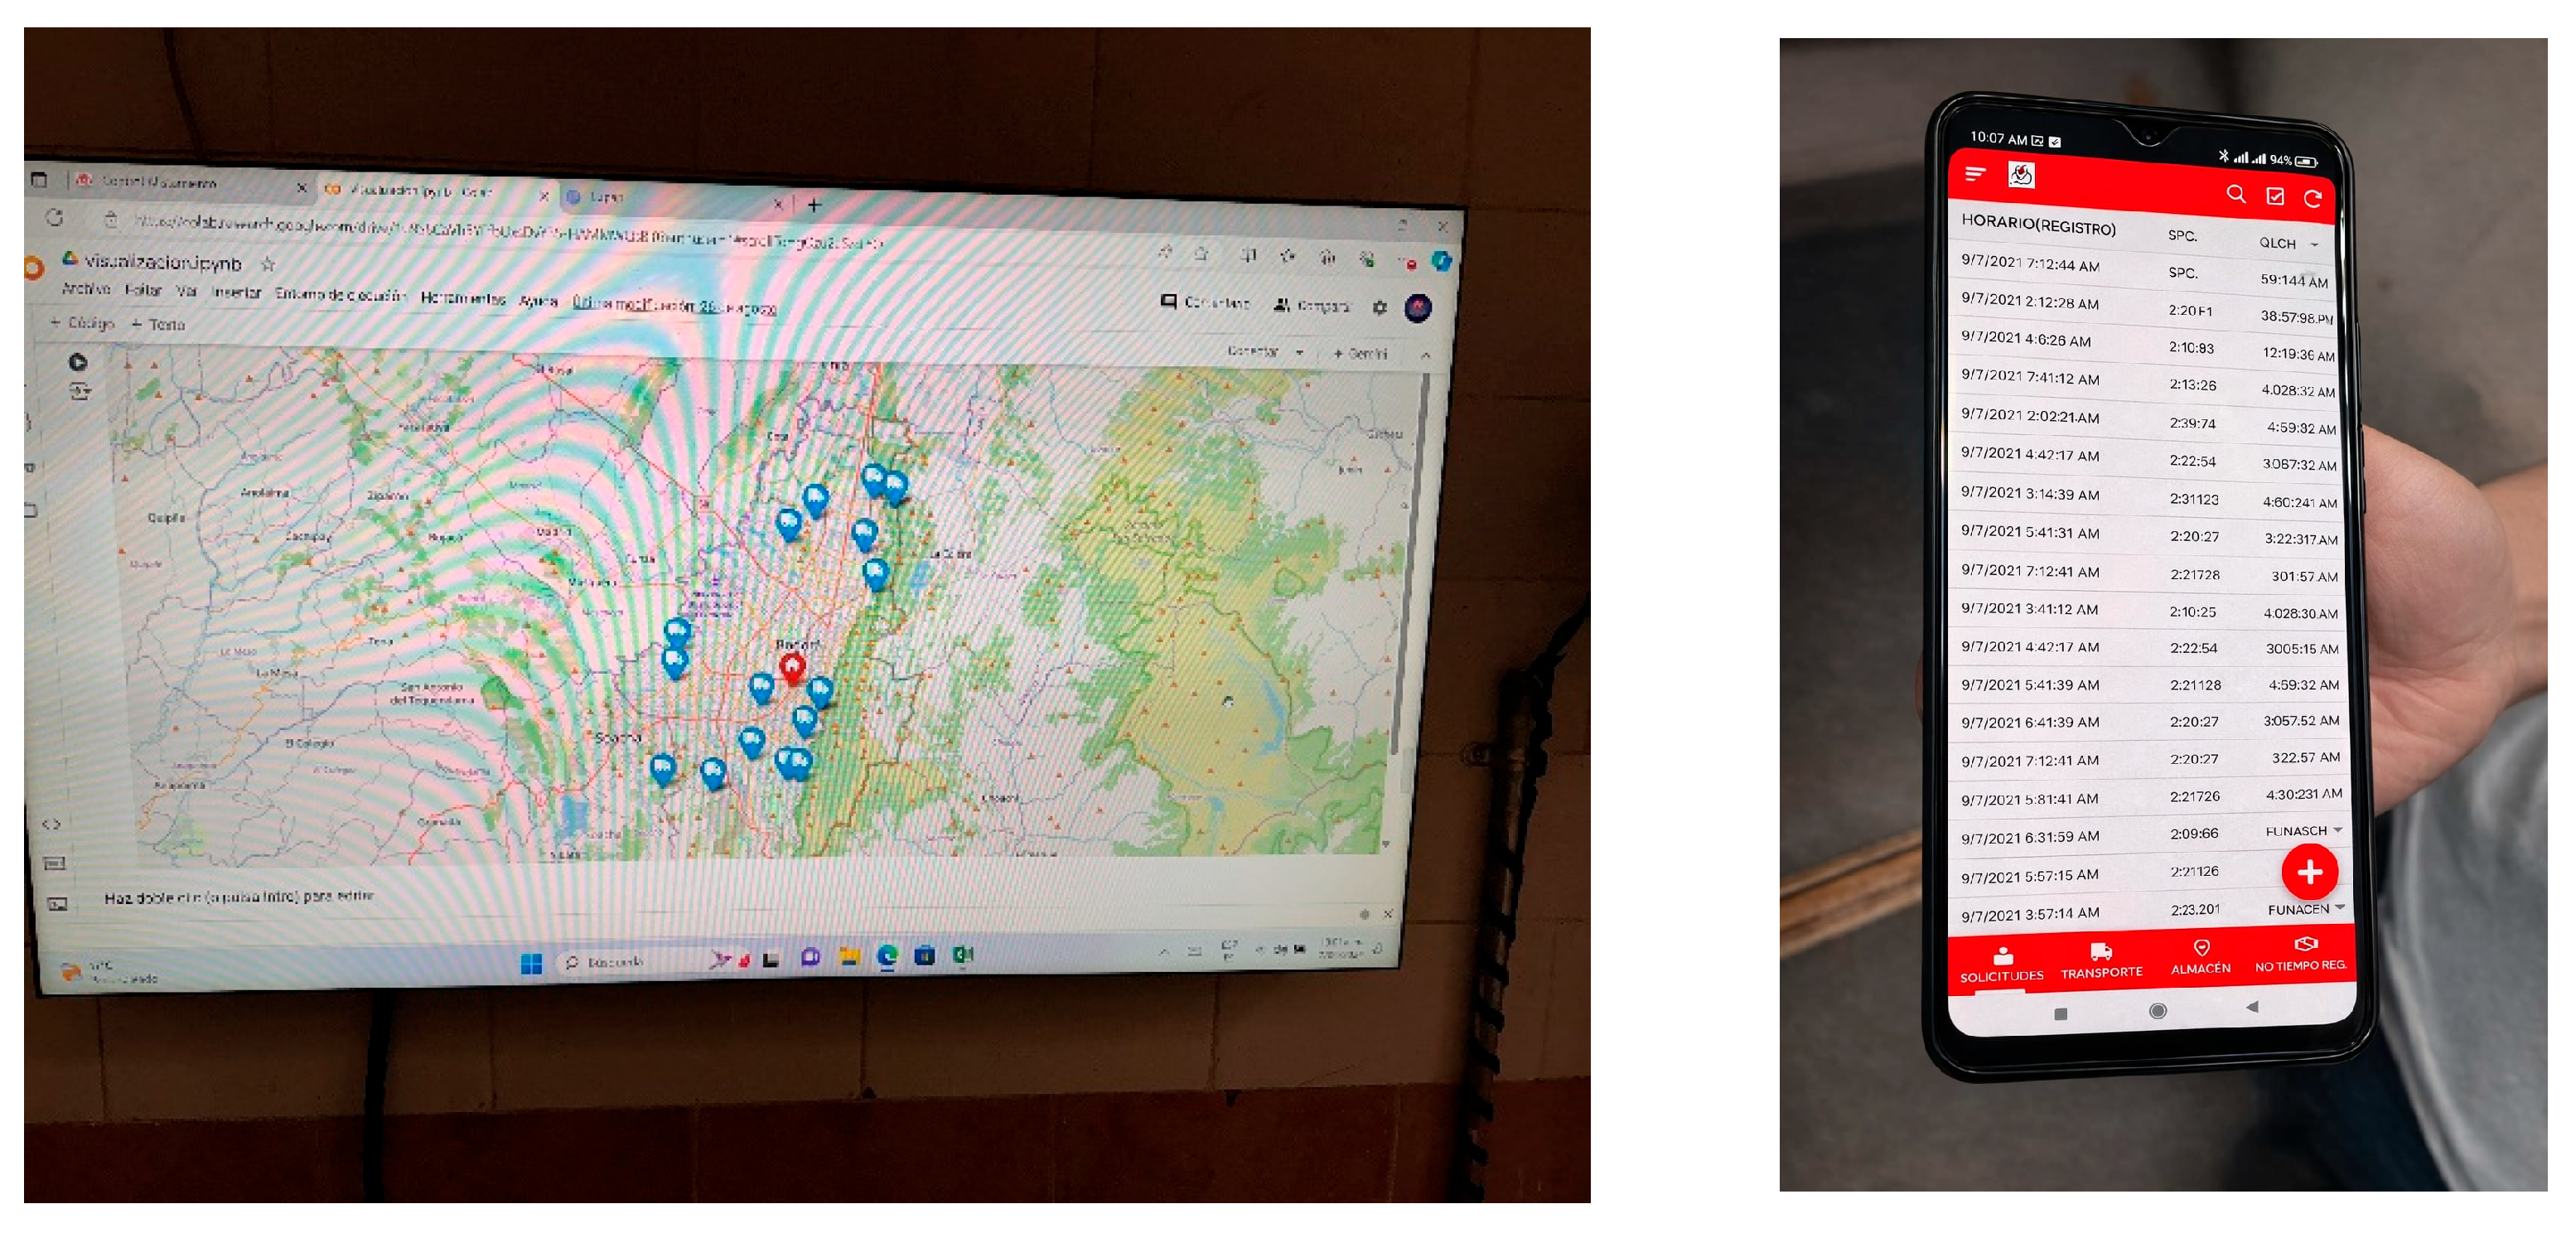
Knowledge transfer has been fundamental to the model’s success and involves understanding each phase of its adaptation and use. The Jupiter notebook scripts were made available to the Food Bank’s logistics team, accompanied by a detailed technical presentation of each phase of the methodology and a user manual with instructions for executing the model. A project briefing with senior management and cross-departmental integration activities recently took place. Despite this, the notebooks were not easy to interpret and to maintain by people with limited computer background. For this reason, the Food Bank first hired an engineering student intern. This person, now a junior engineer, was later hired full-time and at the time of writing, he is responsible for the operation and maintenance of the application. This person has made several changes to the Python script: the first one is that the schedule is now calculated on a daily basis with the orders that must be delivered on the very same day. This modified script connects via APIs to another application developed in-house in Microsoft Power Apps™ by the Food Bank. This application records the orders placedby the beneficiaries (blue symbols) to the Food Bank (red home) on the very same day or the day before, and sends the information to the Python script that, in turn, calculates and visualizes the routes on a map. The routes are printed or sent electronically to the truck drivers. Screenshots of the display of the actual routing application and of the order placement mobile app are shown in
Figure 4.
Although the sample size used for the empirical evaluation was limited, this constraint reflects the operational realities of the Food Bank of Bogotá. The organization provided approximately one year of historical operational records, covering more than 400 periodically served beneficiaries. However, the usable portion of this dataset was restricted by inconsistencies, missing information, and the fact that routing decisions are highly dynamic and often influenced by ad hoc or same-day orders. As a result, only a subset of the full year could be reliably used for structured before–after comparison.
Despite these limitations, the optimization results proved highly robust. This strengthens confidence in the observed improvements (e.g., reductions in total travel time, number of trucks, and increases in demand served), since the gains derive from near-optimal solutions rather than early-terminated heuristics or unstable search processes.
We are aware that this is not a perfectly accurate model. Traffic conditions in Bogotá vary across road types. Major corridors and highways typically operate at average speeds between 25 and 35 km/h, while primary arterial roads commonly range between 20 and 27 km/h. Local and residential streets (where a large portion of the Food Bank’s delivery activity occurs) tend to be significantly slower, with average speeds of 15–22 km/h due to frequent stops, pedestrian crossings, school zones, parked vehicles, and narrow road geometry. Because the Food Bank’s routes necessarily combine these three categories of roads and given the pronounced reduction in speeds during peak hours, we adopt a single average operating speed of 25 km/h for model construction. This value falls within the ranges reported by the Bogotá Mobility Observatory [
69] and represents a conservative and realistic approximation that prevents overestimating travel times while preserving the operational simplicity required for the model to be easily implemented by the Food Bank’s staff.
Finally, as pointed out before, the present work is positioned as a static planning baseline for food bank logistics. It does provide insights about how digital transformation using data and optimization models at the Food Bank of Bogota can represent an opportunity for improvements over the current operation. An additional advantage of this model is its replicability for food collection. At the time of writing, other food banks of the ABACO (Association of Food Banks of Colombia, acronym in Spanish) are evaluating its use.
Additionally, operational change management is critical for successful deployment. The observed gains depend not only on algorithmic improvements but also on data discipline (accurate and timely updates) and stakeholder alignment (drivers, coordinators, and donors). Training and communication strategies will be essential to ensure the adoption and sustainability of these enhancements.
6. Conclusions and Future Work
This project was developed with the logistics staff and is currently in the implementation phase at the Food Bank of Bogotá. This project aimed to optimize the delivery routes for food donations by employing clustering and Capacitated Periodic Vehicle Routing Problem (CPVRP)-based models. The implementation of algorithms such as K-means, Path Cheapest Arc, Best Insertion, and meta-heuristics like Guided Local Search and Greedy Descent led to potential improvements in travel time and resource usage.
By testing different combinations of heuristic and meta-heuristic methods, especially the “Best Insertion” heuristic combined with “Guided Local Search,” the model can reduce the total travel time by up to 21% and increase the total demand served by 24%. Other model inputs will be necessary to adapt the model to the evolving conditions at the Food Bank of Bogotá. This model was the starting point for a better distribution system. The sustainability of the system will rely on whether the system can be upgraded and maintained. The Food Bank has taken steps for this and has hired a junior engineer for this task, but a dedicated “routing” department is out of the question for the time being.
This model also has potential for application in other food banks within the Association of Food Banks of Colombia (ABACO), showcasing the broader utility of the developed solution. Future work will be focused on the following:
Incorporating simple time windows using OR-Tools: Adding time windows is a natural next step to reflect donor and beneficiary availability. OR-Tools provides built-in support for VRPTWs, allowing constraints on earliest and latest service times. This enhancement improves realism and service quality, as time windows are widely recognized in logistics for handling scheduling constraints [
42]. OR-Tools’ flexibility for VRPTWs has been demonstrated in practical applications.
Allowing limited cross-zone arcs for flexibility: Current zone-based clustering simplifies planning but can lead to inefficiencies when demand is uneven. Introducing controlled cross-zone arcs (similar to flexible routing strategies) can mitigate these inefficiencies while preserving operational simplicity. Studies on flexible VRP approaches show that overlapping or cross-zone routing reduces costs under demand variability [
48].
Testing time-dependent travel time models to capture congestion effects: Static travel times ignore urban congestion patterns, which can significantly affect routing efficiency. Time-dependent VRP (TDVRP) models incorporate variable speeds and congestion avoidance strategies, reducing late arrivals and extra duty times by up to 70%, as evidenced in the literature (e.g., [
42,
51]). Implementing TDVRP in OR-Tools or hybrid heuristics would improve the accuracy for Bogotá’s traffic conditions.
Integrating pickups when donation predictability improves: Future models should include simultaneous pickup and delivery, as food banks often collect donations while distributing goods. Incorporating this feature would enhance resource utilization and sustainability.
Monthly planning cycle with daily rolling repairs: A rolling horizon approach enables periodic re-optimization using updated data, balancing long-term planning with short-term responsiveness. This technique has proven effective in multiperiod routing and demand-responsive transport systems [
72]. The integration of this feature in the Food Bank’s API for daily updates would allow dynamic adjustments without full re-planning, improving adaptability and reducing operational disruptions.
Based on the dynamic nature of the problem, as outlined in the previous lines, a dynamic scheduling framework for food bank logistics could leverage Dynamic Vehicle Routing Problem (DVRP) formulations or online optimization algorithms to adapt routes in real time as new donations or beneficiary requests occur. These approaches typically involve continuous re-optimization based on updated information, such as vehicle positions, inventory levels, and time windows. For example, DVRP algorithms can incorporate rolling horizon strategies, where routes are periodically recalculated as new orders arrive, while online optimization methods can use event-driven updates triggered by donation arrivals or cancellations. Such a system would require integration with real-time data sources (e.g., donor notifications, GPS tracking) and decision rules to prioritize urgent deliveries, ensuring perishability constraints and equity objectives are maintained. This direction represents a promising extension to improve responsiveness and efficiency in highly dynamic environments.
Exploring the relaxation of strict cluster boundaries to allow limited cross-zone routing if it results in reductions in travel time or vehicle usage. On the computational side, the use of meta-heuristics, hybrid heuristics, or machine learning-based demand forecasting could further enhance planning decisions. Finally, a valuable line of inquiry involves conducting longitudinal field experiments or A/B tests to systematically evaluate the model’s real-world impact on efficiency, service level, and resource utilization.
Author Contributions
Conceptualization, L.H.A., A.C., V.R. and G.M.; methodology, L.H.A., A.C. and V.R.; software, L.H.A., A.C. and V.R.; validation, G.M., A.C.d.S.-O. and J.R.M.-T.; formal analysis, L.H.A., A.C. and V.R.; investigation, L.H.A., A.C. and V.R.; resources, G.M.; data curation, L.H.A., A.C. and V.R.; writing—original draft preparation, L.H.A., A.C. and V.R.; writing—review and editing, G.M., A.C.d.S.-O. and J.R.M.-T.; visualization, L.H.A., A.C. and V.R.; supervision, G.M., A.C.d.S.-O. and J.R.M.-T.; project administration, G.M.; funding acquisition, G.M. All authors have read and agreed to the published version of the manuscript.
Funding
The authors would like to acknowledge the support provided by Universidad de La Sabana through a graduate assistantship, which facilitated this research. This project was funded by Universidad de La Sabana under grant INGPhD-48-2022.
Institutional Review Board Statement
Not applicable.
Informed Consent Statement
Not applicable.
Data Availability Statement
The data that support the findings of this study is available from the corresponding author [Mejía, Gonzalo] upon reasonable request and with prior written authorization of the Food Bank of Bogotá. During the preparation of this work, the author(s) used Chat-GPT in order to translate and review the grammar and style of this paper. After using this tool/service, the author(s) reviewed and edited the content as needed and take(s) full responsibility for the content of the publication. The authors certify that the approach corresponds to our own conceptual design. We also used Chat-GPT for the coding of the algorithms.
Acknowledgments
The authors would like to thank the Food Bank of Bogotá for their kind support throughout this project.
Conflicts of Interest
No potential conflict of interests were reported by the authors.
References
- Esmaeilidouki, A.; Rambe, M.; Ardestani-Jaafari, A.; Li, E.; Marcolin, B. Food bank operations: Review of operation research methods and challenges during COVID-19. BMC Public Health 2023, 23, 1783. [Google Scholar] [CrossRef] [Scilit]
- Fredriksson, A.; Liljestrand, K. Capturing food logistics: A literature review and research agenda. Int. J. Logist. Res. Appl. 2015, 18, 16–34. [Google Scholar] [CrossRef] [Scilit]
- Islam, M.H.; Ivy, J.S. Modeling the role of efficiency for the equitable and effective distribution of donated food. OR Spectr. 2022, 44, 485–534. [Google Scholar] [CrossRef] [Scilit]
- Chandler-Wilde, H. These Are the World’s Most Congested Cities; Bloomberg: New York, NY, USA, 2023. [Google Scholar]
- Rivera, A.F.; Smith, N.R.; Ruiz, A. A Systematic Literature Review of Food Banks’ Supply Chain Operations with a Focus on Optimization Models; Emerald Publishing: Leeds, UK, 2023. [Google Scholar] [CrossRef] [Scilit]
- Akkerman, R.; Buisman, M.E.; Cruijssen, F.C.A.M.; de Leeuw, S.L.J.M.; Haijema, R. Dealing with donations: Supply chain management challenges for food banks. Int. J. Prod. Econ. 2023, 262, 108926. [Google Scholar] [CrossRef] [Scilit]
- Ruffini, K.; Ozturk, O.D.; Pekgün, P. In-kind government assistance and crowd-out of charitable services: Evidence from free school meals. J. Public. Econ. 2025, 248, 105391. [Google Scholar] [CrossRef] [Scilit]
- Vieira, L.M.; Miguel, P.L.S.; de Moraes, C.C. Mapping a food donation supply chain and the implications for social policies in Brazil. Int. J. Logist. Manag. 2025, 36, 1515–1534. [Google Scholar] [CrossRef] [Scilit]
- Ogazon, E.; Smith, N.R.; Ruiz, A.B. Reconfiguration of Foodbank Network Logistics to Cope with a Sudden Disaster. Mathematics 2022, 10, 1420. [Google Scholar] [CrossRef] [Scilit]
- Lowrey, J.D.; Boyer, K.K.K. Pantry direct: A transformative supply chain for reducing food insecurity. J. Bus. Logist. 2024, 45, e12341. [Google Scholar] [CrossRef] [Scilit]
- Morrow, B.F.; Davis, L.B.; Jiang, S.; McCormick, N. Optimizing food pantry stocking through client preferences: A novel elicitation and classification process. J. Humanit. Logist. Supply Chain. Manag. 2024, 14, 399–418. [Google Scholar] [CrossRef] [Scilit]
- Wu, P.; Tai, Y.C. Artificial intelligence-based food-quality and warehousing management for food banks’ inbound logistics. J. Enterp. Inf. Manag. 2024, 37, 307–325. [Google Scholar] [CrossRef] [Scilit]
- Zou, F.; Sharma, L.; Pekgün, P.; Ahire, S.L. Reducing Food Waste in U.S. Food Banks: The Role of Distribution Strategies. Prod. Oper. Manag. 2025, 34, 3667–3685. [Google Scholar] [CrossRef] [Scilit]
- Sandoya, A.; Chicaiza-Vaca, J.; Sandoya, F.; Barán, B. A Model for a Circular Food Supply Chain Using Metro Infrastructure for Quito’s Food Bank Network †. Sustainability 2025, 17, 5635. [Google Scholar] [CrossRef] [Scilit]
- Orgut, I.S.; Lodree, E.J. Equitable distribution of perishable items in a food bank supply chain. Prod. Oper. Manag. 2023, 32, 3002–3021. [Google Scholar] [CrossRef] [Scilit]
- Hamilton, M.; Morrow, B.F.; Davis, L.B.; Morgan, S.; Ivy, J.S.; Jiang, S.; Chi, M.; Hilliard, K. Toward a More Diverse and Equitable Food Distribution System: Amplifying Diversity, Equity and Inclusion in Food Bank Operations. Prod. Oper. Manag. 2025, 34, 643–655. [Google Scholar] [CrossRef] [Scilit]
- Dantzig, G.B.; Ramser, J.H. The Truck Dispatching Problem. Manag. Sci. 1959, 6, 80–91. [Google Scholar] [CrossRef] [Scilit]
- Laporte, G.; Nobert, Y.; Desrochers, M. Optimal Routing under Capacity and Distance Restrictions. Oper. Res. 1985, 33, 1050–1073. [Google Scholar] [CrossRef] [Scilit]
- Toth, P.; Vigo, D. Theory and Methodology A heuristic algorithm for the symmetric and asymmetric vehicle routing problems with backhauls. Eur. J. Oper. Res. 1999, 113, 528–543. [Google Scholar] [CrossRef] [Scilit]
- Rabbouch, B.; Saâdaoui, F.; Mraihi, R. Efficient implementation of the genetic algorithm to solve rich vehicle routing problems. Oper. Res. 2021, 21, 1763–1791. [Google Scholar] [CrossRef] [Scilit]
- Clarke, G.; Wright, J.W. Scheduling of Vehicles from a Central Depot to a Number of Delivery Points. Oper. Res. 1964, 12, 568–581. [Google Scholar] [CrossRef] [Scilit]
- Campbell, A.M.; Savelsbergh, M. Efficient insertion heuristics for vehicle routing and scheduling problems. Transp. Sci. 2004, 38, 369–378. [Google Scholar] [CrossRef] [Scilit]
- Barbarosoglu, G.; Ozgur, D. A tabu search algorithm for the vehicle routing problem. Comput. Oper. Res. 1999, 26, 255–270. [Google Scholar] [CrossRef] [Scilit]
- Gmira, M.; Gendreau, M.; Lodi, A.; Potvin, J.Y. Tabu search for the time-dependent vehicle routing problem with time windows on a road network. Eur. J. Oper. Res. 2021, 288, 129–140. [Google Scholar] [CrossRef] [Scilit]
- Silva, A.S.; Lima, J.; Silva, A.M.T.; Gomes, H.T.; Pereira, A.I. Time-Dependency of Guided Local Search to Solve the Capacitated Vehicle Routing Problem with Time Windows. In International Conference on Optimization, Learning Algorithms and Applications; Springer: Berlin/Heidelberg, Germany, 2024; pp. 93–108. [Google Scholar]
- Frías, N.; Johnson, F.; Valle, C. Hybrid Algorithms for Energy Minimizing Vehicle Routing Problem: Integrating Clusterization and Ant Colony Optimization. IEEE Access 2023, 11, 125800–125821. [Google Scholar] [CrossRef] [Scilit]
- Rezaei, B.; Guimaraes, F.G.; Enayatifar, R.; Haddow, P.C. Combining genetic local search into a multi-population Imperialist Competitive Algorithm for the Capacitated Vehicle Routing Problem. Appl. Soft Comput. 2023, 142, 110309. [Google Scholar] [CrossRef] [Scilit]
- Braekers, K.; Ramaekers, K.; Van Nieuwenhuyse, I. The vehicle routing problem: State of the art classification and review. Comput. Ind. Eng. 2016, 99, 300–313. [Google Scholar] [CrossRef] [Scilit]
- Comert, S.E.; Yazgan, H.R.; Kır, S.; Yener, F. A cluster first-route second approach for a capacitated vehicle routing problem: A case study. Int. J. Procure. Manag. 2018, 11, 399–419. [Google Scholar] [CrossRef] [Scilit]
- Yuan, C.; Yang, H. Research on K-Value Selection Method of K-Means Clustering Algorithm. J 2019, 2, 226–235. [Google Scholar] [CrossRef] [Scilit]
- Calvet, L.; Ferrer, A.; Gomes, M.I.; Juan, A.A.; Masip, D. Combining statistical learning with metaheuristics for the Multi-Depot Vehicle Routing Problem with market segmentation. Comput. Ind. Eng. 2016, 94, 93–104. [Google Scholar] [CrossRef] [Scilit]
- Granillo-Macías, R. Logistics optimization through a social approach for food distribution. Socioecon. Plann Sci. 2021, 76, 100972. [Google Scholar] [CrossRef] [Scilit]
- Sabar, N.R.; Bhaskar, A.; Chung, E.; Turky, A.; Song, A. A self-adaptive evolutionary algorithm for dynamic vehicle routing problems with traffic congestion. Swarm Evol. Comput. 2019, 44, 1018–1027. [Google Scholar] [CrossRef] [Scilit]
- Francis, P.M.; Smilowitz, K.R.; Tzur, M. The Period Vehicle Routing Problem and its Extensions. In The Vehicle Routing Problem: Latest Advances and New Challenges; Golden, B., Raghavan, S., Wasil, E., Eds.; Springer: Boston, MA, USA, 2008; Volume 43, pp. 77–82. [Google Scholar] [CrossRef] [Scilit]
- Coene, S.; Arnout, A.; Spieksma, F.C.R. On a periodic vehicle routing problem. J. Oper. Res. Soc. 2010, 61, 1719–1728. [Google Scholar] [CrossRef] [Scilit]
- Davis, L.B.; Sengul, I.; Ivy, J.S.; Brock, L.G.; Miles, L. Scheduling food bank collections and deliveries to ensure food safety and improve access. Socioecon. Plann Sci. 2014, 48, 175–188. [Google Scholar] [CrossRef] [Scilit]
- Vieira, B.S.; Ribeiro, G.M.; Bahiense, L. Metaheuristics with variable diversity control and neighborhood search for the Heterogeneous Site-Dependent Multi-depot Multi-trip Periodic Vehicle Routing Problem. Comput. Oper. Res. 2023, 153, 106189. [Google Scholar] [CrossRef] [Scilit]
- Nair, D.J.; Grzybowska, H.; Rey, D.; Dixit, V. Food rescue and delivery: Heuristic algorithm for periodic unpaired pickup and delivery vehicle routing problem. Transp. Res. Rec. 2016, 2548, 81–89. [Google Scholar] [CrossRef] [Scilit]
- Schneider, K.; Nurre, S.G. A multi-criteria vehicle routing approach to improve the compliance audit schedule for food banks. Omega 2019, 84, 127–140. [Google Scholar] [CrossRef] [Scilit]
- Alhindi, A.; Alsaidi, A.; Munshi, A. Vehicle Routing Optimization for Non-Profit Organization Systems. Information 2022, 13, 374. [Google Scholar] [CrossRef] [Scilit]
- Reusken, M.; Laporte, G.; Rohmer, S.U.K.; Cruijssen, F.C.A.M. Vehicle routing with stochastic demand, service and waiting times—The case of food bank collection problems. Eur. J. Oper. Res. 2024, 317, 111–127. [Google Scholar] [CrossRef] [Scilit]
- Cuvelier, T.; Didier, F.; Furnon, V.; Gay, S.; Mohajeri, S.; Paris, L.P.G. OR-Tools’ Vehicle Routing Solver: A Generic Constraint-Programming Solver with Heuristic Search for Routing Problems. 2023. Available online: https://hal.science/hal-04015496/document (accessed on 30 October 2025).
- Van Lon, R.R.S.; Branke, J.; Holvoet, T. Optimizing agents with genetic programming: An evaluation of hyper-heuristics in dynamic real-time logistics. Genet. Program. Evolvable Mach. 2018, 19, 93–120. [Google Scholar] [CrossRef] [Scilit]
- Zhou, X.; Tong, L.; Mahmoudi, M.; Zhuge, L.; Yao, Y.; Zhang, Y.; Shang, P.; Liu, J.; Shi, T. Open-source VRPLite Package for Vehicle Routing with Pickup and Delivery: A Path Finding Engine for Scheduled Transportation Systems. Urban. Rail Transit. 2018, 4, 68–85. [Google Scholar] [CrossRef] [Scilit]
- Erdoğan, G. An open source Spreadsheet Solver for Vehicle Routing Problems. Comput. Oper. Res. 2017, 84, 62–72. [Google Scholar] [CrossRef] [Scilit]
- Sahroni, T.R.; Anggoro, L.A.; Ismail, S. Aerna, Application of an open source spreadsheet solver in single depot routing problem. Int. J. Supply Chain. Manag. 2018, 7, 375–381. [Google Scholar]
- Jin, Y.; Ge, X.; Zhang, L.; Ren, J. A two-stage algorithm for bi-objective logistics model of cash-in-transit vehicle routing problems with economic and environmental optimization based on real-time traffic data. J. Ind. Inf. Integr. 2022, 26, 100273. [Google Scholar] [CrossRef] [Scilit]
- Dereci, U.; Karabekmez, M.E. The applications of multiple route optimization heuristics and meta-heuristic algorithms to solid waste transportation: A case study in Turkey. Decis. Anal. J. 2022, 4, 100113. [Google Scholar] [CrossRef] [Scilit]
- Zahorán, L.; Kovács, A. ProSeqqo: A generic solver for process planning and sequencing in industrial robotics. Robot. Comput. Integr. Manuf. 2022, 78, 102387. [Google Scholar] [CrossRef] [Scilit]
- Silva, A.S.; Lima, J.; Pereira, A.I.; Silva, A.M.T.; Gomes, H.T. Execution Time Experiments to Solve Capacitated Vehicle Routing Problem. In Lecture Notes in Computer Science (Including Subseries Lecture Notes in Artificial Intelligence and Lecture Notes in Bioinformatics); Gervasi, O., Murgante, B., Scorza, F., Rocha, A.M.A.C., Garau, C., Karaca, Y., Torre, C.M., Eds.; Springer Science and Business Media Deutschland GmbH, 2023; pp. 273–289. [Google Scholar] [CrossRef] [Scilit]
- Kocaoglu, B.; Ozceylan, A. A Vehicle Routing Problem Arising in the Distribution of Higher Education Institutions Exam Booklets. Gazi Univ. J. Sci. 2023, 36, 705–718. [Google Scholar] [CrossRef] [Scilit]
- Nazari, M.; Oroojlooy, A.; Takáč, M.; Snyder, L.V. Reinforcement learning for solving the vehicle routing problem. In Advances in Neural Information Processing Systems; Garnett, R., Larochelle, H., Bengio, S., Wallach, H., Grauman, K., Cesa-Bianchi, N., Grauman, K., Eds.; Neural Information Processing Systems Foundation: San Diego, CA, USA, 2018; pp. 9839–9849. Available online: https://www.scopus.com/inward/record.uri?eid=2-s2.0-85064833116&partnerID=40&md5=53840028e00ae3ecc8e4a44da447f61e (accessed on 30 October 2025).
- Habib, Y.; Filchenkov, A. Multi-Agent Reinforcement Learning for Multi Vehicles One-commodity Vehicle Routing Problem. Procedia Computer Science 2022, 212, 418–428. [Google Scholar] [CrossRef] [Scilit]
- Alves, F.; Pacheco, F.; Rocha, A.M.A.C.; Pereira, A.I.; Leitão, P. Solving a Logistics System for Vehicle Routing Problem Using an Open-Source Tool. In Computational Science and Its Applications—ICCSA 2021; Gervasi, O., Murgante, B., Misra, S., Garau, C., Blečić, I., Taniar, D., Apduhan, B.O., Rocha, A.M.A.C., Tarantino, E., Torre, C.M., Eds.; Springer International Publishing: Cham, Switzerland, 2021; pp. 397–412. [Google Scholar]
- Jubé, D.D.A.; Wermelinger, C.C.; Van Erven, R.C.G.S.; De Souza, F.N.B.; Ishikawa, E. Optimization of vehicle routing in the distribution of electronic voting machines for elections. In Proceedings of the 2023 18th Iberian Conference on Information Systems and Technologies (CISTI), Aveiro, Portugal, 20–23 June 2023; pp. 1–6. [Google Scholar] [CrossRef] [Scilit]
- Fernando, M.; Thibbotuwawa, A.; Perera, H.N.; Ratnayake, R.M.C. Close-Open Mixed Vehicle Routing Optimization Model with Multiple Collecting Centers to Collect Farmers’ Perishable Produce. In Proceedings of the 2022 International Conference for Advancement in Technology, ICONAT 2022, Goa, India, 21–22 January 2022; Institute of Electrical and Electronics Engineers Inc.: New York, NY, USA, 2022. [Google Scholar] [CrossRef] [Scilit]
- Keenan, P.B. Spatial decision support systems for vehicle routing. Decis. Support. Syst. 1998, 22, 65–71. [Google Scholar] [CrossRef] [Scilit]
- Ruiz, R.; Maroto, C.; Alcaraz, J. A decision support system for a real vehicle routing problem. Eur. J. Oper. Res. 2004, 153, 593–606. [Google Scholar] [CrossRef] [Scilit]
- Lacomme, P.; Rault, G.; Sevaux, M. Integrated decision support system for rich vehicle routing problems. Expert. Syst. Appl. 2021, 178, 114998. [Google Scholar] [CrossRef] [Scilit]
- Schröer, C.; Kruse, F.; Gómez, J.M. A systematic literature review on applying CRISP-DM process model. Procedia Comput. Sci. 2021, 181, 526–534. [Google Scholar] [CrossRef] [Scilit]
- Martinez-Plumed, F.; Contreras-Ochando, L.; Ferri, C.; Hernandez-Orallo, J.; Kull, M.; Lachiche, N.; Ramirez-Quintana, M.J.; Flach, P. CRISP-DM Twenty Years Later: From Data Mining Processes to Data Science Trajectories. IEEE Trans. Knowl. Data Eng. 2021, 33, 3048–3061. [Google Scholar] [CrossRef] [Scilit]
- Belka, R.; Godlewski, M. Vehicle routing optimization system with smart geopositioning updates. Appl. Sci. 2021, 11, 10933. [Google Scholar] [CrossRef] [Scilit]
- Buitinck, L.; Louppe, G.; Blondel, M.; Pedregosa, F.; Mueller, A.; Grisel, O.; Niculae, V.; Prettenhofer, P.; Gramfort, A.; Grobler, J.; et al. API design for machine learning software: Experiences from the scikit-learn project. arXiv 2013, arXiv:1309.0238. [Google Scholar] [CrossRef] [Scilit]
- Rousseeuw, P.J. Silhouettes: A Graphical Aid to the Interpretation and Validation of Cluster Analysis. J Comput Appl Math 1987, 20, 53–65. [Google Scholar] [CrossRef] [Scilit]
- QGIS.org, QGIS Geographic Information System. Open Source Geospatial Foundation Project. 2023. Available online: https://qgis.org/en/site/ (accessed on 29 February 2024).
- OpenStreetMap Contributors, Open Street Maps. 2017, OpenStreetMap Database [PostgreSQL via API], Cambridge. Available online: http://openstreetmap.org (accessed on 29 February 2024).
- Graham, R.L.; Lawler, E.L.; Lenstra, J.K.; Kan, A.H.G.R. Optimization and Approximation in Deterministic Sequencing and Scheduling: A Survey. Ann. Discret. Math. 1979, 5, 287–326. [Google Scholar] [CrossRef] [Scilit]
- Pinedo, M.L. Scheduling: Theory, Algorithms, and Systems, 4th ed.; Springer Verlag: New York, NY, USA; London, UK, 2012. [Google Scholar] [CrossRef] [Scilit]
- De Movilidad, S. Datos Abiertos Secretaría Distrital de Movilidad. Available online: https://datos.movilidadbogota.gov.co/datasets/movilidadbogota::velocidades-bitcarrier-noviembre-2022/explore (accessed on 29 February 2024).
- Baptista, S.; Oliveira, R.C.; Zúquete, E. A periodic vehicle routing case study. Eur. J. Oper. Res. 2002, 139, 220–229. [Google Scholar] [CrossRef] [Scilit]
- Shutaywi, M.; Kachouie, N.N. Silhouette Analysis for Performance Evaluation in Machine Learning with Applications to Clustering. Entropy 2021, 23, 759. [Google Scholar] [CrossRef] [Scilit]
- Stevenson, Z.; Fukasawa, R.; Ricardez-Sandoval, L. Evaluating Periodic Rescheduling Policies Using a Rolling Horizon Framework in an Industrial-Scale Multipurpose Plant. J. Sched. 2020, 23, 397–410. [Google Scholar] [CrossRef] [Scilit]
| Disclaimer/Publisher’s Note: The statements, opinions and data contained in all publications are solely those of the individual author(s) and contributor(s) and not of MDPI and/or the editor(s). MDPI and/or the editor(s) disclaim responsibility for any injury to people or property resulting from any ideas, methods, instructions or products referred to in the content. |





 ,
,