Article

Assessing a Semi-Autonomous Drone-in-a-Box System for Landslide Monitoring: A Case Study from the Yukon Territory, Canada


1
Applied Remote Sensing Lab, Department of Geography, McGill University, Montreal, QC H3A 0B9, Canada
2
Aerospace Research Centre, Flight Research Laboratory, National Research Council of Canada, Ottawa, ON K1V 2B1, Canada
3
Earth and Planetary Sciences Department, McGill University, Montreal, QC H3A 0E8, Canada
4
Yukon Geological Survey, P.O. Box 2703 (K-14), Whitehorse, YT Y1A 2C6, Canada
*
Author to whom correspondence should be addressed.
Sustainability 2026, 18(2), 693; https://doi.org/10.3390/su18020693
Submission received: 29 November 2025 / Revised: 5 January 2026 / Accepted: 7 January 2026 / Published: 9 January 2026
(This article belongs to the Special Issue Sustainable Assessment and Risk Analysis on Landslide Hazards)

Abstract

Technological innovation in commercial Remotely Piloted Aircraft Systems (RPASs) is advancing rapidly. However, their operational efficiency remains limited by the need for on-site skilled human operators. Semi-autonomous drone-in-a-box (DIAB) systems are emerging as a practical solution, enabling automated, repeatable missions for applications such as construction site monitoring, security, and critical infrastructure inspection. Beyond industry, these systems hold significant promise for scientific research, particularly in long-term environmental monitoring where cost, accessibility, and safety are critical factors. In this technology demonstration, we detail the system implementation, discuss flight-planning challenges, and assess the overall feasibility of deploying a DJI Dock 2 DIAB system for remote monitoring of the Miles Ridge landslide in the Yukon Territory, Canada. The system was installed approximately 2.5 km from the landslide and operated remotely from across the country in Montreal, QC, about 4000 km away. A total of five datasets were acquired from July to September 2025, enabling three-dimensional reconstruction of the landslide surface from each acquisition. A comparison of extracted cross-sections demonstrated high reproducibility and accurate co-registration across acquisitions. This study highlights the potential of DIAB systems to support reliable, low-maintenance monitoring of remote landslides.

1. Introduction

Landslides represent one of the most pervasive natural hazards in mountainous environments and occur when gravitational forces exceed the resisting strength of soil, regolith, or bedrock. Their initiation reflects the interplay of geological structures, hydrological conditions, geomorphology, and external triggers. Common drivers include rainfall [1,2], snowmelt [3], earthquakes [4], volcanic activity [5], forest fires [6,7], permafrost degradation [8], and anthropogenic disturbances such as road construction [9]. Although the physical basis of slope failure is well understood, forecasting the precise timing and location of failure remains challenging.
Monitoring unstable slopes typically relies on a combination of in situ instrumentation, periodic GNSS surveys, and passive remote sensing [10,11]. Interferometric Synthetic Aperture Radar (InSAR) has transformed detection of millimetre-scale deformation over large areas [12,13,14,15], while terrestrial and airborne LiDAR systems yield high-resolution characterizations of landslide morphology, displacement fields, and volumetric change [16,17]. Despite these advances, conventional monitoring approaches can be limited by revisit interval, cloud cover, cost, and the advanced analytical expertise required for interpretation. Furthermore, hazardous terrain and weather often restrict access for field personnel, complicating consistent data acquisition.
Remotely piloted aircraft systems (RPAS) have become essential tools in landslide research because they permit rapid deployment and provide centimetre-level spatial resolution. Photogrammetry and LiDAR from RPAS have been used extensively to map slope failures [18,19], detect precursory cracking [20], quantify solifluction [21], and support rapid emergency assessment [22]. However, such conventional RPAS operations have relied on in situ acquisitions where pilots and observers typically travel to or near the hazardous site, often under restrictive conditions (weather windows, access constraints, flight regulations). This limits their ability to obtain frequent or event-triggered observations, which are critical for understanding slope dynamics and precursory signals. In addition, deploying a team to conduct in situ data acquisitions often incurs substantial logistical and financial costs, especially when sites are remote, mountainous, or require complex travel arrangements.
Drone-in-a-box (DIAB) systems, also referred to as Robot-as-a-Service (RaaS) platforms, offer a potential solution to these challenges by enabling fully or semi-autonomous launch, recovery, charging, and data off-loading from compact, self-contained ground stations. Their technical foundations lie in advances in precision landing, automated battery replenishment or replacement, and environmental hardening, allowing systems to remain on site for months at a time. The RPAS component of DIAB systems offers a complementary advantage because their non-invasive, low-impact operation allows repeated monitoring where traditional field access is difficult or undesirable. A synthesis of a decade of docking-station research, highlighted that positioning systems, wireless charging, autonomous battery exchange, and protective storage modules are core components of modern DIAB infrastructure [23]. Recent technological progress has accelerated commercial adoption, with operational systems such as Optimus (American Robotics, Sparks, MD, USA) [24], Drone Network (Avy, Amsterdam, The Netherlands) [25], HubX (Sphere Drones, Sydney, Australia) [26], Energy Robotics BVLOS DIAB (Energy Robotics, Darmstadt, Germany) [27], X10 (Skydio, San Mateo, CA, USA) [28], and the Dock series (DJI, Shenzhen, China) [29,30,31]. Such DIAB systems have been deployed primarily in industrial and public-safety contexts, including automated overhead transmission-line inspections, thermal-hotspot and gas detection at solar farms and refineries, open pit mine monitoring [32,33], and radiological monitoring where human exposure must be minimized [34]. Innovations such as solar-powered charging stations have also been explored to further extend use in remote or infrastructure-poor regions [26,35].
Despite this commercial momentum, DIAB implementation remains underrepresented in the peer-reviewed scientific literature. Most research focuses on individual technical components such as precision-landing algorithms (e.g., visual marker–based guidance, infrared beacon trackers [36,37,38]), robust controller design [39], or power-management strategies including wireless charging and automated battery swapping [35,40,41]. Studies that evaluate complete DIAB systems under real operational conditions, particularly in environmental monitoring, natural hazards, long-term deformation tracking, or remote scientific deployments, are noticeably scarce.
Therefore, the novel objective of this study is to present a technology demonstration of the DJI Dock 2 DIAB system [42] for remote, low-maintenance monitoring of an active landslide in complex mountainous terrain. This demonstration represents one of the first scientific evaluations of DIAB technology for landslide monitoring and highlights opportunities and limitations for future scientific and operational use.

2. Materials and Methods

2.1. Study Site

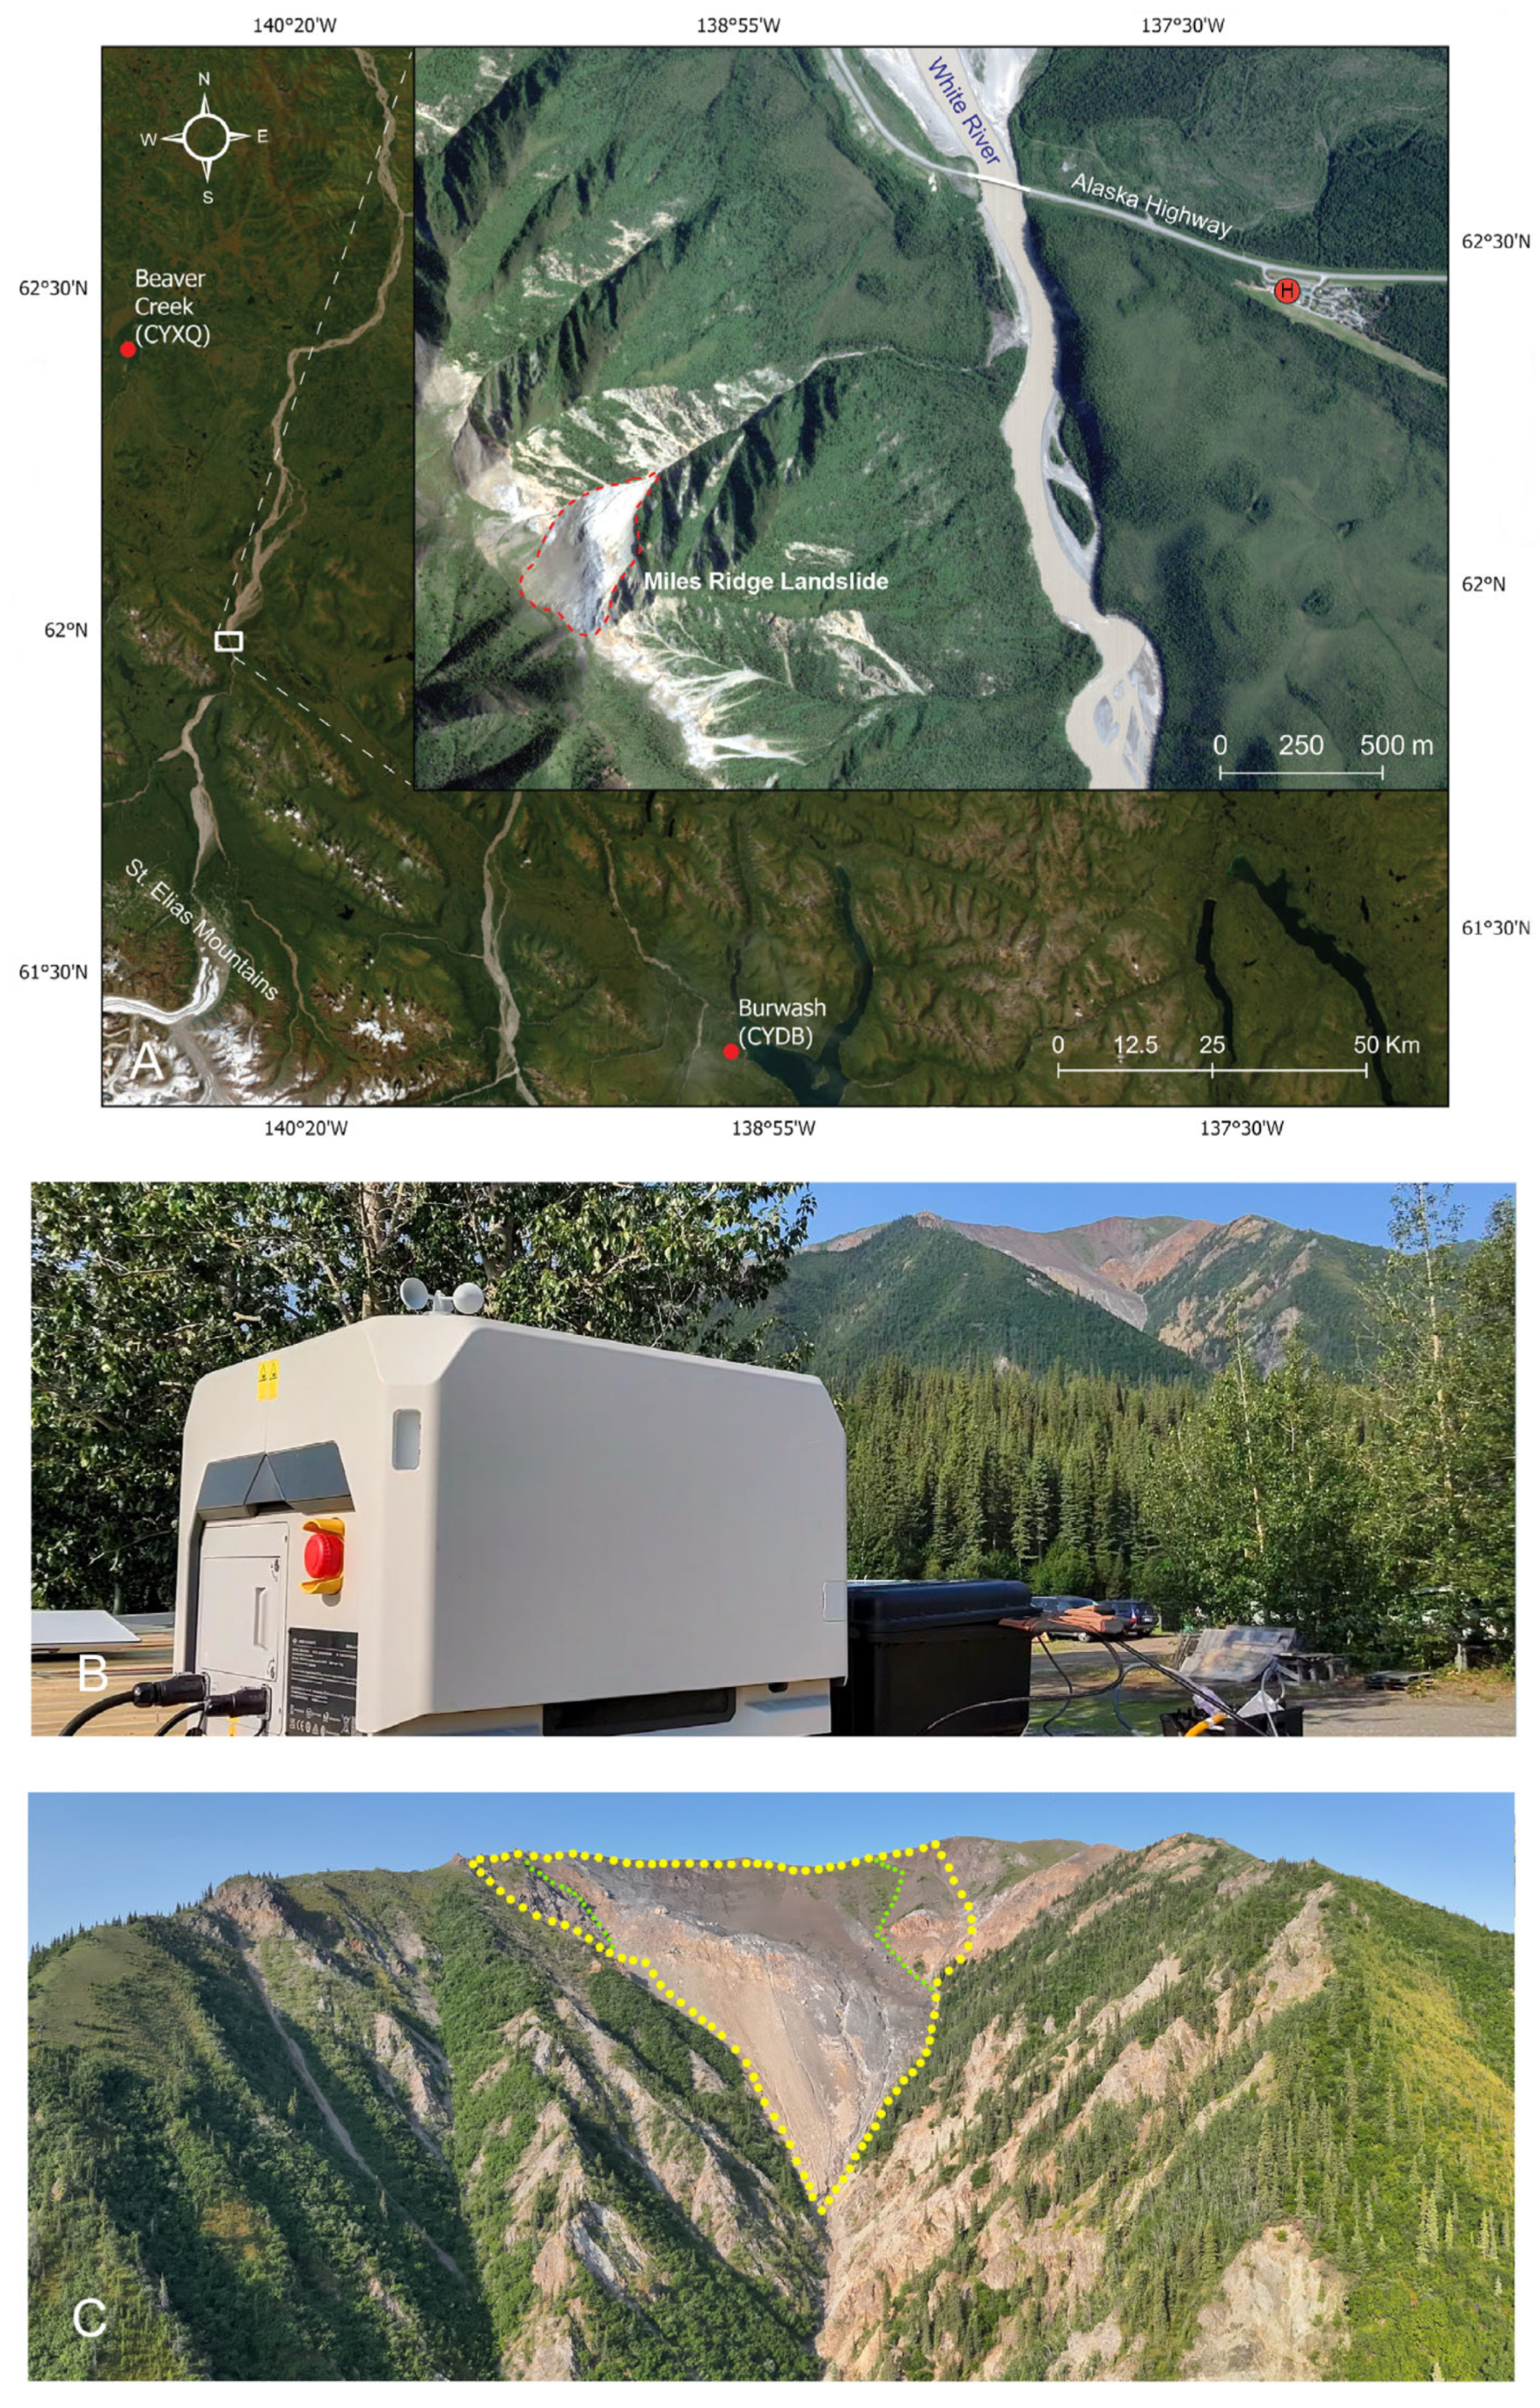
The study site for this technology demonstration is the Miles Ridge landslide near kilometer 1818 on the Alaska Highway, 50 km south of the town of Beaver Creek in the Yukon Territory, Canada (Figure 1). The Alaska Highway serves as the principal overland transportation corridor linking the State of Alaska to the contiguous United States through Canada. The area is geologically active due to a combination of factors including lithology, slope steepness, high regional seismicity [43], proximity to the Denali Fault, and degradation of permafrost under warming conditions. The ~400 m wide landslide head scarp is situated along the crest of Miles Ridge, which lies at the foot of the rugged St. Elias Mountains. The top of the ridge is at an elevation of ~1480 m ASL, rising ~780 m above the White River valley and Shakwak Trench below. The landslide extends a horizontal distance of ~580 m and a vertical distance of ~370 m and lies on a northeast-facing slope that averages 34° in steepness [44]. For our study, the straight-line distance between the head scarp (farthest point of interest) and the installation of the Dock 2 was 2.55 km (1.37 NM) (Figure 1). The landslide and surrounding area to be monitored was 15 ha. The landslide is located within a package of volcanic and highly altered ultramafic rocks which are bounded between a set of faults considered to be within the Denali Fault system [44]. The Denali Fault itself is a major right-lateral strike slip fault that runs in a northwest-southeast direction along the base of Miles Ridge, approximately 1.5 km to the northeast of the landslide.
No evidence of landslide activity on Miles Ridge was found in 1988 aerial photographs [44]. The White River First Nation first observed slope movement at the site in the early 1990s and reported further changes following the 3 November 2002, M7.9 Denali Fault earthquake, which was one of the largest inland earthquakes in North America [45,46]. The region remains highly seismically active; for example, ref [43] reported more than 40,000 earthquakes between 2010 and 2023. The most recent large regional earthquake (M7.0) occurred on 6 December 2025, approximately 188 km south of Miles Ridge. A set of rebar monuments and wooden stakes were installed on site in 2007 to monitor ground deformation through subsequent ground-based differential GPS surveys [44]. The site was resurveyed once in 2010 but had not been revisited until 2025 [47] due to the high cost of helicopter access and site safety concerns, including the presence of slumping and fresh tension cracks above the head scarp [47], rockfall periodically observed 2.5 km away from Discovery Yukon Lodgings, and small debris flows on the lower portion of the landslide [44]. These combined factors make this an ideal site for RPAS-based surveying.

2.2. DJI Dock 2 and Matrice 3TD

The DJI Dock 2 is a fully integrated DIAB system designed for automated operations. It is primarily composed of two hardware components: the Dock itself, which provides weather-resistant housing, automated charging, and environmental monitoring, and the Matrice 3D/3TD (DJI, Shenzhen, China) aircraft, a compact quadrotor drone developed specifically for the Dock 2. Together, these components enable remote and repeatable data collection missions through cloud-based or in situ scheduling and monitoring.
The Dock weighs approximately 34 kg and is rated IP55 for dust and water ingress protection. It can operate within a temperature range of −25 °C to 45 °C [42]. As described in [48] installation requires continuous AC power (see Section 2.3.2) and a stable Ethernet-based network connection (see Section 2.3.3). An internal lead-acid backup battery provides sufficient power for the aircraft to return and land in the event of a power outage. The Dock also includes an integrated weather station that continuously monitors internal and external air temperature, humidity, precipitation, and wind speed. Both the rainfall and wind-speed gauges are self-heating. Thermal regulation inside the Dock is achieved via a solid-state thermoelectric cooler (TEC) that provides both heating and cooling to maintain the aircraft and its battery within a safe operating temperature range. Heating strips along the Dock’s cover seam prevent freezing during cold weather. Dual internal and external cameras enable visual monitoring of aircraft take-offs and landings.
When the aircraft lands, the V-shape of the landing platform allows it to slide into the correct position for closure of the Dock doors. A wireless charging module under the landing platform charges the aircraft battery from 20–90% in ~32 min. To facilitate landing, the Dock employs an image-based recognition system supplemented with Real-Time Kinematic (RTK) positioning, which also functions as an RTK base station for flight operations. The positional accuracy of the RTK base station is specified as 1 cm + 1 ppm (RMS) horizontally and 2 cm + 1 ppm (RMS) vertically [42]. Given that the crest of Miles Ridge was located 2.55 km from the Dock installation, the distance-dependent term contributes up to an additional 2.5 mm to the total, resulting in expected base station positional accuracies of approximately 1.26 cm horizontally and 2.26 cm vertically (1σ) at the farthest point.
The aircraft used with the Dock 2 was a DJI Mavic 3TD (Table 1), hereafter referred to as M3TD. As described in [42] it is equipped with both vision and infrared sensing systems for six-direction obstacle avoidance. It also incorporates DJI AirSense, which alerts the remote pilot to nearby crewed aircraft broadcasting Automatic Dependent Surveillance–Broadcast (ADS-B) signals within approximately 10 km of the M3TD. The onboard GNSS + RTK modules support GPS, GLONASS, BeiDou, and Galileo global navigation satellite constellations. Communication between the aircraft and the Dock 2 is through the DJI OcuSync 3 Enterprise digital transmission system responsible for command/control, telemetry, and real-time video downlink. The lowest video transmission latency from aircraft to Dock 2 is 100–150 ms but can be affected by local environmental conditions. The latency between the Dock and FlightHub 2 (and the remote pilot’s workstation) depends on the network conditions. The integrated M3TD payload has three imaging sensors [42]:
  • A wide-angle RGB camera with a 1/1.32-inch CMOS sensor (48 MP effective; 8064 × 6048 pixels) with an f/1.7 lens and 84° field of view (FOV);
  • A telephoto RGB camera incorporating a 1/2-inch CMOS sensor (12 MP effective; 4000 × 3000 pixels) with an f/4.4 lens and 15° FOV supporting 8× mechanical (56× hybrid) zoom;
  • A radiometrically calibrated thermal infrared camera based on an uncooled vanadium-oxide (VOx) microbolometer with 12 µm pixel pitch, 61° FOV, and thermal sensitivity ≤ 50 mK @ f/1.0.

Table 1. Main characteristics of the DJI Mavic 3DT [42].
CharacteristicValue
Takeoff weight (kg)1.41
Maximum flight speed (m/s) in normal mode15 (forward), 12 (backward), 10 (sideways)
Service ceiling (ft ASL) | (m ASL)13,123 | 4000
Maximum ascent speed (ft/min)|(m/s)1181 | 6
Dimensions without propellers (mm)335 (L) × 398 (W) × 153 (H)
Operating temperature (°C)−20–45
Maximum wind resistance (in flight) (m/s)12
Maximum wind resistance (takeoff/landing) (m/s)8
Maximum flight time | hover time (min)50 | 40
Maximum operating radius (km)10
Ingress protectionIP54
Although the telephoto camera (162 mm format equivalent) offers considerable imaging potential, its photographs are not RTK-precision geotagged and are therefore unsuitable for high-accuracy mapping applications. Consequently, only the wide-angle camera was used for mapping.

2.3. Installation

The installation was designed to remain fully functional and secure under variable weather conditions, prevent access by wildlife or unauthorized individuals, meet signal-quality requirements, and retain the flexibility to be relocated between sites. Prior to installation, a DJI Mavic 3 Enterprise drone (DJI, Shenzhen, China) was used to perform the built-in Dock Site Evaluation routine within the Pilot 2 flight control application. This routine uses the aircraft’s onboard camera to verify that no obvious signal obstructions exist within a 20° field of view from the proposed installation location. If an obstacle is detected, it must satisfy the distance (d) constraint in meters according to Equation (1) [48]:
d   h 0.36
where h is the height of the obstacle (in meters).
During the site evaluation, the aircraft also conducts a GNSS signal quality survey. To satisfy the above-mentioned criteria, the Dock 2 was installed on top of a standard 40 ft (L) × 8 ft (W) × 8.5 ft (H) shipping container (Figure 2). The elevated position eliminated the need for a safety fence.

2.3.1. Physical Installation

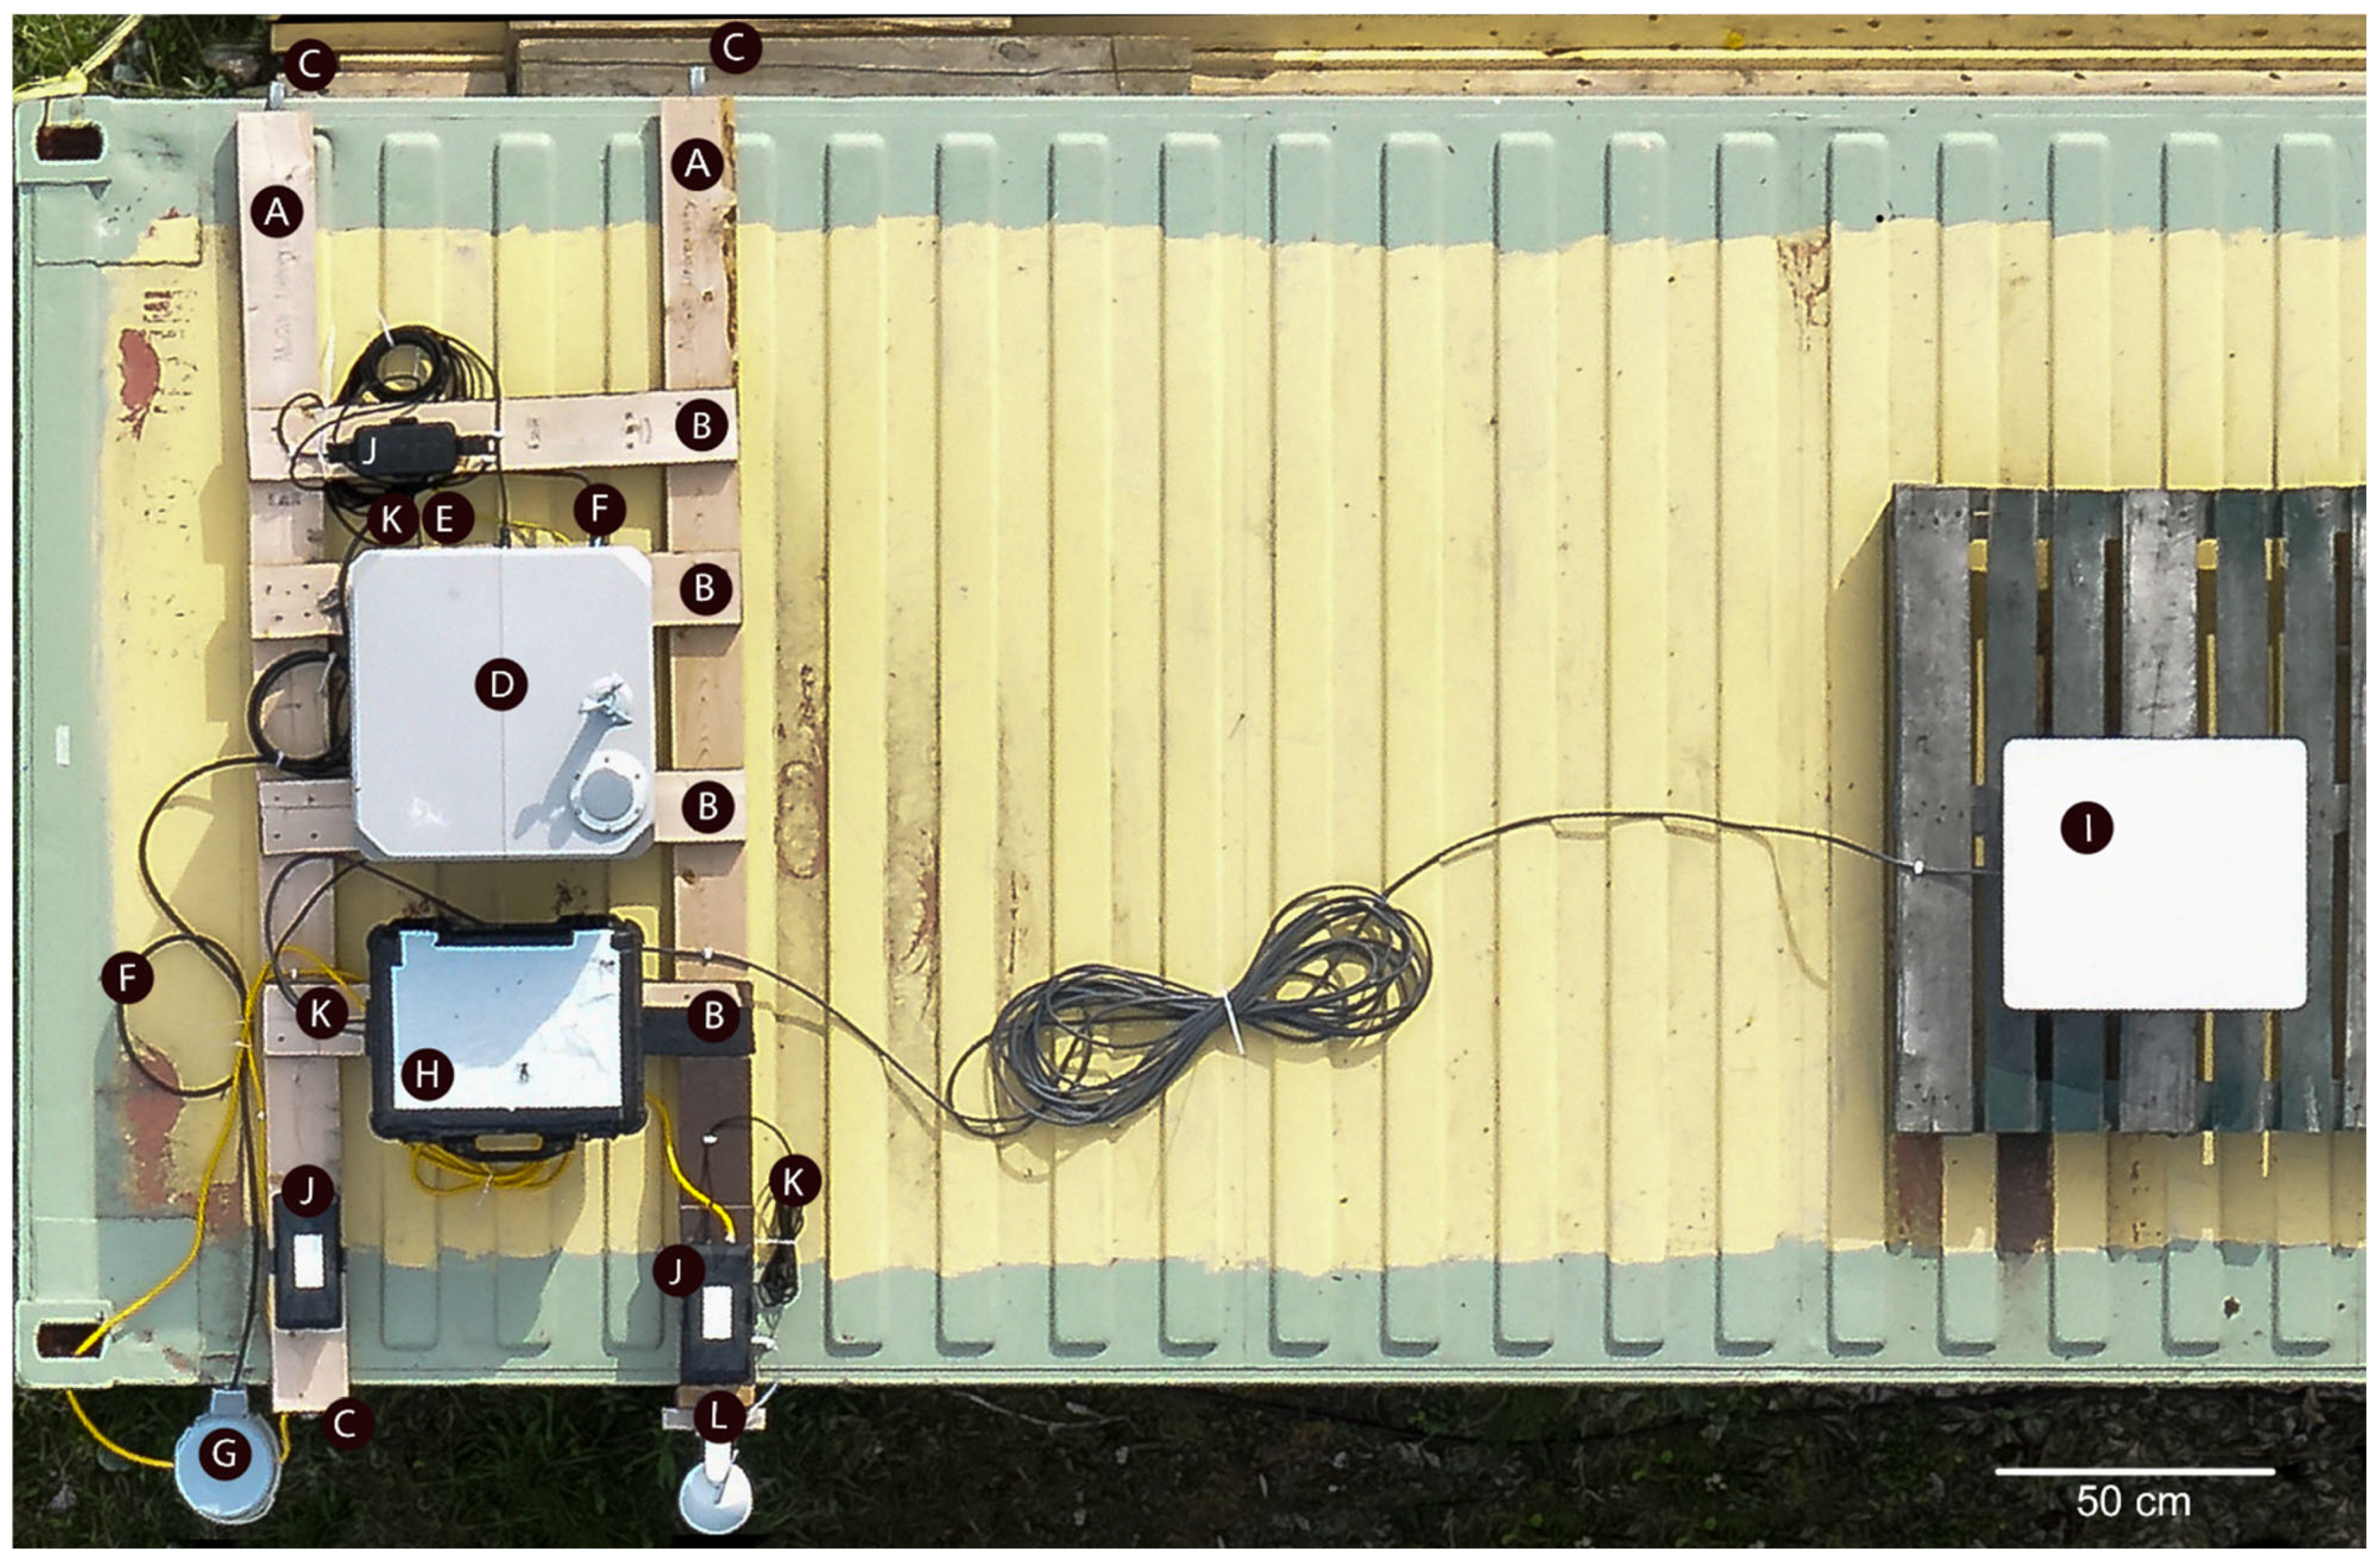
To provide a stable and transportable platform for the Dock 2 installation, a custom wooden base was constructed to fit the top of the shipping container. The base was built from two pieces of 2 × 6 lumber (5 × 15 cm), the standard dimensional size commonly used in Canada and the USA. Their standard length of 240 cm (8 ft) matched the width of the container (Figure 2: A). The two beams were joined by four 80 cm crosspieces (Figure 2: B) of the same material to form a baseplate onto which the Dock 2 and its peripherals were mounted. The ends of the lumber were secured to the container using Everbilt (Everbilt, Forest Park, OH, USA) steel strap hooks (Figure 2: C) that clamp onto the container’s edges, preventing wind-induced movement of the installation. The Dock 2 (Figure 2: D) was fastened to the wooden baseplate with twelve 5 cm deck screws. A self-tapping screw was used to attach the Dock 2 ground wire (Figure 2: E) to the top of the separately grounded container. The container had been independently grounded; however, if it had not been, a dedicated ground wire and grounding rod would have been required [48].

2.3.2. Power

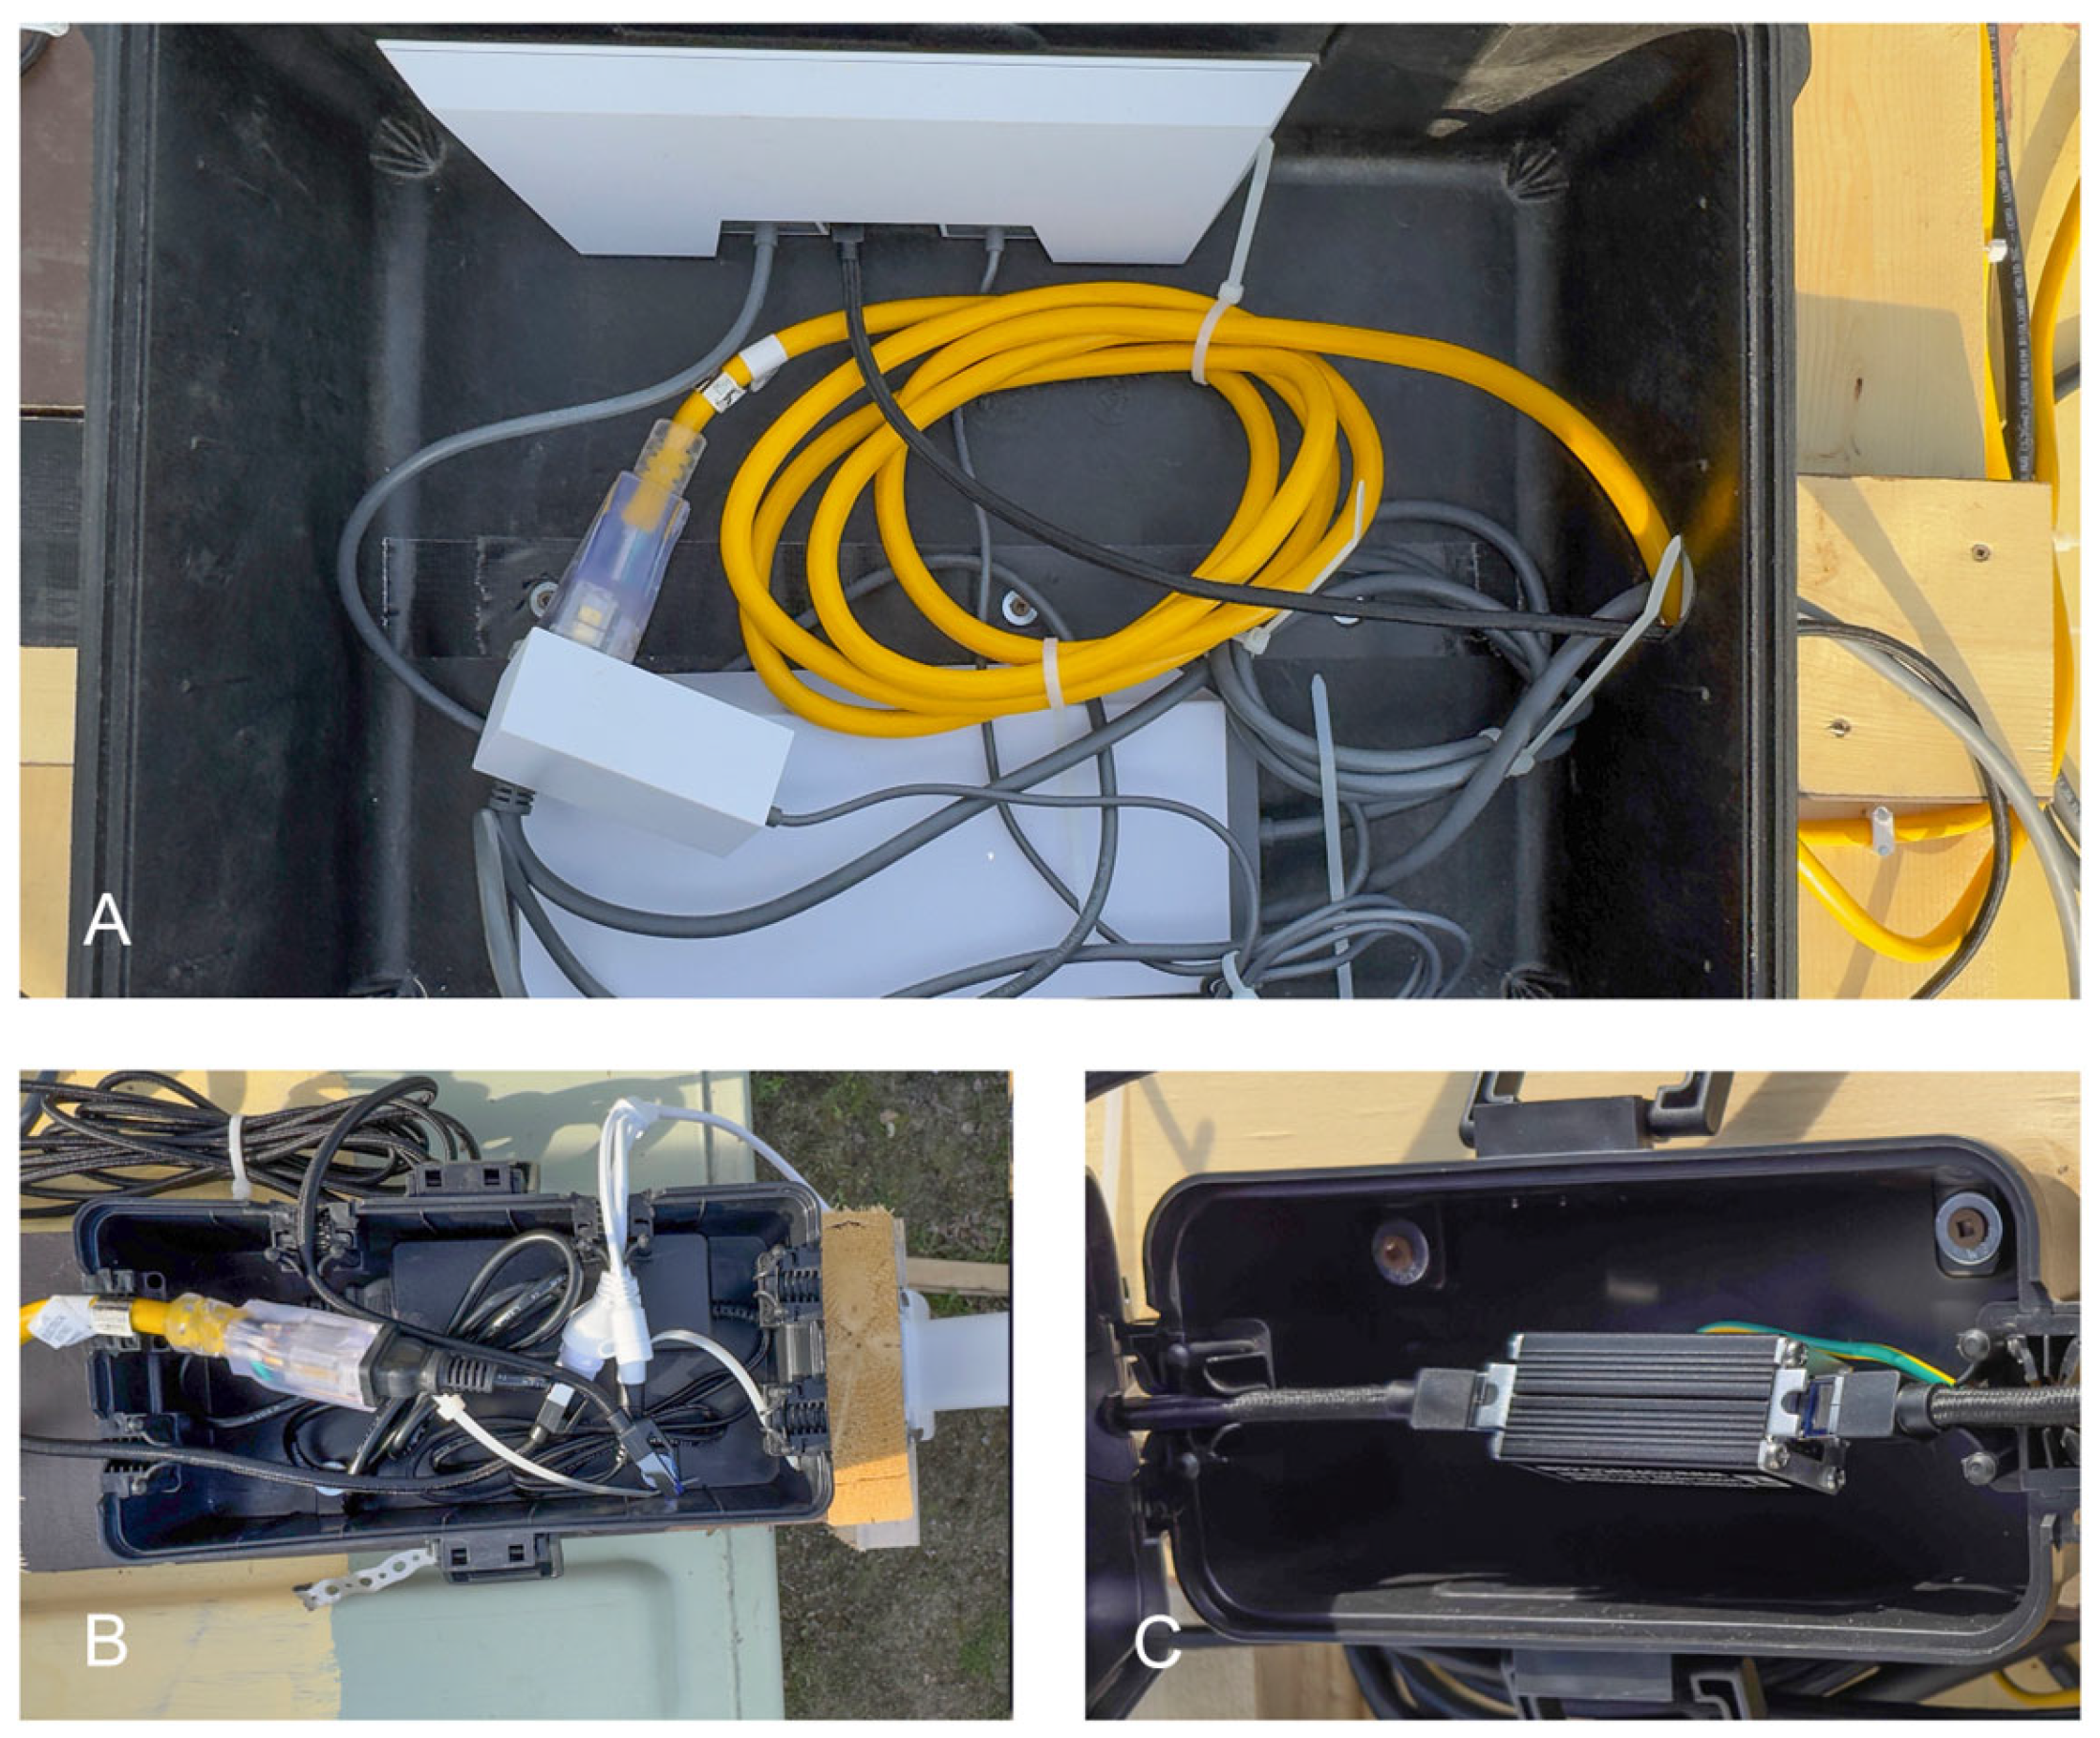
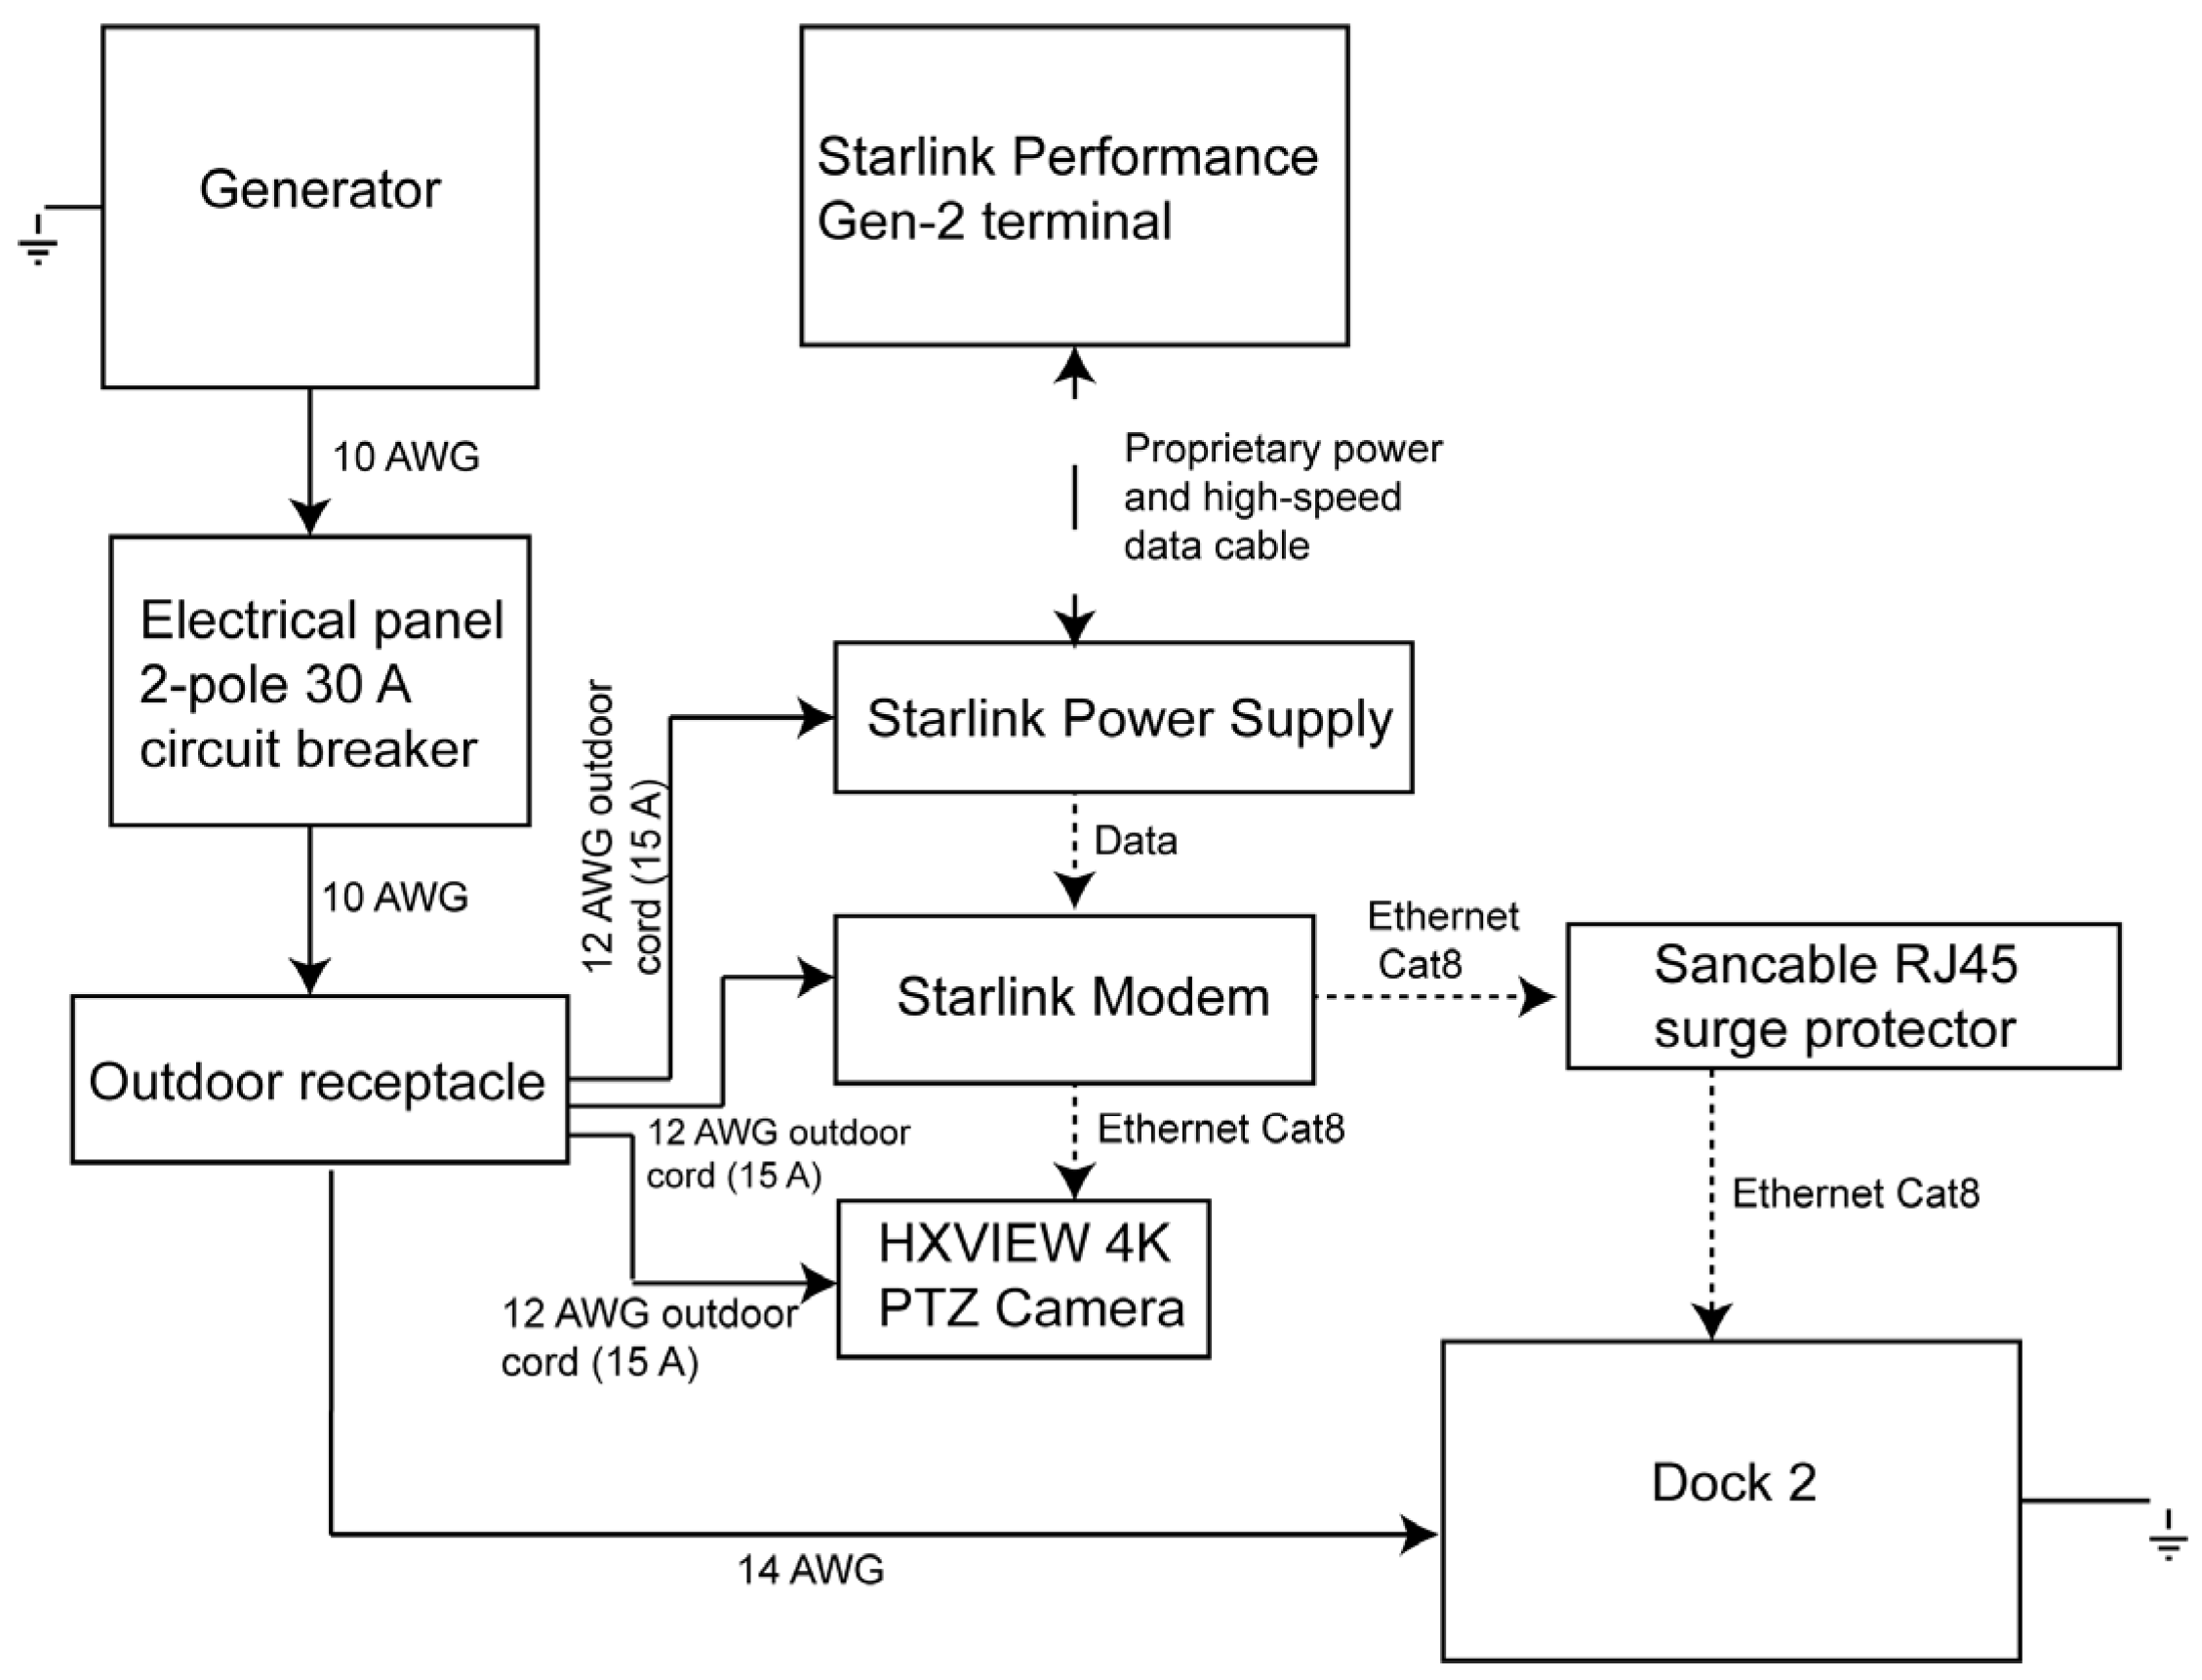
The Dock 2 requires external AC power (maximum power draw of 1000 W) connected to a dedicated 2-pole 16 A circuit breaker and protected by a 40 kA surge suppression device [48]. Although the installation manual recommends 1.5 mm2 cross-sectional area three-core sheathed copper cable (approximate 16 AWG equivalent) for runs under 100 m, a 10/3 Romex (10 AWG) cable was used instead to reduce voltage drops. The 10 AWG line was connected to a dedicated 2-pole 30 A circuit breaker in a nearby electrical panel, supplying power to a waterproof outdoor receptacle mounted on top of the container (Figure 2: G). From this receptacle, 14 AWG wire was routed to the Dock 2 via its standard power connector. The receptacle also supplied power to a Starlink satellite internet system and a security camera (see Section 2.3.3) via 12-gauge, 15 A outdoor-rated extension cords. Because the power plugs for the modem and camera were not waterproof, their connections to the extension cords were enclosed within waterproof electrical boxes mounted to the baseplate (Figure 3). Details of the power distribution are also shown in the functional block diagram in Figure 4.

2.3.3. Network

The Dock 2 requires a low-latency Ethernet connection using IPv4 protocols and a minimum Cat 6-rated cable for proper operation [48]. The built-in 4G wireless backup was not utilized because the landslide site lies outside any cellular data coverage area. Instead, the system was connected to a Starlink-powered satellite internet network (SpaceX, Bastrop, TX, USA), providing a stable high-bandwidth link for remote monitoring and control (Figure 2: I). A Sancable RJ45 (Sheng’an Nuo Technology Co., Ltd, Huizhou City, China) surge protector, housed in a waterproof electrical box, was installed in-line between the Dock 2 and the Starlink modem to safeguard against lightning-induced power fluctuations (Figure 3C). The Starlink modem and power supply were enclosed within a Pelican 1550 case secured to the baseplate with three screws (see Section 2.3.1, Figure 2: H). A 5 cm side opening allowed the Cat 8 Ethernet and power cables to pass through, and the case top was covered in white plastic to reduce the chance of the modem or power supply overheating. The Starlink Performance Gen-2 terminal was attached to a standard pallet placed nearby on the roof of the container to maximize sky visibility (Figure 2: I). A second Ethernet connection from the Starlink modem linked to an HXVIEW 4K PTZ (Pan-Tilt-Zoom) outdoor security camera (HXView, Shenzhen, China) with 30× optical zoom and integrated audio, oriented toward Miles Ridge (Figure 2: L). Given that the pilot-in-command was at times located ~4000 km from the Dock system, real-time situational awareness of meteorological conditions on Miles Ridge and potential local air traffic (e.g., helicopters), as well as reliable communication with visual observers, was critical. Details of the data communication pathways are also shown in the functional block diagram in Figure 4.
Provided that the power supply is already established (e.g., circuit breaker installed), the hardware installation can be finished in less than a day, using a forklift to lift the Dock 2 onto the container roof.

2.3.4. Position Calibration and Alternative Landing Site

During installation, the absolute position of the Dock 2 was established through manual calibration [48]. Because the deployment site is outside of network RTK coverage, absolute positioning was determined using an Emlid RS2 GNSS receiver (Emlid Tech KFT, Budapest, Hungary). The Dock cover was opened, and the RS2 was mounted on a tripod centred above the RTK positioning marker on the internal platform above the electrical cabinet. A plumb bob suspended from the tripod ensured precise collinearity between the antenna phase centre and the marker. GNSS observations were recorded over a 12.5-h session and post-processed using Natural Resources Canada’s Precise Point Positioning (PPP) service [49]. The derived coordinates with total uncertainties of 2.3 cm (X), 3.3 cm (Y), and 2.8 cm (Z) were then used to manually calibrate the Dock’s absolute position (accounting for the vertical offset between the RS2 and the marker). An alternate emergency landing site, required when the aircraft cannot land in the Dock, was designated within the grass field beside the shipping container.

2.4. Flight Planning

2.4.1. FlightHub 2

Flight planning, deployment with remote pilot oversight and preliminary analysis were all conducted via the FlightHub 2 cloud computing platform [50]. FlightHub 2’s information security management system is certified to the ISO/IEC 27001 standard which ensures preservation of confidentiality, information integrity, and data availability [51].

2.4.2. Flight Plan Development

To remain compliant with the Canadian Aviation Regulations, Part IX 901.25(1)(a), the flights needed to remain below 400 ft (122 m) above ground level (AGL). Flights above this altitude require a Special Flight Operations Certificate, in this situation under Standard Scenario 3 (STSC-003) [52]. The area around Miles Ridge is in Class G (uncontrolled) airspace. The nearest registered aerodromes are Beaver Creek (CYXQ) 48.9 km to the north, Burwash (CYDB) 106.7 km to the south and Horsfeld Alaska (4Z5) 32.4 km to the west. The property where the Dock was installed has a private airstrip, which is an unregistered aerodrome (i.e., not registered with Transport Canada) that does not appear in the Canada Flight Supplement. During the Dock installation, the airstrip was in use by two helicopters transporting equipment and staff for mineral exploration.
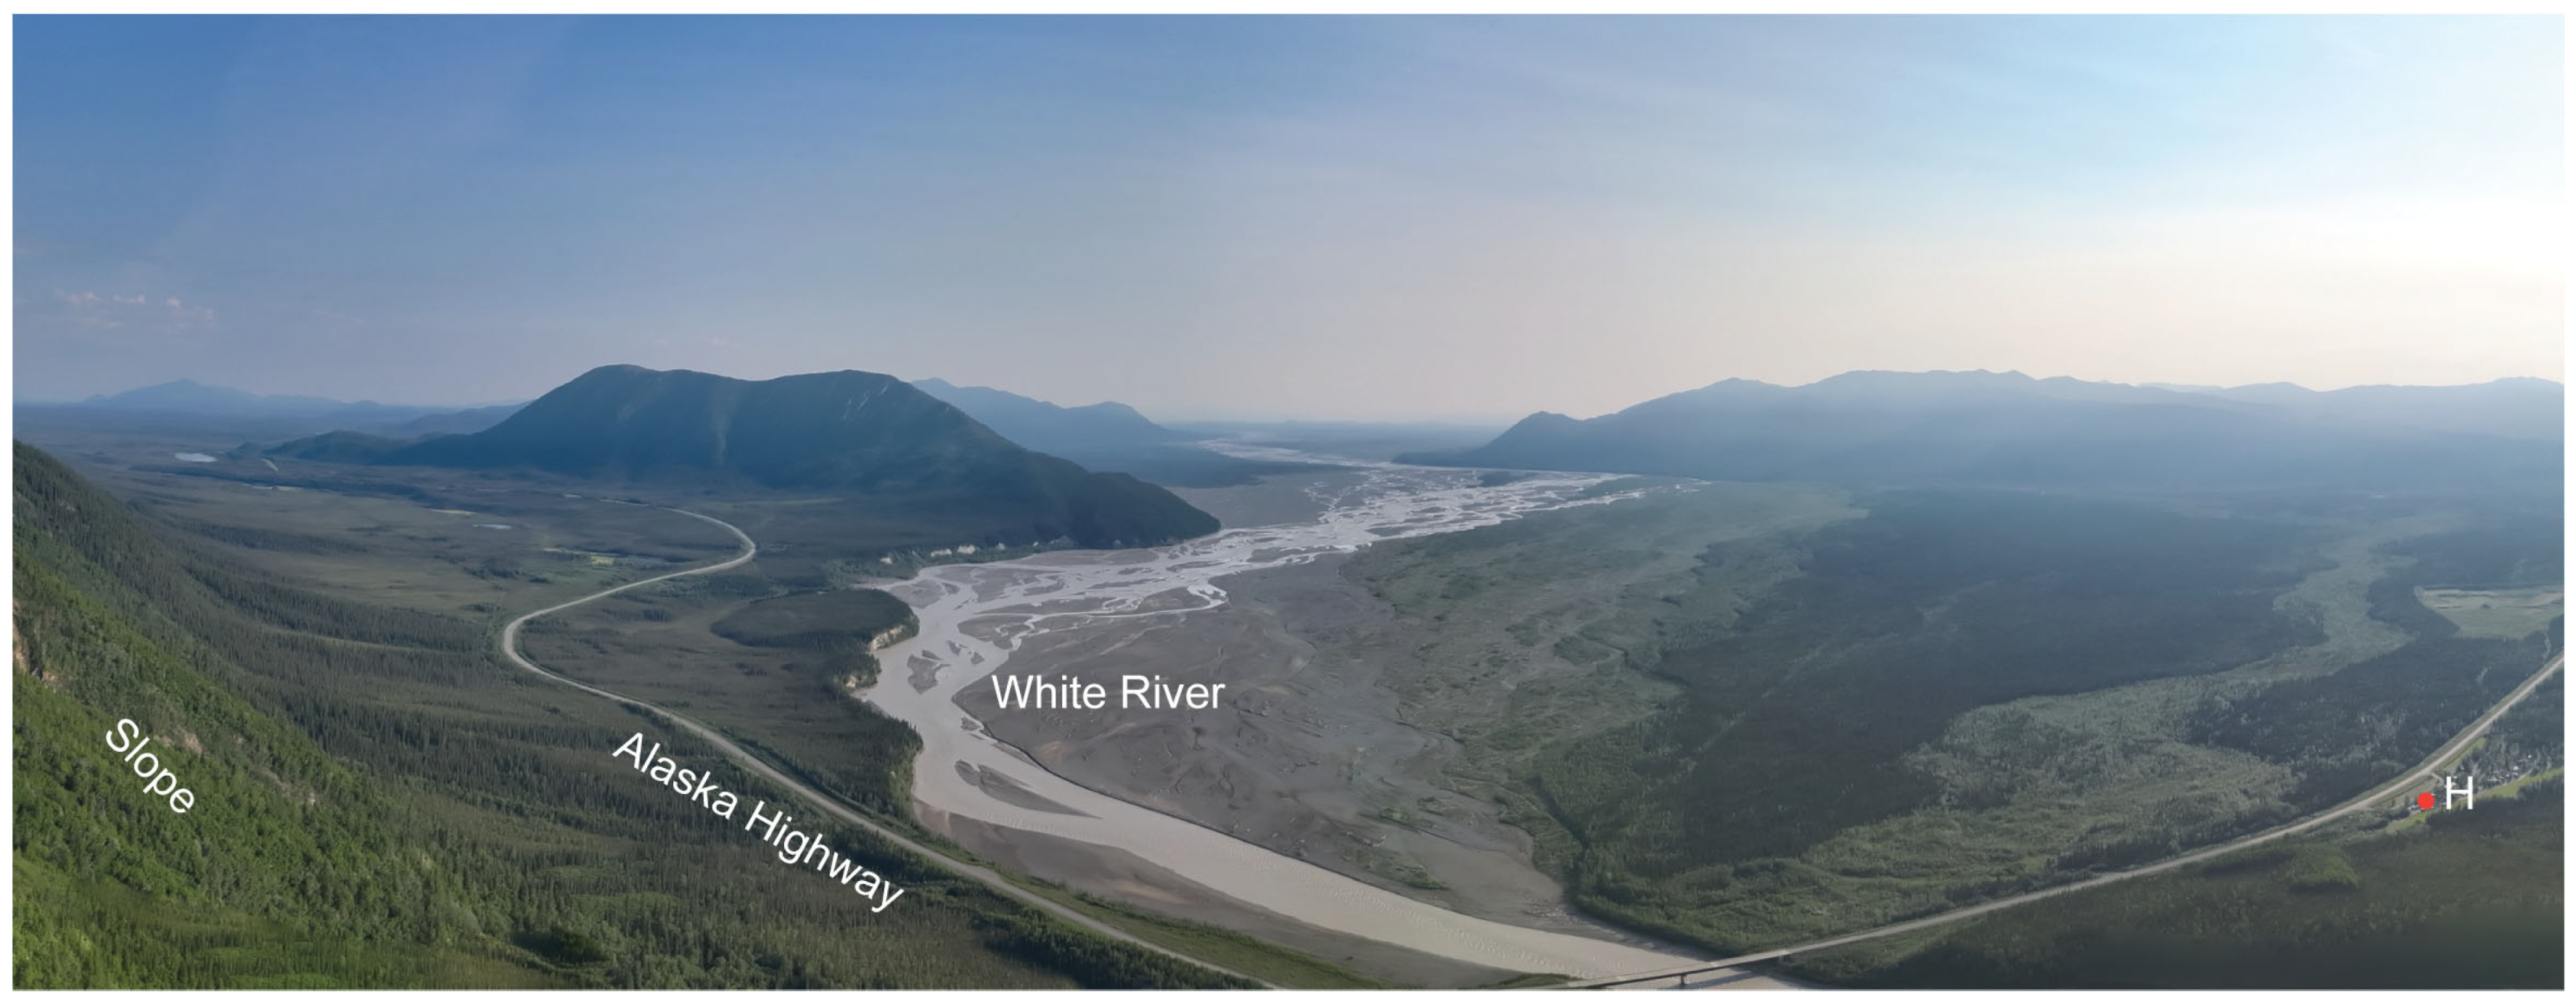
One of the initial flight planning challenges involved the nearly 800 m elevation difference between the installation site and the target landslide area (Figure 5). The terrain model used in FlightHub 2 is based on the platform’s built-in global elevation dataset (provider and specifications not publicly disclosed). Comparisons with multiple independent digital elevation models revealed elevation discrepancies of up to 15 m, and this area is not covered by territorial airborne LiDAR data. Consequently, to accurately determine the elevation of the forest canopy on a small ridge between the installation site and the base of Miles Ridge, a photogrammetric survey was conducted using the M3TD.
The built-in mapping mission templates, such as the Slope Mapping mode, automatically optimize flight-line spacing and camera-triggering intervals; however, they do not permit customized transit altitudes between the Dock and the survey area. If such a mission type had been used, the M3TD would have ascended to the take-off altitude and traveled directly toward the mapping area at that altitude. Given that the highest portion of the mission is located at approximately 1300 m height above ellipsoid (HAE), the aircraft would have transited toward the landslide area at roughly 650 m AGL. Upon completing the mapping at the base of the slope (~1000 m HAE), the return-to-home path would have been at approximately 300 m AGL; both paths exceeded the maximum permitted flight altitude. Likewise, a waypoint mission defined at a custom altitude cannot be combined with a mapping mission, as is possible in third-party flight planning software such as UgCS v.5.11.2 (8103) (SPH Engineering, Riga, Latvia). However, within UgCS, other critical flight planning parameters such as aircraft yaw (discussed below) are not preserved upon export to FlightHub 2, thereby negating interoperability between the two platforms for this application.
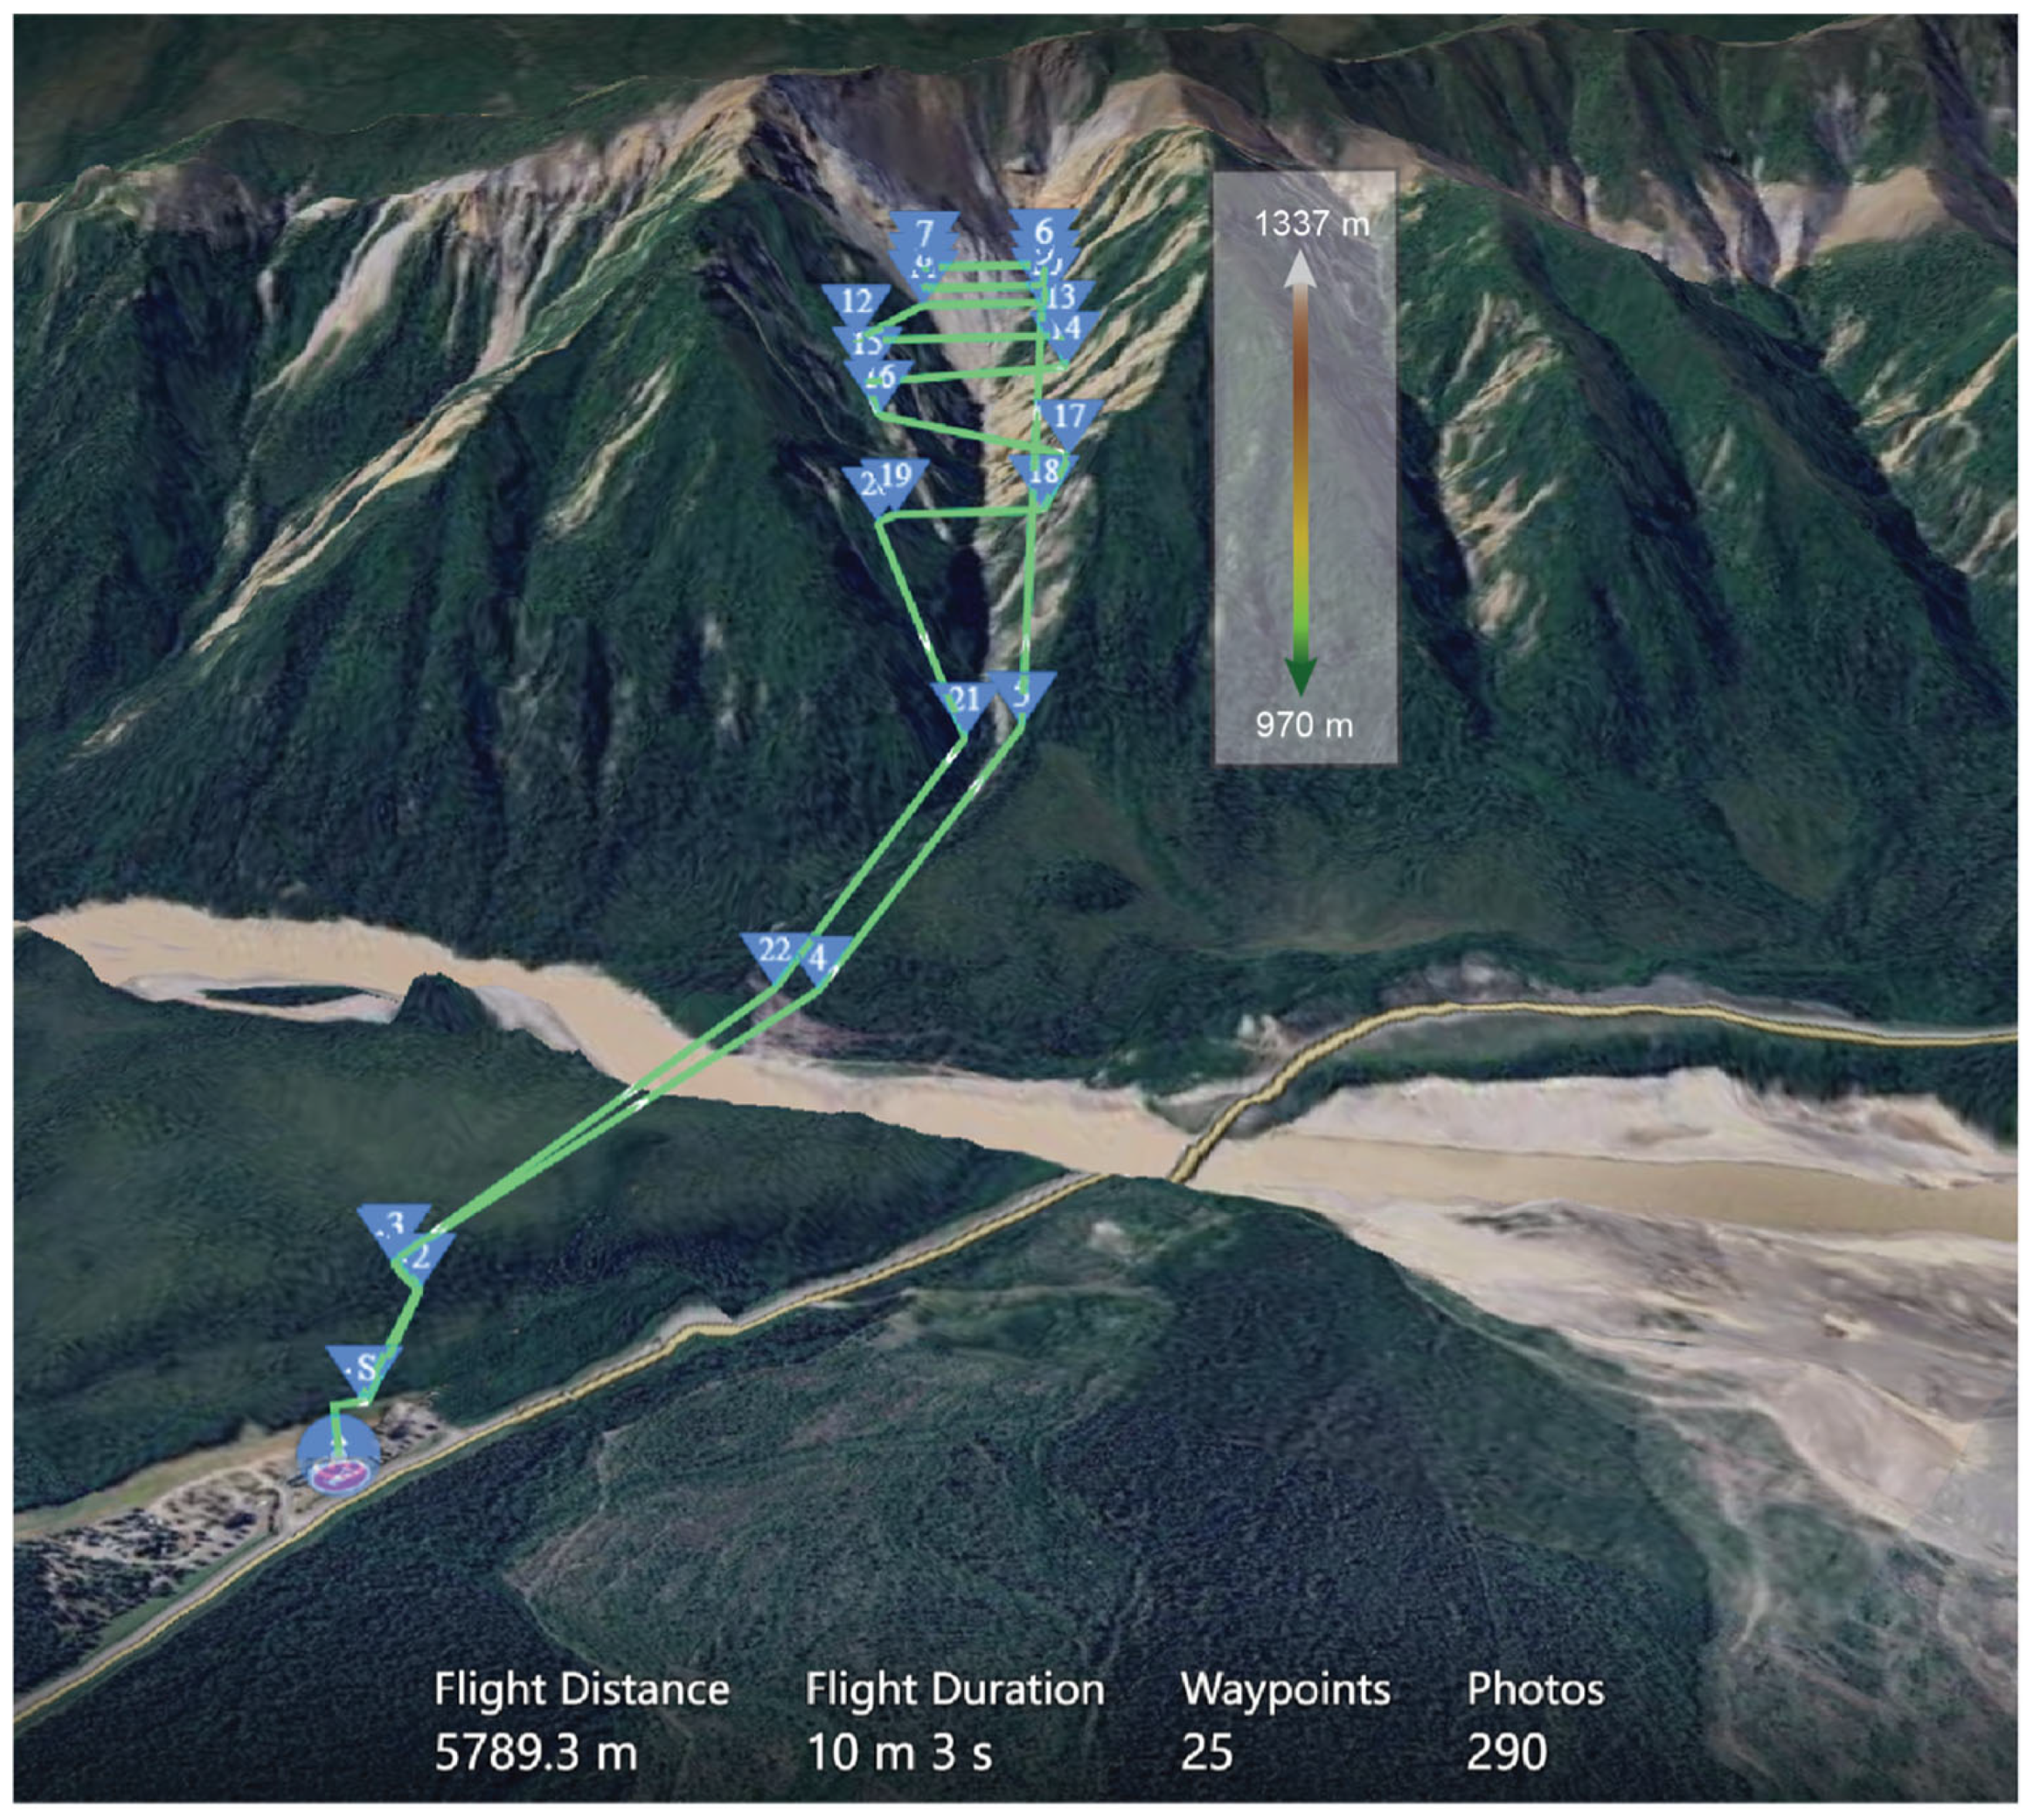
To overcome these limitations, the entire mission was planned as a waypoint mission, with flight-line spacing and waypoint coordinates first determined in ArcGIS Pro (v 3.5). The mission layout was then manually recreated in FlightHub 2 and refined by adjusting the position and altitude of each waypoint and specifying custom waypoint actions. This approach ensured that the aircraft maintained an altitude less than 122 m AGL throughout the mission. The entire mission was flown at a programmed ground speed of 10 m/s, corresponding to the maximum sideways flight speed of the M3TD (Table 1). During the survey, the aircraft ascended to the highest elevation (~1337 m HAE; waypoint 6) and traversed the landslide surface laterally in a cross-slope pattern, flying sideways and backward downslope while maintaining the camera’s orientation toward the slope (Figure 6). The wide-angle camera was configured to trigger once per second between waypoints 5–19, and the gimbal pitch angle was varied between flight lines to ensure full coverage of the landslide surface. To prevent the aircraft spending excessive time at high altitude while attempting to reach precise waypoint positions under high-wind conditions, as would occur if photographs were triggered at fixed distance intervals, the 1-s time-based triggering mode reduced the number of required waypoints and helped keep the overall flight time to a minimum. During transit from take-off to waypoint 6, and again between waypoints 20–25, the aircraft flew forward to and from the survey area. Under ideal wind conditions, the flight duration was estimated at 10 min with a total travel distance of 5789 m and 290 photographs to be acquired (Figure 6). Upon returning to the home point, once inside the Dock 2, the M3TD automatically transfers the photographs to the Dock’s internal hard drive, which then uploads them directly to FlightHub 2. Given that this was a technology-demonstration project with limited prior knowledge of wind and turbulence conditions at altitude, flight lines were intentionally kept well back from the ridge. With repeated flights and improved understanding of the site’s atmospheric conditions, future missions could be planned to position the aircraft closer to the ridge crest.

2.5. Model Evaluation

The data acquisition window extended from mid-July to early September 2025. After each flight, 3D mesh models (B3DM—Batched 3D Model format) were generated in FlightHub 2 for immediate quality control online. Although FlightHub 2 includes built-in online visualization and limited analytical tools, the outputs from the analytical tools (e.g., cross-sections) cannot be downloaded. Consequently, to evaluate temporal consistency, models were processed locally with DJI Terra v.5.0.2 (DJI, Shenzhen, China), producing both solid meshes in .i3s (Indexed 3D Scene Layer) format which is compatible with GIS software and as point clouds in .las format. The .i3s files from three acquisition dates were converted to .las in ArcGIS Pro v.3.5.3 (ESRI, Redlands, CA, USA) since the i3s format stores geometry in a tiled, compressed, multiresolution structure optimized for visualization without direct access to elevation values (as a raster would provide). Finally, temporal consistency was assessed by comparing cross-sections of the landslide surface using the resulting low-density ArcGIS Pro generated .las files in QT Modeler v.8.4.3.1.1 (Applied Imagery, Chevy Chase, MD, USA). The ArcGIS Pro generated .las files were used for the cross-sections instead of the originals because in Terra, construction of the mesh model includes extensive point cloud cleaning (e.g., outlier removal), triangulation, smoothing, and decimation before the original RGB photographs are reprojected onto the surface to create the mesh product; the original .las files do not have this preprocessing applied.

3. Results

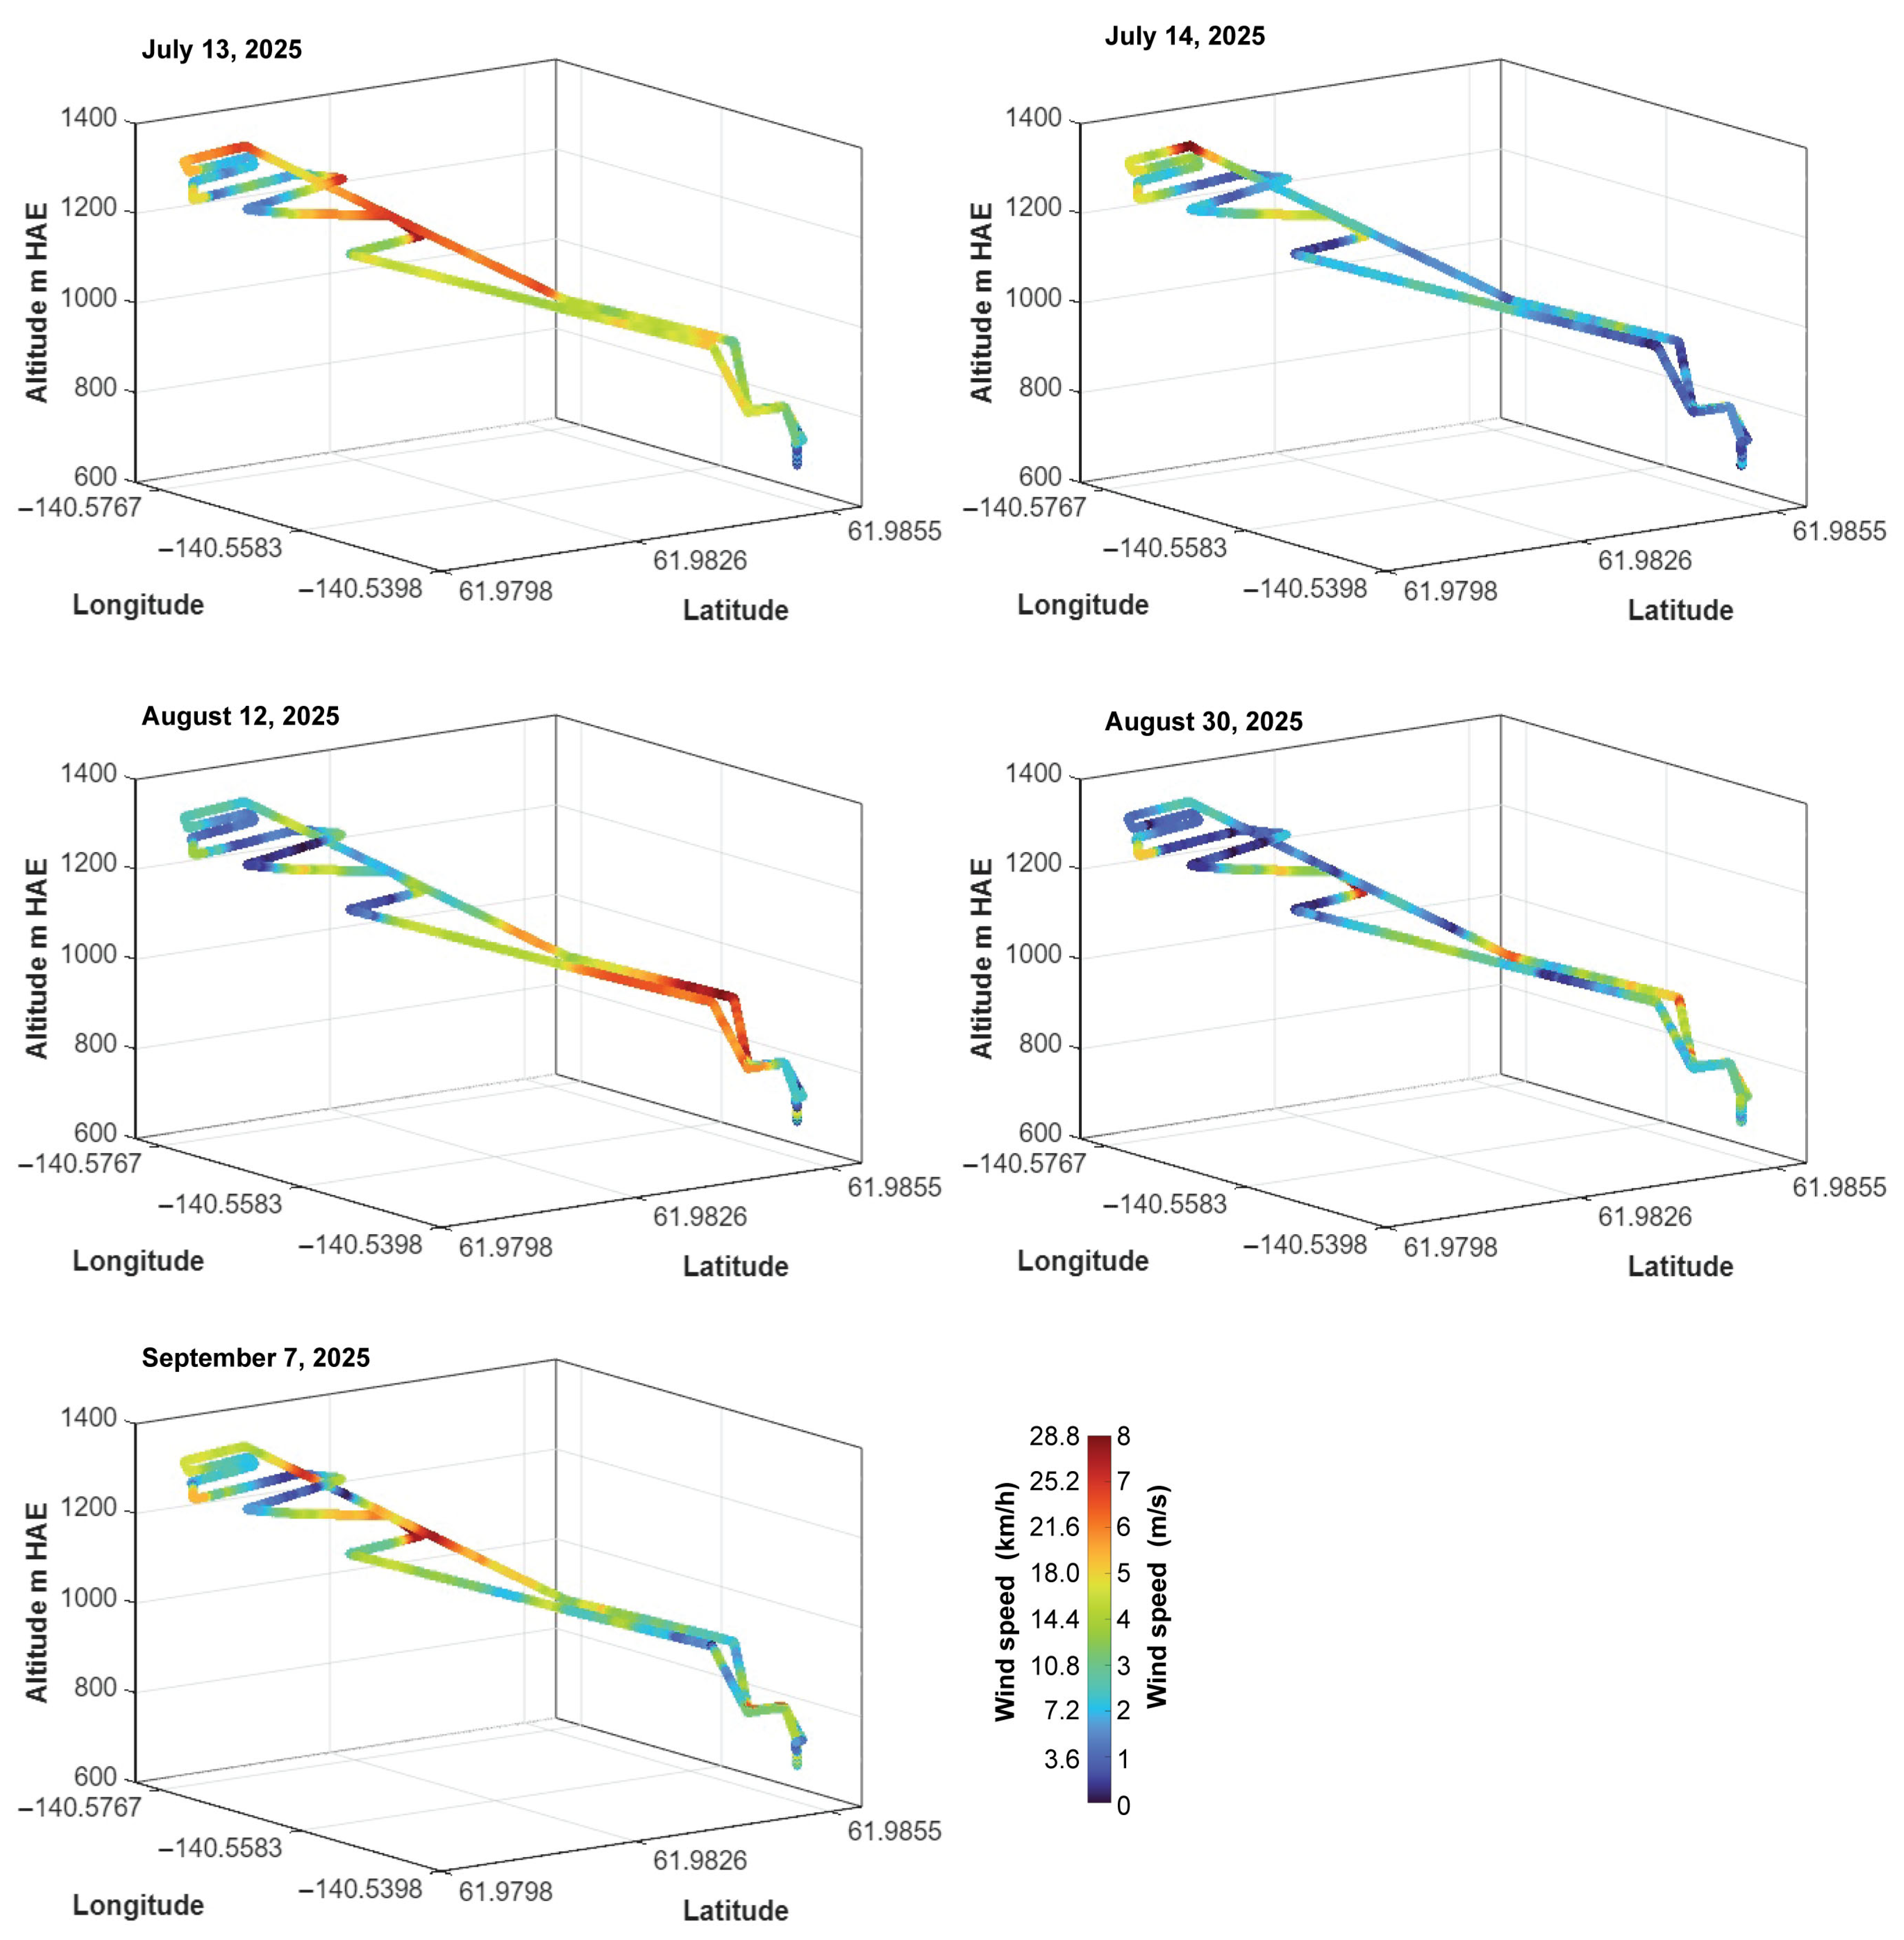
A total of five full model acquisitions were carried out according to the final flight plan between 13 July and 7 September 2025 (Table 2). Except for the 13 July acquisition at 19:55 local time, all flights were conducted in the early afternoon near solar noon to maximize slope illumination and minimize wind. The highest altitude reached by the aircraft between waypoints 6 and 7 (Figure 6) was 1337.9 m HAE. Flight logs indicated that DJI OccuSync transmission strength remained in the Strong (highest) and Very Good (second highest) categories throughout all missions. The overall video-stream latency reported by FlightHub 2 was approximately 190–200 ms and represents end-to-end video transmission only, including onboard camera encoding, OccuSync transmission to the Dock, Starlink satellite backhaul (Dock-to-cloud), DJI cloud relay, FlightHub 2 processing, and browser decoding on the remote pilot’s Ethernet-connected workstation. The segment of the flight experiencing the strongest winds varied between acquisitions (Figure 7). The sustained higher wind speeds observed on 13 July were expected, as the later flight time coincided with stronger winds at higher altitudes in the evening. At this latitude, sunset on 13 July was at 23:53:04, which ensured sufficient remaining daylight to undertake a mapping mission.
Because the camera was programmed to take photographs every second between waypoints 5 and 19, the total number taken during each mission ranged from 297 to 301 (Table 2), slightly above the estimated 290 (Figure 6). Similarly, the total flight time exceeded the planned duration by approximately 90 s. One exception is the flight on 14 July, where the pilot paused the mission near waypoint 23 due to an incoming crewed helicopter that landed on the airfield, adding nearly 90 s to the total flight time. For all flights the aircraft battery was >50 % upon landing.
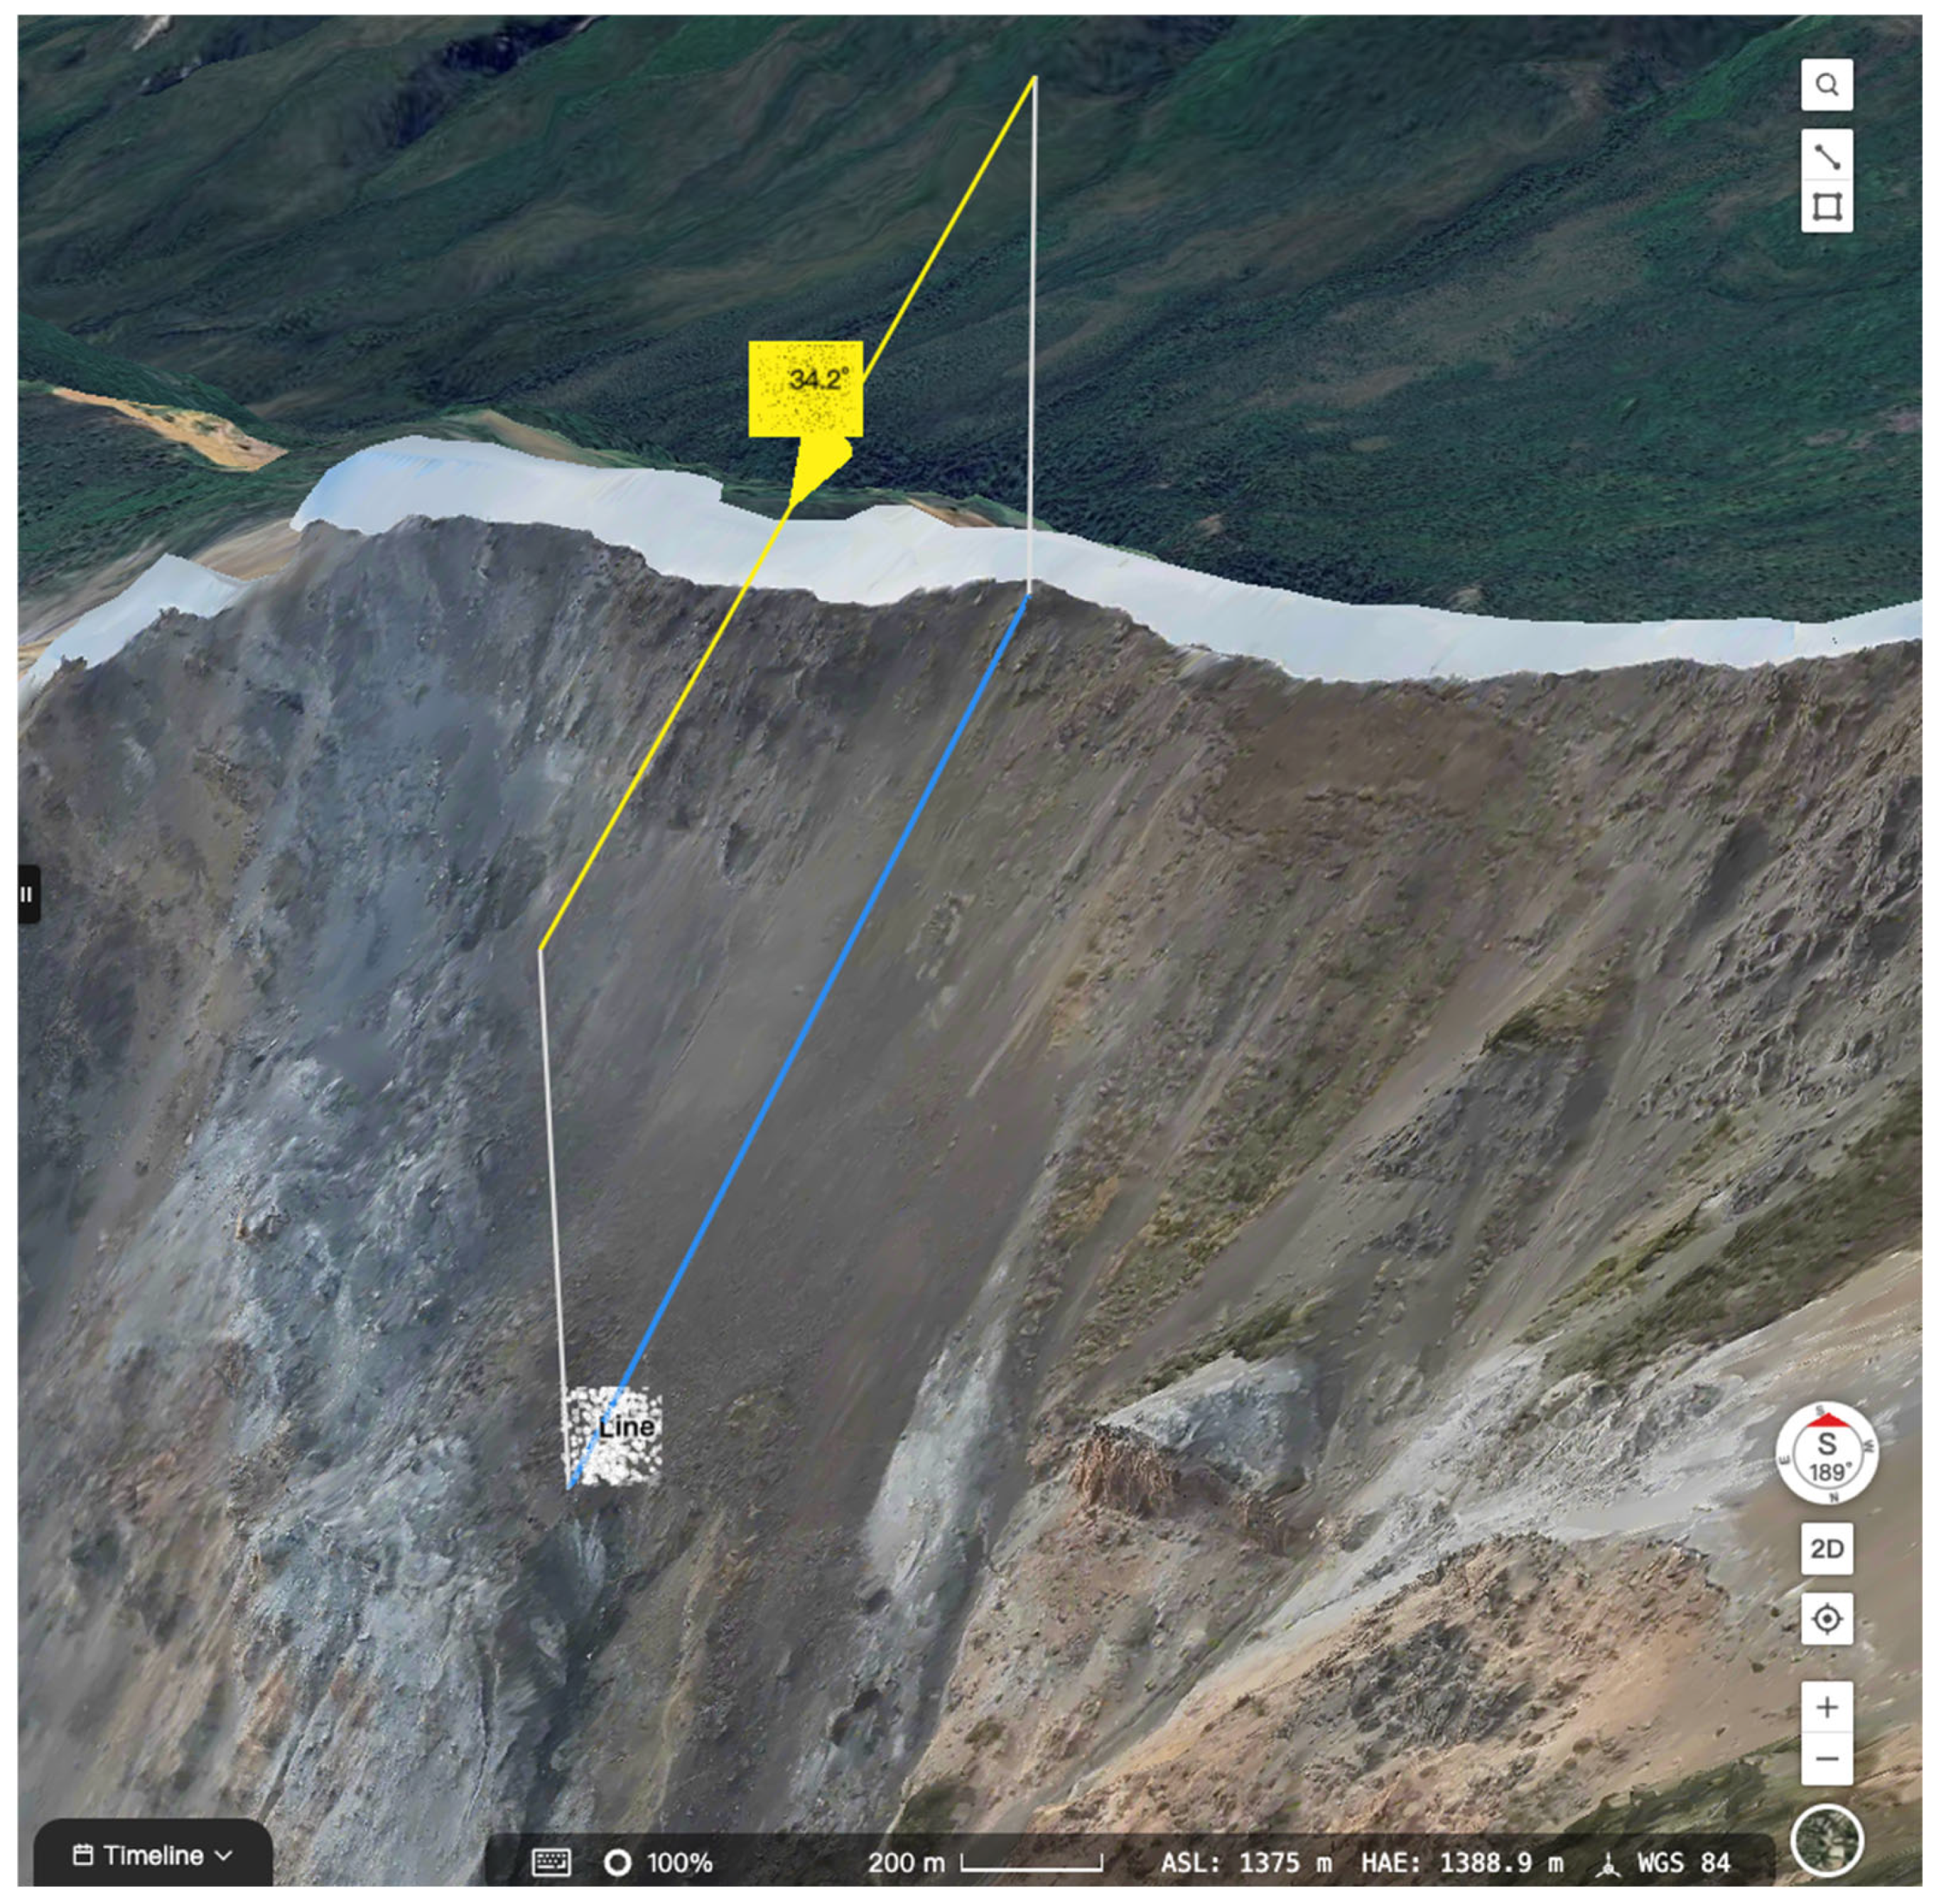
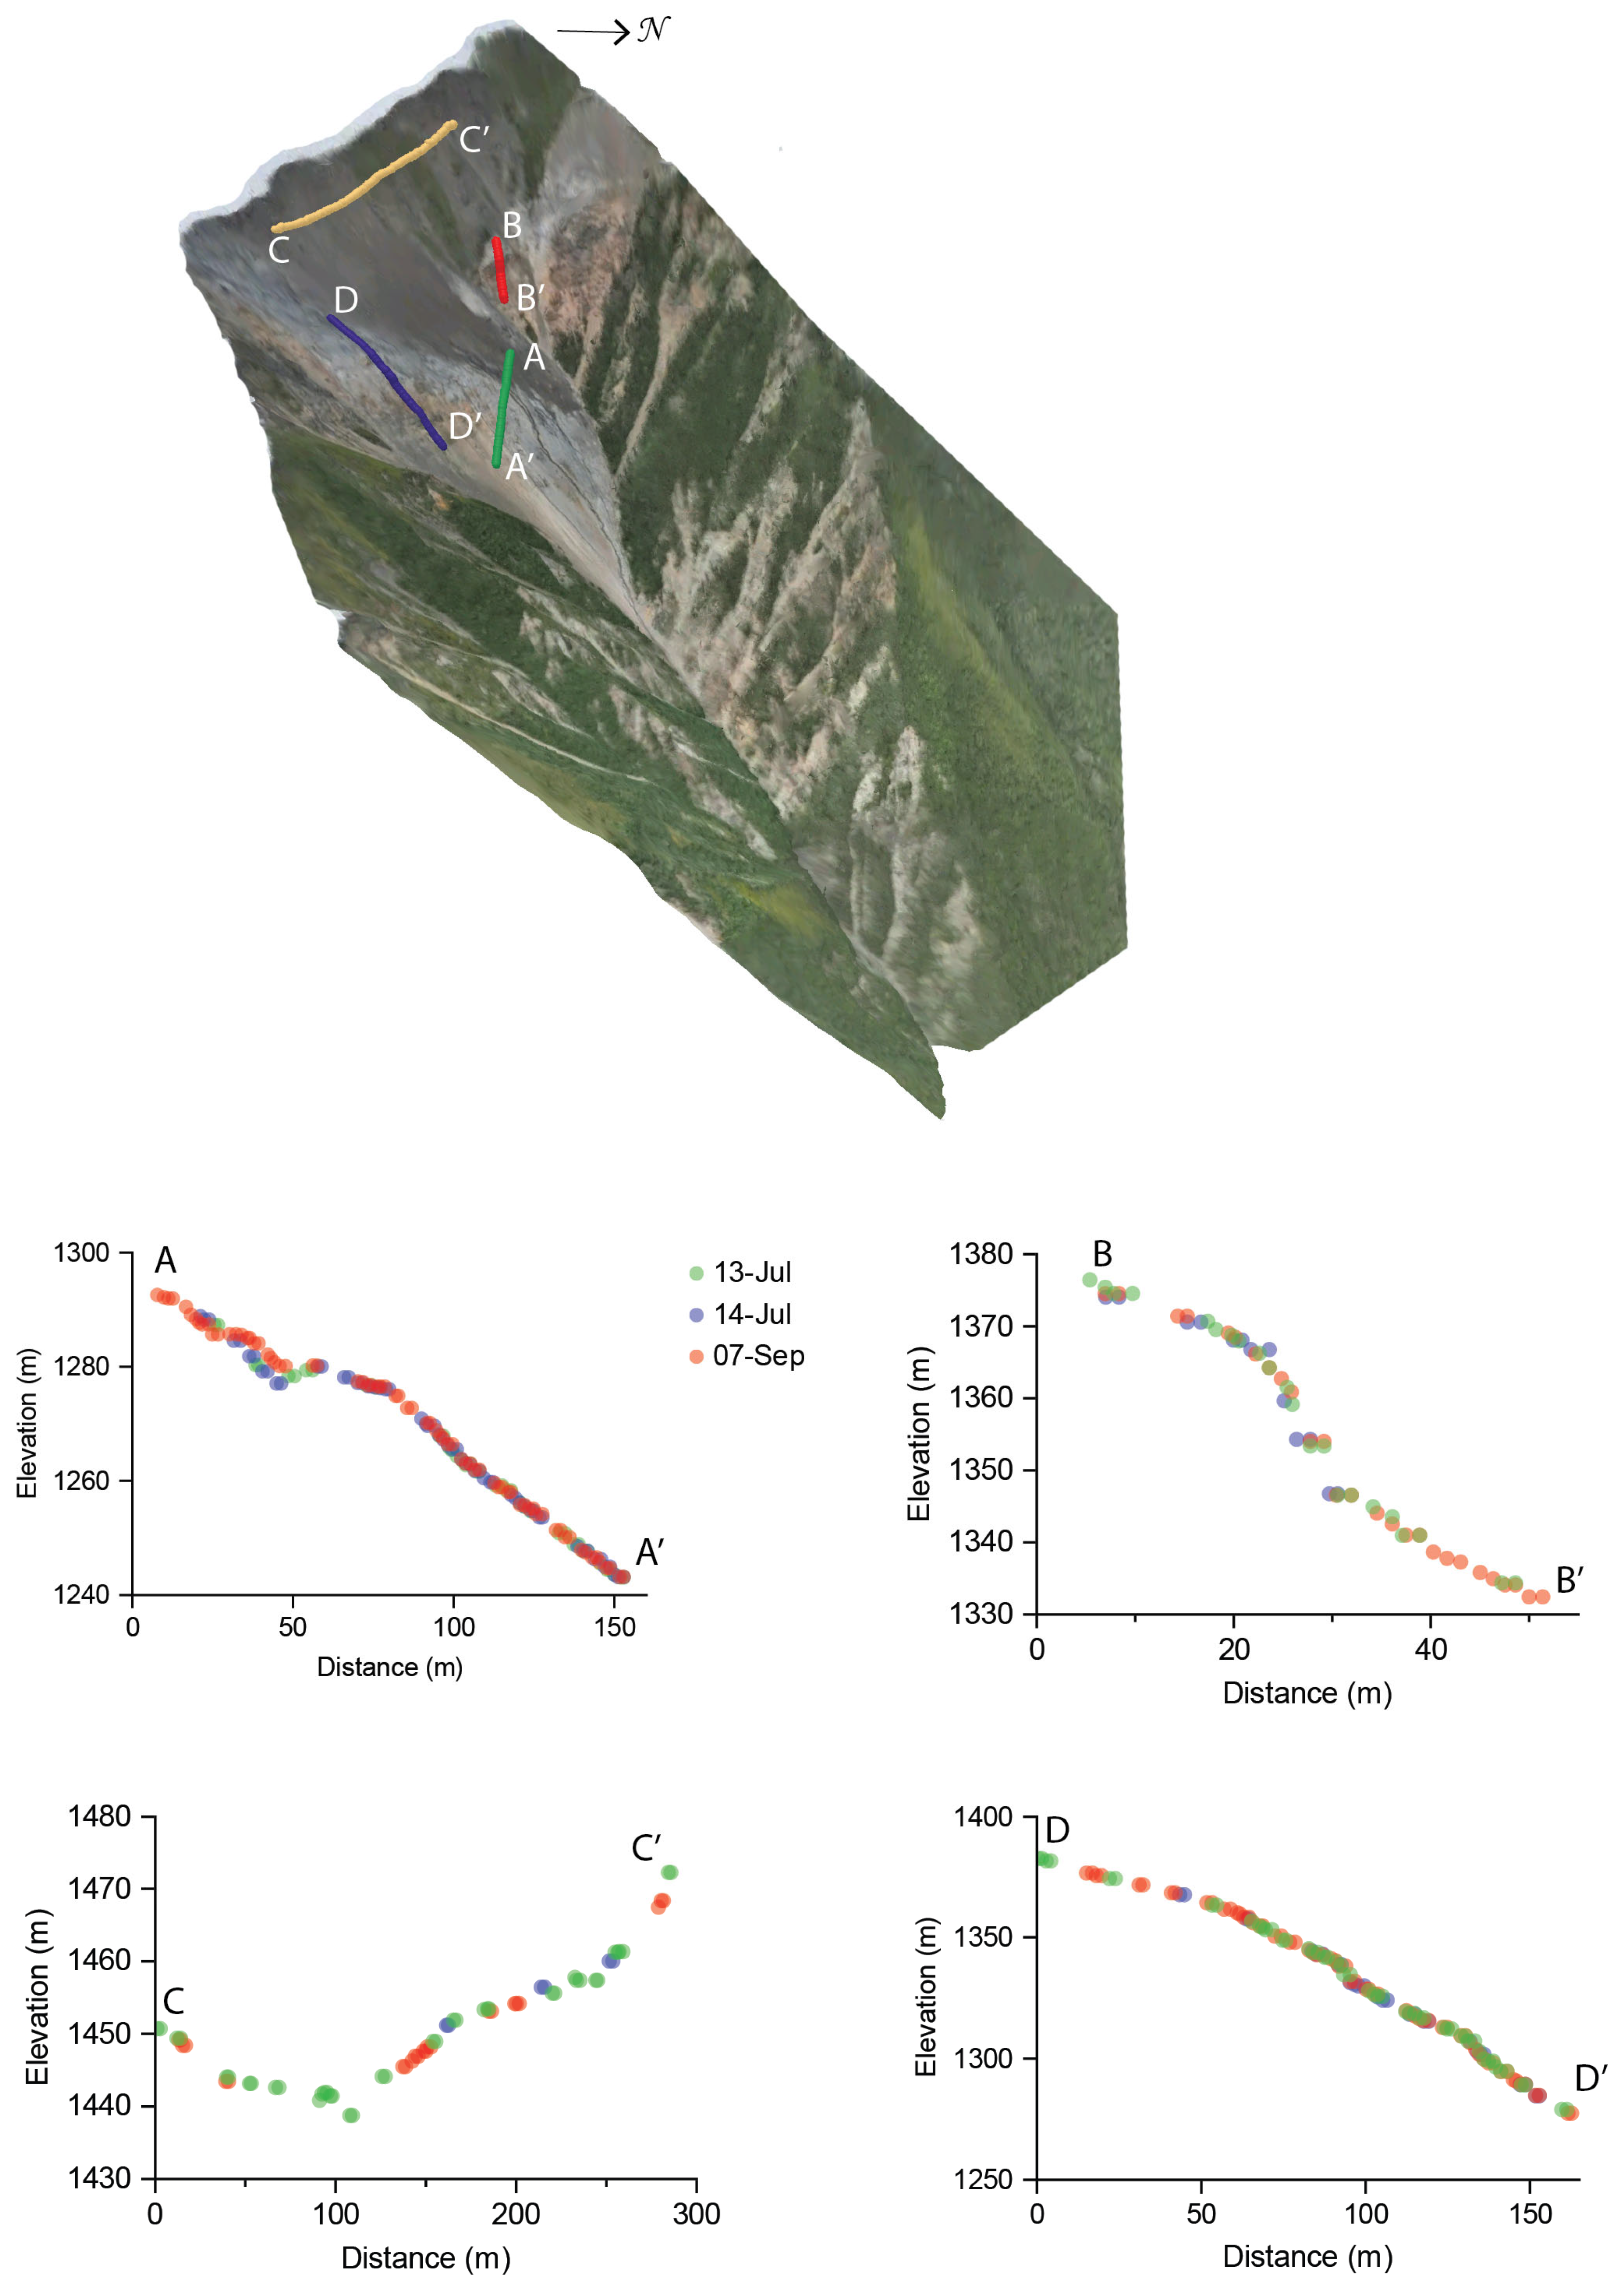
An initial assessment of morphological characteristics such as slope at the head scarp indicate a close agreement with the 34° reported by [44] (Figure 8). An assessment of elevation transects from the 13 July, 14 July, and 7 September datasets reveals close correspondence across all, indicating that the models are well co-registered (Figure 9). The transects show tight clustering of points with no systematic vertical offsets, demonstrating both a temporal stability of the terrain and a high repeatability of the DIAB acquisition workflow. The high similarity of the 13 July and 14 July profiles illustrate reproducibility despite differences in illumination conditions. No systematic geomorphic change is detected along any transect, although the first ~50 m of transect A shows a noticeable deviation of ~2 m in the September dataset, which may reflect small-scale surface topographic differences towards the lower third of the landslide, such as accumulation of rock fall. Slightly increased scatter in transect B is consistent with rougher surface materials, and the overall sparser point density in transect C is indicative of edge-of-block uncertainty.

4. Discussion

Effective deployment of DIAB systems in mountainous environments requires careful consideration of both environmental conditions and operational constraints. Although the Dock 2 is designed to automate routine RPAS flights, real-world performance is strongly shaped by local wind regimes, terrain complexity, and software capabilities. The installation described here (Figure 2, Figure 3 and Figure 4) was straightforward to implement, remained functional and secure under variable summer weather conditions, prevented access by wildlife or unauthorized individuals, met signal-quality requirements, and retained the flexibility to be relocated between sites. The five resulting datasets showed high reproducibility and accurate co-registration (Figure 9), enabling analyses of terrain features and potential changes (see [47]). Together, these results demonstrate that DIAB-based monitoring can operate reliably in complex mountainous terrain while producing data suitable for geomorphological analysis. While our case study focused on a specific landslide in the Yukon Territory, Canada, landslides are of concern in mountainous areas worldwide [53]; therefore, monitoring with a DIAB system could be similarly implemented elsewhere.
One of the greatest uncertainties during flight planning was the lack of prior knowledge of wind conditions along the steep elevation gradient. Figure 7 demonstrates that wind speeds were lowest near the valley floor and increased progressively with altitude toward the ridge, consistent with orographic wind amplification, mountain–plain circulation, and terrain-channelling effects. Mid-slope and uppermost flight lines exhibited the highest variability on three flights and the strongest winds on two dates, confirming that the ridge environment is structurally turbulent. Despite the increased platform motion expected under such conditions, the M3TD maintained stable navigation and adhered to its planned route (Figure 7). The 13 July flight displayed especially sharp spatial gradients in wind speed, indicative of more turbulent evening atmospheric conditions. Unexpectedly, several of the higher-altitude flight segments exhibited periods of very low wind speeds (<3 m/s) across all acquisition dates (Figure 7). Importantly, these results highlight that valley-level wind measurements are not necessarily representative of conditions at altitude. Despite these environmental constraints, the system demonstrated strong operational resilience and maintained mission continuity across flights.
Steep, complex topography also posed challenges for flight planning, particularly in the absence of recent, high-accuracy elevation data such as airborne LiDAR. Maintaining safe clearances above ground within regulations required careful manual adjustments to flight paths. Enhancements to FlightHub 2 such as allowing fully customizable waypoint altitudes for transit to and from mapping areas would substantially facilitate route planning in mountainous terrain. Such capabilities would better accommodate abrupt elevation changes, reduce terrain-following uncertainty, and facilitate deployment in similar environments without the need for advanced GIS analytical skills in flight planning. In addition, analyses generated within FlightHub 2, such as volume-change calculations and elevation transects, are currently available only as visual products or embedded reports. Allowing users to export these outputs in standard formats (e.g., GeoTIFF, shapefiles, CSV) would greatly enhance the scientific and operational value by enabling independent validation and integration with geospatial workflows.
Because of the terrain and environmental challenges, the flight plan used in this study remained conservative, limiting the aircraft’s proximity to the head scarp and minimizing time spent at higher altitudes. As a result, the uppermost portions of the models including features such as tension cracks near the ridge head [47] are less well resolved than features lower on the slope. Greater spatial detail could be achieved in future operations by positioning flight paths closer to the ridge crest, though this would increase exposure to potential wind shear and stronger terrain-driven winds. Alternatively, the zoom camera could be used to obtain high-resolution single-frame photographs.
During an attempt to collect evening infrared data (at ~00:18), wind conditions that initially appeared acceptable at the Dock location (3–5 m/s | 10.8–18 km/h) intensified rapidly as the aircraft climbed with sustained wind speed in the 9–11 m/s (32.4–39.6 km/h) range. By approximately 1100 m HAE, sustained winds exceeded 12 m/s (43.2 km/h) and reached the severe-wind threshold (13.2–13.6 m/s | 47.5–49 km/h), triggering a return-to-home and preventing completion of the mission. Future operations could attempt to further evaluate the utility of the IR camera, if weather conditions at altitude remain suitable for safe operations. Importantly, the failsafe response functioned as designed, ensuring aircraft safety despite deteriorating conditions.
In most conventional drone operations, pilots rely on handheld controllers whose physical sticks and buttons support well-established muscle memory, enabling rapid execution of memory-item actions during emergencies. In contrast, FlightHub 2 currently requires remote pilots to issue critical commands using a keyboard and mouse. Relearning how to fly and react under pressure in this interface can be daunting, and achieving the same level of confidence and instinctive response requires dedicated practice and training.
An important safety feature of the Dock 2 and the DJI FlightHub 2 interface is the ability for the pilot to assume manual control of the aircraft at any time. An example of this is shown in Table 2 for the flight on 14 July, where the pilot paused the automated mission during an airspace incursion from a crewed helicopter. Flight control commands and video transmission are handled via separate communication pipelines, with the flight control system given priority. In Live Flight Control mode, where the pilot directly controls the aircraft, FlightHub 2 displays the remote control latency, which is distinct from the video-stream latency shown in the livestream interface.
Operating a DIAB system remotely also introduces a different kind of psychological workload compared to serving as a pilot-in-command on site. Without direct sensory cues such as hearing the aircraft, observing weather shifts, or visually confirming obstacles remote pilots must rely entirely on telemetry, video feeds, automated safeguards and remote information from on-site visual observers. This increases cognitive demand and can amplify stress, particularly in complex environments like mountains or rapidly changing weather conditions. However, as DIAB technologies mature, situational-awareness tools improve, and standardized operational frameworks become more widespread, these challenges may diminish. Over the next decade, remotely managed DIAB missions may become routine, and the psychological gap between on-site and remote operations may narrow as experience, trust in systems, and automation continue to evolve. Just as importantly, as these platforms accumulate a verifiable safety record demonstrating reliability across diverse environments and use cases, operators will gain greater confidence in both the technology and the operational workflows. This growing body of evidence will help shift DIAB operations from being perceived as novel and high-risk to becoming a standardized, trusted component of routine aerial data collection.
For users to adopt complex, infrastructure-dependent systems such as DIAB platforms, they must perceive clear advantages over existing workflows. Adoption requires more than technological capability; end-users must see improvements in efficiency, safety, data quality, and/or operational reliability. Automated systems that alter established practices also demand new approaches to regulatory compliance, training, data management, and maintenance. Demonstrating practical benefits such as reduced site visits, improved temporal resolution, and enhanced personnel safety is therefore essential.
Given these considerations, the Dock 2 performed well during this technology demonstration. More recent DIAB systems, such as the Dock 3 [31], incorporate built-in battery systems that eliminate the need for hard-wired electrical connections and greatly simplify field installation. This increased mobility enables rapid deployment directly from vehicles and is especially advantageous in remote areas lacking electrical infrastructure. Similarly, Sphere Drones’ HubX platform [26] provides a trailer-mounted, solar-powered solution compatible with both the original Dock [29] and the Dock 2 [42], offering comparable flexibility for off-grid or semi-permanent installations. A key caveat for extreme northern or southern locations is that limited sunlight at high latitudes during winter months renders solar-based charging solutions ineffective. In such settings, alternative power sources would still be required. Also, dependence on satellite-based or alternative reliable internet will limit the implementation of these systems in countries where it is not readily available. Solutions such as the DJI FlightHub 2 AIO (All-In-One) unit [54] which contains on-site hardware and software modules for self-contained operation and analysis can mitigate the lack of internet and support remote offline operations.
As DIAB technology continues to mature, multiple manufacturers have developed similar systems to the one tested here (e.g., [24,25,26,27,28,33]). Even though this demonstration project was conducted using the DJI Dock 2, the approach is transferable to other DIAB systems, provided they possess the requisite technical capabilities. Users must also be aware of the national RPAS regulations in their country of intended use, as not all commercially available systems meet the operational or safety requirements of relevant authorities.
Ultimately, the scientific value of this technology demonstration must be assessed using the photogrammetric models from a geomorphological standpoint. This would allow users to determine whether their spatial and temporal resolutions are sufficient to capture subtle precursory features such as crack propagation, differential settlement, or changes in surface roughness and moisture that may precede slope failure. A recent analysis of the data acquired here by [47] indicates that the Miles Ridge landslide is geomorphologically complex with localized areas of erosion and deformation. Such spatially heterogeneous processes place stringent requirements on both model resolution and repeatability, as deformation signals may be confined to small, spatially discrete zones. Determining this capability is essential for evaluating whether DIAB-based monitoring could contribute meaningfully to landslide early warning systems. Beyond landslide monitoring, these considerations also highlight the broader potential of DIAB systems for other applications that require frequent, high-quality surface observations. Future evaluations of these systems should be expanded to other natural hazards such as volcanoes and wildfires. In addition, the use of DIAB technology may enhance monitoring of ecologically sensitive areas by reducing the need for repeated in-person field visits, thereby offering a less intrusive alternative to traditional survey approaches.

5. Conclusions

The deployment of the Dock 2 in this mountainous environment demonstrated that DIAB systems can operate reliably even under variable weather and challenging terrain. Despite strong, spatially variable winds, steep slopes, and a large elevation gradient, the system maintained stable flight paths, generated highly reproducible models, and met the operational demands of a remote mountain site.
Looking ahead, as battery technology advances, DIAB systems will become less dependent on fixed power infrastructure, with autonomous solar charging enabling true stand-alone operation. This will make the systems more portable, easier to deploy from vehicles, and capable of functioning in increasingly remote or off-grid environments. Enhancements such as more flexible flight-planning controls and improved data-export tools will further support operations in complex landscapes. As DIAB systems build a verifiable safety record and pilots gain experience with remote-only interfaces, these platforms have strong potential to become integral components of continuous landslide monitoring and other geohazard applications. With continued advances in situational awareness and detect-and-avoid capabilities satisfying regulatory frameworks, they may also become fully accepted within the broader aviation community.

Author Contributions

Conceptualization, M.K., O.L., J.S. and P.L.; methodology, M.K., O.L. and J.P.A.-M.; formal analysis, M.K.; investigation, M.K., O.L., J.S., J.P.A.-M., P.L. and J.R.; writing—original draft preparation, M.K., O.L. and J.P.A.-M.; writing—review and editing, M.K., O.L., J.S., J.P.A.-M. and P.L.; funding acquisition, J.S., M.K., J.P.A.-M. and P.L. All authors have read and agreed to the published version of the manuscript.

Funding

This research was funded by a Natural Sciences and Engineering Research Council of Canada’s (NSERC) Alliance Program grant (ALLRP 586350-2), an NSERC Discovery grant (RGPIN-2022-05288) and the Yukon Geological Survey Contribution #084.

Institutional Review Board Statement

Not applicable.

Informed Consent Statement

Not applicable.

Data Availability Statement

The raw data supporting the conclusions of this article will be made available by the authors upon reasonable request following an embargo from the date of publication to allow for completion of graduate theses.

Acknowledgments

We thank Amanda Harris from the Discovery Yukon Lodgings for providing a location to install our equipment as well as ongoing logistical support throughout the data collection. We further thank Stephen Scheunert and Paul Mondor for access to a test site and logistical support in Quebec prior to deployment in the Yukon, as well as Kyle Miller formerly from DJI Enterprise and members of the RPAS Center of Expertise, Transport Canada for helpful flight planning insights. We also thank the National Research Council of Canada’s Integrated Aerial Mobility Program (IAM) for support of the NSERC Alliance Partnership. Dominique Chabot from the National Research Council of Canada, three anonymous reviewers and the Special Issue Editor provided helpful comments to improve the manuscript. This work was conducted under the auspices of a Yukon Scientists and Explorers Licence.

Conflicts of Interest

Author P.L. was employed by the Yukon Geological Survey. The remaining authors declare that the research was conducted in the absence of any commercial or financial relationships that could be construed as a potential conflict of interest.

References

  1. Guzzetti, F.; Melillo, M.; Mondini, A.C. Landslide predictions through combined rainfall threshold models. Landslides 2025, 22, 137–147. [Google Scholar] [CrossRef]
  2. Iverson, R.M. Landslide triggering by rain infiltration. Water Resour. Res. 2000, 36, 1897–1910. [Google Scholar] [CrossRef]
  3. Moreiras, S.; Lisboa, M.S.; Mastrantonio, L. The role of snow melting upon landslides in the central Argentinean Andes. Earth Surf. Process. Landf. 2012, 37, 1106–1119. [Google Scholar] [CrossRef]
  4. Keefer, D.K. Investigating landslides caused by earthquakes—A historical review. Surv. Geophys. 2002, 23, 473–510. [Google Scholar] [CrossRef]
  5. Garcia, M.O.; Sherman, S.B.; Moore, G.F.; Goll, R.; Popova-Goll, I.; Natland, J.H.; Acton, G. Frequent landslides from Koolau Volcano: Results from ODP Hole 1223A. J. Volcanol. Geotherm. Res. 2006, 151, 251–268. [Google Scholar] [CrossRef]
  6. Akosah, S.; Gratchev, I. Systematic review of post-wildfire landslides. Geohazards 2025, 6, 12. [Google Scholar] [CrossRef]
  7. Lipovsky, P.S.; Coates, J.; Leuwkowicz, A.G.; Trochim, E. Active-layer detachments following the summer 2004 forest fires near Dawson City, Yukon. In Yukon Exploration and Geology 2005; Emond, D.S., Bradshaw, G.D., Lewis, L.L., Weston, L.H., Eds.; Yukon Geological Survey, Government of Yukon: Whitehorse, YT, Canada, 2006; pp. 175–197. [Google Scholar]
  8. Svennevig, K.; Keiding, M.; Sørensen, E.V.; Løvholt, F.; Glimsdal, S.; Perez, L.F.; Owen, M.J.; Morino, C. Two similar permafrost degradation landslides at Paatuut, West Greenland, caused tsunamis of substantially different magnitudes. Landslides 2025, 22, 1455–1474. [Google Scholar] [CrossRef]
  9. Turoğlu, H.; Duran, A. The impact of coastal road construction on Kıyıcık Landslide (Artvin, Türkiye) in December 2024. Anthr. Coasts 2025, 8, 35. [Google Scholar] [CrossRef]
  10. Casagli, N.; Intrieri, E.; Tofani, V.; Gigli, G.; Raspini, F. Landslide detection, monitoring and prediction with remote-sensing techniques. Nat. Rev. Earth Environ. 2023, 4, 51–64. [Google Scholar] [CrossRef]
  11. Li, D.; Du, Y.; Zhang, Q.; Huang, G.; Wang, L.; Bai, Z.; Li, Y.; Zhang, J. Low-cost miniaturized GNSS antenna for landslide monitoring and application in Baige landslide (western China). Adv. Space Res. 2025, 76, 128–142. [Google Scholar] [CrossRef]
  12. Liu, X.; Zhao, C.; Zhang, Q.; Yin, Y.; Lu, Z.; Samsonov, S.; Yang, C.; Wang, M.; Tomás, R. Three-dimensional and long-term landslide displacement estimation by fusing C- and L-band SAR observations: A case study in Gongjue County, Tibet, China. Remote Sens. Environ. 2021, 267, 112745. [Google Scholar] [CrossRef]
  13. Osmanoğlu, B.; Sunar, F.; Wdowinski, S.; Cabral-Cano, E. Time series analysis of InSAR data: Methods and trends. ISPRS J. Photogramm. Remote Sens. 2016, 115, 90–102. [Google Scholar] [CrossRef]
  14. Samsonov, S.V.; Feng, W.P. Deformation retrievals for North America and Eurasia from Sentinel-1 DInSAR: Big Data approach, processing methodology and challenges. Can. J. Remote Sens. 2023, 49, 2247095. [Google Scholar] [CrossRef]
  15. Zhu, W.; He, Q.; Wu, J.; Wang, Y.; Li, Z.; Zhan, J.; Zhang, B. Identifying reservoir landslide deformation evolution stages with time series InSAR: Application to the Xinpu landslide in China’s three Gorges region. J. Hydrol. 2025, 663, 134136. [Google Scholar] [CrossRef]
  16. Jaboyedoff, M.; Oppikofer, T.; Abellán, A.; Derron, M.-H.; Loye, A.; Metzger, R.; Pedrazzini, A. Use of LiDAR in landslide investigations: A review. Nat. Hazards 2012, 61, 5–28. [Google Scholar] [CrossRef]
  17. Miandad, J.; Darrow, M.M.; Hendricks, M.D.; Daanen, R.P. Landslide mapping using multiscale LiDAR digital elevation models. Environ. Eng. Geosci. 2020, 26, 405–425. [Google Scholar] [CrossRef]
  18. Lucieer, A.; Jong, S.M.D.; Turner, D. Mapping landslide displacements using Structure from Motion (SfM) and image correlation of multi-temporal UAV photography. Prog. Phys. Geogr. Earth Environ. 2014, 38, 97–116. [Google Scholar] [CrossRef]
  19. Turner, D.; Lucieer, A.; De Jong, S.M. Time series analysis of landslide dynamics using an Unmanned Aerial Vehicle (UAV). Remote Sens. 2015, 7, 1736–1757. [Google Scholar] [CrossRef]
  20. Stumpf, A.; Malet, J.-P.; Kerle, N.; Niethammer, U.; Rothmund, S. Image-based mapping of surface fissures for the investigation of landslide dynamics. Geomorphology 2013, 186, 12–27. [Google Scholar] [CrossRef]
  21. Eichel, J.; Draebing, D.; Klingbeil, L.; Wieland, M.; Eling, C.; Schmidtlein, S.; Kuhlmann, H.; Dikau, R. Solifluction meets vegetation: The role of biogeomorphic feedbacks for turf-banked solifluction lobe development. Earth Surf. Process. Landf. 2017, 42, 1623–1635. [Google Scholar] [CrossRef]
  22. Galve, J.P.; Pérez-García, J.L.; Ruano, P.; Gómez-López, J.M.; Reyes-Carmona, C.; Moreno-Sánchez, M.; Jerez-Longres, P.S.; Ghadimi, M.; Barra, A.; Mateos, R.M.; et al. Applications of UAV digital photogrammetry in landslide emergency response and recovery activities: The case study of a slope failure in the A-7 highway (S Spain). Landslides 2025, 22, 1383–1396. [Google Scholar] [CrossRef]
  23. Grlj, C.G.; Krznar, N.; Pranjić, M. A decade of UAV docking stations: A brief overview of mobile and fixed landing platforms. Drones 2022, 6, 17. [Google Scholar] [CrossRef]
  24. American Robotics Inc. The Optimus System Fully-Automated Drone System. Available online: https://www.american-robotics.com/optimus-system (accessed on 22 November 2025).
  25. Avy BV. The Avy Drone Network. Available online: https://avy.eu/ (accessed on 22 November 2025).
  26. Sphere Communications Pty. Ltd. HubX. Available online: https://www.spheredrones.com.au/products/hubx (accessed on 22 November 2025).
  27. Energy Robotics. Automate Inspection with Drones. Available online: https://www.energy-robotics.com/inspection-drones (accessed on 22 November 2025).
  28. Skydio Inc. Skydio Dock for X10. Available online: https://www.skydio.com/dock (accessed on 22 November 2025).
  29. DJI. DJI Dock For Roads Less Traveled. Available online: https://enterprise.dji.com/dock (accessed on 22 November 2025).
  30. DJI. DJI Dock 2 Easy Operation, Superior Results. Available online: https://enterprise.dji.com/dock-2 (accessed on 22 November 2025).
  31. DJI. DJI Dock 3 Rise to Any Challenge. Available online: https://enterprise.dji.com/dock-3 (accessed on 22 November 2025).
  32. Elia Group. Revolutionizing Overhead Line Incident Response: Introducing Drone-in-a-Box (DIAB). Available online: https://innovation.eliagroup.eu/en/projects/revolutionizing-overhead-line-incident-response-introducing-drone-in-a-box (accessed on 22 November 2025).
  33. Percepto Ltd. Percepto Air The Most Deployed Drone-in-a-Box Solutions on the Market. Available online: https://percepto.co/drone-in-a-box/ (accessed on 22 November 2025).
  34. Bene, V.; Kristof, Z.; Elek, B. The DJI Dock 2 is a “Drone in a Box” to enhance the unmanned guard solution—Scientific research with the cooperation of Duplitec Ltd. Repüléstud. Közl. 2024, 35, 171–178. [Google Scholar] [CrossRef]
  35. Głębocki, R.; Kopyt, A.; Jacewicz, M.; Florczak, D. Autonomous solar-powered docking station for the unmanned quadrotors. In Proceedings of the Council of European Aerospace Societies, Conference on Guidance, Navigation and Control, Berlin, Germany, 3–5 May 2022; p. CEAS–GNC-2022-2078. [Google Scholar]
  36. Mahoor, M.H.; Godzdanker, R.; Dalamagkidis, K.; Valavanis, K.P. Vision-based landing of light weight unmanned helicopters on a smart landing platform. J. Intell. Robot. Syst. 2011, 61, 251–265. [Google Scholar] [CrossRef]
  37. Malyuta, D.; Brommer, C.; Hentzen, D.; Stastny, T.; Siegwart, R.; Brockers, R. Long-duration fully autonomous operation of rotorcraft unmanned aerial systems for remote-sensing data acquisition. J. Field Robot. 2020, 37, 137–157. [Google Scholar] [CrossRef]
  38. Sanchez-Lopez, J.L.; Pestana, J.; Saripalli, S.; Campoy, P. An approach toward visual autonomous ship board landing of a VTOL UAV. J. Intell. Robot. Syst. 2014, 74, 113–127. [Google Scholar] [CrossRef]
  39. Polvara, R.; Patacchiola, M.; Hanheide, M.; Neumann, G. Sim-to-real quadrotor landing via sequential Deep Q-Networks and domain randomization. Robotics 2020, 9, 8. [Google Scholar] [CrossRef]
  40. Cokyasar, T. Optimization of battery swapping infrastructure for e-commerce drone delivery. Comput. Commun. 2021, 168, 146–154. [Google Scholar] [CrossRef]
  41. Severa, O.; Bouček, Z.; Neduchal, P.; Bláha, L.; Myslivec, T.; Flidr, M. Droneport: From concept to simulation. In Proceedings of the System Engineering for Constrained Embedded Systems, Budapest, Hungary, 17–19 January 2022; pp. 33–38. [Google Scholar]
  42. DJI Enterprise. DJI Dock 2 Matrice 3D Series Unmanned Aircraft Flight Manual; DJI Enterprise: Shenzhen, China, 2024; p. 119. [Google Scholar]
  43. Han, J.; Dettmer, J.; Gosselin, J.M.; Gilbert, H.; Biegel, K. Seismicity near the eastern Denali fault from temporary and long-term seismic recordings. In Yukon Exploration and Geology Technical Papers 2023; Weston, L.H., Purple Rock Inc., Eds.; Yukon Geological Survey, Government of Yukon: Whitehorse, YT, Canada, 2024; pp. 37–50. [Google Scholar]
  44. Bond, J.D.; Lipovsky, P.S.; von Gaza, P. Surficial geology investigations in Wellesley basin and Nisling Range, southwest Yukon. In Yukon Exploration and Geology 2007; Edmond, D.S., Blackburn, L.R., Hill, R.P., Weston, L.H., Eds.; Yukon Geological Survey, Government of Yukon: Whitehorse, YT, Canada, 2008; pp. 125–138. [Google Scholar]
  45. Grassi, B. The 2002 Denali Fault Earthquake: Twenty Years of Shaking Up Alaska Seismology. Available online: https://earthquake.alaska.edu/2002-denali-fault-earthquake-twenty-years-shaking-alaska-seismology (accessed on 22 November 2025).
  46. Ruppert, N.A. Five years after the 2002 Denali Fault earthquake sequence: A regional network operator’s perspective. Seismol. Res. Lett. 2008, 79, 424–425. [Google Scholar] [CrossRef]
  47. Stix, J.; Roman, J.; Kalacska, M.; Lucanus, O.; Lipovsky, P.S.; Arroyo-Mora, J.P. Assessing Miles Ridge landslide activity using an integrated ground-RPAS-satellite approach. In Yukon Exploration and Geology 2025; Stuart, A., Weston, L.H., Schultz, S.H., Eds.; Yukon Geological Survey, Government of Yukon: Whitehorse, YT, Canada, 2026. [Google Scholar]
  48. DJI Enterprise. DJI Dock 2 Installation and Setup Manual; DJI Enterprise: Shenzhen, China, 2024; p. 65. [Google Scholar]
  49. Natural Resources Canada. Precise Point Positioning. Available online: https://webapp.csrs-scrs.nrcan-rncan.gc.ca/geod/tools-outils/ppp.php (accessed on 22 November 2025).
  50. DJI. DJI FlightHub 2. Available online: https://enterprise.dji.com/flighthub-2 (accessed on 22 November 2025).
  51. ISO/IEC 27001:2022; Information Security, Cybersecurity and Privacy Protection—Information Security Management Systems—Requirements. ISO: Geneva, Switzerland, 2022.
  52. Transport Canada. Advisory Circular (AC) No. 903-001, Remotely Piloted Aircraft Systems Operational Risk Assessment; 2024-06-03; Civil Aviation, Remotely Piloted Aircraft Systems Task Force: Ottawa, ON, Canada, 2024. [Google Scholar]
  53. Korup, O.; Pánek, T.; Břežný, M. Size estimates of Earth’s largest terrestrial landslides informed by topographic setting. Commun. Earth Environ. 2025, 6, 629. [Google Scholar] [CrossRef]
  54. DJI Enterprise. DJI FlightHub2 AIO User Manual v1.0; DJI Enterprise: Shenzen, China, 2025; p. 44. [Google Scholar]
Figure 1. (A) Map of the location of the Miles Ridge landslide (outlined in red) in the Yukon Territory, Canada. The H represents the location of the Dock 2 installation. Inset image is a Skysat satellite image (50 cm resolution) acquired 9 July 2025. The background imagery is a true colour composite from a WorldView-2 satellite image acquired 11 September 2015, and 27 May 2019, processed as a Maxar Vivid™ Standard basemap product with 50 cm HD resolution available through the ArcGIS Pro World Imagery Basemap product (v.2024.R12). (B) The Dock 2 installation at the Discovery Yukon Lodgings (km 1818) with the Miles Ridge landslide in the background. (C) Area around the landslide considered in the flight planning outlined in yellow. Green dotted lines illustrate the lateral boundaries of the landslide as described by [44]. Photographs B and C were taken on 13 July 2025.
Sustainability 18 00693 g001
Figure 2. Dock 2 installation components on top of standard shipping container. A: 2 × 6 lumber 240 cm, B: 2 × 6 lumber 80 cm, C: steel strap hooks, D: Dock 2, E: ground wire, F: Romex 10/3 power cable, G: outdoor receptacle, H: Pelican case housing Starlink modem and power supply, I: Starlink Performance Gen-2 terminal, J: Waterproof electrical box housing Sancable RJ45 surge protector, and power connection for security camera K: Cat 8 Ethernet cables, L: HXVIEW 4K PTZ security camera.
Sustainability 18 00693 g002
Figure 3. Interior view of (A) Pelican case housing the Starlink modem and power supply (Figure 2: H), (B) Waterproof electrical box housing the power supply and Ethernet connection for the security camera, (C) Waterproof electrical box housing the RJ45 surge protector (Figure 2: J). The bundled but unplugged Ethernet cable shown in (B) was used during on-site testing and setup of the Dock 2 to connect a laptop directly to the Starlink modem in place of the security camera (the modem has only two output ports). This cable was removed when installation was complete.
Sustainability 18 00693 g003
Figure 4. Functional block diagram of the Dock 2 installation showing power distribution and data communication pathways. Line type visually separates the power from the communication networks.
Sustainability 18 00693 g004
Figure 5. Panorama of two photographs taken at ~1060 m HAE by the M3TD. This shows how the aircraft must stay relatively close to the terrain (e.g., the slope seen on the left), while the home point (takeoff location) designated by the letter H is 350 m below (lower right).
Sustainability 18 00693 g005
Figure 6. Final flight plan as shown in FlightHub 2. The blue triangles mark the locations of the waypoints. The terrain model shown is the platform’s built-in global elevation dataset. The elevation gradient overlay shows the range of altitudes HAE over which photographs were acquired.
Sustainability 18 00693 g006
Figure 7. Wind speed (m/s and km/h) during the five mapping flights as reported in the flight logs.
Sustainability 18 00693 g007
Figure 8. Screen capture from FlightHub 2 displaying the 14 July model illustrating the slope estimation of 34.2°.
Sustainability 18 00693 g008
Figure 9. Comparison of cross-sections from the mesh models generated on 13 July, 14 July and 7 September 2025. The model from the 14 July model is shown as reference for the locations from which the cross-sections were extracted. Each cross section is shown in a different line colour. The colours of the points indicate the date as shown in the legend. Cross-sections were extracted from models reprocessed locally with Terra (see Section 2.5).
Sustainability 18 00693 g009
Table 2. Flight and main environmental characteristics of the five model acquisitions. Time is shown as local time.
Date Start Time
(UTC-7)
Solar Noon (UTC-7)Maximum Wind Speed (m/s | km/h)Kp
Index
Number of
Photographs
Duration (mm:ss)Flight
Distance (m)
13 July 202519:5514:28:036.1 | 22.02.330011:235766.5
14 July 202513:3014:28:096.9 | 24.84.330213:04 *5816.5
12 August 202513:5614:27:077.9 | 28.43.029711:265821.0
30 August 202514:4414:22:365.8 | 20.92.329811:205788.2
12:0314:19:585.2 | 18.71.730111:275828.2
* Flight duration exceeded the expected time due to the pilot in command pausing the mission during an airspace incursion from a crewed helicopter.
Disclaimer/Publisher’s Note: The statements, opinions and data contained in all publications are solely those of the individual author(s) and contributor(s) and not of MDPI and/or the editor(s). MDPI and/or the editor(s) disclaim responsibility for any injury to people or property resulting from any ideas, methods, instructions or products referred to in the content.