Article

An Improved NSGA-II–TOPSIS Integrated Framework for Multi-Objective Optimization of Electric Vehicle Charging Station Siting


1
College of Navigation, Jimei University, Xiamen 361021, China
2
Marine Traffic Safety Institute, Jimei University, Xiamen 361021, China
*
Author to whom correspondence should be addressed.
Sustainability 2026, 18(2), 668; https://doi.org/10.3390/su18020668
Submission received: 24 November 2025 / Revised: 31 December 2025 / Accepted: 6 January 2026 / Published: 8 January 2026

Abstract

The rapid growth of electric vehicle (EV) adoption poses significant challenges for the rational planning of charging infrastructure, where economic efficiency and service quality are inherently conflicting. To support scientific decision-making in charging station siting, this study proposes an integrated multi-objective optimization and decision-support framework that combines an improved Non-dominated Sorting Genetic Algorithm II (NSGA-II) with an entropy-weighted TOPSIS method. A bi-objective siting model is developed to simultaneously minimize total operator costs and maximize user satisfaction. User satisfaction is explicitly characterized by a nonlinear charging distance perception function and a queuing-theoretic waiting time model, enabling a more realistic representation of user service experience. To enhance convergence performance and solution diversity, the NSGA-II algorithm is improved through variable-wise random chaotic initialization, opposition-based learning, and adaptive crossover and mutation operators. The resulting Pareto-optimal solutions are further evaluated using an improved entropy-weighted TOPSIS approach to objectively identify representative compromise solutions. Simulation results demonstrate that the proposed framework achieves superior performance compared with the standard NSGA-II algorithm in terms of operating cost reduction, user satisfaction improvement, and multi-objective indicators, including hypervolume, inverted generational distance, and solution diversity. The findings confirm that the proposed NSGA-II–TOPSIS framework provides an effective, robust, and interpretable decision-support tool for EV charging station planning under conflicting objectives.

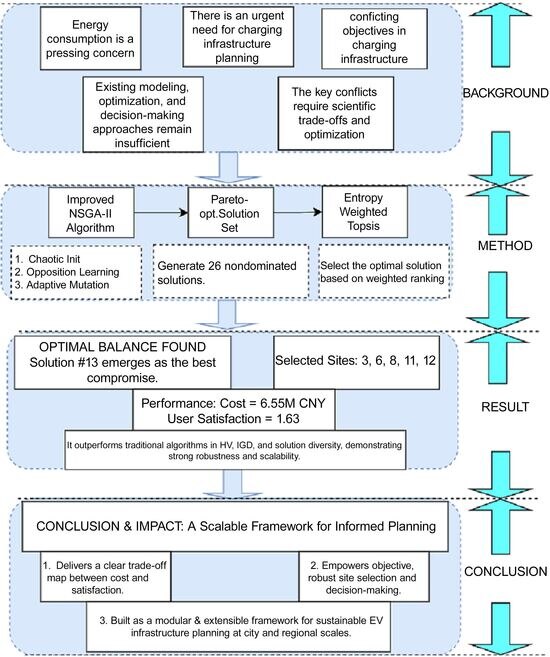
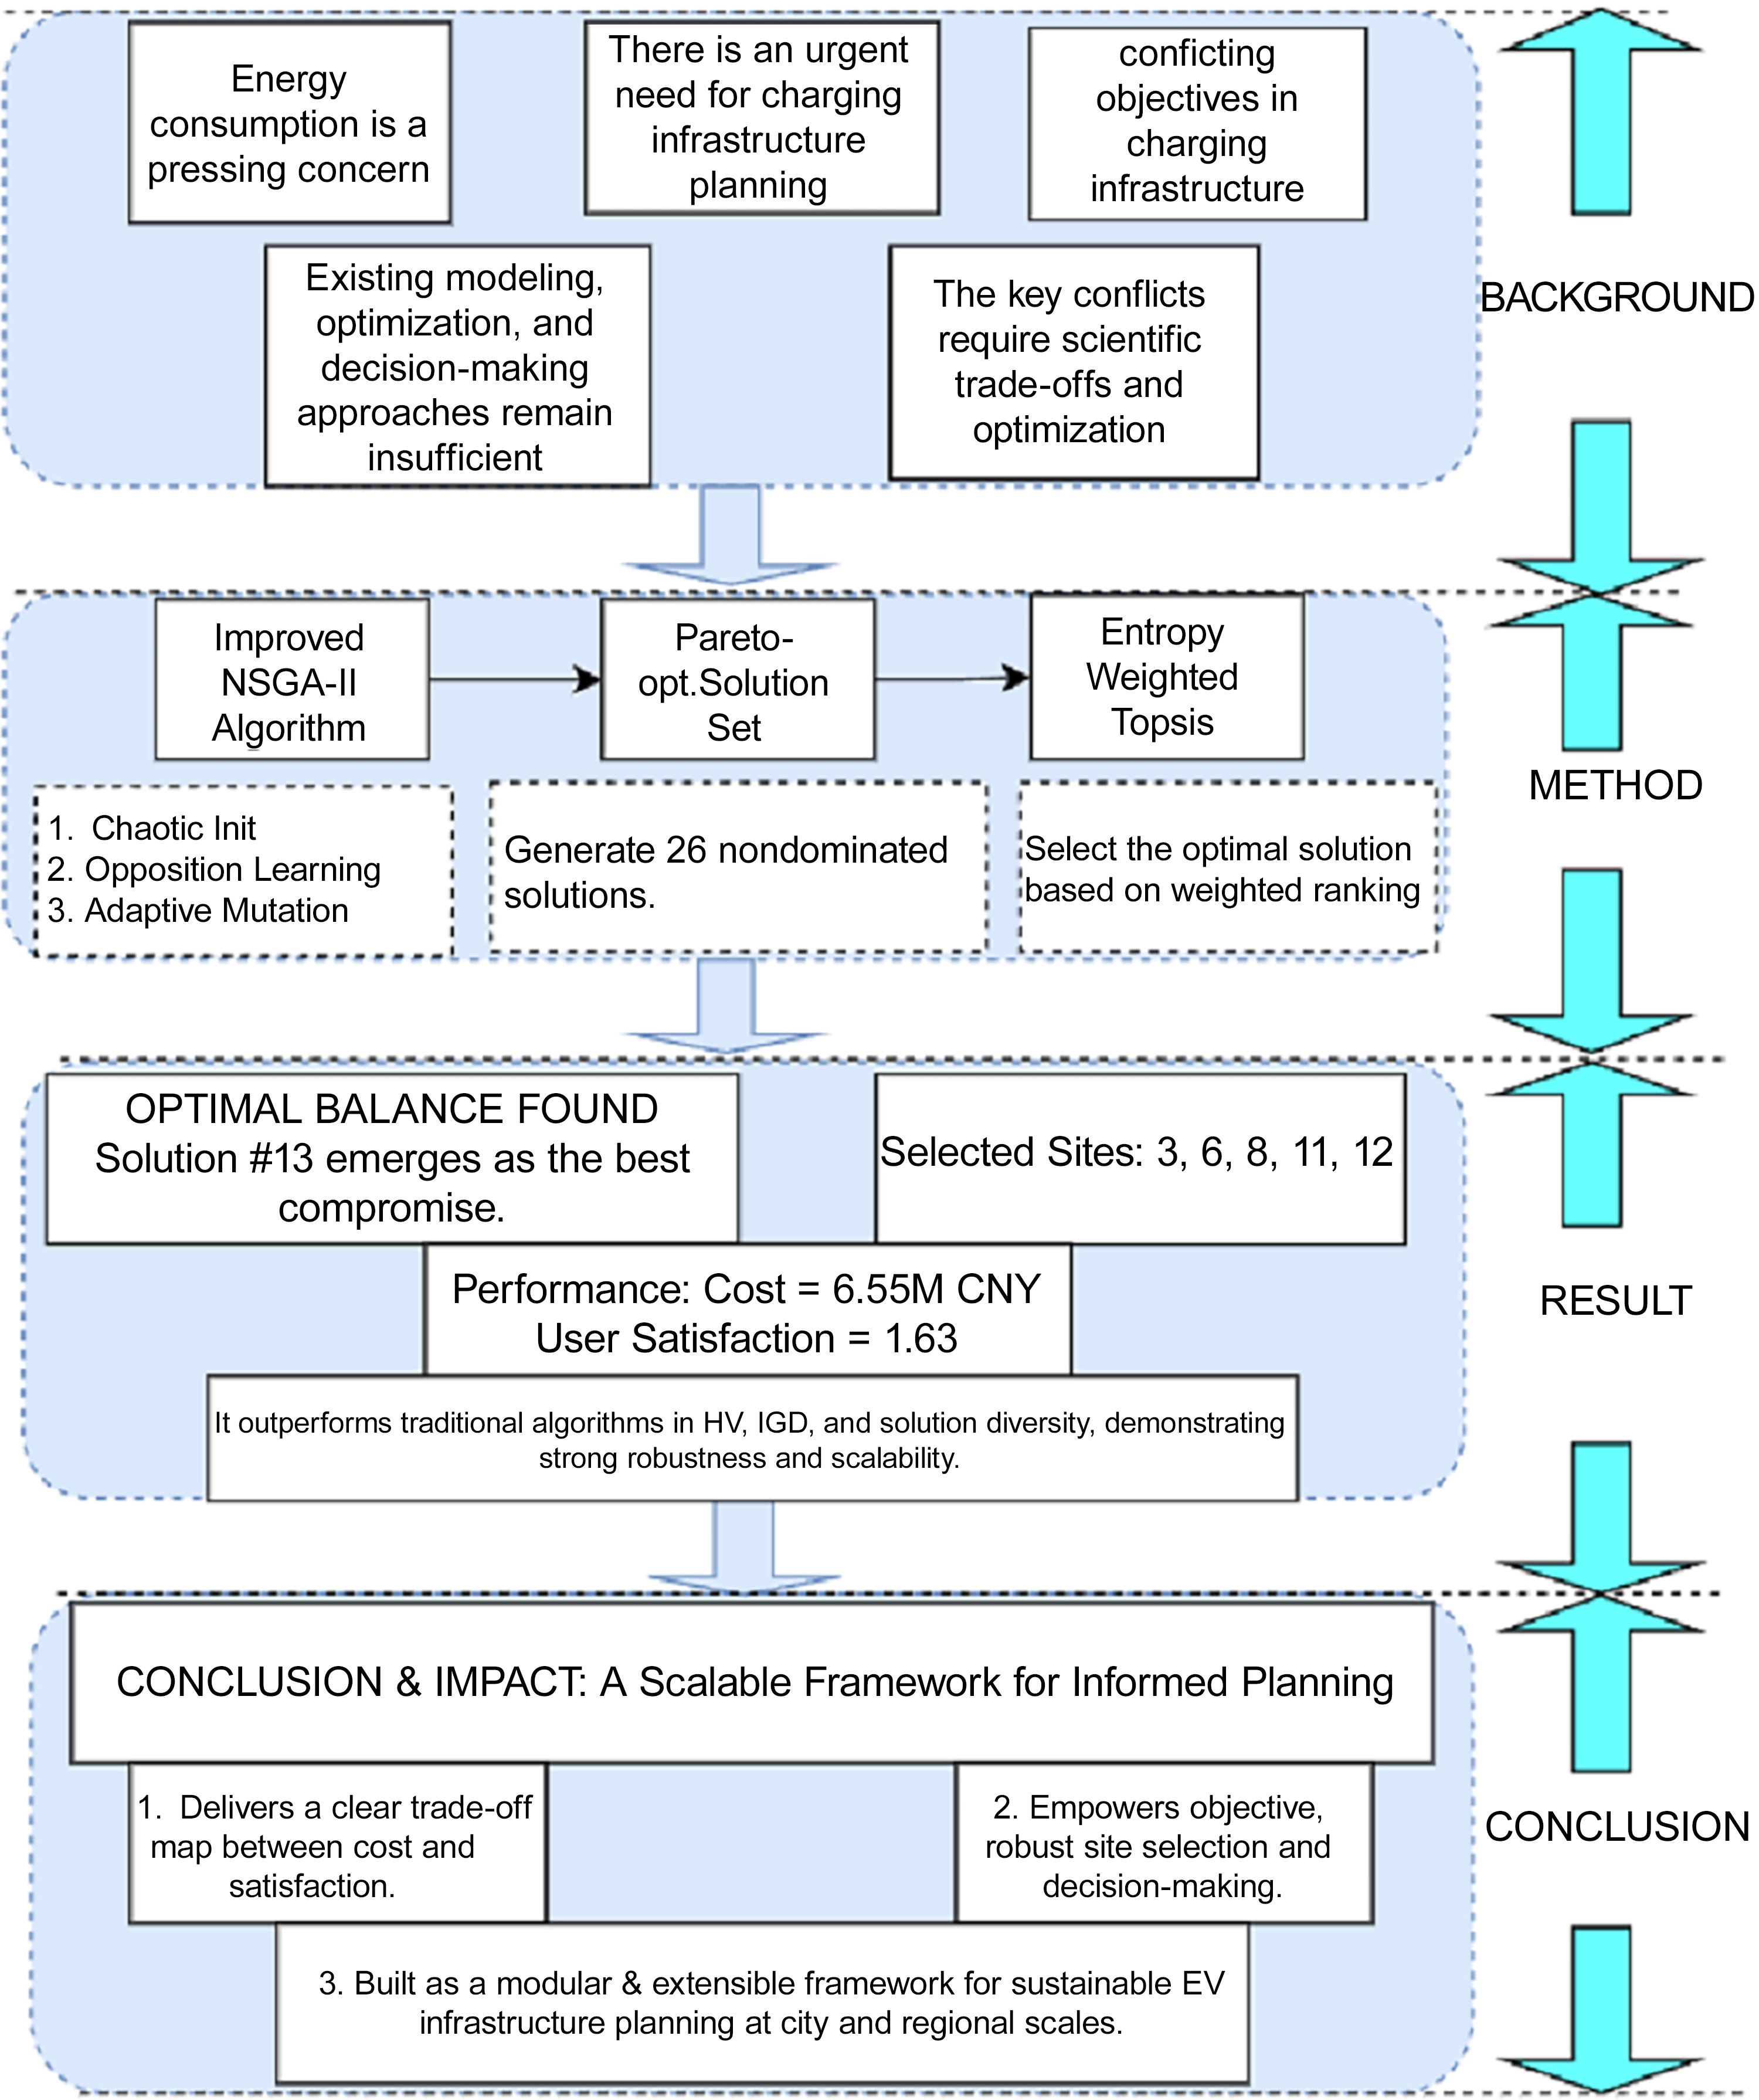
Graphical Abstract

1. Introduction

Energy serves as the cornerstone of social development. However, the reserves of non-renewable energy sources, primarily fossil fuels, are limited and continuously declining. In recent years, the global energy crisis has intensified, with imbalances between energy supply and demand and environmental degradation becoming major international concerns. Against this backdrop, the concept of sustainable development has created significant opportunities for the rapid growth of the electric vehicle (EV) industry. EVs, which replace traditional internal combustion engines with electric drive systems, can significantly reduce carbon emissions during operation [1] and effectively decrease dependence on petroleum resources. Consequently, EVs are widely regarded as a critical pathway for achieving energy conservation and emission reduction in the transportation sector and are expected to become the mainstream direction of future automotive development. Given the inherent limitations of EV driving range, the scientific planning of charging infrastructure locations within road networks is essential to ensure reliable energy supply. Charging station location planning not only directly affects the operational efficiency and economic performance of infrastructure providers but also plays a key role in shaping users’ charging experience and travel behavior. Therefore, research on EV charging station location holds significant theoretical and practical value for promoting the sustainable development of EV transportation systems.
This topic has attracted extensive attention from researchers in recent years. A data-driven approach has been proposed to optimize EV routing strategies and determine charging station locations [2]. User-oriented location models have also been developed by incorporating charging convenience, time, and cost as core decision factors [3]. Optimization models based on genetic algorithms have been constructed to minimize construction and operational costs under multiple constraints, such as depreciation periods, energy consumption, and spatial demand distribution [4]. To address demand uncertainty, stochastic optimization frameworks based on Benders decomposition have been introduced, demonstrating improved computational efficiency compared to traditional solvers, although challenges remain when considering complex capacity and congestion constraints [5]. In addition, charging station location problems have been formulated as submodular maximization models and solved using greedy-based algorithms under budget constraints [6]. Various metaheuristic algorithms, including Particle Swarm Optimization [7], Cuckoo Search Algorithm [8], Genetic Algorithm [9], and hybrid optimization strategies [10], have also been widely applied in this research field.
Despite the above progress, several limitations remain in existing studies on EV charging station location planning. First, user satisfaction or service quality is often modeled using linear or weighted distance-based functions, which may fail to capture the nonlinear perception of travel distance and charging convenience. Second, although multi-objective evolutionary algorithms are extensively employed, limited attention has been paid to the robustness of optimization results and algorithm behavior under parameter variations. Third, many studies focus primarily on generating Pareto-optimal solution sets, while the selection of a final compromise solution is often subjective and lacks a systematic decision-support mechanism. Recent studies published within the last five years have attempted to address these issues by integrating user preferences, fairness considerations, and advanced multi-objective evolutionary frameworks [11,12,13]. Nevertheless, a comprehensive framework that simultaneously incorporates nonlinear user satisfaction modeling, robust multi-objective optimization, and objective compromise solution selection remains insufficiently explored.
To address these gaps, this study proposes an integrated multi-objective optimization and decision-support framework for EV charging station location planning. A nonlinear user satisfaction function is constructed to better represent users’ perception of service distance and waiting time. An improved Non-dominated Sorting Genetic Algorithm II (NSGA-II) is employed to obtain high-quality Pareto-optimal solutions, and an entropy-weighted TOPSIS method is further introduced to objectively identify the best compromise solution from the Pareto front. Through this integrated framework, the trade-offs between economic cost and service quality can be characterized in a transparent and reproducible manner, providing practical support for EV charging infrastructure planning.

2. Modeling Framework and Optimization Methods

2.1. Modeling of Charging Station Siting Problem

This subsection establishes the mathematical framework for the siting optimization problem, including assumptions, objectives, and constraints.

2.1.1. Problem Assumptions

To effectively address the construction needs of electric vehicle charging stations while balancing the perspectives of both operators and users, this paper establishes the following assumptions for the charging station siting problem:
(1)
Each charging pile can only serve one electric vehicle at a time; simultaneous charging of multiple vehicles by a single pile is not considered.
(2)
All charging piles are of the same specification, meaning that their construction costs as well as the proportions of operation and maintenance costs are identical.
(3)
All users are restricted to selecting the nearest charging station for service. (The distance between demand points and candidate stations is measured using the Euclidean distance.)
(4)
The energy consumption of users during travel is solely related to the distance traveled, independent of other external factors.

2.1.2. Establishment of Multi-Objective Functions

Objective Function I
Total Operator Cost Minimization Function: The total operator cost minimization function comprises the construction cost, operation cost, and maintenance cost of the charging stations.
In the process of establishing electric vehicle charging stations, it is essential to consider not only the construction cost C1 but also the operation and maintenance cost C 2 . The mathematical expression is presented as follows:
C 1 = j = 1 J O j + q j N j + e j N j 2 t o ( 1 + t o ) k ( 1 + t o ) k 1
Among them, O j represents the fixed investment cost, including construction and capital investment costs; q j denotes the unit price of the charging pile; e j is the equivalent investment coefficient associated with the construction of charging stations and the procurement of related equipment; and t o refers to the discount rate. N j indicates the number of charging piles configured at station j. The operation and maintenance cost of an electric vehicle charging station is assumed to be proportional to its construction cost [14]. Therefore, the expression for the operation and maintenance cost C 2 can be formulated as follows:
C 2 = β j = 1 J O j + q j N j + e j N j 2 t o ( 1 + t o ) k ( 1 + t o ) k 1
Here, β represents the proportional coefficient.
In summary, the objective function for minimizing the total operating cost of electric vehicle (EV) charging stations can be expressed as follows:
m i n Z 1 = j = 1 J O j + q j N j + e j N j 2 t o ( 1 + t o ) k ( 1 + t o ) k 1 + β j = 1 J O j + q j N j + e j N j 2 t o ( 1 + t o ) k ( 1 + t o ) k 1
Objective Function II
Maximization of User Satisfaction. The objective function for maximizing user satisfaction consists of two components: the satisfaction function of charging waiting time and the satisfaction function of charging distance.
User satisfaction with the layout of charging facilities is significantly influenced by the geographical accessibility of charging stations, which shows a negative correlation with the distance to the station the shorter the distance, the higher the user satisfaction; conversely, as the distance increases, satisfaction decreases accordingly. Therefore, to quantitatively describe this relationship, the user satisfaction function is expressed as follows [15]:
S d ( d i j ) = 0 d i j > d m a x 1 2 + 1 2 cos π 2 + π d m a x d m i n d i j d m a x + d m i n 2 d m i n d i j d m a x   1 0 < d i j < d m i n
where S d ( d i j ) represents the user’s distance satisfaction, and d i j denotes the Euclidean distance between demand point i and candidate charging station j. Among them, d m i n and d m a x refer to the minimum acceptable distance threshold and the maximum tolerable distance threshold of users, respectively. Charging waiting time also significantly affects users’ charging experience. Excessive waiting time may directly reduce overall satisfaction and lead to negative perceptions. Therefore, the satisfaction function of charging waiting time is expressed as follows:
S ( T j ) = 0 T j > T m a x T m a x T j T m a x T m i n T m i n T j T m a x 1 T j < T m i n
The adoption of different mathematical forms for the two sub-satisfaction functions is motivated by the distinct ways in which users perceive distance and time. The distance satisfaction function S d ( d i j ) is modeled using a cosine-based formulation to capture users’ nonlinear sensitivity to travel distance. As the distance approaches the maximum tolerance threshold d m a x , satisfaction declines at an accelerating rate, thereby introducing a “soft constraint” effect that penalizes excessively long travel distances. In contrast, the waiting time satisfaction function S ( T j ) is modeled as a linear function within the acceptable interval [ T m i n , T m a x ] reflecting users’ approximately uniform psychological trade-off toward reasonable waiting durations [16].
This differentiated functional design enables the overall satisfaction metric Z 2 to exhibit heterogeneous sensitivity to distance and waiting time. Specifically, the model prioritizes the avoidance of sharp satisfaction losses caused by excessive distance through nonlinear penalization, while simultaneously achieving balanced improvements in waiting time through linear optimization. Consequently, the optimization process is guided toward a more refined and behaviorally consistent balance between spatial convenience and temporal acceptability, avoiding extreme deficiencies in any single dimension and resulting in siting solutions with enhanced practical rationality.
In the equation, S ( T j ) denotes the user’s satisfaction with waiting time, and T j represents the expected waiting time of users at candidate station j. The acceptable waiting time range for users is defined by the lower bound T m i n and the upper bound T m a x . Considering the randomness of electric vehicle charging demand and the variability of charging duration, users often experience queuing when charging resources are limited. Therefore, this queuing process is suitably modeled using the M/M/C queuing theory model [17].
T j = ( M j μ j ) M j μ j M j ! ( 1 μ j ) 2 A P i d l e
P i d l e = [ k = 0 M j 1 1 k ! ( A μ ) K + 1 M j ! 1 1 μ j ( A μ ) M j ] 1
μ j = A M j μ
where A represents the number of electric vehicles entering the charging station per hour, μ j denotes the service rate of candidate charging station j, P i d l e represents the probability that the charging station is idle, and μ refers to the average number of electric vehicles arriving at the charging station per hour.
In summary, the objective function for maximizing electric vehicle user satisfaction is expressed as follows:
m a x Z 2 = i I j J G i j q i S d ( d i j ) + S ( T j )
where Z 2 represents user satisfaction, considering the set of demand points I. For each demand point i I, the charging demand is denoted by q i . The model introduces a binary decision variable G i j to indicate the charging allocation relationship: when demand point i is assigned to candidate charging station j for charging, G i j = 1; otherwise, G i j = 0.

2.1.3. Related Constraints

In the planning of electric vehicle charging infrastructure, site selection decisions must satisfy multiple dimensional constraints to construct a feasible solution space. The constraint condition N J m i n N J N J m a x indicates that the number of charging piles N J at each charging station j is subject to practical limitations—it cannot fall below a minimum threshold N J m i n nor exceed a maximum threshold N J m a x . The constraint J m i n J J m a x specifies that the total number of charging stations J in the planning area is restricted by budget, land availability, and other resources, and must lie between a minimum J m i n and a maximum J m a x . The constraint j J G i j = 1, I , ensures that each demand point i is assigned to exactly one charging station J for service. The conditions d i j d m a x and T j T m a x respectively require that the distance d i j from demand point ii to charging station j does not exceed a maximum acceptable distance d m a x (based on the Euclidean distance), and the service time T j at station j does not exceed a maximum acceptable service time T m a x . Finally, the binary variable Y j {0, 1} indicates whether a charging station is constructed at candidate location j (1 if constructed, 0 otherwise).

2.2. Improved NSGA-II Algorithm and TOPSIS-Based Decision-Making Method

In the multi-objective siting study of electric vehicle charging and battery-swapping stations, the performance of the optimization algorithm and the rationality of the decision-making method directly determine the scientific validity of the results. Traditional NSGA-II algorithms are prone to local optima when addressing complex nonlinear problems, while conventional TOPSIS methods are highly sensitive to weight assignment and distance measurement, making it difficult to accurately evaluate the superiority of alternative solutions. Therefore, this study introduces improvements to both methods to enhance the global search capability of the optimization process and the reliability of the final decision outcomes.

2.2.1. Improved NSGA-II Algorithm

To address the limitations of the conventional NSGA-II algorithm when solving the complex multi-objective electric vehicle charging station location problem, this section incorporates three core improvement modules. Each of these modules is developed based on well-established strategies that have been extensively validated in complex optimization problems and proven effective in enhancing search performance [18]. First, an enhanced chaotic initialization strategy is employed, in which multiple chaotic maps are selected at the variable level in a stochastic manner to improve the quality and diversity of the initial population. Second, an intelligent opposition-based learning mechanism is introduced to periodically explore opposite regions of the solution space, thereby accelerating convergence and mitigating premature stagnation. Third, an adaptive hybrid mutation operator is designed to dynamically coordinate four mutation strategies according to the evolutionary state, achieving a balanced trade-off between global exploration and local exploitation. Through the synergistic integration of these mature mechanisms, the proposed algorithm exhibits significantly improved global search capability, convergence accuracy, and solution diversity. Consequently, a high-quality Pareto front is obtained, providing a reliable foundation for subsequent multi-criteria decision-making.
Enhanced Chaotic Initialization Mapping
In this study, an enhanced chaotic mapping initialization approach is introduced, wherein each decision variable is initialized using a “randomly selected chaotic map from a pool of five distinct types”: Logistic, Tent, Circle, Gauss, and Henon. This method replaces the conventional random initialization method [19]. The parameters of these mappings are determined based on chaotic dynamics theory to ensure that the system operates within a chaotic state. By leveraging the sensitivity to initial conditions and ergodicity inherent in chaotic systems, this method effectively generates a high-quality and highly diverse initial population for the optimization process.
During population initialization, for each dimension (decision variable) of each individual, one chaotic map is randomly chosen from the five available types. The selected map iterates five times to generate a chaotic sequence value, which is then linearly scaled to the actual solution space bounds. This “variable-wise random selection strategy” ensures that different chaotic dynamics simultaneously influence different dimensions of the solution vector, creating a heterogeneous initialization that enhances both spatial coverage and population diversity.
The mathematical expressions for the five chaotic maps are as follows:
Logistic   Map :   X n + 1 = r · X n · ( 1 X n ) , r     [ 3.8 ,   4 ]
Tent   Map :   X n + 1 = X n μ , X n < μ 1 X n 1 μ , X n μ , μ = 0.499
Circle   Map :   X n + 1 = [ X n + b · a 2 π sin ( 2 π X n ) ] mod 1 , a = 0.5 , b = 0.2
Gauss   Map :   X n + 1 = e x p ( α · x n 2 ) ,   α = 0.7
Henon   Map :   X n + 1 = 1 a · x n 2 + b · X n , a = 1.4 , b = 0.3
The solution space mapping formula is:
x i = L i + ( U i L i ) · x i
where xi′ is the value mapped to the actual solution space, Li and U i are the lower and upper bounds of the i t h dimension, respectively, and xi is the i t h dimension normalized value generated by the chaotic map within the interval [0, 1].
This initialization strategy combines three types of solutions: coverage-oriented solutions (20%), random feasible solutions (30%), and chaotic mapping solutions (50%), ensuring uniform spatial distribution of the initial solutions. The variable-wise random selection of chaotic maps introduces heterogeneous chaotic dynamics across different dimensions, preventing premature homogeneity and enhancing the algorithm’s exploration capability in complex multi-dimensional search spaces.
Introduction of an Intelligent Opposition-Based Learning Strategy [20]
In this study, a periodic (every five generations) population enhancement mechanism is proposed. For feasible solutions, corresponding opposite solutions are generated and evaluated, while infeasible solutions are repaired through a corrective strategy. Furthermore, elite individuals are selected based on the diversity of the objective space to maintain population balance and enhance the overall search performance.
X o p p = L + U x c u r
Here, X o p p represents the generated opposite solution. The number L is assumed to denote the lower bound of the solution space, U is supposed to signify the upper bound of the solution space, and x c u r stands for the current solution. By using this formula, we can explore solutions that are opposite to the current solution within the solution space, thus potentially discovering better solutions and improving the algorithm’s performance.
Adaptive Hybrid Mutation Operator
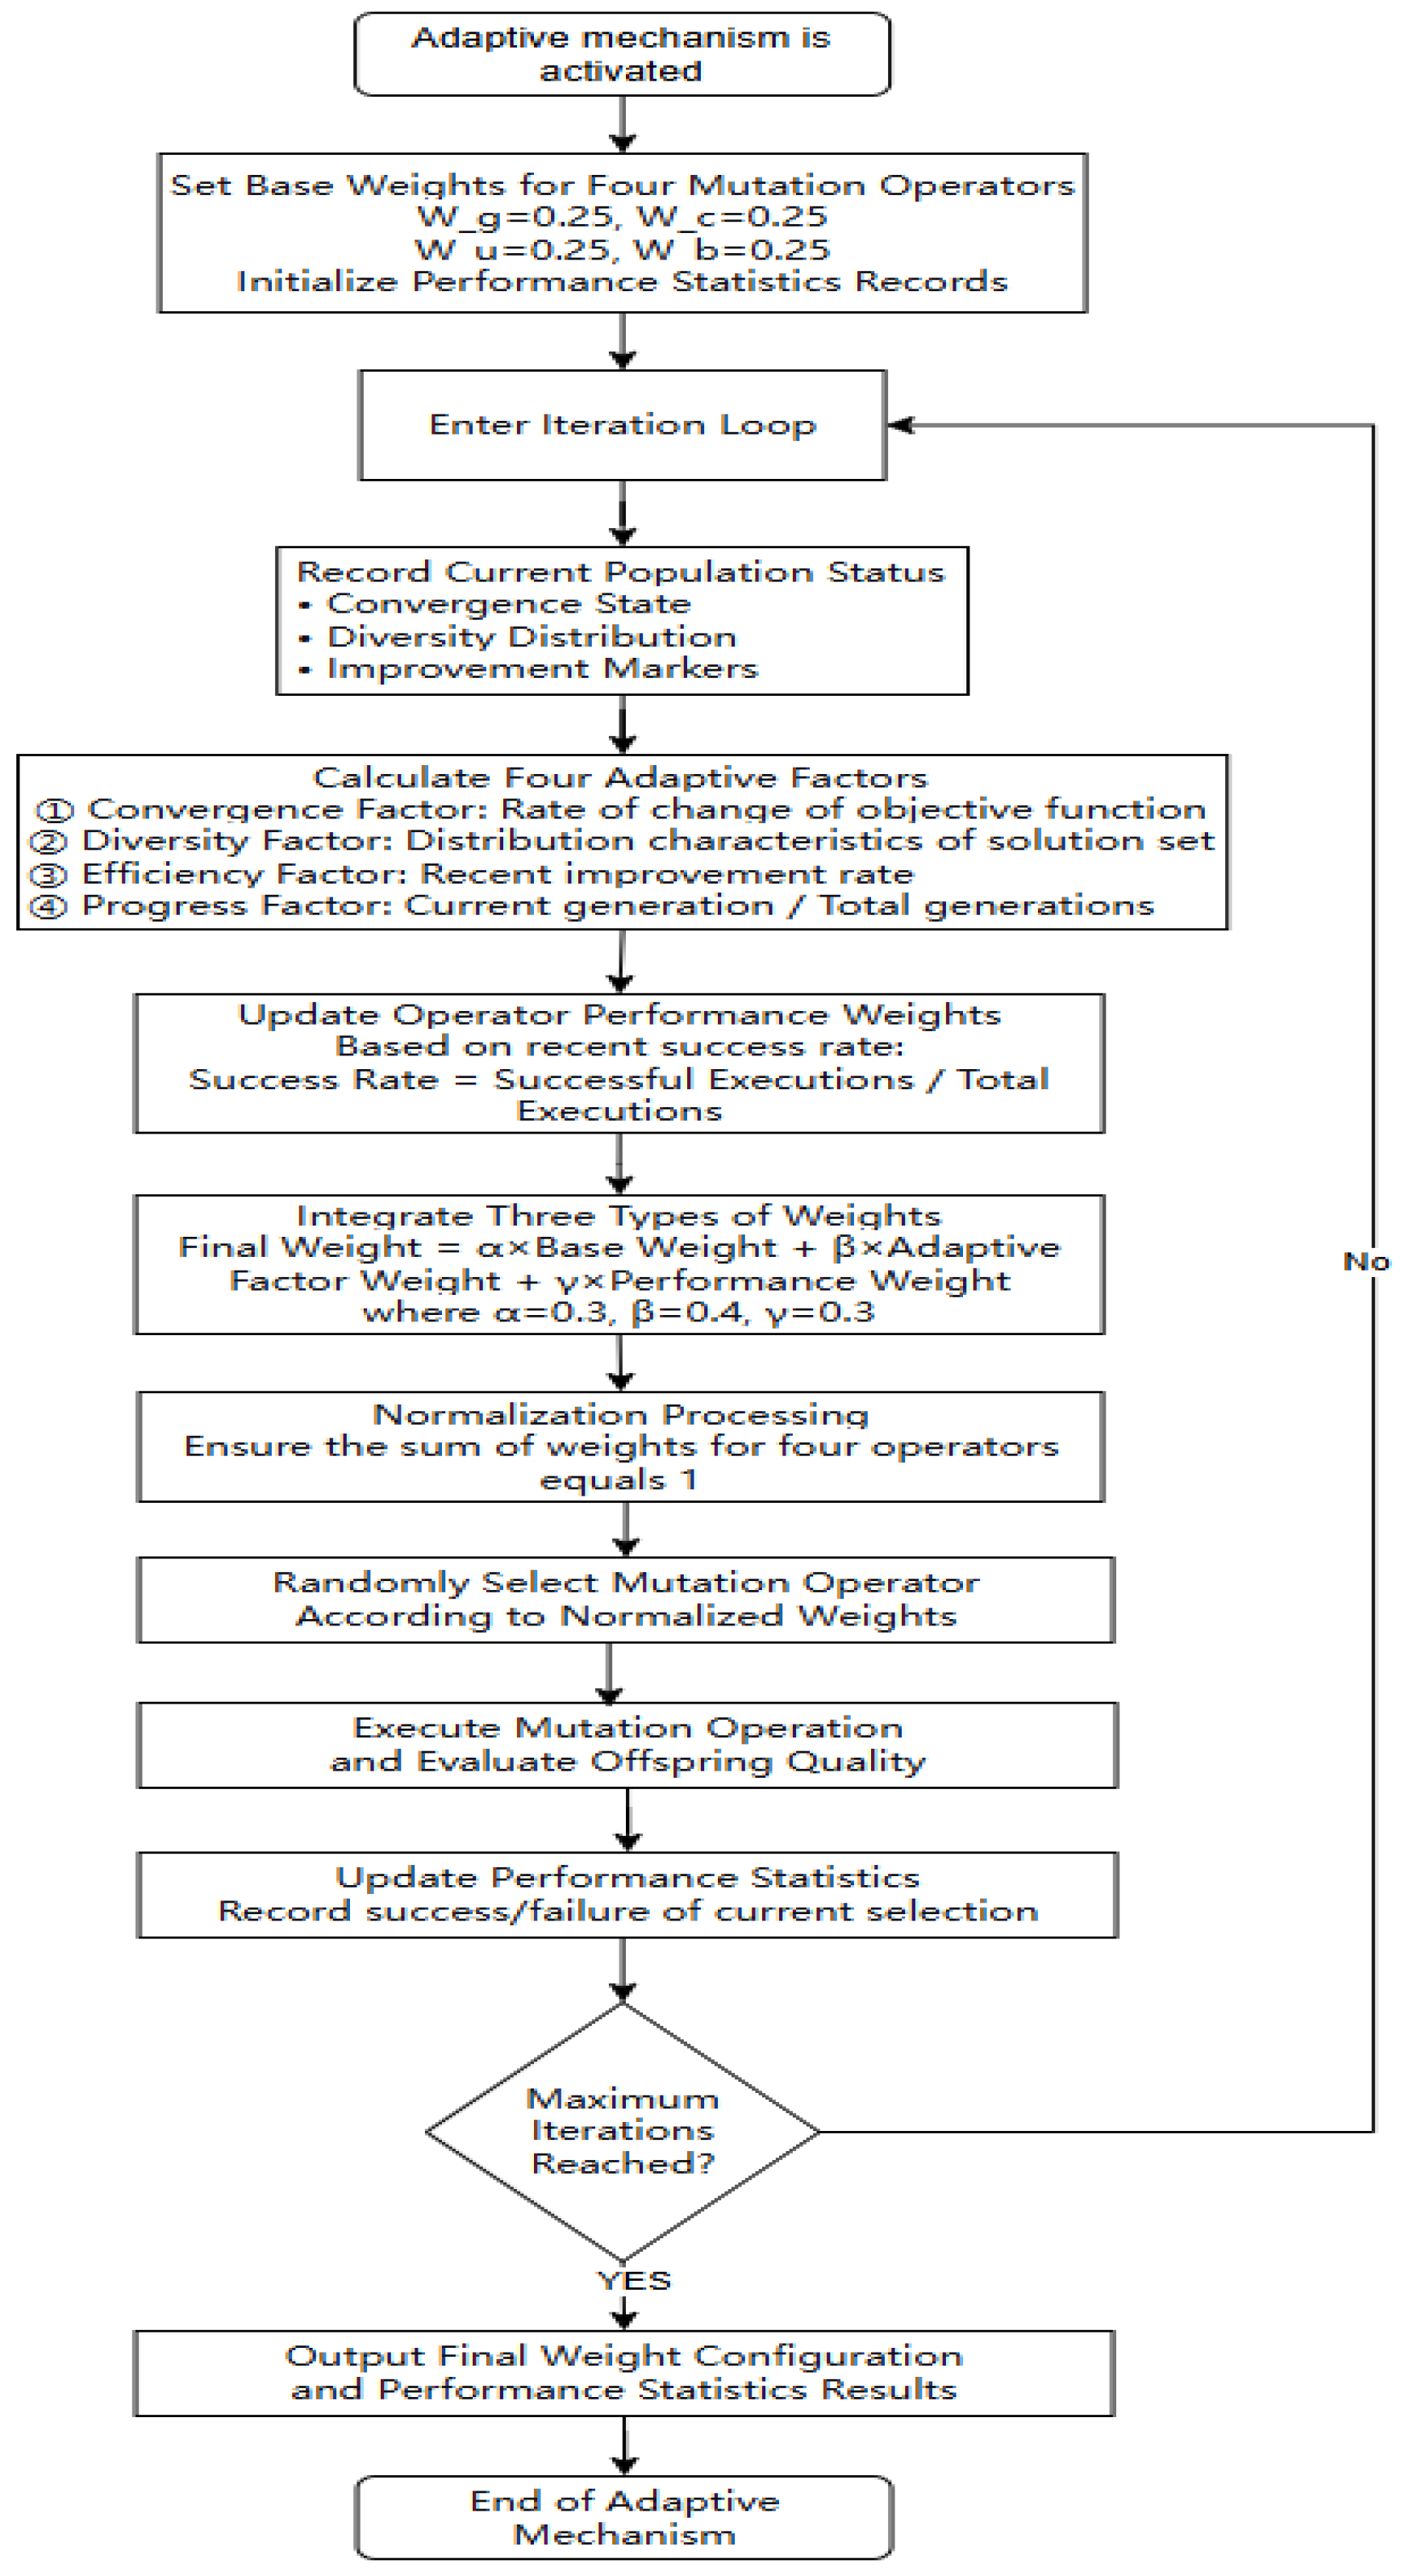
The core of this study lies in the construction of an adaptive dynamic adjustment mechanism, through which a hybrid mutation operator is introduced to coordinate four types of mutation strategies: Gaussian, chaotic, uniform, and boundary mutations. The parameter settings follow conventional domain guidelines, with the simulated binary crossover distribution index set to η = 20 and the elite retention threshold set to 0.7. This mechanism adaptively adjusts the selection probability and mutation intensity of operators in real time, intelligently balancing global exploration and local exploitation throughout the optimization process. The adaptive weight management system dynamically adjusts the selection probabilities of mutation operators based on four key factors: ① the convergence factor, which monitors the rate of change the objective function value; ② the diversity factor, which quantifies the distribution characteristics of the population in the objective space; ③ the efficiency factor, which counts the recent improvement rate; and ④ the progress factor, which tracks the ratio of the current generation to the total number of generations. By combining these factors with weights α = 0.3, β = 0.4, and γ = 0.3, the system tends to favor exploratory operators (uniform and chaotic mutations) in the early stages and exploitative operators (Gaussian and boundary mutations) in the later stages.
To better illustrate the workflow of this adaptive mechanism, Figure 1 presents a complete flowchart of its decision-making and adjustment process.
To effectively balance exploration and exploitation throughout the evolutionary process, an adaptive mutation weight management system is designed. This system dynamically adjusts the selection probabilities of four mutation operators—Gaussian, chaotic, uniform, and boundary mutations—based on real-time feedback from the evolutionary state. The adaptive mechanism evaluates four key factors to determine the optimal weight distribution:
  • Convergence Factor ( C f ): Monitors the rate of change the best objective value over recent generations. A high C f indicates slow convergence, prompting increased exploration via uniform and chaotic mutations.
  • Diversity Factor ( D f ): Quantifies the distribution of solutions in the objective space using Euclidean dispersion. Low diversity triggers higher weights for exploratory operators (uniform and chaotic) to enhance population spread.
  • Efficiency Factor ( E f ): Tracks the recent improvement rate of Pareto solutions. A low E f suggests stagnation, leading to increased use of disruptive operators (Gaussian and boundary mutations) to escape local optima.
  • Progress Factor ( P f ): Represents the ratio of the current generation to the total generations ( P f = g e n / max_gen ) As P f increases, the algorithm shifts from exploration to exploitation, favoring Gaussian and boundary mutations for local refinement.
The adaptive weight for each operator is computed as:
W o p = W b a s e , o p + α · C f + β · D f + γ · E f + δ · P f
where W b a s e , o p is the baseline weight, and α = 0.3, β = 0.4, and γ = 0.3 are tunable coefficients balancing the influence of each factor. The weights are normalized after each update to ensure a valid probability distribution.
Additionally, a performance tracking module records the success rate of each operator. Operators with higher historical success rates receive incremental weight bonuses, reinforcing effective search behaviors.
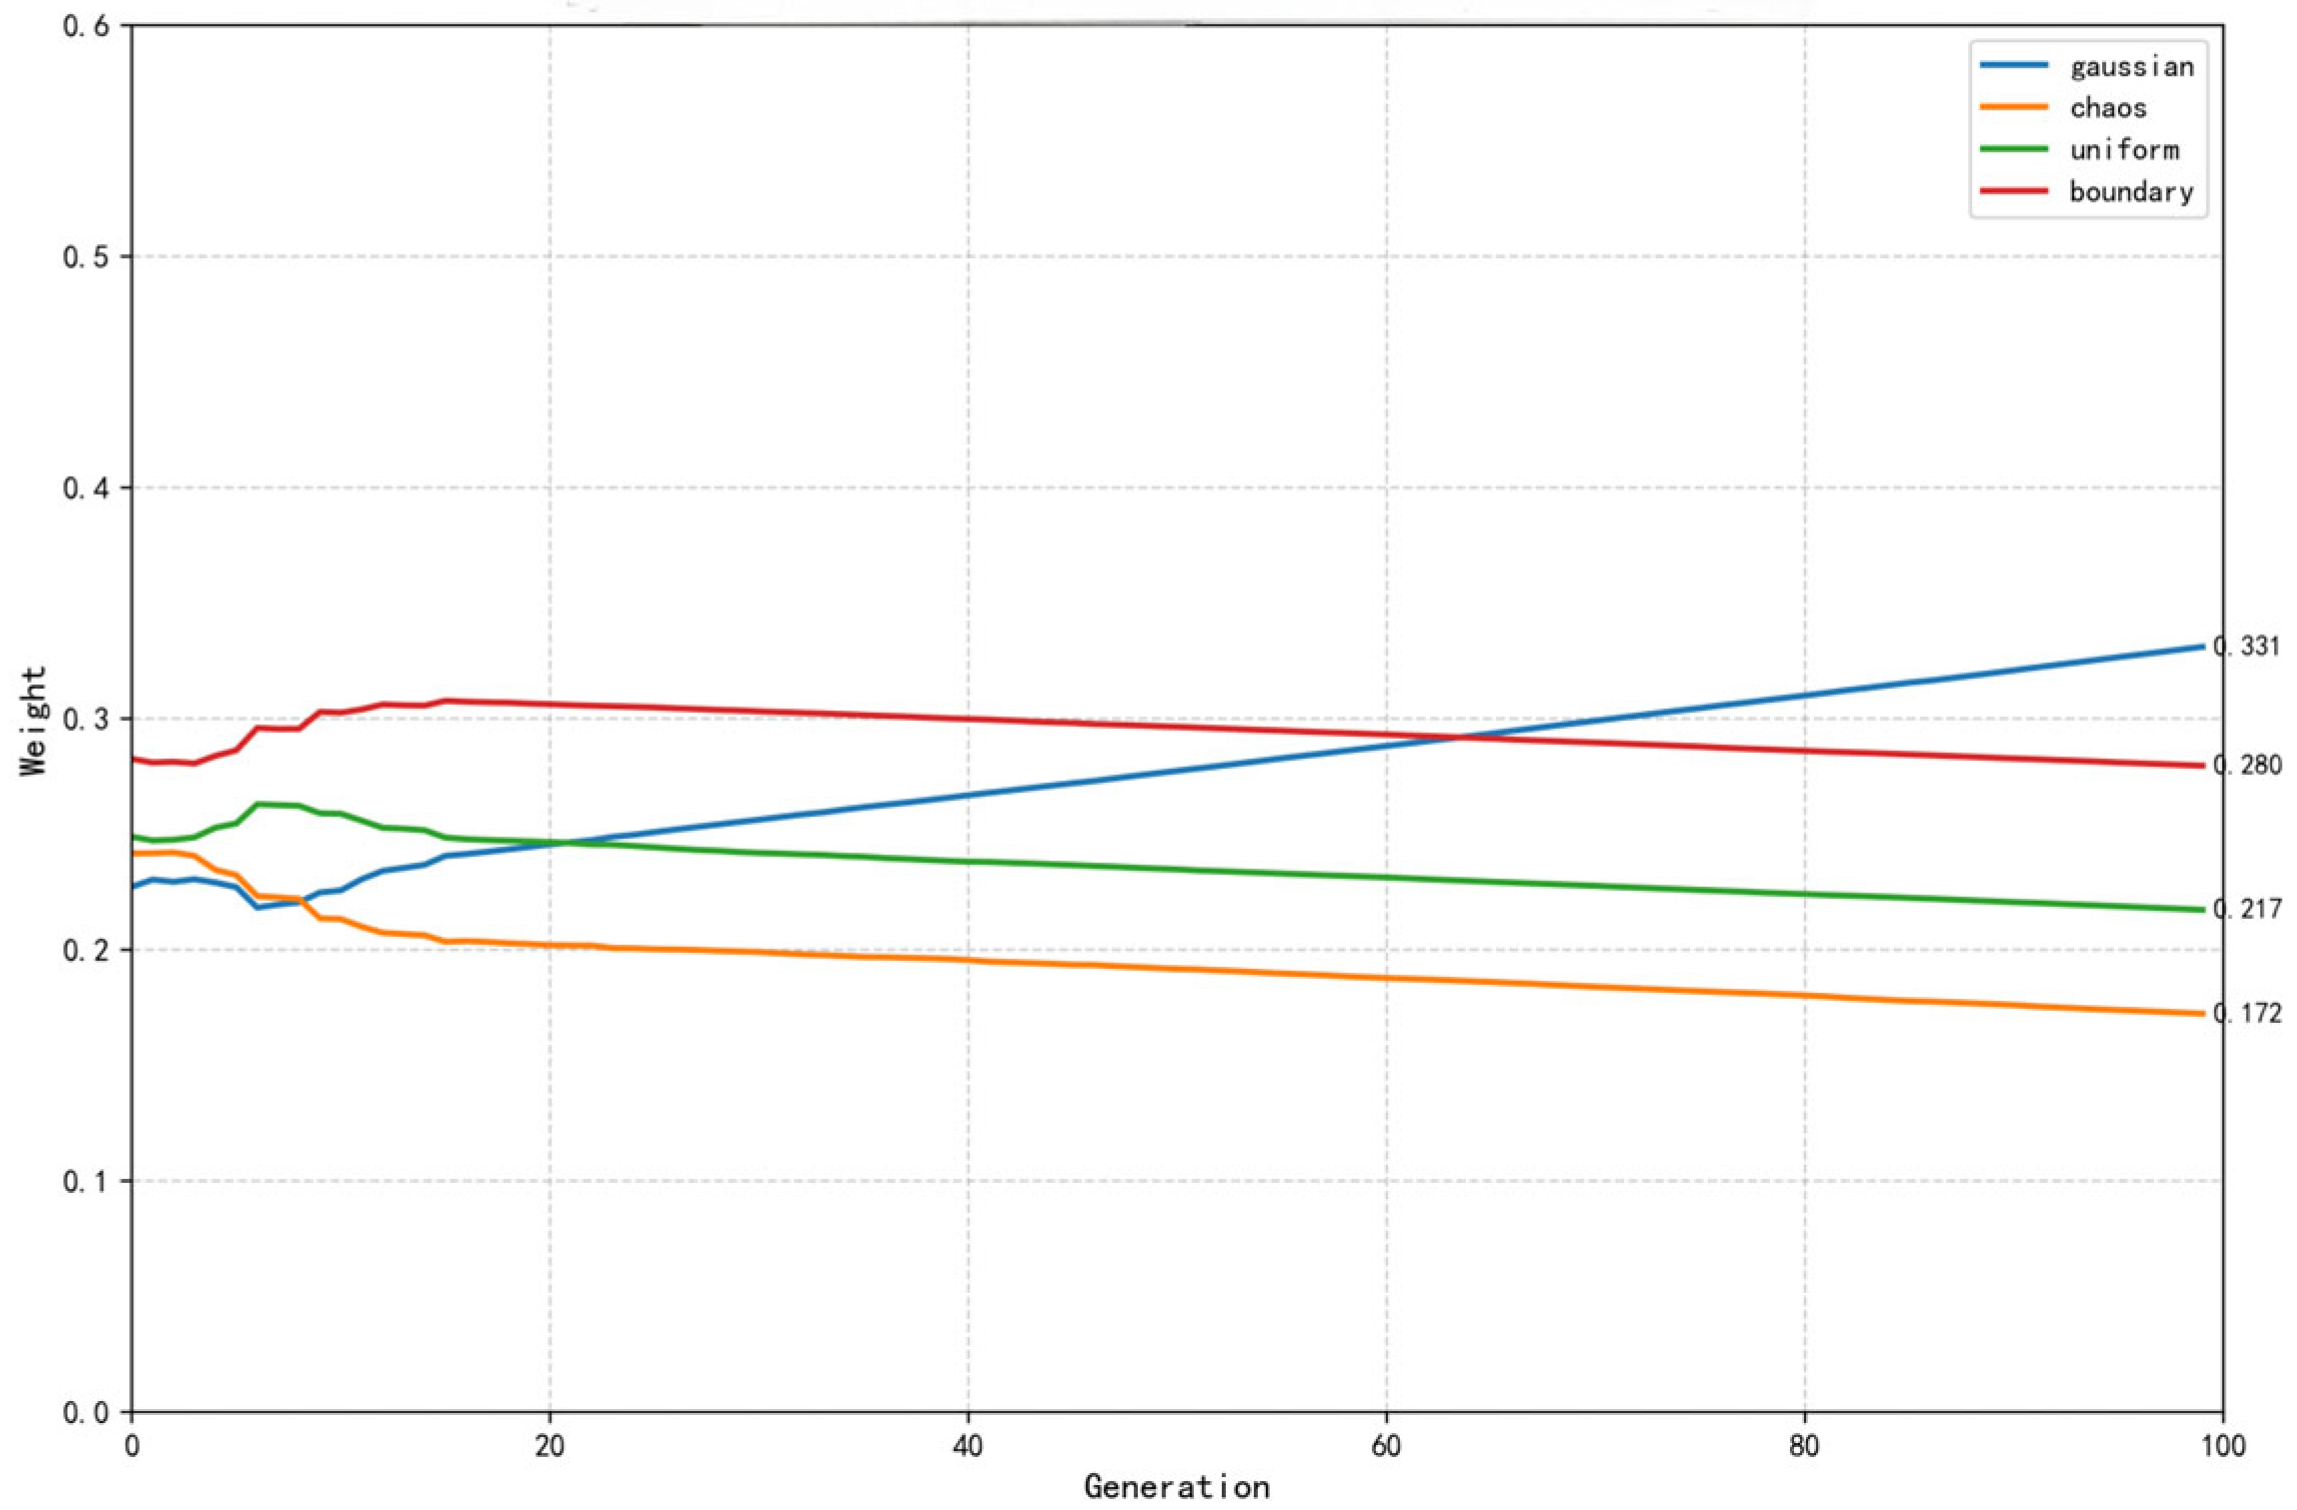
The adaptive weight adjustment mechanism, as illustrated in Figure 2, demonstrates a clear transition in operator emphasis throughout the evolutionary process. In the early stages (approximately 0–20 generations), when population diversity is crucial, the algorithm assigns higher weights to chaotic and uniform mutation operators, promoting extensive exploration of the solution space. As evolution progresses (20–60 generations), a gradual transition occurs, with Gaussian and boundary mutations gaining prominence. Finally, in the later stages (60–80 generations), Gaussian and boundary mutations become dominant, facilitating fine-tuning near the Pareto front. This dynamic adjustment represents a self-regulating search strategy that robustly adapts to problem landscape characteristics, effectively balancing exploration and exploitation to avoid premature convergence while enhancing global search capability.
Gaussian Mutation: Gaussian mutation introduces random perturbations following a normal distribution, and is expressed as follows:
x i = x i + N ( 0 , σ )
where N ( 0 , σ ) denotes a normally distributed random variable with a mean of 0 and a variance of σ ; x i represents the variable value before mutation, and x i represents the resulting value after mutation.
Chaotic Mutation: Mutation values are generated by utilizing the ergodicity of the chaotic map. In this study, “either the Logistic map or the Tent map is randomly selected” to generate chaotic sequences for the mutation operation. This reduced set of chaotic maps maintains computational efficiency while preserving the exploration capability of chaotic search during the evolutionary process.
x i = L i + ( U i L i ) C h a o s M a p ( r )
Li denotes the lower bound of the i t h dimension in the solution space, U i represents the upper bound of the i t h dimension in the solution space, and C h a o s M a p ( r ) stands for the chaotic mapping function.
Uniform Mutation: This operation is implemented by generating a stochastic perturbation that follows a uniform distribution across the entire search space, wherein the new value is sampled between the defined lower and upper bounds for each variable. The formula is given by:
x i = U ( L i ,   U i )
where U ( L i ,   U i ) denotes a random number uniformly distributed over the interval [ L i ,   U i ].
Boundary Mutation: This operator sets a variable to either its lower or upper bound with equal probability. The formula is as follows:
x i = Li ,   with   a   probability   of   0.5 Ui ,   with   a   probability   of   0.5
The offspring are generated using simulated binary crossover, which begins with the definition of a distribution parameter, denoted as β:
β = ( 2 u ) 1 ( η + 1 ) , u 0.5 ( 1 2 1 u ) 1 ( η + 1 ) , u > 0.5
where η = 20 is the distribution index, and u~U(0, 1) is a random number from a uniform distribution on the interval [0, 1].
Based on β the offspring W1 and W2 are calculated as follows:
  W 1 = 0.5 [ ( 1 + = β ) p 1 + ( 1 β ) p 2 ] W 2 = 0.5 [ ( 1 β ) p 1 + ( 1 + β ) p 2 ]
where p1 and p2 are the parent individuals involved in the crossover.
To preserve high-quality genes, an elite gene transmission mechanism is designed:
Q i = P e l i t e , i , P e l i t e > 0.7 Q i , other
where P e l i t e , i denotes the i t h gene of the elite individual, and Q i represents the corresponding offspring gene after crossover or mutation.
By leveraging the integrated and synergistic effects of the above-mentioned mutation operators, we have achieved a marked enhancement in both the quality of the solution set and the convergence performance of the algorithm when addressing the charging station location problem.

2.2.2. Improved Entropy-Weighted TOPSIS Decision-Making Model

After generating the Pareto optimal solution set using the relevant algorithm, it is necessary to further identify the most representative compromise solution. The traditional TOPSIS method, as a multi-criteria decision-making tool, has been widely applied across various domains, demonstrating practical utility in prioritization, resource allocation, and infrastructure planning [21,22]. However, TOPSIS still exhibits certain inherent limitations, including subjectivity in weight determination, simplicity in normalization procedures, and lack of transparency in the decision-making process. To address these issues, this study proposes an improved TOPSIS model based on entropy weight theory. The proposed model incorporates an objective weight assignment mechanism, an enhanced indicator normalization method, and a systematic decision-tracking process, thereby constructing an interpretable multi-criteria decision-making framework to support the selection of optimal solutions from the algorithm’s output. Specifically, the following improvements are implemented to overcome the deficiencies of traditional TOPSIS in normalization, weight determination, and result stability [23].
Differential Ratio Normalization
To enhance the robustness and stability of the normalization process, this study introduces a differential ratio normalization method, incorporating a smoothing factor ε to mitigate numerical instability when the denominator approaches zero. According to the characteristics of the evaluation indicators, the normalization formulas are defined as follows:
For cost-type indicators (e.g., total operator cost, where a smaller value indicates better performance):
r c i j = ( max ( x i ) x i j ) ( max ( x i ) min ( x i ) ) + ε ,
For benefit-type indicators (e.g., user satisfaction, where a larger value indicates better performance):
r e i j = ( x i j min ( x i ) ) ( max ( x i ) min ( x i ) ) + ε
Here, r c i j represents the normalized result of cost-type indicators (where smaller values indicate better performance), and r e i j represents the normalized result of benefit-type indicators (where larger values indicate better performance). The parameter ϵ = 10 10 is introduced as a numerical smoothing factor to ensure the numerical stability of the algorithm.
Entropy-Based Adaptive Determination of Indicator Weights
To achieve objective and dynamically adaptive weight allocation, this study adopts an entropy-based adaptive weighting method. The fundamental principle is that the greater the degree of dispersion of an indicator among different alternatives, the more information it conveys, and consequently, the greater its influence on the overall evaluation result. Therefore, such indicators should be assigned higher weights.
The calculation procedure is as follows:
First, compute the proportion of each indicator as follows:
P i j = r i j i = 1 m r i j
Here, P i j denotes the proportion of the i t h alternative under the j t h indicator, r i j represents the normalized value of the indicator, and m is the total number of alternatives.
Next, the information entropy of each indicator is calculated as follows:
e i j = 1 l n m i = 1 m p i j l n ( p i j + ε )
Here, e i j represents the information entropy of the j t h indicator, and ε is a smoothing factor introduced to avoid the occurrence of ln0. A smaller value of e i j indicates a greater degree of variation the indicator among different alternatives, implying that it carries more information.
Finally, the weight of each indicator is determined according to the degree of dispersion reflected by its information entropy:
w j = 1 e i j j = 1 n ( 1 e i j )
Here, w j denotes the normalized weight of the j t h indicator, and n represents the total number of indicators.
Perturbation-Corrected Relative Closeness Calculation
To address the numerical deficiencies in the traditional TOPSIS relative closeness calculation, this study introduces a key optimization strategy by embedding a perturbation factor ε into the computation formula. This modification aims to attenuate sensitivity to extreme values and smooth numerical fluctuations, thereby establishing a more robust decision-making basis for the selection of optimal alternatives. The improved relative closeness calculation formula is expressed as follows:
C i = D i D i + + D i + ε
Here, D i + and D i represent the Euclidean distances between the i t h alternative and the positive ideal solution and negative ideal solution, respectively. The introduced correction term ensures the stability of the denominator under extremely small distance conditions, thereby avoiding abnormal amplification of the closeness coefficient. This improvement enhances the model’s computational accuracy and stability in distinguishing highly similar alternatives. Moreover, the proposed method demonstrates strong discriminative ability and numerical consistency when handling outliers and noisy data, ensuring robust and reliable rankings. To further assess its sensitivity to weight allocation, comparative experiments with the subjectively weighted AHP are conducted in subsequent sections, highlighting the superiority of the objective entropy weight method in managing weight fluctuations.

3. Case Study and Results Analysis

This section presents the case study and corresponding simulation results based on the proposed modeling and optimization framework. It details the simulation setup, model solution outcomes, and algorithmic performance comparison, followed by a comprehensive discussion of the key findings.

3.1. Test Case

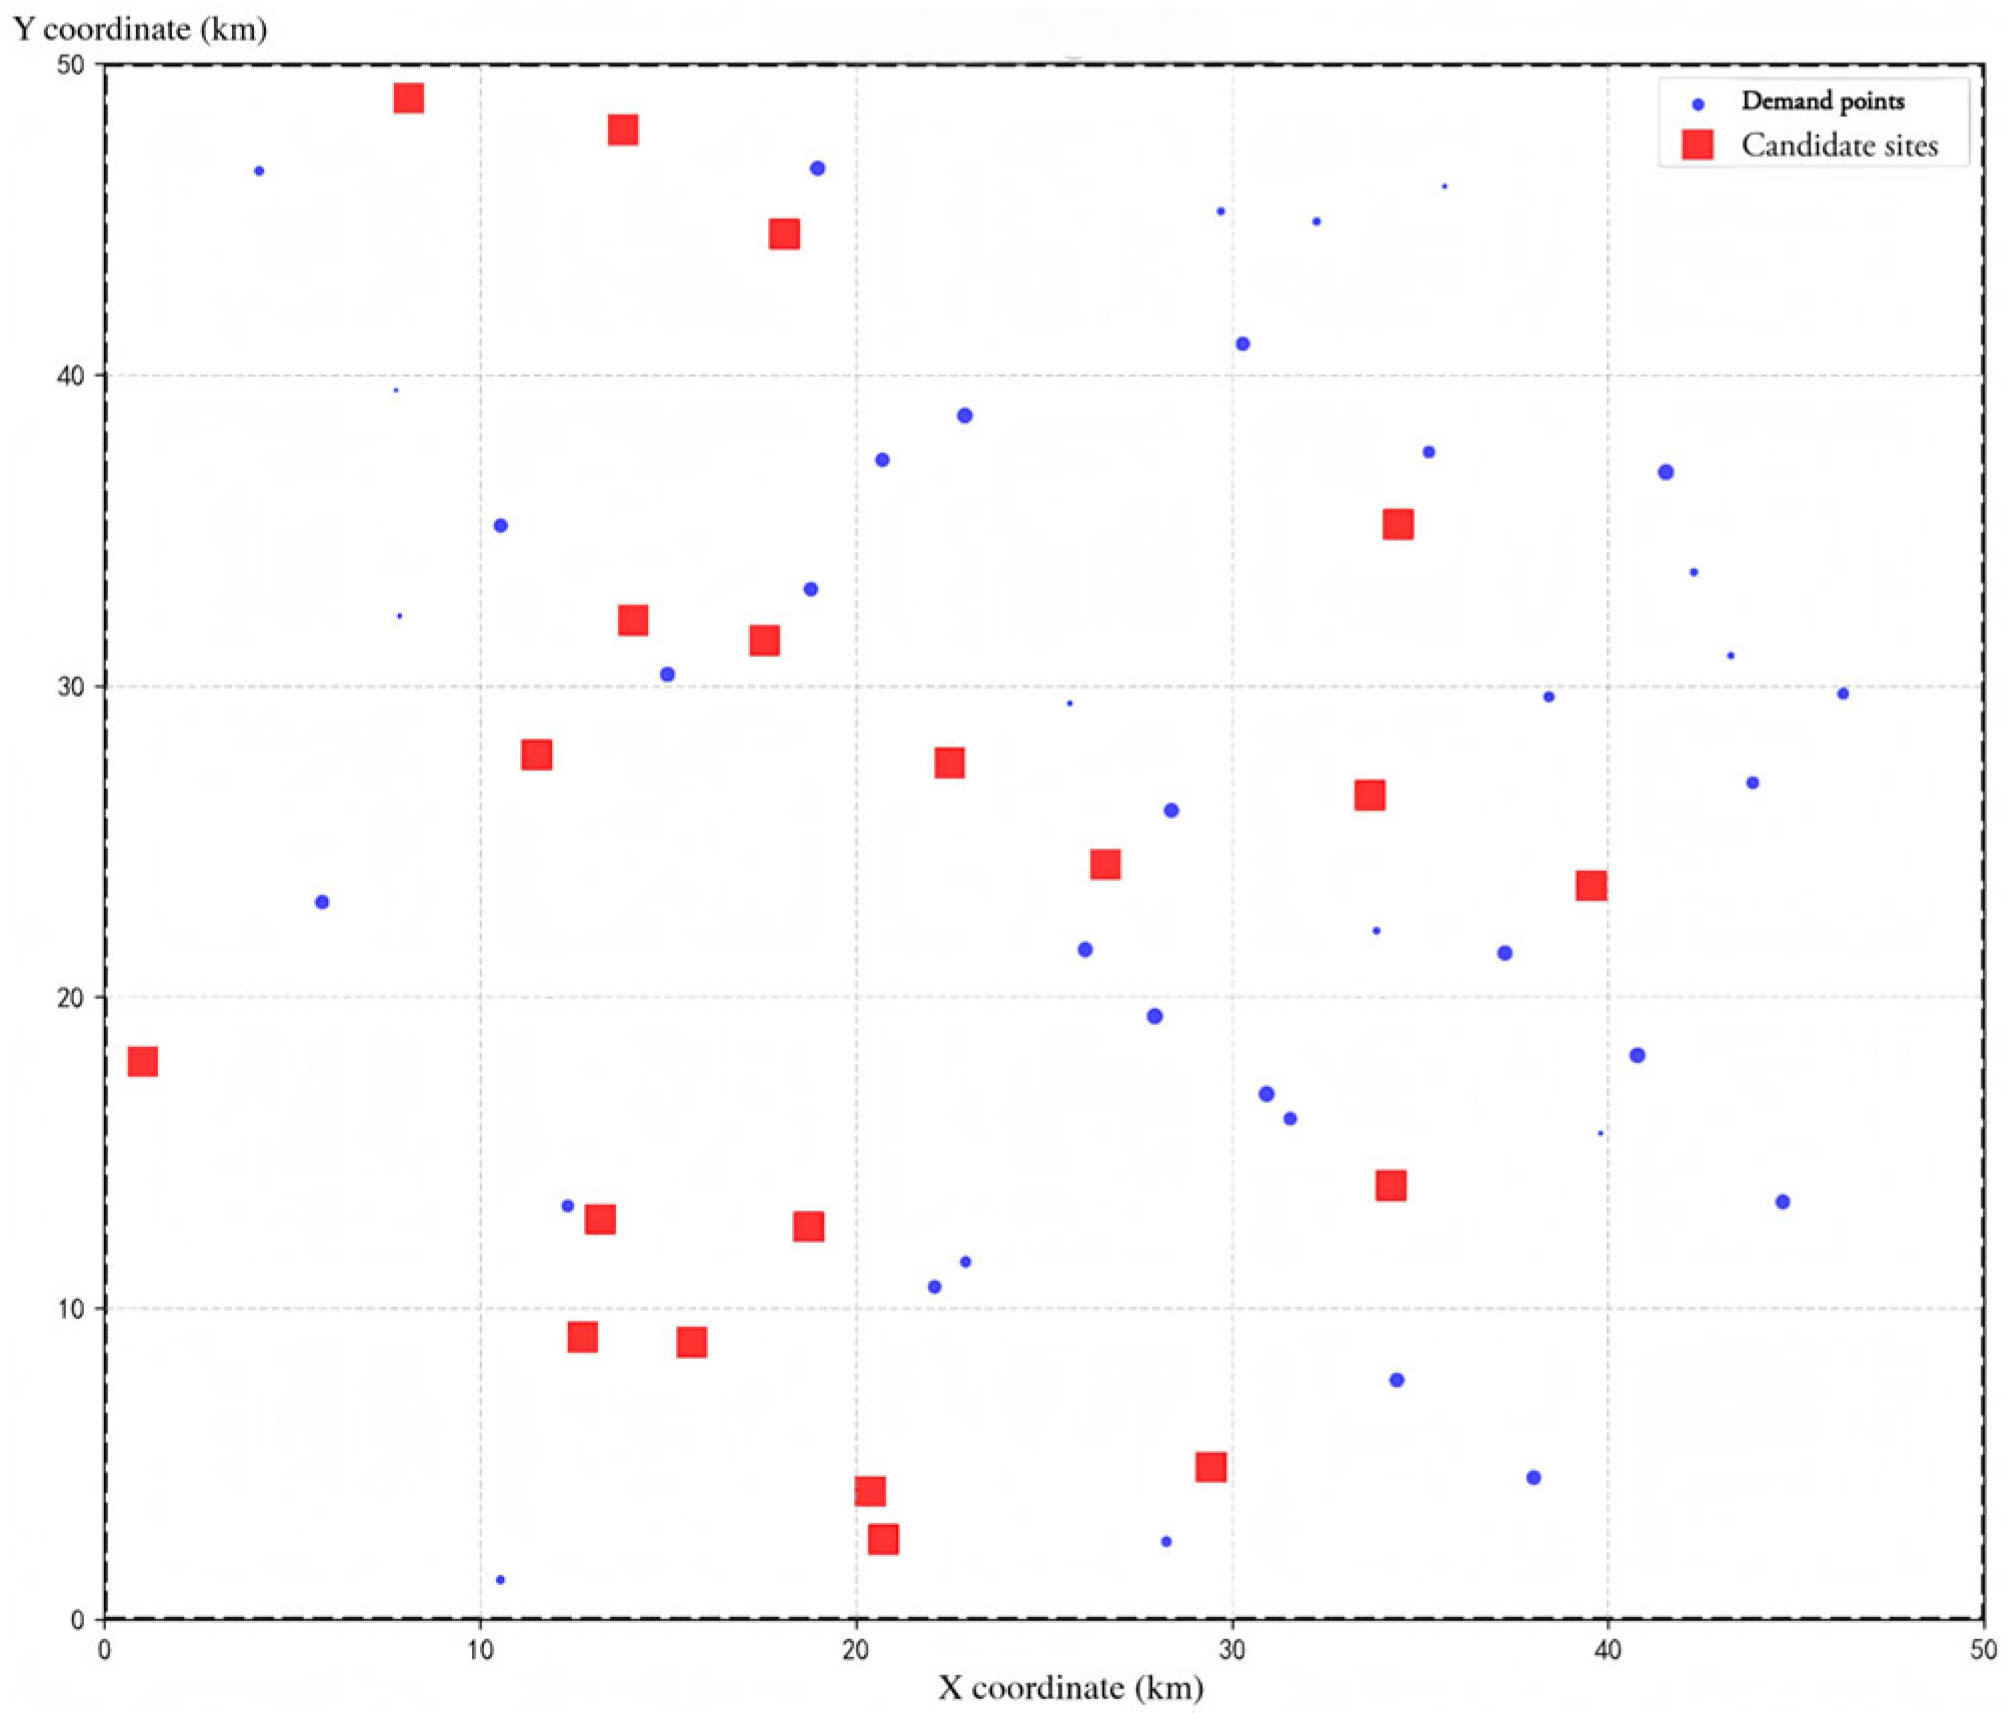
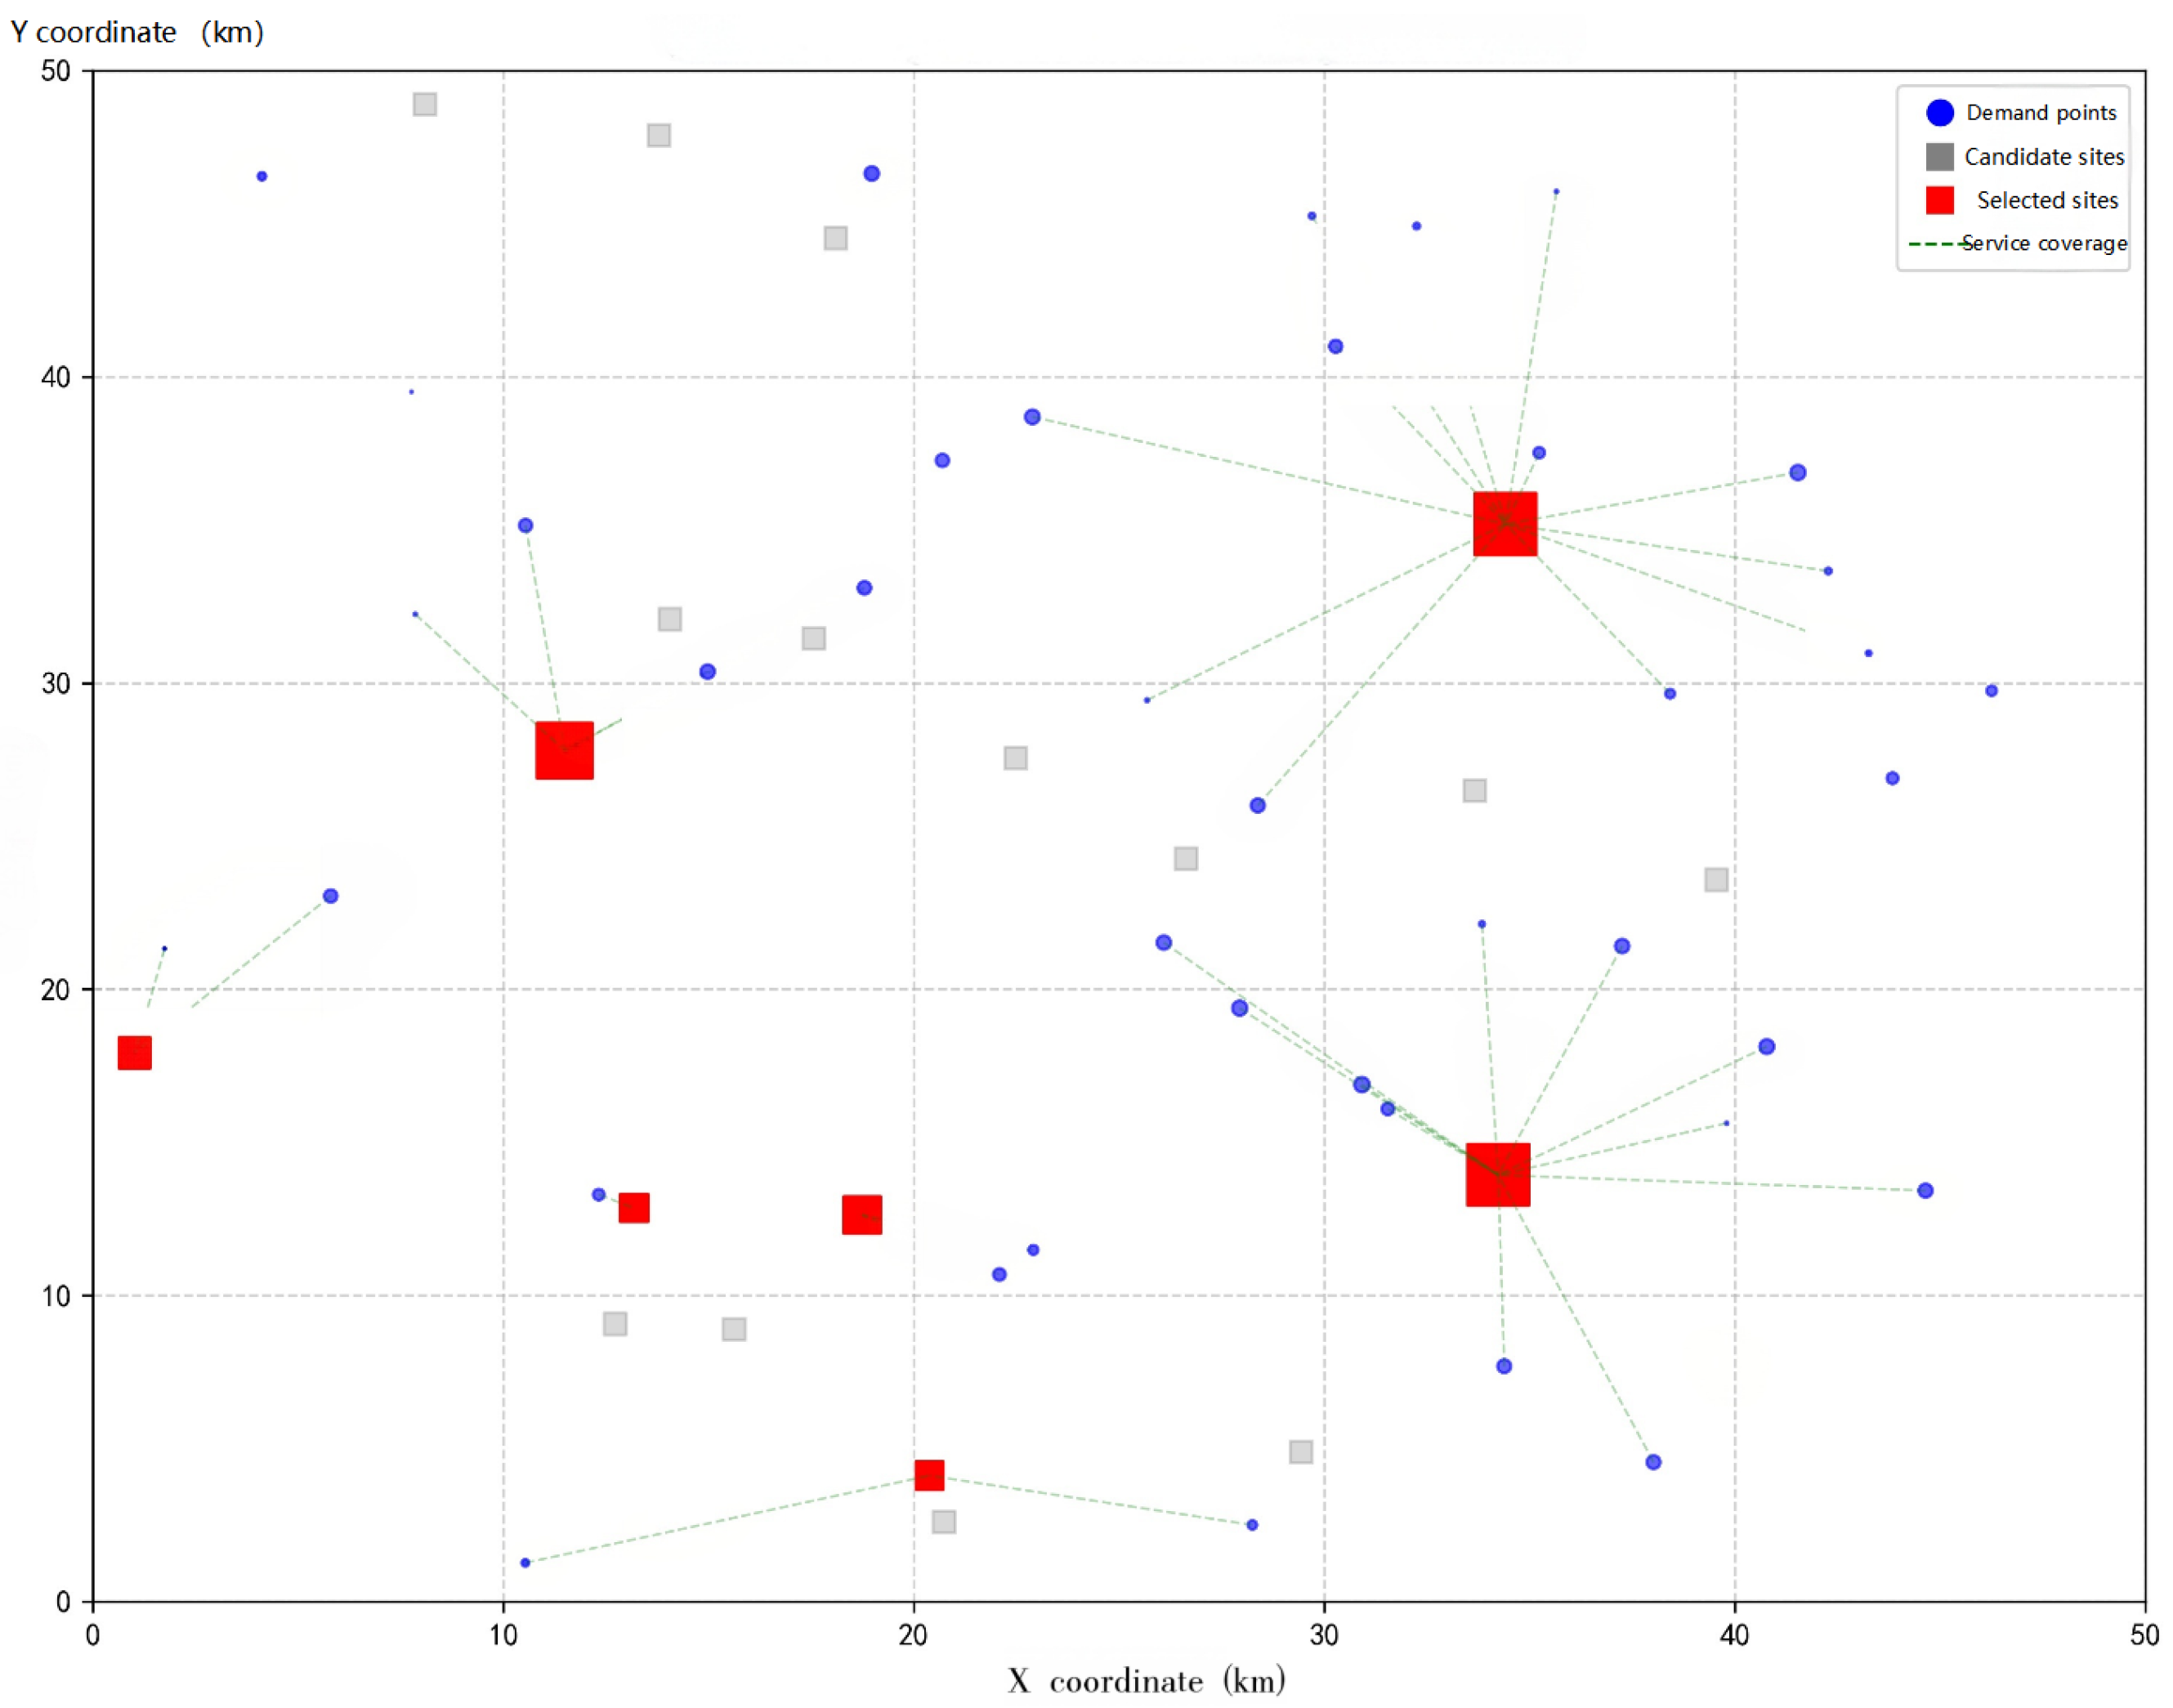
This paper designs a test instance for the electric vehicle charging station location problem. The locations of all demand points are randomly generated within a [0, 50] × [0, 50] plane. The specific coordinates and charging demands are shown in Table 1, with a total of 45 demand points and 20 candidate stations. Furthermore, in practical charging station location scenarios, in addition to considering user charging demand, corresponding real-world conditions such as the selected location and road network situation should also be taken into account. Therefore, to enhance the realism and reliability of the experiment, 5 unsuitable candidate locations were randomly removed from the initially generated 45 demand points: Site 6 (9.73, 9.80), Site 7 (30.36, 1.34), Site 9 (3.24, 47.74), Site 20 (38.21, 46.10), and Site 33 (36.02, 31.60). The coordinate positions of the candidate points are listed in Table 2. Figure 3 shows the simulated layout for the EV charging station location planning after removing the unsuitable candidate sites. All experiments were conducted under the same experimental environment, with identical algorithm parameter settings as shown below, ensuring that all comparative experiments were performed under consistent conditions.
The parameter settings used in this study are based on the references cited [24,25,26]. The population size is set to 100, and the algorithm runs for 100 generations. The crossover probability is 0.9, and the mutation probability is 0.3. The fixed investment cost ( O j ) is 1 million CNY, the unit cost of a charging pile ( q j ) is 0.1 million CNY per unit, and the equivalent investment coefficient ( e j ) is 0.02 million CNY per unit. The proportional coefficient (β) is 0.1. The maximum user satisfaction distance ( d m a x ) is 15 km, and the minimum satisfaction distance ( d m i n ) is 1 km. The number of charging piles at each station ranges from a minimum of N m i n = 4 to a maximum of N m a x = 20. The minimum and maximum waiting times are T m i n = 0.2 h and T m a x = 0.5 h, respectively. The number of charging stations to be constructed ranges from a minimum of J m i n 5 to a maximum of J m a x 15. The discount rate ( t o ) is 0.05, and the depreciation period (k) is 20 years. Since NSGA-II is a population-based multi-objective evolutionary algorithm, no explicit error tolerance is defined in this study. Instead, convergence is evaluated based on the stabilization of the Pareto-optimal solution set over successive generations. Accordingly, 100 generations are adopted as the termination criterion, which is sufficient to ensure convergence while maintaining computational efficiency.

3.2. Solution Results

3.2.1. Limitations of the Charging Station Location Model Assumptions and Their Impacts

To ensure the tractability of the optimization model, this study introduces a series of necessary simplifications. This section aims to systematically evaluate the potential impacts of these core assumptions on the research findings and to clarify the strategies adopted to mitigate the associated biases.
  • Assumption of homogeneous equipment and charging power:
By ignoring shared charging modes and heterogeneity in charging power levels, this assumption may lead to an overestimation of the required infrastructure scale and total investment cost. To buffer this bias, conservative upper limits on the number of charging piles are imposed, and average service rate parameters are adopted in the model. This simplification aims to construct a clear and solvable baseline model, thereby verifying the core logic and efficacy of the proposed optimization-decision framework.
2.
Assumption of nearest-station user choice:
The model assumes that users always select the nearest charging station, while neglecting more complex decision-making behaviors based on real-time queuing conditions, pricing, and other factors. This simplification may overestimate the actual spatial convenience of the planning solutions. Accordingly, the distance satisfaction function employed in the model only reflects static distance preferences. Although this captures the primary spatial factor, the model’s structure can accommodate more complex user choice models in future applications to enhance behavioral realism.
3.
Assumption of the M/M/C queuing model:
The idealized conditions of Poisson arrivals and exponential service times differ from real-world charging scenarios, which are characterized by peak-demand patterns and charging durations correlated with the state of charge (SOC). This discrepancy may result in an underestimation of waiting times during peak periods. It must be reiterated that the core objective of this study is to conduct relative comparisons and trade-off analyses among alternative planning schemes using a unified modeling framework, rather than to precisely predict absolute queuing delays. Therefore, a relatively wide acceptable waiting time range (0.2–0.5 h) is specified to enhance the robustness of the conclusions.
4.
Assumption of static demand and transportation conditions:
By adopting fixed demand points and Determined by Euclidean distance while ignoring dynamic traffic flows, the model may overestimate the actual spatial accessibility of charging stations. To address this limitation, a relatively large maximum acceptable service distance (15 km) is set to ensure that the planning schemes retain a basic level of spatial service capability within a static analytical framework.
5.
Impact of Model Assumptions and Boundary Definition
The series of core assumptions introduced in this study—such as homogeneous charging facilities, users’ nearest-station choice behavior, and static demand and traffic conditions—represent common and necessary modeling strategies for managing real-world complexity while ensuring model tractability and interpretability. Collectively, these simplifying assumptions explicitly define the analytical boundaries of this research and exert directional influences on the quantitative outcomes of the optimization objectives.
Specifically, under the current modeling framework:
  • Homogeneous facilities and nearest-station choice behavior.
The model does not distinguish among charging power levels, nor does it incorporate users’ dynamic decision-making based on real-time information. As a result, the estimation of total operational costs may be biased toward a simplified scenario, while user satisfaction is evaluated under an idealized assumption of spatial accessibility.
  • Static demand and the M/M/C queuing model.
By adopting fixed demand points and classical queuing theory, the model may not fully capture peak-demand aggregation effects or variability in charging durations. Consequently, the estimated service capacity requirements and waiting times tend to be smoothed relative to highly dynamic real-world conditions.
  • Euclidean distance and static traffic conditions.
The use of straight-line (Euclidean) distance simplifies the complexity of actual road networks and dynamic traffic conditions, which may affect the precise representation of infrastructure coverage efficiency and user travel costs. Taken together, these modeling choices imply that the derived Pareto-optimal front represents the theoretical trade-off between operator economic performance (Z1) and user service quality (Z2) under a clearly defined, idealized benchmark scenario. The primary contribution of this study lies not in providing a directly deployable implementation scheme, but in offering a transparent and quantifiable decision trade-off spectrum and performance boundary, which serves as a methodological foundation for subsequent research and practical planning efforts. Accordingly, the derived Pareto front characterizes the intrinsic trade-off between operator cost (Z1) and user satisfaction (Z2) under a well-defined benchmark scenario. The main contribution lies in the development of a modular and extensible decision-support framework that establishes a methodological baseline for scenario-based analysis and planning practice.
6.
Parameter Robustness and Validation of Conclusions
To enhance the robustness and practical relevance of the research conclusions, conservative principles were adopted in the parameter settings. For instance, relatively relaxed constraints were imposed on the maximum service distance ( d m a x = 15 km), acceptable waiting time ( T m a x = 0.5 h), and the upper bound on the number of charging piles per station ( N m a x = 20). Such settings implicitly bias the optimization process toward station layout solutions that can maintain basic service reliability even under real-world conditions that are more demanding than those assumed in the model.
Accordingly, although the absolute numerical values of cost and satisfaction may deviate from those observed in fully realistic scenarios, the fundamental patterns and trade-off structures revealed by the model remain robust. Specifically, the relative ranking of alternative solutions within the Pareto set, as well as the essential economic principle that increased investment improves user experience with diminishing marginal returns, are stable and pronounced. The comparison between different solutions in Table 3 (e.g., Solution 13 versus Solution 2) clearly substantiates this intrinsic relationship. The main findings and value of this study therefore lie in the systematic revelation and quantitative characterization of such multi-objective conflicts, rather than in the pursuit of precise point estimates.
Overall, the modeling simplifications adopted are integral to establishing a tractable and interpretable benchmark. They collectively define a clear analytical scope within which the intrinsic trade-off between operator economy and user service quality is rigorously quantified. The core contribution of this work resides in the development of a modular and extensible decision-support framework, rather than a fixed site-specific plan. By design, the conservative parameterization imbues the solutions with inherent robustness, ensuring that the revealed trade-off patterns and solution rankings remain valid under more demanding real-world conditions. This framework provides a verified methodological baseline that can be systematically refined—by relaxing the current assumptions—to address increasingly complex and realistic planning scenarios in future applications.

3.2.2. Presentation and Description of the Pareto Solution Set

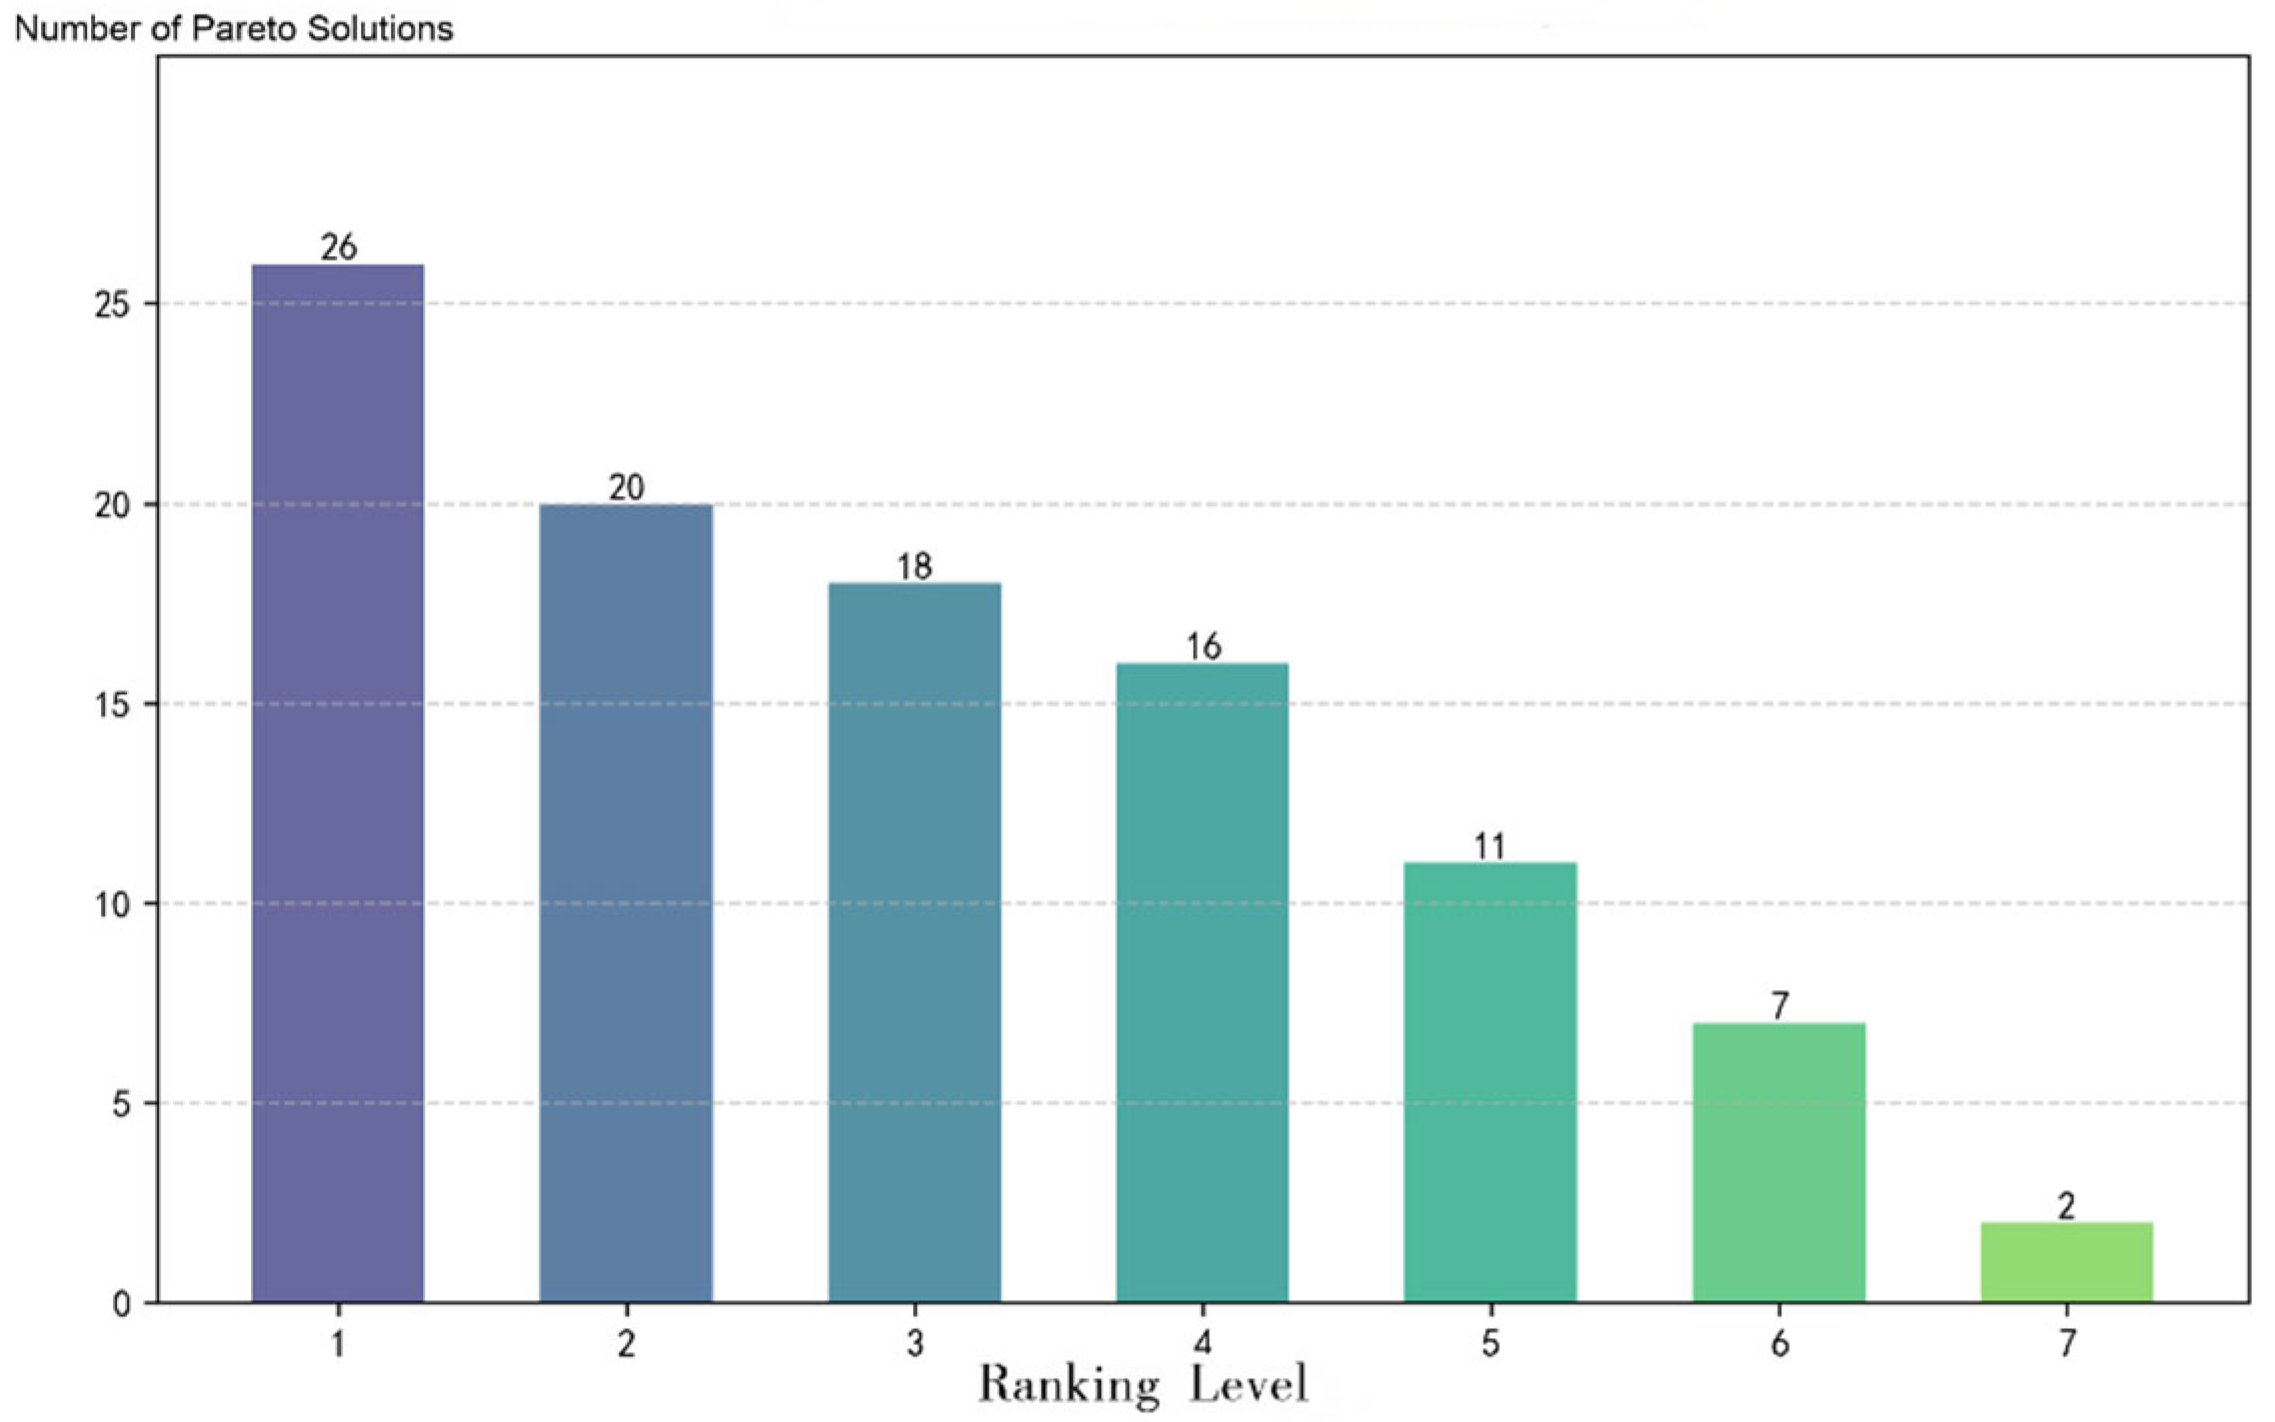
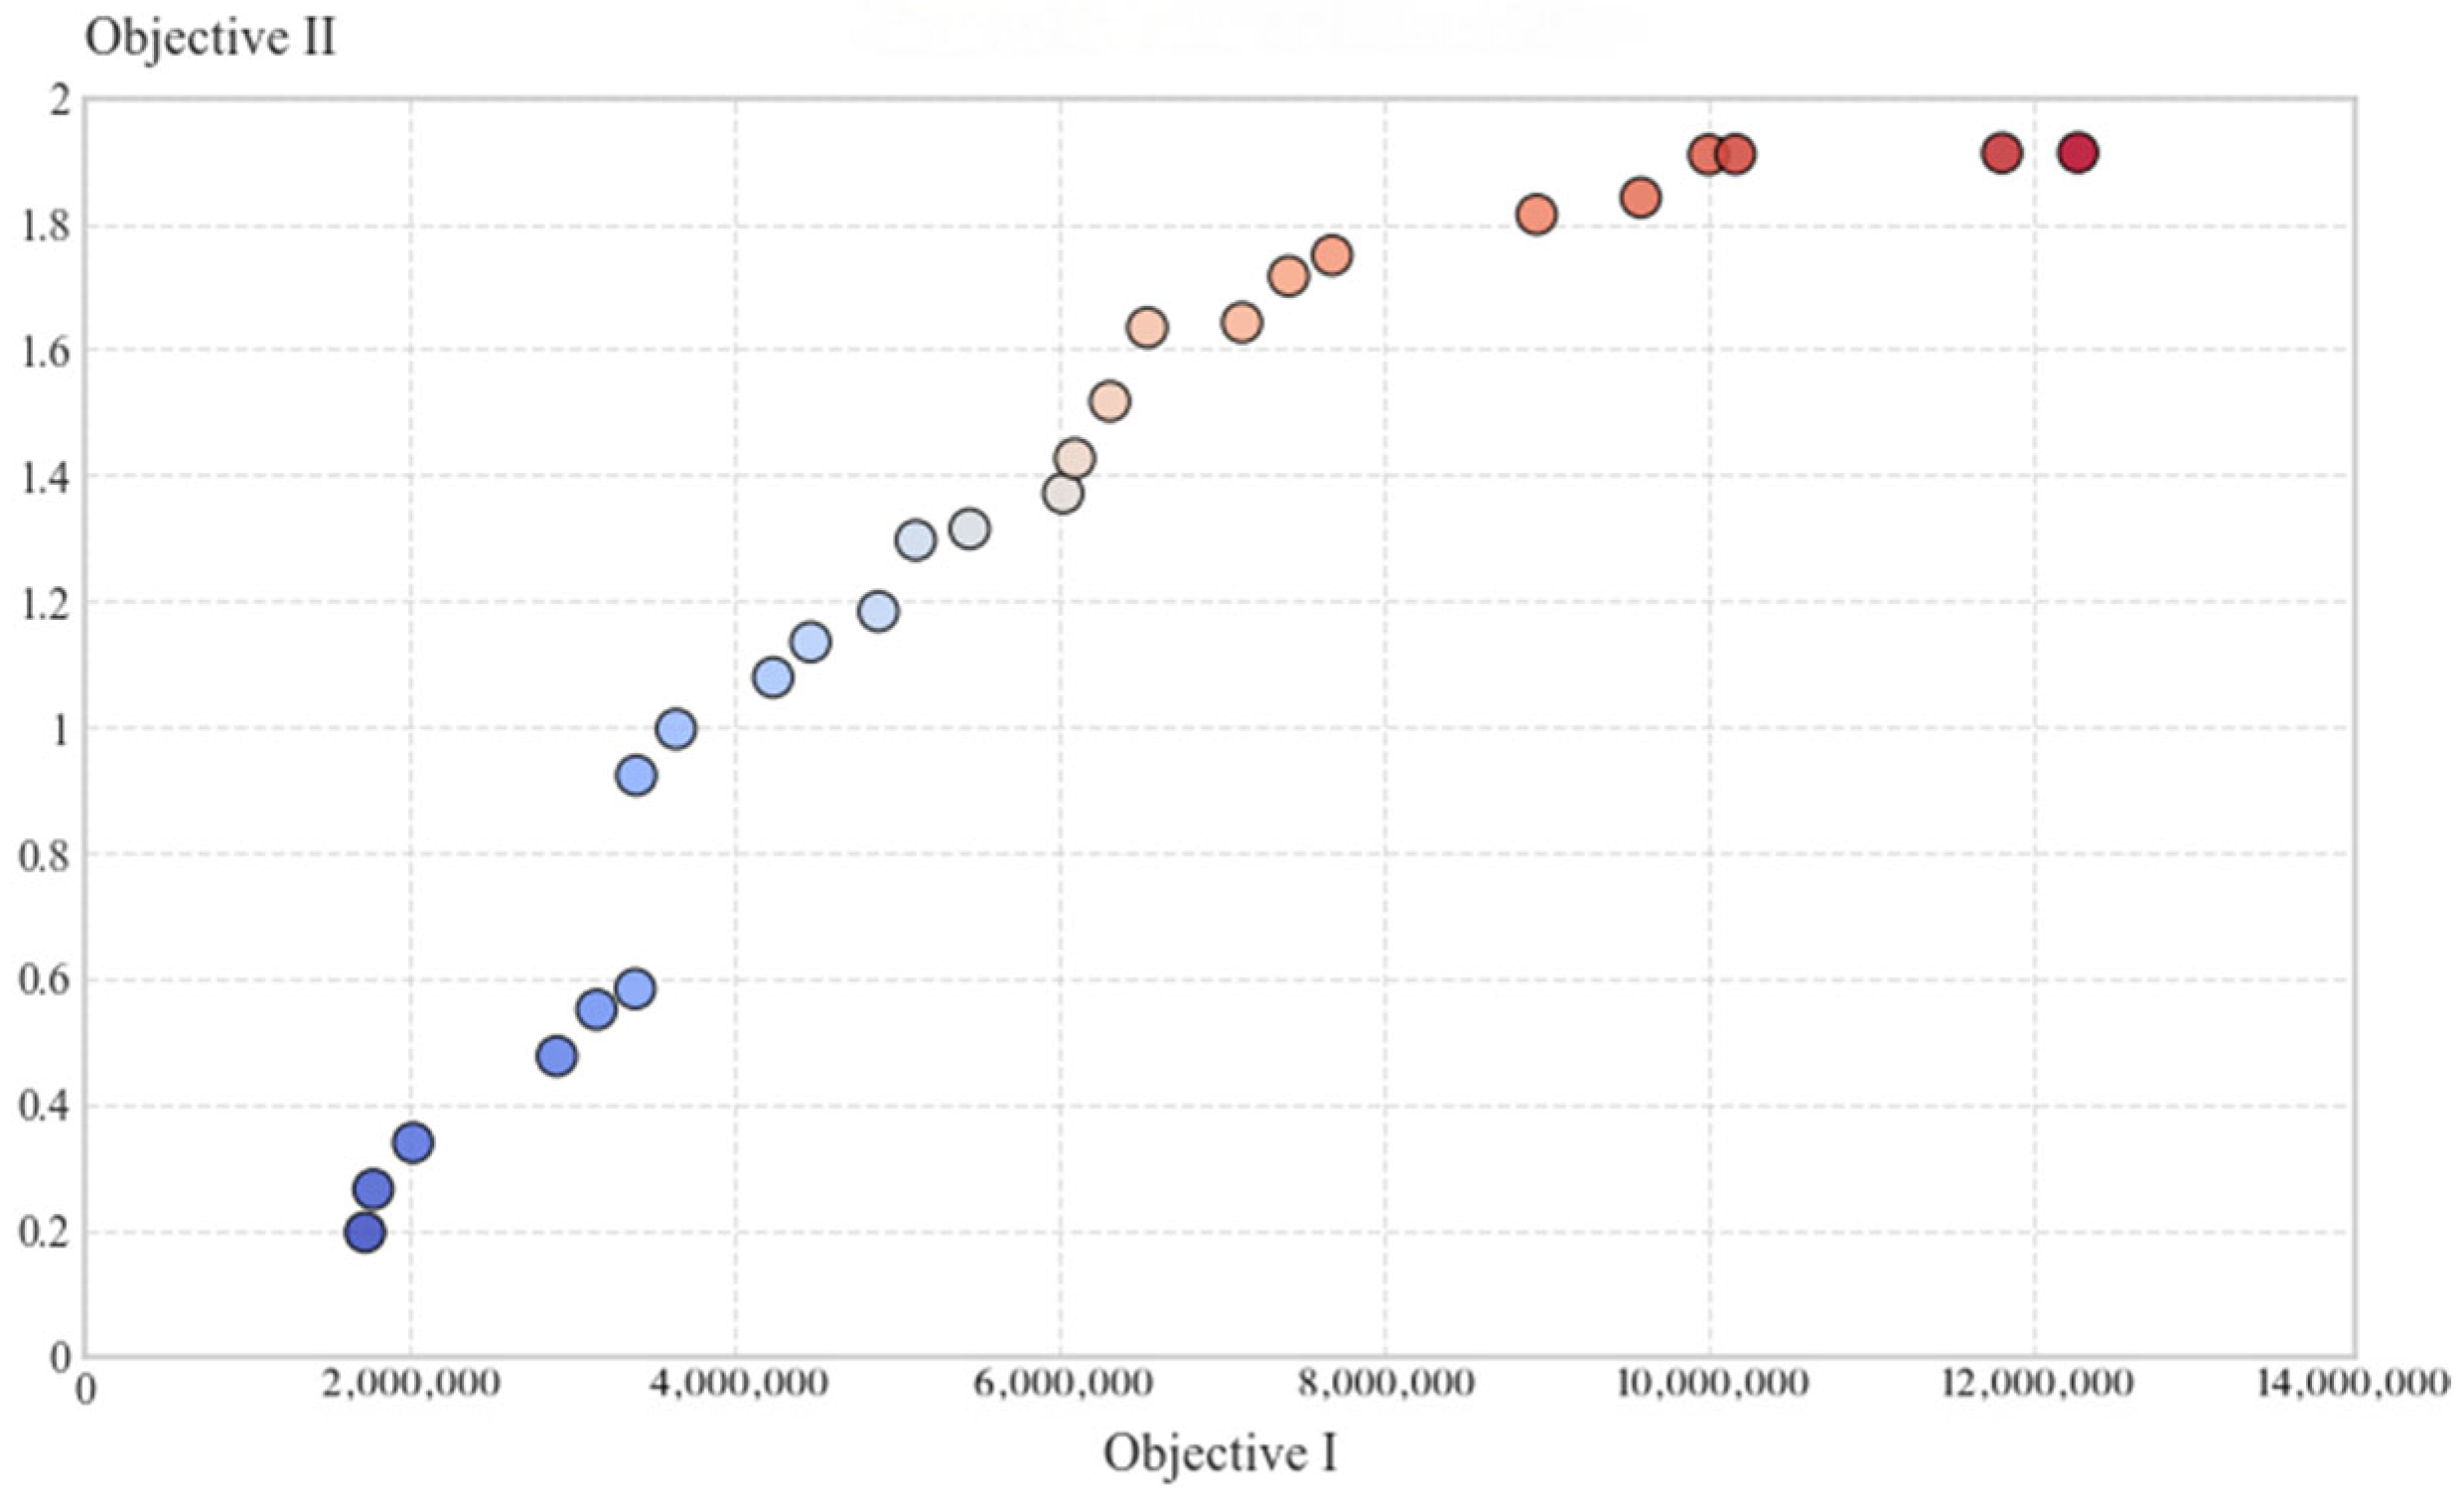
As illustrated in Figure 4 and Figure 5, the Pareto optimal solution set obtained in this study contains twenty-seven non-dominated solutions. The solutions within this set exhibit minimal objective conflict and are clearly distinguishable from the dominated alternatives, thereby providing decision-makers with a set of representative and well-balanced optimal options. The detailed numerical values of the corresponding Pareto optimal solutions are presented in Table 3.
The numerical results of the corresponding Pareto optimal solution set are presented in Table 3, which includes detailed information on Objective Function I and Objective Function II, as well as the number of charging stations and charging piles to be constructed.
According to the results presented in Table 3, solution 2 achieves the highest level of user satisfaction but incurs the maximum total life-cycle cost. In contrast, solution 3 exhibits the lowest total cost and a correspondingly low user satisfaction level. This comparison clearly reveals a pronounced trade-off between operator cost and user satisfaction. This trade-off is fundamentally governed by the spatial configuration strategy of charging station layout: a clustered deployment primarily reduces costs through economies of scale in infrastructure and simplified management, but at the expense of uneven network coverage, which significantly diminishes user satisfaction. Conversely, a dispersed layout enhances network accessibility and service equity to maximize user satisfaction, yet it leads to substantially higher costs due to duplicated infrastructure investments and increased operational complexity.
Further analysis indicates that the relationship between the number of charging stations and user satisfaction is not purely linear. Statistical testing of the 26 Pareto-optimal solutions yields a Spearman correlation coefficient of ρ = 0.68 (p < 0.01), confirming a significant positive correlation between the two variables. However, a more detailed examination reveals substantial differences in satisfaction levels among schemes with an identical number of stations. For instance, although both solution 3 and solution 13 consist of five stations, their user satisfaction values are 0.1961 and 1.6342, respectively—an 8.3-fold difference. Crucially, their total costs also differ markedly (approximately 1.72 million and 6.55 million), directly evidencing the dual role of spatial clustering in cost containment and its suppressive effect on satisfaction: solution 3 adopts a highly clustered layout, sacrificing service coverage for minimal cost, whereas solution 13 employs a relatively dispersed and evenly distributed site selection, which increases cost but dramatically improves satisfaction by enhancing spatial accessibility. This disparity is primarily attributed to two factors.
First, the spatial distribution of stations critically influences both service accessibility and cost structure. The stations in solution 13 (3, 6, 8, 11, and 12) are evenly distributed across the planning area, effectively covering major demand points, but require investment across a wider range of locations, resulting in a higher cost per unit of coverage. In contrast, the stations in solution 3 (4, 7, 9, 10, and 14) are relatively clustered. While this achieves lower unit construction costs and centralized operations and maintenance, it creates significant spatial service gaps, causing distance satisfaction S d ( d i j ) to plummet as travel distances exceed user tolerance thresholds. Second, the number of charging piles configured at each station modulates service capacity and capital expenditure within the chosen spatial strategy. Solution 13 is equipped with a sufficient number of charging piles at key stations (20, 16, 20, 8, and 9), supporting demand distribution under its dispersed layout but also contributing to higher per-station investment. In comparison, Section 3 is configured with only the minimum number of piles (7, 4, 4, 4, and 4), aligning with its “cost-first” objective under a clustered strategy but collectively leading to severely constrained service capacity.
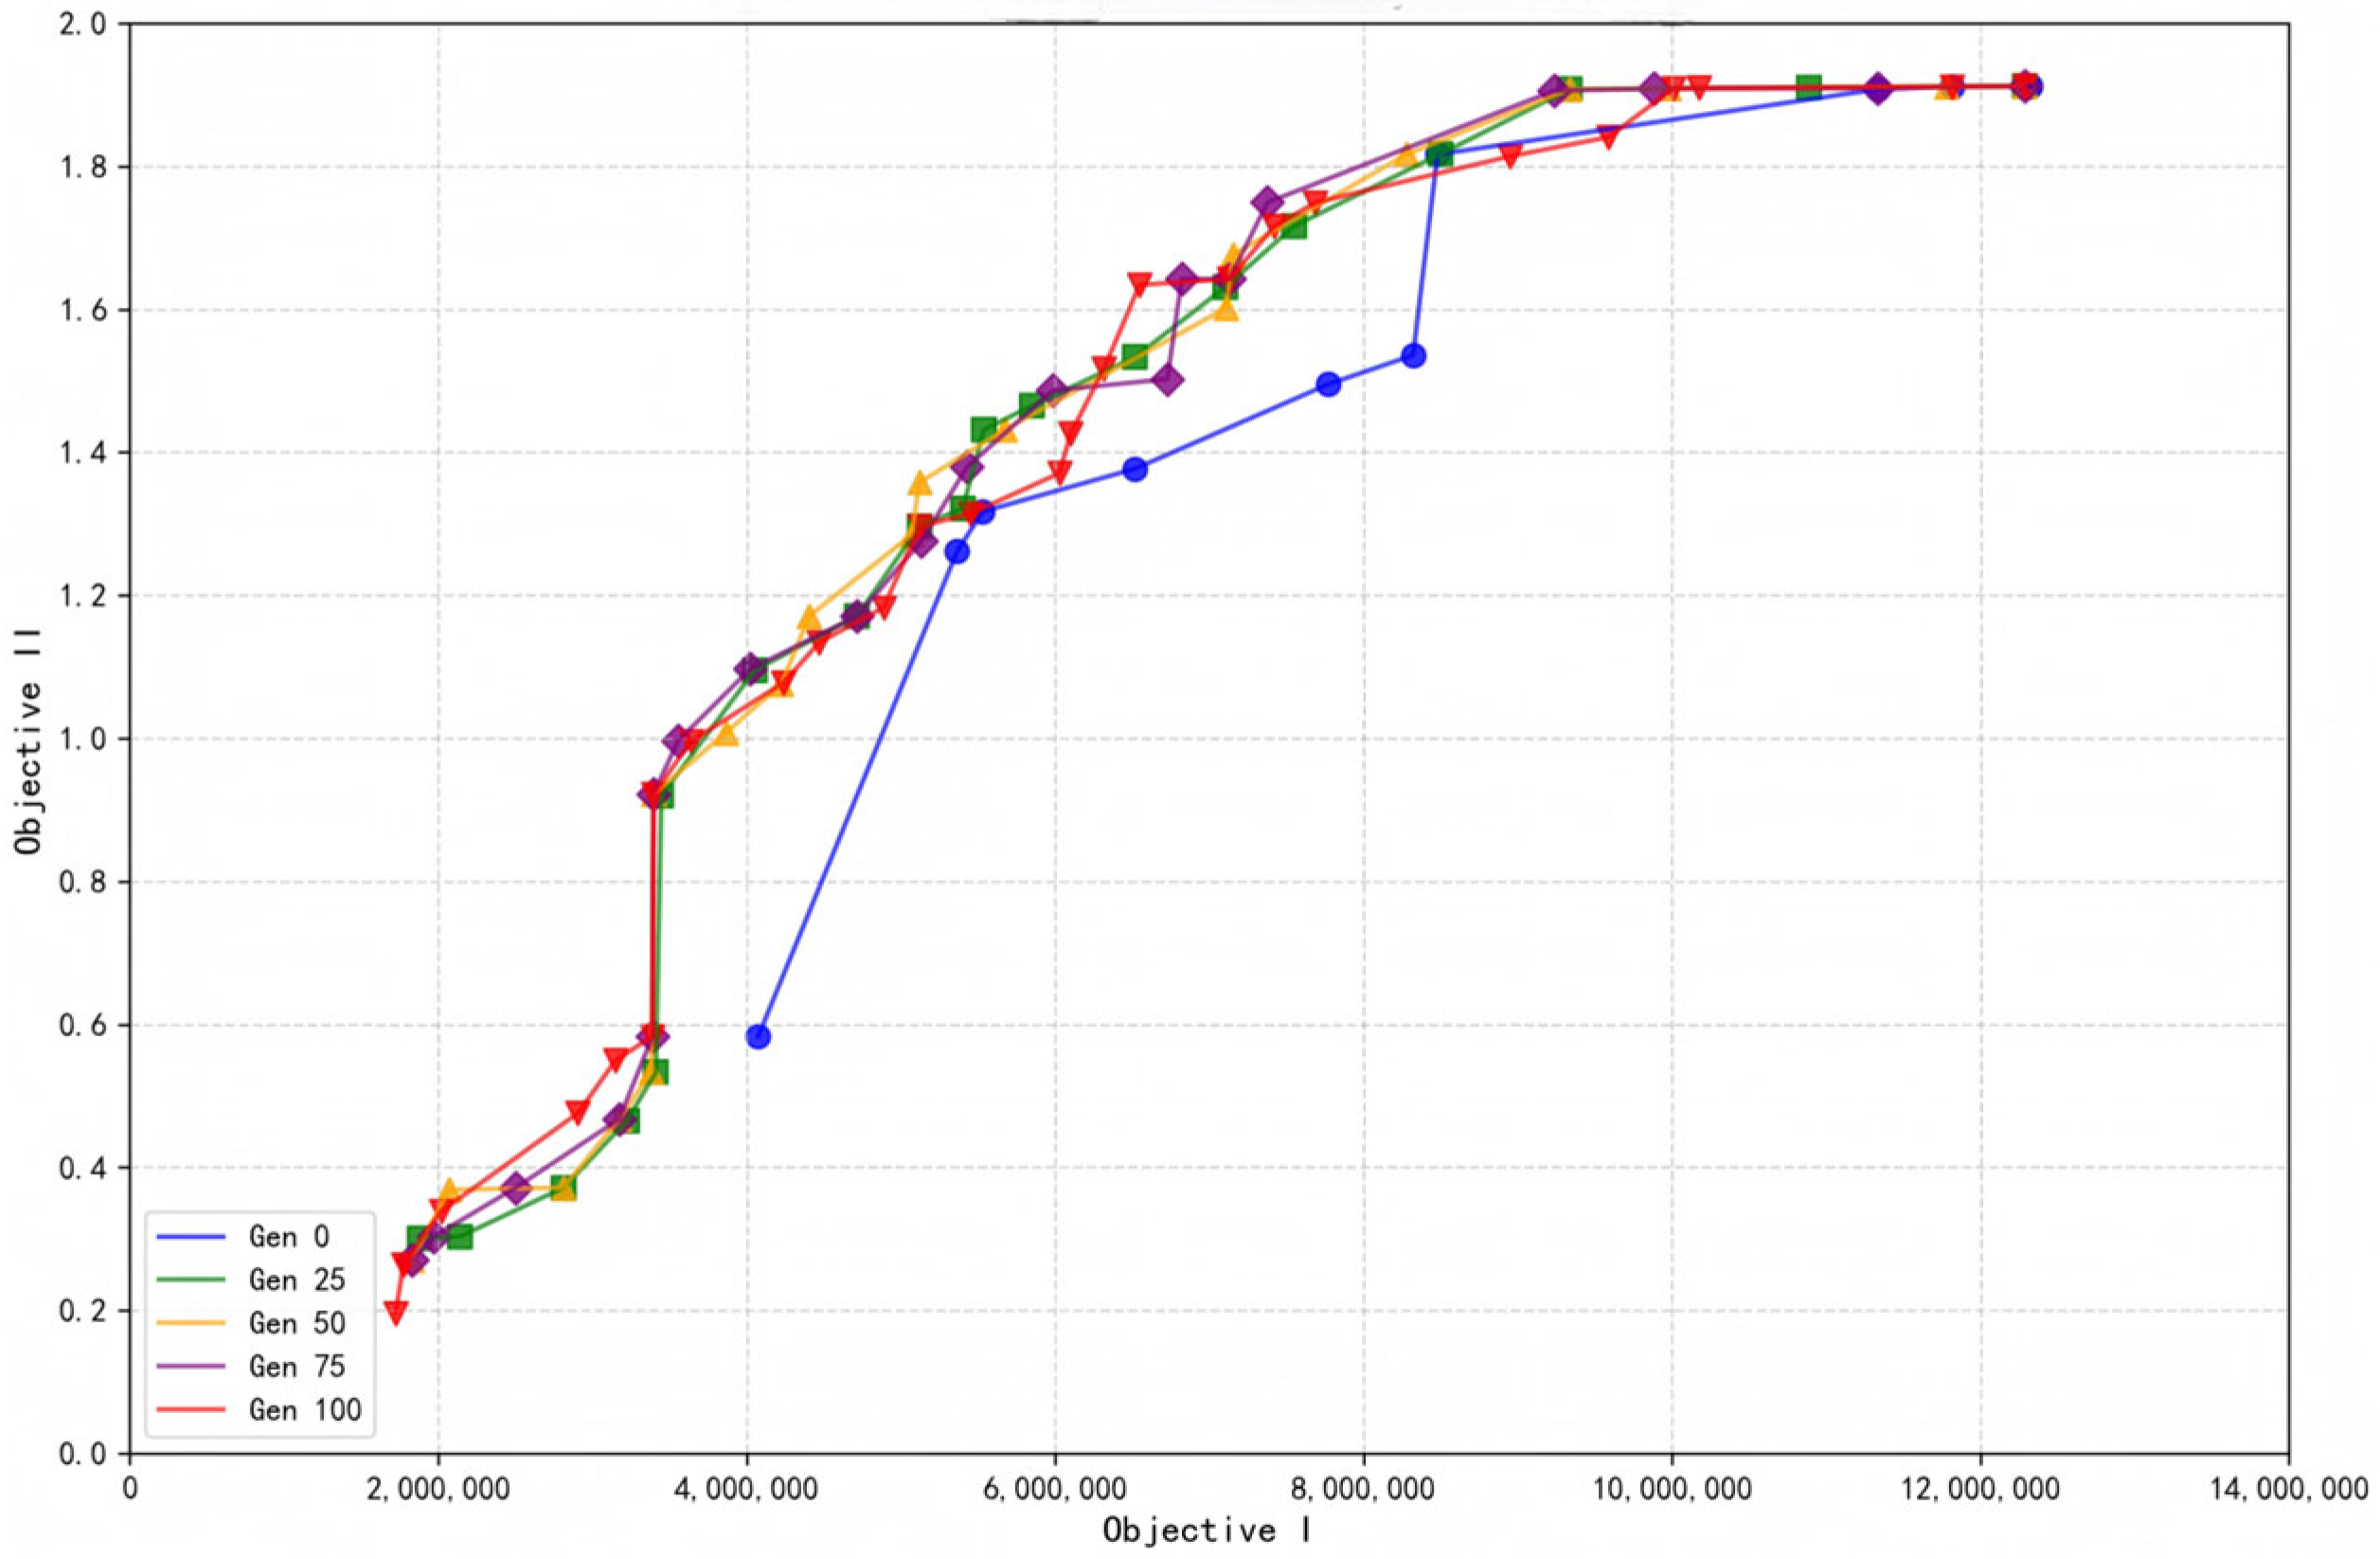
Notably, a phenomenon of diminishing marginal returns is also observed. When the number of charging stations increases from five to ten, the average improvement in user satisfaction per additional station is approximately 1.25%. However, when the number increases further from ten to fourteen, the marginal improvement declines to only 0.35% per station, while the associated marginal cost increase remains substantial. This pattern further indicates that relying solely on increasing the number of stations becomes increasingly inefficient for boosting satisfaction and is accompanied by persistently rapid cost escalation. This finding suggests that under resource constraints, higher levels of user satisfaction can still be achieved with fewer stations through optimized site selection (balancing clustering and dispersion) and resource allocation. For example, solution 13, which includes only five stations, attains a user satisfaction level close to that of solution 2 with fourteen stations, while its total cost accounts for only 53.3% of the latter. This further demonstrates that rational spatial layout strategies coupled with efficient, differentiated resource configuration are more effective than merely increasing the number of stations in balancing economic efficiency and service quality. Meanwhile, Figure 6 illustrates the evolutionary process of the Pareto front across different generations. In the initial stage, the solutions are widely scattered in the objective space, indicating a low level of convergence. As the evolution progresses, the Pareto front gradually converges toward the true Pareto-optimal region, accompanied by a more uniform distribution of solutions. This evolutionary process enables the algorithm to capture a richer and more comprehensive set of trade-off relationships between operator cost and user satisfaction.
Based on the above analysis, the improved TOPSIS method is employed to comprehensively evaluate and rank all candidate schemes. This aims to systematically reconcile the complex trade-off between operator cost control and user satisfaction enhancement, providing robust decision support for charging infrastructure planning and offering clear strategic choices and layout design guidance for planners under different budget constraints and policy objectives.

3.2.3. Managerial Insights and Strategic Implications

Analysis of the Pareto-optimal set translates algorithmic outcomes into direct strategic guidance for infrastructure planning:
1.
The Fundamental Trade-off is Spatial: The extremes of the Pareto frontier are defined by two opposing spatial strategies: cost-minimizing clustering (exemplified by Solution 3, sacrificing coverage) versus satisfaction-maximizing dispersion (exemplified by Solution 2, incurring high cost). All viable planning options exist on this spectrum.
2.
Optimal Layout Outperforms Simple Expansion: The significant performance gap between Solutions 3 and 13 (identical station count) demonstrates that superior geographic distribution and site-specific capacity allocation are more critical than merely increasing the number of stations. Efficient placement of well-sized stations can achieve high utility with lower infrastructure density.
3.
Actionable Decision Pathways:
(1)
For budget-constrained planning: Prioritize high-efficiency solutions from the central-left Pareto front (e.g., Solution 13), which balance adequate service coverage with manageable cost, avoiding the steep economic penalties of excessive dispersion.
(2)
For policy-driven, user-centric objectives: Solutions from the right front (e.g., near Solution 2) are relevant, with the model quantifying the incremental investment required for each unit of satisfaction gain.
(3)
Recognizing diminishing returns: The declining marginal satisfaction per additional station indicates an optimal network density. Beyond this point, investment should shift from new locations to enhancing existing ones.
4.
Key Drivers and Contextual Adaptation: The sharpness of the cost satisfaction trade off is not constant but is driven by specific contextual conditions:
(1)
Demand Spatial Pattern: In areas with highly dispersed demand points, the cost of achieving full coverage via dispersion rises sharply, intensifying the trade-off.
(2)
User Behavior Profile: A population with low tolerance for waiting necessitates more chargers or stations to prevent satisfaction collapse, directly increasing costs.
(3)
Network and Land Constraints: Complex real-world road networks increase effective travel distance, while high urban land costs amplify the expense of a dispersed layout.
Consequently, the framework’s output is not a single recommendation but an adaptive decision-support tool. Planners can obtain a context-specific efficiency frontier by inputting localized parameters.
In summary, the Pareto frontier serves as a strategic decision map. Planners can first orient themselves by choosing a primary spatial strategy (clustered vs. dispersed) based on top-level goals, then navigate to the most efficient implementation plan within that strategy, thereby making informed, scenario-based decisions.

3.3. Effectiveness Verification of the Algorithmic Improvement Strategies: Ablation Study Analysis

To systematically evaluate the individual contributions of the three improvement strategies proposed in this study to the overall algorithmic performance, a series of ablation experiments were designed and conducted. Specifically, five algorithmic configurations were comparatively analyzed: (1) the fully improved NSGA-II algorithm, (2) NSGA-II without the chaotic initialization mechanism, (3) NSGA-II without the opposition-based learning mechanism, (4) NSGA-II without the adaptive mechanism, and (5) the standard NSGA-II algorithm. The evaluation was performed from four key aspects of solution quality and computational performance, including overall solution quality, convergence, distribution, and efficiency. Accordingly, four widely adopted performance metrics were employed: hypervolume (HV), inverted generational distance (IGD), diversity, and runtime.
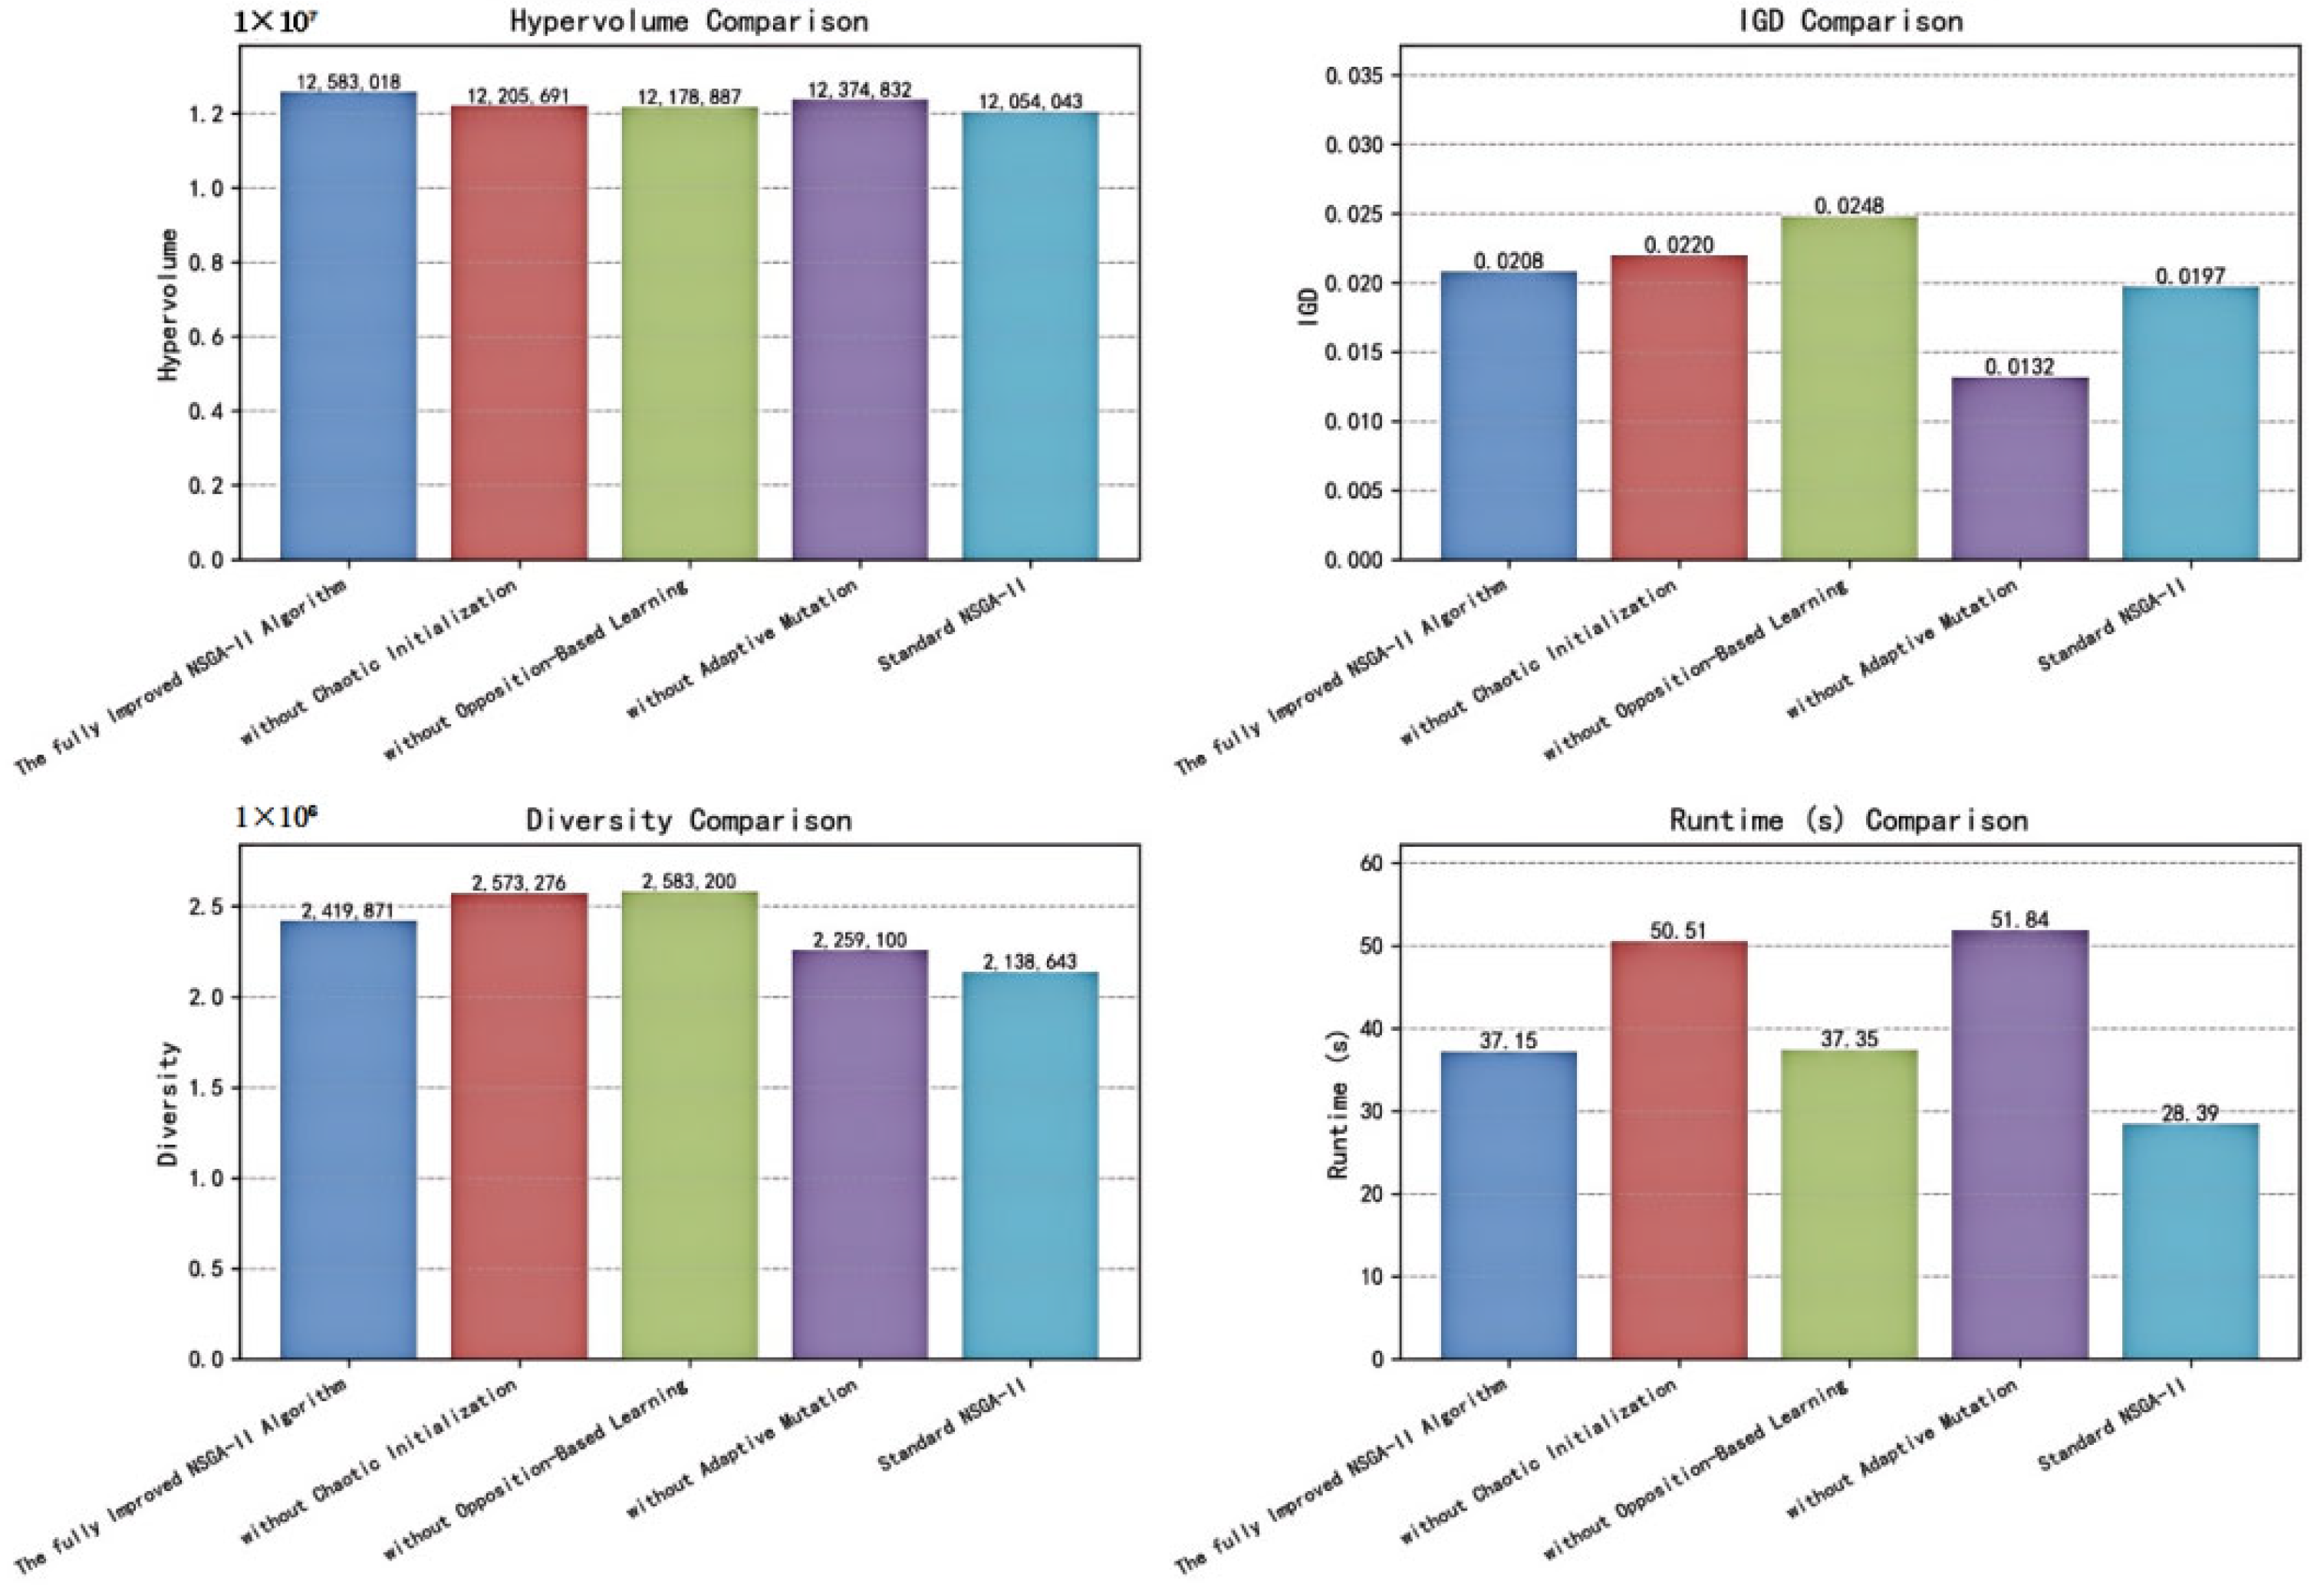
The comparative results of the five algorithmic configurations across the four performance metrics are illustrated in Figure 7.
To quantitatively elucidate the individual contributions of each improvement module and their synergistic effects on algorithmic performance, this study designs and conducts a systematic ablation experiment, in which five algorithmic configurations are comparatively evaluated across multiple key performance metrics. The corresponding results are presented in Figure 7. Overall, the findings indicate that each improvement module operates at a distinct stage of the evolutionary process, with clearly differentiated functional roles, while collectively contributing to a significant enhancement of the algorithm’s overall performance.
First, the chaotic initialization mechanism primarily affects the early stage of the search process by constructing an initial population with higher diversity and solution quality, thereby providing a more favorable starting point for subsequent evolution. After removing this module, the runtime is reduced from 37.15 s to 25.99 s, corresponding to an efficiency improvement of approximately 30%. However, this reduction in computational cost is accompanied by a deterioration in solution quality, as the hypervolume (HV) decreases by 4.2%, from 12,583,018 to 12,054,043, while the inverted generational distance (IGD) increases from 0.0208 to 0.0248. These results demonstrate that chaotic initialization trades additional computational overhead for enhanced global search potential, yielding a substantial positive contribution to the quality of the final solution set.
Second, the opposition-based learning mechanism plays a critical role in improving the convergence performance of the algorithm. When this module is removed, the IGD value increases markedly to 0.0248, representing a 19.2% degradation, which is the most pronounced impact among all improvement strategies. In addition, both the HV value (12,178,887) and the diversity metric are inferior to those achieved by the fully improved algorithm. These observations indicate that, by systematically exploring the opposite regions of the solution space, the opposition-based learning mechanism effectively guides the population toward a more accurate and stable approximation of the true Pareto front.
Third, the adaptive mechanism is mainly responsible for dynamically regulating the search strategy to balance exploration and exploitation. In the absence of this module, the algorithm achieves the best performance in terms of a single convergence metric (IGD = 0.0132), and also attains the highest diversity value (2,583,200). Nevertheless, its hypervolume (12,374,832) fails to reach the optimal level and remains lower than that of the fully improved algorithm. This phenomenon suggests that the adaptive mechanism does not merely aim to optimize a single performance indicator, but instead enhances the overall coverage of the solution set in the objective space by coordinating search depth and breadth, an advantage that is ultimately reflected in the improvement of the HV metric.
In summary, the three improvement modules act synergistically on the NSGA-II algorithm from the perspectives of search initialization, convergence guidance, and search dynamics, respectively. Although the removal of an individual module may lead to superior performance in certain isolated metrics (e.g., runtime or IGD), the fully integrated NSGA-II algorithm incorporating all proposed improvements achieves the highest hypervolume value (12,583,018), which is widely regarded as a comprehensive indicator of Pareto solution set quality and coverage. These results provide strong evidence for the effectiveness and synergistic benefits of the proposed improvement strategies, demonstrating that the overall performance enhancement of the algorithm arises from the systematic integration of multiple complementary modules rather than from any single isolated technique.

3.4. Comprehensive Ranking and Optimal Solution Determination Based on the Improved TOPSIS Model

To scientifically evaluate and compare the performance of different siting Solution, this study employs an improved Technique for Order Preference by Similarity to Ideal Solution (TOPSIS) model to conduct a comprehensive assessment and ranking of the 26 candidate schemes obtained after preliminary screening. The evaluation framework focuses on two core dimensions: operator cost and user satisfaction. By calculating the relative closeness of each scheme to the ideal best and worst solutions, the improved TOPSIS method enables an objective and quantitative prioritization of multiple alternatives. This approach effectively balances cost control and user experience, thereby providing a more rational and persuasive basis for final decision-making. The ranking results calculated are presented in Table 4:
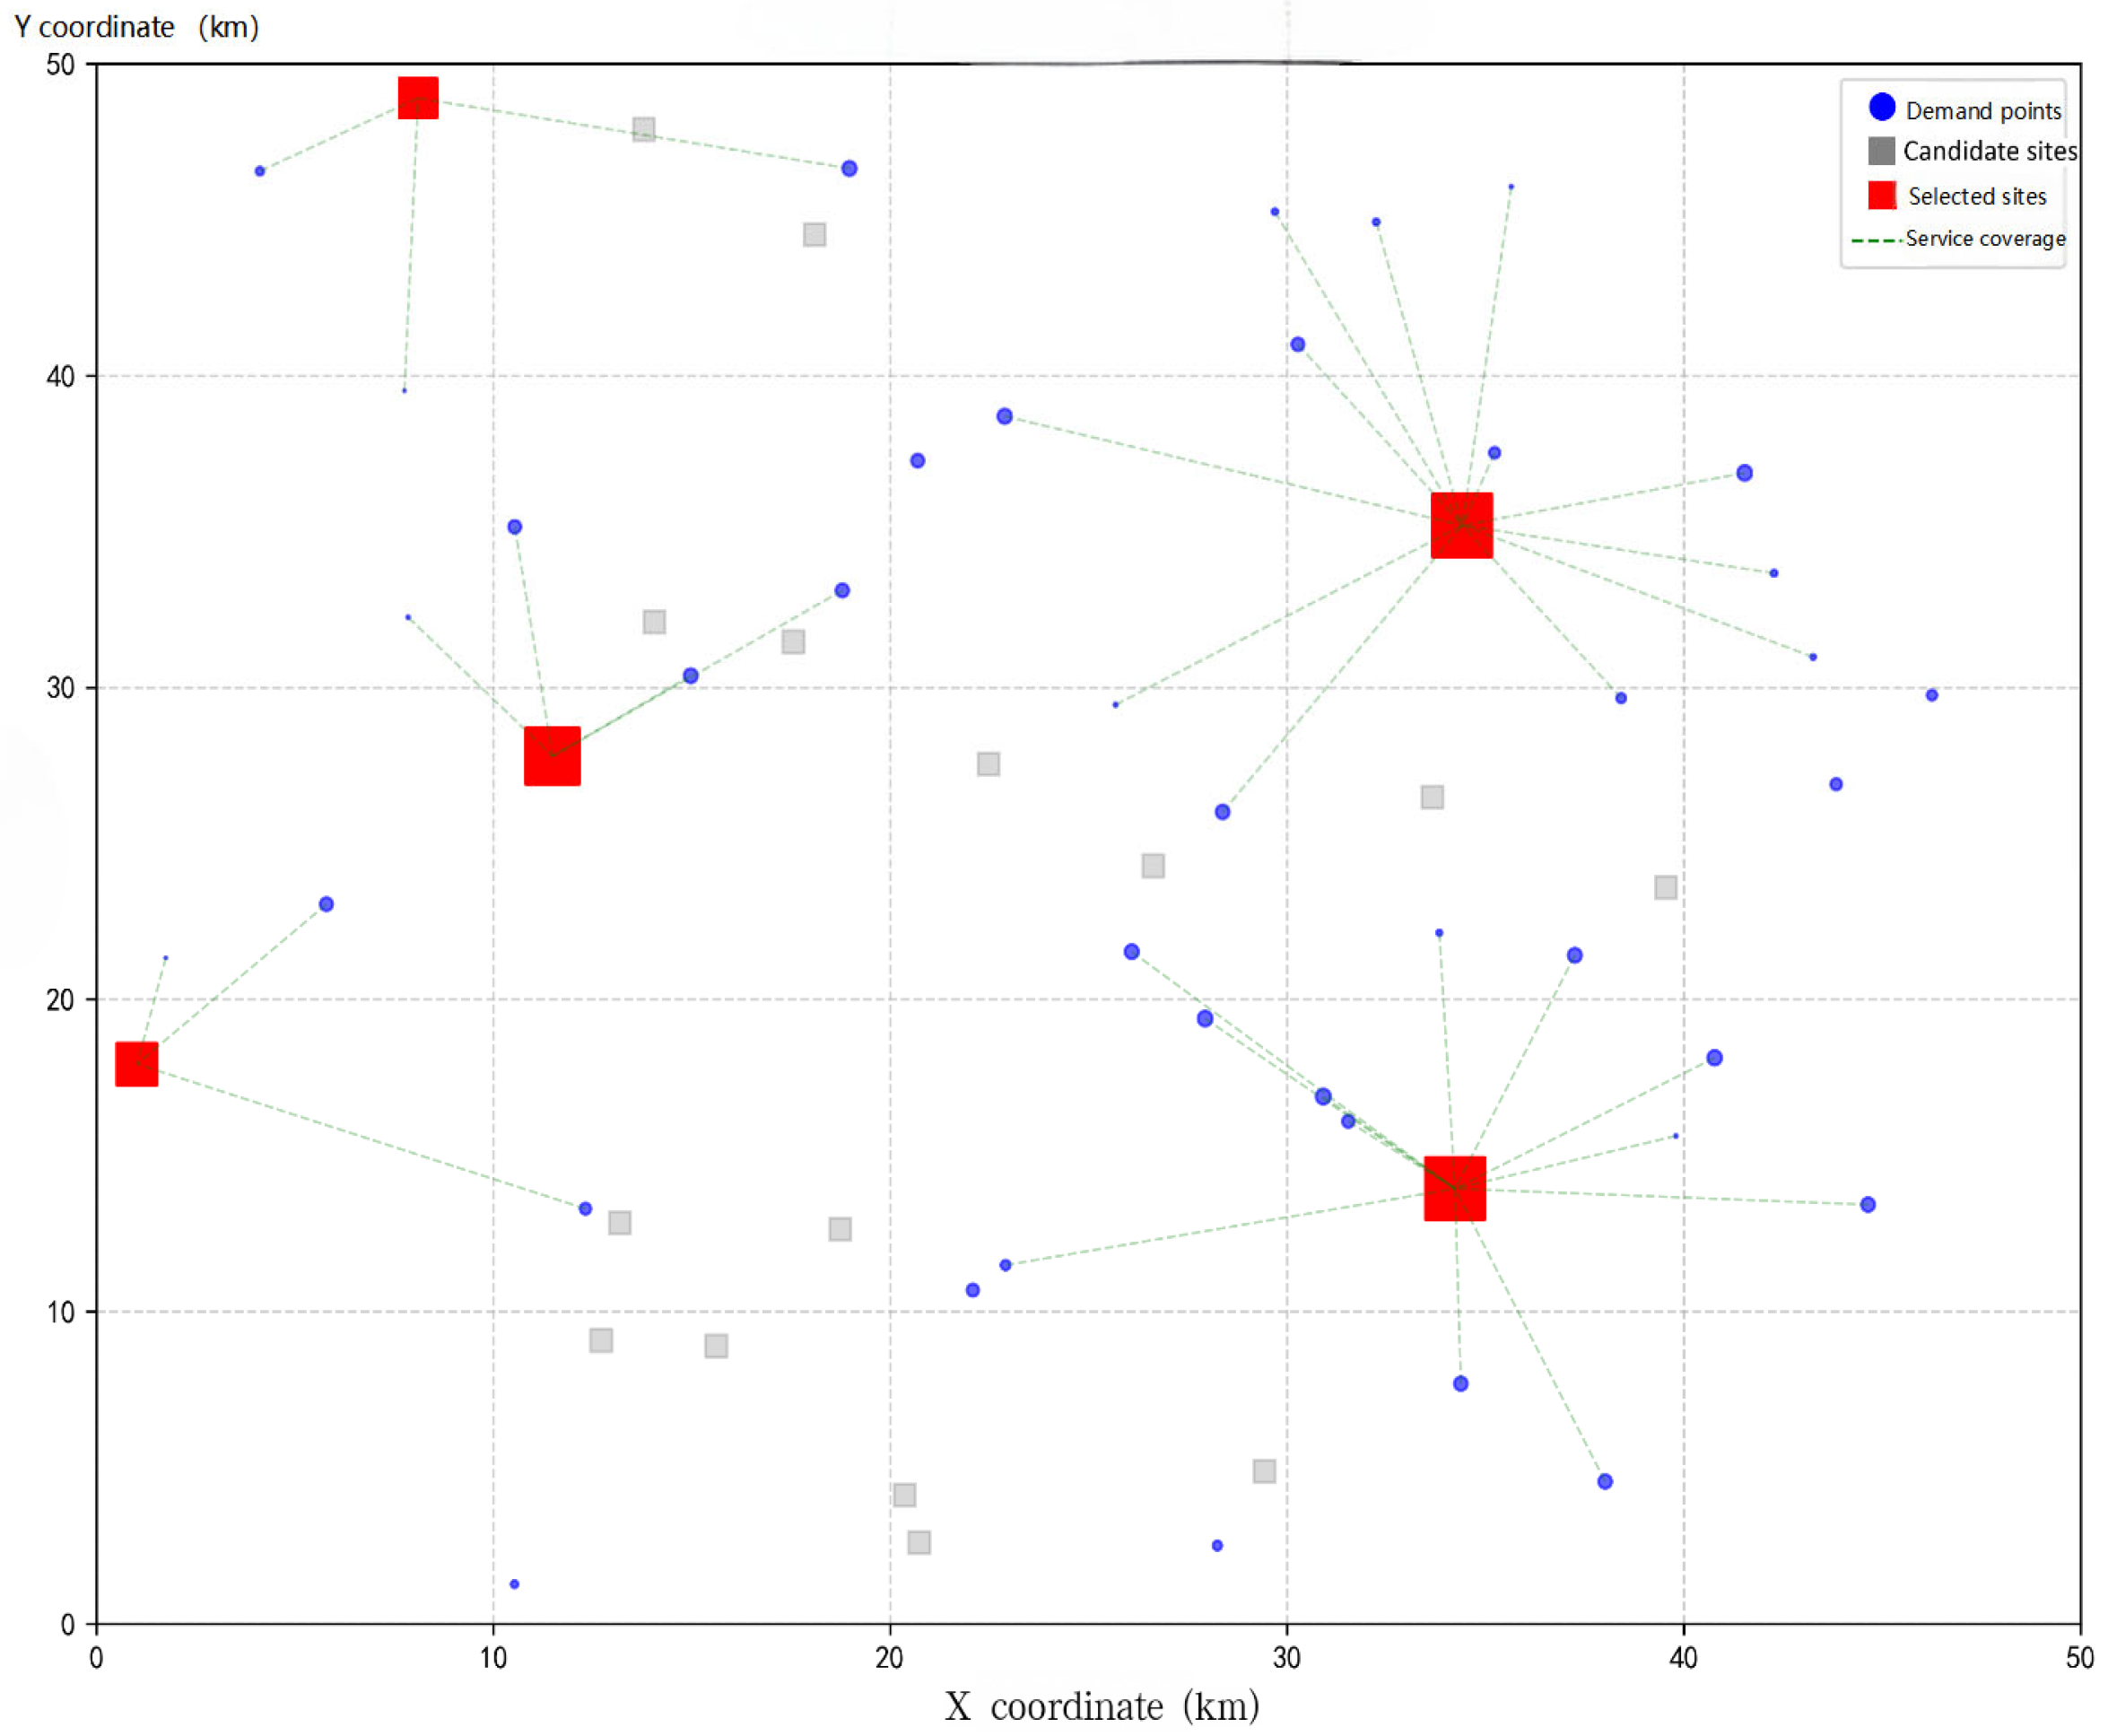
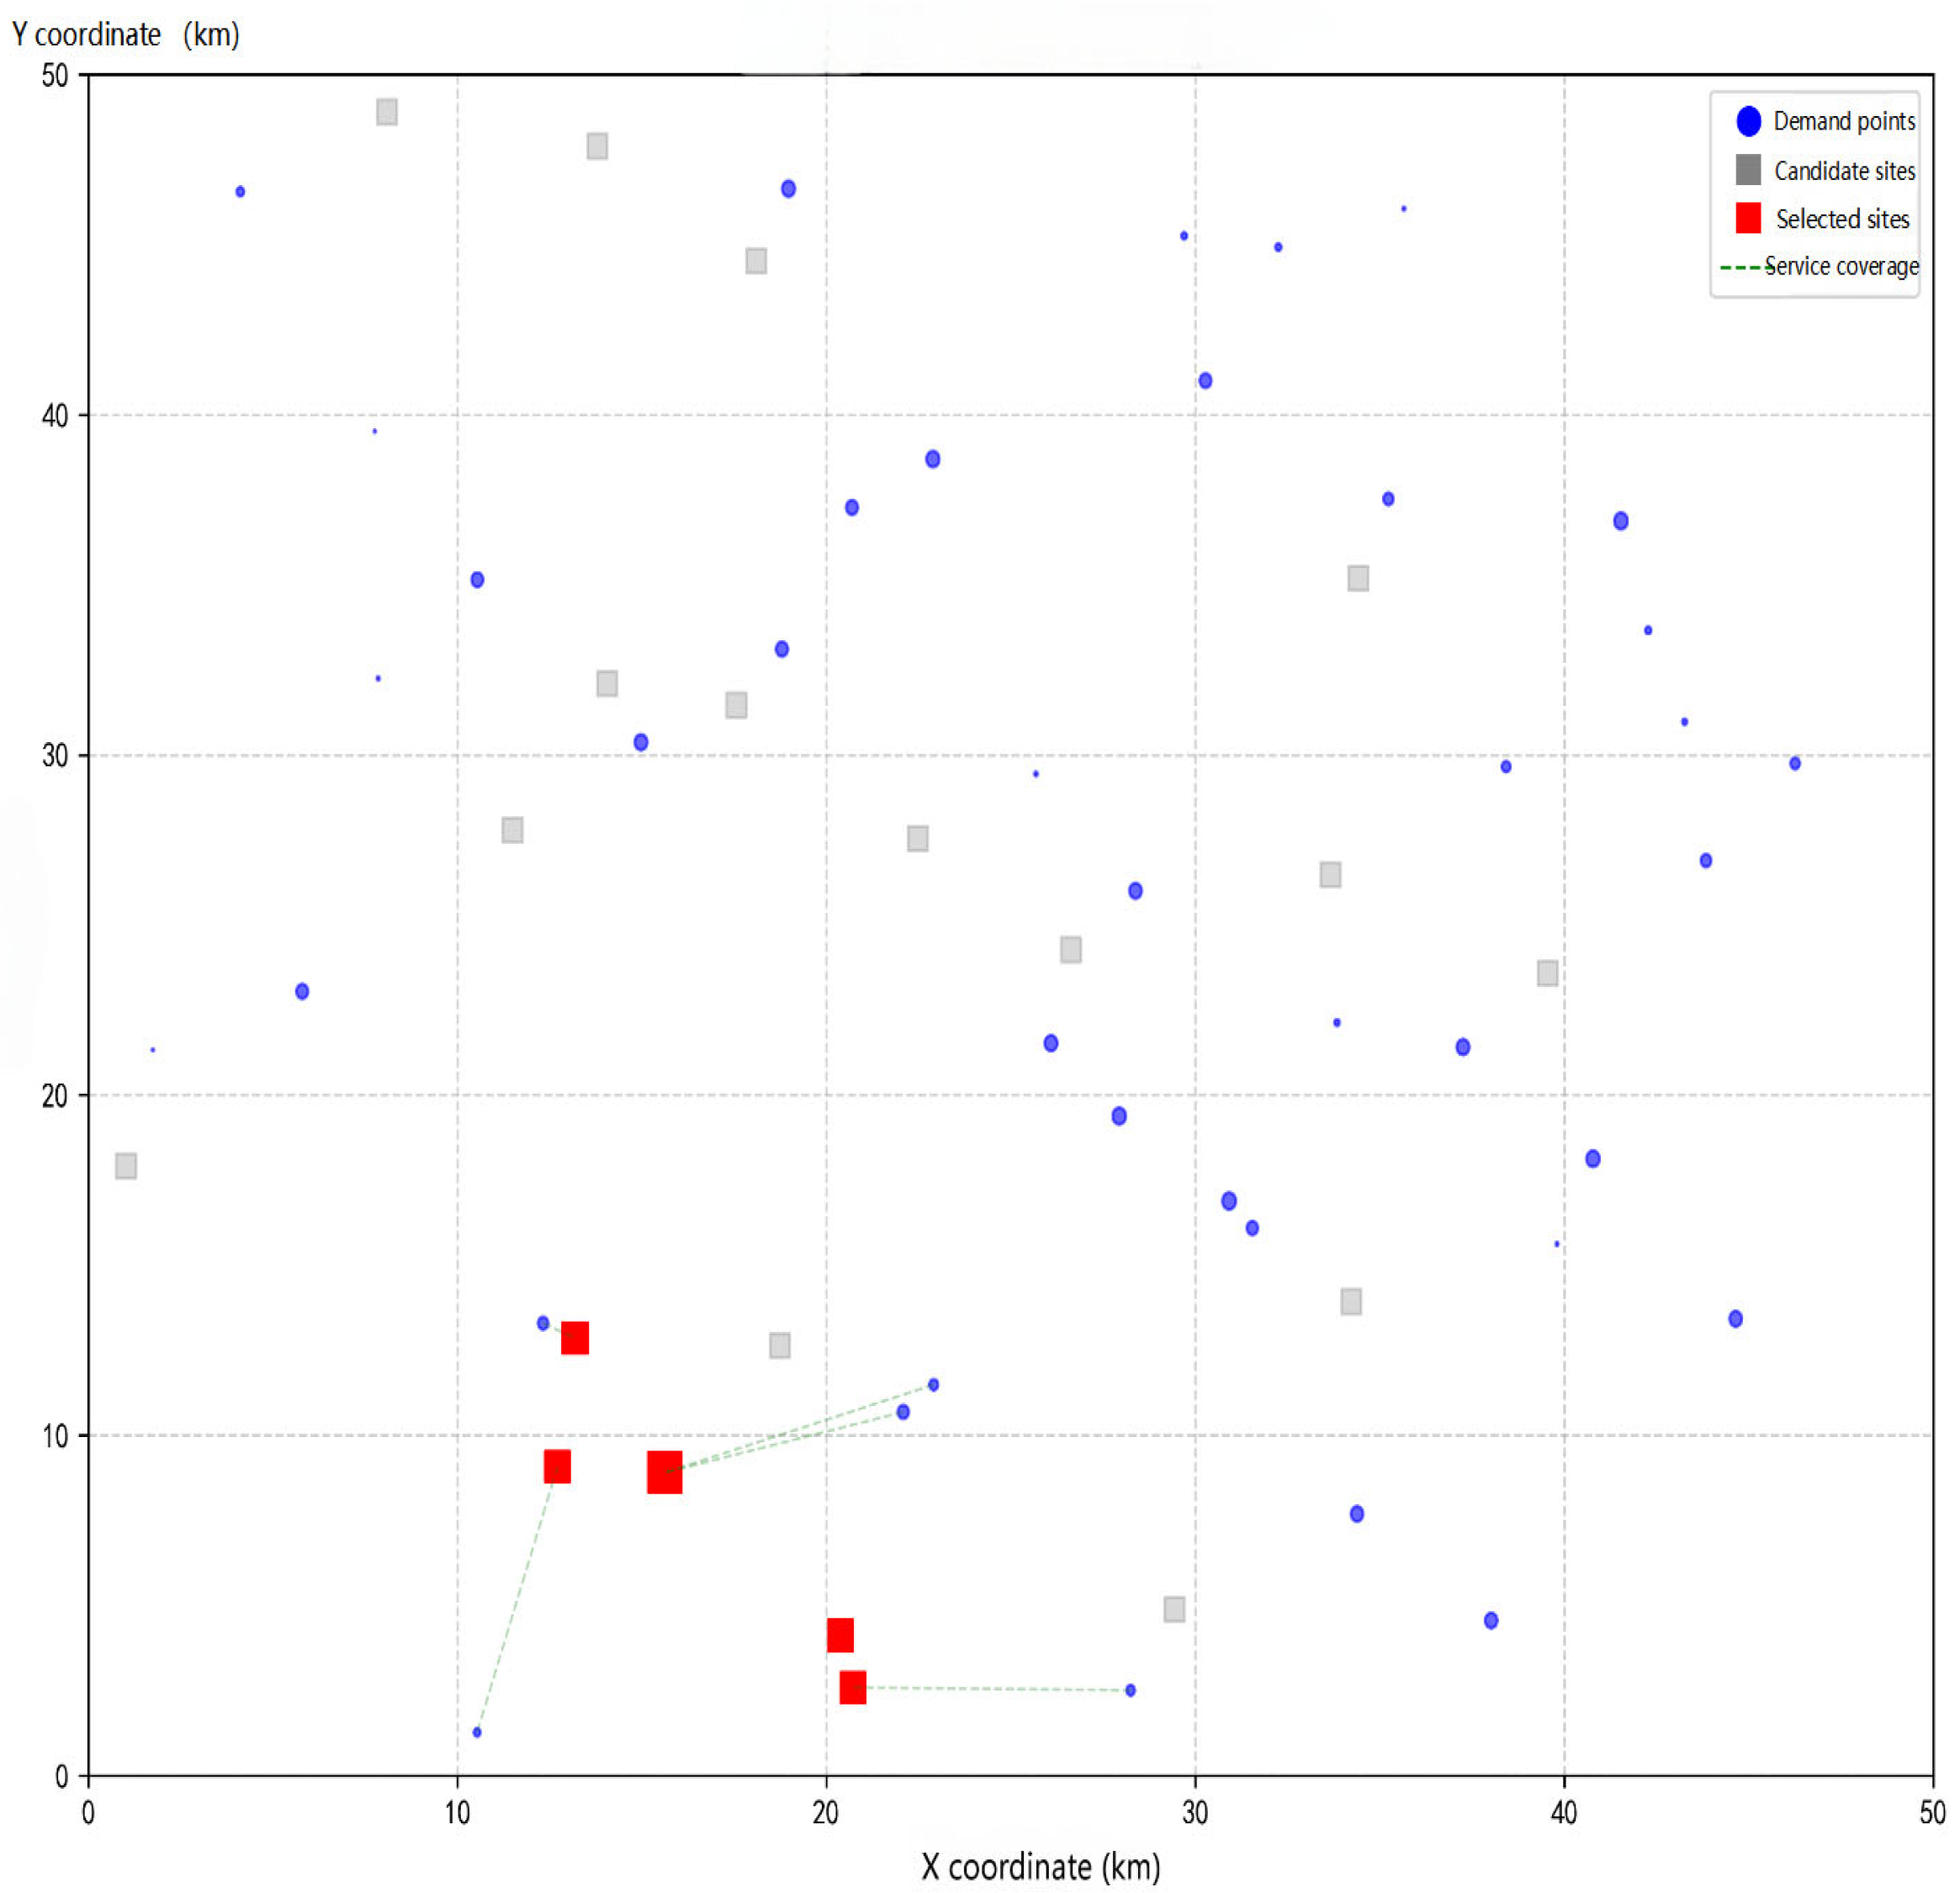
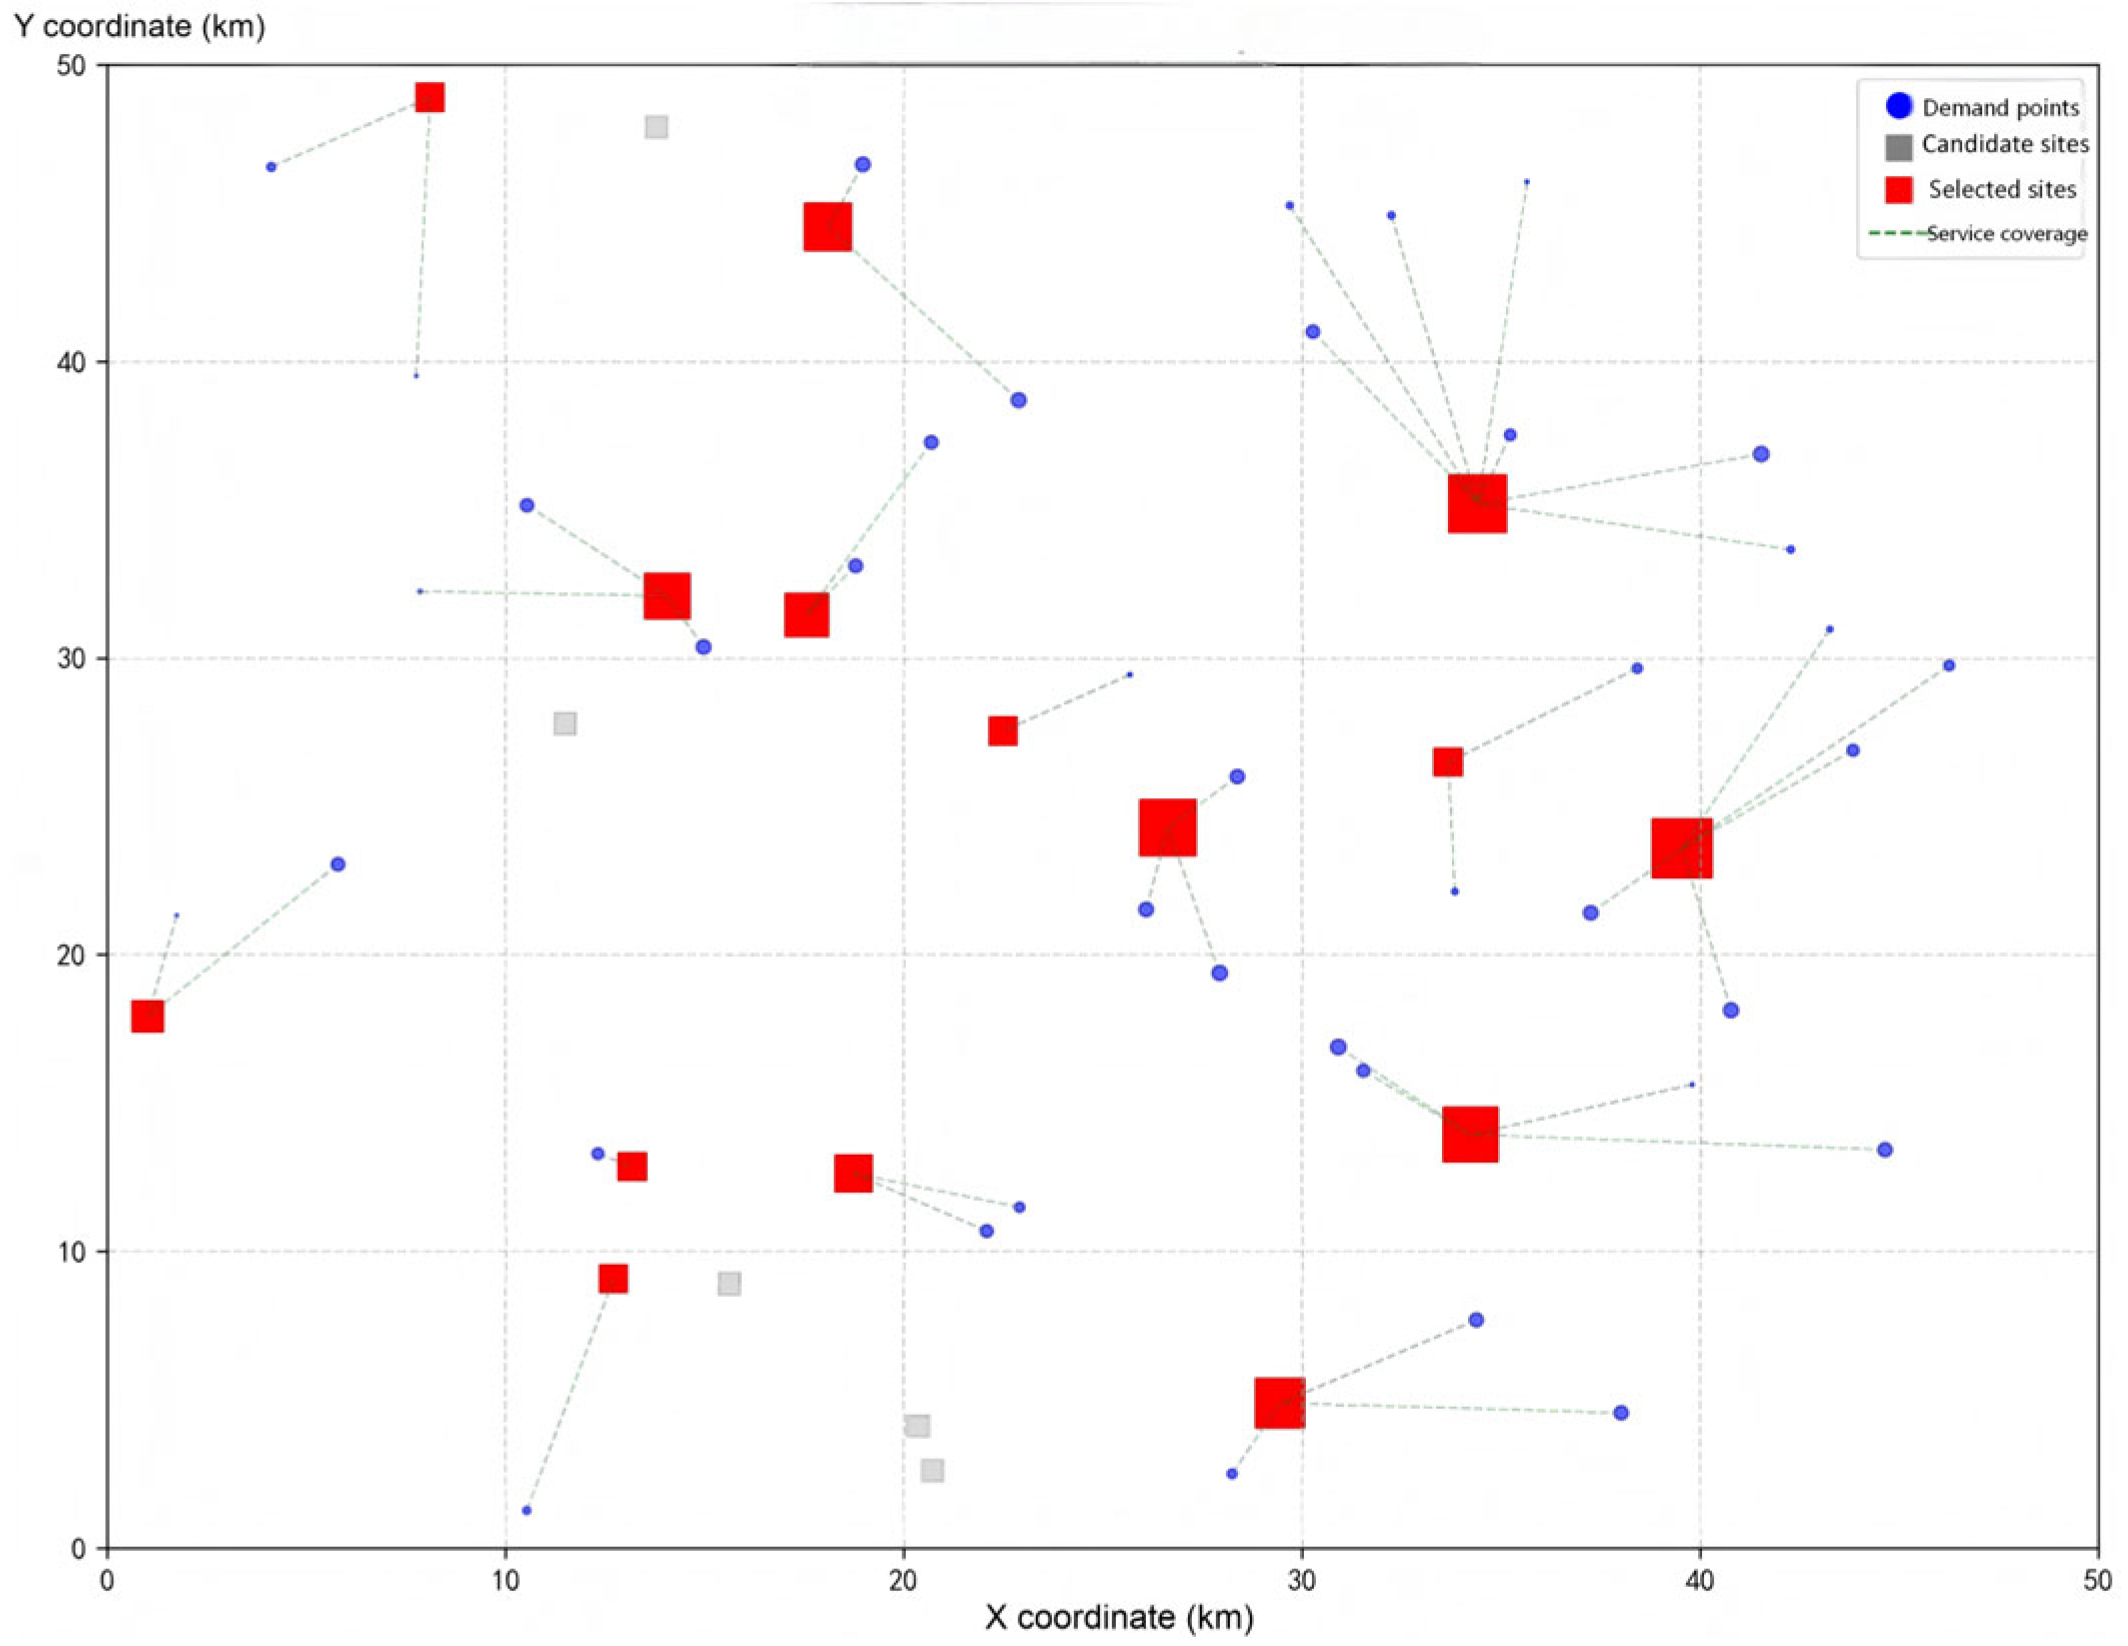
The evaluation scores obtained from the improved TOPSIS model all fall within the threshold range of [0, 1], and a higher score corresponds to a higher ranking. The improved TOPSIS model evaluates each scheme based on its normalized distances to the positive ideal solution (PIS) and negative ideal solution (NIS). The relative closeness C i is computed as C i = D i D i + + D i + ε , where a higher C i indicates a better overall performance. Based on the quantitative analysis and ranking of the candidate siting schemes using the improved TOPSIS model, the results indicate that Solution 13 is identified as the optimal siting solution (as shown in Figure 8). Solution 13 achieves the highest TOPSIS score (0.7003) because it strikes an optimal balance between cost efficiency and user satisfaction, avoiding extreme values in either objective. Under this evaluation framework, the selected candidate sites are Stations 3, 6, 8, 11, and 12, with the corresponding numbers of charging piles planned for construction being 20, 16, 20, 8, and 9, respectively. It is noteworthy that Solution 3, which primarily emphasizes operator cost reduction (Figure 9), and Solution 2, which focuses on maximizing user satisfaction (Figure 10), rank 26th and 20th, respectively, in the comprehensive evaluation. It should be emphasized that the results derived from the improved TOPSIS model do not represent an absolute optimal solution; rather, they provide a relative optimum achieved by balancing operator cost efficiency and user demand satisfaction. Furthermore, the regional level of economic development and residents’ consumption capacity play a decisive role in shaping the investment strategy for charging infrastructure. In regions with higher economic development, service quality centered on user experience should be prioritized. Conversely, in moderately developed regions, construction and operation cost control should take precedence to achieve optimal resource allocation, wherein focusing on cost minimization may, in fact, represent the most practical and effective solution.

3.5. Comparative Analysis of Algorithm Performance and Decision Effectiveness of the Improved TOPSIS Model

To comprehensively verify the superiority of the proposed improved NSGA-II algorithm, this section conducts a comparative analysis from two perspectives: algorithmic search performance and decision-support effectiveness of the improved TOPSIS model. The proposed method is compared against the standard NSGA-II algorithm under identical parameter settings, and all experimental results are statistically reported and analyzed.

3.5.1. Comparison of Algorithmic Search Performance

The search performance of an algorithm determines its ability to obtain high-quality solutions. In this study, several key performance indicators, including hypervolume (HV), inverted generational distance (IGD), diversity, and runtime, are adopted to evaluate and compare the optimization performance of different algorithms. The comparative results of the proposed improved NSGA-II algorithm against the standard NSGA-II, MOEA/D, and SPEA algorithms are summarized in Table 5.
Based on the results presented in Table 5, the performance of the algorithms can be analyzed and ranked as follows. The improved NSGA-II algorithm ranks first in both the hypervolume (HV) and diversity metrics, indicating that the obtained Pareto front not only covers the largest objective space with the highest overall solution quality, but also exhibits the most uniform distribution in the objective space. This provides decision-makers with the widest range of high-quality alternatives. Its IGD value is also highly competitive, ranking second only to the standard NSGA-II, which demonstrates good convergence performance and a solution set that closely approximates the true Pareto front. Although its computational time is not the shortest, this is a reasonable outcome of the advanced search mechanisms and diversity-preserving strategies incorporated into the algorithm, representing an appropriate trade-off between solution quality and computational efficiency. Overall, the improved NSGA-II achieves the best comprehensive performance, ranking first in terms of solution quality (HV and diversity) and convergence (IGD). The standard NSGA-II algorithm performs best in terms of the IGD metric, indicating the highest convergence accuracy. Its HV and diversity values both rank second, suggesting good solution quality and distribution. In addition, it exhibits relatively short runtime and high computational efficiency. Owing to its advantages in convergence speed and accuracy, the standard NSGA-II ranks second in overall performance. The SPEA algorithm shows moderate performance across all metrics. Its HV and diversity both rank third, indicating acceptable solution quality. However, its IGD value is noticeably worse than those of the two NSGA-II variants, reflecting relatively weak convergence performance. Its most significant drawback is the longest runtime, resulting in the lowest computational efficiency. Consequently, SPEA ranks third in overall performance. The MOEA/D algorithm demonstrates a clear advantage in runtime, achieving the highest computational efficiency. However, it performs poorly in the core solution quality metrics: both HV and diversity are the lowest among all algorithms, and its IGD value is substantially higher than those of the others. This indicates that its solution set has limited coverage, concentrated distribution, and remains far from the true Pareto front. Despite its high efficiency, the inferior solution quality leads to the lowest overall performance ranking, placing it fourth.
In summary, for the complex multi-objective optimization problem of charging station location planning, the improved NSGA-II algorithm exhibits comprehensive and significant superiority in terms of solution quality, distribution, and convergence. These results also effectively validate the effectiveness of the proposed algorithmic improvement strategies.

3.5.2. Comparative Analysis of Ranking Results Based on the Improved TOPSIS Model

To further validate the superiority of the improved NSGA-II algorithm in generating high-quality Pareto-optimal solution sets, this section presents a comparative analysis of the ranking results obtained by applying the improved TOPSIS model to the Pareto fronts generated by both algorithms. The comparison covers key performance indicators, including the comprehensive evaluation score, operator cost, user satisfaction, and charging station configuration schemes. The detailed results are summarized in Table 6.
According to the analysis of Table 6, the improved NSGA-II algorithm achieves a higher TOPSIS score (0.7003) compared with the standard NSGA-II algorithm (0.6928), indicating that its Pareto solution set is closer to the ideal solution in the dual-objective trade-off. Although the standard NSGA-II algorithm yields a slightly higher value in terms of the single user satisfaction indicator, it incurs a higher total cost and requires the construction of more charging stations, reflecting lower resource allocation efficiency. In contrast, the improved NSGA-II algorithm significantly reduces construction and operation costs while maintaining comparable user satisfaction, demonstrating superior economic efficiency and practical applicability. Overall, the five charging stations and their corresponding charging pile configurations selected by the improved NSGA-II algorithm (Stations 6, 8, 11, 12, and 3) exhibit a more balanced spatial distribution and service capability, effectively avoiding resource redundancy and waste. The siting results obtained by the standard NSGA-II algorithm based on the improved TOPSIS ranking are illustrated in Figure 11.

3.5.3. Comparative Analysis of Ranking Results with Different Weighting Methods

To validate the necessity and advantages of incorporating the entropy weight method into the improved Technique for Order Preference by Similarity to Ideal Solution (TOPSIS) model, and to highlight the differences between objective and subjective weighting approaches, this section compares the ranking results of the entropy-weighted scheme with those obtained using equal-weight AHP on the same Pareto-optimal solution set. Specifically, all criteria in the AHP method were assigned equal weights to rank the candidate alternatives, and the resulting rankings were then compared with those obtained from the improved TOPSIS method, with a focus on analyzing the differences and stability of the optimal compromise solutions under different weighting strategies.
Table 7 presents the comparative ranking results of the Top-5 solutions obtained using the improved TOPSIS method and the AHP-based method.
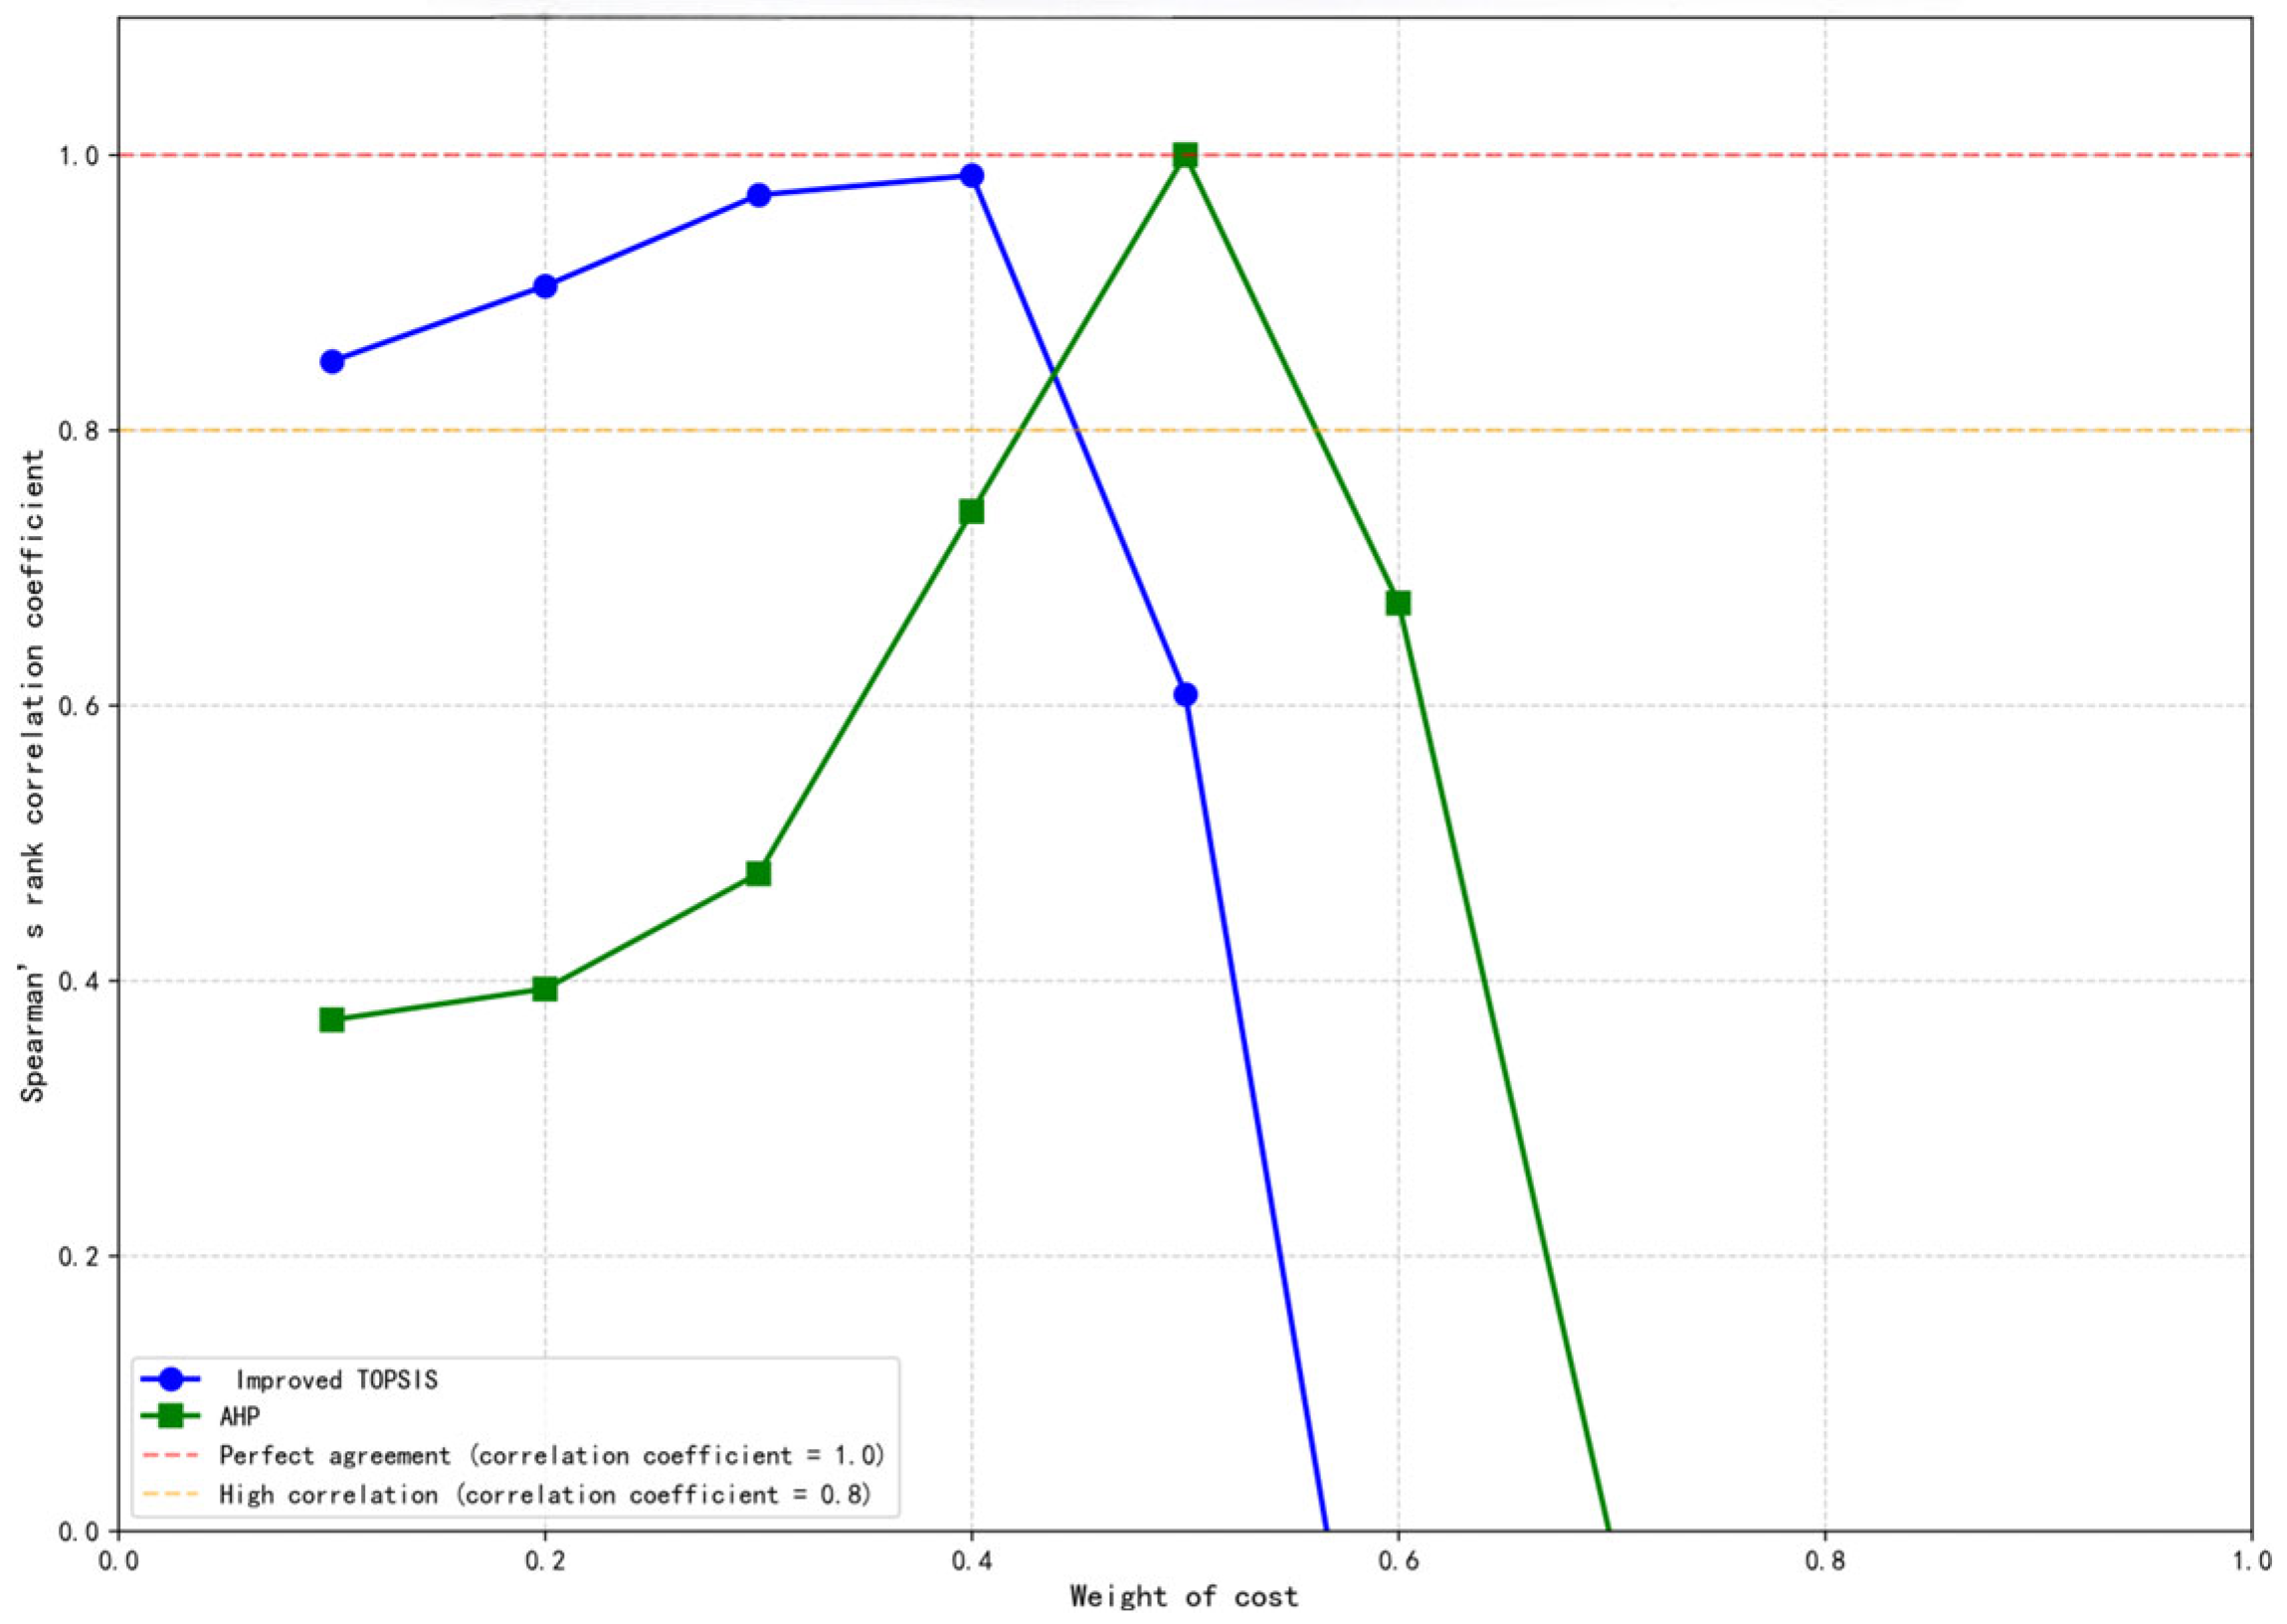
As shown in the table, under the improved TOPSIS method, solution 13 attains the highest comprehensive score, whereas its ranking drops to fifth place (0.6710) under the equal-weight AHP method, indicating that the choice of weight determination significantly affects the ranking outcomes. The equal-weight assumption in AHP subjectively balances the relative importance of objectives but fails to reflect the actual differences among schemes, whereas the improved TOPSIS method assigns weights based on indicator variability, providing a more objective representation of inter-scheme differences. Figure 12 illustrates the ranking stability of the improved TOPSIS and AHP methods under varying cost weights. The results demonstrate that the improved TOPSIS maintains high Spearman correlation across weight variations, showing minimal sensitivity to subjective weight settings, while AHP’s stability declines as the weight increases. These findings suggest that the improved TOPSIS is more reliable under weight uncertainty, offering a consistent and objective basis for decision-making.

3.5.4. Assessing Model Parameter Sensitivity

To evaluate the robustness of the electric vehicle charging station location optimization model, this chapter conducts a sensitivity analysis on two critical model parameters: the unit cost of charging piles ( q j ) and the maximum acceptable service distance ( d m a x , based on the Euclidean distance). The objectives of the sensitivity analysis are twofold: (1) to quantify the impact of variations in these parameters on the optimization objectives, namely total cost (Z1) and user satisfaction (Z2); and (2) to examine how changes in these parameters affect the final location decision scheme.
This study employs a one-factor-at-a-time approach for the sensitivity analysis, in which only one parameter is varied at a time while all other conditions are kept constant to ensure the comparability of results. For each parameter, three levels of variation are considered: the baseline value, a 20% decrease, and a 20% increase. The detailed experimental design is presented in Table 8.
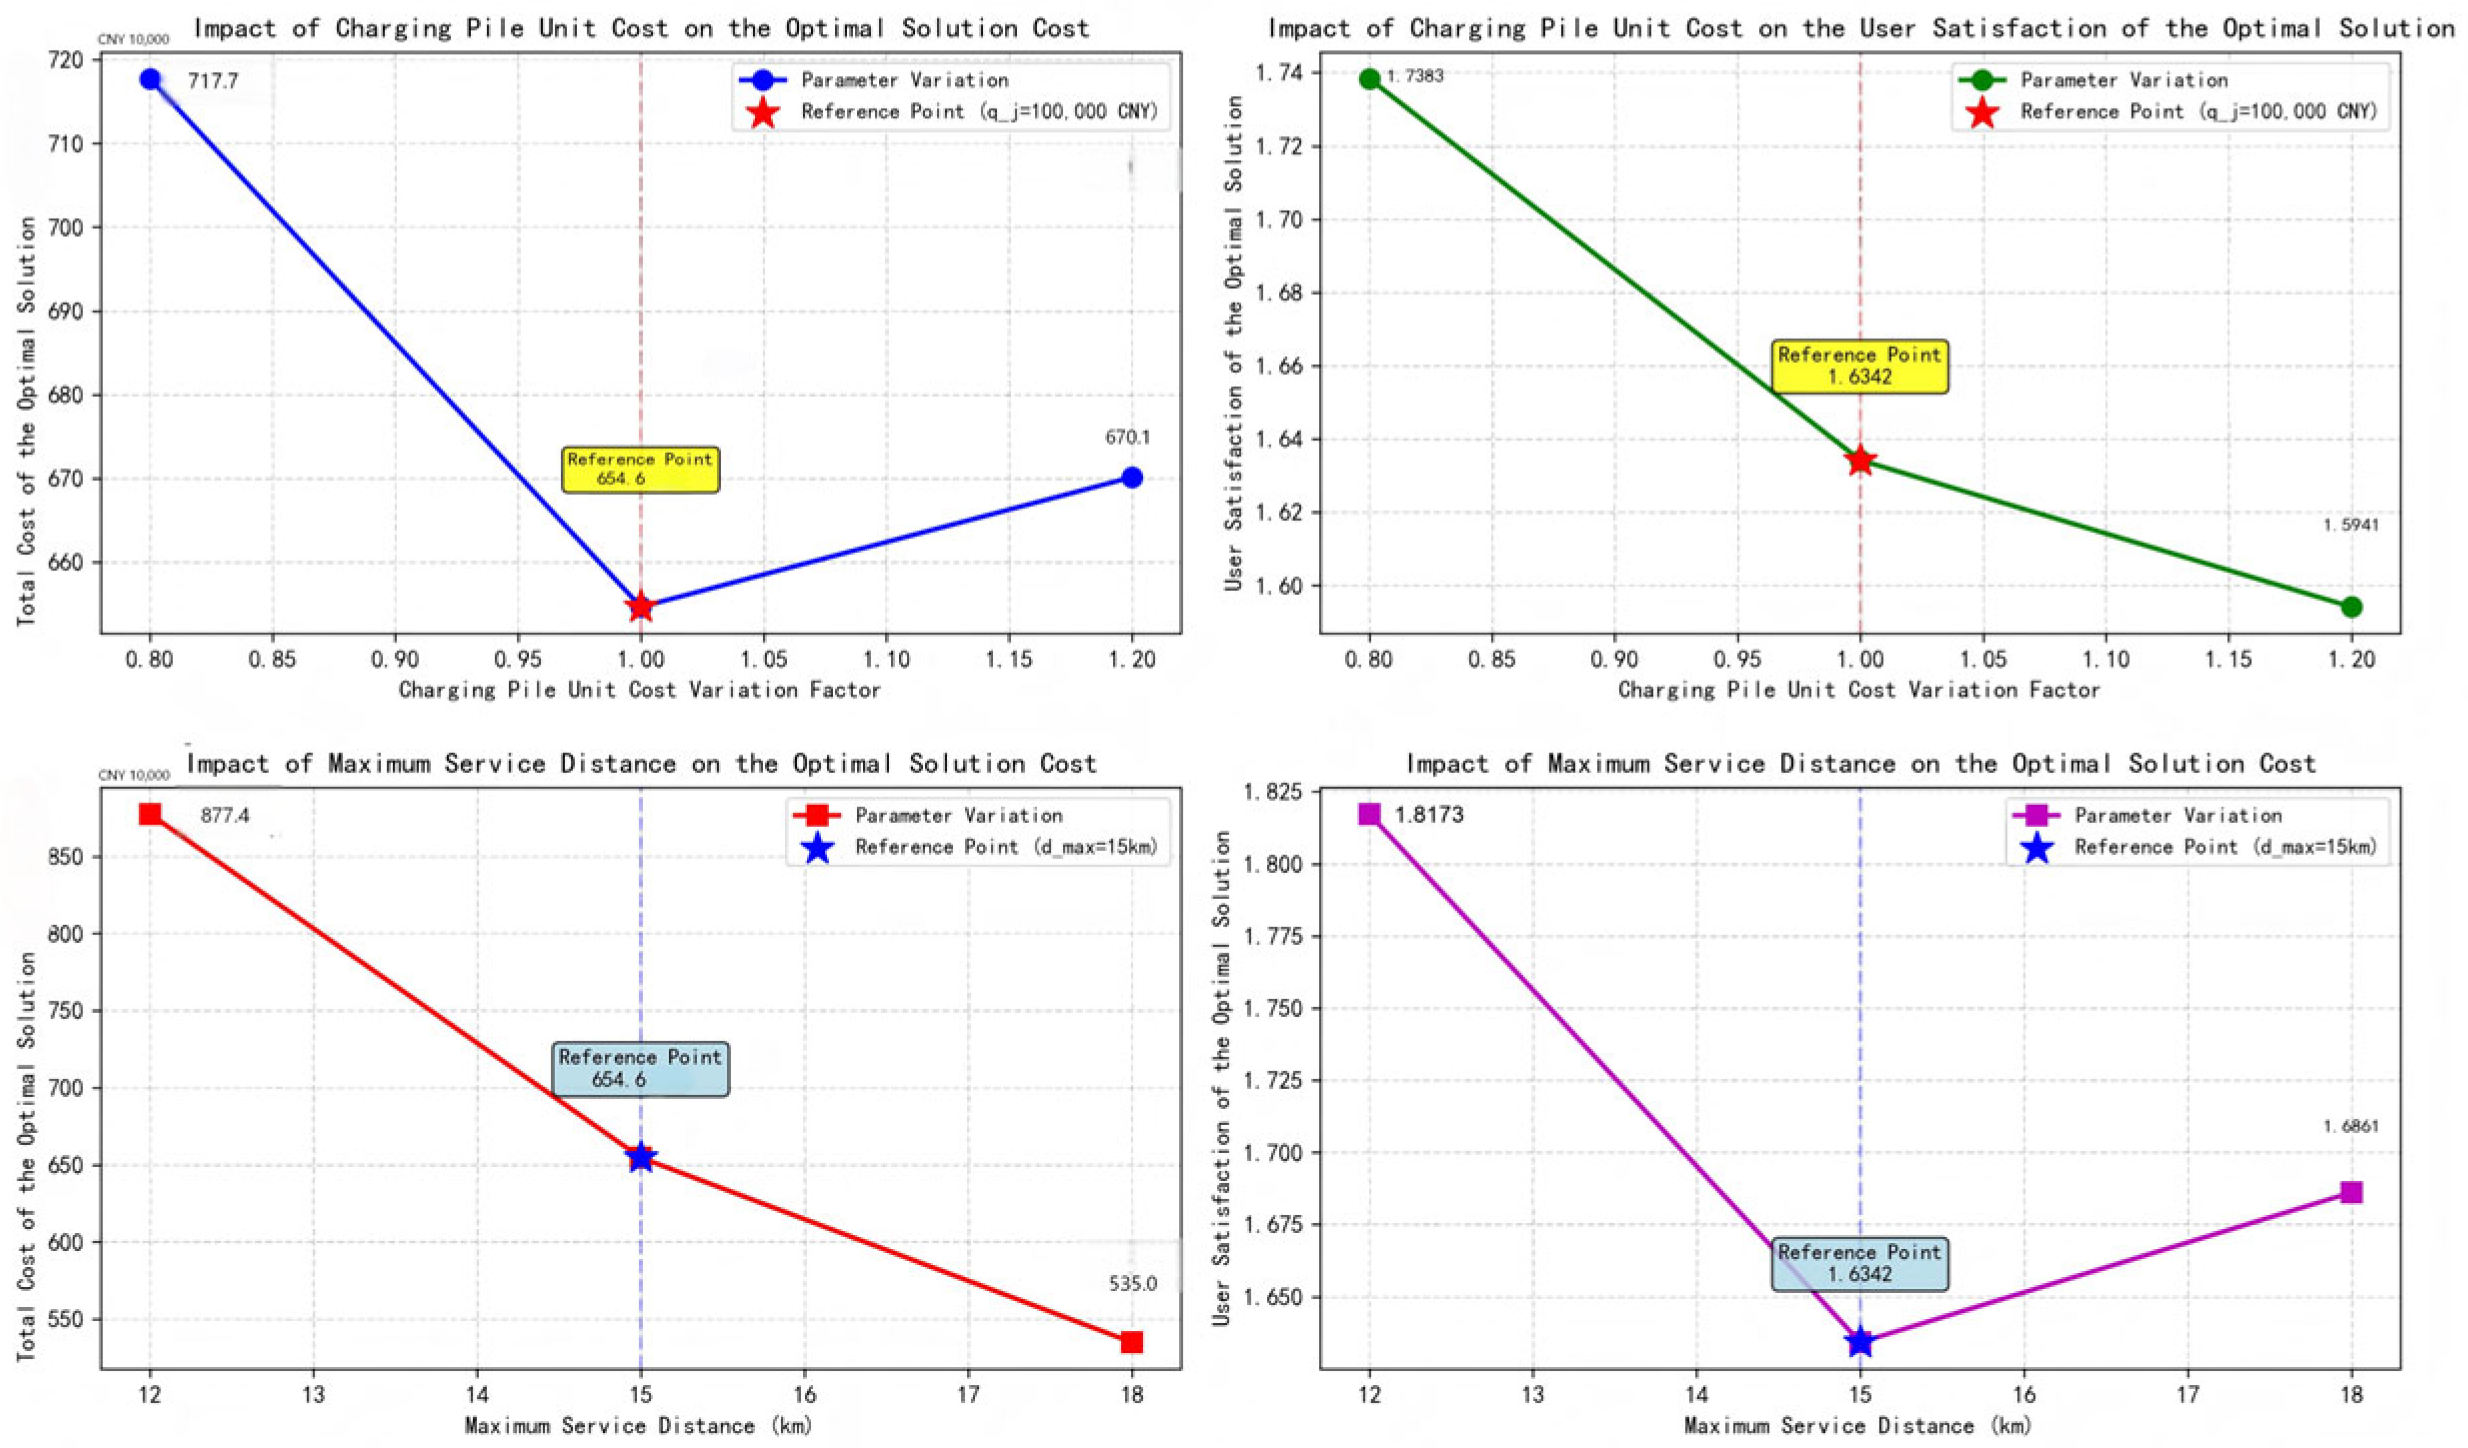
To control experimental variables, all sensitivity analysis experiments were conducted using the same parameter settings of the improved NSGA-II algorithm: a population size of 100, 100 generations, a crossover rate of 0.9, and a mutation rate of 0.3. After each experiment, the characteristics of the Pareto-optimal solution set were recorded, and the best compromise solution was selected from each Pareto set using the entropy-weighted TOPSIS method, consistent with the baseline experiment. The experimental results are presented in Figure 13.
The following analysis is drawn from the experimental results presented above.
(1)
Impact of Charging Pile Unit Cost ( q j )
Changes in the unit cost of charging piles directly affect construction costs, influencing both total cost (Z1) and location decisions. As shown in Figure 12, increasing q j by 20% from 100,000 CNY to 120,000 CNY raises the total cost by 18.2%, while user satisfaction (Z2) decreases slightly by 2.1%, indicating that cost is sensitive to q j , whereas satisfaction remains stable. Conversely, reducing q j by 20% to 80,000 CNY lowers total cost by 15.6% and slightly improves satisfaction by 1.8%. These results suggest that q j mainly affects economic objectives, with limited impact on service quality.
(2)
Impact of Maximum Service Distance ( d m a x )
The maximum service distance shapes station layout and coverage. As Figure 12 shows, increasing d m a x from 15 km to 18 km (+20%) boosts user satisfaction by 11.7% while raising total cost by only 5.3%, due to more flexible layouts covering remote demand points. Reducing d m a x to 12 km (−20%) decreases satisfaction by 13.5% and lowers cost by 6.8%, reflecting reduced accessibility but more concentrated construction. Thus, d m a x has a stronger influence on satisfaction, and adjusting it can guide strategies prioritizing either coverage or cost.
(3)
Model Robustness
Within ±20% variations key parameters, the model consistently produces Pareto-optimal solutions with clear economic–service trade-offs. The best compromise solutions respond logically to parameter changes, demonstrating strong robustness and providing decision-makers with stable, reliable spatial layouts suitable for diverse real-world charging infrastructure planning scenarios.

3.5.5. Scalability Analysis of the Proposed Framework

Although this study is conducted on a medium-scale case (45 demand points, 20 candidate stations), the design of the proposed improved NSGA-II-TOPSIS framework inherently considers the requirements of larger-scale networks in practical planning. The modular architecture of the framework allows its core components to be readily extended to incorporate more realistic factors. However, theoretical scalability must be validated experimentally to assess the framework’s adaptability to actual large-scale planning problems. Therefore, we designed and conducted a systematic scalability experiment to empirically address the following key questions: How does the performance of the proposed algorithm change as the numbers of candidate stations and demand points increase exponentially? Can it still obtain high-quality siting solutions within a reasonable time frame?
Experimental Design for Scalability:
To simulate real-world planning scenarios of varying complexity, we constructed three problem scales:
Small Scale: 45 demand points, 20 candidate sites (consistent with the main case study), with a maximum of 15 stations, minimum of 5 stations, and a population size of 100.
Medium Scale: 90 demand points, 40 candidate sites (2 × scale, simulating city-level networks), with a maximum of 25 stations, minimum of 8 stations, and a population size of 150.
Large Scale: 180 demand points, 80 candidate sites (4 × scale, simulating regional-level networks), with a maximum of 35 stations, minimum of 10 stations, and a population size of 200.
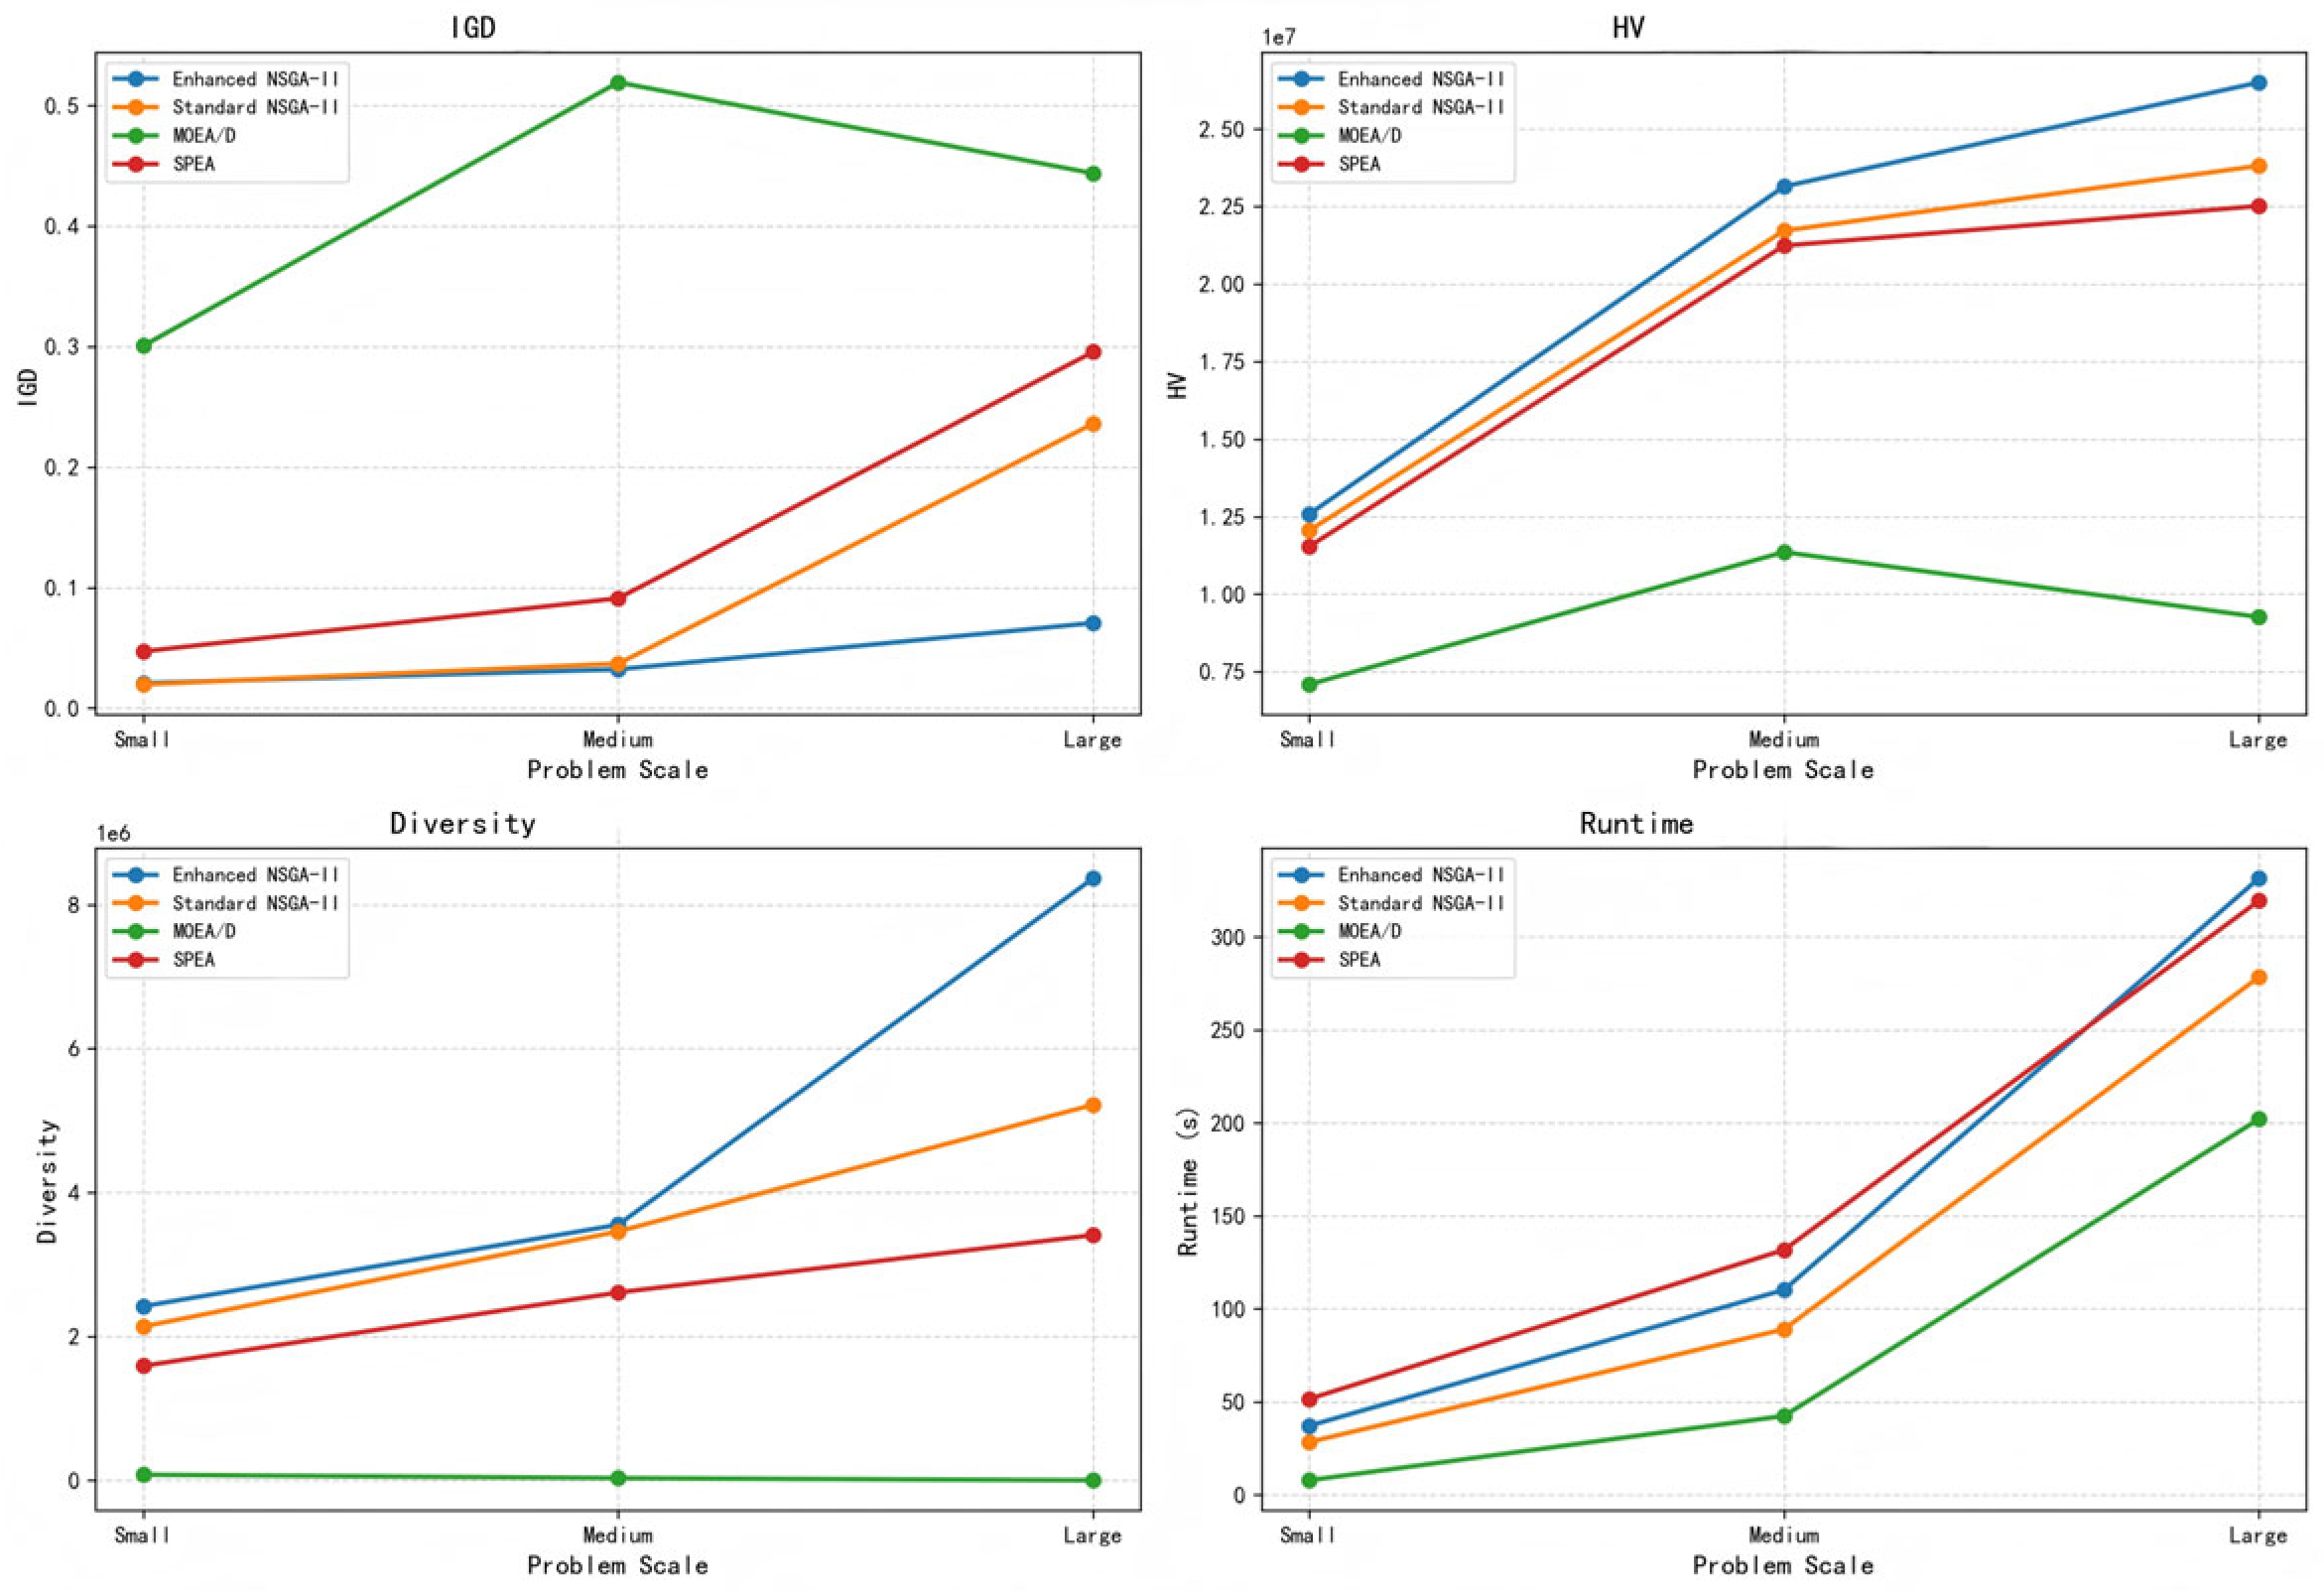
All algorithms were executed under identical parameter settings for 100 generations and evaluated using four performance indicators: Inverted Generational Distance (IGD), Hypervolume (HV), diversity, and computational time. The overall performance comparison of the algorithms across different problem scales is intuitively illustrated in Figure 14, while the detailed quantitative results are summarized in Table 9 for further in-depth analysis.
Although the present study is conducted based on small-scale case scenarios, the modular design of the proposed improved NSGA-II–TOPSIS framework inherently enables its application to larger-scale and more complex real-world planning problems. To systematically examine the performance evolution and practical applicability of the algorithms as the problem scale increases, a series of multi-scale expansion experiments were carried out, aiming to reveal the underlying mechanisms driving performance variation and their corresponding planning implications. The experimental results indicate that, as the problem scale increases from a small-scale instance (45 demand points and 20 candidate stations) to a large-scale instance (180 demand points and 80 candidate stations), the computational time of all algorithms increases, which is consistent with the fundamental characteristics of combinatorial optimization problems. However, the improved NSGA-II demonstrates superior scalability robustness across key performance indicators, with performance degradation significantly lower than that of the benchmark algorithms.
(1)
Convergence and solution quality.
The IGD value of the improved NSGA-II increases from 0.0208 in the small-scale scenario to 0.0707 in the large-scale scenario, representing an approximate 3.4-fold increase. Nevertheless, its IGD under the large-scale setting remains substantially lower than those of the standard NSGA-II, SPEA, and MOEA/D, confirming its strong ability to effectively approximate the true Pareto front in high-dimensional search spaces. More importantly, the hypervolume (HV), which reflects the overall quality and coverage of the solution set, reaches 26.5 million in the large-scale case and consistently remains the highest among all algorithms. Moreover, its growth trend with increasing problem scale is the smoothest, indicating that the high-quality solution sets generated by the proposed algorithm exhibit strong scalability and robustness.
(2)
Diversity of the solution set.
The diversity indicator of the improved NSGA-II increases markedly from 2.42 million to 8.37 million as the problem scale expands. This improvement is not coincidental but results from the synergistic effects of the embedded chaotic initialization, opposition-based learning, and adaptive mutation mechanisms. These strategies effectively maintain and enhance the population’s exploratory capability under rapidly increasing problem dimensionality, preventing premature convergence and enabling the generation of well-distributed Pareto-optimal solutions even in ultra-high-dimensional decision spaces. In contrast, the diversity of MOEA/D almost collapses in the large-scale scenario (approaching zero), highlighting the inherent limitations of its decomposition-based strategy when dealing with high-dimensional and complex Pareto fronts.
(3)
Trade-off analysis of computational efficiency.
The computational time of the improved NSGA-II increases from 37.15 s to 331.64 s as the problem scale expands. Although the absolute runtime increases, the growth factor (approximately 8.9 times) is significantly lower than the growth factor of the number of decision variables (approximately 16 times), indicating that the algorithm does not suffer from catastrophic time complexity escalation. More importantly, within an acceptable computation time (approximately 5.5 min), the proposed method is capable of generating a high-quality and highly diverse set of candidate siting solutions for a simulated regional-scale network with 180 demand points. This level of efficiency fully satisfies the timeliness requirements of the preliminary planning and scheme comparison stages.
The comprehensive analysis demonstrates that the improved NSGA-II–TOPSIS framework is capable of effectively addressing large-scale charging network planning problems. Its core enhancement mechanisms—including high-quality initialization, intelligent convergence guidance, and adaptive balance between exploration and exploitation—not only ensure superior performance in small-scale cases but also enable mitigated performance degradation and strong predictability as the problem scale increases. Although the computational cost inevitably rises with increasing scale, the algorithm exhibits more pronounced overall advantages in terms of solution quality (HV), distribution (diversity), and convergence accuracy (IGD). These strengths provide reliable support for solution exploration and decision trade-off analysis in large-scale planning scenarios. Consequently, the proposed framework demonstrates both theoretical scalability and practical feasibility, offering an efficient decision-support tool for the planning of urban- and regional-level charging infrastructure.

4. Conclusions and Outlook

4.1. Main Findings and Contributions

This study focuses on the site selection of urban electric vehicle (EV) charging stations and verifies the effectiveness of the proposed model and algorithm through simulation analysis. To address the limitations of traditional studies that are often single-objective and suffer from insufficient algorithmic performance, a multi-objective optimization model considering both operator cost and user satisfaction is developed. An improved NSGA-II algorithm combined with an entropy-weighted TOPSIS decision model is introduced to achieve a dynamic balance between economic efficiency and service quality. The proposed framework provides a quantitative and practical basis for the scientific planning of urban charging infrastructure, offering significant implications for improving energy utilization efficiency and promoting sustainable urban transportation. The research framework consists of three main components. First, in terms of model construction, a multi-objective site selection framework is established from the dual perspectives of operators and users, comprehensively balancing economic and service-oriented objectives to overcome the limitations of traditional single-target approaches. Second, in algorithm design, an improved NSGA-II algorithm integrated with the entropy-weighted TOPSIS method is employed for multi-objective optimization. Techniques such as chaotic initialization, opposition-based learning, and adaptive hybrid mutation are incorporated to enhance convergence efficiency and solution diversity. Finally, in model validation, case analyses are conducted to verify the applicability of the proposed approach, providing practical guidance for optimizing urban charging infrastructure layout. In the empirical analysis, an actual urban scenario is considered, generating 40 valid demand points and 20 candidate sites. The improved NSGA-II algorithm yields 26 sets of Pareto-optimal solutions, which are further ranked using the entropy-weighted TOPSIS method. The optimal scheme selects candidate sites 3, 6, 8, 11, and 12, with 20, 16, 20, 8, and 9 chargers, respectively. The results demonstrate that the proposed model and algorithm achieve high optimization efficiency, effectively improving the coordination between user satisfaction and operator profitability, and providing robust support for complex urban charging demand planning. However, certain limitations remain. The model assumptions do not fully account for practical factors such as multi-vehicle sharing of chargers, heterogeneous charging power levels, and users’ stochastic charging behaviors, which may cause deviations from real-world conditions. Moreover, external variables such as weather variations, dynamic traffic flow, and policy incentives are not yet incorporated, limiting the model’s adaptability and generality. Future research may incorporate dynamic queuing models and heterogeneous charger configurations to better capture realistic charging behaviors, while integrating multidimensional factors—such as traffic dynamics, extreme weather, and policy stimuli—through real-time data interfaces to enhance environmental adaptability. In summary, this study provides a novel framework and methodological reference for the scientific planning and optimization of urban EV charging infrastructure, contributing valuable theoretical and practical insights toward the advancement of intelligent transportation and low-carbon mobility systems.

4.2. Discussion on Model Implications, Positioning, and Future Extensions

To achieve a balance between limited information availability and computational feasibility, this study introduces a series of necessary simplifying assumptions in the model formulation, including equipment homogeneity, static user behavior, and a nearest-station choice strategy. These assumptions ensure the tractability of the model and the robustness of the results. The primary objective is to establish a clear methodological benchmark, through which the fundamental trade-off between operator cost and user satisfaction can be systematically revealed and quantitatively characterized for the first time. Accordingly, the principal value of the proposed framework lies in providing a transparent and quantifiable decision trade-off spectrum and performance boundary for high-level charging network planning. Nevertheless, it must be acknowledged that the current framework, in its present form, is subject to inherent analytical limitations. Its adaptability, stability, and decision accuracy across diverse real-world scenarios remain to be further validated. These limitations mainly arise from the fact that several critical dynamic and contextual factors commonly encountered in practical planning have not yet been incorporated into the model.
The modular architecture adopted in this study provides a solid technical foundation for systematically integrating such complexities. Future research may extend the framework along the following directions to facilitate its transition from methodological validation to scenario-oriented application:
(1)
Multi-scenario testing and adaptability analysis.
The framework can be applied to real-world cases characterized by different urban structures, demand scales, and spatial distributions to systematically assess its performance consistency and generalization capability. Particular attention should be given to the influence of regional characteristics—such as land-use costs and power grid capacity—as well as macro-contextual factors including seasonal demand fluctuations.
(2)
Real-data-driven validation and enhancement.
Integrating real traffic flow data, electric vehicle travel trajectories, and land-use constraints would enhance the model’s ability to represent complex real-world environments. In addition, incorporating dynamic electricity pricing mechanisms, specific policy incentives, and the market composition of battery technologies could enable the framework to respond more accurately to economic and policy signals.
(3)
Modeling of dynamic and stochastic factors.
By incorporating time-varying demand, dynamic traffic conditions, and stochastic user behavior, the framework can be strengthened to better handle real-world uncertainty. This research direction may be further extended to consider the coordinated deployment of heterogeneous charging technologies, as well as the impacts of technological evolution and market penetration dynamics on long-term planning strategies.
In summary, this study establishes a methodologically sound and scalable prototype of a decision-support framework. Through the progressive integration of richer dynamic data, finer-grained behavioral models, and more comprehensive contextual modules, future work can evolve the framework from providing fundamental trade-off boundaries into a powerful tool capable of supporting concrete, differentiated decision-making in increasingly complex planning practices.

Author Contributions

Conceptualization, X.L., H.G. and D.Y.; methodology, H.G.; software, H.G. and H.C.; validation, H.G. and Y.W.; formal analysis, Y.W.; investigation, H.G.; resources, X.L. and H.G.; data curation, H.G.; writing—original draft preparation, H.G.; writing—review and editing, X.L., H.G. and D.Y.; visualization, H.G.; supervision, X.L. and D.Y.; project administration, X.L.; funding acquisition, X.L. All authors have read and agreed to the published version of the manuscript.

Funding

This research was funded by [Enhancing the Resilience of Fujian’s New Energy Vehicle Industry Chain under the New Quality Productivity Paradigm] grant number [2024R0124].

Institutional Review Board Statement

Not applicable.

Informed Consent Statement

Not applicable.

Data Availability Statement

Data are contained within the article.

Conflicts of Interest

The authors declare no conflicts of interest.

References

  1. Wolfram, P.; Weber, S.; Gillingham, K.; Hertwich, E.G. Pricing indirect emissions accelerates low-carbon transition of US light vehicle sector. Nat. Commun. 2021, 12, 7121. [Google Scholar] [CrossRef]
  2. Hung, Y.-C.; Michailidis, G. A novel data-driven approach for solving the electric vehicle charging station location-routing problem. IEEE Trans. Intell. Transp. Syst. 2022, 23, 23858–23868. [Google Scholar] [CrossRef]
  3. Yi, T.; Cheng, X.B.; Zheng, H.; Liu, J.-P. Research on location and capacity optimization method for electric vehicle charging stations considering user’s comprehensive satisfaction. Energies 2019, 12, 1915. [Google Scholar] [CrossRef]
  4. Zhou, G.Y.; Zhu, Z.W.; Luo, S.M. Location optimization of electric vehicle charging stations: Based on cost model and genetic algorithm. Energy 2022, 247, 123437. [Google Scholar] [CrossRef]
  5. Kadri, A.A.; Perrouault, R.; Boujelben, M.K.; Gicquel, C. A multi-stage stochastic integer programming approach for locating electric vehicle charging stations. Comput. Oper. Res. 2020, 117, 104888. [Google Scholar] [CrossRef]
  6. Sun, C.; Li, T.; Tang, X. Data-driven electric vehicle charging station placement for incentivizing potential demand. In Proceedings of the 2021 IEEE International Conference on Communications, Control, and Computing Technologies for Smart Grids (SmartGridComm), Aachen, Germany, 25–28 October 2021; pp. 27–32. [Google Scholar]
  7. Silapan, S.; Patchanee, S.; Kaewdornhan, N.; Somchit, S.; Chatthaworn, R. Optimal sizing and locations of fast charging stations for electric vehicles considering power system constraints. IEEE Access 2024, 12, 139620–139631. [Google Scholar] [CrossRef]
  8. Kumar, B.V.; Chitkara, M.; Kumar, S. Optimizing EV Charging Stations and Capacitors with the Cuckoo Search Algorithm for Reduced Energy Loss in Distribution Networks. In Proceedings of the 2024 IEEE North Karnataka Subsection Flagship International Conference (NKCon), Bagalkote, India, 21–22 September 2024; pp. 45–50. [Google Scholar]
  9. Li, J.; Liu, Z.; Wang, X. Public charging station localization and route planning of electric vehicles considering the operational strategy: A bi-level optimizing approach. Sustain. Cities Soc. 2022, 87, 104153. [Google Scholar] [CrossRef]
  10. Li, Y.; Zhang, H.; Wang, X. Hybrid genetic algorithm–simulated annealing based electric vehicle charging station placement for optimizing distribution network resilience. Energy Rep. 2024, 10, 1125–1138. [Google Scholar] [CrossRef]
  11. Zapotecas-Martínez, S.; Armas, R.; García-Nájera, A. A multi-objective evolutionary approach for the electric vehicle charging stations problem. Expert Syst. Appl. 2024, 240, 122514. [Google Scholar] [CrossRef]
  12. Zhang, Q.; Si, G.; Li, H. Optimization of electric vehicle charging station location distribution based on activity–travel patterns. ISPRS Int. J. Geo-Inf. 2025, 14, 373. [Google Scholar] [CrossRef]
  13. Ding, X.; Jiang, Z.; Fu, Y.; Zhang, H. Optimization method for location and capacity determination of electric vehicle mobile charging station based on multi-objective hybrid frog jump algorithm. Sustain. Energy Res. 2025, 12, 49. [Google Scholar] [CrossRef]
  14. Yu, N.; Feng, X.; Tang, A.; Sun, L.; Li, Y.; Wang, J.; Zhang, Q. Electric Vehicle Charging Station Location Method Based on an Improved NSGA-II Algorithm. J. Zhengzhou Univ. (Sci. Ed.) 2025, 1–6. [Google Scholar] [CrossRef]
  15. Jia, Y.; Xing, F. Electric Vehicle Charging Station Location Based on Satisfaction Optimization. J. Donghua Univ. (Nat. Sci. Ed.) 2017, 43, 739–745+770. (In Chinese) [Google Scholar]
  16. Xu, D.; Pei, W.; Zhang, Q. Optimal Planning of Electric Vehicle Charging Stations Considering User Satisfaction and Charging Convenience. Energies 2022, 15, 5027. [Google Scholar] [CrossRef]
  17. Zhang, Y.; Wang, J. Planning of electric vehicle charging stations: An integrated deep learning and queueing theory approach. Appl. Energy 2023, 347, 121438. [Google Scholar]
  18. Limane, A.; Zitouni, F.; Harous, S.; Almazyad, A.S.; Ferhat, A. Chaos-enhanced metaheuristics: Classification, comparison, and convergence analysis. Complex Intell. Syst. 2025, 11, 177. [Google Scholar] [CrossRef]
  19. Aydemir, S.B. A novel arithmetic optimization algorithm based on chaotic maps for global optimization. Evol. Intell. 2023, 16, 981–996. [Google Scholar] [CrossRef]
  20. Rahnamayan, S.; Tizhoosh, H.R.; Salama, M.M.A. Opposition-Based Differential Evolution. IEEE Trans. Evol. Comput. 2008, 12, 64–79. [Google Scholar] [CrossRef]
  21. Dua, R.; Almutairi, S.; Bansal, P. Emerging energy economics and policy research priorities for enabling the electric vehicle sector. Energy Rep. 2024, 12, 1836–1847. [Google Scholar] [CrossRef]
  22. Wang, Z.; Li, P.; Cai, W.; Shi, Z.; Liu, J.; Cao, Y.; Li, W.; Wu, W.; Li, L.; Liu, J.; et al. Identifying administrative villages with an urgent demand for rural domestic sewage treatment at the county level: Decision making from China wisdom. Sustainability 2025, 17, 800. [Google Scholar] [CrossRef]
  23. Thunuguntla, V.K.; Maineni, V.; Injeti, S.K.; Kumar, P.P.; Nuvvula, R.S.S.; Dhanamjayulu, C.; Rahaman, M.; Khan, B.A. A TOPSIS-based multi-objective optimal deployment of solar PV and BESS units in power distribution system electric vehicles load demand. Sci. Rep. 2024, 14, 29688. [Google Scholar] [CrossRef] [PubMed]
  24. Ai, X.; Li, Y.; Wang, K.; Hu, J. Electric Vehicle Charging Station Location and Capacity Determination Based on a Chaos Simulated Annealing Particle Swarm Optimization Algorithm. Electr. Power Autom. Equip. 2018, 38, 9–14. (In Chinese) [Google Scholar] [CrossRef]
  25. Jiang, X.; Feng, Y.; Xiong, H.; Wang, J.; Zeng, Q. Electric Vehicle Charging Station Planning Based on a Travel Probability Matrix. Trans. China Electrotech. Soc. 2019, 34, 2719. (In Chinese) [Google Scholar]
  26. Wang, Z. Research on the Location of Urban Public Electric Vehicle Charging Stations Based on a Multi-Objective Programming Model. Master’s Thesis, Henan University, Kaifeng, China, 2023. (In Chinese). [Google Scholar]
Figure 1. Workflow of the adaptive mechanism.
Sustainability 18 00668 g001
Figure 2. Dynamic adjustment of adaptive mutation operator weights.
Sustainability 18 00668 g002
Figure 3. Simulation diagram of electric vehicle charging station location planning.
Sustainability 18 00668 g003
Figure 4. The number of solutions for different sequences.
Sustainability 18 00668 g004
Figure 5. The pareto front solution set.
Sustainability 18 00668 g005
Figure 6. Pareto front comparison at key generations.
Sustainability 18 00668 g006
Figure 7. Comparison of performance metrics in ablation experiments for the improved NSGA-II algorithm.
Sustainability 18 00668 g007
Figure 8. Site selection map of solution 13.
Sustainability 18 00668 g008
Figure 9. Site selection map of solution 3.
Sustainability 18 00668 g009
Figure 10. Site selection map of solution 2.
Sustainability 18 00668 g010
Figure 11. Charging station site selection results using the standard NSGA-II algorithm with improved TOPSIS ranking.
Sustainability 18 00668 g011
Figure 12. Comparison of ranking stability between improved TOPSIS and AHP under weight variations.
Sustainability 18 00668 g012
Figure 13. Sensitivity analysis of model parameters.
Sustainability 18 00668 g013
Figure 14. Multi-Scale algorithm performance comparison.
Sustainability 18 00668 g014
Table 1. Demand and coordinate data of demand points.
NumberingX/kmY/kmVehicle Demand/VehiclesNumberingX/kmY/kmVehicle Demand/Vehicles
118.9846.6343261.7521.321
238.4329.65192710.541.2711
35.8023.04362810.5435.1435
47.8632.2422938.024.5539
535.6646.0523032.2544.929
69.739.80123130.9216.8848
730.361.34253218.8033.1037
814.9830.37423336.0231.6047
93.2447.74153427.9419.3827
1022.8938.69443535.2437.5226
1125.6829.4433612.3313.2927
1242.2833.6593726.0921.5242
134.1246.55143822.0910.6832
1439.8015.6223931.5516.0932
1533.8422.1374034.387.6939
1630.2840.99354120.7037.2726
1744.6513.42404246.2629.7522
1837.2621.41424343.2630.976
1928.252.50184422.9111.4920
2038.2146.10364543.8426.898
2129.7045.258
2228.3826.0040
2341.5436.8747
2440.7818.1245
257.7639.501
Table 2. Coordinate locations of candidate sites.
NumberingX/kmY/kmNumberingX/kmY/km
118.1044.531134.4235.19
214.0632.09128.1148.89
31.0217.921313.8147.88
415.638.901420.732.59
526.6424.271517.5631.45
634.2413.931633.6726.48
712.729.081722.4927.54
811.5027.791829.454.88
920.384.111918.7412.62
1013.1912.852039.5523.57
Table 3. Numerical values of the pareto solution set.
SolutionCandidate Site NumberNumber of Charging PilesObjective Function IObjective Function II
12, 6, 8, 9, 10, 11, 1220, 20, 6, 4, 4, 20, 8, 7, 2010,007,068.44081.9092
21, 2, 3, 5, 6, 7, 10, 11, 12,
15, 16, 17, 18, 19, 20
12, 11, 5, 17, 16, 4, 4, 18,
4, 10, 4, 4, 13, 7, 9
12,285,334.74291.9124
34, 7, 9, 10, 147, 4, 4, 4, 41,723,119.13350.1961
44, 10, 14, 16, 194, 4, 4, 7, 203,395,770.34270.9224
53, 7, 8, 9, 135, 5, 16, 10, 183,388,560.63920.5831
61, 3, 6, 7, 8, 9, 11, 12, 1317, 5, 20, 5, 16, 10, 20,
4, 4
8,947,242.02811.8140
73, 6, 7, 8, 9, 10, 11, 12, 145, 20, 4, 16, 7, 4, 20, 8,
4
7,685,543.91781.7492
819, 11, 8, 10, 7, 12, 15, 1,
3, 2, 18, 5, 20, 9, 14
7, 18, 4, 4, 4, 4, 10, 12, 5,
11, 13, 20, 20, 4, 4
11,816,704.01621.9117
93, 6, 7, 9, 10, 125, 20, 4, 10, 4, 184,239,305.65071.0781
103, 4, 6, 7, 9, 11, 14, 1911, 5, 20, 4, 20, 8, 4, 16,
7, 20
6,099,409.15051.4262
112, 3, 6, 10, 11, 12, 14, 15,
19, 20
11, 5, 20, 4, 20, 8, 4, 16,
7, 20
10,172,891.62101.9098
123, 4, 7, 9, 105, 7, 4, 4, 41,773,587.05800.2644
136, 8, 11, 12, 320, 16, 20, 8, 96,546,410.76681.6342
143, 7, 10, 14, 16, 185, 4, 4, 7, 20, 134,470,016.16231.1344
151, 3, 6, 7, 9, 12, 1320, 5, 20, 5, 10, 4, 46,027,312.11571.3709
163, 4, 6, 7, 8, 10, 11, 145, 7, 20, 4, 16, 4, 20, 47,130,396.74931.6423
174, 7, 13, 3, 87, 5, 8, 5, 163,150,640.42410.5501
186, 8, 10, 11, 1220, 20, 12, 20, 87,418,784.88881.7160
194, 7, 10, 13, 167, 4, 4, 8, 203,640,900.26130.9961
202, 6, 10, 11, 12, 14, 19, 2020, 20, 4, 20, 8, 4, 7, 209,588,905.63851.8409
211, 3, 6, 7, 1020, 5, 20, 4, 115,450,535.83661.3143
223, 4, 7, 10, 135, 7, 4, 4, 82,018,716.97650.3385
233, 4, 7, 8, 95, 7, 5, 16, 42,905,510.50550.4761
241, 4, 9, 16, 1920, 5, 4, 20, 75,118,889.47621.2962
253, 6, 9, 12, 13, 155, 20, 15, 4, 6, 206,315,700.25521.5171
263, 6, 7, 8, 9, 195, 20, 5, 16, 4, 74,888,178.96461.1831
Table 4. Ranking results based on evaluation scores.
Solution IDScoreRankSolution IDScoreRank
130.7003110.613514
250.67982110.608315
180.6794390.606116
160.67654190.594817
70.6743540.576718
100.6615680.562519
240.6557720.551220
210.6498850.479021
150.64659170.478022
60.635810230.468223
260.623011220.464524
140.619212120.458025
200.61741330.448826
Table 5. Comparison of algorithm search performance.
Name of the AlgorithmHypervolumeInverted Generational DistanceDiversityRuntime/s
Enhanced NSGA-II12,583,018.26310.02082,419,870.875337.15
Standard NSGA-II12,054,043.11980.01972,138,643.184328.39
MOEA/D7,090,696.76830.300877,514.40617.82
SPEA11,539,899.29540.04711,590,371.189051.58
Table 6. Comparison of algorithm ranking results.
Algorithm TypeRankImproved TOPSIS Score Total Operator Cost (10k CNY)User Satisfaction Candidate Site IDNumber of Charging Piles
Enhanced NSGA-II10.70036,546,410.76681.63426, 8, 11, 12, 320, 16, 20, 8, 9
Standard NSGA-II10.69286,820,379.49931.64262, 5, 7, 8, 9, 10,
18
5, 20, 16, 4, 4, 20,
7
Table 7. Comparison of ranking method results.
RankImproved TOPSIS (Solution ID)ScoreAHP (Solution ID)Score
1130.7003120.6802
2250.6798210.6737
3180.6794220.6719
4160.6765190.6712
570.6743130.6710
Table 8. Sensitivity analysis experimental design matrix.
Experiment IDVariable ParameterParameter ValueMagnitude of Variation
1 q j 80,000 CNY−20%
2 q j 10,000 CNYReference Point
3 q j 120,000 CNY+20%
4 d m a x 12 km−20%
5 d m a x 15 kmReference Point
6 d m a x 18 km+20%
Table 9. Performance comparison of algorithms under different problem scales.
ScaleAlgorithmIGDHVDiversityRuntime (s)
SmallEnhanced NSGA-II0.020812,583,018.26312,419,870.875337.15
Standard NSGA-II0.019712,054,043.11982,138,643.184328.39
MOEA/D0.30087,090,696.768377,514.40617.82
SPEA0.047111,539,899.29541,590,371.18951.58
MediumEnhanced NSGA-II0.032223,148,217.68243,553,996.5213110.25
Standard NSGA-II0.036921,724,169.57603,459,863.004589.06
MOEA/D0.519311,359,800.503531,224.745242.46
SPEA0.091221,241,015.60122,611,663.1785131.74
LargeEnhanced NSGA-II0.070726,506,806.24928,371,341.9284331.64
Standard NSGA-II0.236123,816,901.86255,222,255.7161278.49
MOEA/D0.44389,263,960.05420.0202.13
SPEA0.295722,521,157.63953,409,405.3339319.55
Disclaimer/Publisher’s Note: The statements, opinions and data contained in all publications are solely those of the individual author(s) and contributor(s) and not of MDPI and/or the editor(s). MDPI and/or the editor(s) disclaim responsibility for any injury to people or property resulting from any ideas, methods, instructions or products referred to in the content.