An Improved NSGA-II–TOPSIS Integrated Framework for Multi-Objective Optimization of Electric Vehicle Charging Station Siting


Abstract
1. Introduction
2. Modeling Framework and Optimization Methods
2.1. Modeling of Charging Station Siting Problem
2.1.1. Problem Assumptions
- (1)
- Each charging pile can only serve one electric vehicle at a time; simultaneous charging of multiple vehicles by a single pile is not considered.
- (2)
- All charging piles are of the same specification, meaning that their construction costs as well as the proportions of operation and maintenance costs are identical.
- (3)
- All users are restricted to selecting the nearest charging station for service. (The distance between demand points and candidate stations is measured using the Euclidean distance.)
- (4)
- The energy consumption of users during travel is solely related to the distance traveled, independent of other external factors.
2.1.2. Establishment of Multi-Objective Functions
Objective Function I
Objective Function II
2.1.3. Related Constraints
2.2. Improved NSGA-II Algorithm and TOPSIS-Based Decision-Making Method
2.2.1. Improved NSGA-II Algorithm
Enhanced Chaotic Initialization Mapping
Introduction of an Intelligent Opposition-Based Learning Strategy [20]
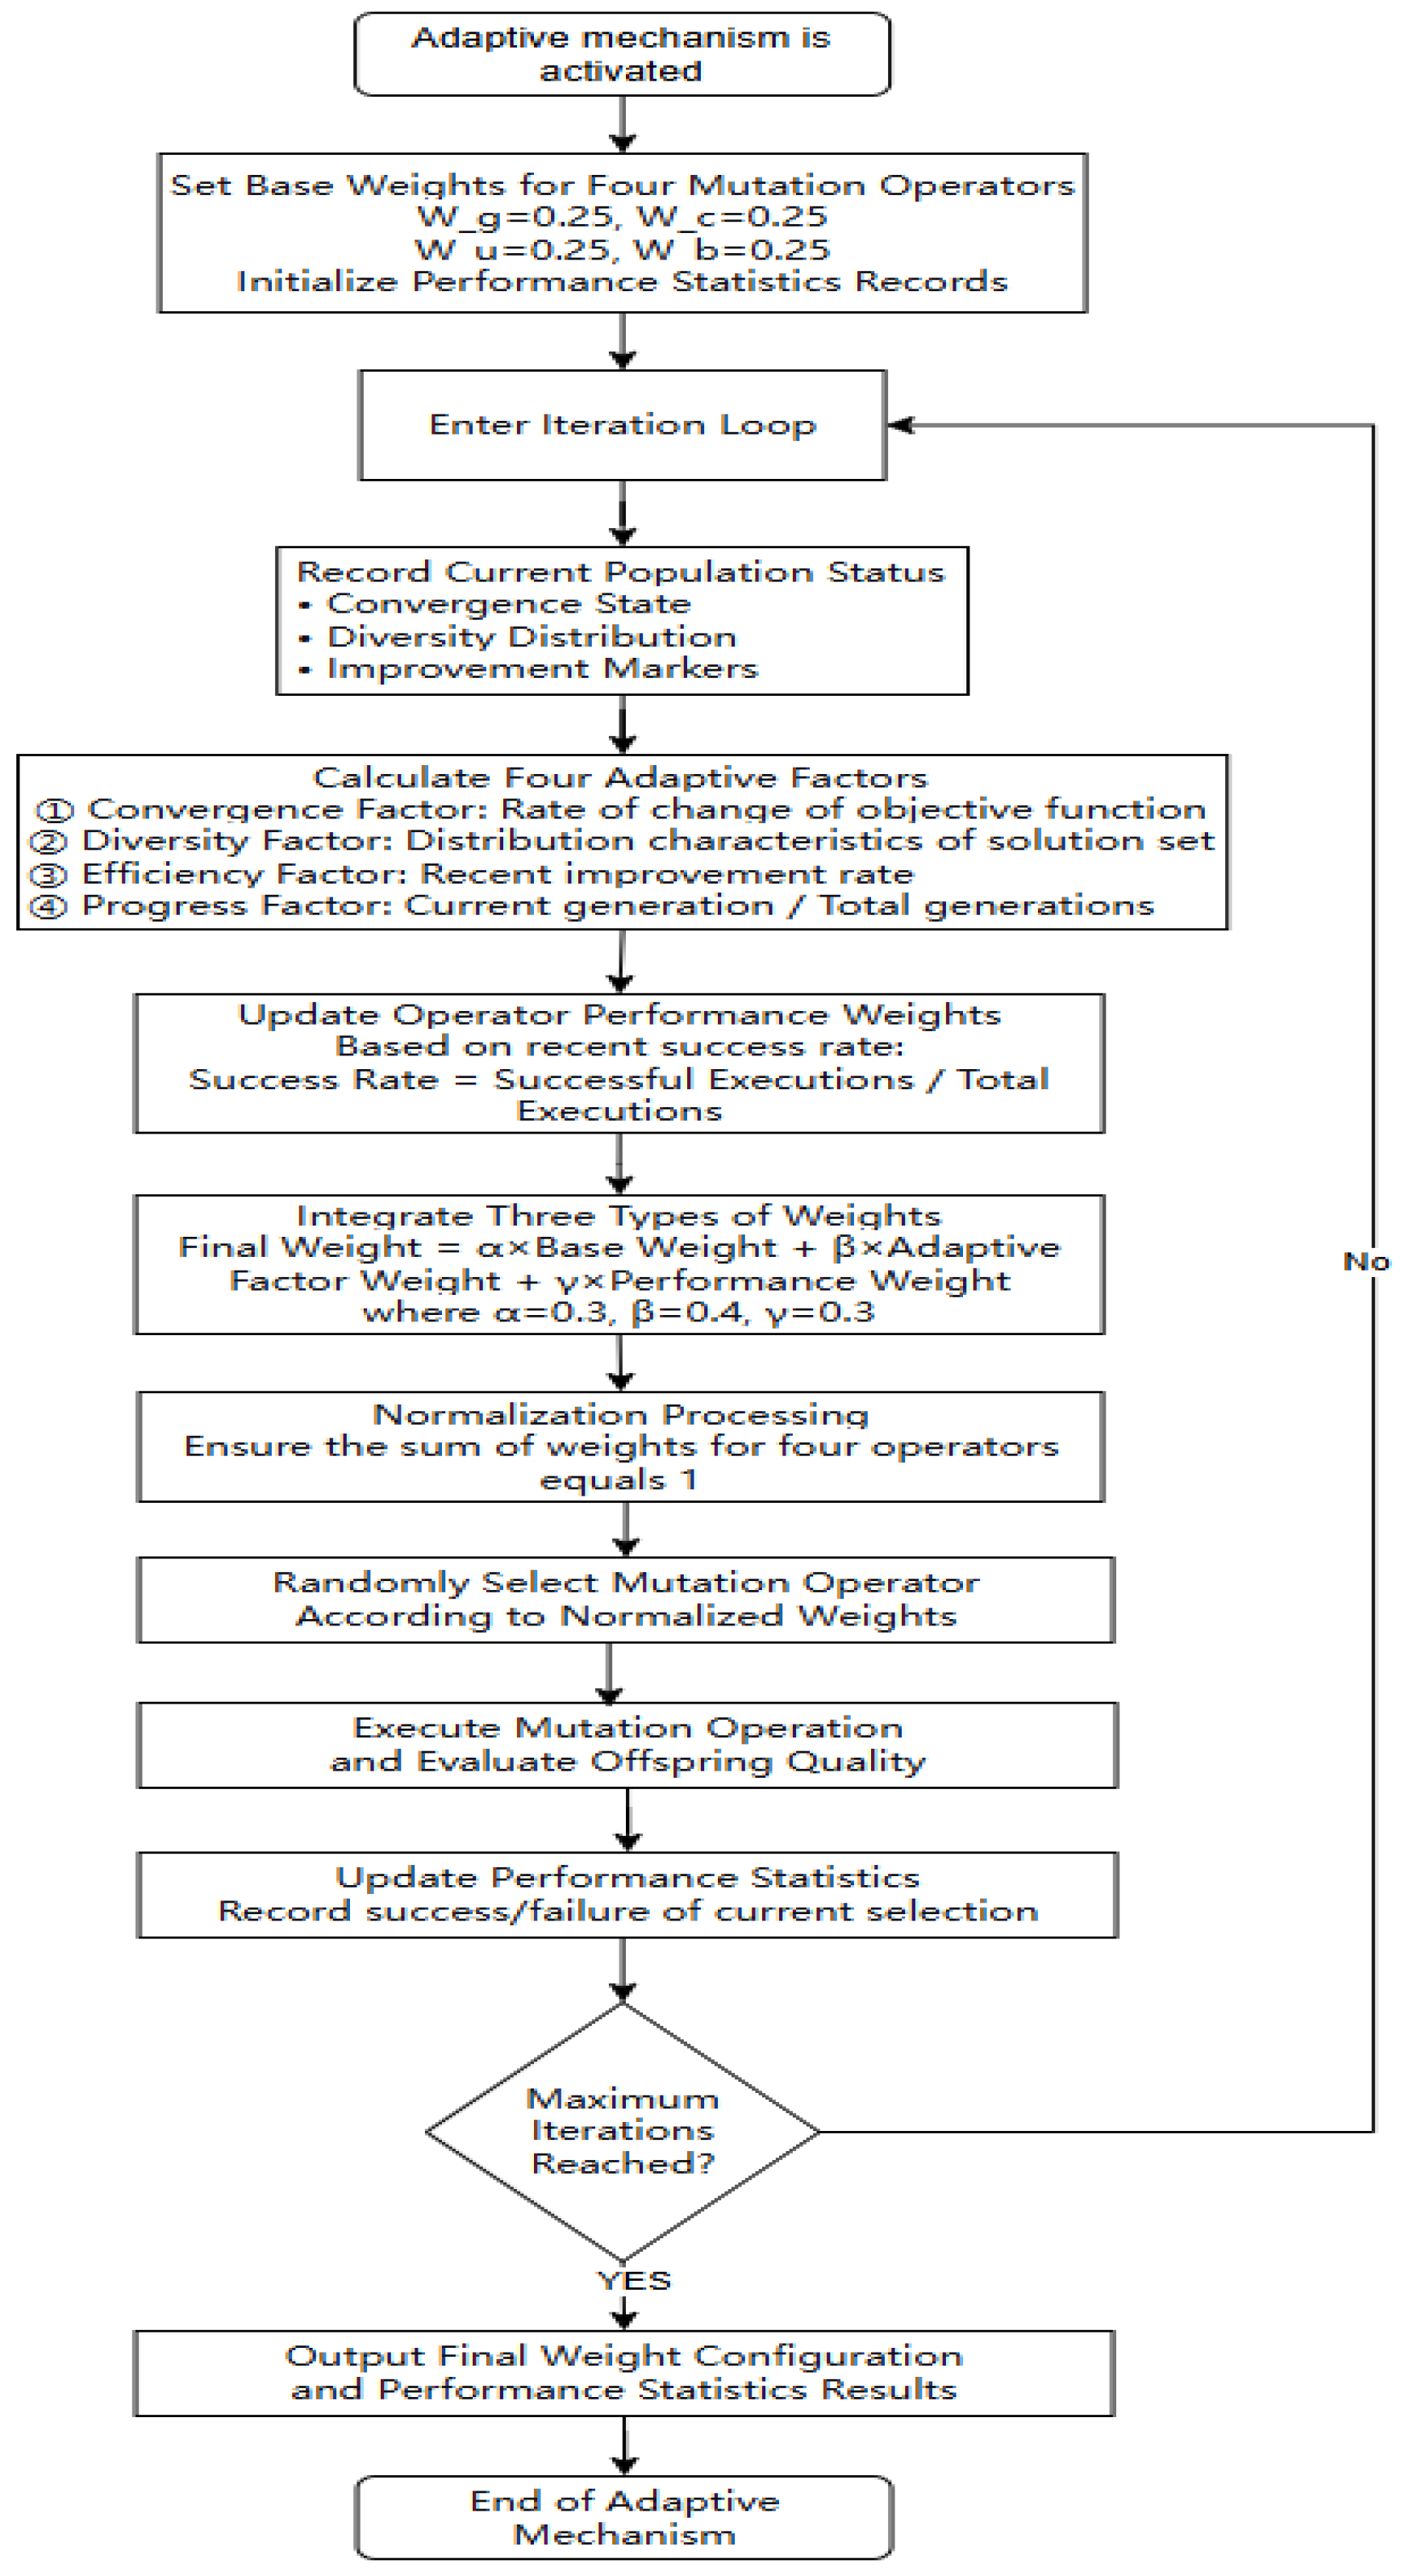
Adaptive Hybrid Mutation Operator
- Convergence Factor (): Monitors the rate of change the best objective value over recent generations. A high indicates slow convergence, prompting increased exploration via uniform and chaotic mutations.
- Diversity Factor (): Quantifies the distribution of solutions in the objective space using Euclidean dispersion. Low diversity triggers higher weights for exploratory operators (uniform and chaotic) to enhance population spread.
- Efficiency Factor (): Tracks the recent improvement rate of Pareto solutions. A low suggests stagnation, leading to increased use of disruptive operators (Gaussian and boundary mutations) to escape local optima.
- Progress Factor (): Represents the ratio of the current generation to the total generations () As increases, the algorithm shifts from exploration to exploitation, favoring Gaussian and boundary mutations for local refinement.
2.2.2. Improved Entropy-Weighted TOPSIS Decision-Making Model
Differential Ratio Normalization
Entropy-Based Adaptive Determination of Indicator Weights
Perturbation-Corrected Relative Closeness Calculation
3. Case Study and Results Analysis
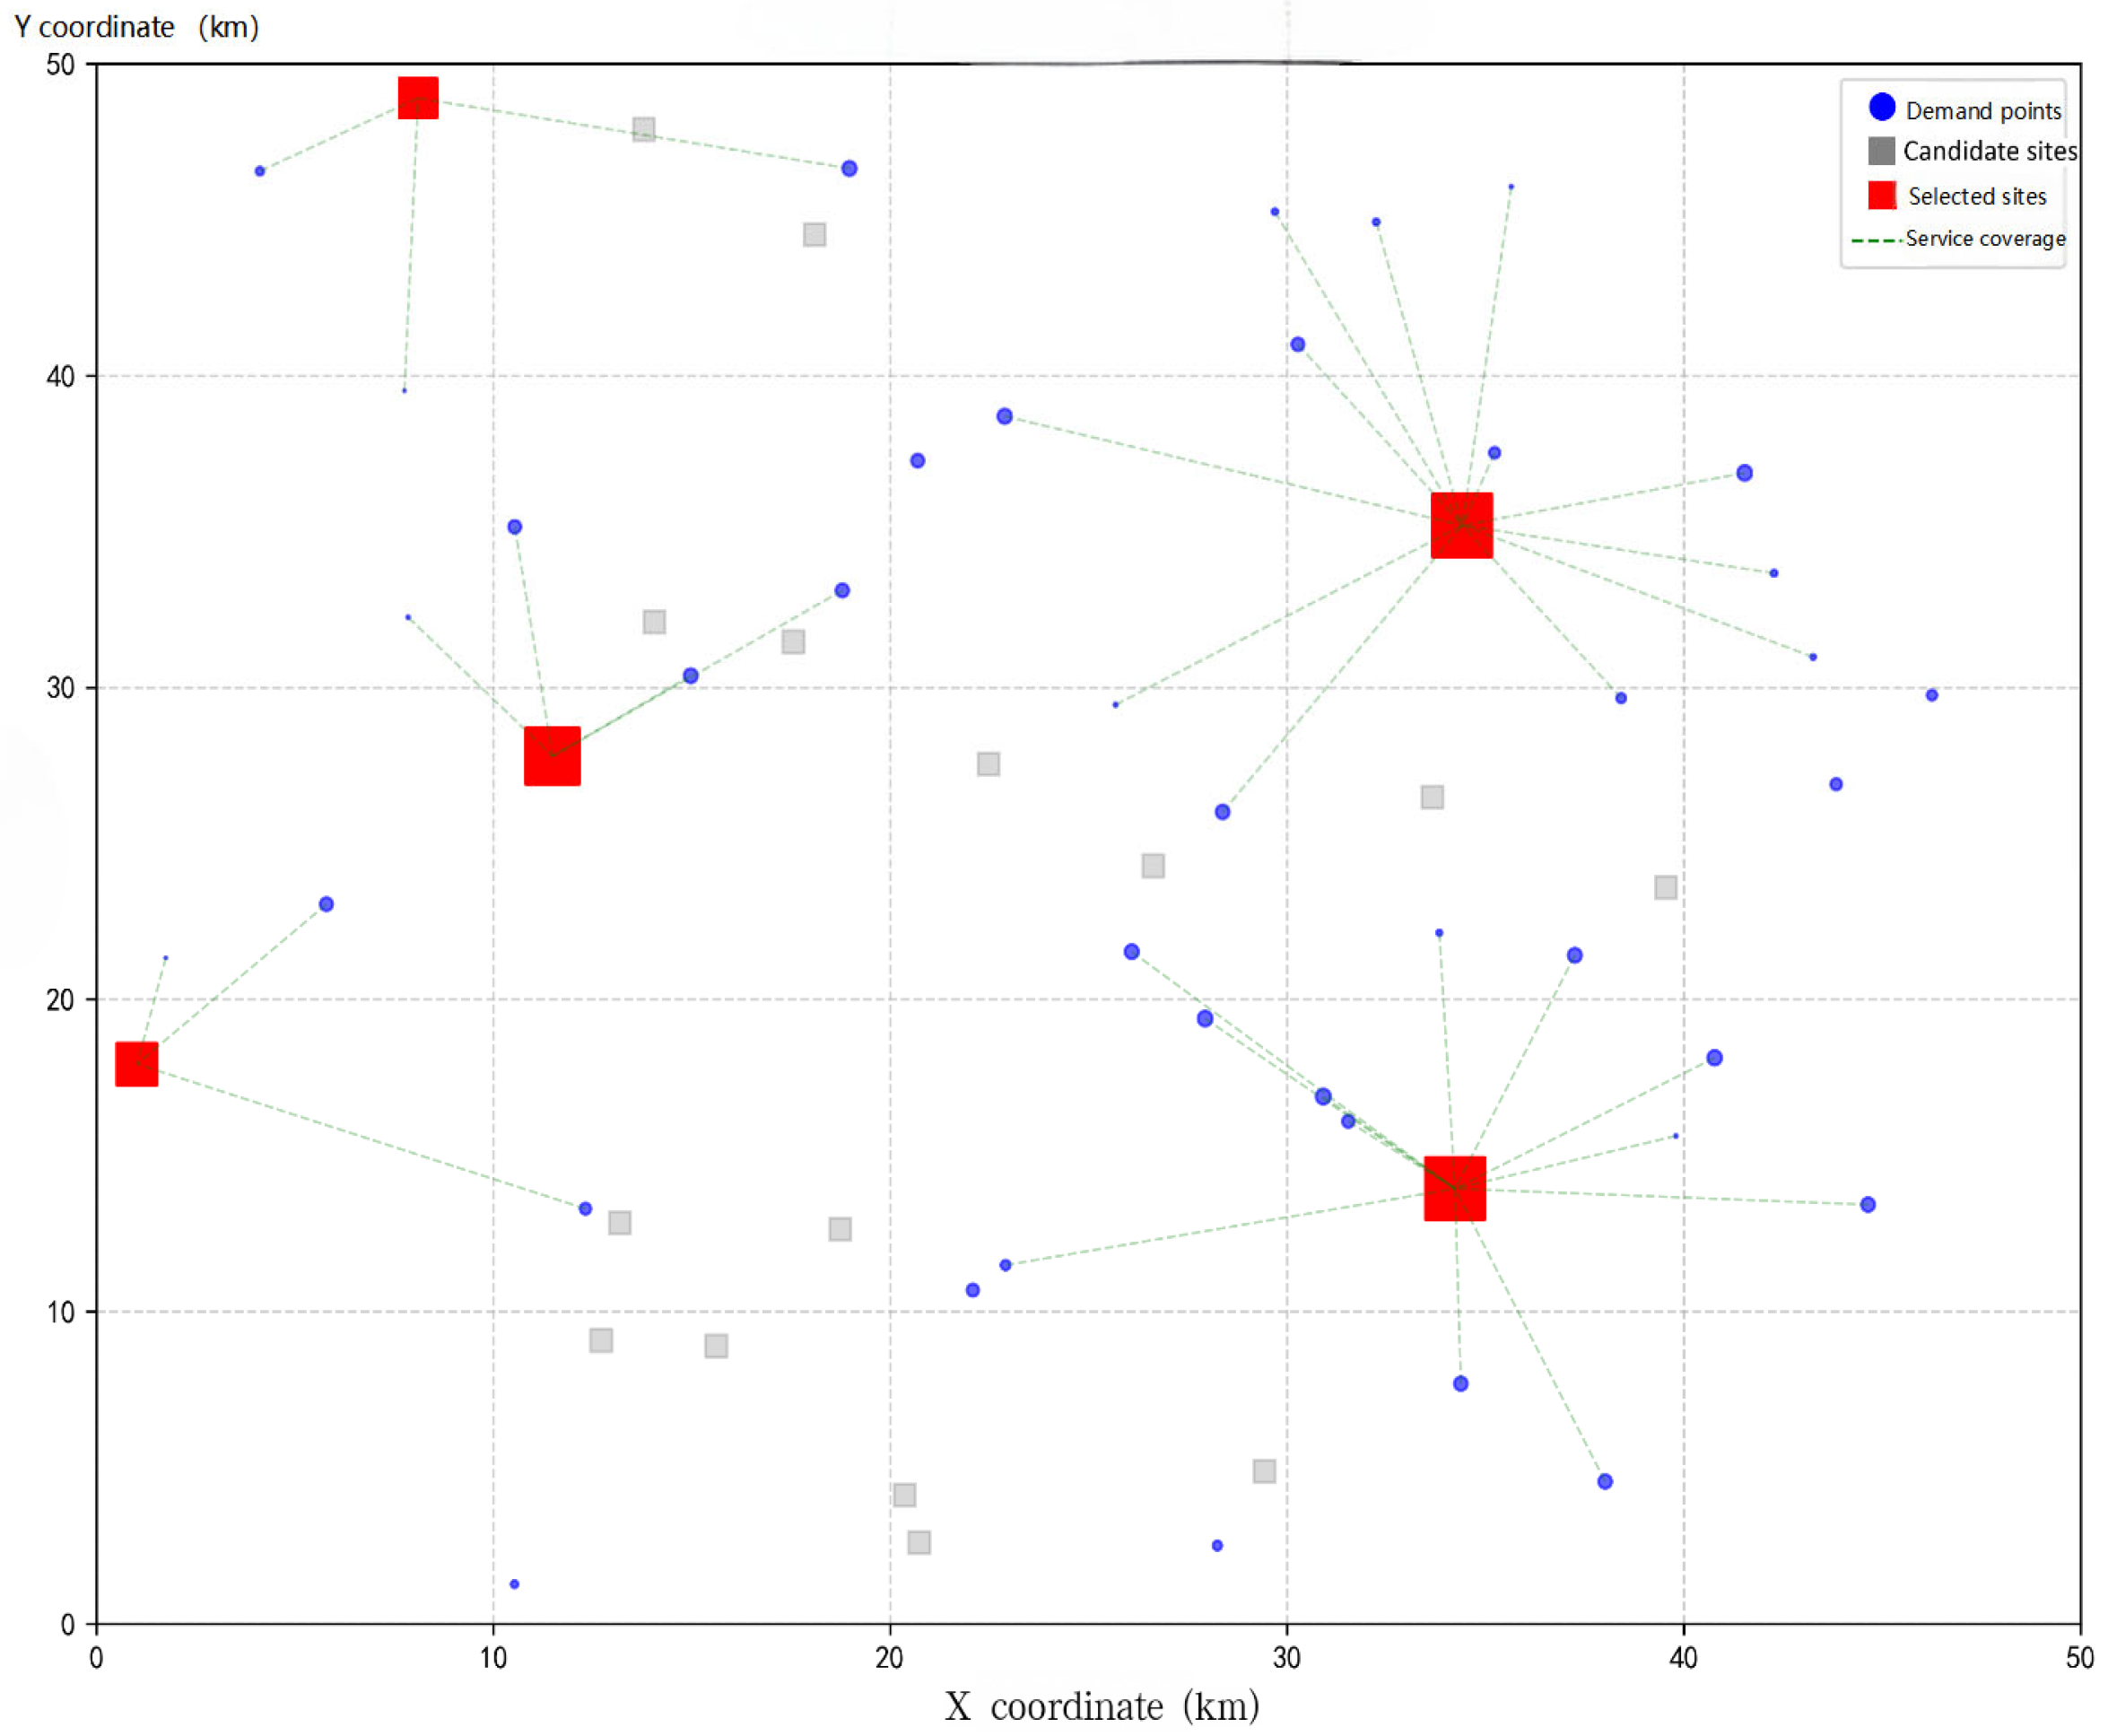
3.1. Test Case
3.2. Solution Results
3.2.1. Limitations of the Charging Station Location Model Assumptions and Their Impacts
- Assumption of homogeneous equipment and charging power:
- 2.
- Assumption of nearest-station user choice:
- 3.
- Assumption of the M/M/C queuing model:
- 4.
- Assumption of static demand and transportation conditions:
- 5.
- Impact of Model Assumptions and Boundary Definition
- Homogeneous facilities and nearest-station choice behavior.
- Static demand and the M/M/C queuing model.
- Euclidean distance and static traffic conditions.
- 6.
- Parameter Robustness and Validation of Conclusions
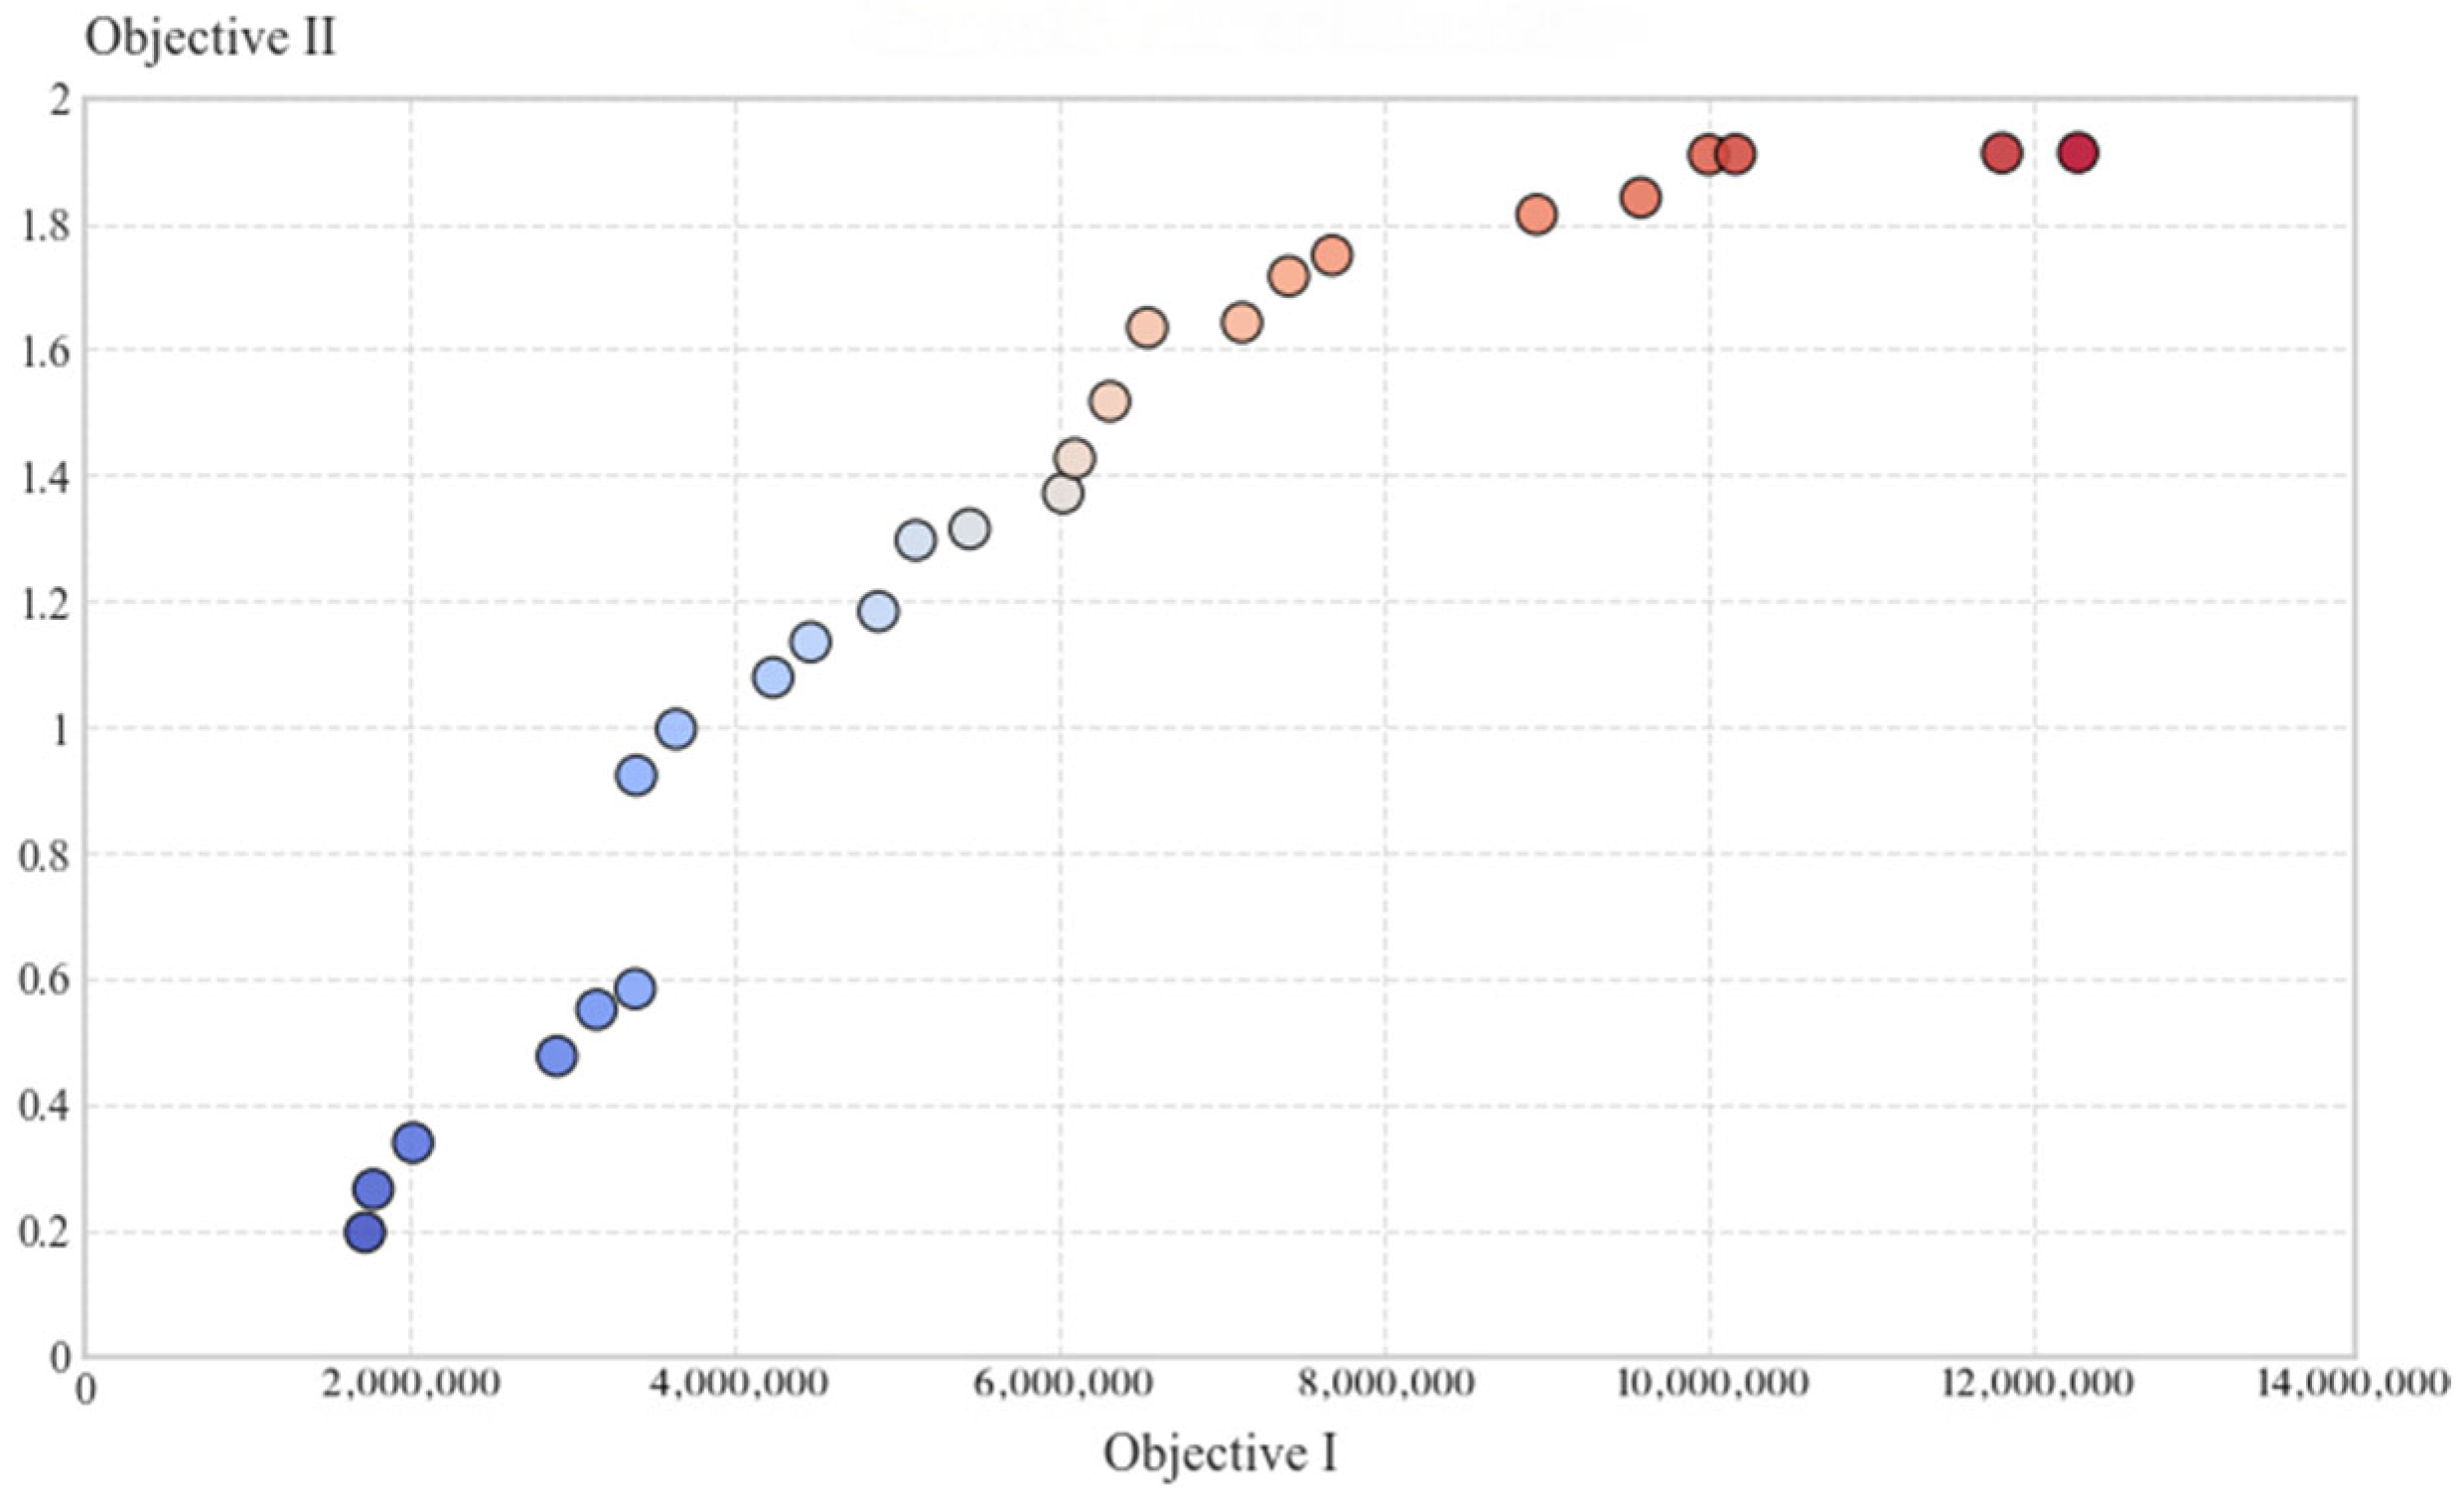
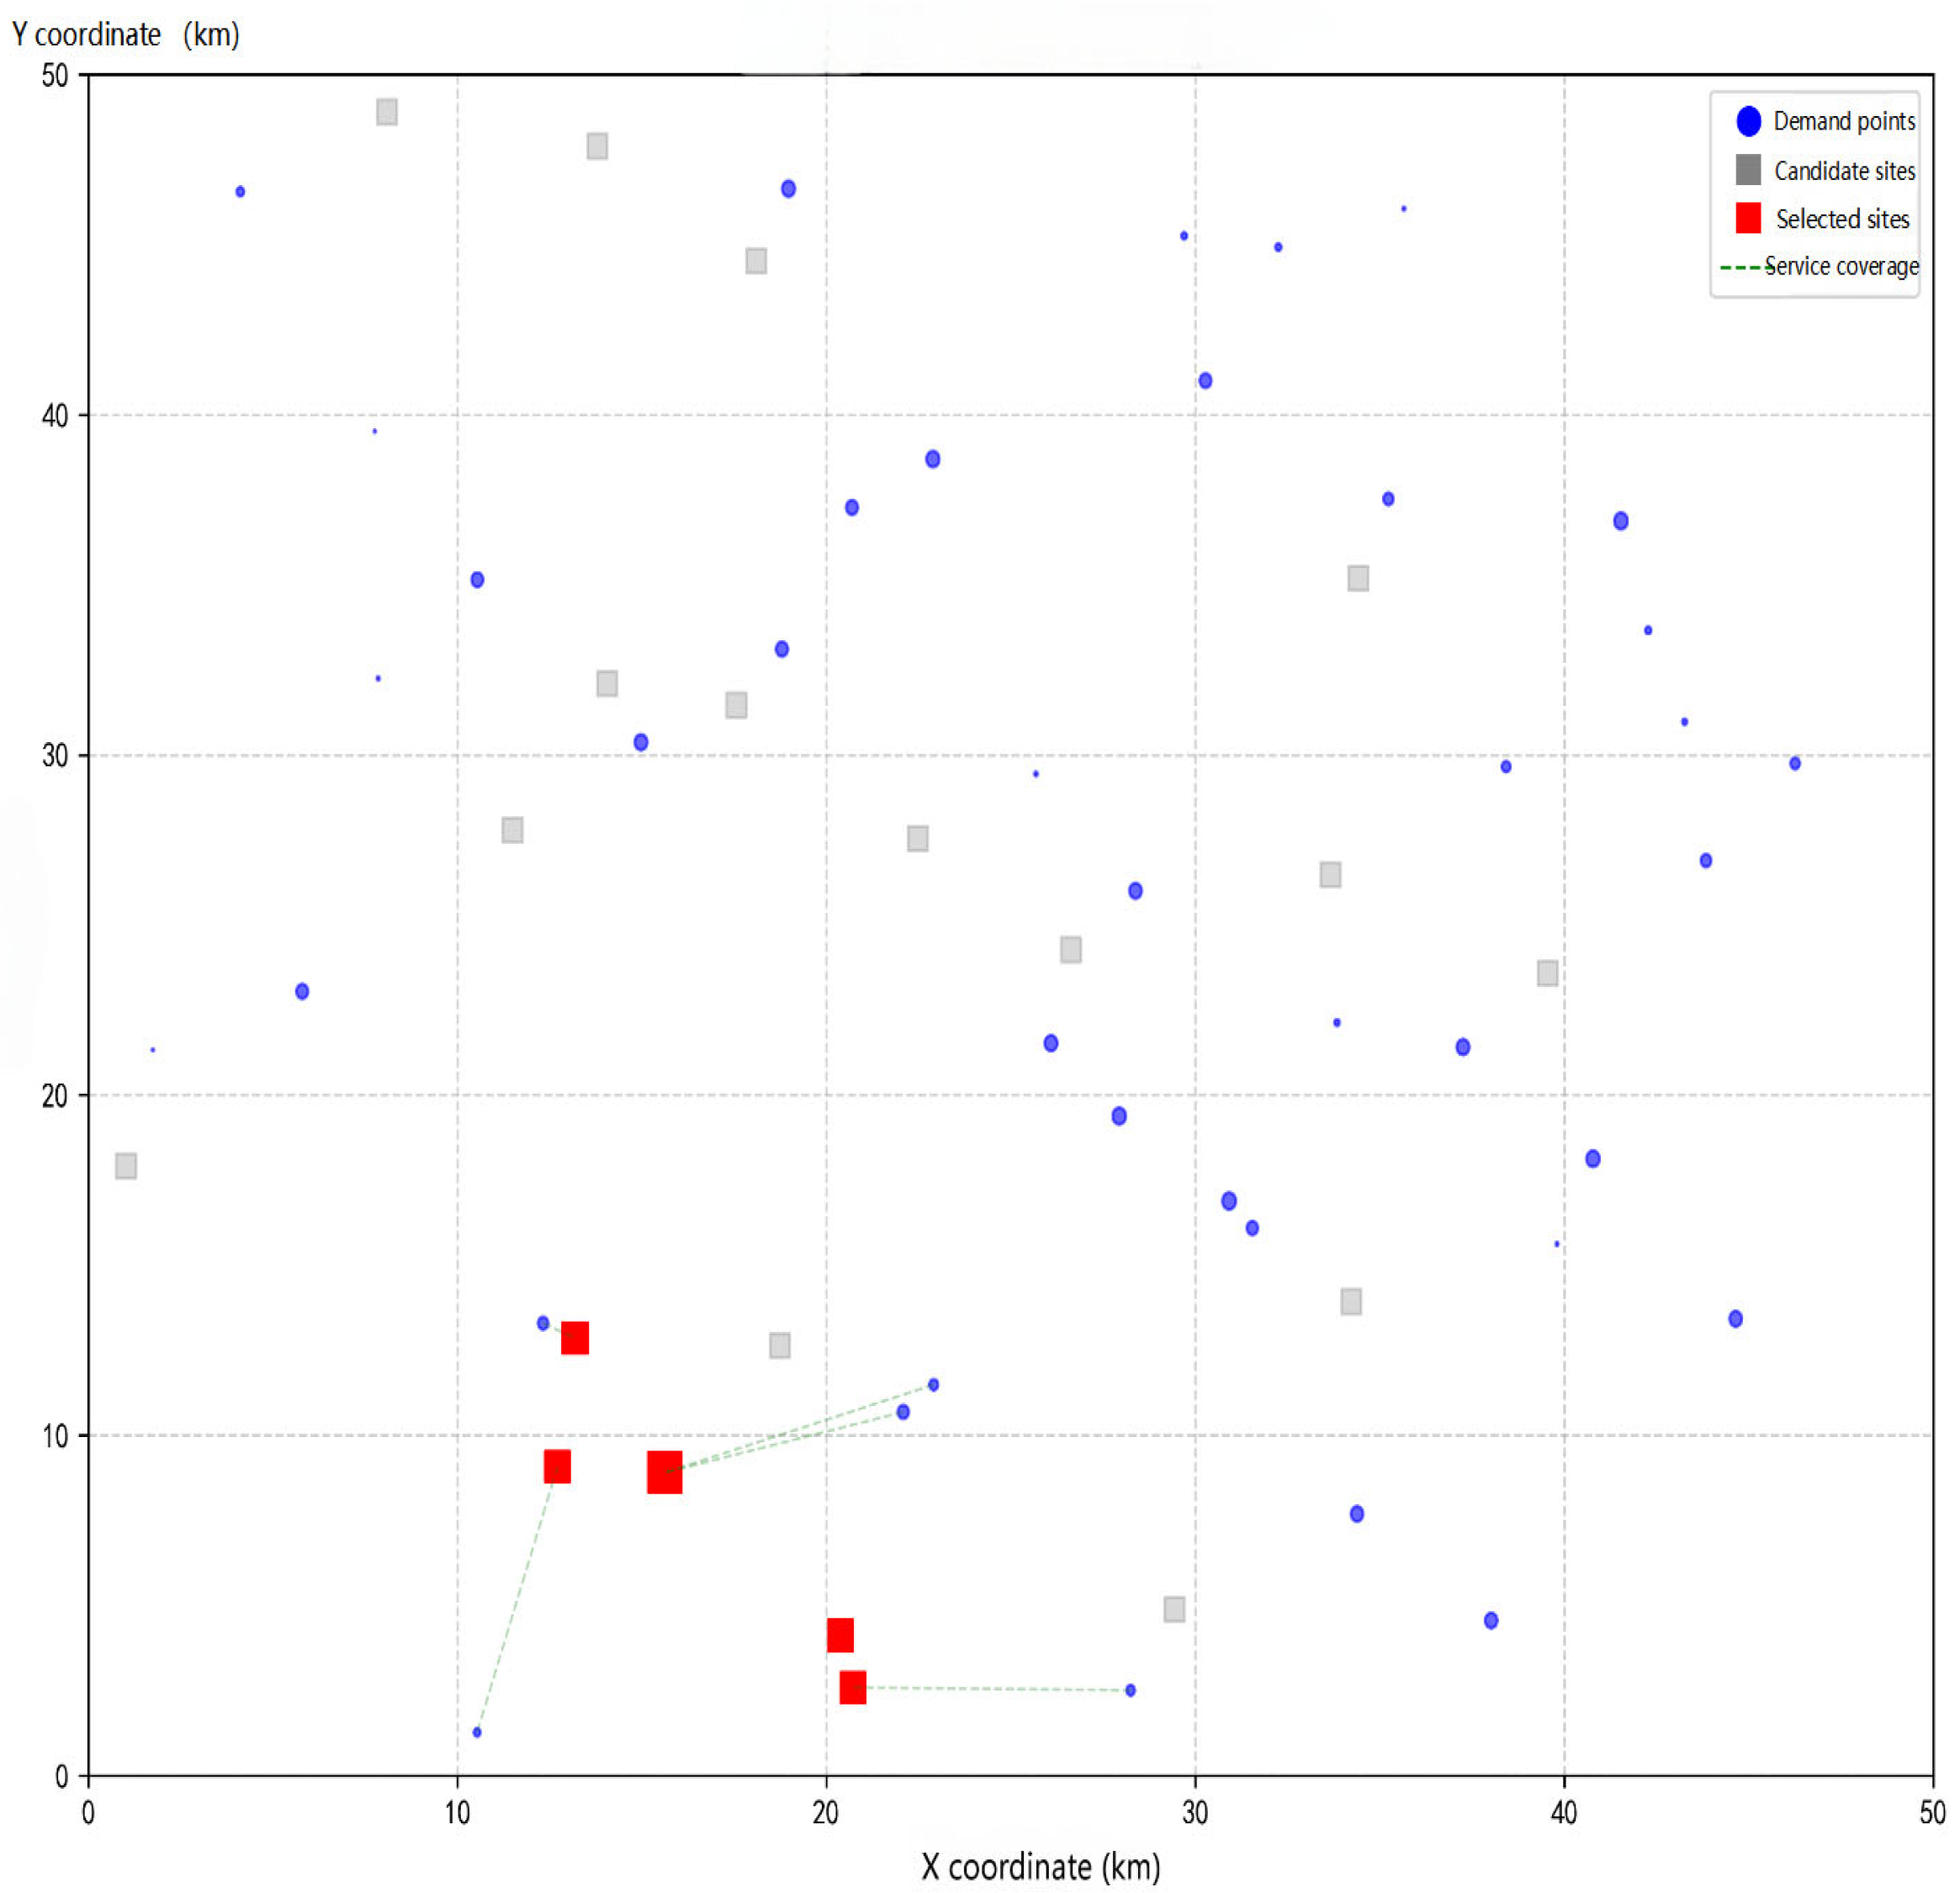
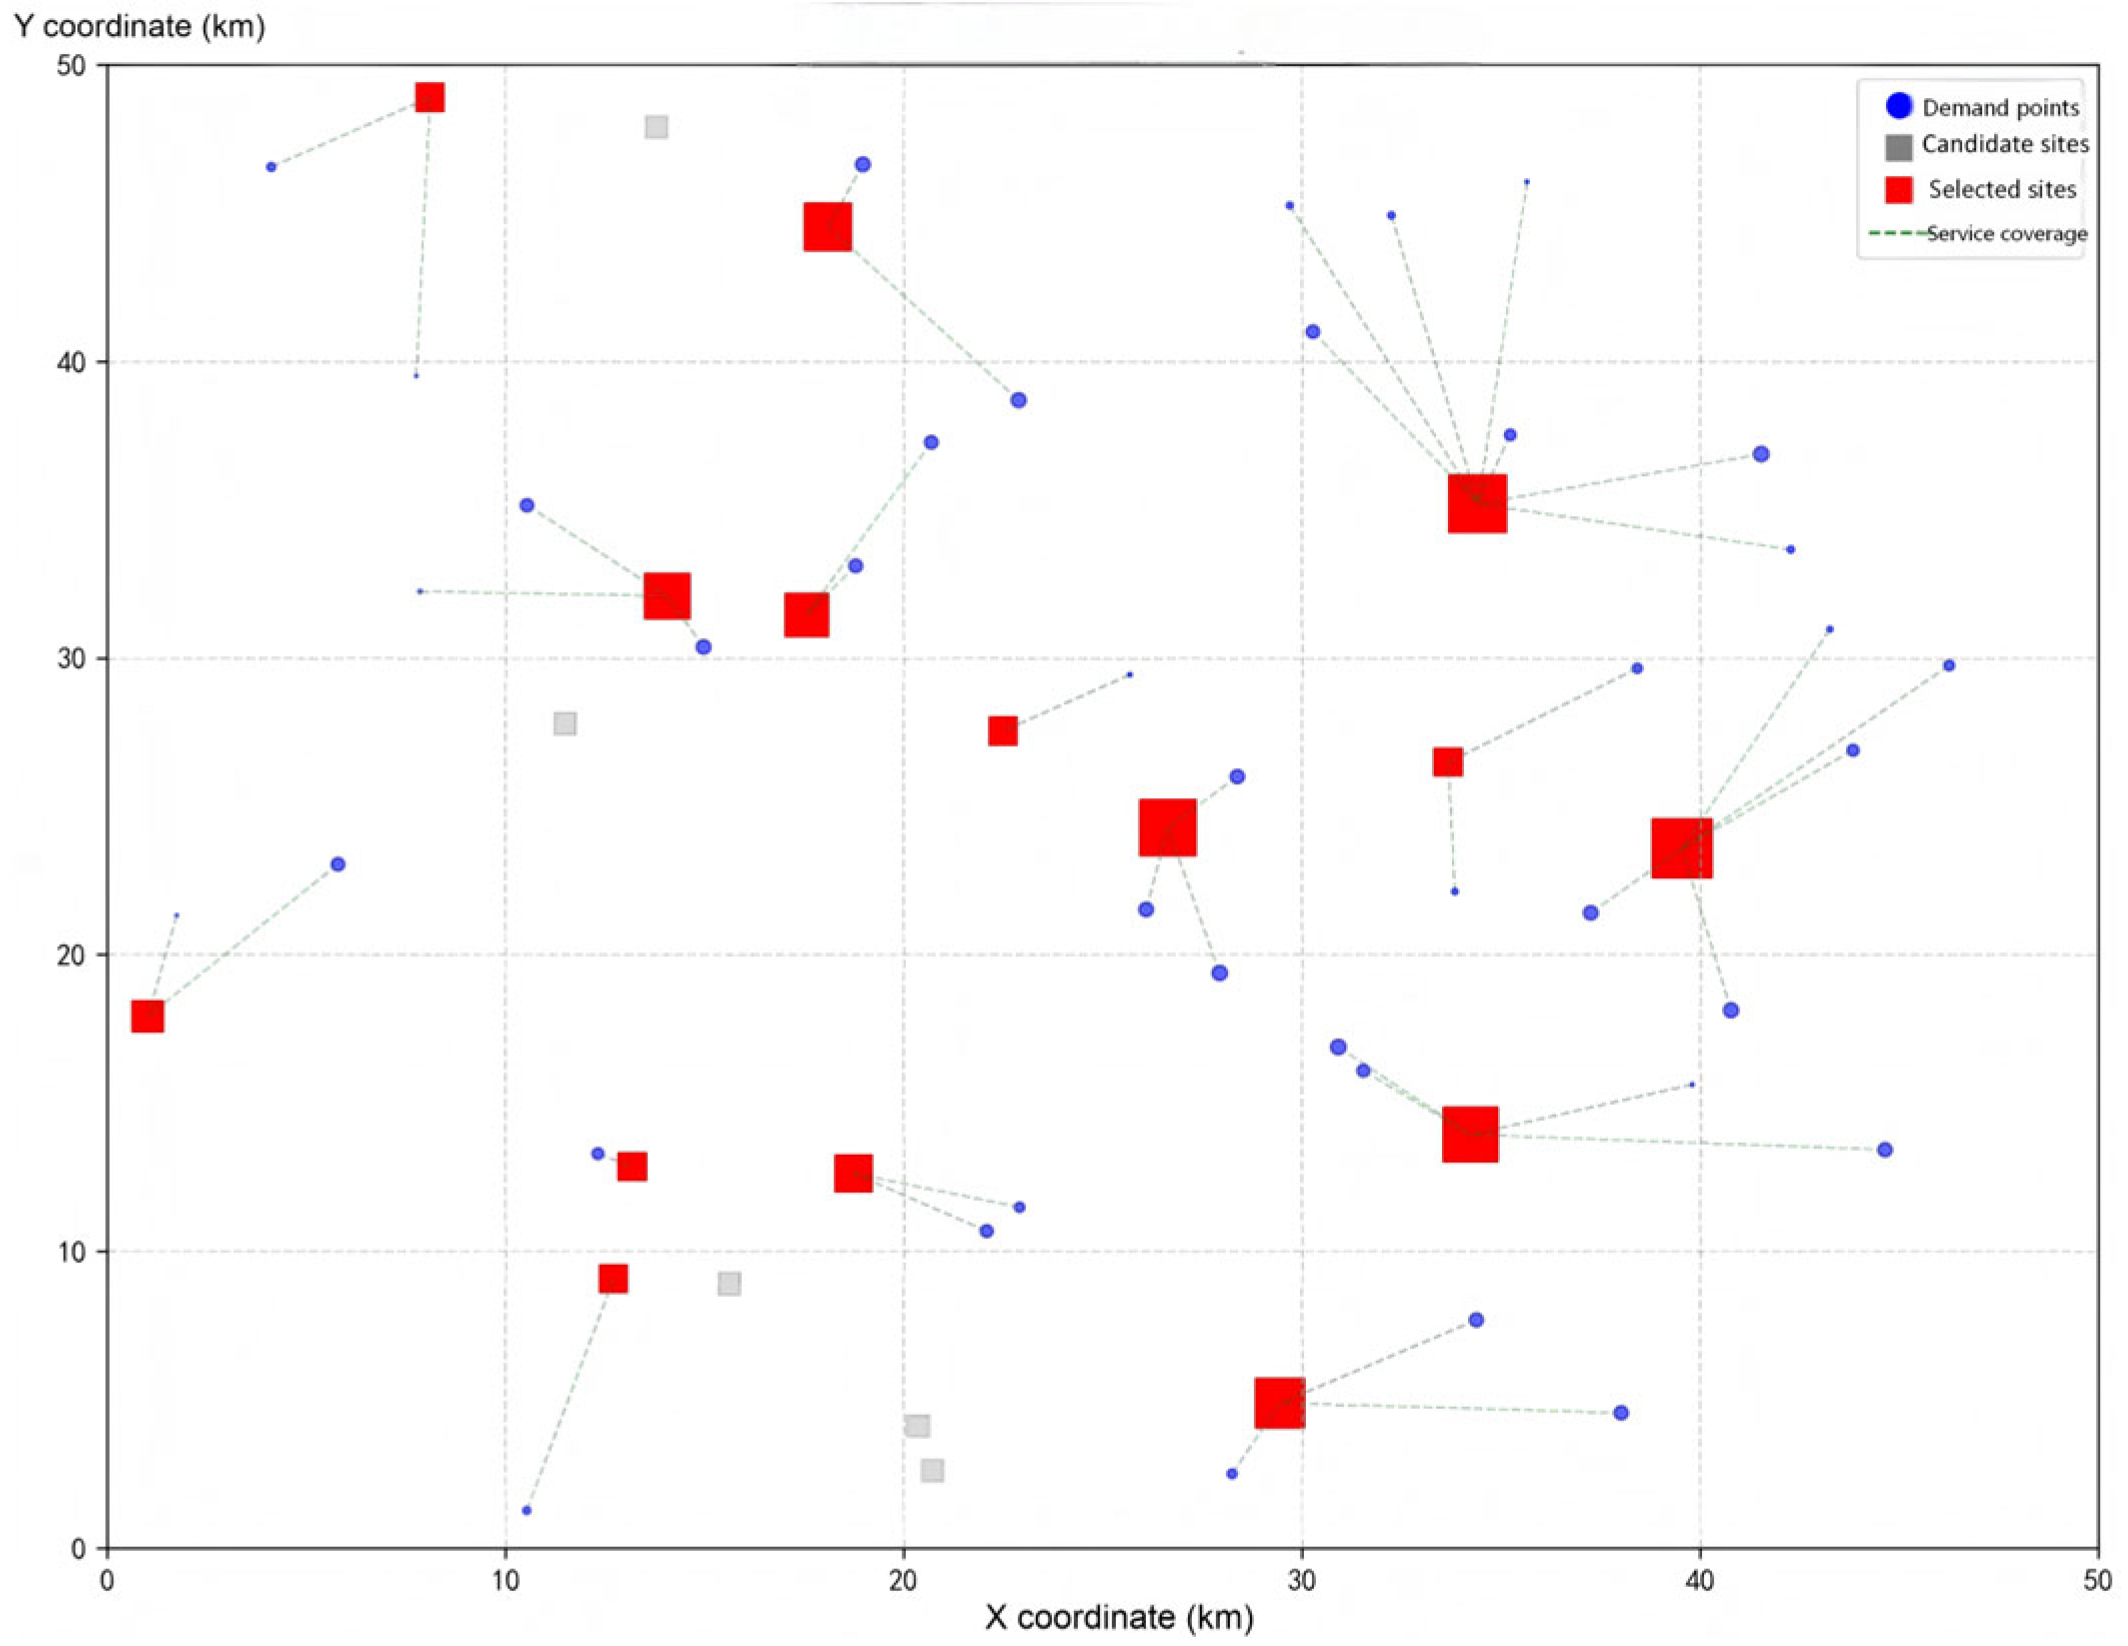
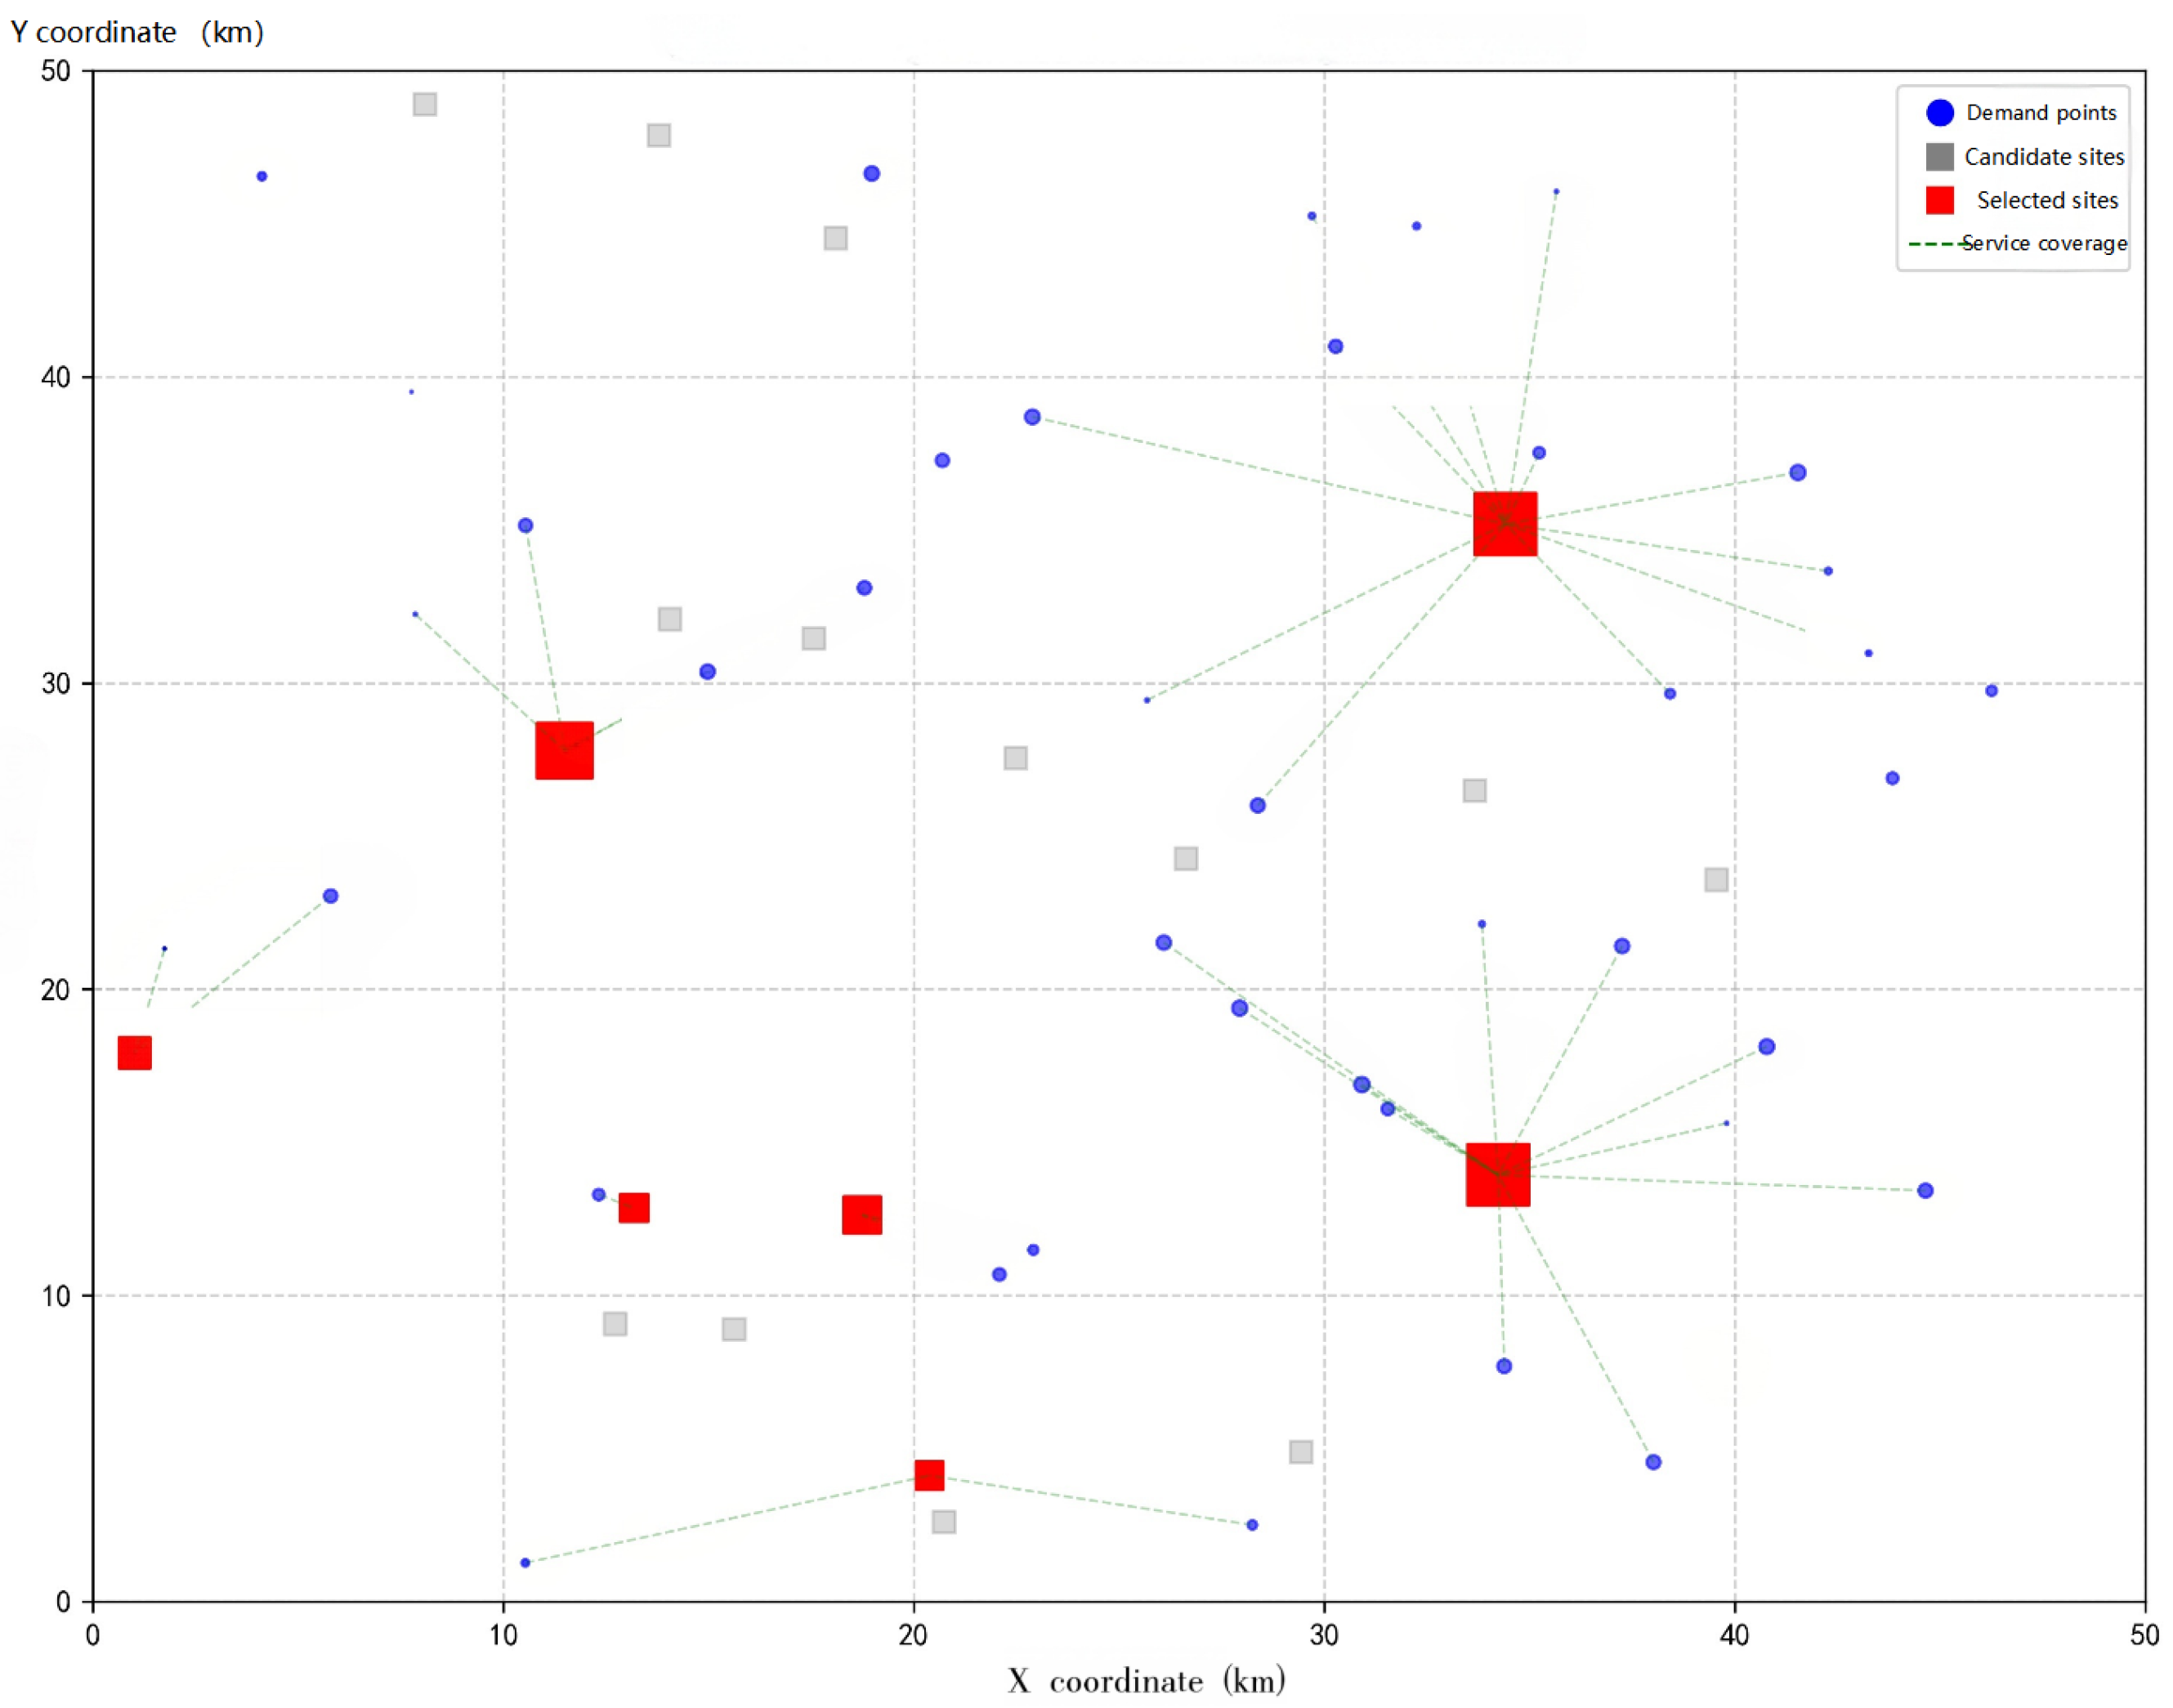
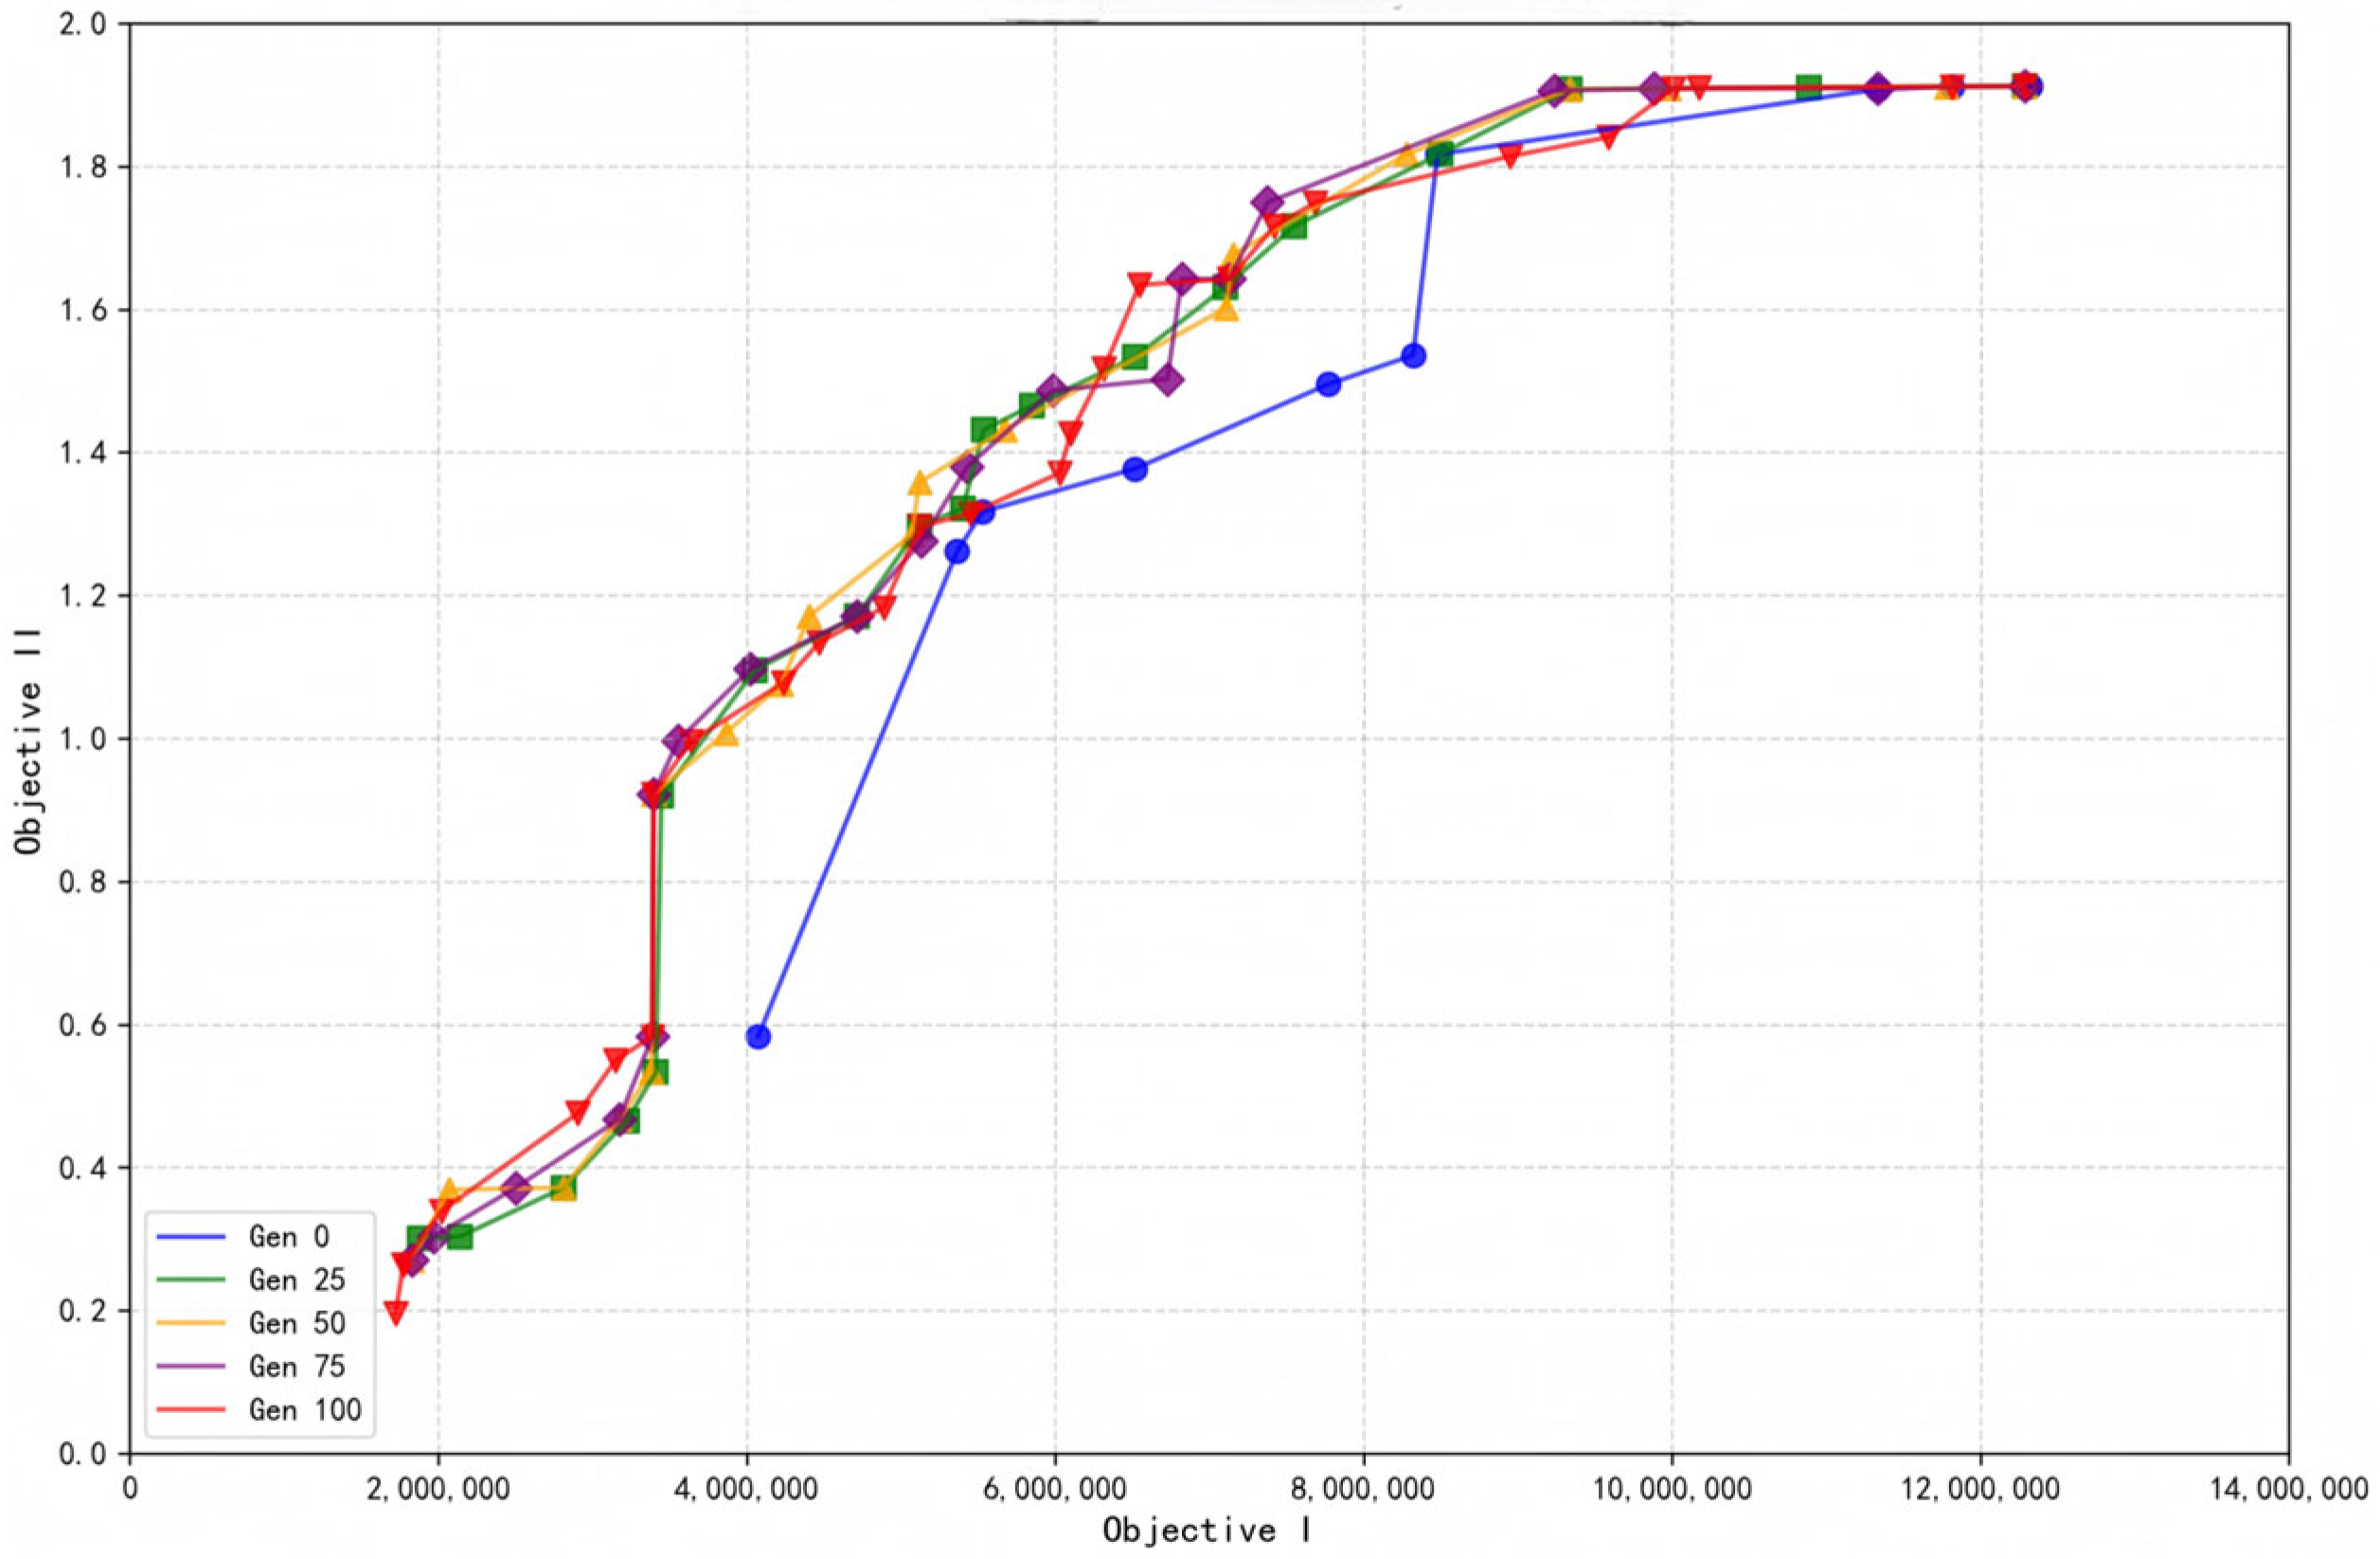
3.2.2. Presentation and Description of the Pareto Solution Set
3.2.3. Managerial Insights and Strategic Implications
- 1.
- The Fundamental Trade-off is Spatial: The extremes of the Pareto frontier are defined by two opposing spatial strategies: cost-minimizing clustering (exemplified by Solution 3, sacrificing coverage) versus satisfaction-maximizing dispersion (exemplified by Solution 2, incurring high cost). All viable planning options exist on this spectrum.
- 2.
- Optimal Layout Outperforms Simple Expansion: The significant performance gap between Solutions 3 and 13 (identical station count) demonstrates that superior geographic distribution and site-specific capacity allocation are more critical than merely increasing the number of stations. Efficient placement of well-sized stations can achieve high utility with lower infrastructure density.
- 3.
- Actionable Decision Pathways:
- (1)
- For budget-constrained planning: Prioritize high-efficiency solutions from the central-left Pareto front (e.g., Solution 13), which balance adequate service coverage with manageable cost, avoiding the steep economic penalties of excessive dispersion.
- (2)
- For policy-driven, user-centric objectives: Solutions from the right front (e.g., near Solution 2) are relevant, with the model quantifying the incremental investment required for each unit of satisfaction gain.
- (3)
- Recognizing diminishing returns: The declining marginal satisfaction per additional station indicates an optimal network density. Beyond this point, investment should shift from new locations to enhancing existing ones.
- 4.
- Key Drivers and Contextual Adaptation: The sharpness of the cost satisfaction trade off is not constant but is driven by specific contextual conditions:
- (1)
- Demand Spatial Pattern: In areas with highly dispersed demand points, the cost of achieving full coverage via dispersion rises sharply, intensifying the trade-off.
- (2)
- User Behavior Profile: A population with low tolerance for waiting necessitates more chargers or stations to prevent satisfaction collapse, directly increasing costs.
- (3)
- Network and Land Constraints: Complex real-world road networks increase effective travel distance, while high urban land costs amplify the expense of a dispersed layout.
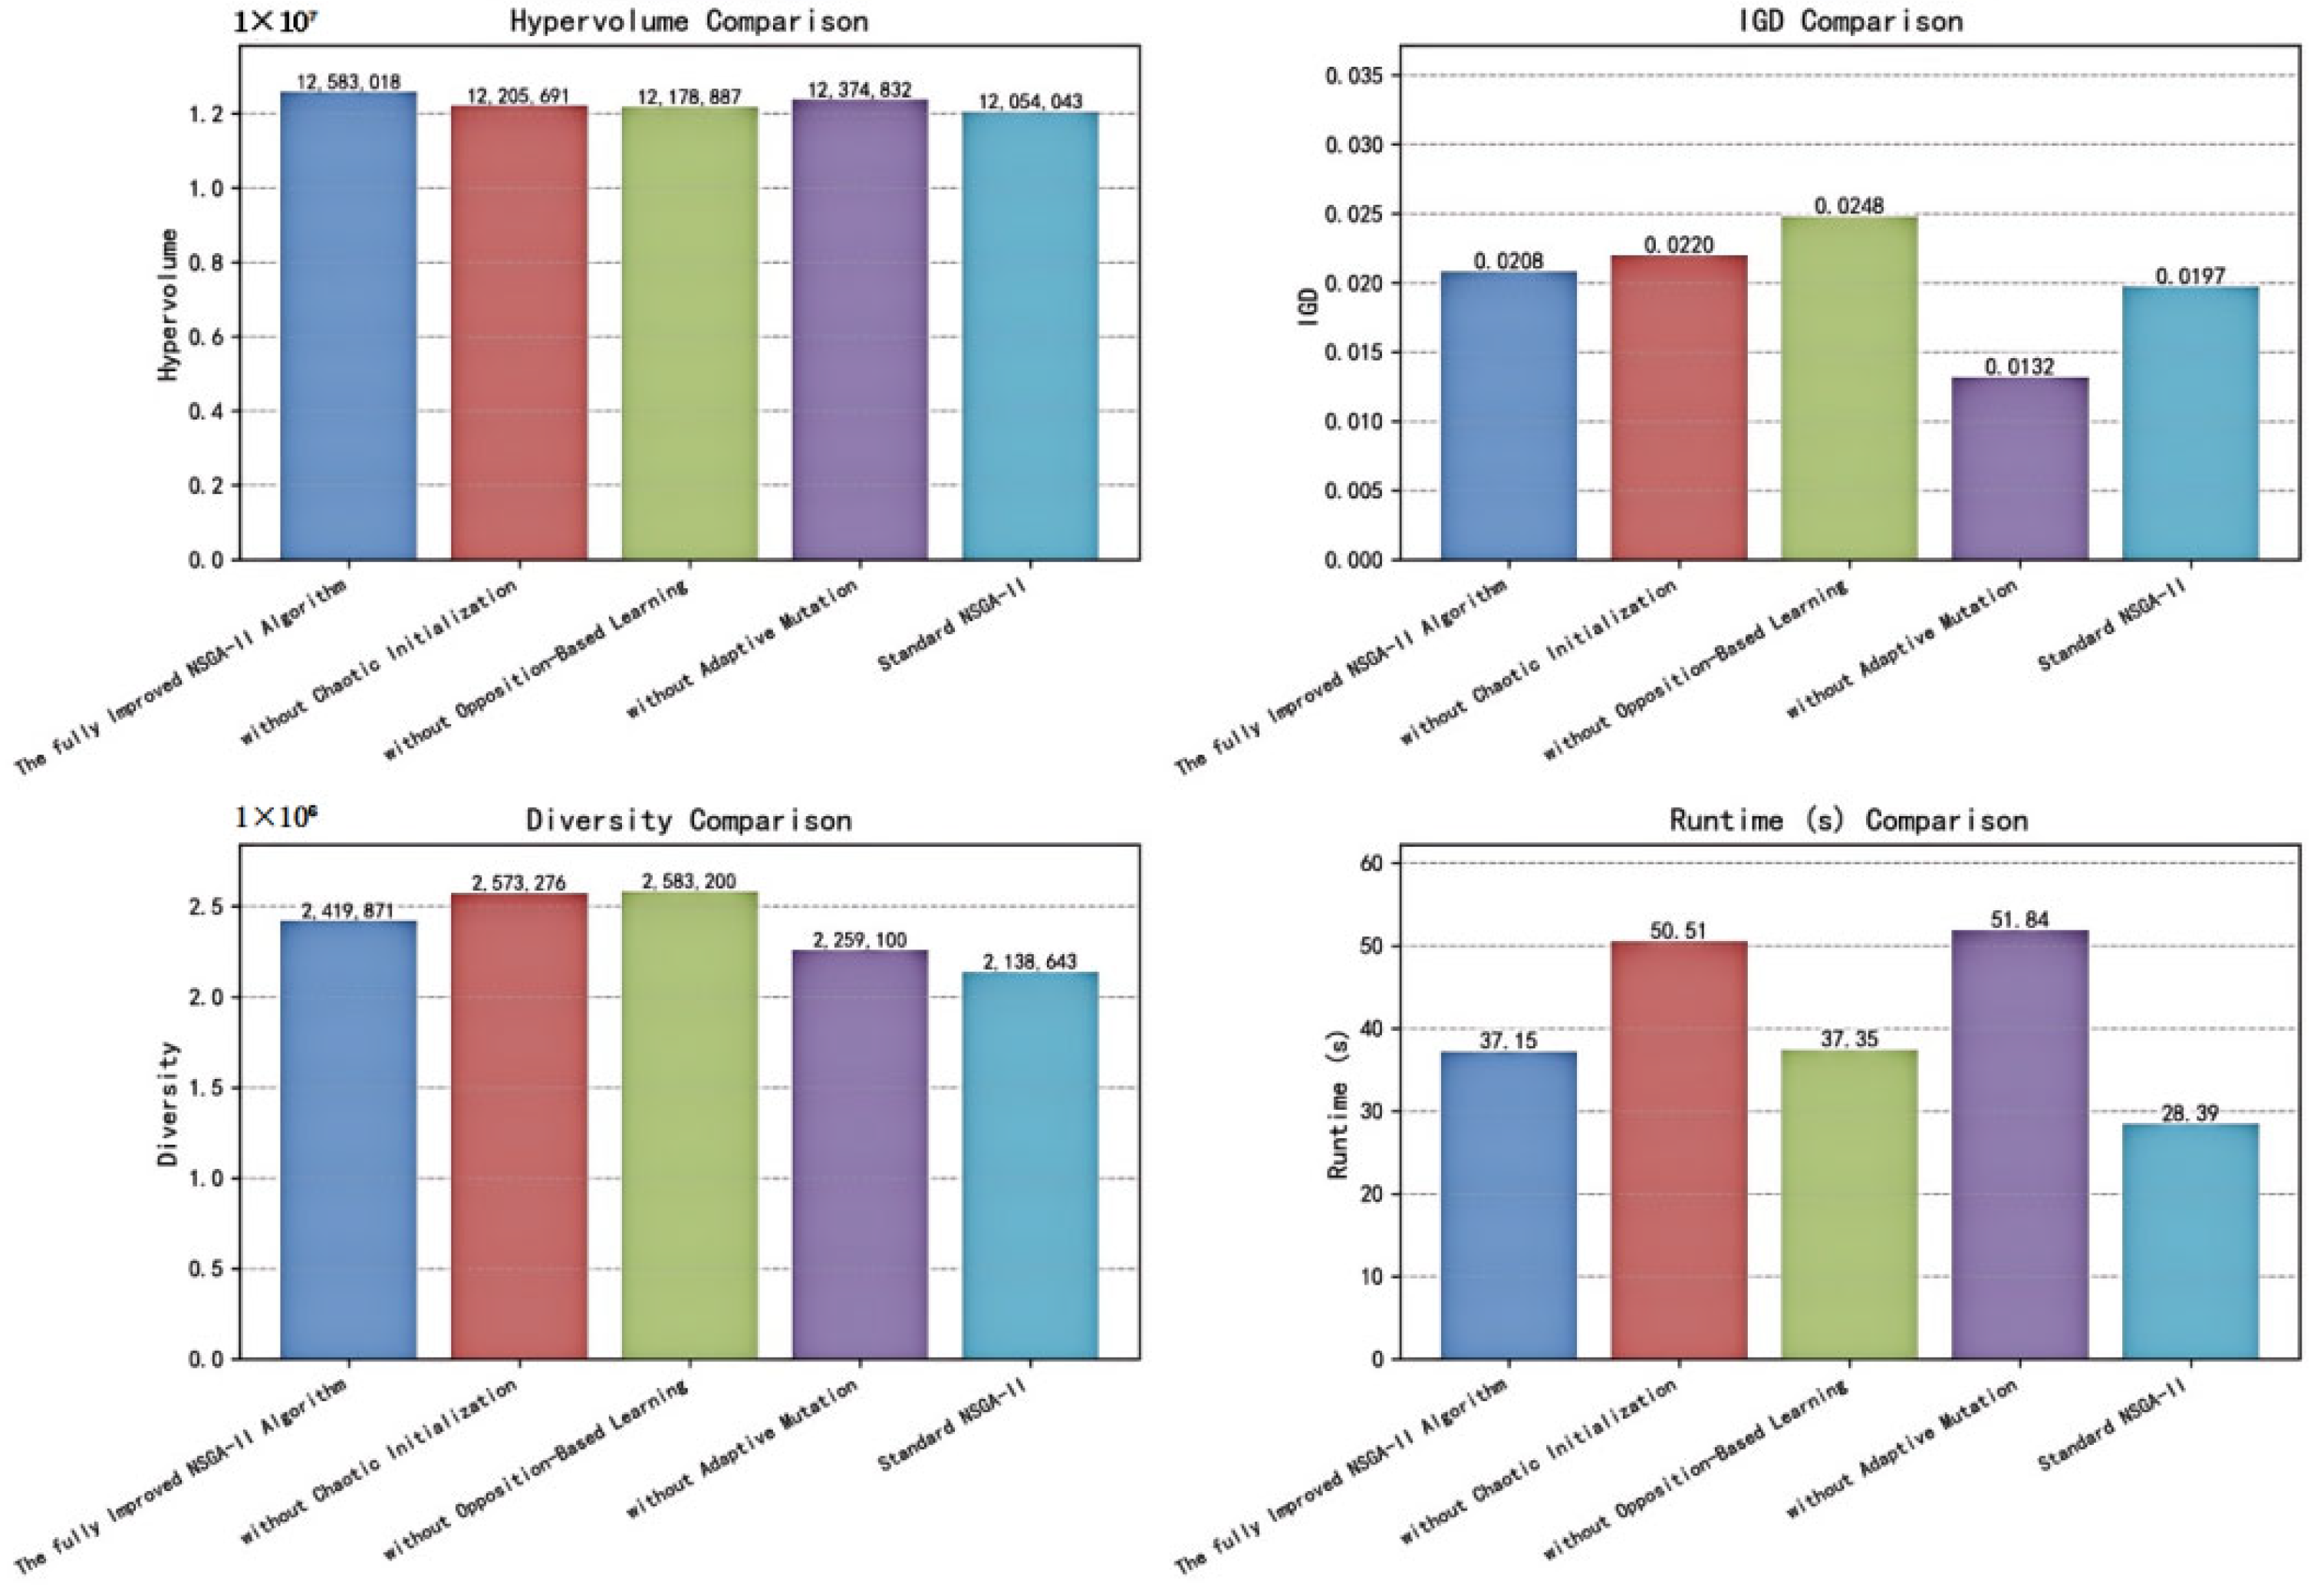
3.3. Effectiveness Verification of the Algorithmic Improvement Strategies: Ablation Study Analysis
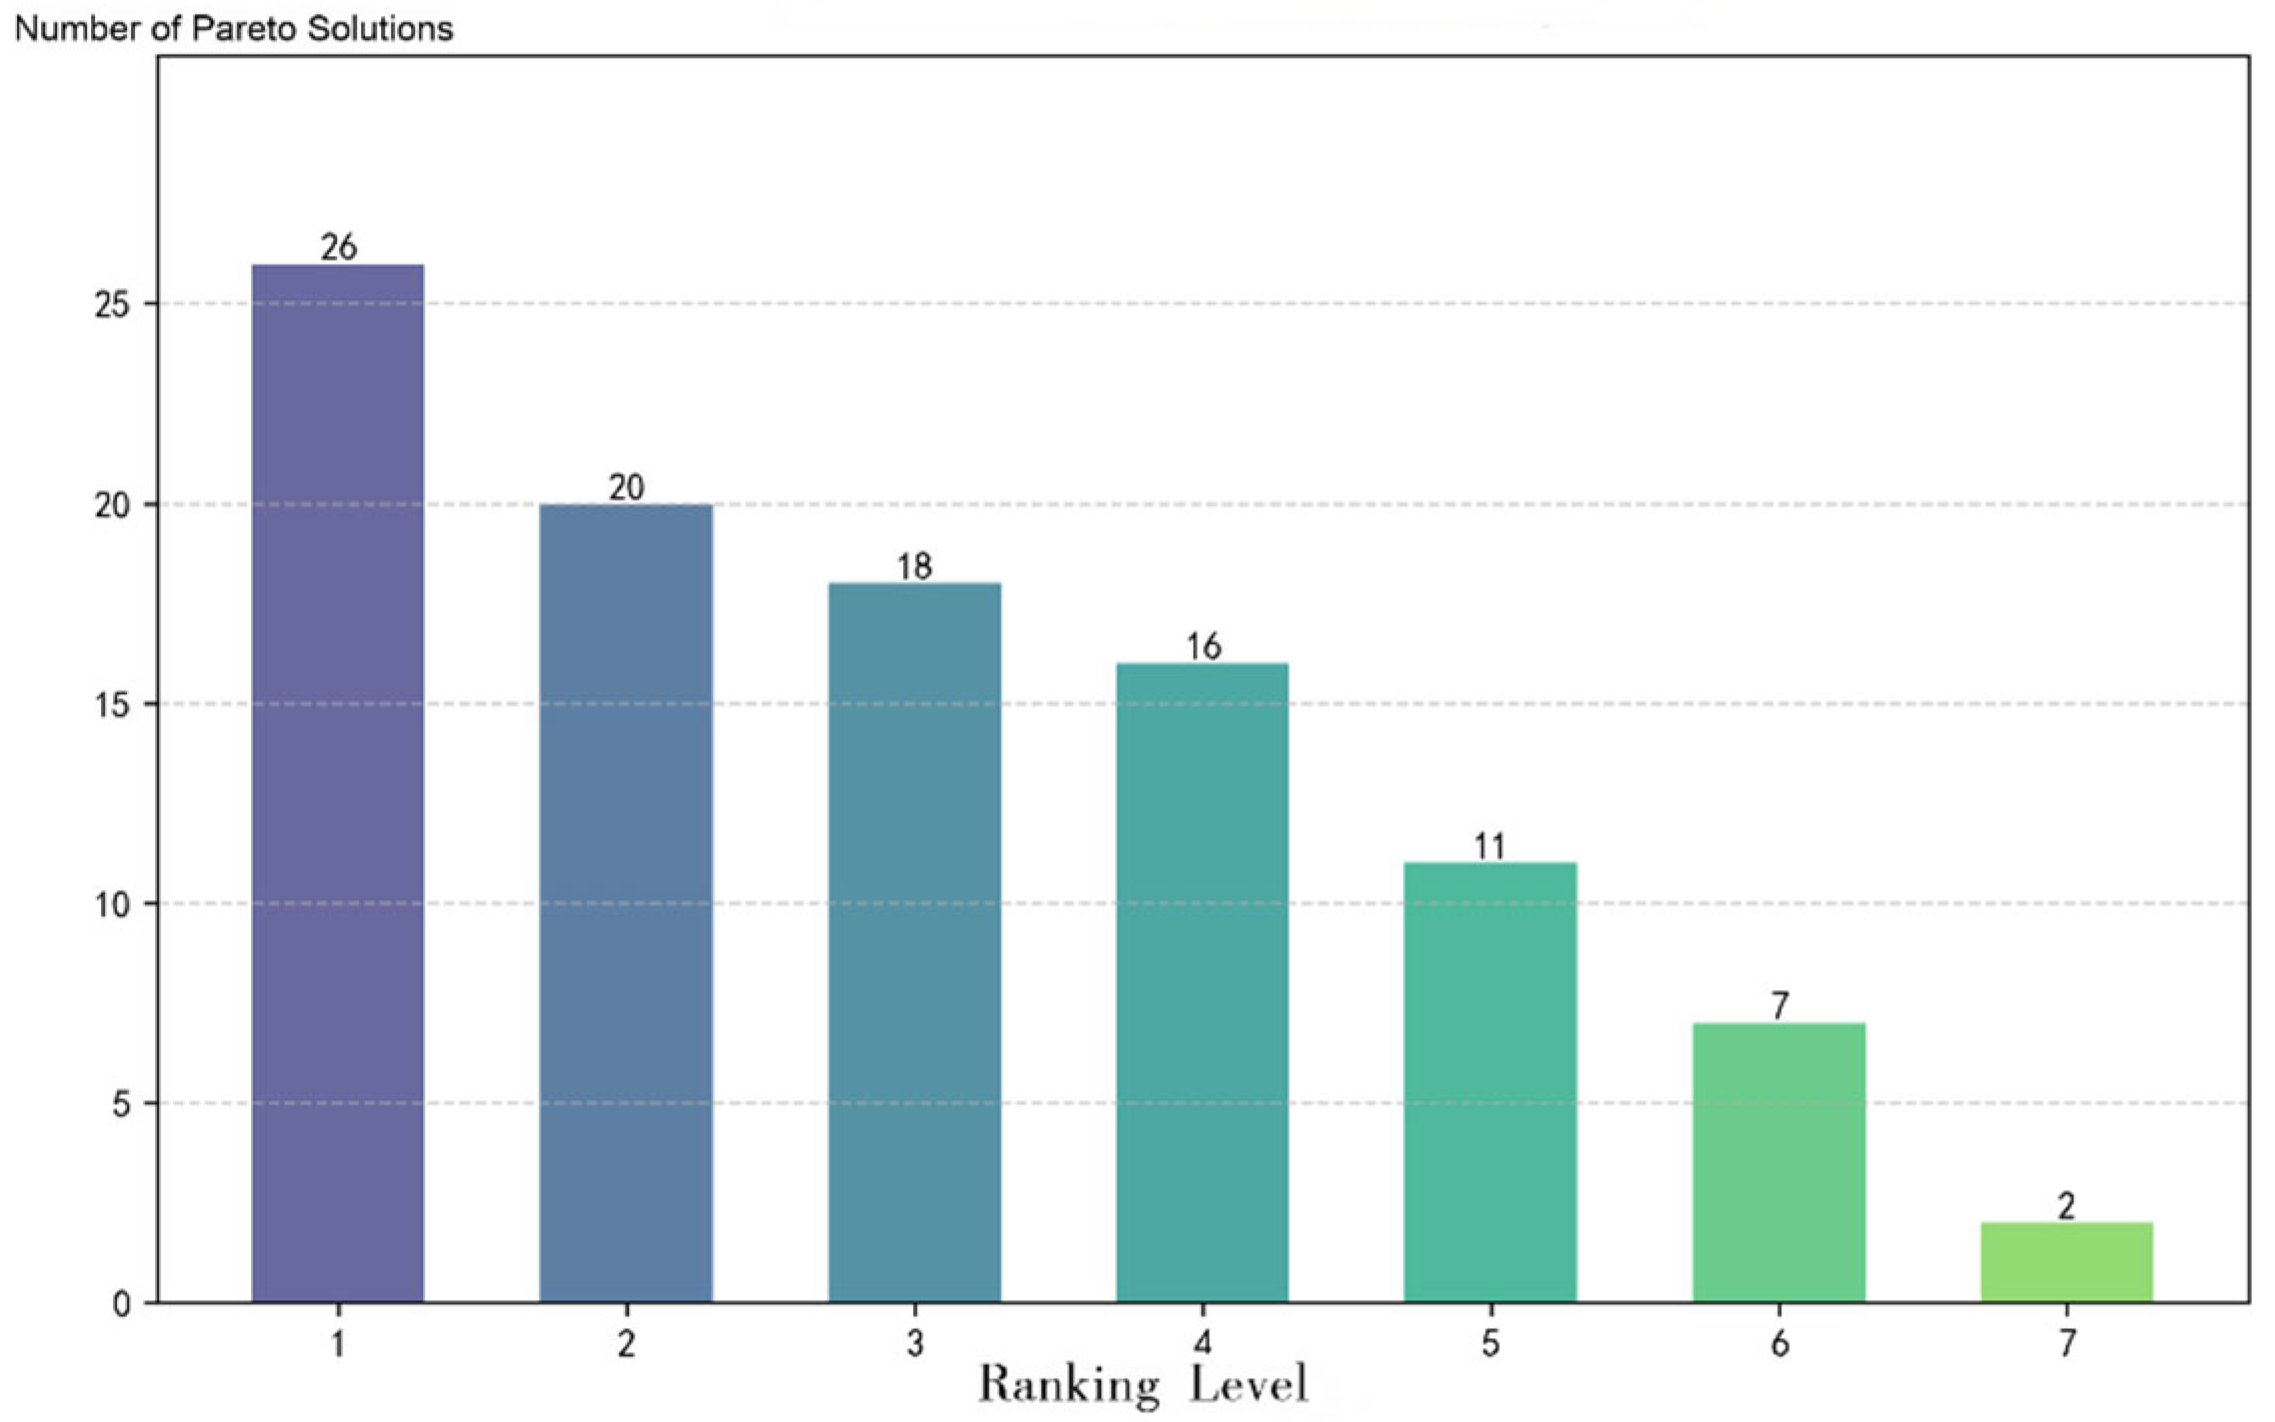
3.4. Comprehensive Ranking and Optimal Solution Determination Based on the Improved TOPSIS Model
3.5. Comparative Analysis of Algorithm Performance and Decision Effectiveness of the Improved TOPSIS Model
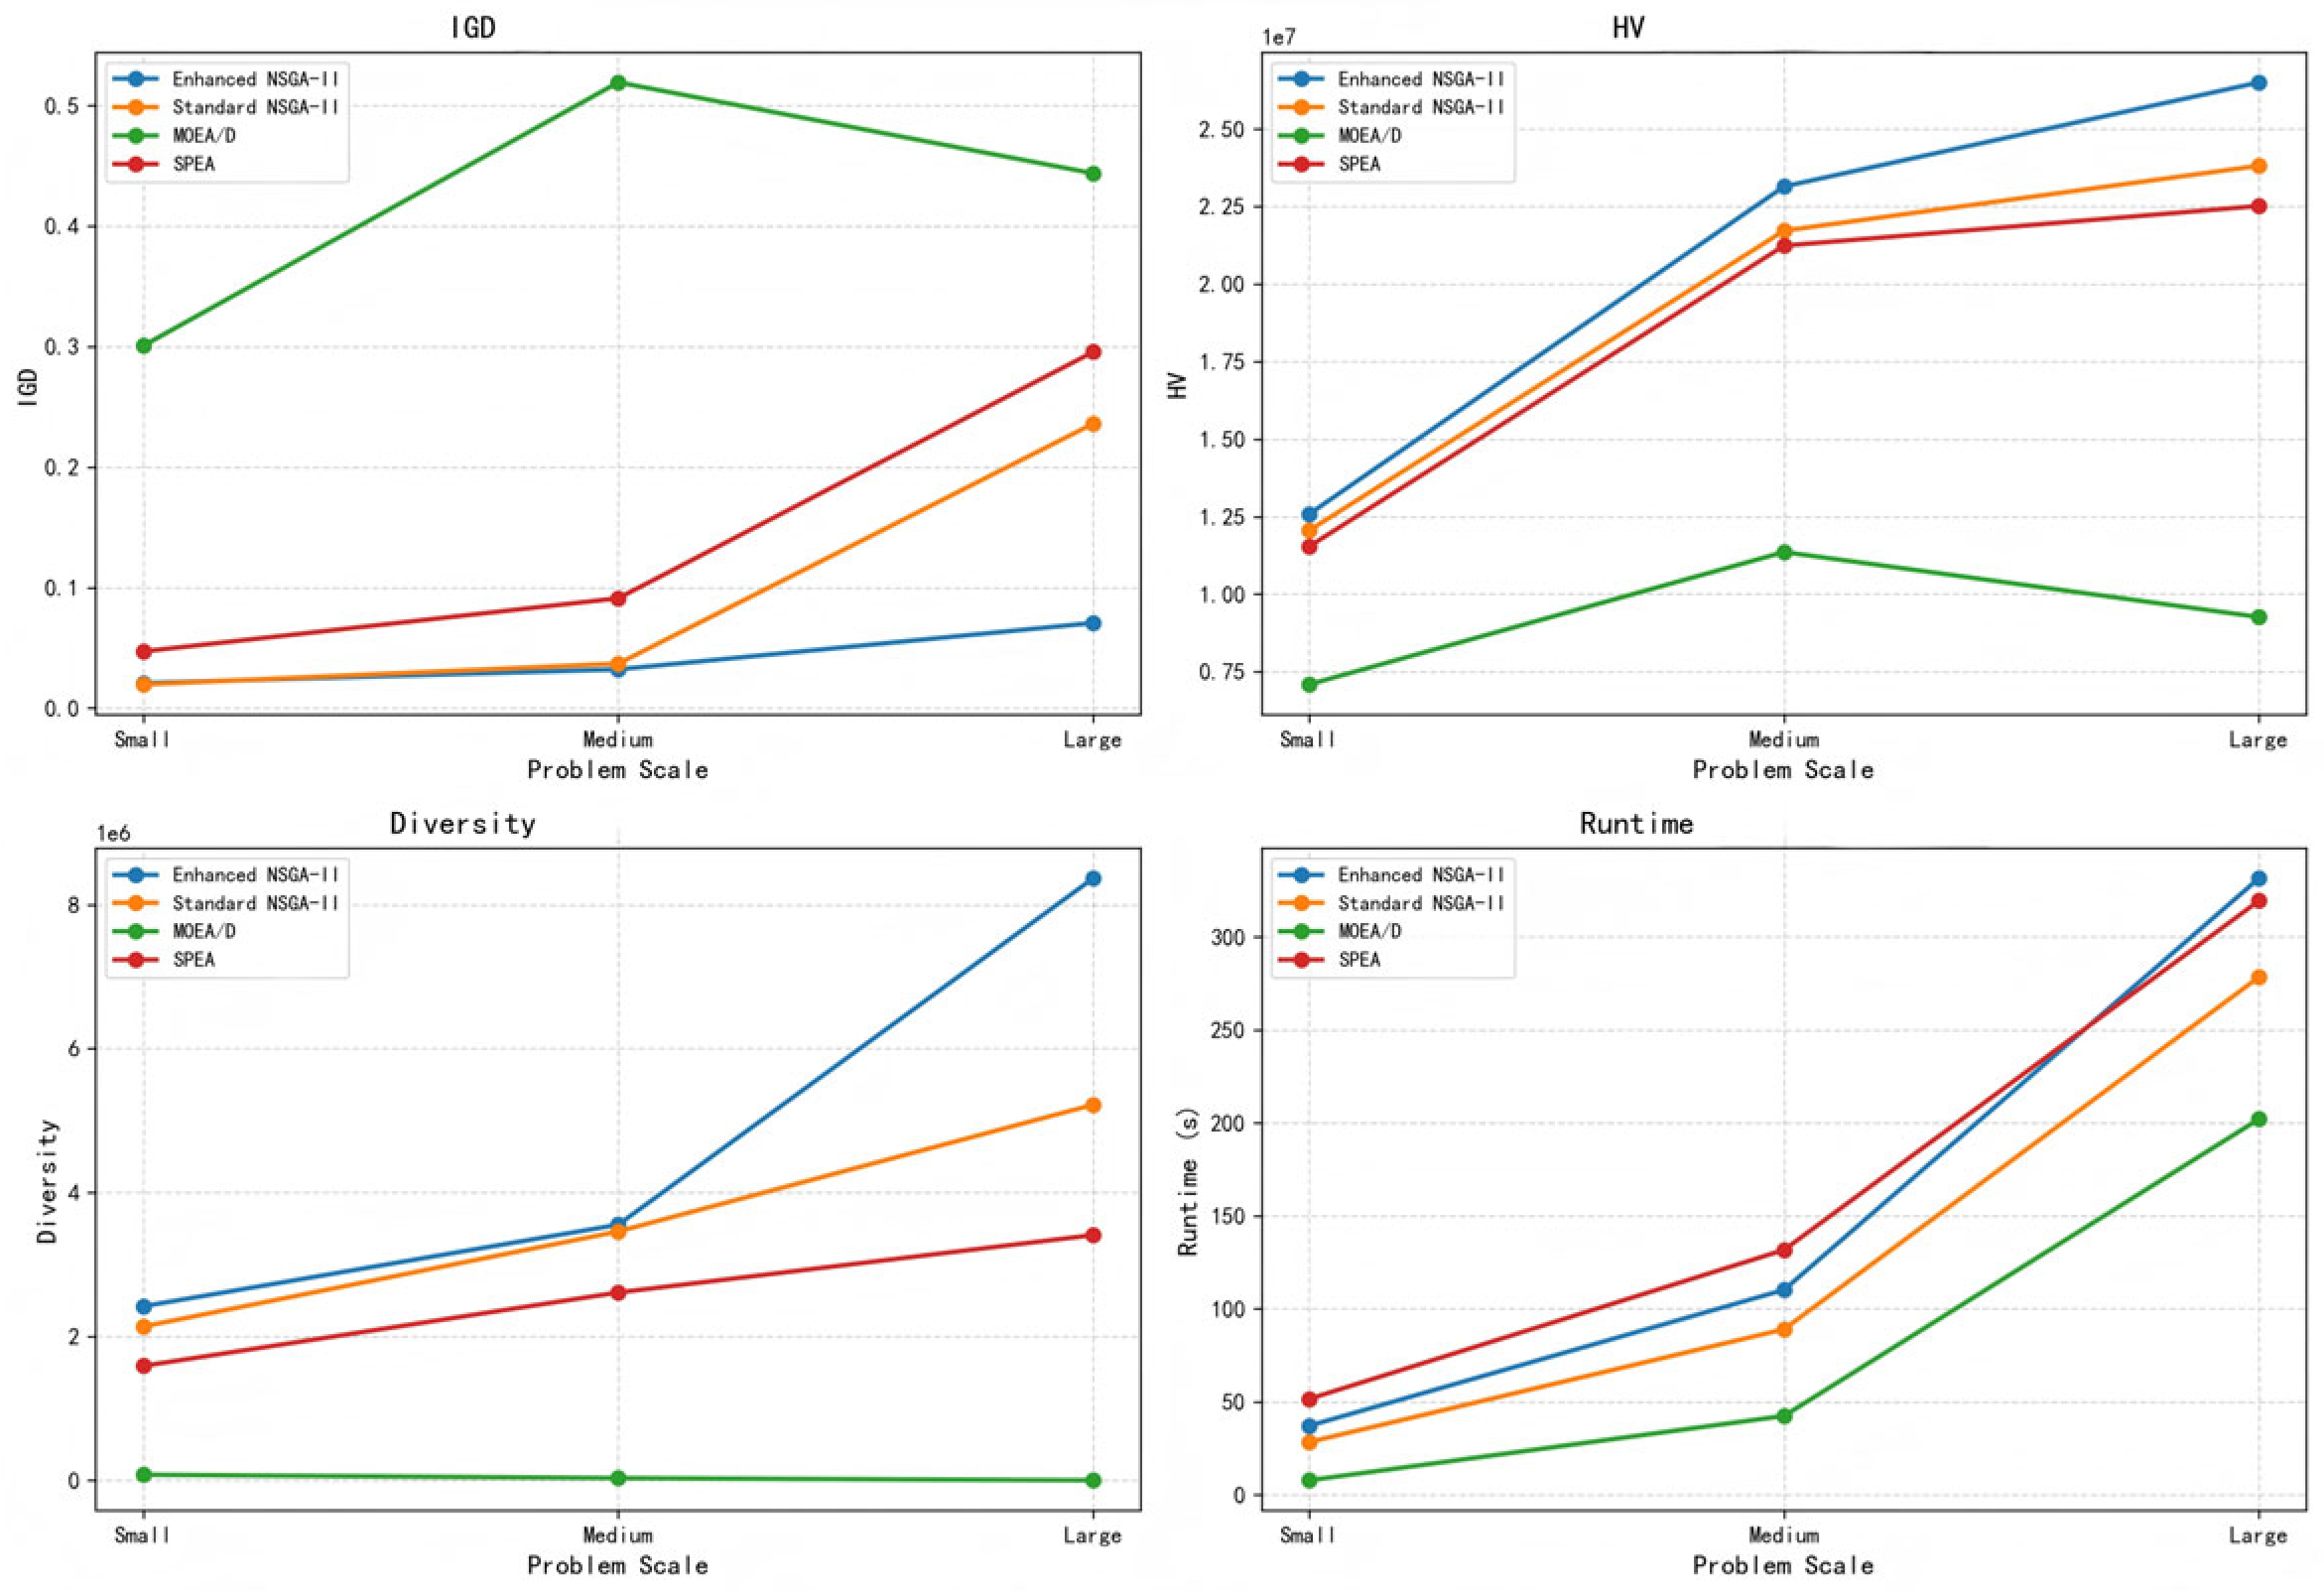
3.5.1. Comparison of Algorithmic Search Performance
3.5.2. Comparative Analysis of Ranking Results Based on the Improved TOPSIS Model
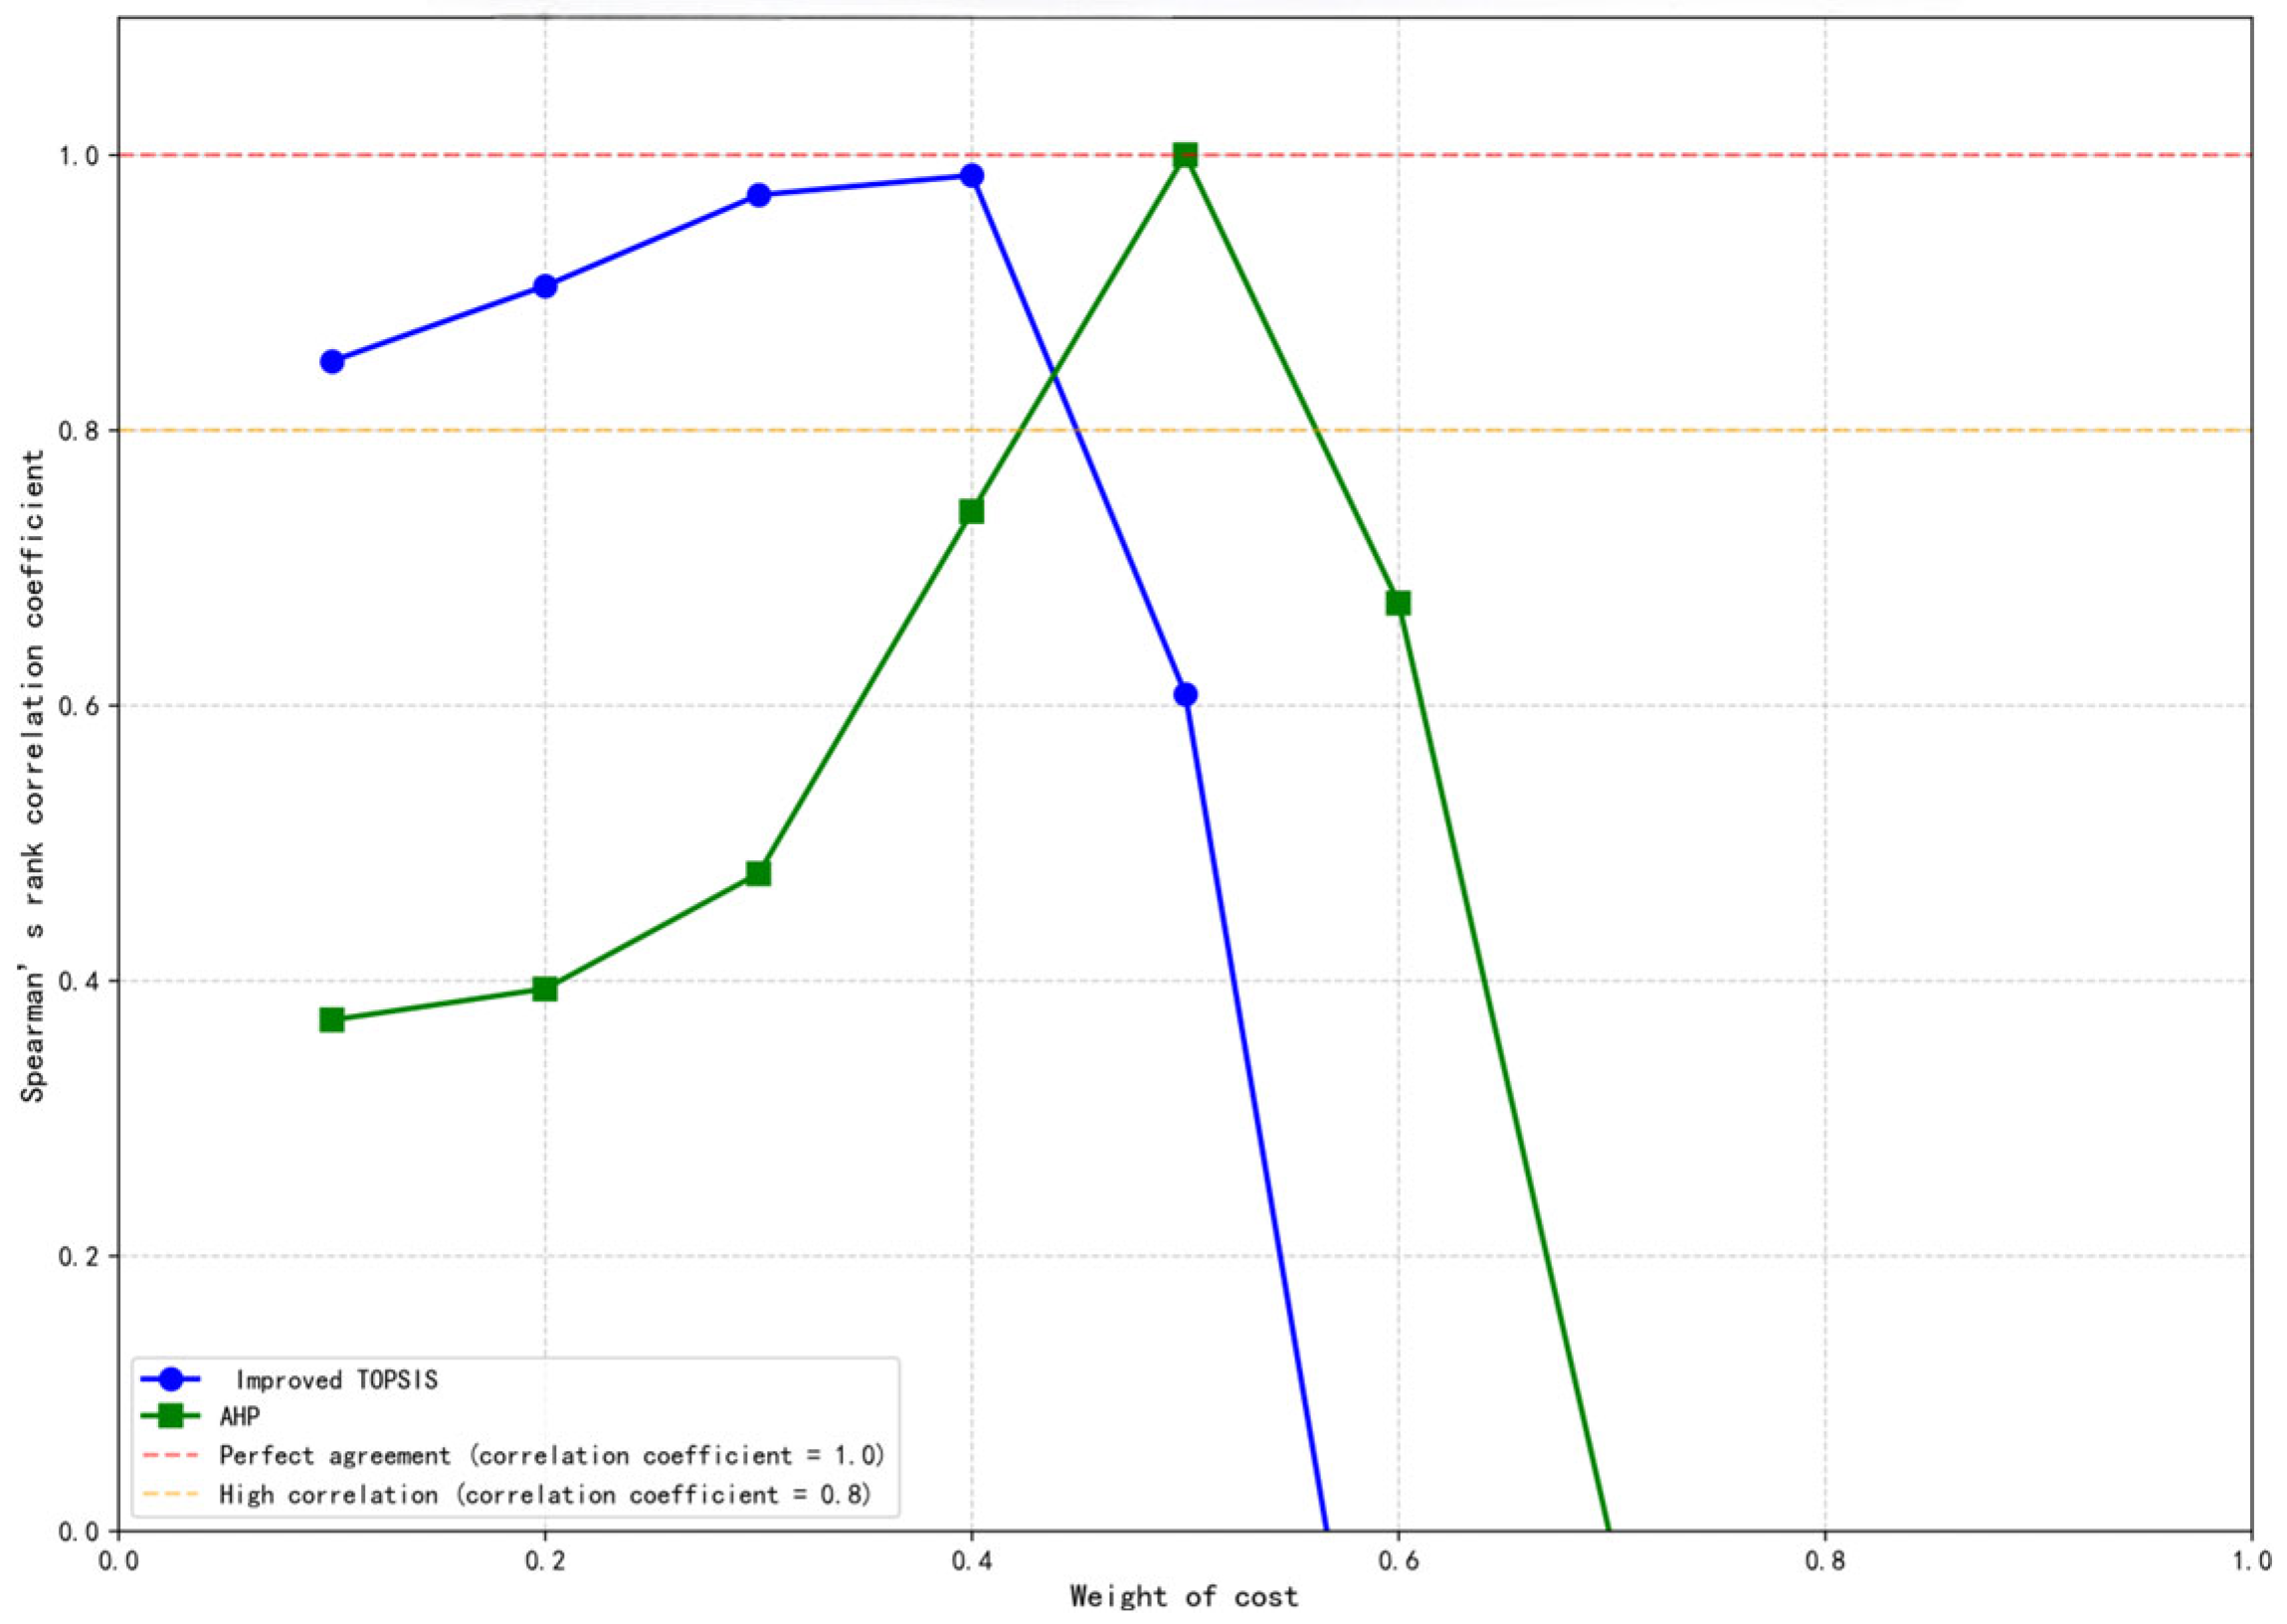
3.5.3. Comparative Analysis of Ranking Results with Different Weighting Methods
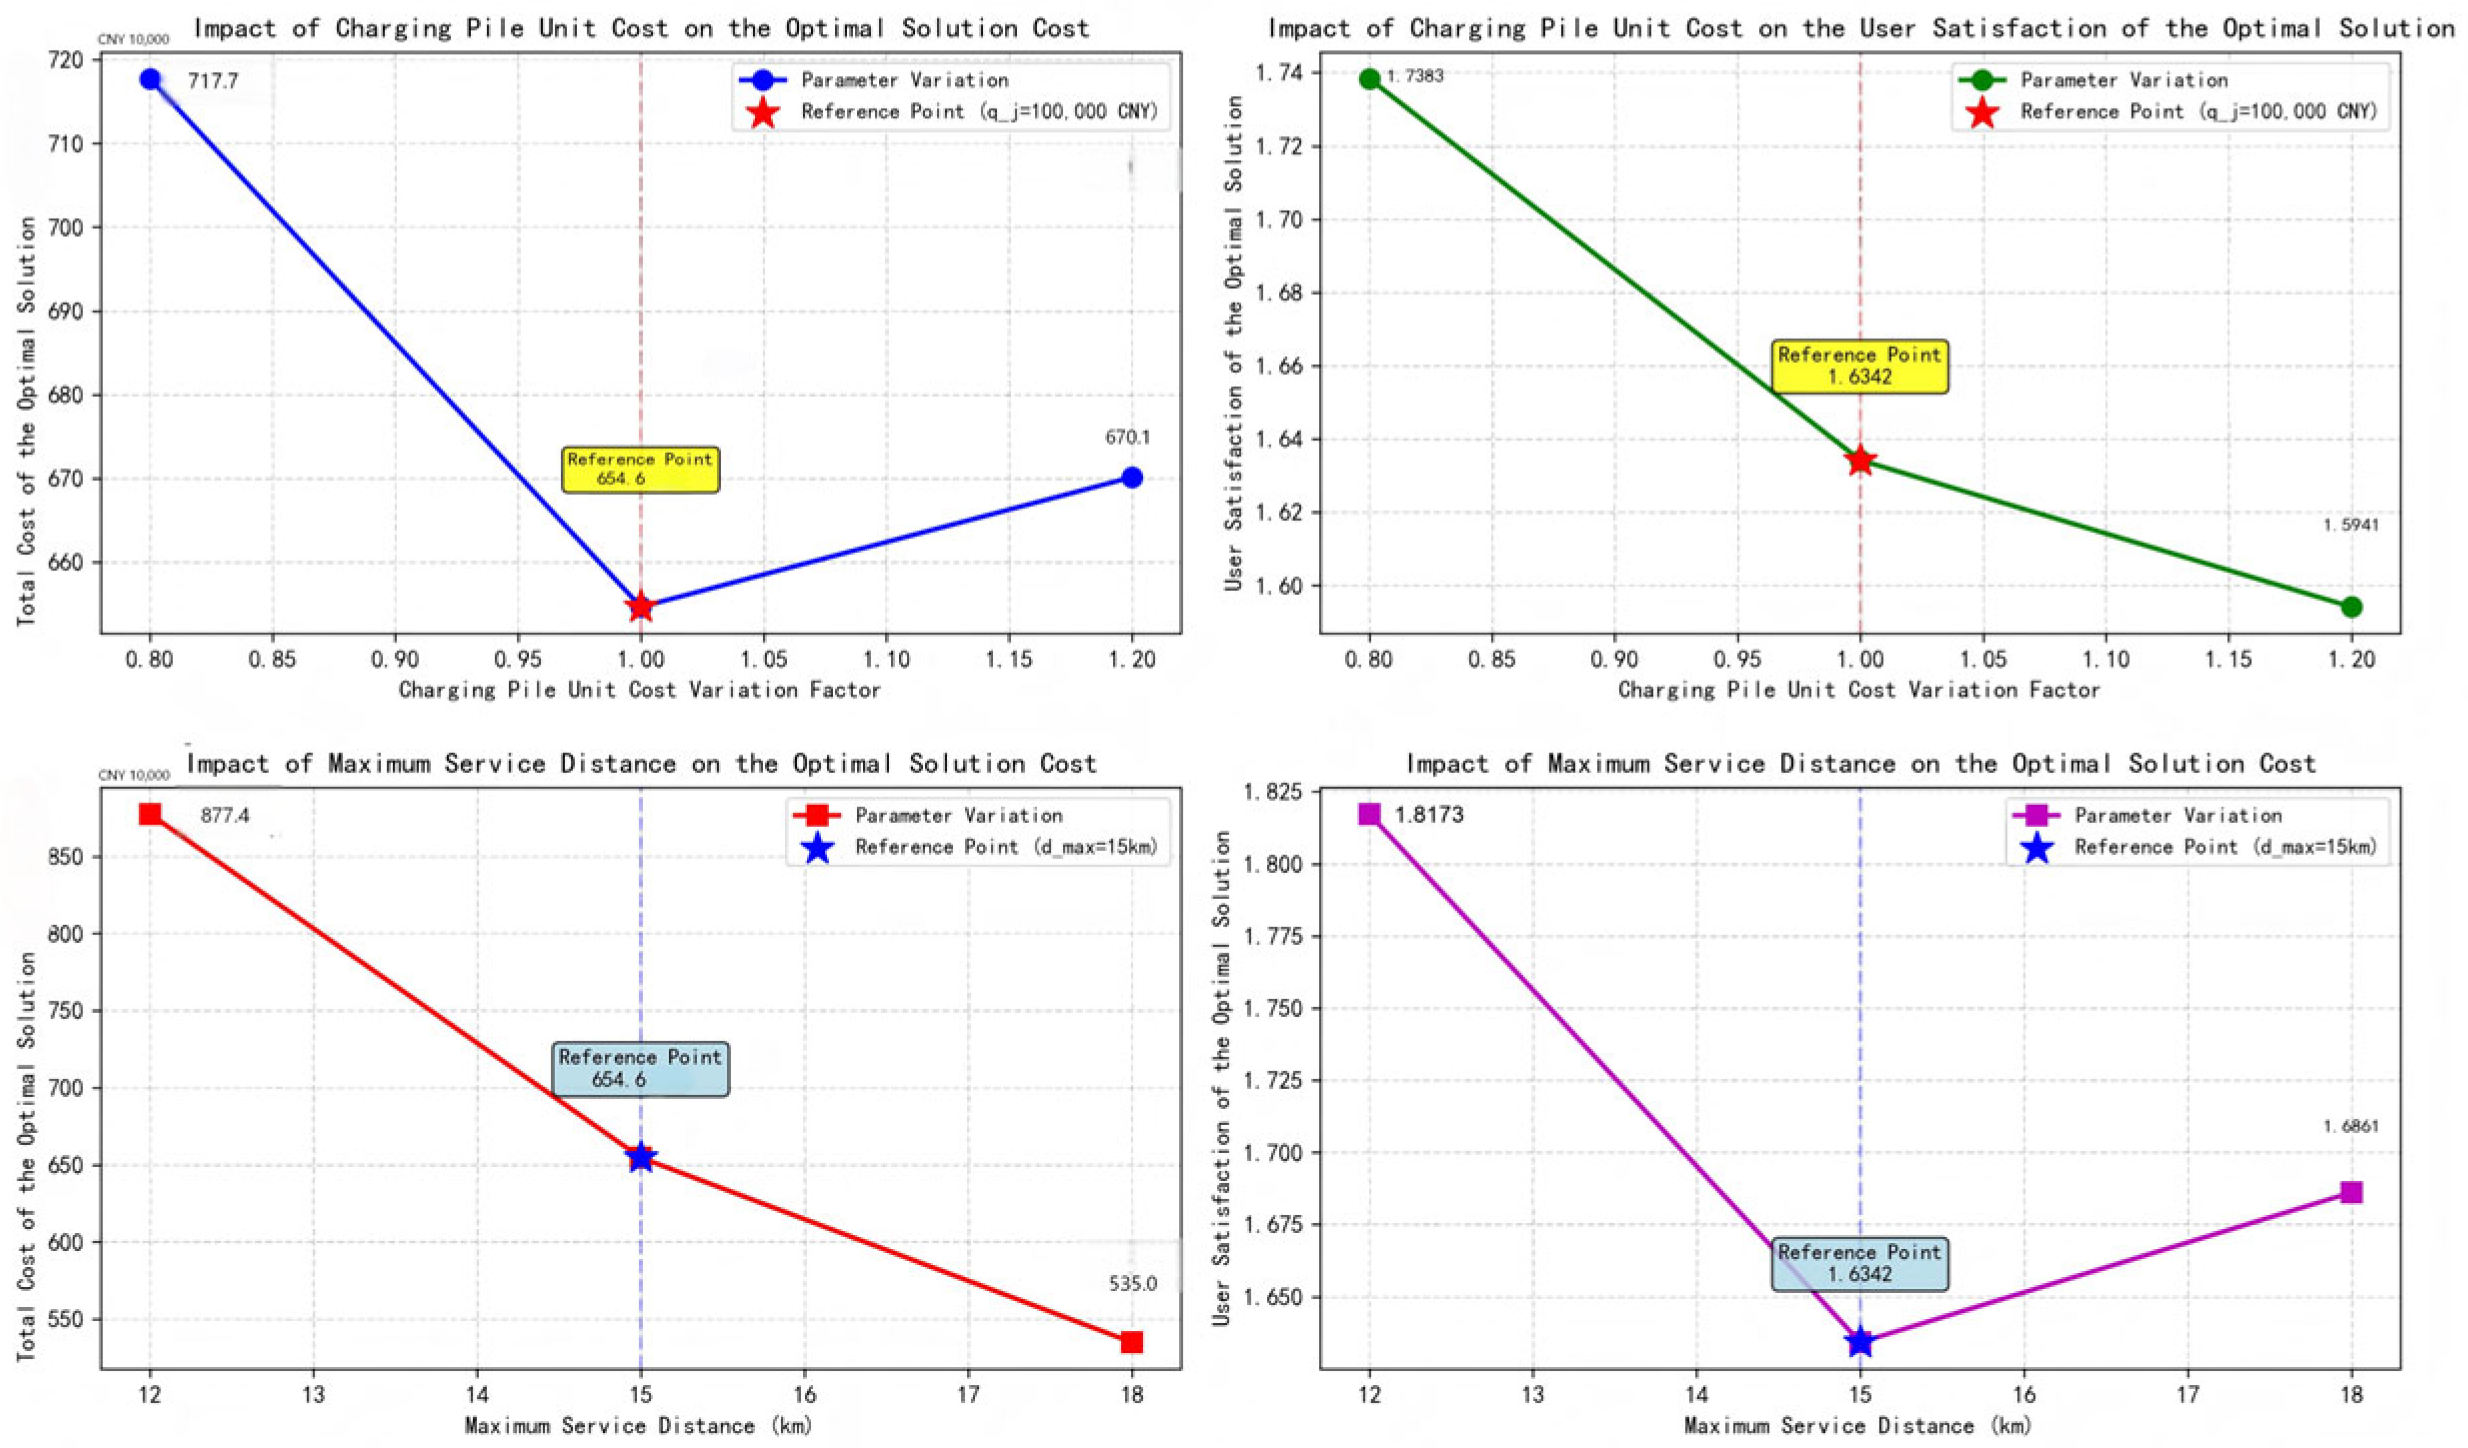
3.5.4. Assessing Model Parameter Sensitivity
- (1)
- Impact of Charging Pile Unit Cost ()
- (2)
- Impact of Maximum Service Distance ()
- (3)
- Model Robustness
3.5.5. Scalability Analysis of the Proposed Framework
- (1)
- Convergence and solution quality.
- (2)
- Diversity of the solution set.
- (3)
- Trade-off analysis of computational efficiency.
4. Conclusions and Outlook
4.1. Main Findings and Contributions
4.2. Discussion on Model Implications, Positioning, and Future Extensions
- (1)
- Multi-scenario testing and adaptability analysis.
- (2)
- Real-data-driven validation and enhancement.
- (3)
- Modeling of dynamic and stochastic factors.
Author Contributions
Funding
Institutional Review Board Statement
Informed Consent Statement
Data Availability Statement
Conflicts of Interest
References
- Wolfram, P.; Weber, S.; Gillingham, K.; Hertwich, E.G. Pricing indirect emissions accelerates low-carbon transition of US light vehicle sector. Nat. Commun. 2021, 12, 7121. [Google Scholar] [CrossRef]
- Hung, Y.-C.; Michailidis, G. A novel data-driven approach for solving the electric vehicle charging station location-routing problem. IEEE Trans. Intell. Transp. Syst. 2022, 23, 23858–23868. [Google Scholar] [CrossRef]
- Yi, T.; Cheng, X.B.; Zheng, H.; Liu, J.-P. Research on location and capacity optimization method for electric vehicle charging stations considering user’s comprehensive satisfaction. Energies 2019, 12, 1915. [Google Scholar] [CrossRef]
- Zhou, G.Y.; Zhu, Z.W.; Luo, S.M. Location optimization of electric vehicle charging stations: Based on cost model and genetic algorithm. Energy 2022, 247, 123437. [Google Scholar] [CrossRef]
- Kadri, A.A.; Perrouault, R.; Boujelben, M.K.; Gicquel, C. A multi-stage stochastic integer programming approach for locating electric vehicle charging stations. Comput. Oper. Res. 2020, 117, 104888. [Google Scholar] [CrossRef]
- Sun, C.; Li, T.; Tang, X. Data-driven electric vehicle charging station placement for incentivizing potential demand. In Proceedings of the 2021 IEEE International Conference on Communications, Control, and Computing Technologies for Smart Grids (SmartGridComm), Aachen, Germany, 25–28 October 2021; pp. 27–32. [Google Scholar]
- Silapan, S.; Patchanee, S.; Kaewdornhan, N.; Somchit, S.; Chatthaworn, R. Optimal sizing and locations of fast charging stations for electric vehicles considering power system constraints. IEEE Access 2024, 12, 139620–139631. [Google Scholar] [CrossRef]
- Kumar, B.V.; Chitkara, M.; Kumar, S. Optimizing EV Charging Stations and Capacitors with the Cuckoo Search Algorithm for Reduced Energy Loss in Distribution Networks. In Proceedings of the 2024 IEEE North Karnataka Subsection Flagship International Conference (NKCon), Bagalkote, India, 21–22 September 2024; pp. 45–50. [Google Scholar]
- Li, J.; Liu, Z.; Wang, X. Public charging station localization and route planning of electric vehicles considering the operational strategy: A bi-level optimizing approach. Sustain. Cities Soc. 2022, 87, 104153. [Google Scholar] [CrossRef]
- Li, Y.; Zhang, H.; Wang, X. Hybrid genetic algorithm–simulated annealing based electric vehicle charging station placement for optimizing distribution network resilience. Energy Rep. 2024, 10, 1125–1138. [Google Scholar] [CrossRef]
- Zapotecas-Martínez, S.; Armas, R.; García-Nájera, A. A multi-objective evolutionary approach for the electric vehicle charging stations problem. Expert Syst. Appl. 2024, 240, 122514. [Google Scholar] [CrossRef]
- Zhang, Q.; Si, G.; Li, H. Optimization of electric vehicle charging station location distribution based on activity–travel patterns. ISPRS Int. J. Geo-Inf. 2025, 14, 373. [Google Scholar] [CrossRef]
- Ding, X.; Jiang, Z.; Fu, Y.; Zhang, H. Optimization method for location and capacity determination of electric vehicle mobile charging station based on multi-objective hybrid frog jump algorithm. Sustain. Energy Res. 2025, 12, 49. [Google Scholar] [CrossRef]
- Yu, N.; Feng, X.; Tang, A.; Sun, L.; Li, Y.; Wang, J.; Zhang, Q. Electric Vehicle Charging Station Location Method Based on an Improved NSGA-II Algorithm. J. Zhengzhou Univ. (Sci. Ed.) 2025, 1–6. [Google Scholar] [CrossRef]
- Jia, Y.; Xing, F. Electric Vehicle Charging Station Location Based on Satisfaction Optimization. J. Donghua Univ. (Nat. Sci. Ed.) 2017, 43, 739–745+770. (In Chinese) [Google Scholar]
- Xu, D.; Pei, W.; Zhang, Q. Optimal Planning of Electric Vehicle Charging Stations Considering User Satisfaction and Charging Convenience. Energies 2022, 15, 5027. [Google Scholar] [CrossRef]
- Zhang, Y.; Wang, J. Planning of electric vehicle charging stations: An integrated deep learning and queueing theory approach. Appl. Energy 2023, 347, 121438. [Google Scholar]
- Limane, A.; Zitouni, F.; Harous, S.; Almazyad, A.S.; Ferhat, A. Chaos-enhanced metaheuristics: Classification, comparison, and convergence analysis. Complex Intell. Syst. 2025, 11, 177. [Google Scholar] [CrossRef]
- Aydemir, S.B. A novel arithmetic optimization algorithm based on chaotic maps for global optimization. Evol. Intell. 2023, 16, 981–996. [Google Scholar] [CrossRef]
- Rahnamayan, S.; Tizhoosh, H.R.; Salama, M.M.A. Opposition-Based Differential Evolution. IEEE Trans. Evol. Comput. 2008, 12, 64–79. [Google Scholar] [CrossRef]
- Dua, R.; Almutairi, S.; Bansal, P. Emerging energy economics and policy research priorities for enabling the electric vehicle sector. Energy Rep. 2024, 12, 1836–1847. [Google Scholar] [CrossRef]
- Wang, Z.; Li, P.; Cai, W.; Shi, Z.; Liu, J.; Cao, Y.; Li, W.; Wu, W.; Li, L.; Liu, J.; et al. Identifying administrative villages with an urgent demand for rural domestic sewage treatment at the county level: Decision making from China wisdom. Sustainability 2025, 17, 800. [Google Scholar] [CrossRef]
- Thunuguntla, V.K.; Maineni, V.; Injeti, S.K.; Kumar, P.P.; Nuvvula, R.S.S.; Dhanamjayulu, C.; Rahaman, M.; Khan, B.A. A TOPSIS-based multi-objective optimal deployment of solar PV and BESS units in power distribution system electric vehicles load demand. Sci. Rep. 2024, 14, 29688. [Google Scholar] [CrossRef] [PubMed]
- Ai, X.; Li, Y.; Wang, K.; Hu, J. Electric Vehicle Charging Station Location and Capacity Determination Based on a Chaos Simulated Annealing Particle Swarm Optimization Algorithm. Electr. Power Autom. Equip. 2018, 38, 9–14. (In Chinese) [Google Scholar] [CrossRef]
- Jiang, X.; Feng, Y.; Xiong, H.; Wang, J.; Zeng, Q. Electric Vehicle Charging Station Planning Based on a Travel Probability Matrix. Trans. China Electrotech. Soc. 2019, 34, 2719. (In Chinese) [Google Scholar]
- Wang, Z. Research on the Location of Urban Public Electric Vehicle Charging Stations Based on a Multi-Objective Programming Model. Master’s Thesis, Henan University, Kaifeng, China, 2023. (In Chinese). [Google Scholar]





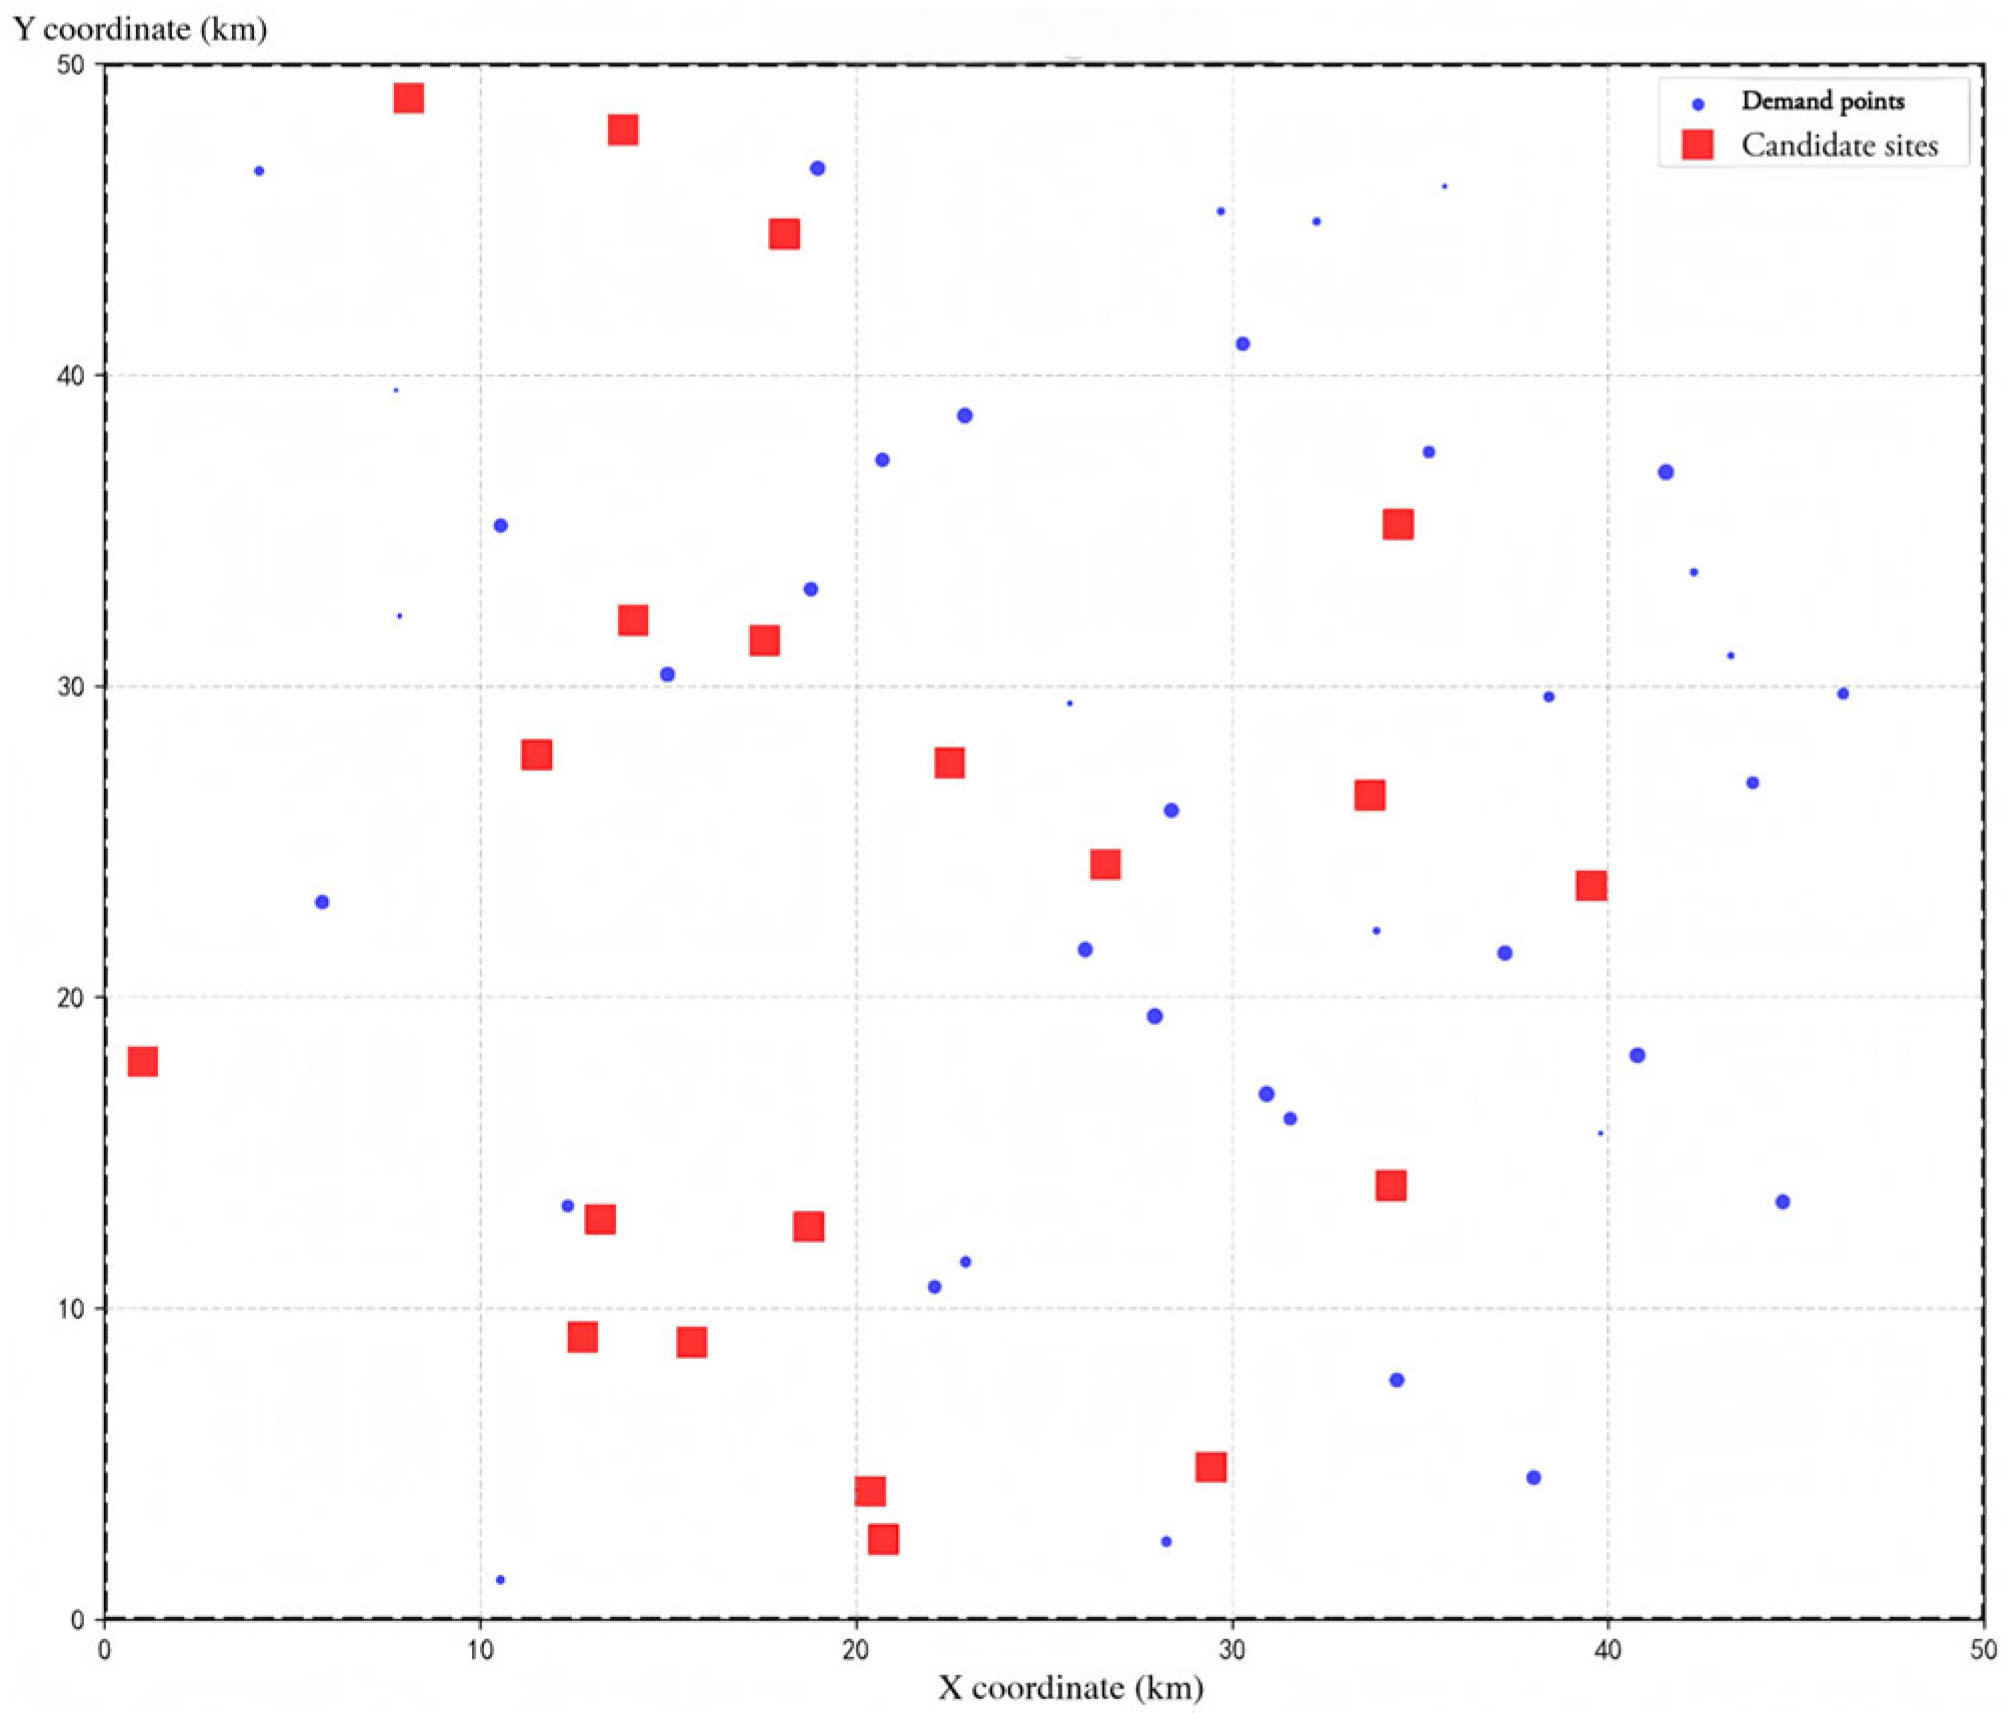
| Numbering | X/km | Y/km | Vehicle Demand/Vehicles | Numbering | X/km | Y/km | Vehicle Demand/Vehicles |
|---|---|---|---|---|---|---|---|
| 1 | 18.98 | 46.63 | 43 | 26 | 1.75 | 21.32 | 1 |
| 2 | 38.43 | 29.65 | 19 | 27 | 10.54 | 1.27 | 11 |
| 3 | 5.80 | 23.04 | 36 | 28 | 10.54 | 35.14 | 35 |
| 4 | 7.86 | 32.24 | 2 | 29 | 38.02 | 4.55 | 39 |
| 5 | 35.66 | 46.05 | 2 | 30 | 32.25 | 44.92 | 9 |
| 6 | 9.73 | 9.80 | 12 | 31 | 30.92 | 16.88 | 48 |
| 7 | 30.36 | 1.34 | 25 | 32 | 18.80 | 33.10 | 37 |
| 8 | 14.98 | 30.37 | 42 | 33 | 36.02 | 31.60 | 47 |
| 9 | 3.24 | 47.74 | 15 | 34 | 27.94 | 19.38 | 27 |
| 10 | 22.89 | 38.69 | 44 | 35 | 35.24 | 37.52 | 26 |
| 11 | 25.68 | 29.44 | 3 | 36 | 12.33 | 13.29 | 27 |
| 12 | 42.28 | 33.65 | 9 | 37 | 26.09 | 21.52 | 42 |
| 13 | 4.12 | 46.55 | 14 | 38 | 22.09 | 10.68 | 32 |
| 14 | 39.80 | 15.62 | 2 | 39 | 31.55 | 16.09 | 32 |
| 15 | 33.84 | 22.13 | 7 | 40 | 34.38 | 7.69 | 39 |
| 16 | 30.28 | 40.99 | 35 | 41 | 20.70 | 37.27 | 26 |
| 17 | 44.65 | 13.42 | 40 | 42 | 46.26 | 29.75 | 22 |
| 18 | 37.26 | 21.41 | 42 | 43 | 43.26 | 30.97 | 6 |
| 19 | 28.25 | 2.50 | 18 | 44 | 22.91 | 11.49 | 20 |
| 20 | 38.21 | 46.10 | 36 | 45 | 43.84 | 26.89 | 8 |
| 21 | 29.70 | 45.25 | 8 | ||||
| 22 | 28.38 | 26.00 | 40 | ||||
| 23 | 41.54 | 36.87 | 47 | ||||
| 24 | 40.78 | 18.12 | 45 | ||||
| 25 | 7.76 | 39.50 | 1 |
| Numbering | X/km | Y/km | Numbering | X/km | Y/km |
|---|---|---|---|---|---|
| 1 | 18.10 | 44.53 | 11 | 34.42 | 35.19 |
| 2 | 14.06 | 32.09 | 12 | 8.11 | 48.89 |
| 3 | 1.02 | 17.92 | 13 | 13.81 | 47.88 |
| 4 | 15.63 | 8.90 | 14 | 20.73 | 2.59 |
| 5 | 26.64 | 24.27 | 15 | 17.56 | 31.45 |
| 6 | 34.24 | 13.93 | 16 | 33.67 | 26.48 |
| 7 | 12.72 | 9.08 | 17 | 22.49 | 27.54 |
| 8 | 11.50 | 27.79 | 18 | 29.45 | 4.88 |
| 9 | 20.38 | 4.11 | 19 | 18.74 | 12.62 |
| 10 | 13.19 | 12.85 | 20 | 39.55 | 23.57 |
| Solution | Candidate Site Number | Number of Charging Piles | Objective Function I | Objective Function II |
|---|---|---|---|---|
| 1 | 2, 6, 8, 9, 10, 11, 12 | 20, 20, 6, 4, 4, 20, 8, 7, 20 | 10,007,068.4408 | 1.9092 |
| 2 | 1, 2, 3, 5, 6, 7, 10, 11, 12, 15, 16, 17, 18, 19, 20 | 12, 11, 5, 17, 16, 4, 4, 18, 4, 10, 4, 4, 13, 7, 9 | 12,285,334.7429 | 1.9124 |
| 3 | 4, 7, 9, 10, 14 | 7, 4, 4, 4, 4 | 1,723,119.1335 | 0.1961 |
| 4 | 4, 10, 14, 16, 19 | 4, 4, 4, 7, 20 | 3,395,770.3427 | 0.9224 |
| 5 | 3, 7, 8, 9, 13 | 5, 5, 16, 10, 18 | 3,388,560.6392 | 0.5831 |
| 6 | 1, 3, 6, 7, 8, 9, 11, 12, 13 | 17, 5, 20, 5, 16, 10, 20, 4, 4 | 8,947,242.0281 | 1.8140 |
| 7 | 3, 6, 7, 8, 9, 10, 11, 12, 14 | 5, 20, 4, 16, 7, 4, 20, 8, 4 | 7,685,543.9178 | 1.7492 |
| 8 | 19, 11, 8, 10, 7, 12, 15, 1, 3, 2, 18, 5, 20, 9, 14 | 7, 18, 4, 4, 4, 4, 10, 12, 5, 11, 13, 20, 20, 4, 4 | 11,816,704.0162 | 1.9117 |
| 9 | 3, 6, 7, 9, 10, 12 | 5, 20, 4, 10, 4, 18 | 4,239,305.6507 | 1.0781 |
| 10 | 3, 4, 6, 7, 9, 11, 14, 19 | 11, 5, 20, 4, 20, 8, 4, 16, 7, 20 | 6,099,409.1505 | 1.4262 |
| 11 | 2, 3, 6, 10, 11, 12, 14, 15, 19, 20 | 11, 5, 20, 4, 20, 8, 4, 16, 7, 20 | 10,172,891.6210 | 1.9098 |
| 12 | 3, 4, 7, 9, 10 | 5, 7, 4, 4, 4 | 1,773,587.0580 | 0.2644 |
| 13 | 6, 8, 11, 12, 3 | 20, 16, 20, 8, 9 | 6,546,410.7668 | 1.6342 |
| 14 | 3, 7, 10, 14, 16, 18 | 5, 4, 4, 7, 20, 13 | 4,470,016.1623 | 1.1344 |
| 15 | 1, 3, 6, 7, 9, 12, 13 | 20, 5, 20, 5, 10, 4, 4 | 6,027,312.1157 | 1.3709 |
| 16 | 3, 4, 6, 7, 8, 10, 11, 14 | 5, 7, 20, 4, 16, 4, 20, 4 | 7,130,396.7493 | 1.6423 |
| 17 | 4, 7, 13, 3, 8 | 7, 5, 8, 5, 16 | 3,150,640.4241 | 0.5501 |
| 18 | 6, 8, 10, 11, 12 | 20, 20, 12, 20, 8 | 7,418,784.8888 | 1.7160 |
| 19 | 4, 7, 10, 13, 16 | 7, 4, 4, 8, 20 | 3,640,900.2613 | 0.9961 |
| 20 | 2, 6, 10, 11, 12, 14, 19, 20 | 20, 20, 4, 20, 8, 4, 7, 20 | 9,588,905.6385 | 1.8409 |
| 21 | 1, 3, 6, 7, 10 | 20, 5, 20, 4, 11 | 5,450,535.8366 | 1.3143 |
| 22 | 3, 4, 7, 10, 13 | 5, 7, 4, 4, 8 | 2,018,716.9765 | 0.3385 |
| 23 | 3, 4, 7, 8, 9 | 5, 7, 5, 16, 4 | 2,905,510.5055 | 0.4761 |
| 24 | 1, 4, 9, 16, 19 | 20, 5, 4, 20, 7 | 5,118,889.4762 | 1.2962 |
| 25 | 3, 6, 9, 12, 13, 15 | 5, 20, 15, 4, 6, 20 | 6,315,700.2552 | 1.5171 |
| 26 | 3, 6, 7, 8, 9, 19 | 5, 20, 5, 16, 4, 7 | 4,888,178.9646 | 1.1831 |
| Solution ID | Score | Rank | Solution ID | Score | Rank |
|---|---|---|---|---|---|
| 13 | 0.7003 | 1 | 1 | 0.6135 | 14 |
| 25 | 0.6798 | 2 | 11 | 0.6083 | 15 |
| 18 | 0.6794 | 3 | 9 | 0.6061 | 16 |
| 16 | 0.6765 | 4 | 19 | 0.5948 | 17 |
| 7 | 0.6743 | 5 | 4 | 0.5767 | 18 |
| 10 | 0.6615 | 6 | 8 | 0.5625 | 19 |
| 24 | 0.6557 | 7 | 2 | 0.5512 | 20 |
| 21 | 0.6498 | 8 | 5 | 0.4790 | 21 |
| 15 | 0.6465 | 9 | 17 | 0.4780 | 22 |
| 6 | 0.6358 | 10 | 23 | 0.4682 | 23 |
| 26 | 0.6230 | 11 | 22 | 0.4645 | 24 |
| 14 | 0.6192 | 12 | 12 | 0.4580 | 25 |
| 20 | 0.6174 | 13 | 3 | 0.4488 | 26 |
| Name of the Algorithm | Hypervolume | Inverted Generational Distance | Diversity | Runtime/s |
|---|---|---|---|---|
| Enhanced NSGA-II | 12,583,018.2631 | 0.0208 | 2,419,870.8753 | 37.15 |
| Standard NSGA-II | 12,054,043.1198 | 0.0197 | 2,138,643.1843 | 28.39 |
| MOEA/D | 7,090,696.7683 | 0.3008 | 77,514.4061 | 7.82 |
| SPEA | 11,539,899.2954 | 0.0471 | 1,590,371.1890 | 51.58 |
| Algorithm Type | Rank | Improved TOPSIS Score | Total Operator Cost (10k CNY) | User Satisfaction | Candidate Site ID | Number of Charging Piles |
|---|---|---|---|---|---|---|
| Enhanced NSGA-II | 1 | 0.7003 | 6,546,410.7668 | 1.6342 | 6, 8, 11, 12, 3 | 20, 16, 20, 8, 9 |
| Standard NSGA-II | 1 | 0.6928 | 6,820,379.4993 | 1.6426 | 2, 5, 7, 8, 9, 10, 18 | 5, 20, 16, 4, 4, 20, 7 |
| Rank | Improved TOPSIS (Solution ID) | Score | AHP (Solution ID) | Score |
|---|---|---|---|---|
| 1 | 13 | 0.7003 | 12 | 0.6802 |
| 2 | 25 | 0.6798 | 21 | 0.6737 |
| 3 | 18 | 0.6794 | 22 | 0.6719 |
| 4 | 16 | 0.6765 | 19 | 0.6712 |
| 5 | 7 | 0.6743 | 13 | 0.6710 |
| Experiment ID | Variable Parameter | Parameter Value | Magnitude of Variation |
|---|---|---|---|
| 1 | 80,000 CNY | −20% | |
| 2 | 10,000 CNY | Reference Point | |
| 3 | 120,000 CNY | +20% | |
| 4 | 12 km | −20% | |
| 5 | 15 km | Reference Point | |
| 6 | 18 km | +20% |
| Scale | Algorithm | IGD | HV | Diversity | Runtime (s) |
|---|---|---|---|---|---|
| Small | Enhanced NSGA-II | 0.0208 | 12,583,018.2631 | 2,419,870.8753 | 37.15 |
| Standard NSGA-II | 0.0197 | 12,054,043.1198 | 2,138,643.1843 | 28.39 | |
| MOEA/D | 0.3008 | 7,090,696.7683 | 77,514.4061 | 7.82 | |
| SPEA | 0.0471 | 11,539,899.2954 | 1,590,371.189 | 51.58 | |
| Medium | Enhanced NSGA-II | 0.0322 | 23,148,217.6824 | 3,553,996.5213 | 110.25 |
| Standard NSGA-II | 0.0369 | 21,724,169.5760 | 3,459,863.0045 | 89.06 | |
| MOEA/D | 0.5193 | 11,359,800.5035 | 31,224.7452 | 42.46 | |
| SPEA | 0.0912 | 21,241,015.6012 | 2,611,663.1785 | 131.74 | |
| Large | Enhanced NSGA-II | 0.0707 | 26,506,806.2492 | 8,371,341.9284 | 331.64 |
| Standard NSGA-II | 0.2361 | 23,816,901.8625 | 5,222,255.7161 | 278.49 | |
| MOEA/D | 0.4438 | 9,263,960.0542 | 0.0 | 202.13 | |
| SPEA | 0.2957 | 22,521,157.6395 | 3,409,405.3339 | 319.55 |
Disclaimer/Publisher’s Note: The statements, opinions and data contained in all publications are solely those of the individual author(s) and contributor(s) and not of MDPI and/or the editor(s). MDPI and/or the editor(s) disclaim responsibility for any injury to people or property resulting from any ideas, methods, instructions or products referred to in the content. |
© 2026 by the authors. Licensee MDPI, Basel, Switzerland. This article is an open access article distributed under the terms and conditions of the Creative Commons Attribution (CC BY) license.
Share and Cite
Liu, X.; Guo, H.; Chen, H.; Wu, Y.; Yu, D. An Improved NSGA-II–TOPSIS Integrated Framework for Multi-Objective Optimization of Electric Vehicle Charging Station Siting. Sustainability 2026, 18, 668. https://doi.org/10.3390/su18020668
Liu X, Guo H, Chen H, Wu Y, Yu D. An Improved NSGA-II–TOPSIS Integrated Framework for Multi-Objective Optimization of Electric Vehicle Charging Station Siting. Sustainability. 2026; 18(2):668. https://doi.org/10.3390/su18020668
Chicago/Turabian StyleLiu, Xiaojia, Hailong Guo, Hongyu Chen, Yufeng Wu, and Dexin Yu. 2026. "An Improved NSGA-II–TOPSIS Integrated Framework for Multi-Objective Optimization of Electric Vehicle Charging Station Siting" Sustainability 18, no. 2: 668. https://doi.org/10.3390/su18020668
APA StyleLiu, X., Guo, H., Chen, H., Wu, Y., & Yu, D. (2026). An Improved NSGA-II–TOPSIS Integrated Framework for Multi-Objective Optimization of Electric Vehicle Charging Station Siting. Sustainability, 18(2), 668. https://doi.org/10.3390/su18020668