1. Introduction
With the United Nations’ Agenda 2030, the European (EU) Green Deal [
1], legal frameworks [
2], and action plans [
3] derived from it, countries around the world have set themselves ambitious sustainable development goals. These are intended to secure social prosperity, global peace, and enable healthy economic growth for all, despite the challenges posed by the climate crisis. In this context, the economy, in general, and the manufacturing industry in particular, are assigned considerable responsibility for overcoming these challenges. Against this backdrop, lithium-ion battery (LIB) recycling constitutes a strategically important area where circular economy ambitions encounter implementation realities. Beyond technical efficacy, progress depends on how organizations mobilize resources, align institutional routines, and build internal legitimacy for change. Our study speaks to these practical conditions by eliciting stakeholder priorities and perceived constraints.
Recycling and waste management play a central role in this. They are the link between production, consumption, and the return of raw materials. This means that they not only contribute to the conservation of primary resources and the reduction in emissions through proper disposal and recycling but are also an important economic sector. However, simply implementing the right measures, such as recycling or the production of secondary raw materials, is not enough to achieve sustainability goals and a circular economy. It is equally crucial to implement these measures efficiently and in an environmentally friendly manner. Without a comprehensive environmental management system, these processes threaten to counteract their original purpose—environmental protection.
Recycling and waste management companies face not only environmental and social responsibilities but also economic challenges common to all businesses. As a result, they operate at the intersection of public-good obligations and entrepreneurial requirements. Sustainability in waste management therefore involves not only doing the right things but also doing them right. Effective environmental and sustainability management is key to aligning ecological, social, and economic objectives and hinges on the combination of technical innovation, stringent monitoring systems, and responsible operational conduct.
The same consideration applies to the field of LIB production and recycling. As production volumes increase, sustainability management and responsible recycling become essential, both for recovering critical raw materials and for reducing environmental impacts. Life cycle assessments (LCAs) have demonstrated that LIB recycling can reduce greenhouse gas emissions, energy use, and water consumption by more than 50% compared to primary extraction, with key sensitivities related to electricity mix and chemical input [
4,
5,
6,
7]. Technological research in this field has advanced rapidly. Numerous studies thoroughly analyzed and compared different recycling methods, as well as emerging options [
8,
9,
10,
11,
12]. Less is known about the organizational and institutional conditions that determine whether said potential is realized in practice. We address this gap using stakeholder-based mapping to diagnose where implementation stalls. While related frameworks, such as socio-technical transition mapping and stakeholder-based circular economy assessments, offer valuable conceptual guidance, they typically remain qualitative and generic. Here, we extend this body of work by introducing a quantified barrier–intervention mapping. It integrates stakeholder-derived weighting with literature-based structuring. Applied to LIB recycling, this synthesis translates abstract transition concepts into a sector-specific, data-grounded roadmap that supports prioritization and implementation. This approach facilitates integrated stakeholder perspectives in sustainable recycling strategies, since implementation depends on coordinated action across the value chain from manufacturers to policymakers. Recent studies address stakeholder-specific sustainability trade-offs [
13], social impacts along the supply chain [
5], or collaborative circularity strategies [
14]. Still, systematic mappings of recycler-informed barriers and interventions are rare.
This research provides systematic research of the advantages of sustainable economic management of companies compared to neglecting it. It highlights a stakeholder-based survey of company-related internal barriers and drivers of sustainability. The results provide a weighted list of risks and opportunities associated with sustainability in companies presented in the form of a risk–opportunity mapping. This is followed by a priority-weighted barrier–intervention mapping. Finally, a roadmap links key challenges to countermeasures across strategic, operational, and institutional levels to support implementation. The presented method and roadmap are not only valid for stakeholders in the LIB recycling sector but can be transferred to similar industries supporting sustainable energy and mobility transition in Europe.
2. Materials and Methods
2.1. Data Collection
2.1.1. Systematic Literature Review
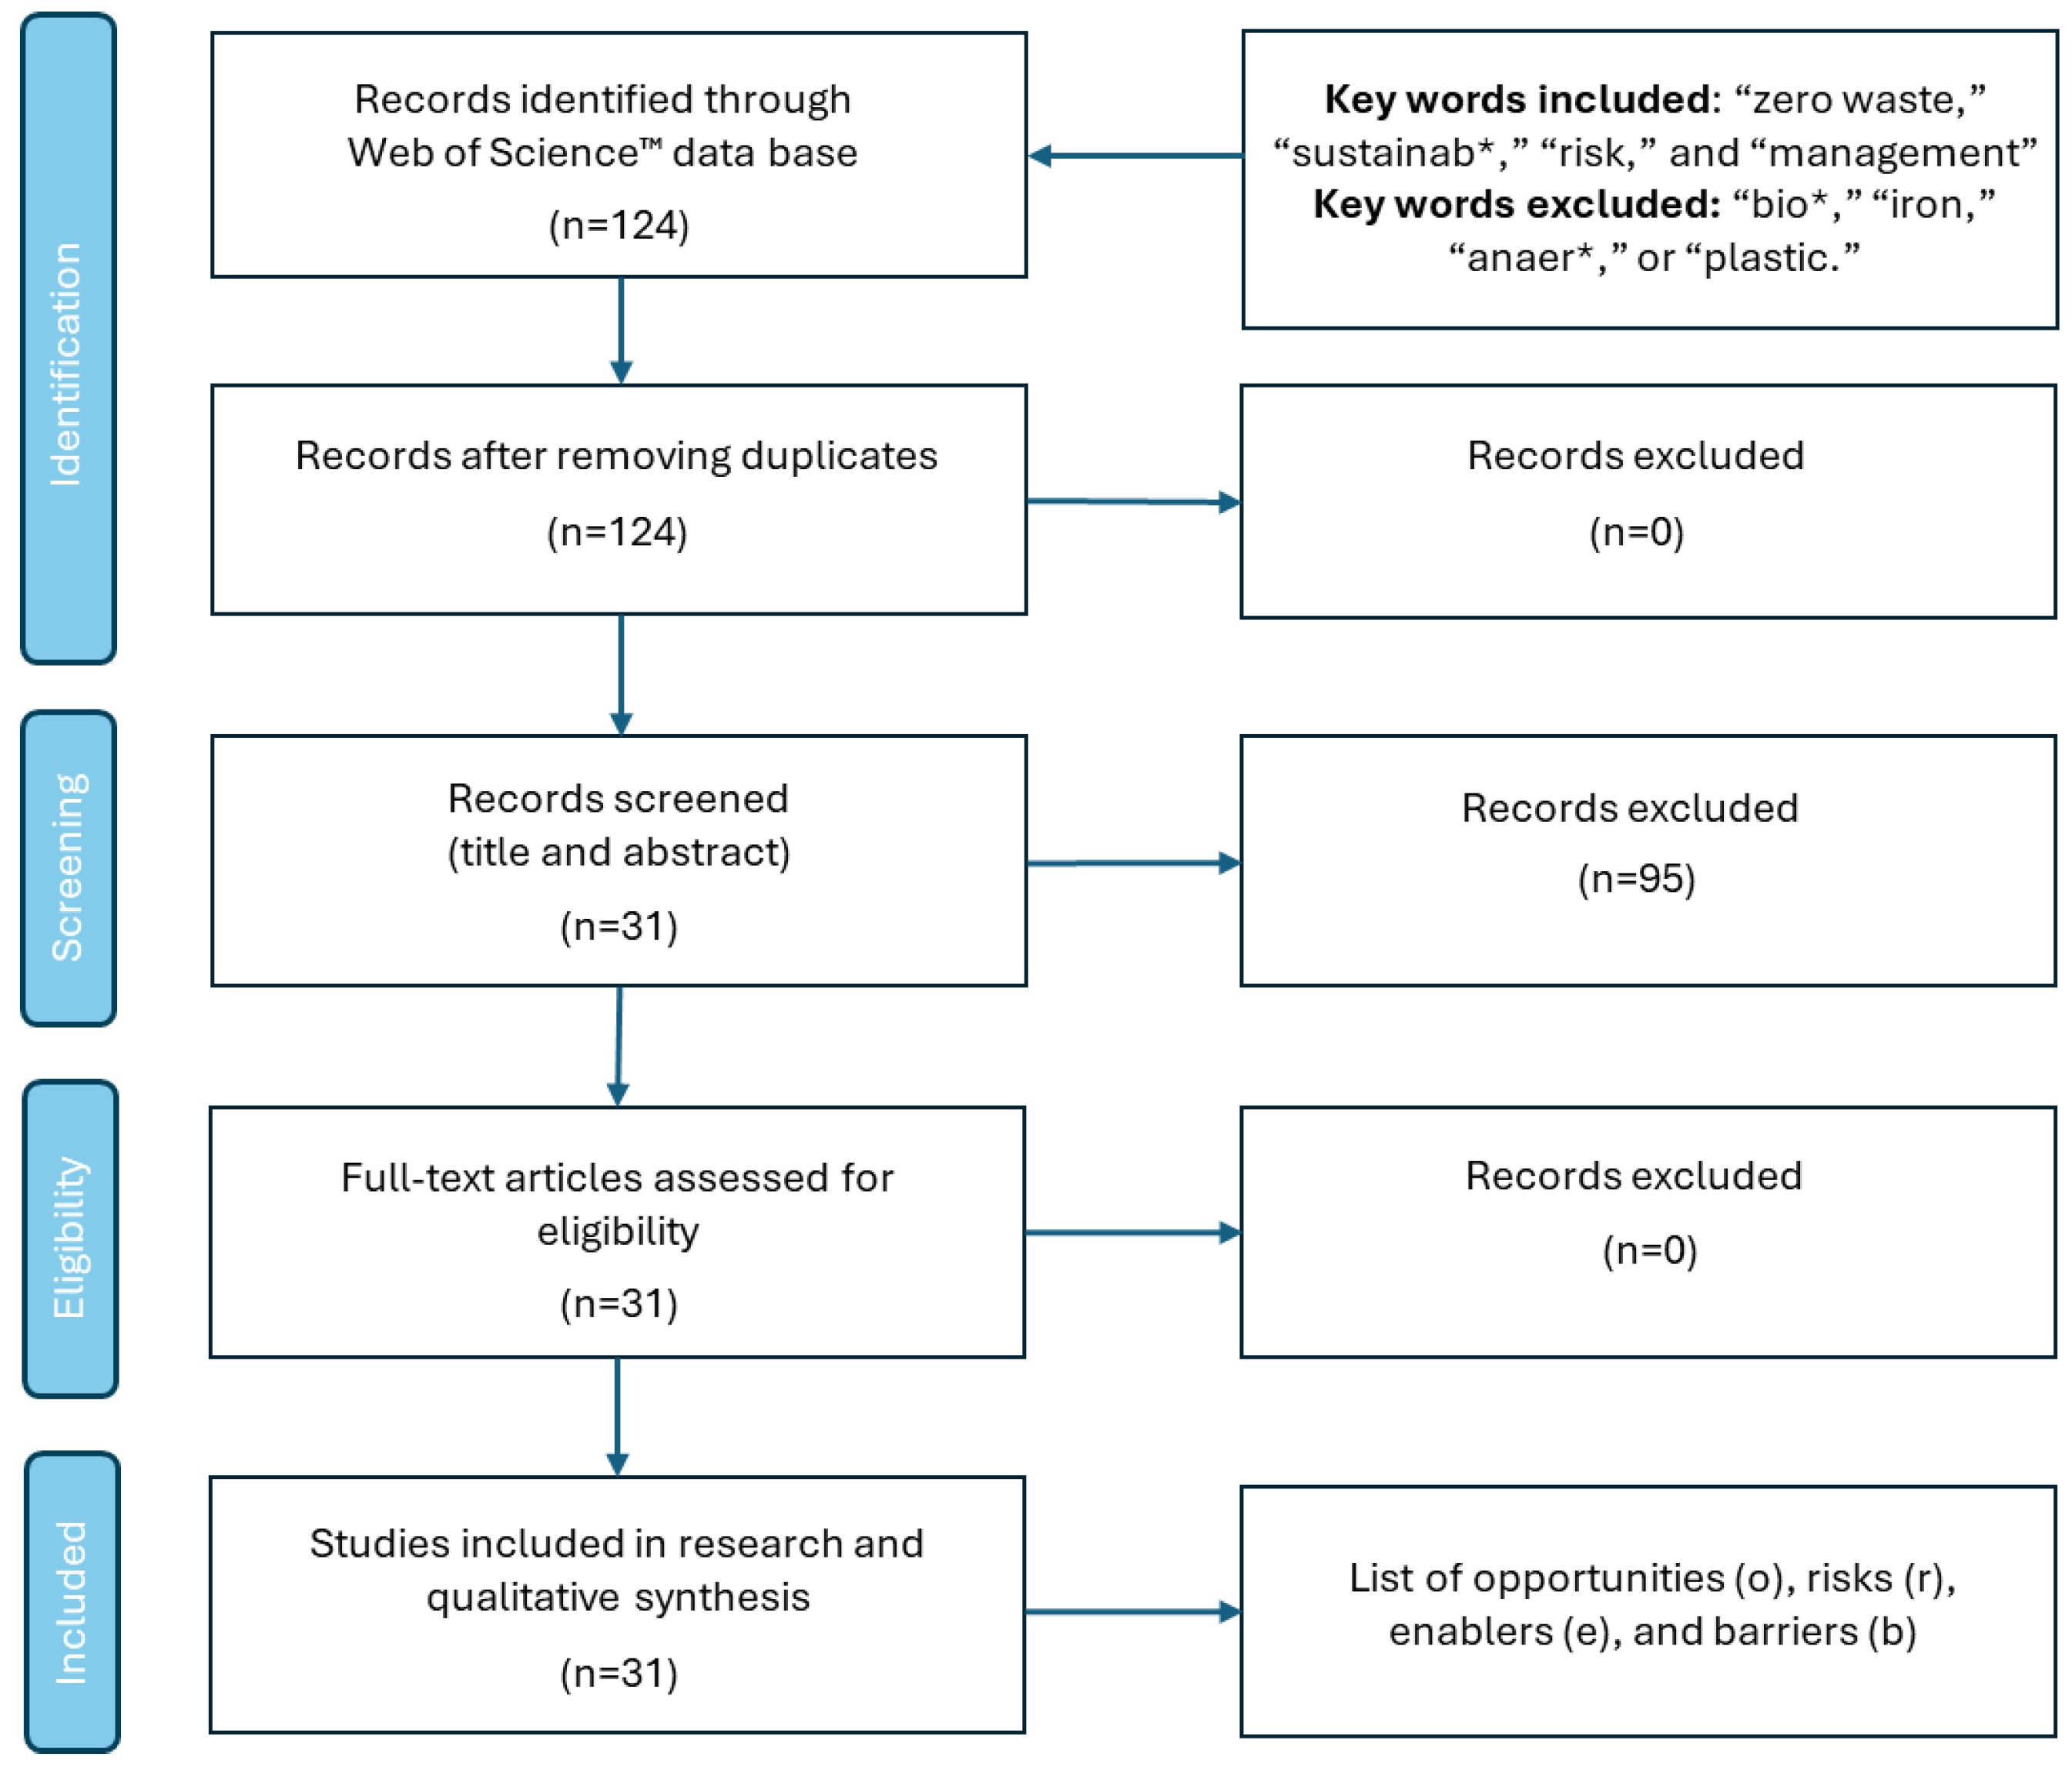
A structured literature review, see
Figure 1, was conducted to provide an item list of four relevant dimensions: company-related inside-out opportunities (o), risks (r), enablers (e), and barriers (b) of sustainable strategies. To capture linguistic variations, truncation was applied using the asterisk operator in Web of Science (e.g., sustainab*, bio*). This search syntax is standard in Web of Science and allows retrieval of all suffix variants of a word stem. All items were coded by frequency and thematic relevance. Every risk and opportunity is categorized into one of the three sustainability dimensions (economical, ecological, and environmental). Barriers and enabler items are sub-grouped into the five domains: strategic, operational, cultural, institutional, and technical-relevant item. This enables the reading of the results not only as content lists but as proxies for organizational capability and governance attention. Results partially build on earlier work by Rutrecht et al., 2023 [
15]. The resulting lists of items, opportunities (27 items), risks (21), barriers (32), and enablers (23), form the basis for stakeholder evaluation and both mapping approaches.
2.1.2. Stakeholder Survey
To contextualize the literature-based finding, a stakeholder survey was conducted, featuring a structured online questionnaire during a study-related project workshop. Overall, the survey engaged 26 participants from industry (n = 9), academia (n = 16), and regulatory institutions (n = 1), of which 21 took part at the workshop, with 5 taking place in a conference setting, at the Sardinia Symposium 2023. All participants had technical-scientific backgrounds and held mid- to senior-level management roles in battery production, recycling, or circular economy. The group was balanced in terms of age (25–54+) and gender (46% female, 54% male).
The questionnaire applies a funnel structure, progressing from general to specific assessments. In total, ten questions examine the stakeholder perspective of the four dimensions corresponding to the analytical categories of this study: opportunities (27 items), risks (21), barriers (32), and enablers (23), each derived from the literature review.
Respondents rated the items using five-point Likert-type scales (1 = very low to 5 = very high for barriers and enablers; 1 = low to 4 = critical for risks). Opportunities were assessed through a two-dimensional matrix distinguishing perceived impact (high, low) and implementation effort (high, low).
Stakeholders were also asked to select the top five most relevant opportunities, risks, barriers, and enablers in their own institutional settings to check for consistency in answering behavior. These rankings are used as well to surface practical salience and to triangulate aggregated scores with decision-facing priorities in organizations. To reduce selection bias, the list of answers is randomly ordered for each participant. A pre-test of the questionnaire was conducted to ensure clarity and resulted in an average completion time of 10 min.
Example items and aggregation logic are provided in
Table S2.1 (Supplementary Material S2) to illustrate the survey structure and ensure methodological transparency. In short, individual Likert responses were averaged at item level and aggregated into cumulative indices for each dimension. Internal consistency was verified using Cronbach’s α (see
Section 3.3) [
16]. In addition, Pearson’s correlation coefficient (r) was applied to quantify inter-item correlations. Thus, potential redundancy and the internal structure of responses are examined. Additional information beyond the basic result statement can be found at
Figures S2.1–S2.4 (Supplementary Materials S2).
2.2. Synthesis
Risk–opportunity mapping and barrier–intervention mapping are used to synthesize literature results and stakeholder insights of the survey.
2.2.1. Risk–Opportunity Mapping
The qualitative assessment of each risk item by a respondent is translated to a four-tier ordinal scale: low =1, moderate = 2, high = 3, and critical = 4. The individual scores are aggregated to calculate an overall criticality index (c), which categorizes risks as follows: critical (c > 50), high (45–49), moderate (40–44), or low (<40). The intervals from low to critical are deliberately chosen to distinguish between degrees of urgency. The choice is guided by the distribution of stakeholder scores but not derived from statistical percentiles or external precedent. Opportunities are evaluated using a two-dimensional matrix with perceived impact (high/low) and implementation effort (high/low) as axes, yielding four categories: low-hanging fruits (high impact, low effort), strategic leaps (high impact, high effort), incremental improvements (low impact, low effort), and money pits (low impact, high effort). Post hoc classification of risk origin (inside-out, outside-in, and dual) is used solely to interpret stakeholder ratings through the lens of double materiality in current reporting practice, not as a formal theory test.
2.2.2. Barrier–Intervention Mapping
Barrier–intervention mapping is applied to structure internal implementation constraints and derive targeted mitigation strategies. Barriers and enablers are rated on a five-point ordinal scale: 0 = none, 1 = minor, …, 4 = very high. For each item, stakeholder responses are aggregated to calculate a weighted score representing the average disabling or enabling effect of each item. Based on these cumulative scores, barriers are grouped as very high (sb > 50), high (sb = 45–50), moderate (sb = 40–44), low (sb = 36–40), or very low (sb < 36). Following the same logic, enablers are grouped: very high (se > 66), high (se = 61–65), moderate (se = 56–60), low (se = 51–55), and very low (se < 50). The choice of thresholds for each group was made deliberately by the authors to support meaningful discussion across distinct levels of perceived hindrance or support. It was guided by distribution of stakeholder scores but not derived from statistical percentiles or external precedent.
In contrast to earlier qualitative transition mappings, we introduce a quantitative weighting procedure that operationalizes stakeholder perceptions and yields replicable and comparable priority scores for enabler–barrier pairs in the form of a barrier–intervention heatmap. To do so, the following scoring logic, given in Equation (1), is applied. Each and every enabler–barrier pair is assessed and assigned with a basic score of the expected positive effect by the authors: 2 = strong positive effect, 1 = tentative positive effect, and 0 = no expected effect. Then, the qualitative score is multiplied by the aggregated stakeholder-derived weight (low = 1 to critical = 5) of the enabling score
sb and
se. According to this calculation, scores always range between 0 and 50, with 50 representing the maximum value and the highest priority. The combined results yield a priority-ranked barrier–intervention heatmap, incorporating both weighted scores of perceived relevance and estimated leverage. Because the basic score (0, 1, and 2) reflects authorial judgment, we document the scoring scheme in the
Supplementary Materials S2 and carry this interpretive choice forward into the limitations of the method to maintain transparency.
Table 1 illustrates the application of the weighing logic using Equation (1).
Each and every enabler–barrier pair is assessed and assigned with a basic score of the expected positive effect by the authors: 2 = strong positive effect, 1 = tentative positive effect, and 0 = no expected effect. Then, the qualitative score is multiplied by the aggregated stakeholder-derived weight (low = 1 to critical = 5) of the enabling score
sb and
se. According to this calculation, scores always range between 0 and 50, with 50 representing the maximum value and the highest priority. The combined results yield a priority-ranked barrier–intervention heatmap, incorporating both weighted scores of perceived relevance and estimated leverage. Because the basic score (0, 1, and 2) reflects authorial judgment, we document the scoring scheme in the
Supplementary Materials S2 and carry this interpretive choice forward into the limitations of the method to maintain transparency.
2.2.3. Roadmap
Finally, a mixed-method approach is applied to formulate a roadmap, to translate stakeholder insights into actionable strategies towards sustainable business practices. Interventions are developed by triangulating: (a) literature results, (b) expert input from the stakeholder survey, and (c) authorial synthesis including an indicative timeline (short- to long-term).
3. Results
3.1. Literature Results
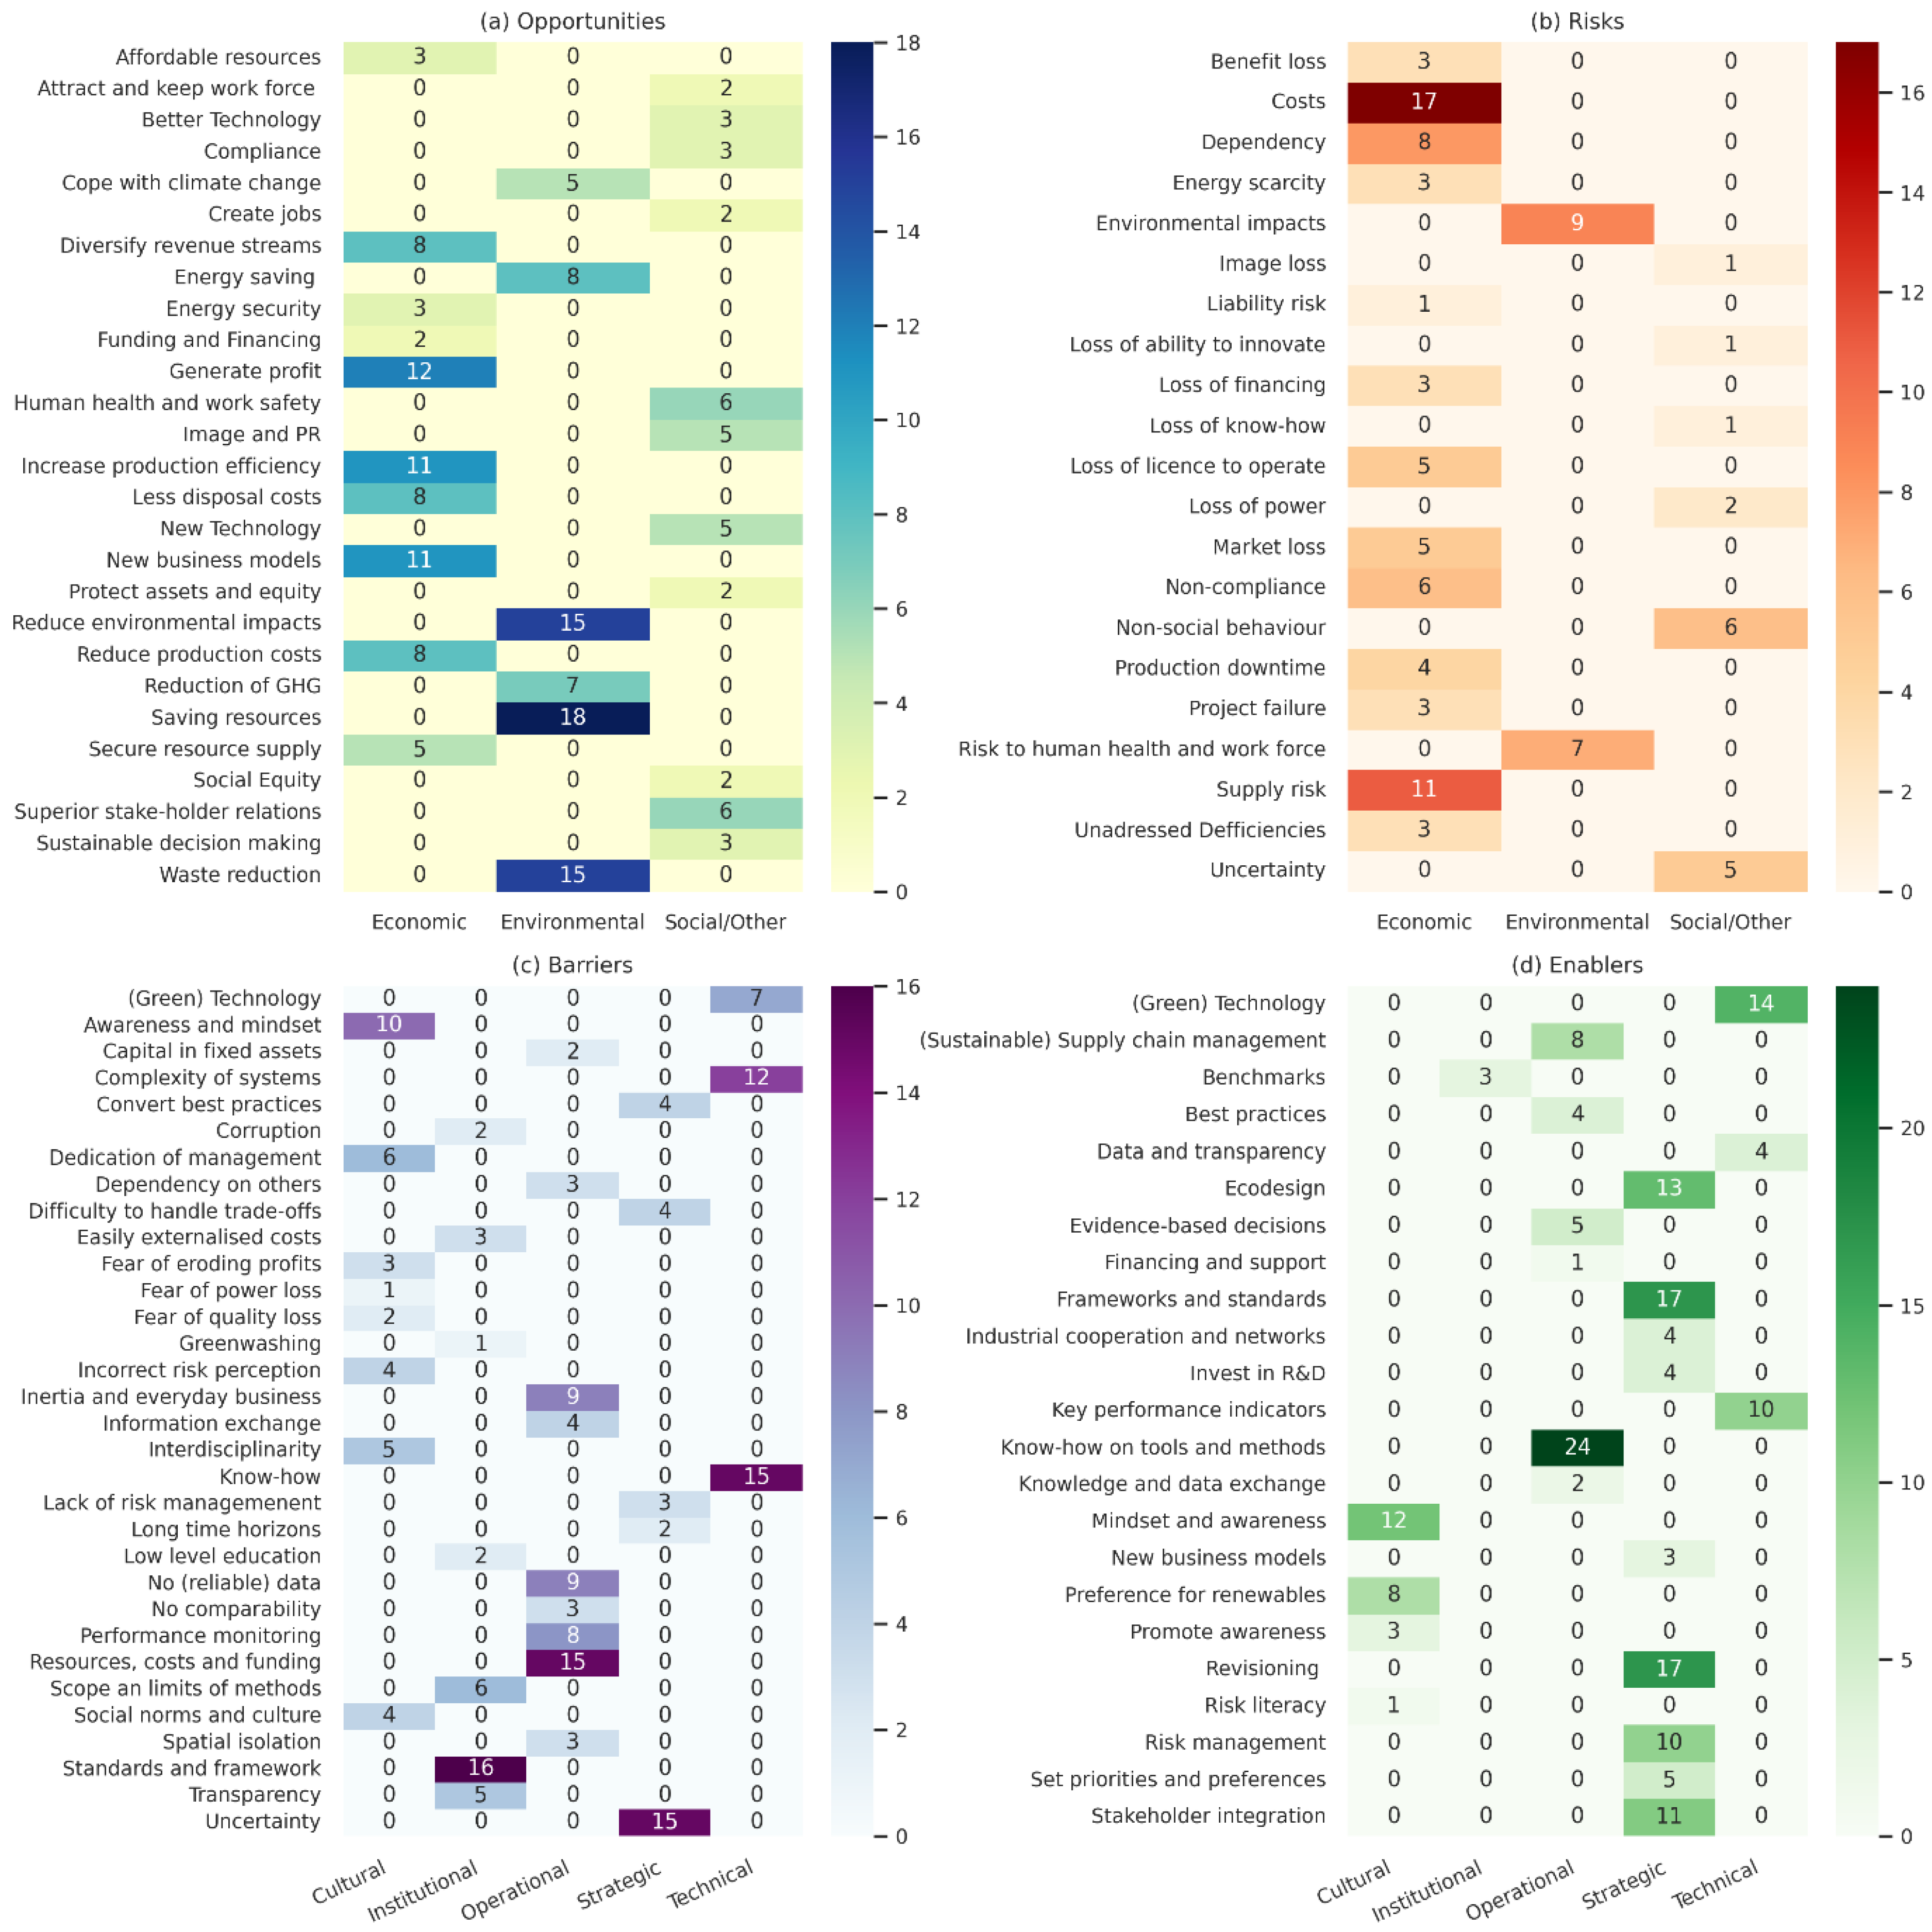
The structured literature review revealed 27 opportunities, 21 risks, 32 internal barriers, and 23 enablers (
Figure 2). Opportunities are most frequently linked to economic (41.8%) and environmental (38.1%) benefits, whereas risks are predominantly framed in economic terms (66.2%), with social (21.8%) and environmental (12.0%) aspects discussed less often. Below, key thematic clusters were synthesized per category to illustrate the main mechanisms emphasized across literature.
3.1.1. Chances of Embracing Sustainability
Across studies, three clusters dominate opportunities linked to sustainability (
Figure 2a).
First, environmental efficiency is consistently highlighted by realizing resource savings (cited in 18 sources), waste reduction (15), and reduced environmental impacts (15). Second, economic performance and business resilience appears as a core theme, including profit generation (12), new business models (11), and increased production efficiency (11). Third, technological innovation features through adoption of new or better technologies (5 and 3, respectively) and lower disposal-related costs (8). Social and governance-related opportunities, such as social equity (2), job creation (2), and sustainable decision-making (3), are discussed far less frequently.
Mechanistically, the literature described several pathways through which firms may realize given opportunities. Productivity and efficiency gains were implemented via more efficient technologies, minimized resource and energy consumption, reduced waste generation, and avoided levies or taxes associated with emissions and disposal; improvements in occupational safety can further diminish downtime and indirect costs. New or diversified revenue streams were realized through product take-back and repair, rental or service-based models, and industrial symbiosis that monetizes by-products as secondary inputs. Enhanced resilience against market and supply volatility was strengthened through energy- and resource-security strategies, portfolio diversification, and workforce attraction/retention supported by improved working conditions.
Literature provided a rich background highlighting the chances of achieving sustainability. The following studies give a broad overview [
15,
16,
17,
18,
19].
3.1.2. Risks of Abandoning Sustainability
Companies that fail to exploit the potential of sustainability may enjoy short-term profits, for example, through externalized environmental costs (source: externalized costs) but in the medium- to long-term perspective they will face serious challenges (
Figure 2b). Three clusters structured the literature-derived risk landscape. The first is
operational and financial fragility, including increasing costs (17 sources), supply chain failure (11), and dependency on critical inputs (8). The second
concerns regulatory and institutional uncertainty, with non-compliance (6), general policy uncertainty (5), and loss of license to operate (5). The third encompasses
environmental and social risks, most commonly environmental impacts (9), risks to human health and workforce (7), and non-social or irresponsible behavior (6). Downstream financial consequences such as loss of financing and project failure (each 3) were repeatedly described as outcomes of internal and external misalignments.
The literature detailed several reinforcing mechanisms, of which four stand out in particular: First, profit erosion through inefficiencies (high material and energy intensity), elevated waste and emissions, and associated taxes/levies; reputational damage can further depress sales and pricing power. Second, threats to company value via unplanned downtime, asset under-maintenance, and workplace accidents or illnesses; coupled with reputational loss, these dynamics impair recruitment and retention. Thirdly, loss of competitiveness when firms fail to meet evolving standards, procurement requirements, or financing criteria, and when the outflow of skilled personnel undermines innovation capacity. And finally, legal exposure via liability for environmental or health damages and, in the extreme, loss of the license to operate.
A double-materiality logic was implicit in many accounts: inside-out risks (e.g., emissions, safety lapses, knowledge attrition) can trigger outside-in pressures (e.g., sanctions, financing constraints, market backlash). This coupling reinforces the need for integrated risk management that spans operational performance, regulatory compliance, and social legitimacy. Selected key studies [
15,
17,
18,
20,
21,
22,
23,
24] provide a good overview of the subject.
3.1.3. Organizational Levers and Constraints
The literature showed an asymmetry: enablers were broadly cataloged, yet granular discussion of how they overcome specific barriers is rarer. Most frequently cited enablers (
Figure 2d) included know-how on tools and methods (18 publications), data and knowledge exchange (17), frameworks and standards (17), and industry-wide collaboration and networks (14). These were followed by (green) technology (14), process transparency (13), financing and resources (10), and research and development (R&D) investment (10). Cultural enablers, stakeholder integration (12), and management mindset (11) appeared less frequently but featured prominently in conceptual debates on implementation.
On the barrier side, the most frequently discussed obstacles (
Figure 2c) were lack of reliable data (16), resource and funding constraints (15), and system complexity (12). Additional barriers included limited methodological scope (9), organizational inertia (9), and insufficient risk management structures (6). Soft barriers (e.g., social norms, limited management dedication) were less visible in counts but may carry outsized practical influence.
Across literature, four cross-cutting mechanisms recurred. They revolved around
data deficits,
funding constraints,
perception of complexity and
know-how gaps. When addressing data deficits, manual collection, inconsistent metrics, and poor traceability came into play. They undermined the credibility and usefulness of management in general, and sustainability tools in particular. Secondly, funding constraints, which were especially salient for small to medium enterprises, limit investment in digital infrastructure, training, and R&D, slowing or even inhibiting capability buildup. Thirdly, the perceived and actual complexity of the subject and handling the multitude of tools and standards while addressing sometimes conflicting needs of stakeholders, was said to create cognitive overload and decision paralysis when sustainability is treated as an add-on rather than embedded practice. And last but not least, know-how gaps, ranging from meaningful tool selection to result interpretation, diminished internal legitimacy and lead to misapplication or superficial compliance. The enabler set corresponded to these deficits: standards and data governance responded to information gaps; collaboration and networks addressed fragmentation; research and development of green technologies targeted technical bottlenecks; and training and leadership commitment built absorptive capacity. Yet the literature provided fewer concrete pairings of enablers to specific barrier constellations, an evidence gap that the stakeholder-derived barrier–intervention mapping in
Section 3.4.2 begins to close. Key publications in this area are as follows: [
15,
17,
18,
21,
22]. Broader contextual insights are provided by [
25,
26,
27]. Additional institutional and cross-sectoral perspectives are offered by [
16,
28].
3.2. Stakeholder Survey
The internal coherence of the questionnaire was assessed using Cronbach’s α, yielding values of approximately 0.99 across all item sets. This result indicated very strong internal correlation among items and therefore motivated additional analyses of inter-item relationships and dimensional differentiation (see
Section 4.6 for discussion).
3.3. Risk–Opportunity Mapping
Evaluation of the answers of the stakeholder survey revealed the following insights.
3.3.1. Validated Opportunities
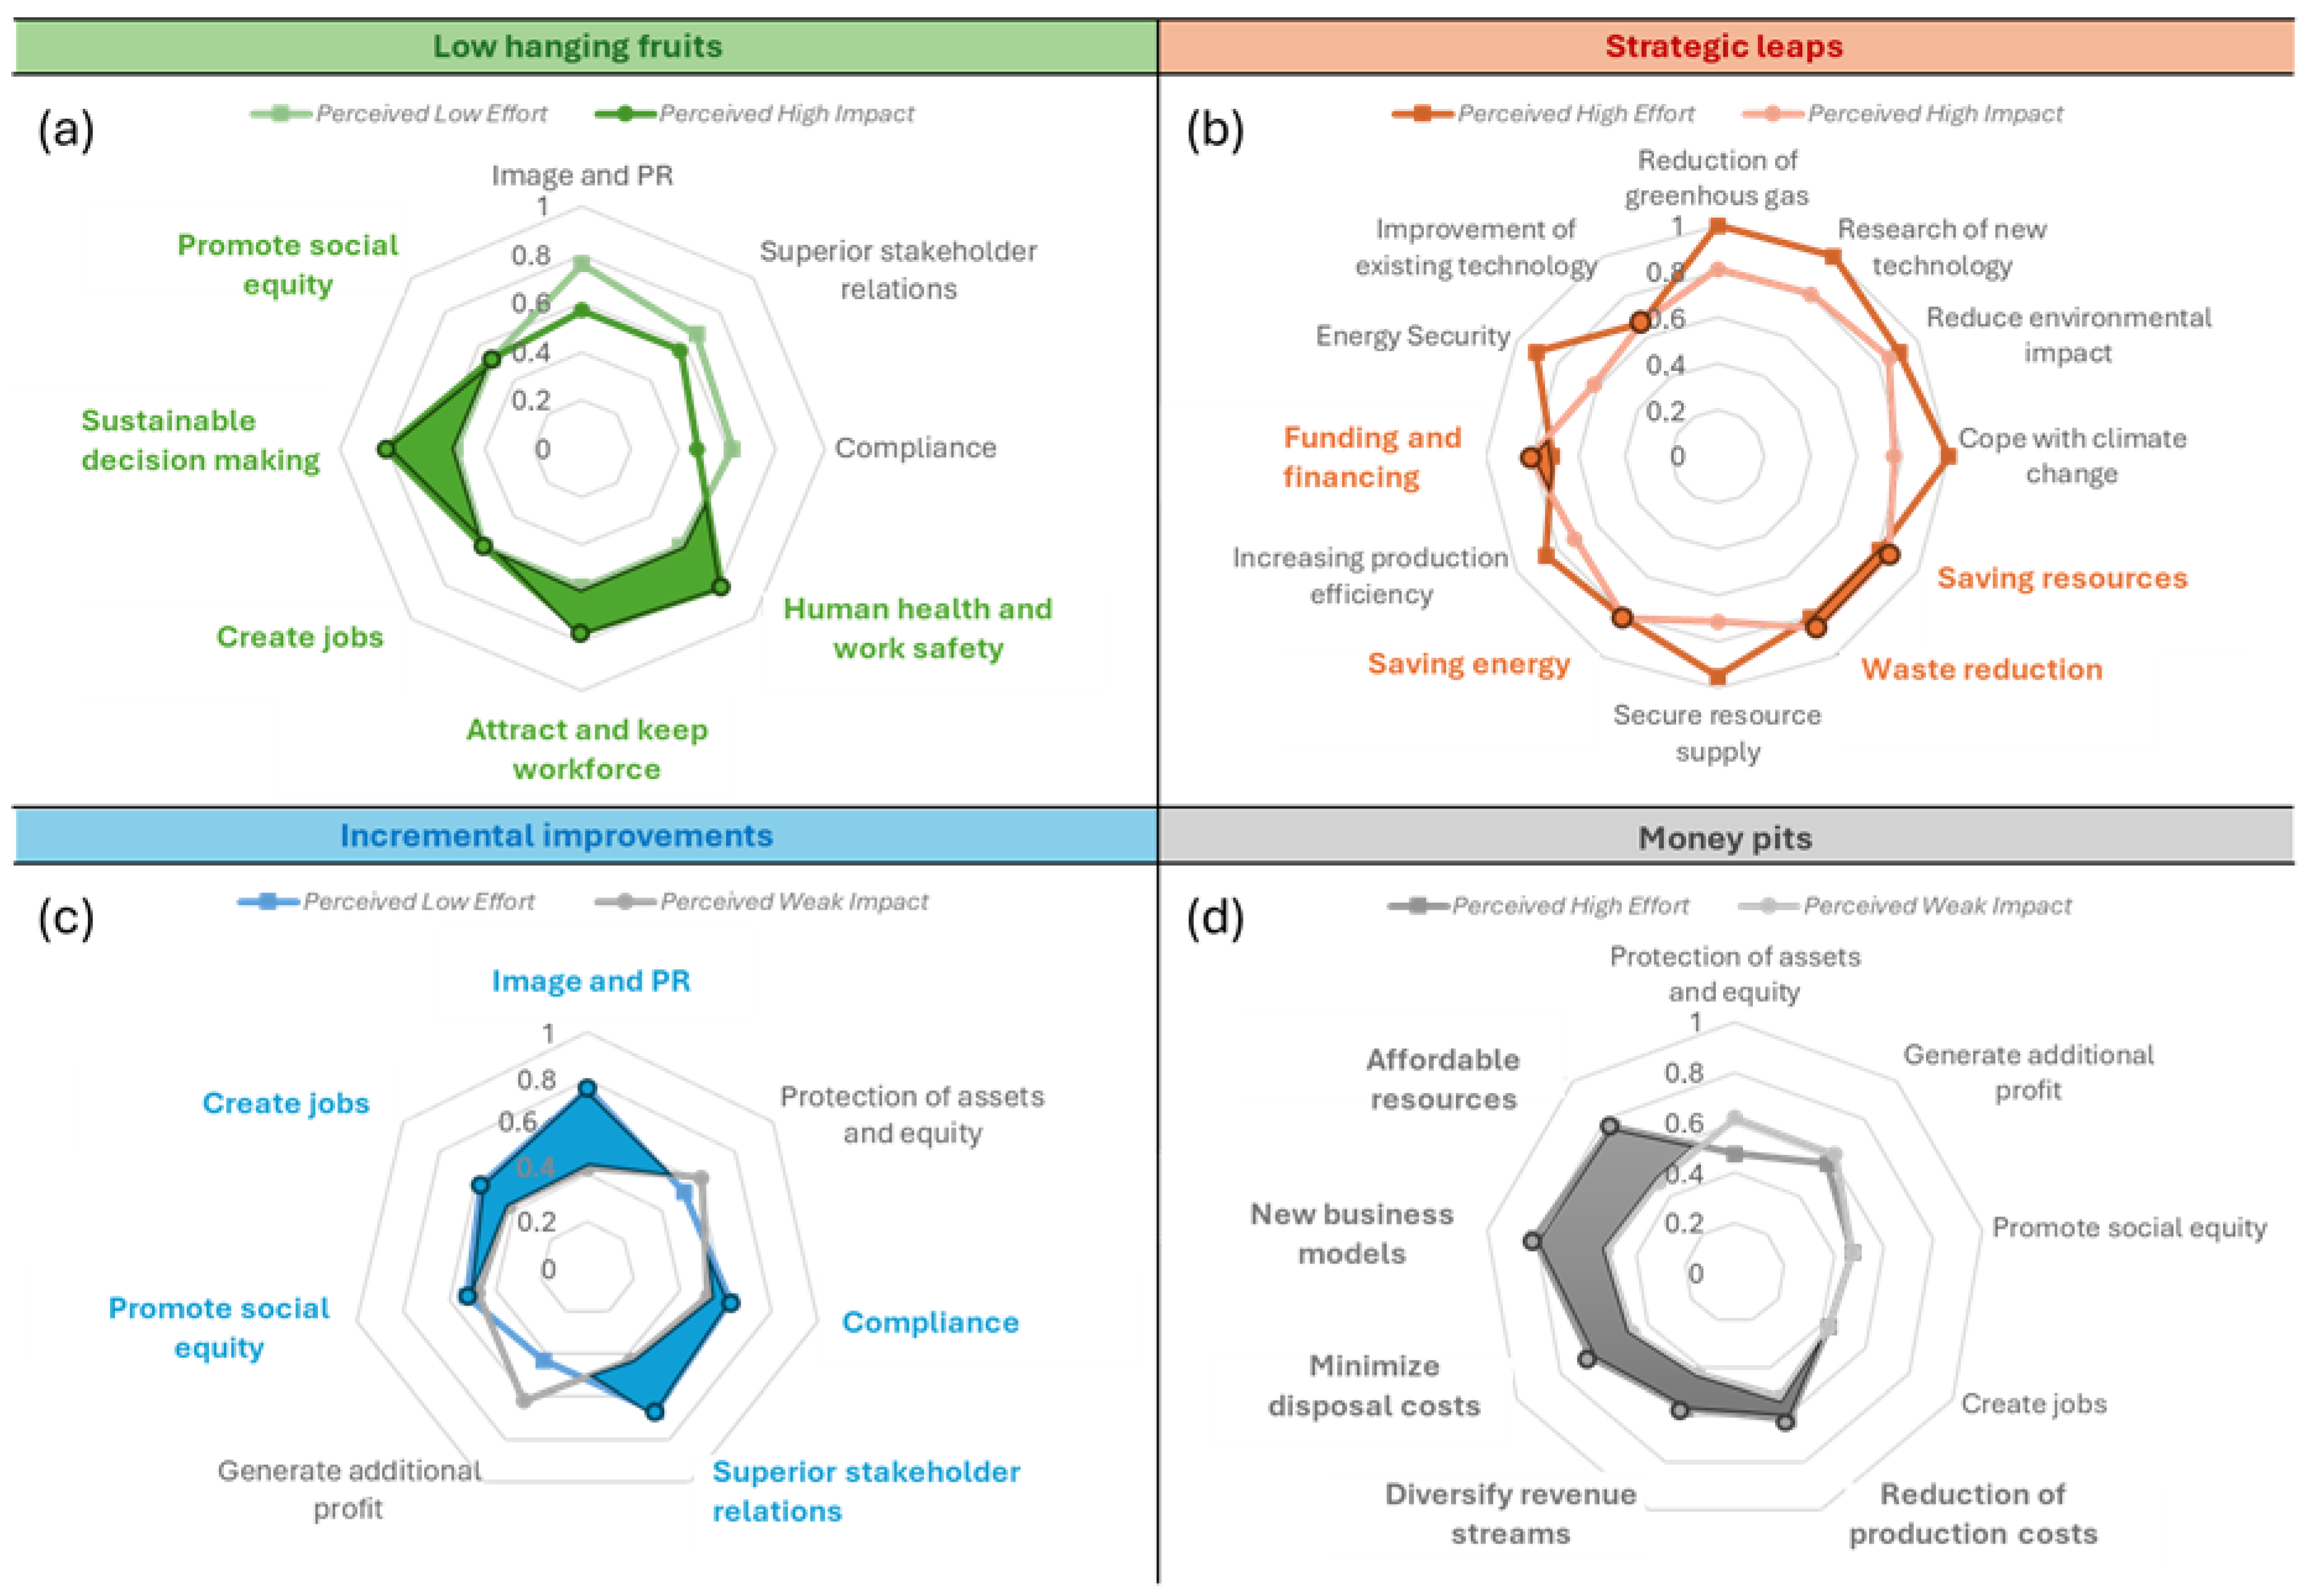
According to the method, four distinct categories were derived (
Figure 3). Incremental improvements (
Figure 3c) reflected opportunities like social equity, job creation, and basic PR measures. Although recognized, these were not rated as transformative opportunities. Low-hanging fruits (
Figure 3a) included domains such as the implementation of human health and work safety, attracting and keeping workforce, creating jobs, sustainable decision-making, and promoting social equity.
Despite being linked with low effort, image and public relations (PR), superior stakeholder relations and compliance were seen as less impactful. Items categorized as strategic leaps (
Figure 3b) were perceived by stakeholders as core levers for transformative change, albeit requiring substantial resources. In particular, greenhouse gas reduction was unanimously considered to demand significant effort; nonetheless, measures in this domain were attributed the highest effectiveness. The same applied to the research and development of new technologies, the mitigation of negative environmental impacts, the safeguarding of resource supply, and climate change adaptation. Certain entries, such as resource conservation, waste reduction, saving energy, funding and resource provision, and the experimental advancement of existing technologies, stood out as particularly attractive. For these items, stakeholders anticipated considerably higher benefits than the associated implementation efforts would suggest. Other items were assessed as money pits (
Figure 3d), where the effort was expected to be high and linked to perceived weak impact. For instance, procurement of affordable resources, new business models and minimizing disposal costs received moderate attention but were deprioritized due to poor perceived returns relative to effort.
The top five opportunities selected by stakeholders as most feasible within their own institutional context were as follows: research of new technologies (16 mentions out of a total of 26), workforce attraction and retention (10), improvement of existing technologies (10), waste reduction (10), and greenhouse gas reduction (8).
3.3.2. Consolidated Risk Landscape
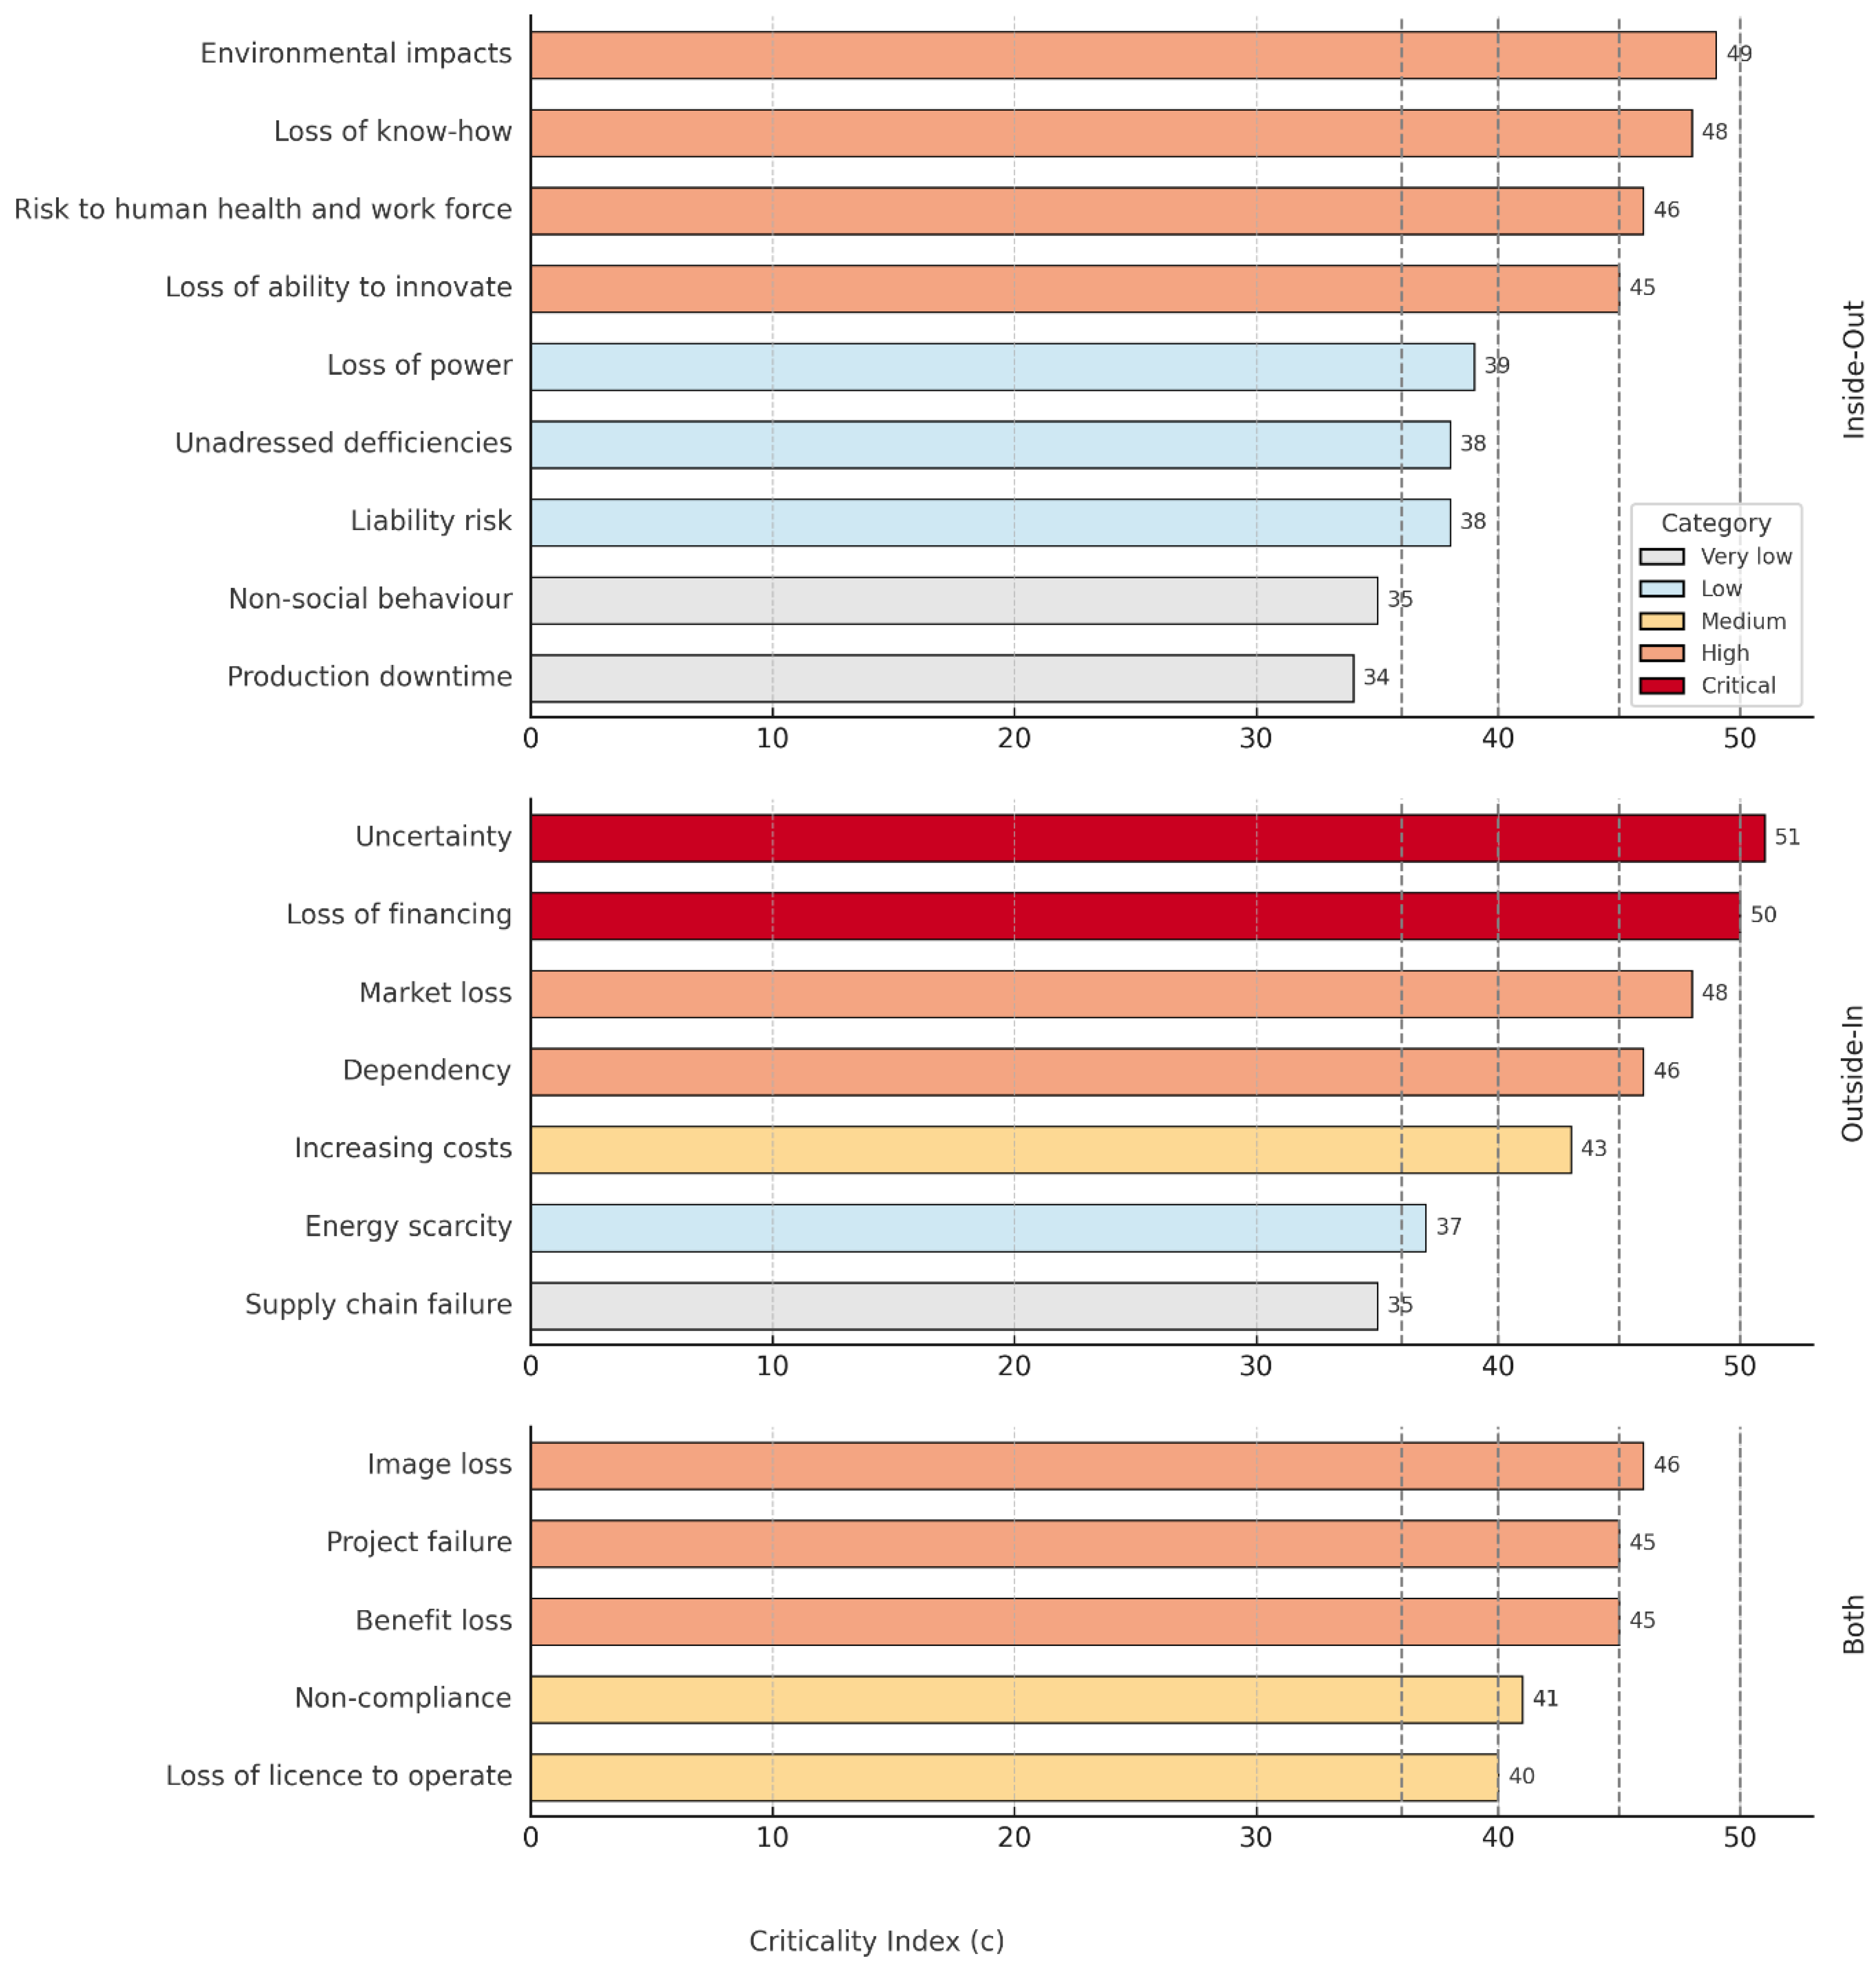
Figure 4 gives an overview of the results of the risk assessment by the stakeholders, displaying a ranked order by the aggregated criticality index c. The highest-rated risk was regulatory uncertainty (c = 51), followed by loss of financing (c = 50) and environmental impacts (c = 49). Other high-risk items include market loss and loss of know-how (each c = 48), image loss, dependency, and health and workforce risks (c = 46), as well as project failure, benefit loss, and loss of innovation capacity (c = 45). In contrast, risks such as production downtime, non-social behavior, supply chain failure, and liability risk were rated with lower criticality (c < 40), suggesting they were considered more manageable under current conditions.
The stakeholder-specific prioritizations closely mirrored the scoring results which reinforce the robustness of the overall risk landscape. The top five items were, in a top-down order, loss of financing (16 mentions out of a total of 26), loss of know-how (14), project failure (13), loss of ability to innovate (13), and image loss (11).
3.4. Barrier–Intervention Mapping
3.4.1. Barrier and Enabler Assessment
The result of the barrier and enabler assessment are summarized in
Table 2. Because
Table 2 consolidates multiple variables (literature frequency, survey salience, qualitative assignment and final stakeholder weighting score), an explicit reading note is provided: higher “s
e” values indicate stronger perceived enabling effects, whereas “Literature (qual.)” reflects thematic salience in the academic corpus. Divergences between both columns highlight survey-literature gaps that inform the subsequent heatmap analysis.
Four items formed a structural core of constraints perceived as the primary impediments to sustainability integration in LIB recycling. Those were namely the lack of resources and funding (sb = 56), followed by the absence of (reliable) data and systemic complexity (each 55), and a lack of methodological know-how (53). Additional high-ranking barriers (45–47) included limited transparency of processes, difficulties in method application, and limited access to green technologies, reflecting concerns about both technical readiness and strategic orientation. Moderately scored barriers (40–44) included organizational inertia, long planning horizons, and missing benchmarks. Some items consistently ranked lower (score < 40), such as corruption, social norms, or power dynamics, and were considered less relevant in the LIB recycling context.
Stakeholder-specific rankings confirmed the salience of the top barriers: lack of funding (13 mentions out of a total of 26 possible), data deficits (10), complexity (9), and greenwashing or organizational inertia (7–8). The close alignment between aggregate scores and contextual top five prioritization suggests that these barriers are cross-cutting and widely acknowledged.
The enabler analysis revealed a concentrated set of high-leverage factors. Investments in R&D and (green) technology in particular ranked highest (each se = 83), followed by methodological know-how (78), industry collaboration (75), and financing and resources (73). Other strongly rated enablers (64–71) included the use of renewable inputs, harmonized standards, and the establishment of process transparency. Mid-tier enablers (60–63) were the use of key performance indicators (KPIs), internal knowledge sharing, defined sustainability policies or revisioning of existing processes. New business models, benchmarks, risk management, risk literacy, and stakeholder integration scored lower but were still viewed positively.
Stakeholders most frequently selected the following enablers in their own institutions as tentatively most helpful: management mindset (11 mentions out of a total of 26 possible), R&D investment (10), expert know-how (9), implementation of green technologies, going for renewables, and dedicated financing and resources (each 8), followed by internal knowledge exchange (7) and inter-firm cooperation (6).
3.4.2. Barrier–Intervention Mapping
The complete barrier-enabler combination matrix used for the calculation of the heatmap is provided in
Tables S2.3 and S2.4 (Supplementary Materials S2) for full transparency. Only the top ten barriers and their corresponding interventions are summarized in
Table 3 to facilitate readability.
Aggregating the expected effectiveness of enabling effects across all barriers yielded the following rank-ordered list: know-how on tools and methods (score: 675), financing and resources and establishment of frameworks and standards (both 560), industry-wide cooperation and networks (555), and investment in research and development (480). Enablers that were perceived as highly effective generally act across multiple barriers simultaneously. This implies that enabling factors are not limited to one barrier but often provide leverage in several domains at once. When looking at the most critical barrier items individually (
Table 2), the following intervention patterns emerge.
Unsurprisingly, financing and resources (score: 50) was ranked as the most decisive enabler to overcome the lack of resources. However, know-how on tools and methods (50) was also perceived as effective, for example, as a supportive trait of funding applications or to uncover alternative financing mechanisms. Additional relevant measures included management mindset and awareness (40), revisioning of processes (40), industrial cooperation and networks (25), evidence-based decision-making (20), risk management systems (15), and new business models (15).
Stakeholders emphasized frameworks and standards (50), know-how on tools and methods (50), industry-wide cooperation and networks (50), and knowledge and data exchange (40) as highly valuable enablers. Further supporting measures were process transparency (40), key performance indicators (40), sustainability policies with set priorities (40), and investment in research and development (50).
This barrier closely reflects the systemic challenges of complexity. However, stakeholders rated financing and resources (50) and revisioning of processes (40) as particularly effective in enabling reliable data collection.
The same top enablers were considered decisively for this barrier: frameworks and standards, financing and resources, industry-wide cooperation and networks, and investment in research and development (all 50). They were complemented by internal knowledge and data exchange (40) and best practice implementation (30). Cultural and institutional factors such as sustainability policies, management and employee awareness, and process transparency (all 20) were viewed as less effective but still positively associated.
4. Discussion
4.1. Opportunity Mapping
The opportunity mapping indicates that stakeholder perceptions are shaped by a pragmatic evaluation of what is feasible under current resource, knowledge, and institutional conditions. This results in a strong emphasis on technologically grounded and environmentally oriented opportunities, while options requiring organizational or business-model transformation receive comparatively lower attention.
Stakeholders identify high-impact, high-effort opportunities—such as greenhouse gas reduction, R&D of new technologies, mitigation of environmental impact, climate adaptation, and securing resources and energy supply—as the most consequential levers for long-term sustainability. This focus aligns well with the literature, which equally highlights environmental-efficiency gains, waste and resource reduction, and production-efficiency improvements as core levers of sustainable transformation [
17,
18,
21,
23,
26,
27,
29].
In contrast, economic and business-model opportunities are judged with greater caution. While academic work frequently positioned new business models and diversified revenue streams and asset protection as key enablers in circular economy transitions [
16,
17,
28,
30,
31,
32,
33,
34,
35,
36], stakeholders rated them lower, categorizing them as “money pits”. This skepticism likely reflects perceived implementation barriers: Tight financial margins, regulatory volatility, short planning horizons, and organizational inertia constrain the perceived feasibility of such options, even when their strategic relevance is acknowledged.
A similar discrepancy emerges from management-oriented and socio-organizational opportunities. The literature underlined the value of compliance, occupational safety, stakeholder relations, and communication measures [
15,
16,
23,
28], yet practitioners tend to categorize them as incremental rather than transformative. These measures are routinely practiced but are not regarded as decisive levers for advancing sustainability transitions. Finally, the low prioritization of risk management and risk literacy underscores the practical focus of the stakeholder perspective. Despite its prominence in governance and decision-making literature [
22,
37,
38] it is not viewed as an immediate opportunity with strong transformative potential, further illustrating the overall feasibility-driven orientation of respondents.
4.2. Risk Landscape
Stakeholders’ risk assessments largely confirm the literature’s emphasis on financial fragility, regulatory uncertainty, and knowledge loss as critical threats to sustainable transitions [
15,
19,
20,
22,
31].
Referring to
Figure 4, a notable result is the strong focus on outside-in risks, particularly regulatory uncertainty and loss of financing. These pressures originate largely from the policy environment, markets, and financial systems. In contrast, several internally generated risks that are frequently highlighted in research, such as rising costs, supply chain disruptions, or energy scarcity [
15,
33,
34,
39], were perceived as less critical. This discrepancy is likely influenced by the academic-leaning composition of the sample, which may reduce direct exposure to financial volatility and supply chain risk.
Dual risks, such as loss of know-how, project failure, and image loss, feature prominently. These items lie at the intersection of internal weaknesses and external exposure, illustrating the practical relevance of the double-materiality perspective emphasized in sustainability reporting frameworks [
40,
41]. Inefficiencies or knowledge gaps within organizations can rapidly trigger regulatory sanctions, reputational damage, or financial losses.
By contrast, inside-out risks, including environmental impacts, human health impacts, and loss of innovation capacity, were recognized but received lower prioritization than expected based on the literature [
19,
25]. This may indicate an underestimation of organizations’ own risk-generating potential or a perceived ability to manage these risks internally.
Taken together, the risk landscape reflects a system where stakeholders are primarily concerned with external volatility and compound vulnerabilities. Literature underscores that such risks require integrated risk management strategies, energy- and resource-security measures, and workforce-stability efforts [
20,
26,
32,
33,
34,
37]. Strengthening risk literacy emerges as a relevant, yet still underappreciated, factor for building organizational resilience.
4.3. Enabler and Barrier Assessment
The comparison of enablers and barriers between literature findings and stakeholder survey results shows both substantial overlap and meaningful discrepancies. At first glance, sustainable progress appears less a question of technical feasibility than of strategic and institutional alignment. Across both sources, the most critical barriers are reliable data, system complexity, and methodological know-how deficits [
15,
23,
37] and were equally emphasized in the stakeholder rankings. These structural impediments reflect the central challenges of operationalizing sustainability in LIB recycling and can be generalized for any industrial process characterized by heterogeneous feedstock, variable process conditions, and evolving regulatory demands.
Yet this perspective captures only part of the challenge. The barrier landscape is driven by complex system dynamics and interdependencies, which influence how individual barriers reinforce each other and how enabling conditions need to be sequenced. These dynamics underline the multi-faceted nature of sustainability implementation in LIB recycling.
On the enabler side, both sources underscore the importance of methodological competence, standards and frameworks, process transparency (KPIs), and collaboration mechanisms (supply chain management) as key preconditions for advancing sustainability [
17,
19,
28,
32,
34,
38,
39,
42,
43].
Discrepancies arise mainly in the weighing of institutional, cultural, and governance-oriented enablers. The literature attributes high importance to stakeholder integration, industrial cooperation, and institutional pressure [
16,
17,
28,
35] whereas stakeholders prioritize enablers that are more resource-intensive but directly actionable, such as R&D investments, green technology, and financial support. This reflects a pragmatic orientation: practitioners emphasize what they can control internally, while scholars stress the broader social and institutional conditions needed for long-term transition legitimacy.
Stakeholder ratings also assign lower importance to uncertainty and organizational inertia than suggested by the literature [
16,
21,
22,
35]. While these dynamics are known to slow sustainability transitions, stakeholders appear more concerned with tangible barriers, such as access to funding, data limitations, or methodological competence.
Overall, the analysis shows that while structural bottlenecks are acknowledged universally, practitioners and scholars differ in how they view institutional and cultural drivers. Bridging this gap requires attention to both the technical prerequisites for action and the organizational governance mechanisms that support sustained implementation.
4.4. Barrier-Intervention Mapping
The barrier–intervention mapping in
Table 3 demonstrates that enablers function as cross-cutting accelerators rather than isolated solutions. Highly ranked items such as methodological know-how, financing, standards, industry cooperation, and R&D tend to support multiple barriers simultaneously and deliver spillover benefits beyond their primary scope. This systemic effect confirms findings in sustainability-transition literature that emphasize interconnected capability building rather than single fixes. Compared with socio-technical transition and stakeholder-assessment frameworks, our approach adds an operational layer by linking perceived hindrances to quantified intervention leverage. The combination of empirical weighting and cross-domain mapping improves transparency and supports transferable decision guidance for practitioners and researchers alike.
A second key insight is the sequencing of enablers. Stakeholders implicitly describe a chain of dependencies:
Resources enable organizations to build
Data infrastructure, which support
Know-how development, which in turn helps to
Reduce system complexity.
Such linkages can also lead to circular dependencies. Companies often need resources to collect and process data, but reliable data is required to justify resource allocation in the first place. This creates a feedback loop that can stall implementation, reinforcing the impression of sustainability as a costly and overly complex undertaking. Similar loops exist between complexity reduction and methodological competence.
As a result, interventions should not be designed as one-off countermeasures but as strategically sequenced steps that acknowledge feedback loops and build organizational maturity. Early emphasis must therefore lie on financial governance and capacity building to unlock subsequent action on data, process optimization, and complexity reduction.
4.5. From Map to Roadmap
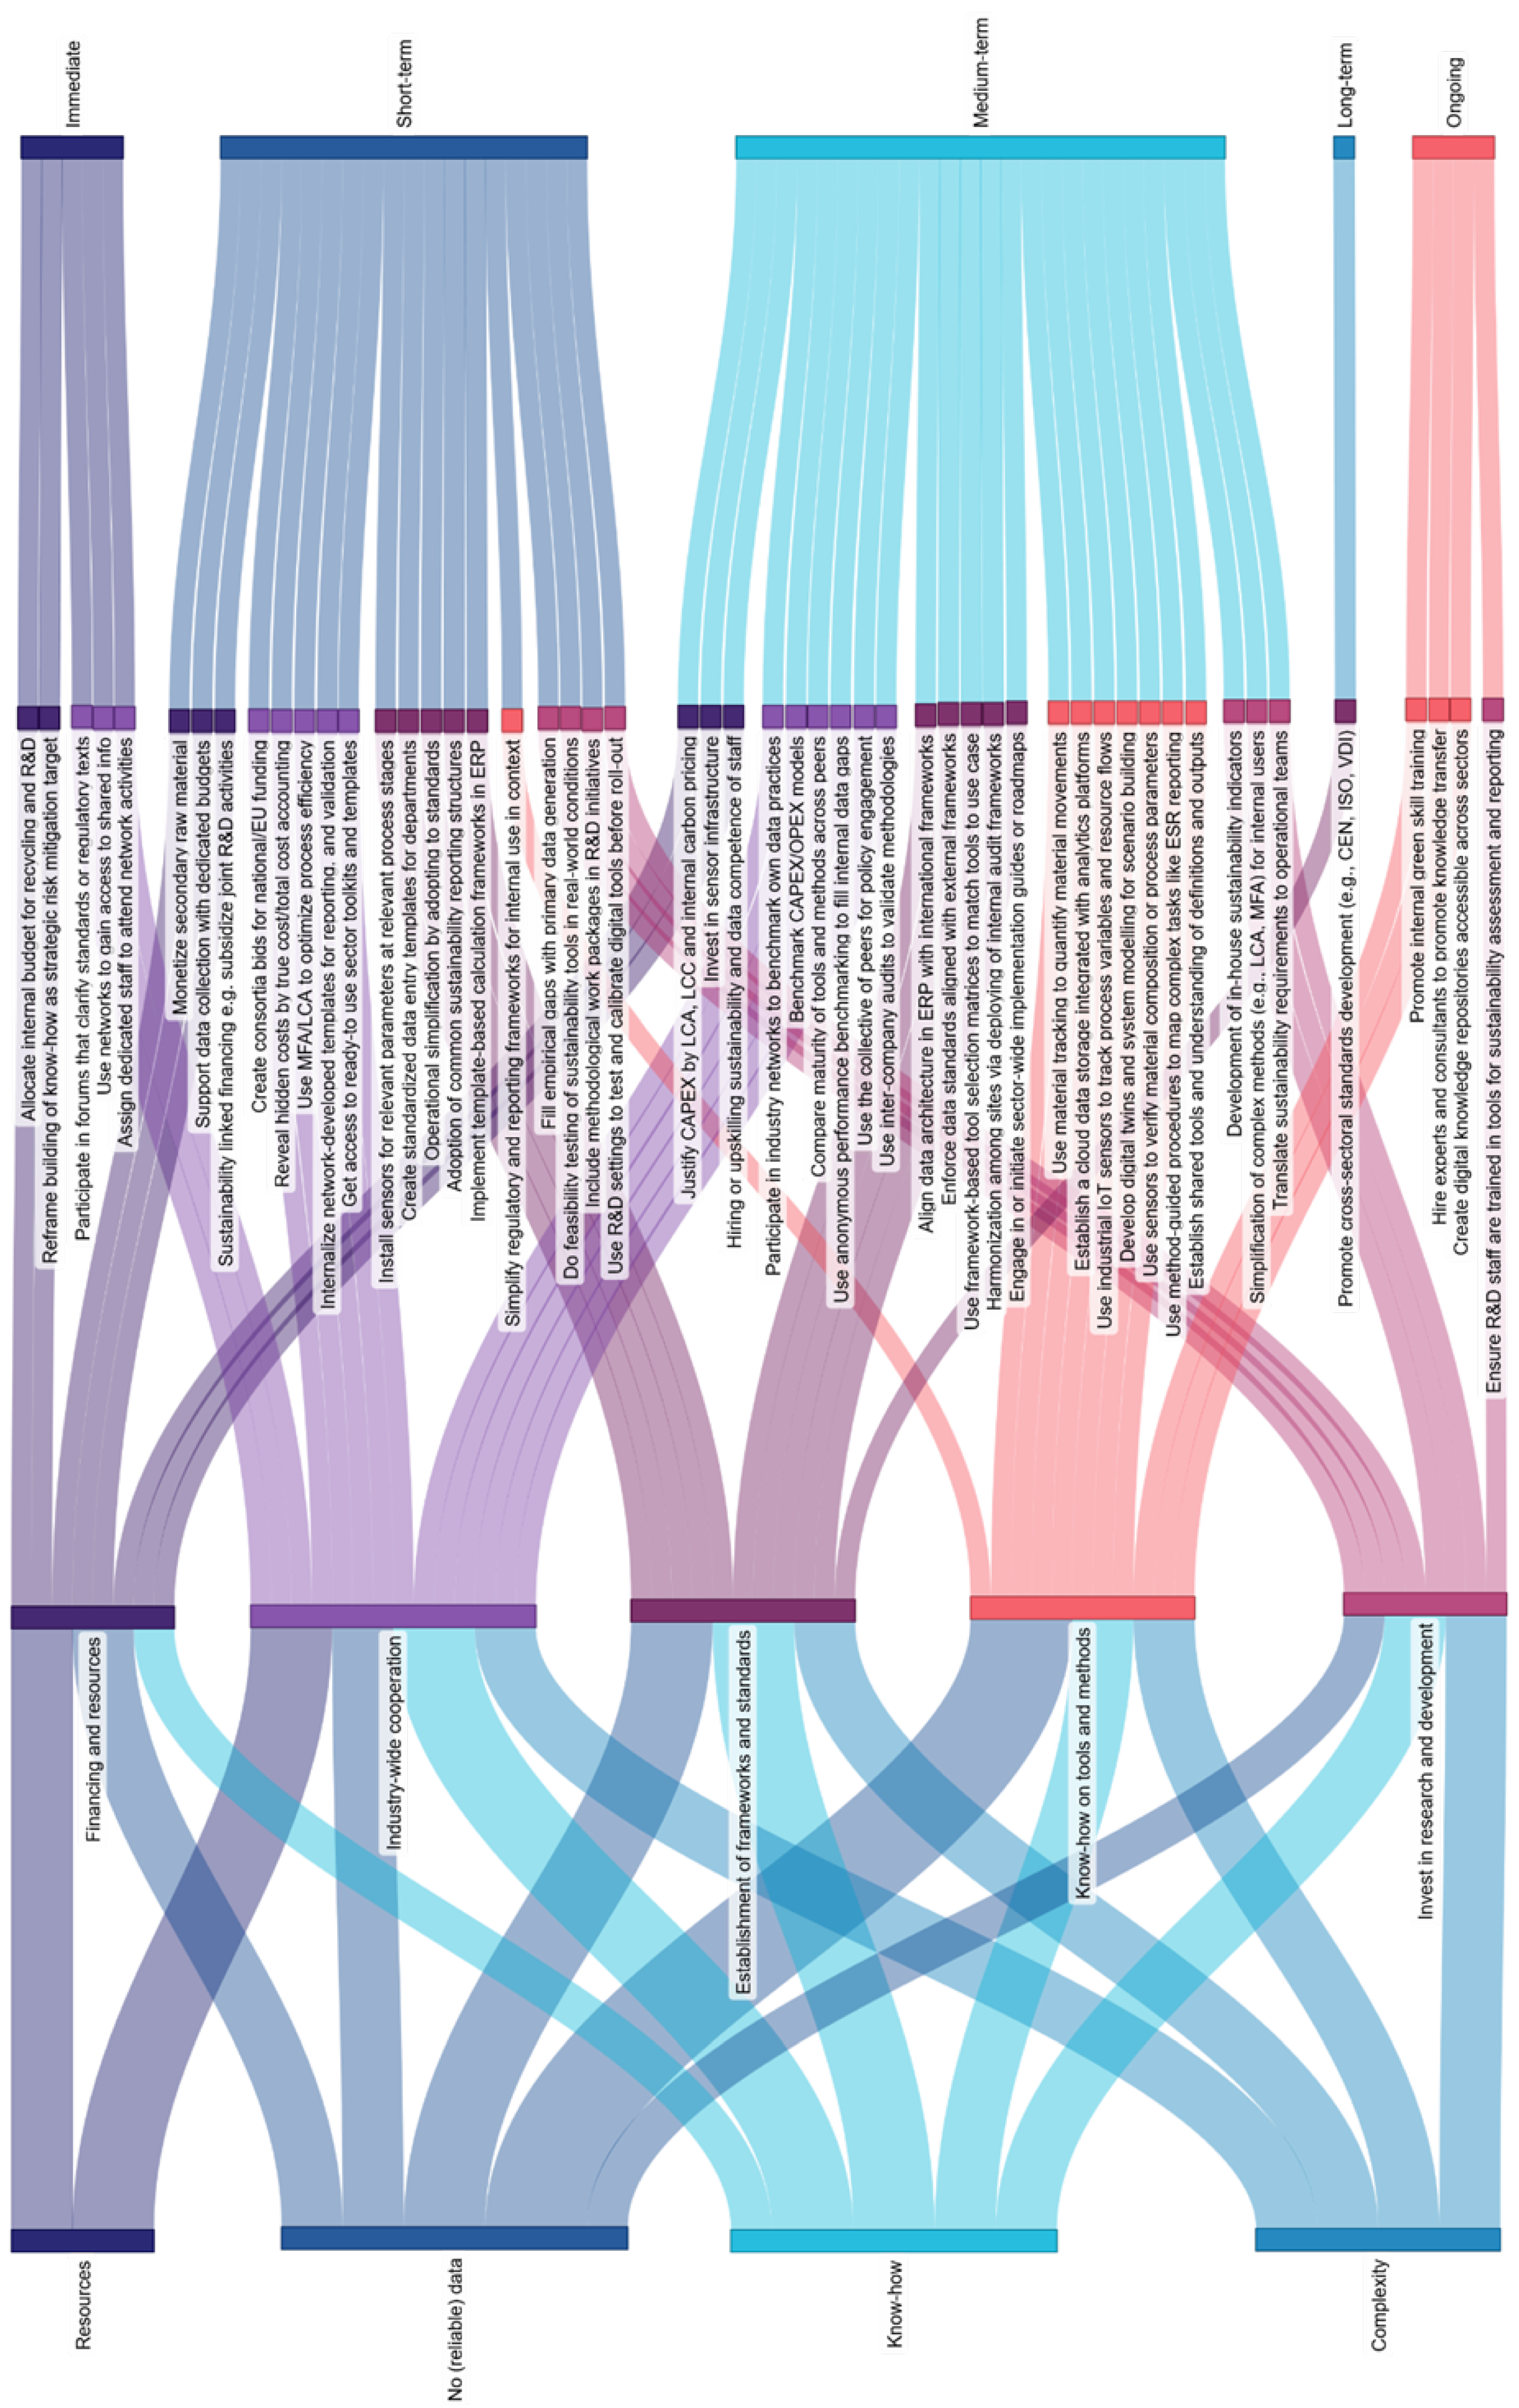
Translating these findings into a roadmap helps define how interventions should be staged over time. The four most critical barriers, lack of resources, no reliable data, system complexity, and lack of know-how, are closely interlinked and shape the order in which measures become feasible, see
Figure 5.
First, resources and funding must be secured. It underpins the capacity to act in other domains. This includes dedicated budgets, to use amongst others for LCA and life cycle costing (LCC) to justify investments, and participation in sectoral or EU-funded consortia. Without sufficient liquidity and personnel capacity, further steps remain out of reach.
With resources secured, the next step is to address data deficits through standardized protocols, sensor-based monitoring, benchmarking, and centralized data platforms. Reliable data is essential not only for reporting credibility but also for reducing perceptions of uncertainty and enabling evidence-based decision-making.
With data structures in place, organizations can begin to reduce system complexity. Structured tool-selection frameworks, simplified calculators for early-stage assessments, or ready-to-use templates can lower entry barriers. Appointing internal “method translators” can further help organizations navigate between different tools and reporting requirements.
Finally, know-how gaps must be addressed through targeted training, recruitment of method specialists, and harmonization of terminology across departments. Embedding capacity-building initiatives within reporting cycles, e.g., those linked to EU sustainability reporting requirements [
44], helps create continuous learning, and institutionalization.
The proposed roadmap also aligns with the evolving policy landscape, particularly the EU Battery Regulation (2023/1542), which emphasizes sustainable product design, traceability, and closed-loop material recovery. Several of the identified barriers—most notably the lack of data transparency, insufficient standardization, and limited cross-sectoral coordination—reflect implementation challenges anticipated under the Regulation. Conversely, the enablers associated with data sharing, standard setting, and risk management directly support compliance with the Regulation’s digital-passport and due-diligence requirements. From a managerial standpoint, the results underline that recyclers can use standardization and digital traceability to reduce uncertainty in input quality and process control. Original equipment manufacturers (OEMs) should intensify long-term cooperation with recyclers to meet extended producer responsibility (EPR) obligations. Policymakers can employ the barrier–enabler mapping to prioritize interventions that accelerate infrastructure readiness and data harmonization.
Although derived from the lithium-ion-battery context, the roadmap is transferable to other circular-value-chain industries, such as photovoltaic-module or e-waste management, which exhibit comparable material flows, actor networks, and coordination challenges.
4.6. Transferability and Limitations
The results are shaped by the context of the FuLIBatteR module, which operates at the innovation interface between academia, industry, and policy. This ensures technically informed insights but limits representativeness. Small to medium enterprises (SMEs), non-governmental organizations (NGOs), and informal sector actors are underrepresented, which may influence the weighting of opportunities, risks, barriers, and enablers. No subgroup analysis between academic and industry respondents was performed because the sample size (n = 26) is insufficient to support statistically meaningful differentiation. As a result, the findings should be understood as sector-informed rather than sector-representative.
The survey design itself also introduces further limitations. Although the questionnaire was pre-tested and randomized to mitigate bias, some participants reported it as cognitively demanding and repetitive. This raises the possibility of attention loss or satisficing behavior. While no evidence of rushed answering was observed, future studies could benefit from modular or adaptive designs to reduce respondent fatigue. The selection of threshold values for category grouping represents a deliberate authorial choice. These cut-offs were empirically guided but primarily designed to ensure interpretability and comparability across mappings rather than to reflect strict statistical boundaries. As a result, minor shifts in threshold definition could slightly alter categorical assignments but would not change the relative ranking or overall interpretation of stakeholder priorities. Also, the barrier–intervention mapping required authorial judgment in assigning basic scores to enabler–barrier combinations. Although these decisions were transparently documented and triangulated with literature and stakeholder input, they inevitably involve an interpretive dimension. High Cronbach’s α values (≈0.99) confirm strong internal coherence of the questionnaire but also raise the possibility of redundancy among conceptually related items. Complementary inter-item correlation analyses differentiated by the four dimensions (
= 0.19 for opportunities, 0.25 for risks, 0.45 for barriers, and 0.35 for enablers) supported this interpretation, revealing varying degrees of internal coherence across constructs. While the opportunity and risk items show broader conceptual spread, the higher correlations within the barrier and enabler dimensions indicate partial item overlap. These findings suggest that the instrument effectively captures dimension-specific stakeholder tendencies while future iterations should refine or consolidate items to improve discriminant validity. Detailed inter-item correlation structures for all four dimensions are visualized in
Figures S2.1–S2.4 (Supplementary Materials S2).
Transferability of the roadmap depends on sectoral, national, and organizational context. While many identified barriers and enablers, such as lack of resources, data deficits, complexity, and know-how gaps, are widely recognized, their specific manifestations and priorities differ across settings. Adaptation is therefore necessary for replication.
Despite these constraints, the mixed-methods approach is robust. Integrating literature and stakeholder perspectives provides a structured framework for understanding implementation gaps and supporting decision-making in LIB recycling and related sectors.
4.7. Overlooked but Emerging Dimensions
An important omission in both the literature and stakeholder responses is cybersecurity. As the sector increasingly depends on digital infrastructures and sensor-based monitoring, vulnerabilities in data systems become critical. The absence of cybersecurity as a risk or enabler suggests a conceptual blind spot, possibly due to disciplinary separation between sustainability and information-security communities. Future research should incorporate cybersecurity explicitly as part of operational resilience to ensure that digitalization strengthens, rather than undermines, transparency and system robustness.
5. Conclusions
This study used a structured literature review, stakeholder survey, and barrier–intervention mapping to identify the key mechanisms shaping sustainability implementation in LIB recycling. The study confirms that an implementation gap persists between ambition and practice. By integrating stakeholder weighting with a quantified barrier–intervention mapping, this work extends existing transition frameworks and delivers a reproducible, data-driven sustainability roadmap validated in the LIB recycling sector.
The combined results, shown in
Figure 2,
Figure 3 and
Figure 4 and detailed in
Table 2 and
Table 3, reveal a small number of structural barriers—lack of resources, lack of reliable data, system complexity, and methodological know-how deficits—that dominate both scholarly and practitioner perspectives. These barriers are interconnected and reinforce one another, underscoring the multi-faceted and interdependent nature of sustainability transitions in the sector. Stakeholders prioritize high-impact, high-effort opportunities, such as greenhouse gas reduction, technological R&D, environmental impact mitigation, and resource and energy security. These choices indicate strong awareness of long-term transformative levers. However, stakeholders are far more cautious toward new business models and several economic opportunities that the literature treats as central drivers of circularity. This divergence reflects practical feasibility constraints, resource scarcity, and short planning horizons in operational environments.
The risk landscape is shaped primarily by outside-in pressures, including regulatory uncertainty and loss of financing, as well as dual risks such as knowledge loss and project failure. Several inside-out risks, notably environmental impacts and workforce-related risks, receive lower emphasis than expected from literature. The consistently limited prioritization of risk literacy and basic risk management competencies is particularly relevant: these capabilities are widely recognized as governance enablers for informed decision-making, yet stakeholders perceive them as secondary. This gap may reinforce short-term focus and amplify vulnerability to external shocks.
The barrier–intervention mapping highlights that enablers operate as cross-cutting accelerators and should be implemented in a sequenced manner. Stakeholder responses reveal an implicit dependency chain: access to resources enables the development of data infrastructures, which facilitate methodological competence, which in turn supports complexity reduction. This sequence mirrors the procedural logic of the EU Battery Regulation (2023/1542), which relies on standardization, data traceability, and digital reporting systems. Accordingly, recyclers should prioritize investment in data and digital tools, OEMs should intensify cooperation on material information flows, and policymakers should focus on harmonization and shared data infrastructures.
Although the roadmap, given in
Figure 5, was developed for LIB recycling, the mechanisms identified here apply to other complex, infrastructure-heavy circular systems—such as photovoltaic recycling or electronic waste—where uncertainty, interdependencies, and resource constraints shape sustainability outcomes. Transferability, however, will depend on sectoral characteristics and organizational maturity.
An emerging challenge not reflected in either stakeholder responses or much of literature is cybersecurity, despite its growing relevance in digitalized recycling environments. Future work should integrate cybersecurity into risk assessments and capability-building frameworks to ensure that digitalization strengthens rather than undermines system resilience.
Overall, this study demonstrates that successful sustainability transitions in LIB recycling depend not only on recognizing opportunities and risks but on understanding how barriers interact and how enabling conditions must be sequenced. The presented mapping and roadmap offer a structured basis for supporting decision-making, guiding investments, and aligning industry practice with evolving regulatory requirements.
Supplementary Materials
The following supporting information can be downloaded at
https://www.mdpi.com/article/10.3390/su18020654/s1, Table S1.1: Literature list of opportunities; Table S1.2: Literature list of risks; Table S1.3: Literature list of intern enablers; Table S1.4: Literature list of intern barriers. Table S2.1: Example items, and aggregation logic of the stakeholder questionnaire, Table S2.2: Structure and content of the sustainability relevant stakeholder questions, Table S2.3: Complete barrier-intervention-mapping, Table S2.4: Basic score for every enabler-barrier pairing, Figure S2.1: Survey Questionnaire. Figure S3.1: Collected Answers of the Survey. Figure S4.1: Inter-item Pearson correlation heatmap for Opportunity Items, Figure S4.2: Inter-item Pearson correlation heatmap for Risk Items, Figure S4.3: Inter-item Pearson correlation heatmap for Barrier Items, Figure S4.4: Inter-item Pearson correlation heatmap for Enabler Items.
Author Contributions
Conceptualization, B.R. and S.R.; methodology, B.R.; software, B.R.; validation, B.R., S.R., A.A. and T.N.; formal analysis, B.R.; investigation, B.R. and S.R.; resources, R.P.; data curation, B.R., writing—original draft preparation, B.R.; writing—review and editing, B.R., S.R. and T.N.; visualization, B.R.; supervision, T.N. and R.P.; project administration, T.N. and B.R.; funding acquisition, T.N. All authors have read and agreed to the published version of the manuscript.
Funding
The authors gratefully acknowledge the funding support of K1-MET GmbH, the metallurgical competence center. The Module FuLIBatteR (FFG Nr. 869295) is supported by COMET (Competence Center for Excellent Technologies), the Austrian program for competence centers. COMET by the Austrian Research Promotion Agency (FFG) is funded by the Federal Ministry of Innovation, Mobility and Infrastructure (BMIMI), the Federal Ministry Economy, Energy and Tourism (BMWET), the Austrian Federal States of Upper Austria and Styria, as well as the Styrian Business Promotion Agency (SFG). Furthermore, Upper Austrian Research GmbH continuously supports the Module. In addition to the public funding from COMET, this Module is partially financed by the company partners Audi, BRAIN Biotech, Ebner Industrieofenbau, RHI Magnesita, Saubermacher Dienstleistungs AG, TÜV SÜD Landesgesellschaft Österreich, VTU Engineering, and voestalpine High-Performance Metals, as well as the scientific partners ACIB, Coventry University, Technical University of Leoben, BOKU University, and UVR-FIA.
Institutional Review Board Statement
This study is waived for ethical review as, under Austrian regulations, such research does not fall within the scope of studies requiring ethics committee approval. According to the Austrian Universities Act (UG 2002) and standard practice at Austrian technical universities, anonymous surveys conducted for scientific purposes without personal data processing or intervention are exempt from formal ethics review. Nevertheless, the study was conducted in accordance with the principles of the Declaration of Helsinki (1975, revised 2013), notably with respect to voluntary participation, confidentiality, and responsible handling of data.
Informed Consent Statement
Verbal informed consent was obtained from the participants. Verbal consent was obtained rather than written because the study was conducted using anonymous data collection, no personal or sensitive data were recorded, and participants were not subjected to any intervention, making verbal consent sufficient for this research.
Data Availability Statement
The raw data of the survey presented in this study is available on request from the corresponding author, for aggregated results please refer to the
Supplementary Materials.
Acknowledgments
Special thanks goes to SankeyMATIC and their free to use and open-source material flow diagram webpage. During the preparation of this work the author(s) used DeepL Translation Free (V.2.27.8.0) and ChatGPT 4.5 and 5.0 by OpenAI in order to assist in language refinement, outline structuring of the manuscript, and meaningful shortening of text. After using this tool/service, the author(s) reviewed and edited the content as needed and take(s) full responsibility for the content of the published article.
Conflicts of Interest
Author Bettina Rutrecht was employed by the company K1-MET GmbH, Astrid Arnberger was employed by the company Saubermacher Dienstleistungs AG. The remaining authors declare that the research was conducted in the absence of any commercial or financial relationships that could be construed as a potential conflict of interest.
Abbreviations
The following abbreviations are used in this manuscript:
| c | Criticality index |
| EPR | Extended producer responsibility |
| EU | European Union |
| KPI | Key performance indicator |
| LCA | Life cycle assessment |
| LCC | Life cycle costing |
| LIB | Lithium-ion battery |
| NGO | Non-governmental organization |
| OEM | Original equipment manufacturer |
| PR | Public relations |
| Qual. | qualitative |
| R&D | Research and development |
| sb | Stakeholder-derived barrier effect of an item |
| se | Stakeholder-derived enabling effect of an item |
| SME | Small to medium enterprises |
References
- European Commission. The European Green Deal. Available online: https://ec.europa.eu/info/strategy/priorities-2019-2024/european-green-deal_de (accessed on 27 July 2025).
- European Commission (Ed.) The Clean Industrial Deal: A Joint Roadmap for Competitiveness and Decarbonisation: Communication from the Commission to the European Parliament, the Council, the European Economic and Social Committee and the Committee of Regions; European Commission: Brüssel, Belgium, 2025. [Google Scholar]
- European Commission. Circular Economy Action Plan. 2020. Available online: https://eur-lex.europa.eu/legal-content/EN/TXT/?qid=1583933814386&uri=COM:2020:98:FIN (accessed on 1 September 2023).
- Machala, M.L.; Chen, X.; Bunke, S.P.; Forbes, G.; Yegizbay, A.; de Chalendar, J.A.; Azevedo, I.L.; Benson, S.; Tarpeh, W.A. Life cycle comparison of industrial-scale lithium-ion battery recycling and mining supply chains. Nat. Commun. 2025, 16, 988. [Google Scholar] [CrossRef] [Scilit]
- A Llamas-Orozco, J.; Meng, F.; Walker, G.S.; Abdul-Manan, A.F.N.; MacLean, H.L.; Posen, I.D.; McKechnie, J. Estimating the environmental impacts of global lithium-ion battery supply chain: A temporal, geographical, and technological perspective. Proc. Natl. Acad. Sci. USA 2023, 2, pgad361. [Google Scholar] [CrossRef] [Scilit] [PubMed]
- Mrozik, W.; Rajaeifar, M.A.; Heidrich, O.; Christensen, P. Environmental impacts, pollution sources and pathways of spent lithium-ion batteries. Energy Environ. Sci. 2021, 14, 6099–6121. [Google Scholar] [CrossRef] [Scilit]
- Boyden, A.; Soo, V.K.; Doolan, M. The Environmental Impacts of Recycling Portable Lithium-Ion Batteries. Procedia CIRP 2016, 48, 188–193. [Google Scholar] [CrossRef] [Scilit]
- Harper, G.; Sommerville, R.; Kendrick, E.; Driscoll, L.; Slater, P.; Stolkin, R.; Walton, A.; Christensen, P.; Heidrich, O.; Lambert, S.; et al. Recycling lithium-ion batteries from electric vehicles. Nature 2019, 575, 75–86. [Google Scholar] [CrossRef] [Scilit]
- Ma, X.; Meng, Z.; Bellonia, M.V.; Spangenberger, J.; Harper, G.; Gratz, E.; Olivetti, E.; Arsenault, R.; Wang, Y. The evolution of lithium-ion battery recycling. Nat. Rev. Clean Technol. 2025, 1, 75–94. [Google Scholar] [CrossRef] [Scilit]
- Baum, Z.J.; Bird, R.E.; Yu, X.; Ma, J. Lithium-Ion Battery Recycling—Overview of Techniques and Trends. ACS Energy Lett. 2022, 7, 712–719. [Google Scholar] [CrossRef] [Scilit]
- Xu, P.; Tan, D.H.S.; Jiao, B.; Gao, H.; Yu, X.; Chen, Z. A Materials Perspective on Direct Recycling of Lithium-Ion Batteries: Principles, Challenges and Opportunities. Adv. Funct. Mater. 2023, 33, 2213168. [Google Scholar] [CrossRef] [Scilit]
- Lv, W.; Wang, Z.; Cao, H.; Sun, Y.; Zhang, Y.; Sun, Z.H. A Critical Review and Analysis on the Recycling of Spent Lithium-Ion Batteries. ACS Sustain. Chem. Eng. 2018, 6, 1504–1521. [Google Scholar] [CrossRef] [Scilit]
- Husmann, J.; Ali, A.-R.; Cerdas, F.; Herrmann, C. The influence of stakeholder perspectives on the end-of-life allocation in the life cycle assessment of lithium-ion batteries. Front. Sustain. 2023, 4, 1163207. [Google Scholar] [CrossRef] [Scilit]
- Biswal, B.K.; Zhang, B.; Tran, P.T.M.; Zhang, J.; Balasubramanian, R. Recycling of spent lithium-ion batteries for a sustainable future: Recent advancements. Chem. Soc. Rev. 2024, 53, 5552–5592. [Google Scholar] [CrossRef] [Scilit]
- Luthra, S.; Sharma, M.; Kumar, A.; Joshi, S.; Collins, E.; Mangla, S. Overcoming barriers to cross-sector collaboration in circular supply chain management: A multi-method approach. Transp. Res. Part E Logist. Transp. Rev. 2022, 157, 102582. [Google Scholar] [CrossRef] [Scilit]
- Veleva, V.; Bodkin, G. Corporate-entrepreneur collaborations to advance a circular economy. J. Clean. Prod. 2018, 188, 20–37. [Google Scholar] [CrossRef] [Scilit]
- Tseng, M.-L.; Tran, T.P.T.; Ha, H.M.; Bui, T.-D.; Lim, M.K. Causality of circular business strategy under uncertainty: A zero-waste practices approach in seafood processing industry in Vietnam. Resour. Conserv. Recycl. 2022, 181, 106263. [Google Scholar] [CrossRef] [Scilit]
- Zaman, A.U. A comprehensive review of the development of zero waste management: Lessons learned and guidelines. J. Clean. Prod. 2015, 91, 12–25. [Google Scholar] [CrossRef] [Scilit]
- Nimsai, S.; Yoopetch, C.; Lai, P. Mapping the Knowledge Base of Sustainable Supply Chain Management: A Bibliometric Literature Review. Sustainability 2020, 12, 7348. [Google Scholar] [CrossRef] [Scilit]
- Liu, B.; Fan, Y.; Xue, B.; Wang, T.; Chao, Q. Feature extraction and classification of climate change risks: A bibliometric analysis. Environ. Monit. Assess. 2022, 194, 495. [Google Scholar] [CrossRef] [Scilit]
- Harris, S.; Martin, M.; Diener, D. Circularity for circularity’s sake? Scoping review of assessment methods for environmental performance in the circular economy. Sustain. Prod. Consum. 2021, 26, 172–186. [Google Scholar] [CrossRef] [Scilit]
- Shaktawat, A.; Vadhera, S. Risk management of hydropower projects for sustainable development: A review. Environ. Dev. Sustain. 2021, 23, 45–76. [Google Scholar] [CrossRef] [Scilit]
- Song, Q.; Li, J.; Zeng, X. Minimizing the increasing solid waste through zero waste strategy. J. Clean. Prod. 2015, 104, 199–210. [Google Scholar] [CrossRef] [Scilit]
- Sousa, P.M.; Martelo, L.M.; Marques, A.T.; Bastos, M.M.; Soares, H.M. A closed and zero-waste loop strategy to recycle the main raw materials (gold, copper and fiber glass layers) constitutive of waste printed circuit boards. Chem. Eng. J. 2022, 434, 134604. [Google Scholar] [CrossRef] [Scilit]
- Li, Y.; Trimmer, J.T.; Hand, S.; Zhang, X.; Chambers, K.G.; Lohman, H.A.C.; Shi, R.; Byrne, D.M.; Cook, S.M.; Guest, J.S. Quantitative sustainable design (QSD) for the prioritization of research, development, and deployment of technologies: A tutorial and review. Environ. Sci. Water Res. Technol. 2022, 8, 2439–2465. [Google Scholar] [CrossRef] [Scilit]
- Ang, K.L.; Saw, E.T.; He, W.; Dong, X.; Ramakrishna, S. Sustainability framework for pharmaceutical manufacturing (PM): A review of research landscape and implementation barriers for circular economy transition. J. Clean. Prod. 2021, 280, 124264. [Google Scholar] [CrossRef] [Scilit]
- Fantke, P.; Illner, N. Goods that are good enough: Introducing an absolute sustainability perspective for managing chemicals in consumer products. Curr. Opin. Green Sustain. Chem. 2019, 15, 91–97. [Google Scholar] [CrossRef] [Scilit]
- Nassani, A.A.; Isac, N.; Rosak-Szyrocka, J.; Yousaf, Z.; Haffar, M. Institutional Pressures and Circular Economy Target Performance: Are Zero Waste Practices and Enviropreneurship Worth Pursuing? Sustainability 2023, 15, 2952. [Google Scholar] [CrossRef] [Scilit]
- Mulvaney, D.; Richards, R.M.; Bazilian, M.D.; Hensley, E.; Clough, G.; Sridhar, S. Progress towards a circular economy in materials to decarbonize electricity and mobility. Renew. Sustain. Energy Rev. 2021, 137, 110604. [Google Scholar] [CrossRef] [Scilit]
- Masoudipour, E.; Amirian, H.; Sahraeian, R. A novel closed-loop supply chain based on the quality of returned products. J. Clean. Prod. 2017, 151, 344–355. [Google Scholar] [CrossRef] [Scilit]
- Momeni, M.A.; Jain, V.; Govindan, K.; Mostofi, A.; Fazel, S.J. A novel buy-back contract coordination mechanism for a manufacturer-retailer circular supply chain regenerating expired products. J. Clean. Prod. 2022, 375, 133319. [Google Scholar] [CrossRef] [Scilit]
- Scheel, C.; Bello, B. Transforming Linear Production Chains into Circular Value Extended Systems. Sustainability 2022, 14, 3726. [Google Scholar] [CrossRef] [Scilit]
- Axon, C.J.; Darton, R. Sustainability and risk—A review of energy security. Sustain. Prod. Consum. 2021, 27, 1195–1204. [Google Scholar] [CrossRef] [Scilit]
- Iqbal, M.W.; Kang, Y.; Jeon, H.W. Zero waste strategy for green supply chain management with minimization of energy consumption. J. Clean. Prod. 2020, 245, 118827. [Google Scholar] [CrossRef] [Scilit]
- Tang, X.; He, Y.; Salling, M. Optimal pricing and production strategies for two manufacturers with industrial symbiosis. Int. J. Prod. Econ. 2021, 235, 108084. [Google Scholar] [CrossRef] [Scilit]
- Lieder, M.; Rashid, A. Towards circular economy implementation: A comprehensive review in context of manufacturing industry. J. Clean. Prod. 2016, 115, 36–51. [Google Scholar] [CrossRef] [Scilit]
- Owen, G. What makes climate change adaptation effective? A systematic review of the literature. Glob. Environ. Change 2020, 62, 102071. [Google Scholar] [CrossRef] [Scilit]
- Glavič, P.; Pintarič, Z.N.; Bogataj, M. Process Design and Sustainable Development—A European Perspective. Processes 2021, 9, 148. [Google Scholar] [CrossRef] [Scilit]
- Hampus, A.; Ljunggren, M. Towards comprehensive assessment of mineral resource availability? Complementary roles of life cycle, life cycle sustainability and criticality assessments. Resour. Conserv. Recycl. 2021, 167, 105396. [Google Scholar] [CrossRef] [Scilit]
- Richtlinie (EU) 2022/2464 des Europäischen Parlaments und Vom 14. Dezember 2022 zur Änderung der Verordnung (EU) Nr. 537/2014 und der Richtlinien 2004/109/EG, 2006/43/EG und 2013/34/EU Hinsichtlich der Nachhaltigkeitsberichterstattung Von Unternehmen: CSRD-Richtlinie. 2022. Available online: https://eur-lex.europa.eu/legal-content/DE/TXT/PDF/?uri=CELEX:32022L2464 (accessed on 5 March 2023).
- Primec, A.; Belak, J. Sustainable CSR: Legal and Managerial Demands of the New EU Legislation (CSRD) for the Future Corporate Governance Practices. Sustainability 2022, 14, 16648. [Google Scholar] [CrossRef] [Scilit]
- Zanghelini, G.M.; Cherubini, E.; Soares, S.R. How Multi-Criteria Decision Analysis (MCDA) is aiding Life Cycle Assessment (LCA) in results interpretation. J. Clean. Prod. 2018, 172, 609–622. [Google Scholar] [CrossRef] [Scilit]
- Colla, M.; Ioannou, A.; Falcone, G. Critical review of competitiveness indicators for energy projects. Renew. Sustain. Energy Rev. 2020, 125, 109794. [Google Scholar] [CrossRef] [Scilit]
- EFRAG. First Set of Draft ESRS. Available online: https://www.efrag.org/en/sustainability-reporting (accessed on 30 June 2023).
| Disclaimer/Publisher’s Note: The statements, opinions and data contained in all publications are solely those of the individual author(s) and contributor(s) and not of MDPI and/or the editor(s). MDPI and/or the editor(s) disclaim responsibility for any injury to people or property resulting from any ideas, methods, instructions or products referred to in the content. |





 ,
,