Article

The Effect of National Eco-Industrial Parks on City-Level Synergistic Reduction in Pollution and Carbon Emissions: Evidence from a Staggered DID Analysis in the Yangtze River Delta, China

Nanjing Institute of Environmental Sciences, Ministry of Ecology and Environment, Nanjing 210042, China
*
Author to whom correspondence should be addressed.
Sustainability 2026, 18(2), 598; https://doi.org/10.3390/su18020598
Submission received: 23 October 2025 / Revised: 1 December 2025 / Accepted: 9 December 2025 / Published: 7 January 2026

Abstract

China’s National Eco-Industrial Parks (NEIPs) represent a significant policy intervention designed to achieve the synergistic reduction in pollution and carbon emissions. While previous studies have examined the impacts of NEIPs on pollution and carbon emissions in isolation, research on their synergistic reduction is still limited. This study constructs a Carbon-Pollution Co-Reduction Index (CPCRI) with weights determined by the entropy weight method (EWM) to capture the joint performance of emission intensities. By applying a staggered difference-in-differences (SDID) model to city-level panel data from the Yangtze River Delta between 2003 and 2021, the study finds that NEIPs significantly improve the CPCRI of cities where NEIPs are located by 2.30 percentage points. This positive effect exhibits a time lag, becoming statistically significant three years after establishment and strengthening thereafter. Mechanism analyses indicate that the synergistic reductions are driven by technological innovation and reduced energy intensity, while heterogeneity analyses reveal that the policy effect is more pronounced in economically developed provinces and larger cities but has diminished in recent years. Then, a coupling coordination degree (CCD) is integrated to construct a new index to capture both joint performance and synergy between reductions. These findings provide robust empirical support for NEIPs as a practical policy tool to achieve sustainable industrial transformation in the Yangtze River Delta.

1. Introduction

Climate change, predominantly driven by human activities, has become a major concern of research across many scientific fields [1]. Industrial activities, while significantly contributing to economic growth, are also a primary cause of adverse environmental impacts, accounting for roughly 61% of environmental pollutant emissions and 24% of greenhouse gas (GHG) emissions [2,3]. In this study, two broad categories of these impacts are distinguished—local and regional pollution and GHGs—which are primary drivers of global climate change, represented mainly by carbon dioxide. Due to this dual impact, the synergistic reduction in environmental pollution and carbon emissions has become a priority on the international agenda, underscoring the imperative of balancing economic growth with environmental sustainability [4].
Industrial parks concentrate industrial activities and thus play a significant role in generating pollution and carbon emissions. In response to the environmental challenges, many countries have developed eco-industrial parks (EIPs), founded on the concept of an “industrial symbiosis”, over the past several decades. The EIPs form resource-recycling networks for by-products like steam, waste heat, and industrial residues, which help mitigate pollution and carbon dioxide (CO2) emissions [5,6]. In addition to environmental benefits, EIPs enhance business competitiveness, foster technological innovation, and create jobs, delivering significant socio-economic gains as well [7].
As the world’s second-largest economy and the largest developing country, China has been facing a conflict between economic growth and environmental protection. The country’s dependency on coal and on heavy and chemical industries has resulted in the co-emission of local pollutants and GHGs, where the release patterns exhibit spatio-temporal consistency [8,9]. To address high energy consumption and pollution in traditional industries, China initiated the program of National Eco-Industrial Parks (NEIPs) in 2001. The program aims to achieve the co-control of pollution and carbon emissions through upgrading industrial structure, retrofitting facilities for sustainability, and adopting advanced technologies [10,11]. By the end of 2024, 73 NEIPs had been established nationwide and distributed across 19 provinces, municipalities, and autonomous regions. Therefore, NEIPs’ performance in reducing pollution and carbon emissions has become a major focus for both policymakers and researchers.
The extant literature on industrial parks and pollution/carbon reduction mainly focuses on several areas, but it has also revealed critical gaps that this paper aims to address. First, micro-level case studies lack generalizability, even though they provide valuable insights into the environmental and economic benefits of specific measures, such as the CO2 and SOx reduction from combined heat and power systems [12] or the advantages of solid waste treatment in specific parks like the Tianjin Economic–Technological Development Area [13]. However, the singular cases limit the generalizability of their results due to unique regional contexts, failing to reveal NEIPs’ broader effects across cities. Second, to understand the development of industrial parks, scholars have introduced various interdisciplinary theoretical frameworks such as resource dependence theory and strategic niche management [14,15]. Even though these papers provide conceptual value, they often remain qualitative and descriptive, lacking empirical validation. For example, Zhu et al. identify barriers to EIP promotion in China but do not quantify how NEIPs drive co-reduction [14]. As a result, a gap between theoretical propositions and quantitative testing exists. Third, the application of quantitative methods, like Data Envelopment Analysis for performance evaluation and the difference-in-differences (DID) model, has increased, examining the benefits of EIPs across different objectives [16,17,18,19]. However, these studies usually treat local pollution reduction and carbon mitigation as independent goals, ignoring the joint performance and synergies between local pollution reduction and carbon mitigation. For example, Miao et al. use the DID method to evaluate green parks’ effects on carbon emission reduction but do not take the local or regional pollutants into account [20]. This limited perspective paints an incomplete picture of NEIPs’ benefits in driving regional sustainable transitions. Therefore, this study aims to address these gaps by constructing a composite index and employing a quasi-experimental design to provide robust and generalizable empirical evidence on the synergistic effects of NEIPs.
To empirically evaluate the causal impact of NEIPs on the synergistic reduction, this study constructs the Carbon-Pollution Co-Reduction Index (CPCRI) using the entropy weight method (EWM). This index integrates major industrial pollutants, including industrial sulfur dioxide (SO2), industrial dust and fumes, and industrial wastewater, and CO2. To examine the causal effect of NEIPs on the CPCRI, a staggered difference-in-differences (SDID) model and a series of robustness tests are employed. To better capture “synergy”, a limitation of a weighted-average index, a coupling coordination degree (CCD) is integrated into the CPCRI in the subsequent analysis. Two mechanisms (technological innovation and energy intensity) link NEIPs to co-reduction. By using interaction terms to quantify how these mechanisms amplify NEIPs’ effects, the gap between theory and empirical analysis is addressed.
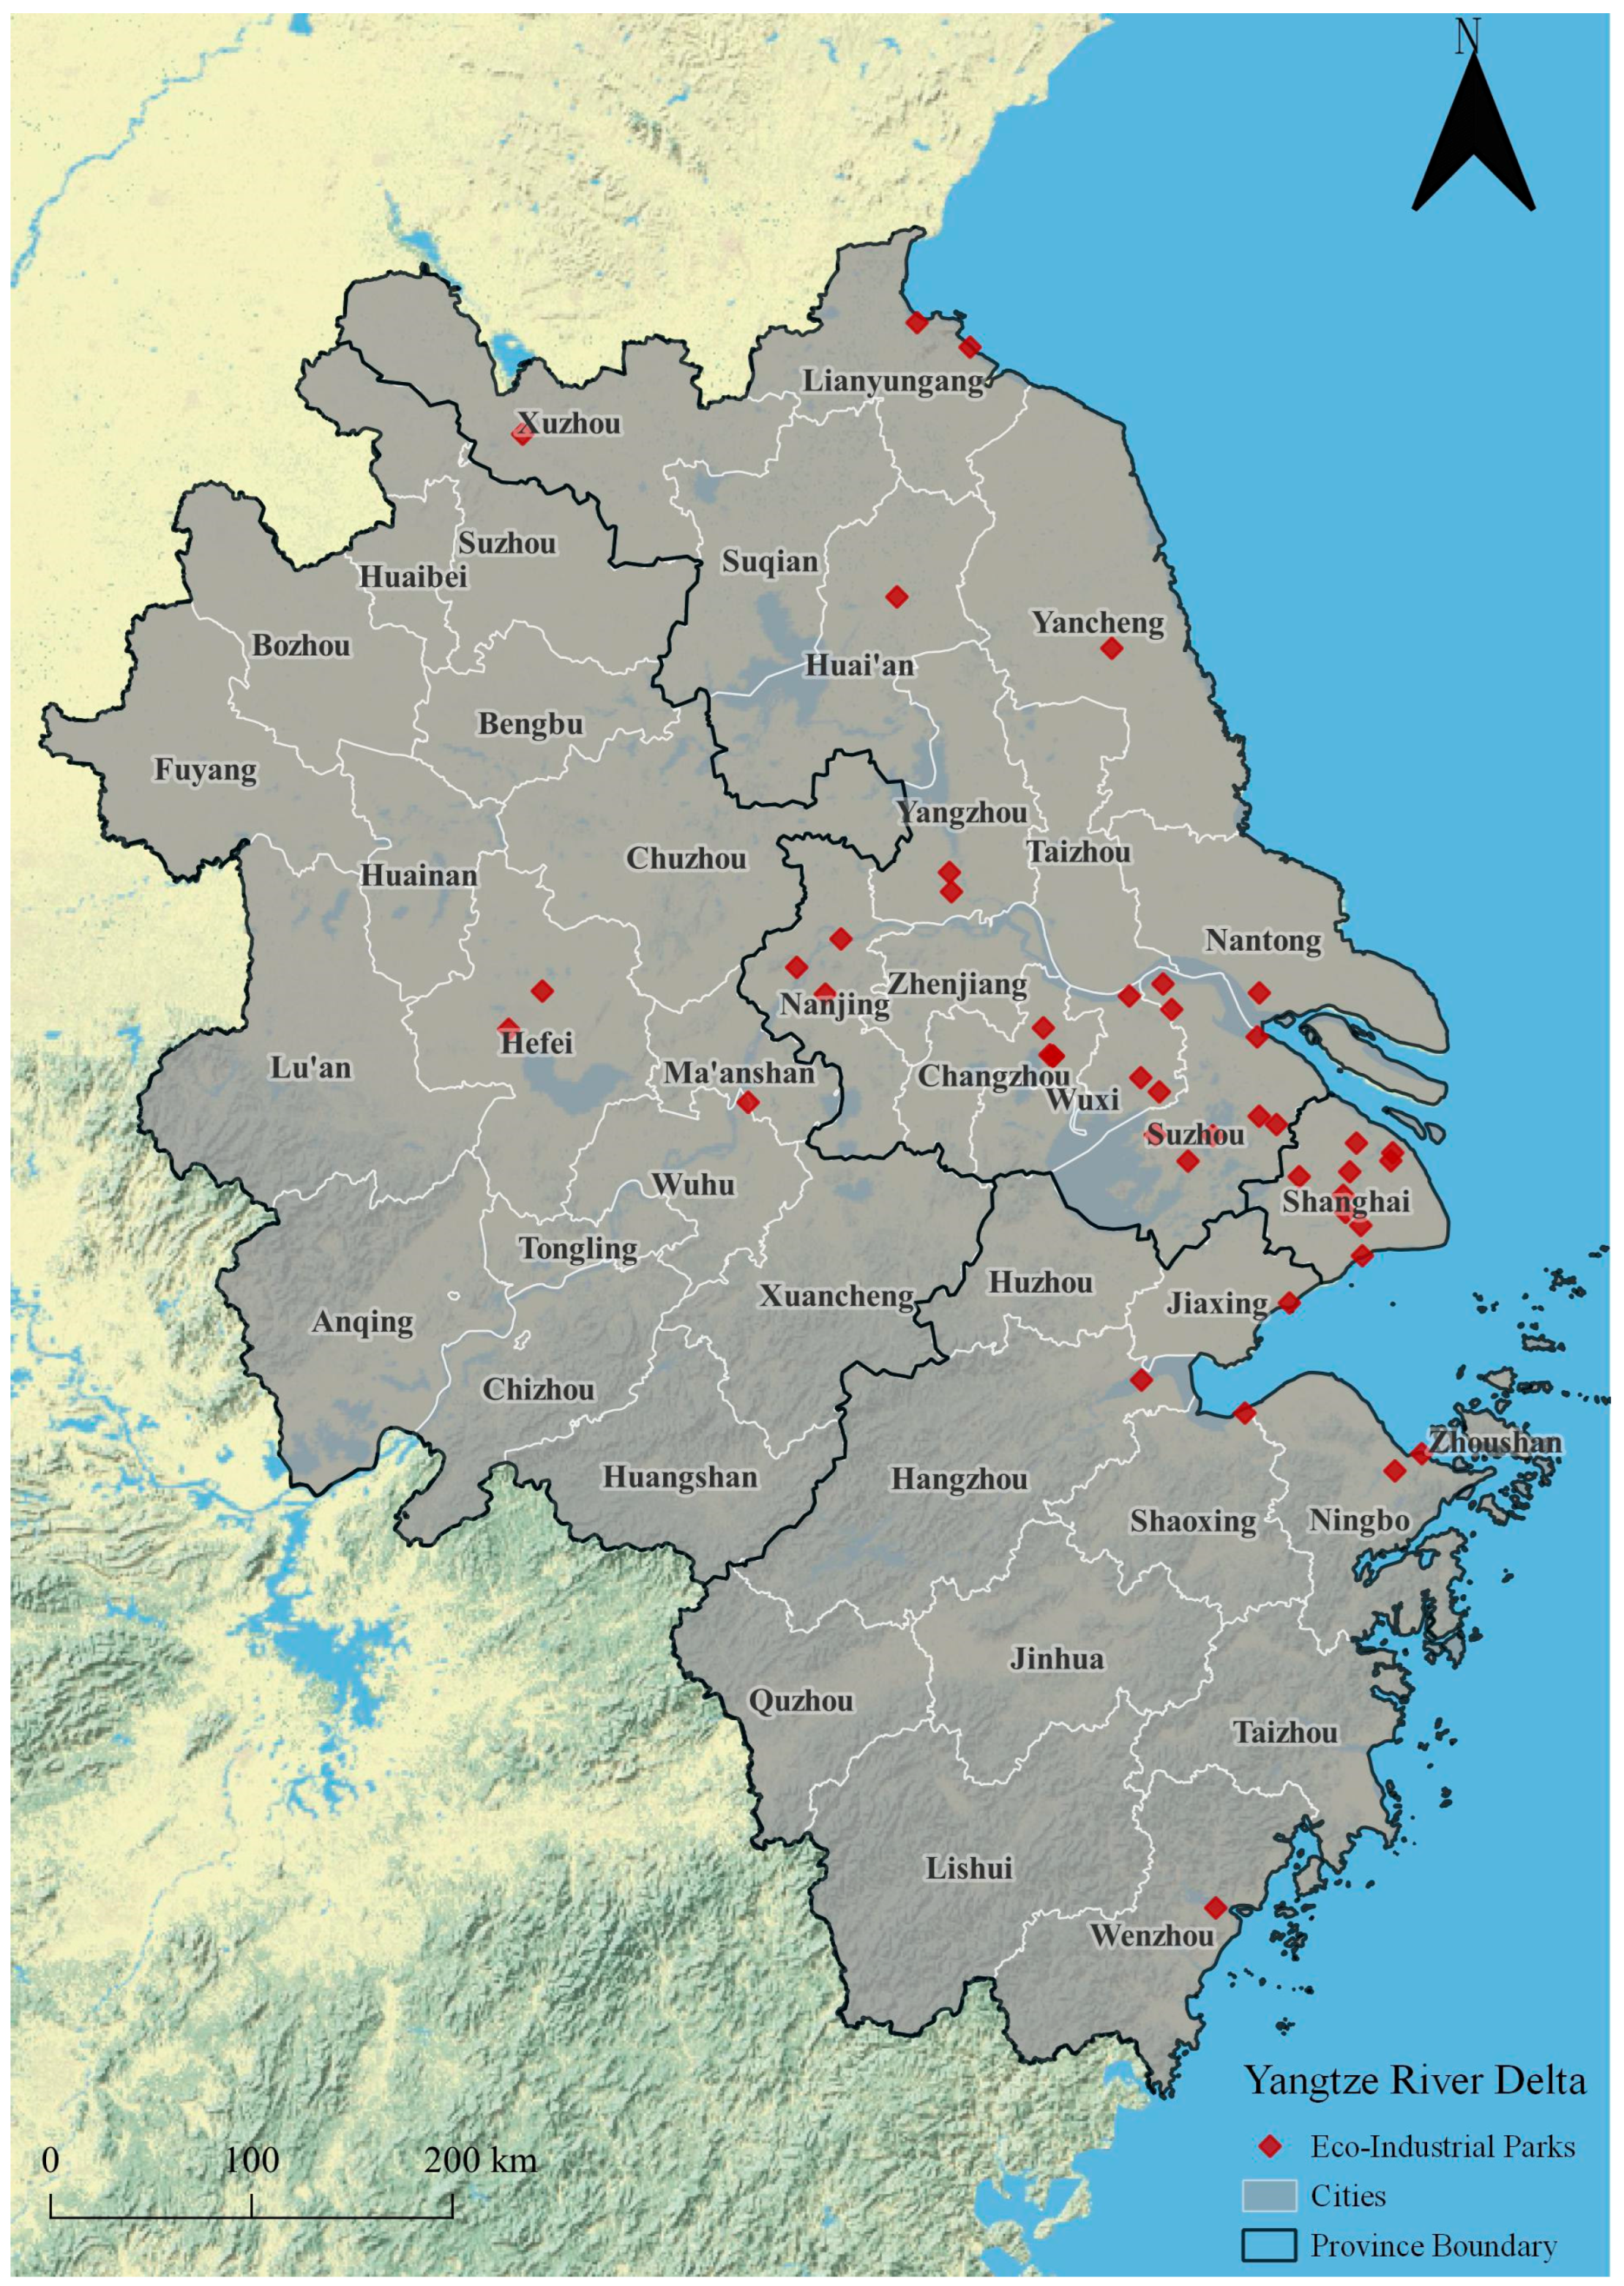
The empirical analysis of this study concentrates on China’s Yangtze River Delta region (Shanghai, Jiangsu, Zhejiang, and Anhui), an area characterized by its developed economy and comprehensive industrial structure [21]. Despite covering only 3.7% of China’s land and housing 16.2% of its population, the Yangtze River Delta generates 23.5% of national GDP. The regional intense development has also exerted pressure on the environment, making NEIPs crucial for the region’s sustainable transition. The Yangtze River Delta has forty-four NEIPs (approximately 60% of the national total as of 2024), the country’s highest density, in which a diverse range of industries are located, including chemicals, electronics, and processing, among others. Figure 1 is based on the NEIP list published by Ministry of Ecology and Environment of the People’s Republic of China and created by QGIS based on NEIPs’ latitudes and longitudes [22]. Shanghai, as a window of China’s reform and opening-up, is currently the industrial center of the Yangtze River Delta region. As a result, a large number of NEIPs are concentrated in Shanghai, south Jiangsu, and north Zhejiang. Even though the spatial distribution of NEIPs in the Yangtze River Delta is not uniform, the region’s integrated development strategy facilitates the consistency of environmental regulations [23], which helps mitigate heterogeneity from regional disparities and allows for a more accurate assessment of NEIP effectiveness.
Compared to previous studies that treated pollution reduction and carbon mitigation as separate objectives, this paper makes a contribution by taking the synergistic reduction into account. The construction of the CPCRI provides a novel and integrated metric for evaluating NEIP’s impacts on the joint performance of reductions in the city, addressing the critical gap in the literature. In addition to assessing the policy effect, this study also performs a mechanism test analysis to investigate whether technological innovation and reduced energy intensity mediate the observed outcomes. The integration with CCD better captures synergistic interaction between pollutants, addressing the limitation of a weighted-average index. By providing robust evidence for the synergistic co-reduction effects of NEIPs, this work offers critical empirical support for validating the NEIP program as a key policy tool to achieve co-reduction goals.

2. Theoretical Analysis and Hypotheses

The patterns of local and regional pollution and GHG emissions are inherently interconnected, as they share many of the same major drivers [24]. The combustion of fossil fuels and various energy-intensive industrial processes are significant sources of such environmental issues [25]. Therefore, the interventions targeting these primary drivers bring potential for the co-control of GHGs and local pollutants. NEIPs serve as a critical policy instrument in this regard, providing a platform for industrial symbiosis, systematic management, and structural adjustment.
Through the application of industrial symbiosis, NEIPs facilitate efficient resource sharing, including energy, water, and by-products, as well as the centralized supply of utilities such as renewable energy and advanced wastewater treatment [6,26]. The systematic management can minimize resource consumption and process inefficiencies. In addition, NEIPs can simultaneously reduce both CO2 emissions and pollutant releases through adjusting industrial structure by phasing out inefficient facilities and production processes while shifting toward cleaner energy and production methods [27]. Centralized infrastructures and collaborative management within the parks enable the implementation of measures and strategies that enhance the co-control of both CO2 and local pollutants. To evaluate the policy effects on reductions, this study introduces the CPCRI consisting of emission intensities of various major pollutants at the city level. The following hypothesis is proposed:
Hypothesis 1:
NEIPs enhance the synergistic reduction in pollution and carbon emissions.
The first pathway involves technological innovations. The industrial symbiosis model enables material recycling and energy cascading among enterprises within the parks, which creates a demand for green technologies [28]. Concurrently, the industrial agglomeration within NEIPs accelerates technological innovation and stimulates the emergence of new businesses endogenously, which is facilitated by closer collaborations, improved information flows, and more powerful incentives [29]. This process, which reduces pollution and carbon emissions simultaneously, is measured by the number of invention patents granted per 10,000 people at the city level.
The second pathway involves reducing energy intensity. The establishment and operation of an NEIP require a systematic optimization of the energy system, primarily through building shareable energy infrastructure and its green, low-carbon transformation, with a particularly significant impact on the power sector [30]. NEIPs facilitate the development of energy facilities, such as smart grids, high-efficiency power transformers, integrated energy management platforms, and advanced heating/cooling systems, which reduce the inefficiencies of the energy system [31,32]. Concurrently, the infrastructures are progressively decarbonized by adopting renewable energy and carbon capture technology [6,33]. This systemic optimization improves energy efficiency, directly reflected in lowered energy intensity. Given the centrality of electricity in industrial production and its emission footprint, we will use “electricity intensity” (electricity consumption per unit of industrial output) as a primary indicator to capture changes in energy intensity [34]. These two pathways are intercorrelated; technological innovation enables deeper energy system optimization, while efficient infrastructure provides practical applications for technological innovations. As a result, industrial agglomeration within NEIPs brings a structural shift in NEIPs towards advanced sectors featuring high technology, great value added, and low resource consumption, ultimately achieving co-control of local pollution and carbon emission [35]. Thus, the following hypothesis is proposed:
Hypothesis 2:
NEIPs enhance the pollution and carbon reduction performance of cities where NEIPs are located through two pathways: fostering technological innovation and lowering energy intensity.

3. Methodology and Data

3.1. Carbon-Pollution Co-Reduction Index Construction

A composite index that integrates multiple pollutants and carbon emissions is essential to evaluate the synergistic reduction effects of NEIPs. Accordingly, this study introduces the Carbon-Pollution Co-Reduction Index (CPCRI). Considering data availability and the relevance of pollutants to the synergistic reduction, the intensities (number of emissions per unit of GDP) of industrial SO2, dust and fumes, wastewater, and CO2 are selected as the component indicators. This study uses emission intensity rather than total emissions, because intensity takes the level of economic activity into account and therefore provides a more reasonable basis for comparative assessment. The weights of the component indicators in the CPCRI are determined by the entropy weight method (EWM), which offers the advantage of minimizing the subjective interference in weight determination, thereby enhancing the objectivity of the weights [36,37].
The first step involves standardizing the values as follows:
Y i j = m a x ( x i j ) x i j m a x ( x i j ) m i n ( x i j )
P i j = Y i j j = 1 m Y i j
where xij is the value of the jth indicator in the ith sample. max(xij) and min(xij) are the maximum and minimum values of the jth indicator, respectively. Yij is the standardized value of the jth indicator in the ith sample. Pij is the proportion of the jth indicator in its ith sample. m is the number of samples.
The information entropy value, Ej, of the jth indicator is defined as follows:
E j = i = 1 m P i j × ln P i j ln m
If Pij = 0, then define Pij × ln P i j = 0.
The entropy weight is determined by the following equation:
w j = 1 E j n j = 1 n E j
where n is the number of the component indicators.
Consequently, the CPCRI is obtained by the following equation:
C P C R I = j = 1 n Y i j × w j

3.2. Variable Definition

3.2.1. Dependent Variables

The dependent variable of this study is the CPCRI of each city in the Yangtze River Delta, China, from 2003 to 2021. The index is calculated by the EWM as described in Section 3.1.

3.2.2. Core Explanatory Variables

The core explanatory variables are the dummy variable of cities that constructed NEIPs, an interaction term (treat × period) of the group dummy variable, treat, and the time dummy variable, period. If the sample city has constructed an NEIP, the group dummy variable, treat, takes 1, or it takes 0 otherwise. The time dummy variable, period, takes 1 for the year of the first NEIP’s establishment and years thereafter when the sample city has an NEIP; otherwise, it takes 0.

3.2.3. Control Variables

The control variables are selected to better reflect the co-reduction effects of NEIPs by excluding the factors that may affect the policy effects. Therefore, taking data availability into account, the following control variables are selected: (1) the level of the urban economic development, measured by the logarithm of regional per capita GDP (lnGDP), (2) population density, measured by the city population divided by the city space (pop_density), (3) industrial structure, measured by the ratio of tertiary industry value added to secondary industry value added (indus_stru), and (4) regional trade openness, measured by the logarithm of the city’s foreign direct investment (lnfdi).

3.3. Model Specification

3.3.1. Benchmark Model

The staggered difference-in-differences model is a useful technique to evaluate the causal effects of policy interventions at multiple time periods by comparing changes in results between treatment and control groups [38]. This study considered the establishment of NEIPs as a quasi-natural experiment, where the cities that had the EIPs before 2021 were set as the treatment group, and other cities were set as the control group. The benchmark model is constructed as Equation (6):
C P C R I i t = β 0 +   β 1 N E I P i t   +   β 2 C o n t r o l i t + μ i + λ t + ε i t
where i and t represent the city and year, respectively. CPCRIit represents the Carbon-Pollution Co-Reduction Index of city i in year t. NEIPit represents a dummy variable indicating whether the sample city i has established an NEIP. Controlit represents a set of control variables. μi is the city fixed effect, and λt is the time fixed effect. εit is the random error term. β1 is the core coefficient, which indicates the net effect of NEIPs on the CPCRI of the city. If β1 is significantly positive, it means that NEIPs could significantly reduce pollution and carbon emissions at the same time.
The prerequisite for applying the SDID model is that treatment and control groups do not have systematic differences in the pre-policy period. This requires us to pass the parallel trend test. To further validate the parallel trend assumption, a joint significance test (F-test) on all pre-treatment coefficients is performed. The null hypothesis of the test is that the pre-treatment coefficients are jointly equal to zero. The event study method was conducted for this purpose [39]:
C P C R I i t = β 0 + q = 5 5 β k × N E I P i , t + q   + β 2 C o n t r o l i t + μ i + λ t + ε i t
where NEIPi,t+q is an indicator variable for event time q. q represents the year relative to NEIP establishment. βk reflects the dynamic effects of NEIPs on CPCRI. To mitigate multicollinearity, the year before the NEIP establishment was excluded (k ≠ 1).

3.3.2. Coupling Coordination Degree

The CPCRI, constructed via the EWM, is able to effectively measure the policy effects on emission intensities across four pollutants. However, it lacks the ability to quantify the synergy among the component indicators. To better capture the synergistic reduction, the coupling coordination degree (CCD, denoted as D) is introduced.
CCD is computed based on the four emission intensity subsystems. Each subsystem’s performance is measured by weighting its standardized emission intensity with the EWM, which is the Y computed in Section 3.1.
Coupling degree (C) reflects the strength of interaction between the four subsystems and is specified by the following equations:
C = Y 1 × Y 2 × Y 3 × Y 4 ( Y 1 + Y 2 + Y 3 + Y 4 ) 4 4  
where C ∈ [0, 1]. Y1, Y2, Y3, and Y4 are the standardized emission intensities of industrial wastewater, industrial SO2, industrial dust and fumes, and CO2, respectively.
The CCD between the pollutant emission intensities is calculated by the following formula:
D = C × T
where D ∈ [0, 1] denotes the degree of coupling coordination between the four pollutants. T is the CPCRI, which represents the co-reduction performance of the pollution and carbon emissions.
Then, the CCD is integrated with CPCRI to construct a new index (I) that better captures the level of overall reduction performance and the synergistic relationship between its components. The index, I, is calculated by the following equation:
I = w 1 D × w 2 C P C R I
where I represents the comprehensive performance of the city’s reduction performance and synergy among pollutants. w1 and w2 are the entropy weights of D and CPCRI.

3.3.3. Mechanism Test Model

As pollution and carbon emissions are closely correlated to technological innovation (innovative patents per unit of population) and energy consumption (electricity consumption per unit of industrial value added), it is essential to examine whether both factors serve as the underlying mechanisms through which NEIPs affect city-level pollution and carbon emissions. Therefore, a mechanism test model is required and specified by the following equations:
M i t =   α 0 + α 1 N E I P i t + α 2 C o n t r o l i t   +   μ i   + λ t   + ε i t
C P C R I i t = β 0 + β 1 N E I P i t + θ   N E I P i t × M i t + β 2 C o n t r o l i t + μ i + λ t + ε i t
where Mit is the mediator, representing the effects of NEIPs on the technology innovation and electricity consumption per unit of industrial value added. NEIPit × Mit represents an interaction term between the policy dummy variable and the mediator. θ measures the co-reduction effects of pollution and carbon emission caused by the interaction term, whereas β1 measures the effect of the co-reduction through other factors excluding the mediating variables.

3.4. Data

This study employed panel data from 41 cities in the Yangtze River Delta region spanning 2003–2021 to quantify the impact of NEIPs on co-reduction in city-level pollution and carbon reduction levels. Cities with NEIPs are set as the treatment group, and the others are set as the control group. The city-level CO2 emission data are obtained by using a 1 km × 1 km raster of global CO2 emissions from the website of the Center for Global Environmental Research (CGER) [40], and then QGIS 3.22.5 is applied to calculate CO2 emissions in the Yangtze River Delta cities, clipped from China’s city-level administration shapefile. The city-level pollutant emission and control variable data are derived from the City Statistical Yearbooks [41]. Since the statistical yearbooks of different cities provide varying completeness of the data, some of the cities have missing data for certain years. Linear interpolation is employed to fill the missing data.
Table 1 presents the descriptive statistics for the dependent variable, CPCRI, and control variables. The balanced dataset consists of 779 observations. With a mean of 0.501, CPCRI exhibits a moderate variation (SD = 0.165) and a roughly symmetric distribution (skewness = 0.297). In contrast, the control variables display significantly different distributional characteristics. Specifically, the right skewness and high kurtosis of population density, as well as the ratio of tertiary industry value added to secondary industry value added, reflect the substantial disparities in city size and industrial structure across cities in the Yangtze River Delta. The data summary highlights the necessity for heterogeneity analysis.

4. Results and Discussion

4.1. Carbon-Pollution Co-Reduction Index

Unlike the expert scoring method, which derives weights by consulting multiple experts to assign values based on their judgment and then aggregating those assignments (e.g., by averaging), the EWM determines weights objectively based on empirical data from the Yangtze River Delta. Using the method described in Section 3.1, the weights of each component indicator are determined (Table 2).

4.2. Benchmark Regression Results

Using the method described in Section 3.2.1, the impact of NEIP construction on the CPCRI is evaluated. The benchmark regression results of the DID model are shown in Table 3. The results in Column (1) indicate that the estimated coefficient for the core explanatory variable NEIP is significantly positive at the 1% significance level. Columns (2)–(5) show the results of each control variable being engaged individually, and Column (6) shows the result of all control variables being added. The fixed region and time effects are considered through Columns (1) to (6). The results show that the coefficients remain significantly positive, regardless of whether control variables are added. Compared with cities without NEIPs, cities with NEIPs show a significant increase of 2.3 percentage points in the CPCRI, suggesting that NEIPs can promote the joint performance of pollution and carbon reductions.

4.3. Parallel Trend Test

The prerequisite for using the difference-in-differences method is that there is no significant difference in the CPCRI between the treatment and control groups before the policy is implemented. Otherwise, it cannot be ensured that the policy effect observed in the post-policy period is solely due to the NEIP establishment, rather than the pre-policy differences. In such cases, systematic differences and endogeneity issues may exist [42].
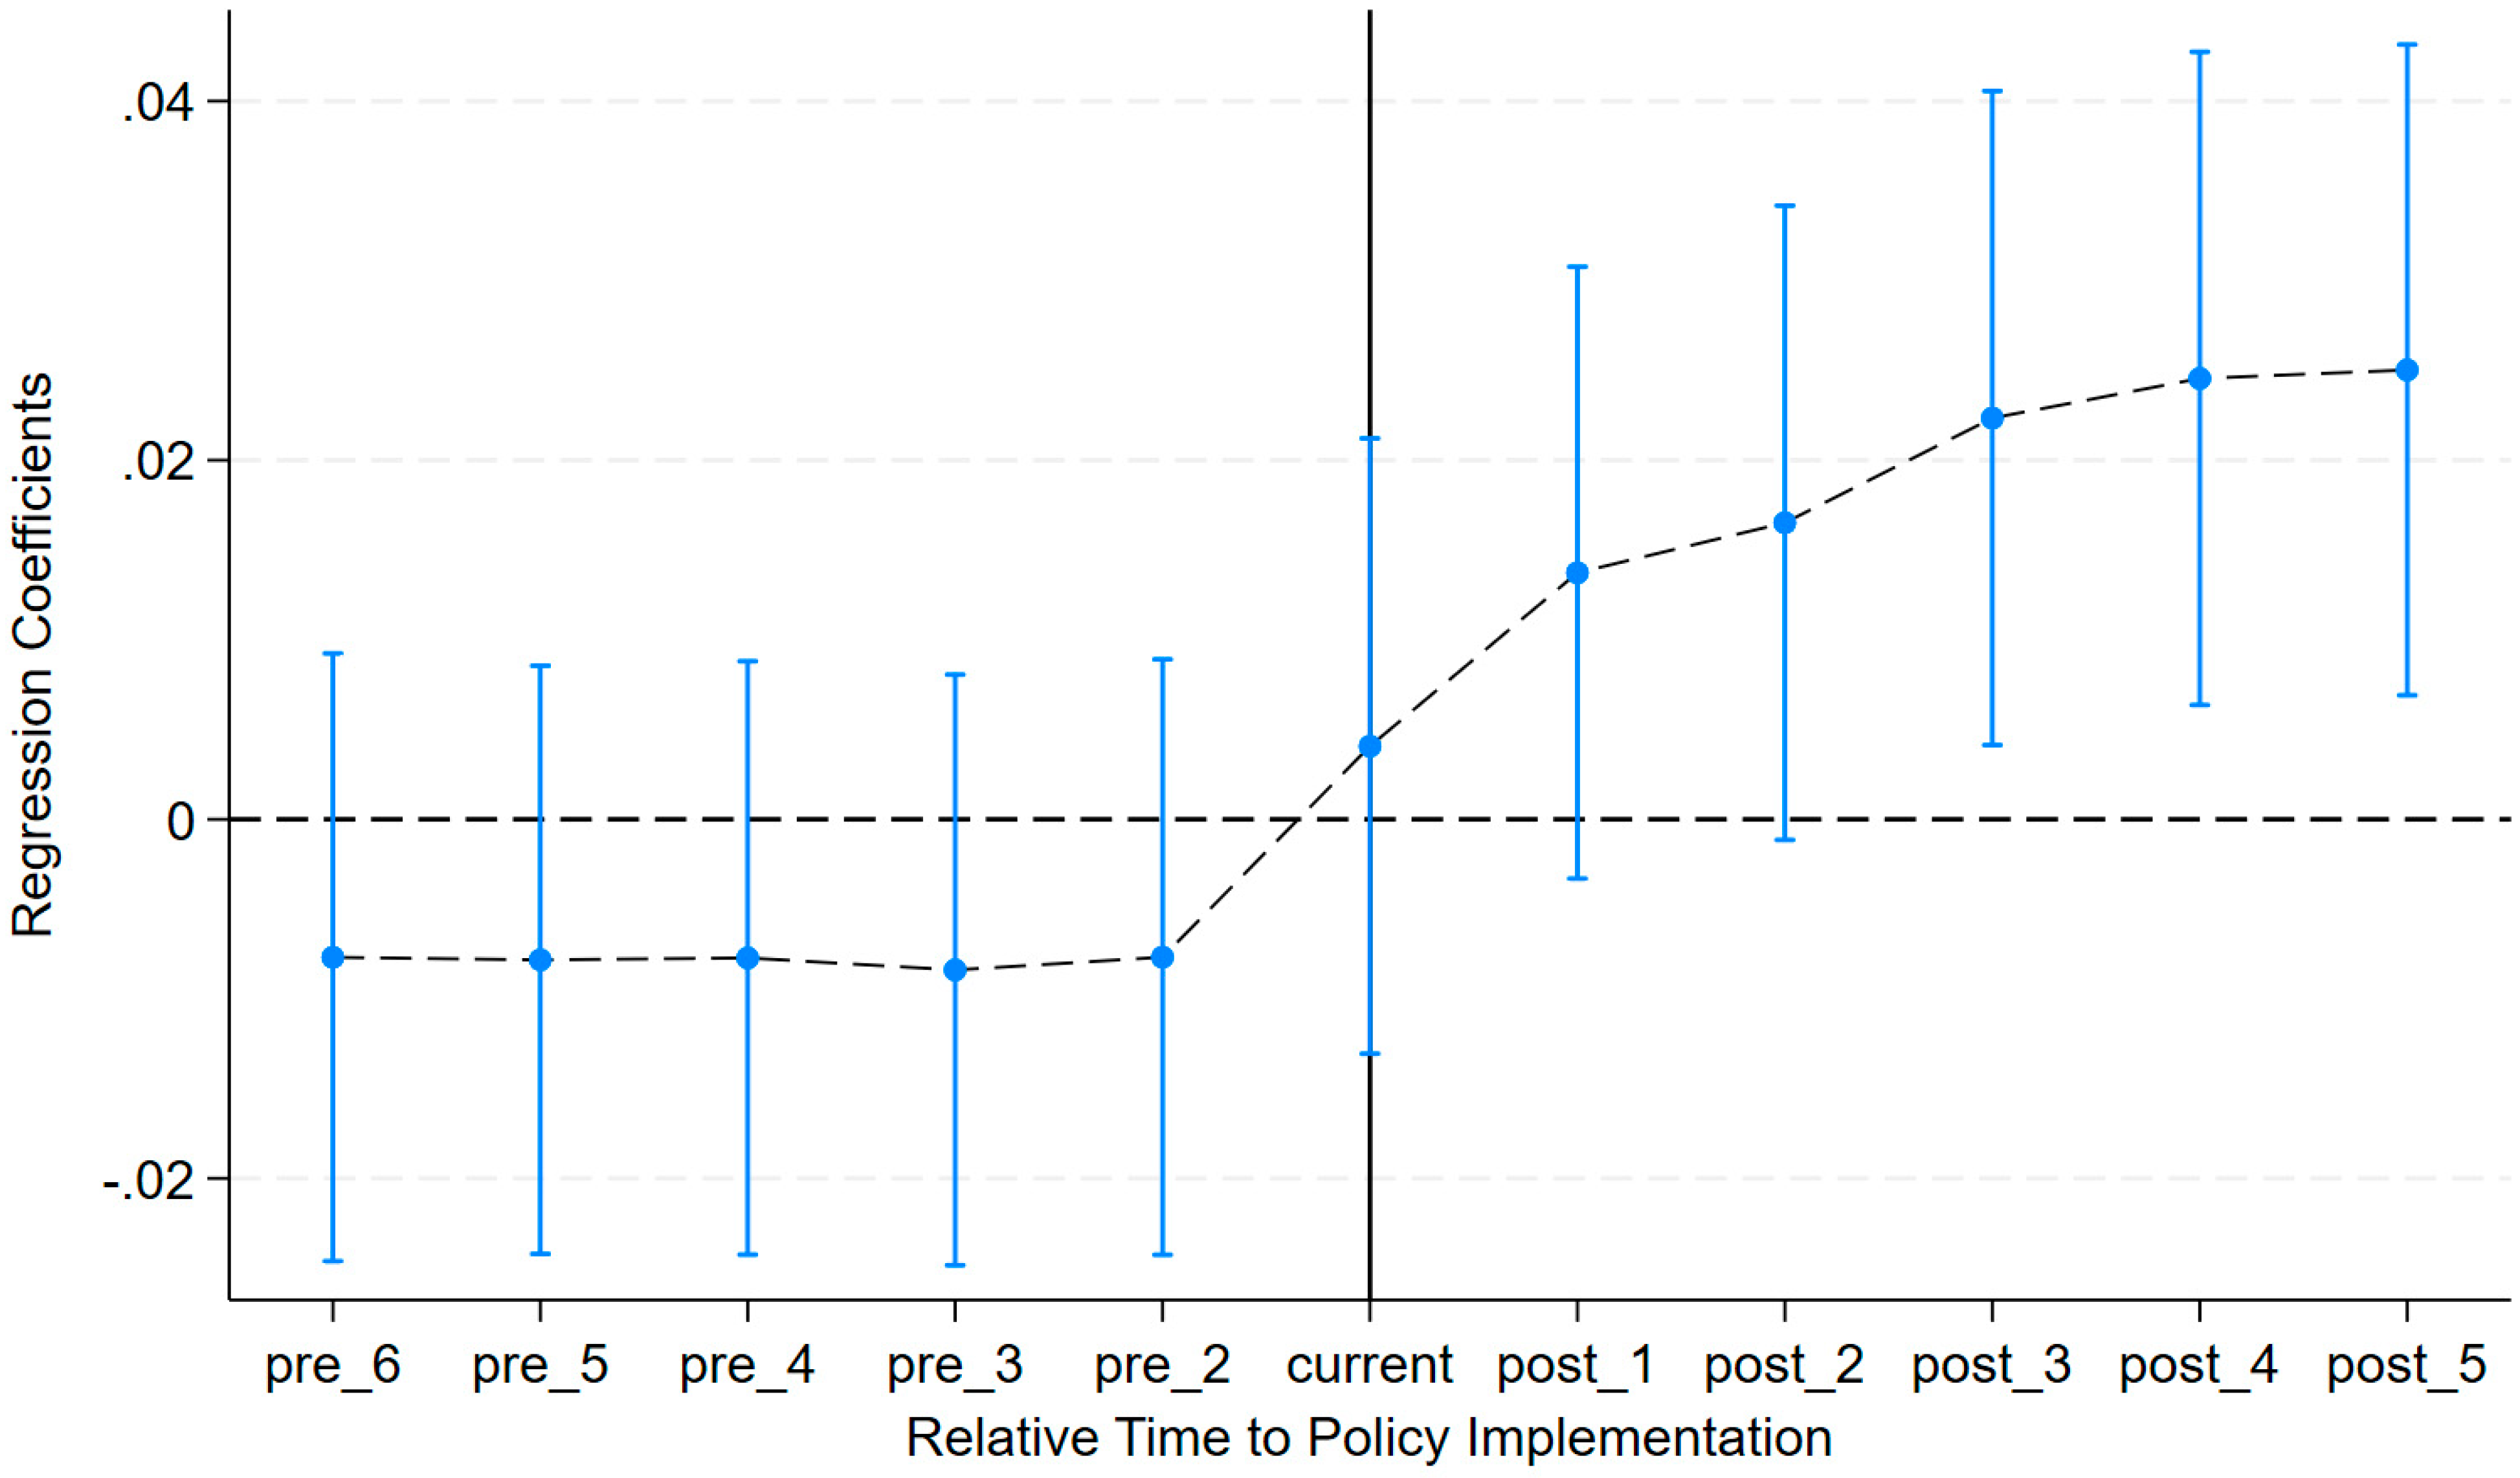
Based on Equation (7), a parallel trend test is conducted (Figure 2). The coefficients before the policy implementation are below 0 and not statistically significant. The result indicates that no significant difference exists between the treatment and control groups before NEIPs are established. Moreover, a joint significant test (F-test) on all pre-treatment coefficients is also conducted to statistically confirm the absence of a systematic pre-existing trend. The result of the F-test fails to reject the hypothesis that all pre-treatment coefficients are jointly equal to zero (F-statistic = 0.64, p-value = 0.70). This result, combined with the observation of Figure 2, provides strong evidence that the treatment and control groups have a parallel trend prior to NEIP establishment.
Although the regression coefficients in the implementation year and the subsequent two years show statistical insignificance, they become significantly positive three years after NEIP establishment and show an apparent increasing trend after NEIP establishment. The finding that the effects of NEIP have a time lag is consistent with the research of Qian et al. on the impact of NEIP on carbon intensity [17]. This observed time lag could be attributed to the time required for NEIPs to undergo infrastructure development, capital investment, firm recruitment, and the gradual formation and development of industrial symbiosis. The result suggests that NEIPs can significantly improve the CPCRI, but with a time lag, and the effect becomes increasingly pronounced over time.

4.4. Placebo Test

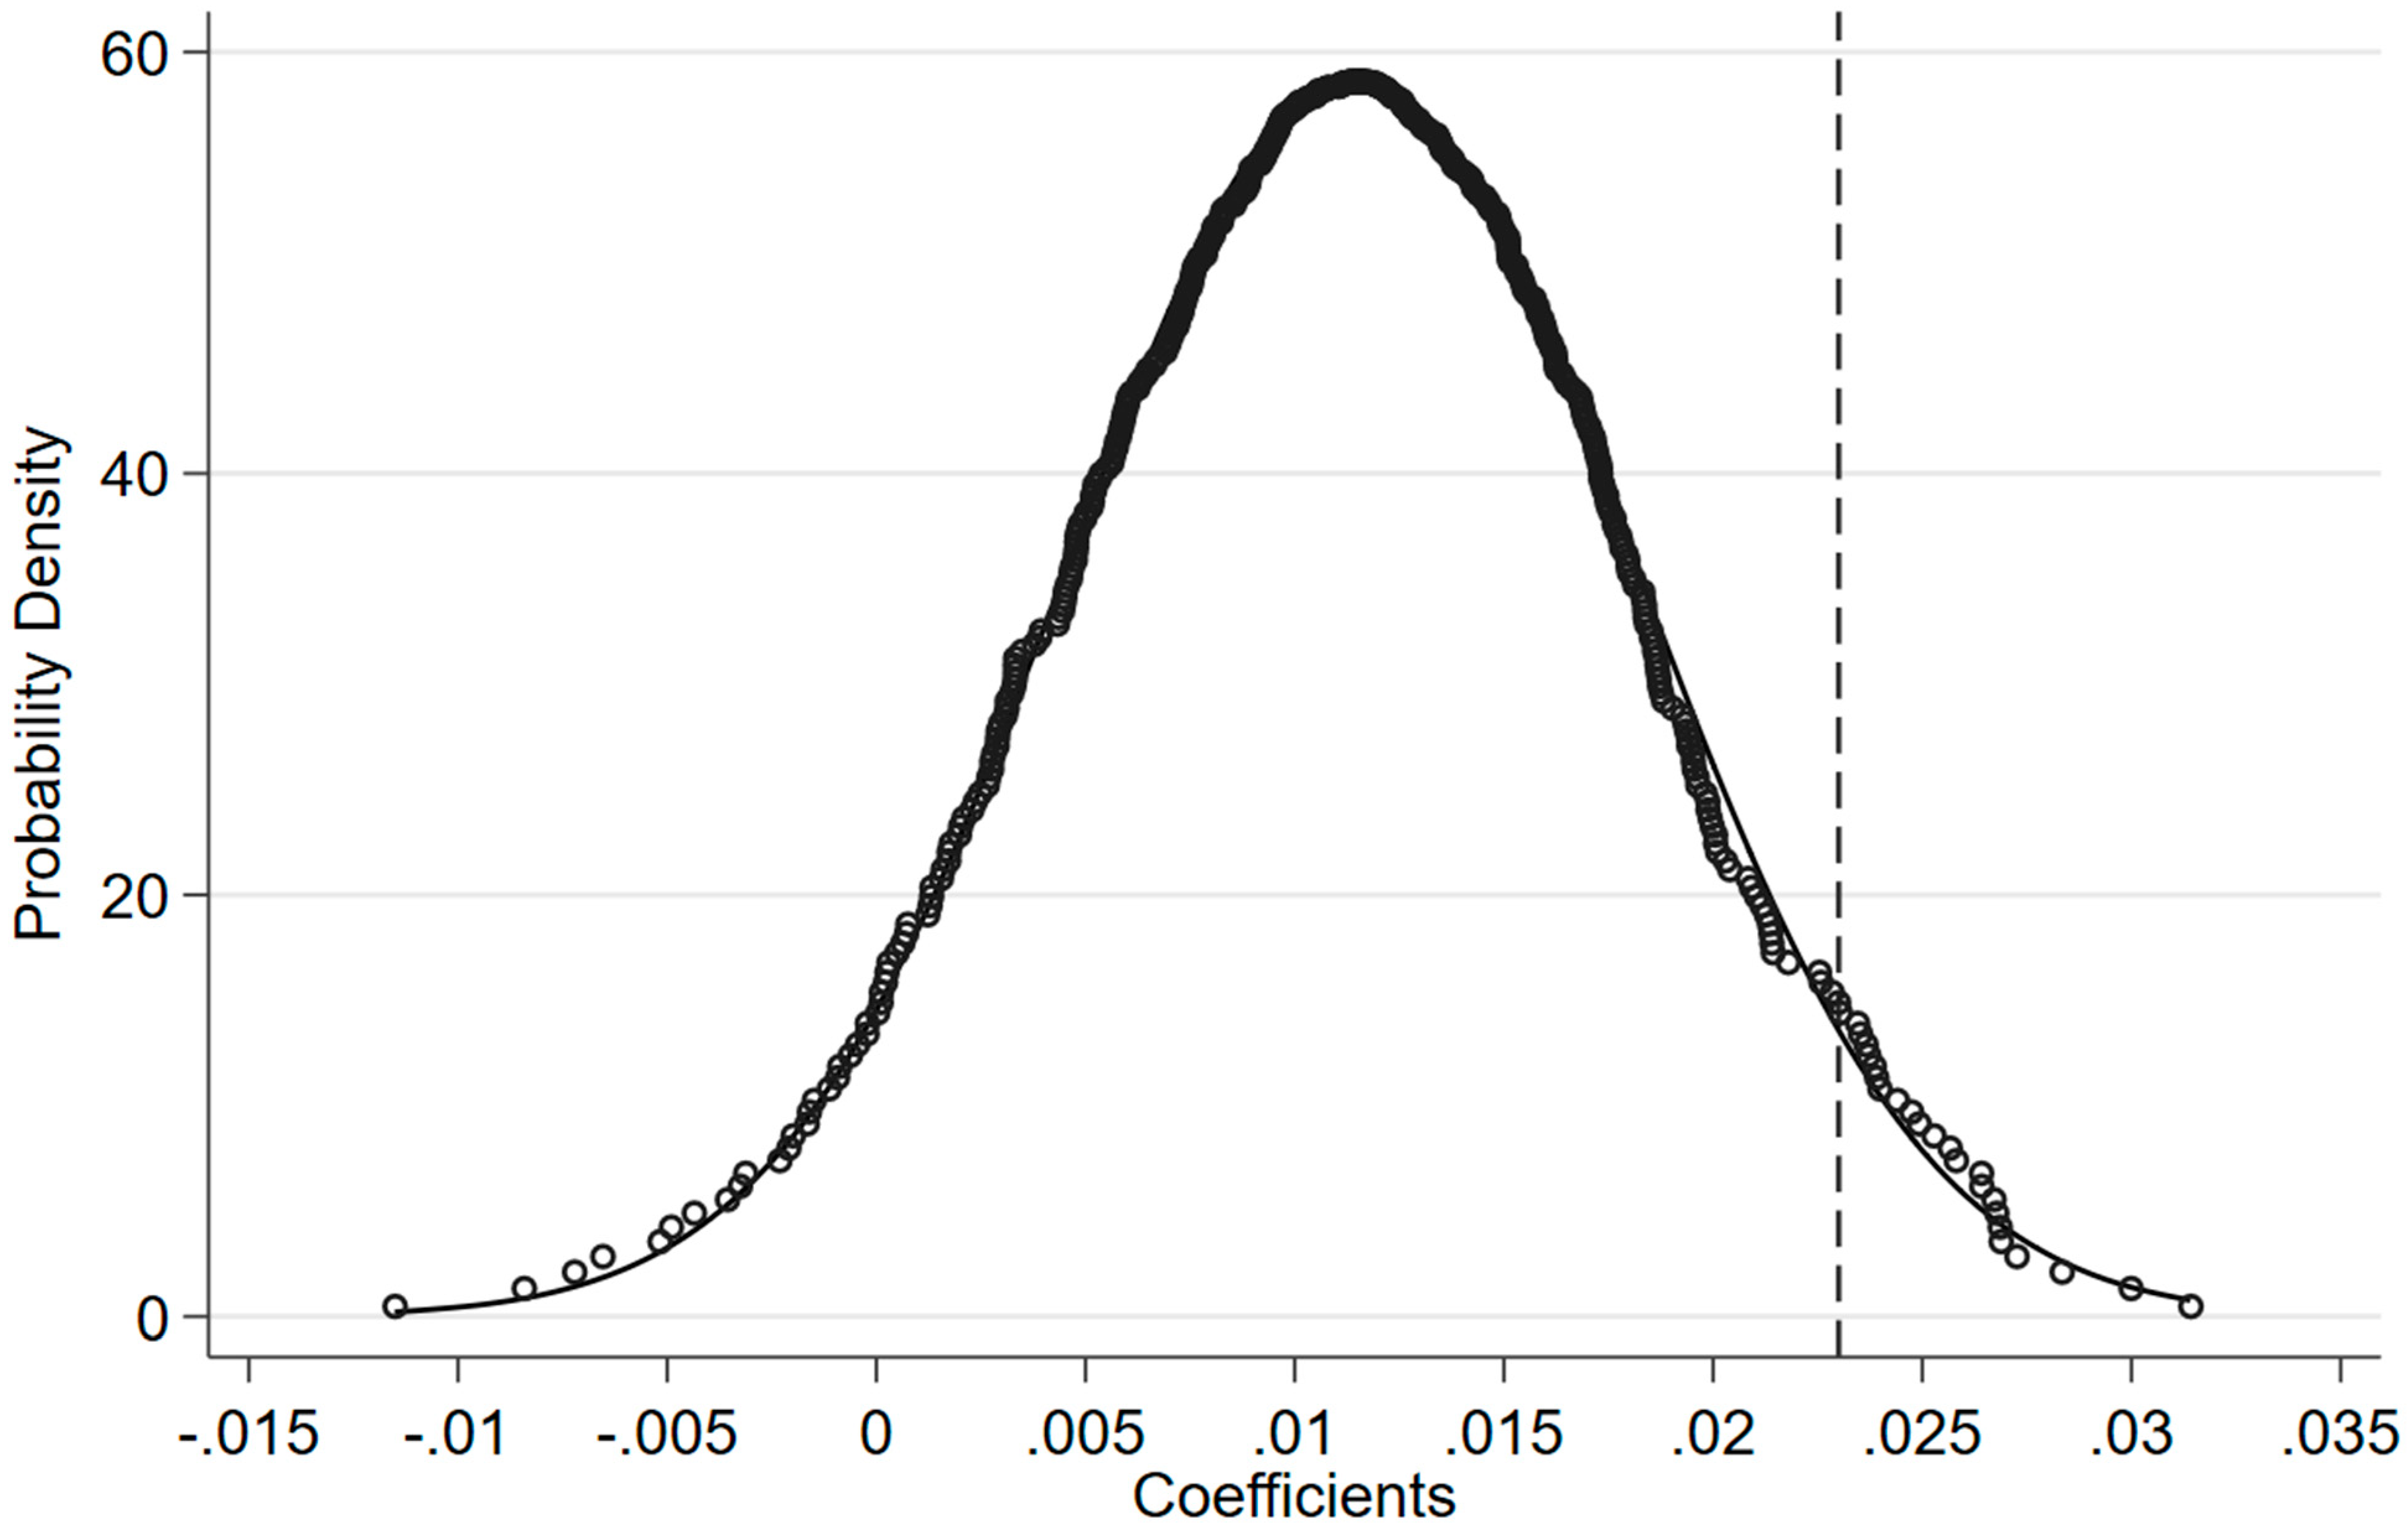
A placebo test is conducted to evaluate whether the observed treatment effect is influenced by unobserved factors or simply by chance rather than the policy implementation [43]. This study performed 500 random assignments of treatment and control groups in the placebo test, and benchmark regressions are conducted to obtain 500 estimated coefficients. The coefficients derived from the random sample regressions exhibit a normal distribution, and the vertical dashed line represents the estimated coefficient obtained from the regression under the actual scenario, with a value of 0.0230 (Figure 3). The mean value of the random DID coefficients is 0.011, with an average p-value of 0.30.
As shown in Figure 3, the coefficients of the random assignments form a distribution centered near zero. The actual coefficient of 0.023 falls in the right tail of this distribution. This result suggests that the likelihood of obtaining an effect as large as the actual benchmark regression by random chance is very low, thus increasing confidence that the observed effect is attributable to the NEIP policy rather than unobserved factors.

4.5. Treatment Effect Heterogeneity

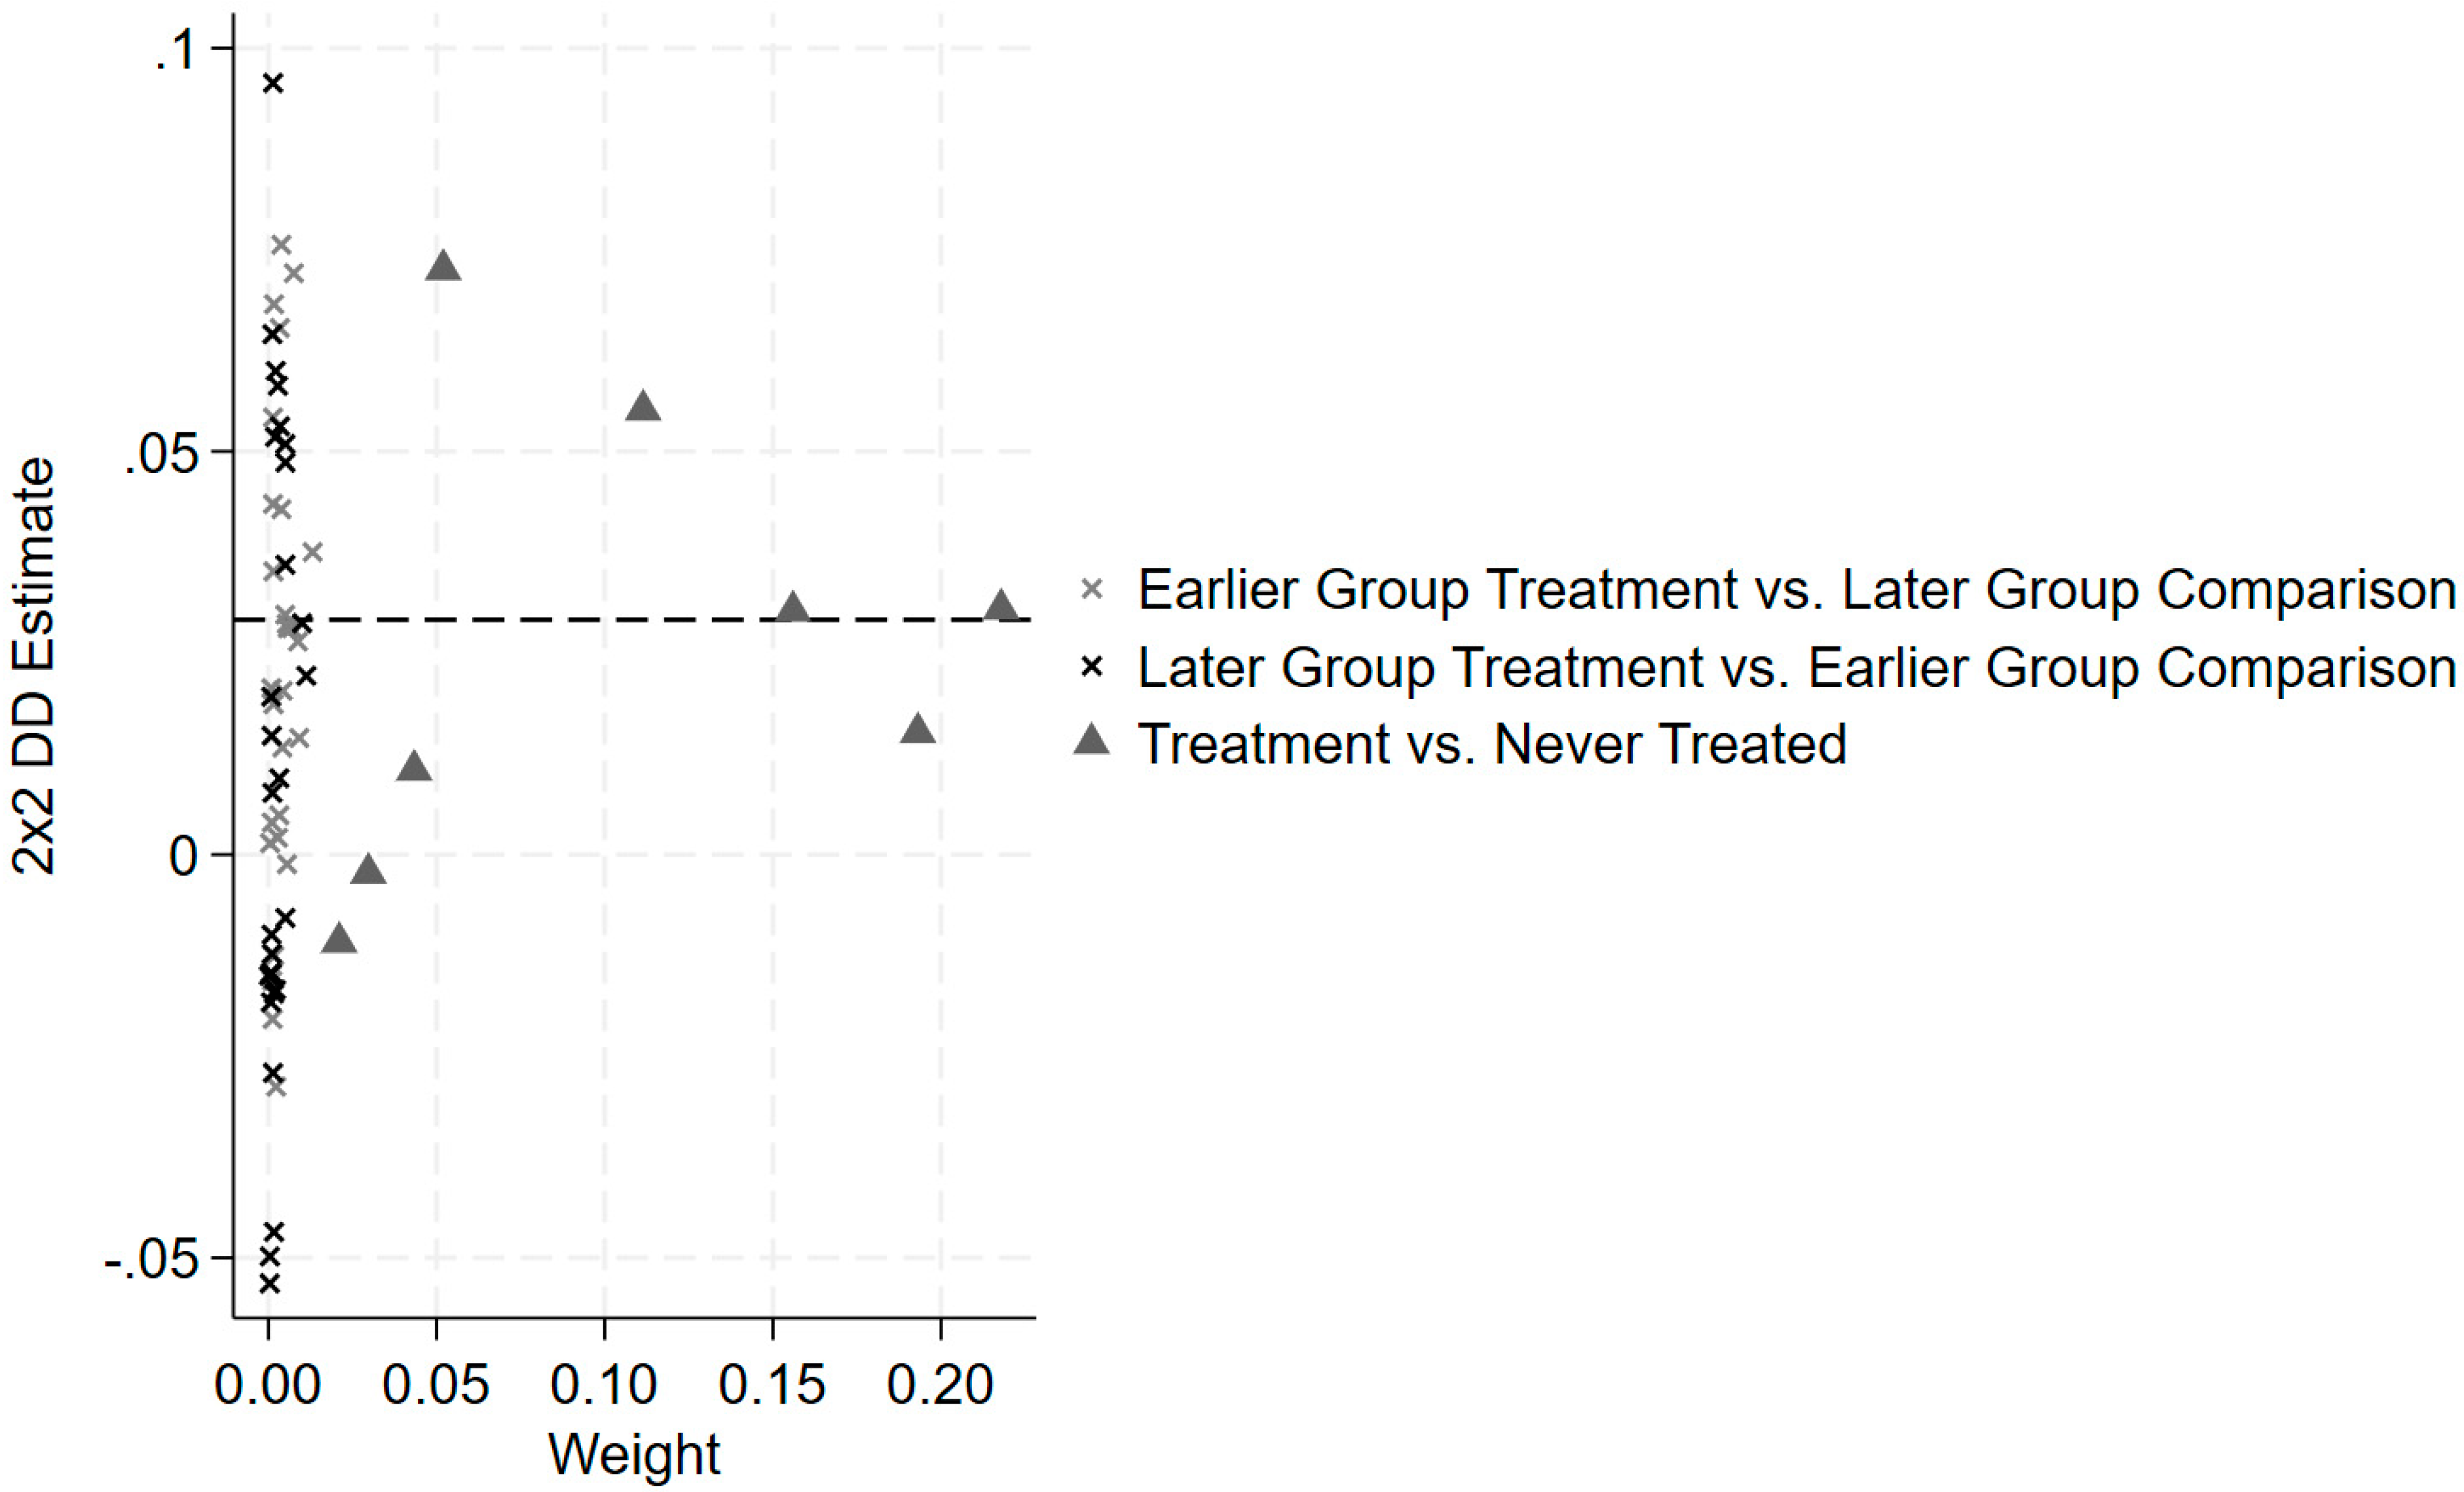
Given that the recent econometric literature has indicated the susceptibility of SDID to biases caused by treatment effect heterogeneity [38,44,45,46], the Goodman-Bacon decomposition is further used to evaluate and validate the robustness of the empirical finding [47]. Since the policy effects may differ in years after implementation for the treatment group, the Goodman-Bacon decomposition is used to evaluate the potential bias introduced by the treatment effect heterogeneity of the two-way fixed-effect SDID method (Table 4 and Figure 4). The Goodman-Bacon decomposition can effectively quantify the impact of the bias when the earlier treatment group serves as a control for the later treatment group [38]. When the earlier treatment group is the control group, the average estimated value of the later treatment group under policy effect is 0.025, with a weight of 7%. The weight of 7% indicates that the 2 × 2 comparison, in which the earlier treatment group serves as the control, makes a limited contribution to the overall TWEF estimate. Therefore, any potential bias originating from this specific comparison is unlikely to affect the result substantively. In addition, the estimated values among the three groups do not have a significant difference and are all positive. Thus, it can be concluded that the impact of bias generated by treatment effect heterogeneity is negligible and does not critically affect the benchmark regression result.

4.6. Propensity Score Matching DID (PSM-DID)

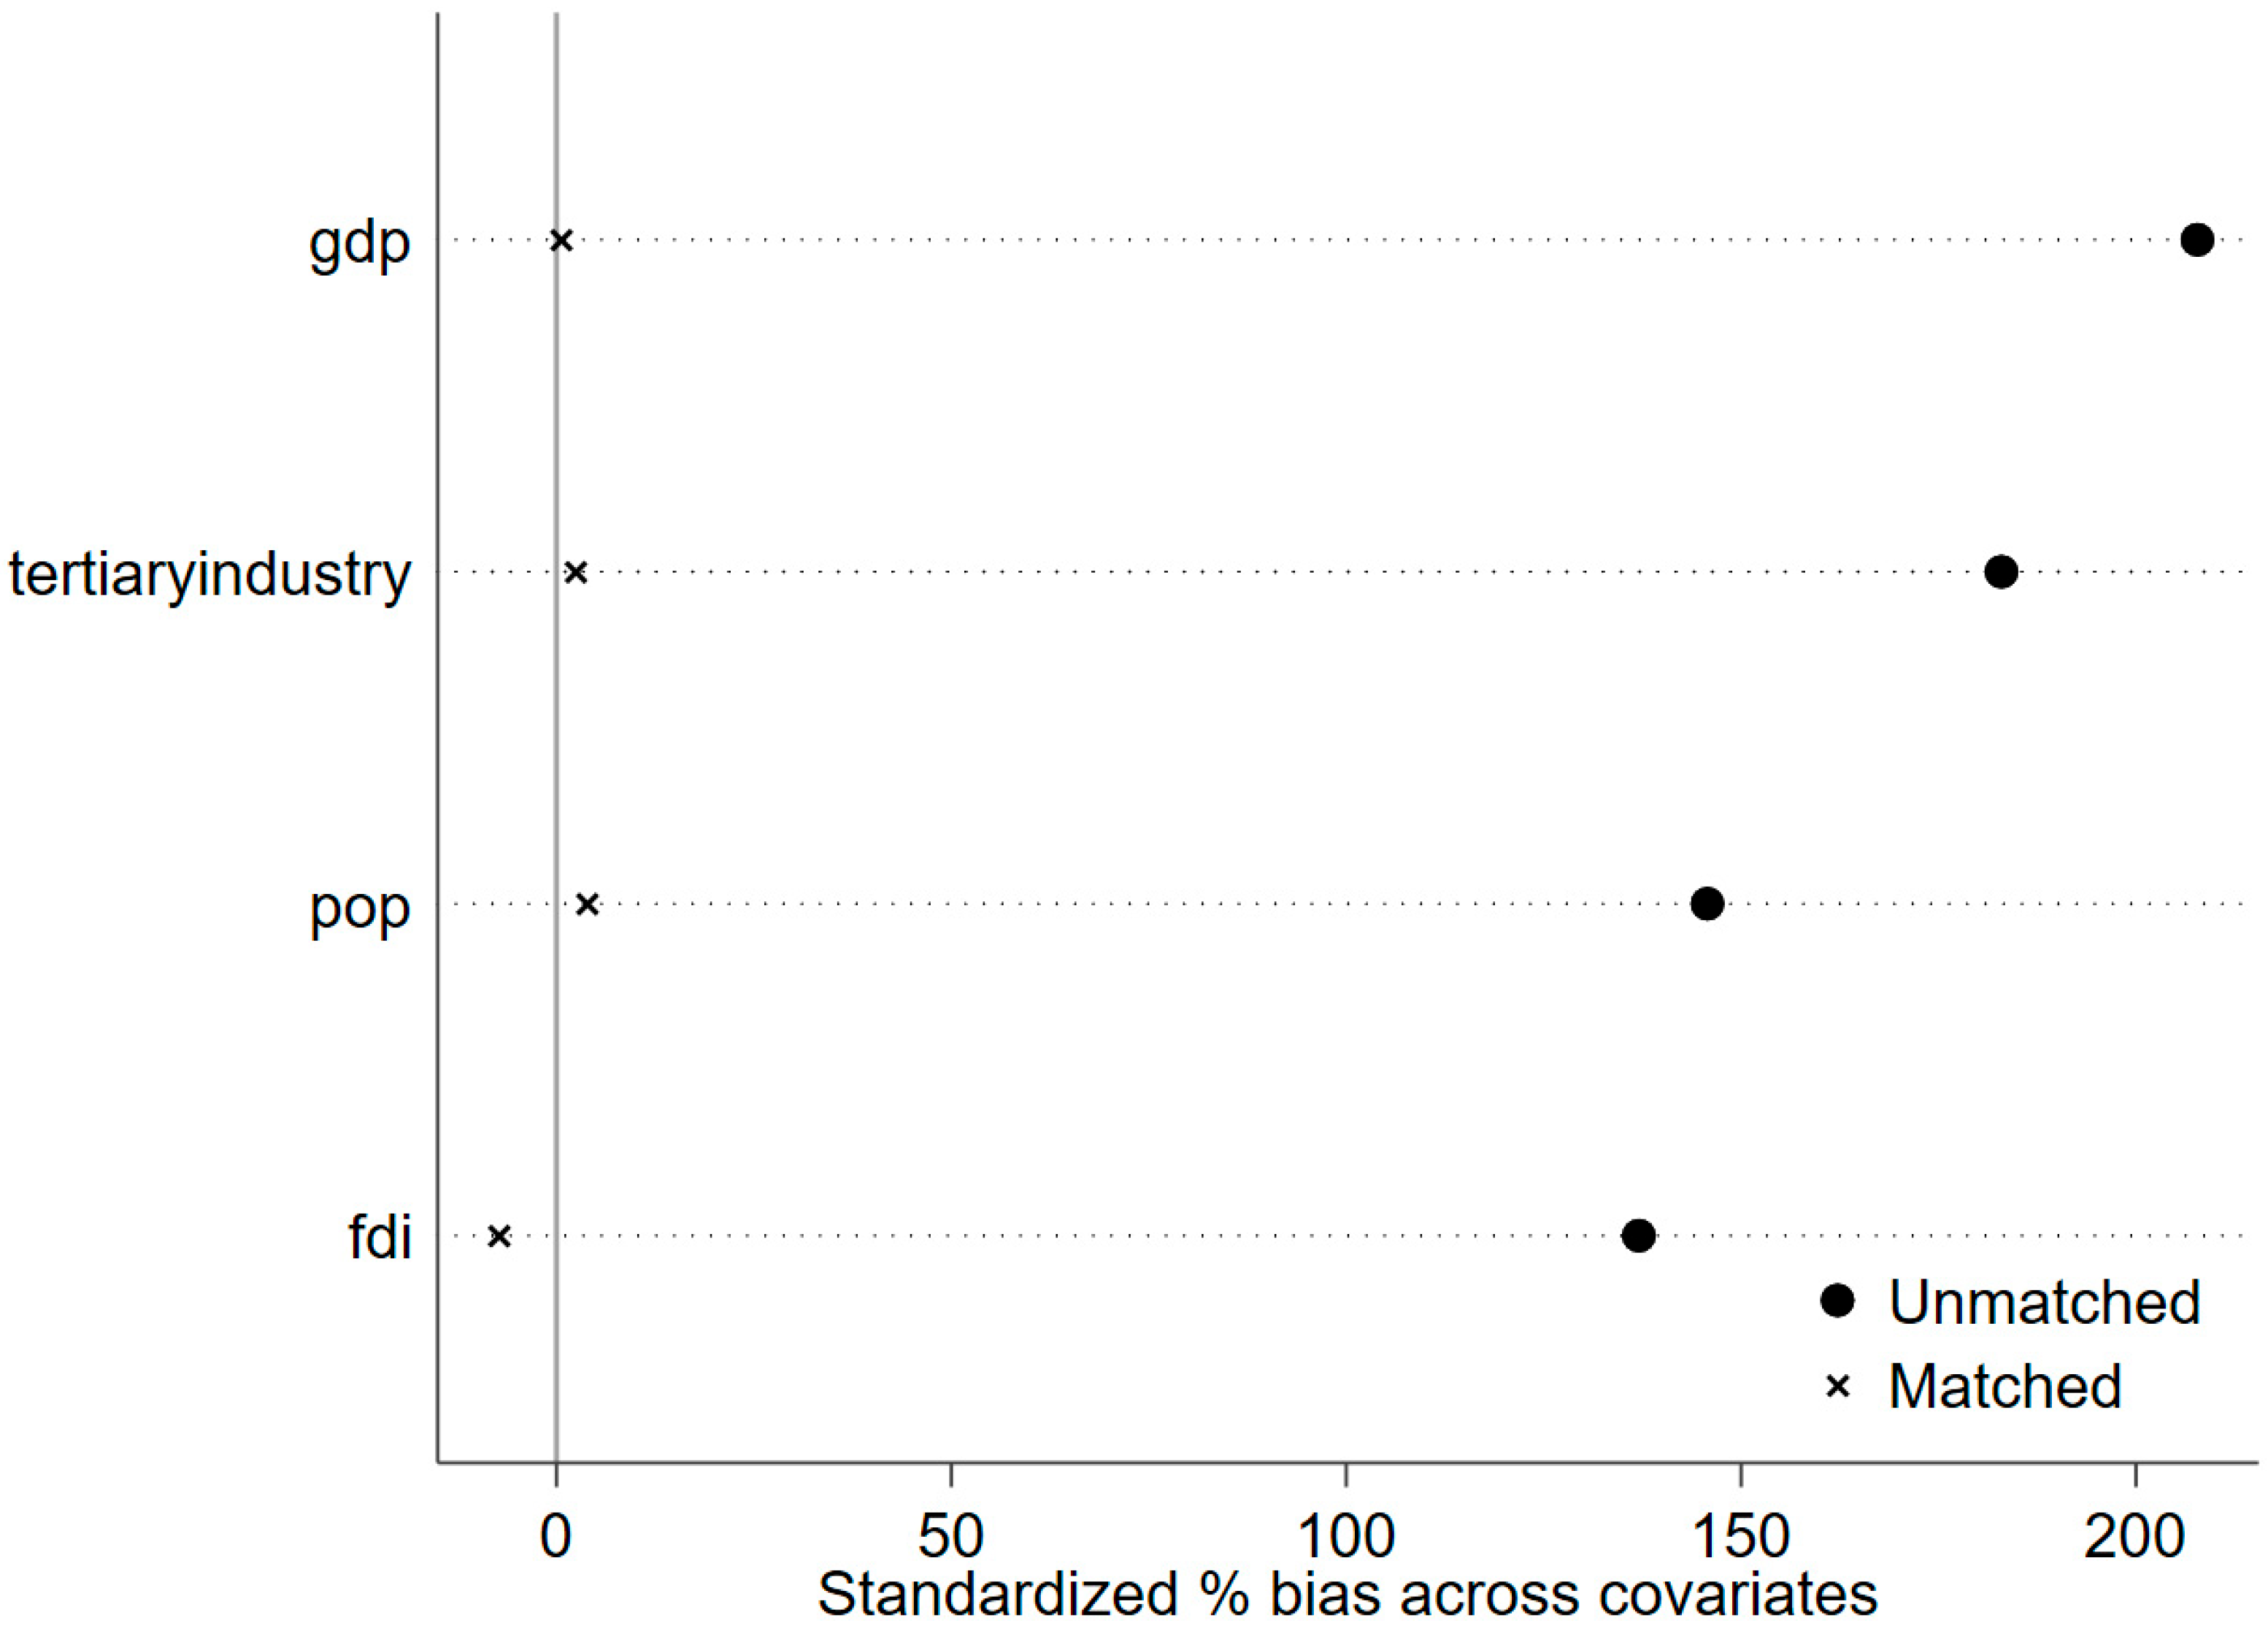
As the SDID method constitutes a quasi-natural experiment, there remains a potential for endogeneity issues arising due to selection bias. The formation of NEIPs is probably correlated with cities’ characteristics, such as economic development, human capital, industrial structure, and capital investment [48,49,50]. Therefore, a PSM-DID method is employed to mitigate this concern and test the robustness of the result (Table 5 and Figure 5). Specifically, a 1:1 nearest-neighbor matching is performed to make the treatment and control groups more comparable based on covariates. The matching result shows that the PSM-DID successfully balances the pre-treatment characteristics between the treatment and control groups. The PSM-DID regression yields a coefficient of 0.0275, which is significant at the 5% level (p-value = 0.018). The result provides robust evidence, confirming a positive and significant policy effect.

4.7. Heterogeneity Analysis

The heterogeneity of cities’ characteristics within the Yangtze River Delta is mitigated due to regional collaboration in the framework of the regional integrated development, but the quantity and intensity of environmental regulations vary over time. Moreover, although the Yangtze River Delta is one of China’s most economically developed regions, it still has disparities in development among its provinces. The economic development and sizes of cities in the region vary. Therefore, in this study, the cities in the Yangtze River Delta are categorized by their respective provinces (excluding Shanghai) and population size. The heterogeneity analyses are conducted, and the regression results are presented in Table 6, Table 7 and Table 8.

4.7.1. Heterogeneity Analysis Based on NEIP Establishment Time

A heterogeneity analysis is conducted to test whether early and late NEIPs both have significantly positive effects on the CPCRI. The original treatment group is divided into two groups based on establishment time: early (2008–2014) and late (2015–2021). The grouping almost evenly splits the treatment group, and 2015 was the last year of “The Twelfth Five-Year Plan”, which effectively advanced environmental protection in China (Table 6). The result indicates that even though the effect of the late NEIPs becomes weaker than before, the effect remains significantly positive regardless of the NEIP establishment time, further supporting the robustness.
Because of an increasing demand for environmental quality in China over the past decade, a series of environmental regulations and policies have been issued successively, which have reduced a substantial amount of environmental pollutant emissions [51,52,53]. By proposing the “dual carbon” goals, China has adopted a series of practices aimed at lowering the CO2 emission intensity [54]. These actions have reduced pollutant and carbon intensities not only in the cities with NEIPs but also in all cities nationwide. As the economy and environmental quality improve, the effects of environmental regulations on emission intensity would be weakened [55,56,57]. Thus, the marginal effects of environmental regulations are a possible reason for the reductions in CPCRI improvements in cities that have established NEIPs over the past decade. The synergistic reduction effect of NEIPs may reflect temporal heterogeneity in implementation effectiveness.
Table 6. Heterogeneity analysis results based on NEIP establishment time.
EarlyLate
NEIP0.0240 ***0.0142 *
Control VariablesYesYes
City Fixed EffectsYesYes
Time Fixed EffectsYesYes
N627589
R-squared0.980.97
* p < 0.1, ** p < 0.05, *** p < 0.01.

4.7.2. Heterogeneity Analysis Based on Administrative Division

According to the benchmark regression results grouped by administrative divisions, NEIPs in Zhejiang most significantly improve the CPCRI, followed by those in Jiangsu, but NEIPs in Anhui do not have a significant impact (Table 7). This disparity is possibly because Anhui Province has a lower degree of urbanization and a more traditional industrial structure, which leads to a less pronounced policy effect [58]. This result aligns with the conclusion of Shen et al., which suggests that when GDP per capita is between CNY 64,153 and 160,714, the effectiveness of environmental regulations correlates positively with economic development; higher economic development corresponds to better effects of environmental regulations [59].
Table 7. Heterogeneity analysis results based on administrative divisions.
AnhuiJiangsuZhejiang
NEIP0.006400.0178 **0.0317 **
Control VariablesYesYesYes
City Fixed EffectsYesYesYes
Time Fixed EffectsYesYesYes
N304247209
Standard Errors0.2450.6640.636
R-squared0.960.970.98
* p < 0.1, ** p < 0.05, *** p < 0.01.

4.7.3. Heterogeneity Analysis Based on City Size

Since the Yangtze River Delta is one of China’s most densely populated regions, by 2021, all its cities had residential populations exceeding one million. Given this context, in the heterogeneity analysis based on city size, a population of five million residents is set as the threshold to distinguish between large cities and small-to-medium-sized cities within the region. Of the 18 large cities, only 4 have not established NEIPs; among the 23 small-to-medium-sized cities, 19 have yet to establish NEIPs.
Referring to the benchmark regression results (Table 8), establishing NEIPs exhibits a significantly positive impact only on cities with a population above five million, while showing no significant effect on small-to-medium-sized cities. This distinction may arise, because large cities have well-developed infrastructures, more advanced industrial structures, lower pollutant and carbon emission intensities, and easier access to green technologies and relevant human capital [59].
Table 8. Heterogeneity analysis results based on city size.
Big CitiesSmall-to-Medium-Sized Cities
NEIP0.0430 ***−1.22 × 10⁻³
Control VariablesYesYes
City Fixed EffectsYesYes
Time Fixed EffectsYesYes
N342437
R-squared0.970.96
* p < 0.1, ** p < 0.05, *** p < 0.01.

4.8. Changing Explained Variable

To better understand the synergistic reduction and the extent of impact on each emission, the dependent variable is substituted by the component indicators from the index (CO2 intensity, industrial SO2 intensity, industrial dust and fume intensity, and industrial wastewater intensity) (Table 9). The result demonstrates that except for dust and fume, NEIPs significantly reduce the emission intensity of the other three pollutants, with the greatest reduction observed in SO2. The effect on the industrial dust and fumes is insignificant, because dust and fumes, compared to other pollutants, originate from more dispersed and non-point sources, in addition to severe dust and fume pollution by industries like cement production being difficult to mitigate [60].
Since the extensive development of NEIPs in the Yangtze River Delta, multiple cities have more than one NEIP. To avoid the accumulation effects of a consecutive construction of NEIPs, a regression excluding the cities that have over two NEIPs (Shanghai, Nanjing, Suzhou, Wuxi, and Changzhou) is conducted. The result is shown in Column 5 of Table 9. The coefficient remains significantly positive, which indicates that the accumulation of NEIPs in those cities insignificantly influences the synergistic reduction in pollution and carbon emissions.

4.9. Coupling Coordination Degree Analysis

To address the “synergy” in the CPCRI, the CPCRI integrates the coupling coordination degree (D) among all four indicators. The coupling coordination degree model goes beyond merely capturing co-existence of reductions to quantitatively evaluate the intensity and quality of interaction among four indicators. A higher D value indicates that carbon and local pollution reductions are not only progressing simultaneously but are also in a state of synergy.
Accordingly, the new index is constructed using the entropy weight method to objectively assign weights to original co-reduction performance and D. This index better reflects the level of overall emission reduction and synergistic relationship between its component indicators.
Table 10 presents the benchmark DID regression results for the new index, with NEIPs as the core explanatory variable and a set of control variables. The results are robust, validated by the parallel trend test and placebo test (Figures S1 and S2). As shown in Table 10, compared with cities without NEIPs, cities with NEIPs show a significant increase of 1.97 percentage points in the new index at the 5% significance level, indicating that NEIP establishment significantly promotes the co-reduction in carbon and local pollution, as well as the coordinated and synergistic relationship among the pollutants. Therefore, the positive effect of NEIPs is not only demonstrated in the joint performance of reductions but also in the synergy of this process.

4.10. Mechanism Test Analysis

To empirically examine the mechanisms proposed in Section 2, the mediating effects of technological innovation and energy intensity are tested (Table 11). First, to investigate technological innovation, the number of invention patents granted per 10,000 people is used as the mediating variable. Second, to capture the reduction in energy intensity from infrastructure sharing and greening, electricity intensity, measured by electricity consumption per unit of industrial value added, serves as a direct and precise proxy for energy intensity [32]. The mechanism test analysis directly examines how NEIPs influence cities’ CPCRI through these two channels. To address the concerns of endogeneity from unobservable factors, the placebo tests are conducted to validate robustness (Figures S3 and S4).
When the number of invention patents and electricity intensity are the explained variables, the estimated coefficients are 1.016 and −84.52, respectively, and both are statistically significant. The result suggests that NEIPs significantly promote technological innovation and reduce energy intensity.
The interaction terms to assess how these mechanisms shape the impacts of NEIPs on the CPCRI are further tested. For technological innovation, the estimated coefficients on NEIP and NEIP × TI are 0.0179 and 0.00362, respectively, both positive and significant. This finding indicates that the positive effect of NEIPs on CPCRI is enhanced by stimulating technological innovation.
Regarding the interaction term with energy intensity, the estimated coefficients are 0.0857 (NEIP) and –1.13 × 10⁻⁵ (NEIP × EC). The positive direct effect of NEIPs is consistent with the finding that the parks lower energy intensity, which in turn improves the CPCRI. However, the significantly negative interaction term indicates that the adverse effect of an increase in electricity consumption on the CPCRI is intensified by the NEIP policy. This finding suggests that high electricity consumption poses a potent risk within NEIPs, where its environmental impact is magnified. While NEIPs significantly promote the synergistic reduction in pollution and carbon emissions, their environmental performance is highly sensitive to electricity consumption. Thus, the strict control of energy consumption and incentives for sustainable energy within NEIPs are imperative for optimizing the effect of NEIPs on the synergistic reduction.

5. Conclusions

5.1. Conclusions

This study investigates the effects of establishing NEIPs in the Yangtze River Delta region on the synergistic reduction in pollution and carbon emission at the city level. An SDID model is adopted to analyze the impact of NEIPs on cities where they are located. To evaluate synergistic reduction, CPCRI, a composite measure incorporating carbon emission intensity and major industrial pollutant emission intensities, is introduced. The analysis is based on panel data from 41 cities in the Yangtze River Delta from 2003 to 2021.
The results show that NEIPs have significantly improved the cities’ synergistic reduction in pollution and carbon emissions. This remains true through a series of robustness tests. Besides the direct impact, the technology innovation and energy intensity are effective driving mechanisms for the synergistic reduction in pollution and carbon emissions. However, the heterogeneity analysis indicates that the administrative division and city size could affect the effectiveness of NEIP policy implementation. The economic development, industrial structure, and infrastructure construction are important factors that may affect the effects of NEIPs. Moreover, although environmental regulations over the past decade, which affect all cities in the region, have weakened NEIPs’ synergistic reduction due to the marginal effect, NEIPs still generate a significantly positive effect.
In addition, NEIPs significantly reduce emissions of CO2, industrial SO2, and industrial wastewater in the cities where NEIPs are located. The impact on SO2 emissions is the most pronounced among the component indicators, but the policy did not exhibit a statistically significant effect on industrial dust and fume emissions.

5.2. Limitations

The study is subject to several limitations. First, the analysis is geographically restricted to China’s Yangtze River Delta region. Although the study area selection helps control regional heterogeneity, the findings may not be fully generalizable to other regions of China, which differ in terms of economic development, resource endowments, industrial structures, or policy implementation contexts. Nevertheless, this study provides a replicable paradigm for research that assesses NEIP effects in other regions. Second, constrained by data availability, the study evaluates policy effects at the city level and does not examine finer spatial scales such as counties, districts, or even enterprises. Future research could utilize more adequate data to explore the policy effects at smaller spatial scales, which would provide deeper insights into micro-level mechanisms. Moreover, during the research period, the CO2 emission data released by CGER was only up to the end of 2021, which cannot reflect the policy effect in the framework of the current policy environment, especially with the dual carbon target being introduced. Future research could further refine mechanism analysis by using indicators that better reflect the pathways, such as the number of symbiosis-specific grants and shared infrastructures utilized or the consumption of sustainable energy. As statistical data continue to improve, subsequent studies will also be able to include more indicators and control variables, enabling more precise and comprehensive evaluations of NEIP performance.

5.3. Policy Implications

Based on these conclusions, the following policy implications are proposed:
For the government, the Yangtze River Delta should continue to advance the development of NEIPs as a key strategy for achieving synergistic reduction in pollution and carbon emissions, since the empirical analysis has already proved that NEIPs have positive effects on co-reduction. From the distribution of eco-industrial parks, a significant concentration is observed in the region centered around Shanghai, encompassing southern Jiangsu and northern Zhejiang, indicating an uneven distribution pattern. There remains substantial potential for the construction of additional NEIPs. However, a region-specific and category-based approach should be adopted when promoting the development of eco-industrial parks. Since significant disparities exist across parks in terms of economic development levels, industrial structure characteristics, pollution patterns, infrastructure development, and other factors, it is essential to implement region-specific and category-based guidance for eco-industrial parks in different regions and of various types. Since the heterogeneity analysis shows insignificant effects in Anhui and small-to-medium-sized cities, the targets should be set based on the city’s developing situation. Moreover, a three-year subsidy is also proposed to address the time lag of the NEIP effects.
For the NEIP management committee, a park-level co-reduction monitoring platform is necessary. This platform can clearly display the current emission status of the park and provide a data basis for further research. Moreover, distributed solar PV and shared energy infrastructure should also be promoted, thereby decreasing the energy cost of enterprises and improving the energy efficiency of the whole park. The industrial division of labor and cooperation among regions and parks can build a collaborative and win–win industrial system. Industrial parks in Anhui, for instance, should explore the model of co-operated parks to absorb green and high-tech industries through partnerships with parks in Shanghai, Jiangsu, and Zhejiang.
For enterprises within parks, collaboration with universities should be encouraged. The Yangtze River Delta has the most abundant educational and scientific resources in the country. The management committee, in collaboration with universities, provides enterprises with technical consulting. The collaboration will allow NEIPs to serve as platforms for the practical application of research results from universities and research institutes, creating a win–win relationship between two stakeholders. Moreover, the enterprises within the park can pilot the government’s “green finance” policy.
For the public, parks should release an “emission reduction progress report”, including company emission rankings (marked as “excellent” and “non-compliant”), and set up a public comment platform. These actions will provide the public with access to the management of NEIPs. In addition, the public can get involved in NEIP construction through an “Open Day”, which invites residents to visit the facilities. Such educational activities will enhance the social acceptance of NEIPs.

Supplementary Materials

The following supporting information can be downloaded at https://www.mdpi.com/article/10.3390/su18020598/s1. Supplementary Materials S1: Table S1. Original Data; Table S2. CPCRI Computations; Supplementary Materials S2: Figure S1. Parallel Trend Test of CPCRI integrating CCD; Figure S2. Placebo Test for CPCRI integrating CCD; Figure S3. The placebo test for technological innovation; Figure S4. The placebo test for electricity consumption.

Author Contributions

Conceptualization, H.W. and M.C.; methodology, H.W. and M.C.; software, H.W.; formal analysis, H.W., T.Z. and W.R.; data curation, H.W.; writing—original draft preparation, H.W.; writing—review and editing, T.Z., W.R. and M.C.; supervision, M.C.; funding acquisition, M.C. All authors have read and agreed to the published version of the manuscript.

Funding

This research was funded by “Carbon Peaking and Carbon Neutrality” projects of Nanjing Institute of Environmental Sciences, Ministry of Ecology and Environment (ZX2023SZY081 and ZX2023SZY059).

Data Availability Statement

The data presented in this study are available in the Supplementary Materials of this article.

Acknowledgments

The authors gratefully acknowledge Yixuan Zhao and River Wu for their invaluable assistance with data collection and processing.

Conflicts of Interest

The authors declare no conflicts of interest.

References

  1. Du, K.; Li, J. Towards a green world: How do green technology innovations affect total-factor carbon productivity. Energy Policy 2019, 131, 240–250. [Google Scholar] [CrossRef]
  2. Bashmakov, I.A.; Nilsson, L.J.; Acquaye, A.; Bataille, C.; Cullen, J.M.; de la Rue du Can, S.; Fischedick, M.; Geng, Y.; Tanaka, K. Industry. In IPCC, 2022: Climate Change 2022: Mitigation of Climate Change. Contribution of Working Group III to the Sixth Assessment Report of the Intergovernmental Panel on Climate Change; Shukla, P.R., Skea, J., Slade, R., Al Khourdajie, A., van Diemen, R., McCollum, D., Pathak, M., Some, S., Vyas, P., Fradera, R., et al., Eds.; Cambridge University Press: Cambridge, UK; New York, NY, USA, 2022. [Google Scholar] [CrossRef]
  3. Fayomi, G.U.; Mini, S.E.; Fayomi, O.S.I.; Oyeleke, O.; Omole, D.O.; Akinwumi, I.I. Overview of industrial pollution activities and its curbing mechanisms. IOP Conf. Ser. Mater. Sci. Eng. 2019, 640, 012097. [Google Scholar] [CrossRef]
  4. Lyu, Y.; Chen, L.; Tian, J.; Liu, R.; Zhou, Q. Realizing synergy between pollution reduction and carbon mitigation in industrial parks: From model development to tool application. J. Clean. Prod. 2024, 446, 141197. [Google Scholar] [CrossRef]
  5. Behera, S.K.; Kim, J.; Lee, S.; Suh, S.; Park, H.-S. Evolution of ‘designed’ industrial symbiosis networks in the Ulsan Eco-industrial Park: ‘research and development into business’ as the enabling framework. J. Clean. Prod. 2012, 29–30, 103–112. [Google Scholar] [CrossRef]
  6. Butturi, M.A.; Lolli, F.; Sellitto, M.A.; Balugani, E.; Gamberini, R.; Rimini, B. Renewable energy in eco-industrial parks and urban-industrial symbiosis: A literature review and a conceptual synthesis. Appl. Energy 2019, 255, 113825. [Google Scholar] [CrossRef]
  7. Gibbs, D.; Detuz, P. Implementing industrial ecology? Planning for eco-industrial parks in the USA. Geoforum 2005, 36, 452–464. [Google Scholar] [CrossRef]
  8. Li, S.; Wang, S.; Wu, Q.; Zhao, B.; Jiang, Y.; Zheng, H.; Wen, Y.; Zheng, S.; Wu, Y.; Hao, J. Integrated Benefits of Synergistically Reducing Air Pollution and Carbon Dioxide in China. Environ. Sci. Technol. 2024, 58, 14193–14202. [Google Scholar] [CrossRef]
  9. Wang, H.; Ma, J.; Chen, M.; Zhang, Z.; Ding, S.; Wang, S.; Yang, P. Analysis of Needs and Construction of Coordinated Multi-Governance System for Pollution Reduction and Carbon Reduction. Res. Environ. Sci. 2022, 35, 936–944. [Google Scholar] [CrossRef]
  10. Hong, H.; Gasparatos, A. Eco-industrial parks in China: Key institutional aspects, sustainability impacts, and implementation challenges. J. Clean. Prod. 2020, 274, 122853. [Google Scholar] [CrossRef]
  11. Sacirovic, S.; Ketin, S.; Vignjevic, N. Eco-industrial zones in the context of sustainability development of urban areas. Env. Sci. Pollut. Res. 2019, 26, 24346–24356. [Google Scholar] [CrossRef]
  12. Kosugi, T.; Tokimatsu, K.; Zhou, W. An economic analysis of a clean-development mechanism project: A case introducing a natural gas-fired combined heat-and-power facility in a Chinese industrial area. Appl. Energy 2005, 80, 197–212. [Google Scholar] [CrossRef]
  13. Geng, Y.; Zhu, Q.; Haight, M. Planning for integrated solid waste management at the industrial Park level: A case of Tianjin, China. Waste Manag. 2007, 27, 141–150. [Google Scholar] [CrossRef]
  14. Zhu, Q.; Geng, Y.; Sarkis, J.; Lai, K.-H. Barriers to promoting eco-industrial parks development in China: Perspectives from senior officials at National Industrial Parks. J. Ind. Ecol. 2015, 19, 457–467. [Google Scholar] [CrossRef]
  15. Susur, E.; Martin-Carrillo, D.; Chiaroni, D.; Hidago, A. Unfolding eco-industrial parks through niche experimentation: Insight from three Italian cases. J. Clean. Prod. 2019, 239, 118069. [Google Scholar] [CrossRef]
  16. Wang, N.; Bai, Y.; Xie, S.; Zhang, J. The circular economy transformation in industrial parks: Theoretical reframing of the resource and environment matrix. J. Environ. Manag. 2025, 380, 124922. [Google Scholar] [CrossRef]
  17. Qian, L.; Xu, X.; Sun, Y.; Zhou, Y. Carbon emission reduction effects of eco-industrial park policy in China. Energy 2022, 261, 125315. [Google Scholar] [CrossRef]
  18. Wu, Y.; Gao, X. Can the establishment of eco-industrial parks promote urban green innovation? Evidence from China. J. Clean. Prod. 2022, 341, 130855. [Google Scholar] [CrossRef]
  19. Zhang, B.; Yu, L.; Sun, C. How do the National Eco-Industrial Demonstration Parks affect urban total factor energy efficiency? Evidence from a quasi-natural experiment. Energy Econ. 2023, 126, 107018. [Google Scholar] [CrossRef]
  20. Miao, H.; Quan, Q.; Yang, M. Study on the Regional Carbon Emissions Reduction Effect of Green Manufacturing—A Policy Experiment Based on the Construction of Green Parks in China. Sustainability 2025, 17, 1527. [Google Scholar] [CrossRef]
  21. Zhu, B.; Zhang, T. The impact of cross-region industrial structure optimization on economy, carbon emissions and energy consumption: A case of the Yangtze River Delta. Sci. Total Environ. 2021, 778, 146089. [Google Scholar] [CrossRef]
  22. Ministry of Ecology and Environment of the People’s Republic of China. The List of National Eco-Industrial Parks; Ministry of Ecology and Environment of the People’s Republic of China: Beijing, China, 2024. Available online: https://www.mee.gov.cn/xxgk2018/xxgk/sthjbsh/202405/t20240523_1073931.html (accessed on 2 December 2025).
  23. Duan, D.; Jin, H. Environmental Regulation and Green Technology Diffusion: A Case Study of Yangtze River Delta, China. Land 2022, 11, 1923. [Google Scholar] [CrossRef]
  24. Vandyck, T.; Keramidas, K.; Tchung-Ming, S.; Weitzel, M.; Van Dingenen, R. Quantifying air quality co-benefits of climate policy across sectors and regions. Clim. Chang. 2020, 163, 1501–1517. [Google Scholar] [CrossRef]
  25. Kohse-Höinghaus, K. Combustion, Chemistry, and Carbon Neutrality. Chem. Rev. 2023, 123, 5139–5219. [Google Scholar] [CrossRef] [PubMed]
  26. O’Dwyer, E.; Chen, K.; Wang, H.; Wang, A.; Shah, N.; Guo, M. Optimisation of wastewater treatment strategies in eco-industrial parks: Technology, location and transport. Chem. Eng. J. 2020, 381, 122643. [Google Scholar] [CrossRef]
  27. Zheng, Y.; Cao, W.; Zhao, H.; Chen, C.; Lei, Y.; Feng, Y.; Qi, Z.; Wang, Y.; Wang, X.; Xue, W.; et al. Identifying Key Sources for Air Pollution and CO2 Emission Co-control in China. Environ. Sci. Technol. 2024, 58, 15381–15394. [Google Scholar] [CrossRef]
  28. Fraccascia, L.; Yazdanpanah, V.; van Capelleveen, G.; Yazan, D.M. Energy-based industrial symbiosis: A literature review for circular energy transition. Environ. Dev. Sustain. 2021, 23, 4791–4825. [Google Scholar] [CrossRef]
  29. Porter, M.E. Clusters and the new economics of competition. Harv. Bus. Rev. 1998, 76, 77–90. [Google Scholar]
  30. Guo, Y.; Tian, J.; Chen, L. Managing energy infrastructure to decarbonize industrial parks in China. Nat. Commun. 2020, 11, 981. [Google Scholar] [CrossRef] [PubMed]
  31. Guo, A.; Han, L.; Zheng, S. How does industrial agglomeration affect green innovation efficiency in high-tech industries?—Evidence from China. Environ. Dev. Sustain. 2024, 26, 30771–30796. [Google Scholar] [CrossRef]
  32. Jin, T. Impact of heat and electricity consumption on energy intensity: A panel data analysis. Energy 2022, 239, 121903. [Google Scholar] [CrossRef]
  33. Wang, Y.; Ren, H.; Dong, L.; Park, H.-S.; Zhang, Y.; Xu, Y. Smart solutions shape for sustainable low-carbon future: A review on smart cities and industrial parks in China. Technol. Forecast. Soc. Chang. 2019, 144, 103–117. [Google Scholar] [CrossRef]
  34. Wu, W.; Du, Y.; Qian, H.; Fan, H.; Jiang, Z.; Huang, S.; Zhang, X. Industrial Park low-carbon energy system planning framework: Heat pump based energy conjugation between industry and buildings. Appl. Energy 2024, 369, 123594. [Google Scholar] [CrossRef]
  35. Li, Z.; Ge, Z.; Wang, C.; Zhang, D.; Foo, D.C.Y.; Liu, G.; Shi, L. An automated approach for carbon integration in industrial park. Process Saf. Environ. Prot. 2024, 190, 677–687. [Google Scholar] [CrossRef]
  36. Zhu, Y.; Tian, D.; Yan, F. Effectiveness of entropy weight method in decision-making. Math. Probl. Eng. 2020, 2020, 3564835. [Google Scholar] [CrossRef]
  37. Kumar, R.; Singh, S.; Bilga, P.S.; Jatin; Singh, J.; Singh, S.; Scutaru, M.-L.; Pruncu, C.I. Revealing the benefits of entropy weights method for multi-objective optimization in machining operations: A critical review. J. Mater. Res. Technol. 2021, 10, 1471–1492. [Google Scholar] [CrossRef]
  38. Baker, A.C.; Larcker, D.F.; Wang, C.C.Y. How much should we trust staggered difference-in-differences estimates? J. Financ. Econ. 2022, 144, 370–395. [Google Scholar] [CrossRef]
  39. Miller, D.L. An introductory Guide to Event Study Models. J. Econ. Perspect. 2023, 37, 203–230. [Google Scholar] [CrossRef]
  40. Oda, T.; Maksyutov, S. ODIAC Fossil Fuel CO2 Emissions Dataset (ODIAC 2022); Center for Global Environmental Research, National Institute for Environmental Studies: Tsukuba, Japan, 2015. [CrossRef]
  41. National Bureau of Statistics. China’s City Statistical Yearbook (2004–2022). Available online: https://www.stats.gov.cn/sj/ndsj/ (accessed on 2 December 2025).
  42. Rambachan, A.; Roth, J. A more credible approach to parallel trends. Rev. Econ. Stud. 2023, 90, 2555–2591. [Google Scholar] [CrossRef]
  43. Eggers, A.C.; Tuñón, G.; Dafoe, A. Placebo tests for causal inference. Am. J. Political Sci. 2024, 68, 1106–1121. [Google Scholar] [CrossRef]
  44. Xu, H.; Jiao, M. City size, industrial structure and urbanization quality—A case study of the Yangtze River Delta urban agglomeration in China. Land. Use Policy 2021, 111, 105735. [Google Scholar] [CrossRef]
  45. Wu, J.; Nie, X.; Wang, H.; Li, W. Eco-industrial parks and green technological progress: Evidence from Chinese cities. Technol. Forecast. Soc. Chang. 2023, 189, 122360. [Google Scholar] [CrossRef]
  46. Callaway, B.; Sant’Anna, P.H.C. Difference-in-Differences with multiple time periods. J. Econmetrics 2021, 225, 200–230. [Google Scholar] [CrossRef]
  47. Athey, S.; Imbens, G.W. Design-based analysis in Difference-In-Differences settings with staggered adoption. J. Econmetrics 2022, 226, 62–79. [Google Scholar] [CrossRef]
  48. Sun, L.; Abraham, S. Estimating dynamic treatment effects in event studies with heterogeneous treatment effects. J. Econmetrics 2021, 225, 175–199. [Google Scholar] [CrossRef]
  49. Goodman-Bacon, A. Difference-in-differences with variation in treatment timing. J. Econmetrics 2021, 225, 254–277. [Google Scholar] [CrossRef]
  50. Schlüter, L.; Mortensen, L.; Gjerding, A.N.; Kørnøv, L. Can we replicate eco-industrial parks? Recommendations based on a process model of EIP evolution. J. Clean. Prod. 2023, 429, 139499. [Google Scholar] [CrossRef]
  51. Wang, P. China’s air pollution policies: Progress and challenges. Curr. Opin. Environ. Sci. Health 2021, 19, 100227. [Google Scholar] [CrossRef]
  52. Geng, G.; Liu, Y.; Liu, Y.; Liu, S.; Cheng, J.; Yan, L.; Wu, N.; Hu, H.; Tong, D.; Zheng, B.; et al. Efficacy of China’s clean air actions to tackle PM2.5 pollution between 2013 and 2020. Nat. Geosci. 2024, 17, 987–994. [Google Scholar] [CrossRef]
  53. Pan, D.; Tang, J. The effects of heterogeneous environmental regulations on water pollution control: Quasi-natural experimental evidence from China. Sci. Total Environ. 2021, 751, 141550. [Google Scholar] [CrossRef] [PubMed]
  54. Wang, P.-T.; Xu, Q.-C.; Wang, F.-Y.; Xu, M. Investigating the impacts of the Dual Carbon Targets on energy and carbon flows in China. Energy 2024, 313, 133778. [Google Scholar] [CrossRef]
  55. Guo, W.; Yan, C. Assessing the efficiency of China’s environmental regulation on carbon emissions based on Tapio decoupling models and GMM models. Energy Rep. 2018, 4, 713–723. [Google Scholar] [CrossRef]
  56. Ma, Y.; Cao, H.; Ma, Y.; Wu, S. Does technological innovation reduce water pollution intensity in the context of informal environmental regulation? Asia-Pac. J. Chem. Eng. 2020, 15, e2493. [Google Scholar] [CrossRef]
  57. Zhong, Z.; Chen, Z. Exploring the emission reduction and economic impacts of environmental regulation from a dynamic endogenous perspective: Evidence based on the PVAR and threshold models. Humanit. Soc. Sci. Commun. 2024, 11, 1–15. [Google Scholar] [CrossRef]
  58. Perrucci, D.V.; Aktaş, C.B.; Sorentino, J.; Akanbi, H.; Curabba, J. A review of international eco-industrial parks for implementation success in the United States. City Environ. Interact. 2022, 16, 100086. [Google Scholar] [CrossRef]
  59. Shen, X.; Ji, S.; Ge, T.; Chen, Y.; Hao, Z. Environmental regulation and industrial energy efficiency: New evidence from partially linear functional-coefficient models. Environ. Dev. Sustain. 2024. [Google Scholar] [CrossRef]
  60. Sahu, M.; Malyan, V.; Mayya, Y.S. Technologies for Controlling Particulate Matter Emissions from Industries. In Pollution Control Technologies. Energy, Environment, and Sustainability; Singh, S.P., Rathinam, K., Gupta, T., Agarwal, A.K., Eds.; Springer: Singapore, 2021. [Google Scholar] [CrossRef]
Figure 1. Distribution of NEIPs in the Yangtze River Delta, China.
Sustainability 18 00598 g001
Figure 2. Parallel trend test.
Sustainability 18 00598 g002
Figure 3. Random treatment assignment for the placebo test.
Sustainability 18 00598 g003
Figure 4. Details of Goodman-Bacon decomposition.
Sustainability 18 00598 g004
Figure 5. Standardized bias of covariates.
Sustainability 18 00598 g005
Table 1. Data summary of CPCRI and component indicators.
VariableNMeanSDMinMaxSkewnessKurtosis
CPCRI7790.5010.1650.07430.9430.2972.49
lnGDP77910.60.8357.8712.1−0.6212.92
pop_density77971453512239263.4990.47
indus_str7790.9930.3980.4567.416.2319.67
lnfdi77910.91.546.4214.6−0.2942.80
Table 2. Carbon-Pollution Co-Reduction Index (CPCRI) and data source.
Primary IndicatorsComponent IndicatorsUnitsWeightMeanStandard DeviationData Source
Pollution ReductionIndustrial wastewater emission intensityt/CNY 1040.25710.61.01City Statistic Yearbook (2004–2022)
Industrial SO2 emission intensityt/CNY 104 0.3622.651.50City Statistic Yearbook (2004–2022)
Industrial dust and fume emission intensityt/CNY 104 0.2382.221.32City Statistic Yearbook (2004–2022)
Carbon MitigationCarbon dioxide emission intensityt/CNY 104 0.1438.350.31CGER
Table 3. DID model regression results.
VariableNo Control Variable
(1)
Economy
(2)
Population
(3)
Industry Structure
(4)
Openness
(5)
All
(6)
NEIP0.0291 ***0.0320 ***0.0284 ***0.0264 ***0.0264 ***0.0230 ***
lnGDP-0.0308 ***---0.0570 ***
pop_density--4.06 × 10⁻⁶--1.87 × 10⁻⁵ *
indus_stru---0.0143 ***-0.0160 **
lnfdi----−0.00496 **−0.00896 ***
Constant0.313 ***0.0435 **0.312 ***0.225 ***0.354 ***−0.132 ***
YearYesYesYesYesYesYes
CityYesYesYesYesYesYes
N779779779779779779
R-squared0.960.960.960.960.970.96
* p < 0.1, ** p < 0.05, *** p < 0.01.
Table 4. Results of Goodman-Bacon decomposition.
Type of ControlWeightAverage Estimated Value
Earlier Treatment Group vs. Later Treatment Group0.1060.029
Later Treatment Group vs. Earlier Treatment Group0.0700.025
Treatment Group vs. Never Treated Group0.8250.030
Table 5. Balanced test results of PSM.
VariableUnmatchedMeanBiast-Test
MatchedTreatedControltp > |t|
GDPU8329.91742.1207.830.790.000
M5388.15369.60.60.070.945
PopulationU771.59433.91145.715.660.000
M644.66635.73.90.270.789
Tertiary IndustryU4296.6783.118327.010.000
M2586.12539.62.40.300.764
FDIU3.1 × 10577,934137.118.910.000
M2.0 × 1052.1 × 105−7.3−0.450.650
Table 9. Adjusting the explained variables and sample ranges.
CO2 Intensity
(1)
SO2 Intensity
(2)
Dust and Fume Intensity
(3)
Wastewater Intensity
(4)
CPCRI, Excluding the Cities That Have over Two NEIPs
(5)
NEIP−0.0201 ***−0.294 ***−0.0769−0.139 ***0.0204 ***
Control VariablesYesYesYesYesYes
City Fixed EffectsYesYesYesYesYes
Time Fixed EffectsYesYesYesYesYes
N779779779779684
R-squared0.990.940.900.910.96
* p < 0.1, ** p < 0.05, *** p < 0.01.
Table 10. The DID regression results of CPCRI integrating CCD.
VariableNo Control Variable
(1)
Economy
(2)
Population
(3)
Industry Structure
(4)
Openness
(5)
All
(6)
NEIP0.0224 ***0.0254 ***0.0240 **0.0204 **0.0208 **0.0197 **
lnGDP-0.0316 *---0.0494 **
pop_density--−8.70 × 10⁻⁶--4.87 × 10⁻⁶
indus_stru---0.0106-0.0133
lnfdi----−0.00307−0.00714
Constant0.352 ***0.05450.357 ***0.343 ***0.382 ***−0.0599 **
YearYesYesYesYesYesYes
CityYesYesYesYesYesYes
N779779779779779779
R-squared0.950.950.950.950.950.95
* p < 0.1, ** p < 0.05, *** p < 0.01.
Table 11. Impact mechanism analysis.
Technological InnovationsEnergy Intensity
Explained VariableInnovative Patents per 10,000 PeopleCPCRIElectricity Consumption per Industrial Value AddedCPCRI
NEIP1.016 ***0.0179 **−84.52 *0.0857 ***
NEIP × TI-3.62 × 10⁻³ **--
NEIP × EC---−1.13 × 10⁻⁵ **
Control VariablesYesYesYesYes
City Fixed EffectsYesYesYesYes
Time Fixed EffectsYesYesYesYes
N779779779779
R-squared0.810.960.960.96
* p < 0.1, ** p < 0.05, *** p < 0.01.
Disclaimer/Publisher’s Note: The statements, opinions and data contained in all publications are solely those of the individual author(s) and contributor(s) and not of MDPI and/or the editor(s). MDPI and/or the editor(s) disclaim responsibility for any injury to people or property resulting from any ideas, methods, instructions or products referred to in the content.