Article

Financial Performance Sustainability of Islamic Insurance: Evidence from a Panel Vector Autoregressive Analysis of the Pakistani Market


by
Othman Altwijry
1,
Ahmad Alrazni Alshammari
2 and
Montassar Kahia
3,*
1
Department of Finance, College of Business and Economics, Qassim University, Buraydah 51175, Saudi Arabia
2
Institute of Islamic Banking and Finance (IIiBF), International Islamic University Malaysia, Kuala Lumpur 53100, Malaysia
3
Department of Economics, College of Business and Economics, Qassim University, Buraydah 51175, Saudi Arabia
*
Author to whom correspondence should be addressed.
Sustainability 2026, 18(2), 557; https://doi.org/10.3390/su18020557
Submission received: 19 October 2025 / Revised: 19 December 2025 / Accepted: 23 December 2025 / Published: 6 January 2026
(This article belongs to the Section Economic and Business Aspects of Sustainability)

Abstract

This paper investigates the factors of sustainability of the financial performance of Islamic insurance (Takaful) windows in Pakistan. A large body of literature has examined Takaful providers across many countries; however, there is little research on the dynamics of Takaful windows. This study uses an analytical approach to investigate the effects of various operational and financial measures on Takaful window performance. It is one of the earliest works to examine the profitability of Takaful windows with a dynamic PVAR model, providing new evidence on the peculiar financial forces in hybrid Islamic–conventional insurance frameworks. It explores the effects of the retention ratio, Wakalah fees, commission ratio, gross written contributions, and underwriting surplus on profitability, measured by return on assets (ROA) and return on equity (ROE). It uses annual data from 18 Pakistani Takaful window insurers, employs a panel vector autoregressive framework to capture dynamic interdependencies and endogeneity, and conducts a variance decomposition with impulse response analysis. The findings indicate that the retention ratio and underwriting surplus have significant positive effects on ROA, whereas Wakalah fees have a negative impact. In the case of ROE, the underwriting surplus and commission ratio are associated with positive effects; meanwhile, the retention ratio and gross written contributions are related to negative effects. Variance decomposition emphasizes the commission and retention ratios as the main sources of profitability, with Wakalah fees and underwriting surplus being insignificant. The regulators need to ensure proper fund separation and establish the most optimal rules regarding Wakalah fees. The operation of Takaful windows should focus on commission management and business retention strategies to enhance profitability and financial sustainability. The increase in the financial performance of Takaful windows contributes to the expansion of Shariah-compliant insurance, facilitating the financial inclusion of Muslim communities in mixed markets.

1. Introduction

The insurance system is one of the core tools for managing the potential risks faced by individuals and businesses. This system includes elements prohibited by Islamic rules and principles (Shariah). This issue has led Islamic scholars and financial experts to develop an alternative risk management framework that meets the needs of individuals and businesses. The first outcome of these efforts was shown in the first Islamic insurance company in Sudan in 1979. This insurance company provided an insurance model that aligns with the insurance business’s operating concept of mutual responsibility and cooperation and is in line with Shariah rules. This new concept at that time began with different terms and names. It is called the cooperative structure in Saudi Arabia, the participation structure in Turkey, and the mutual and Takaful structures in Sudan and other jurisdictions. The Islamic Financial Services Board (IFSB) stated in its Islamic Financial Services Industry Stability Report 2024 that the Takaful sector accounts for approximately 0.7% of the overall Islamic financial system. The Takaful sector recorded a 6.5% year-on-year (y-o-y) increase to USD 24.05 billion in 2023 [1].
There are two main approaches to offering Takaful products and services to the market: via a full-fledged Takaful firm and/or a Takaful window. The IFSB stated in its 2020 Stability Report that one-third of Takaful organizations operate as windows [2]. Alshammari et al. [3] stated that window operations are not permitted in all jurisdictions. Still, some countries, such as Pakistan and Nigeria, allow this practice to achieve objectives, including encouraging financial inclusion, boosting competitiveness, and tapping a new market segment. Another practice adopted by certain regulators is banning window operations, as in Brunei, Kuwait, Qatar, and Saudi Arabia, due to concerns about compliance with Shariah governance and the performance of standalone, full-fledged Takaful organizations that can meet the demands of their respective markets.
Empirical studies have identified several key drivers of Takaful financial performance across markets. Research conducted in Malaysia has found that the profit performance of Takaful operators was significantly affected by their gross written premiums and underwriting performance [4,5]. Similar research conducted in Saudi Arabia indicated that the two most important factors influencing the financial performance of Islamic insurance operators were premium growth and underwriting performance [6]. In Indonesia, research has shown that contributions, claims, and underwriting surplus are significant contributors to Takaful operator profitability [7]. Therefore, these studies collectively show that Takaful operators’ performance is generally determined by both company-specific and underwriting-related factors across countries.
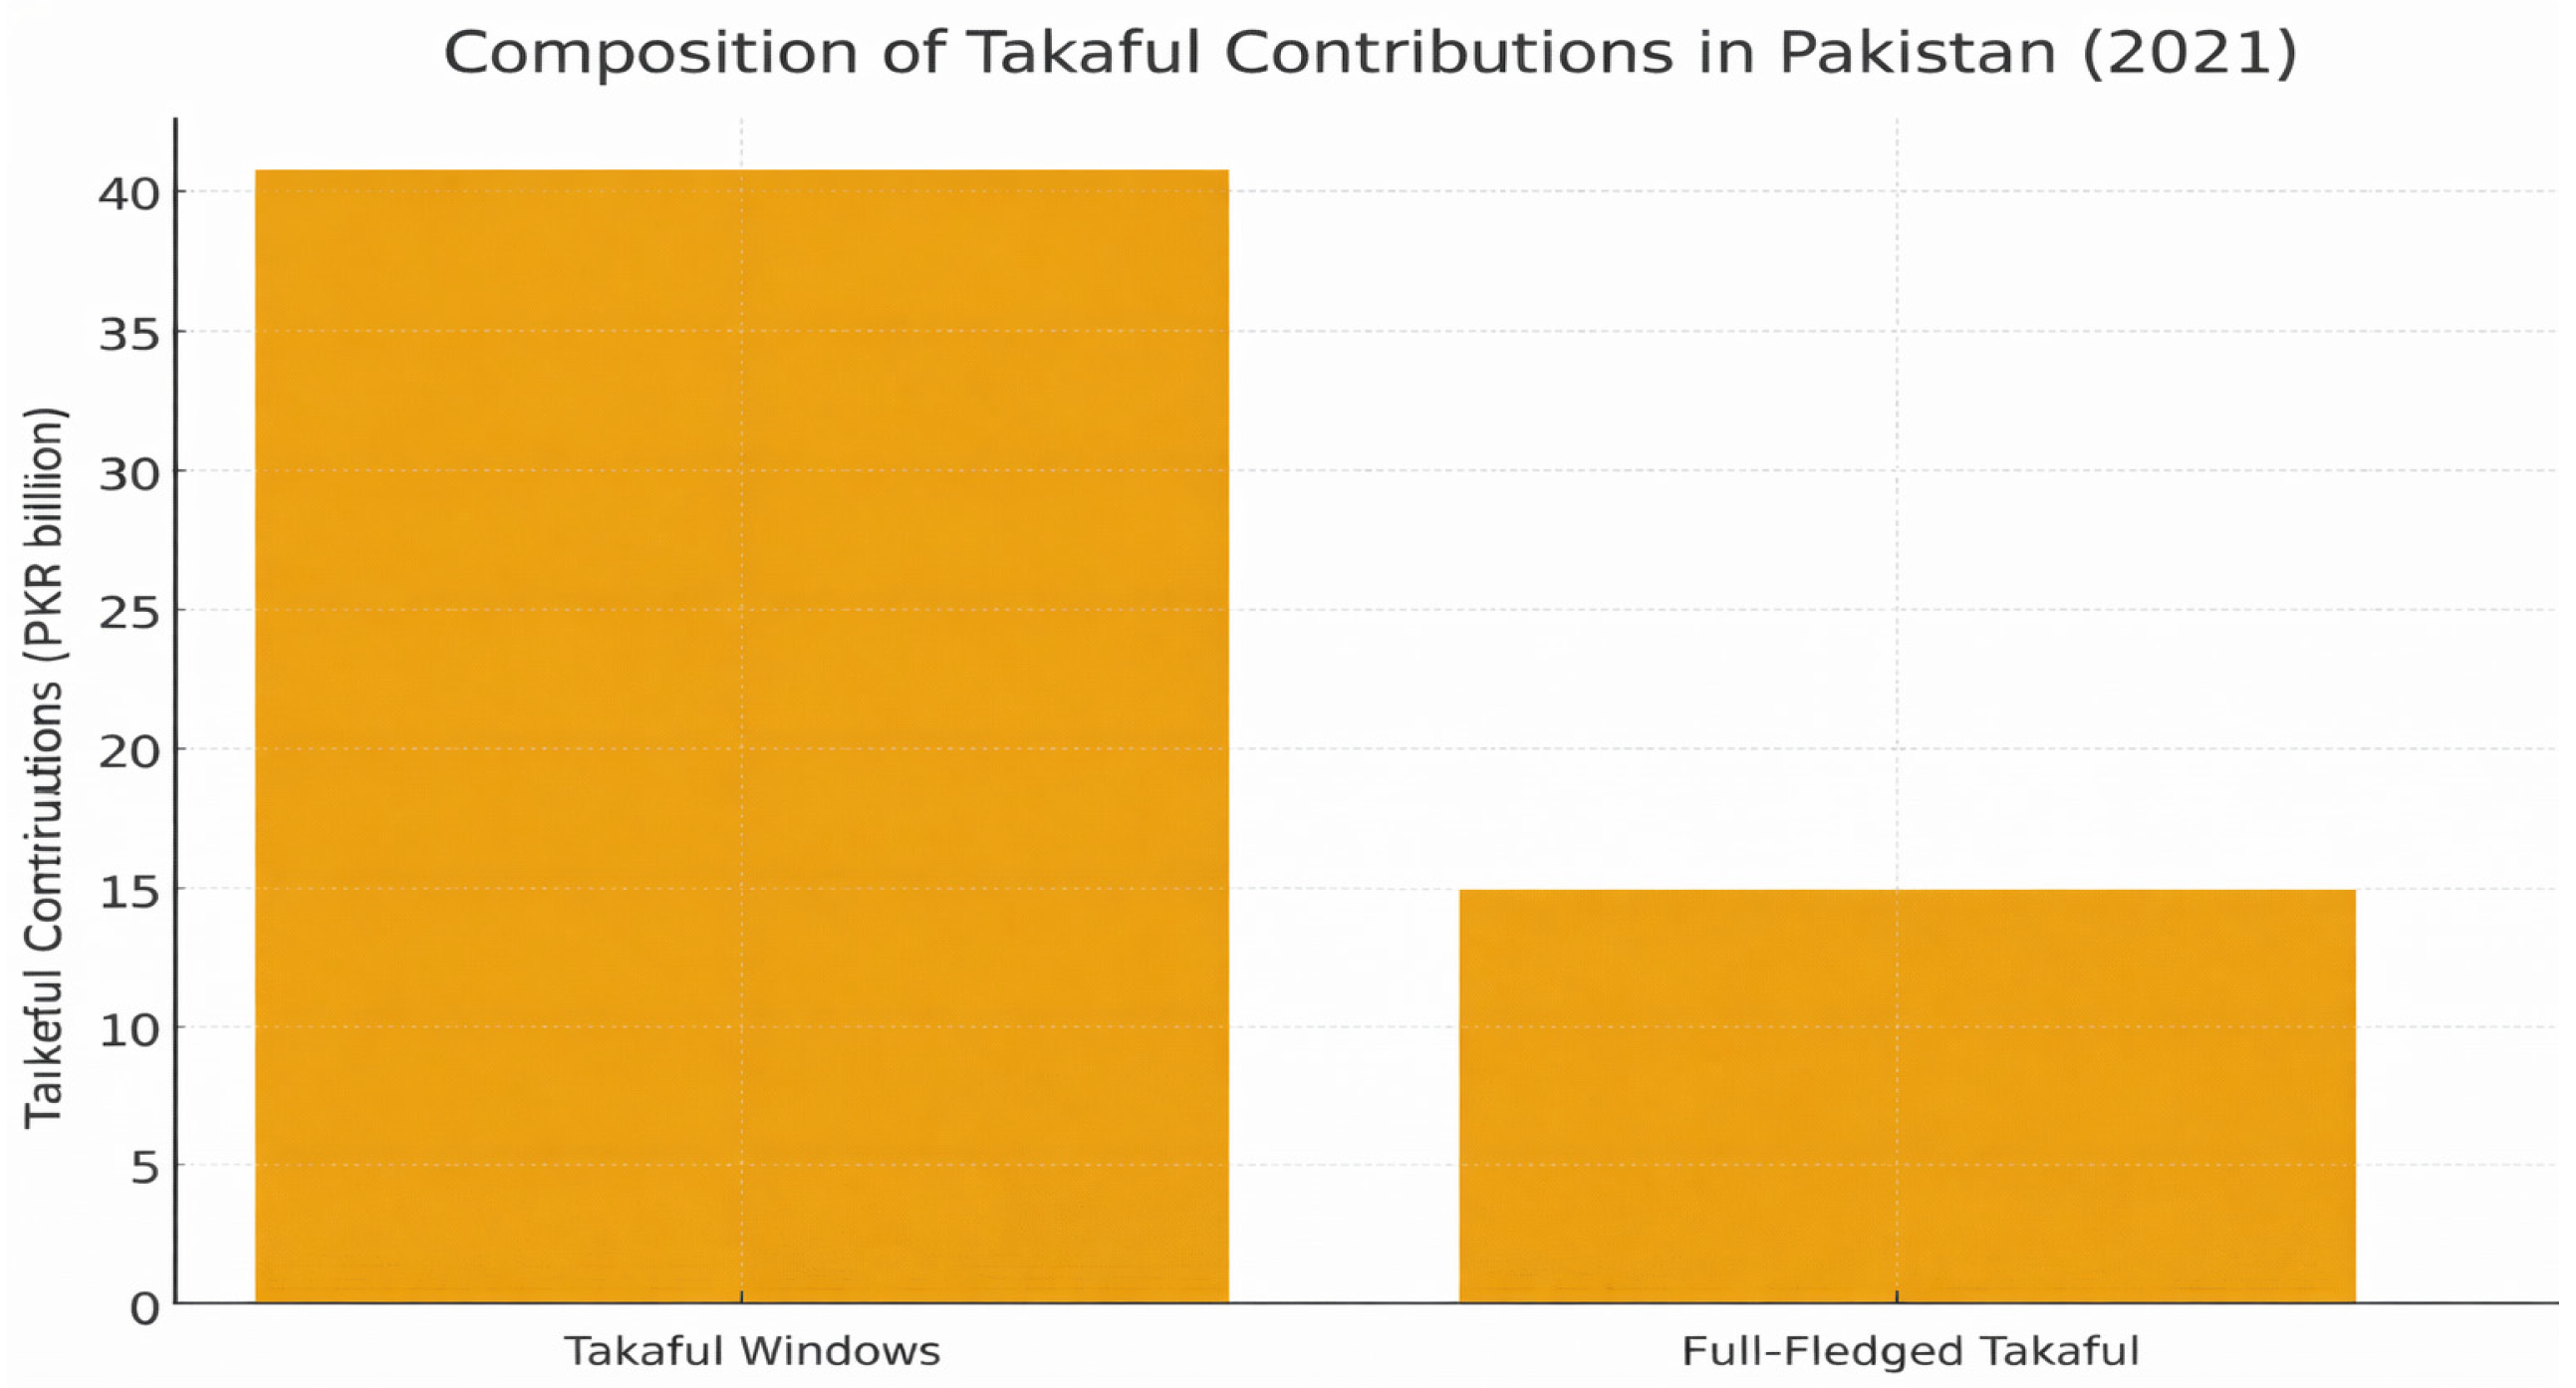
Further, as Takaful windows have been treated differently under various regulations, this research focuses on Pakistan. Pakistan is among the few countries that provide a clear operating and regulatory environment for empirical research. Pakistan is also one of the few countries that has explicitly granted authority to operate and regulate Takaful windows through a comprehensive regulatory framework, most notably the Takaful Rules of 2012 issued by the Securities and Exchange Commission of Pakistan (SECP). The SECP’s rules enabled the organized growth of Takaful windows and established consistent disclosure standards for their financial information, enabling empirical analysis. Additionally, the industry’s contribution to the total Takaful market was significant in 2021 at PKR 56 billion, with 73% contributed by window operators, indicating their prominence in the national Islamic insurance market (see Figure 1). Due to these factors (regulatory certainty, data access, and the dominance of the Takaful window market), Pakistan offers an ideal environment for analytical and policy-relevant research to investigate the determinants of the financial performance of Takaful window operations. Hence, the main goal of this paper is to examine the determinants that affect the financial performance of Takaful windows in Pakistan.
In addition, several previous studies have investigated the profitability and operational factors that influence the Takaful business of fully licensed Takaful companies in different countries; however, virtually none have investigated empirically the financial performance of Takaful windows, which are increasingly playing an essential role in many countries and contribute a significant portion of Takaful premium income in Pakistan. The existing literature is primarily based on larger insurance or Takaful industries, with little focus on how Takaful windows operate within a hybrid Islamic–conventional framework, nor does it provide much insight into how a company’s specific characteristics impact its financial performance. In light of the lack of knowledge regarding how Takaful windows work and perform within such a framework and the rapidly increasing importance of Takaful windows in Pakistan (where they account for a clear majority of Takaful premium income), this research fills a void by providing an analysis of the factors influencing the performance of Takaful windows operating in Pakistan. In addition, the current study represents a logical progression from an analysis of the Takaful industry as a whole to an examination of the empirical contribution of the specific Takaful windows model being studied.
Briefly, this research focuses on an empirical analysis of the financial performance of Takaful windows in Pakistan’s hybrid Islamic–conventional insurance model, using a PVAR methodology that has not previously been applied to Takaful windows. Prior research has primarily analyzed the financial dynamics of Takaful operators rather than those of Takaful windows. However, Takaful windows are now the most significant contributors to the national Takaful sector and operate under a different regulatory framework than Takaful operators; the financial dynamics of Takaful windows have received limited attention. This research analyses how various elements of Takaful windows’ operational practices (retention structure, fee structures, commission mechanisms, underwriting outcomes) affect profit levels, providing insight into a relatively unexamined area of the Islamic insurance industry. In addition to providing clarity to the literature, this research provides further evidence on the potential for the financial sustainability of Takaful windows in a regulatory environment where the majority of Takaful activity occurs.
After this introduction, this article is organized as follows: Section 2 reviews the relevant literature. Section 3 describes the econometric methodology and data used in the analysis. Section 4 presents and discusses the empirical results. Finally, Section 5 presents the conclusions and policy implications.

2. Literature Review

2.1. The Background of Takaful Window Operation

2.1.1. An Overview

The Islamic finance sector is guided by several global bodies, including the Accounting and Auditing Organisation for Islamic Financial Institutions (AAOIFI) and the Islamic Financial Services Board (IFSB). The fundamental principle of these organizations is to enhance the holistic framework and operational efficacy of the Islamic financial sector. In this context, the “Takaful window” is defined by the IFSB-25 as “a part of a conventional insurer/reinsurer (which may be in the form of a branch, unit, or division) which provides Takaful/reTakaful services, but does not have a separate legal identity [2].” In this model, the host undertakings are defined as conventional institutions that also offer Islamic financial instruments. As stipulated by IFSB-20, it is incumbent upon hosts to ensure a clear financial separation of window operations, which requires keeping separate records of assets, liabilities, capital, profits, and losses. This is very important, as financial interlinkages between the host and its Takaful window arise in relation to cash flows for partnership profit shares and agency (Wakala) fees [2].

2.1.2. Characteristics and Operational Structure of Takaful Windows

The Takaful window model is a method by which an Islamic insurance unit can be created and operated within a conventional insurance company. The Takaful window has legal status, and its operation will require it to work within the same corporate structure as the parent company. However, segregation between the two business types will be required to ensure that all financial transactions relating to the Takaful window comply with Islamic Shariah principles [2,3]. To segregate the two business types, Takaful window models use segregated funds: Takaful contributions from participants are placed in the Participants’ Risk Fund (PRF), where the industry uses various terms for PRF, such as Participants’ Takaful Fund and Takaful Fund for risk sharing and underwriting, while shareholders’ capital, along with other fees and operational costs, is placed in the shareholders’ fund. The separation of the PRF and the shareholders’ fund ensures that shareholders’ interests do not influence the underwriting results and risk-sharing activities of the Takaful window. As such, the Takaful window remains in compliance with Shariah law [8].
Further, the Takaful window’s operational model combines two governance structures: the technical and financial support of the conventional host insurer and Shariah compliance (including Shariah supervision of fees paid by Takaful participants through Wakala agreements, the way business is conducted with policyholders, and how funds are segregated) [3]. Takaful windows face new governance issues—including transparency regarding the flow of money into and out of the PRF versus the host conventional insurer and ensuring that conventional and Shariah-compliant assets and liabilities do not commingle [8,9]. In contrast to standalone Takaful insurers (which are operationally independent and were established solely to provide Islamic insurance), Takaful windows rely upon host insurers to distribute products, manage risks, and provide operational capabilities, thereby creating interdependencies that affect both the costs and the profit margins associated with providing Takaful services [9].

2.1.3. The Ideology of Permitting and Banning Takaful Windows

The financial authority has various goals and objectives, such as allowing conventional insurance institutions to serve as hosts or establishing an insurance window that provides Shariah-compliant products and services [10]. Among these goals and objectives to allow this practice are (1) enabling conventional insurance companies to have a Takaful window, which is a part of supporting financial inclusion. Once this window is allowed, Muslims who live in non-Muslim countries are excluded from the insurance services due to not being allowed in Shariah. In Cameroon, for instance, the Cameroonian insurance company that serves several African countries was founded in 2020, providing Takaful products and services via a window unit to promote financial inclusion [11]. (2) The Takaful and reTakaful window is considered an expansion to reach a new market. This can be demonstrated by the Takaful and reTakaful products and services offered by international insurance players, such as AIG and Hannover Re. They have started providing services in different jurisdictions to meet the demand throughout the window unit. A relevant case of a conventional reinsurance company diversifying into the Takaful market is Kenya, which launched its Takaful window in 2013. The move later spread to the Egyptian market, thus making the company a Takaful window operator [12]. Additionally, Takaful windows are recognized as practical tools for enhancing competitiveness and increasing market penetration; this was demonstrated by the Government of Pakistan’s adoption of the Takaful Rules in Pakistan, 2012 [13].
However, some financial regulatory authorities do not allow conventional insurance companies to offer Takaful through windows. Another major concern is that it is difficult to establish a robust Shariah governance structure, which, if not correctly managed, could lead to misinterpretations and reputational risks related to adherence to Shariah principles. Also, the presence of a reasonable number of fully fledged Takaful operators in the market might decrease the need for windows. For example, in Kuwait, Article 29 of Law No. 125 of 2019 strictly prohibits conventional insurers from offering Takaful products [14].

2.2. Performance and Profitability of Takaful

There are a sufficient number of studies examining the financial performance and profitability of the insurance sector in different countries, e.g., ref. [15] in Kuwait, ref. [16] in Pakistan, ref. [17] in the USA and the UK, ref. [18] in the UAE, ref. [19] in Palestine, ref. [20] in Canada, ref. [21] in the UK, and ref. [22] in Kosovo. Also, the performance of the Takaful sector has been examined in different countries, e.g., refs. [4,5] in Malaysia, ref. [6] in Saudi Arabia, and ref. [7] in Indonesia.
Further, the relevant literature shows that global Takaful research has contributed significantly to understanding Takaful mechanisms but remains limited to the local institutional and market environments in which it was carried out. The empirical results from Malaysia have shown that premium volume and underwriting quality are key indicators of Takaful companies’ profitability. The empirical results from Saudi Arabia and Indonesia, on the other hand, have demonstrated that liquidity management, contribution growth, and underwriting efficiency are the leading financial indicators of Takaful companies’ success. In addition, recent studies show that the performance and profitability of Takaful (Islamic Insurance) are influenced by internal, external, and governance factors observed across many countries worldwide. All studies from the GCC region and other regions in Southeast Asia consistently show that firm size, leverage, capital adequacy, and investment returns are positively associated with profitability, and liquidity is negatively associated with it [23,24,25,26,27]. In addition to these internal and external factors, economic growth, customer satisfaction, and corporate social responsibility (CSR) all have a positive influence on the performance of Takaful companies; companies undergoing an audit performed by reputable external auditors and implementing a strong CSR policy have a higher return on assets and return on equity [28,29]. The integration of Fintech into the Takaful business model has resulted in enhanced Operational Efficiency and Profitability in some countries, including Qatar, but several barriers remain, including regulatory issues and cybersecurity threats [30]. Boards of Directors and their role in relation to Shariah Boards have become increasingly important for the financial performance of Takaful companies, with larger, more experienced boards associated with better performance [31,32,33]. Despite Takaful companies demonstrating resilience in terms of continued premium growth and adaptation to environmental changes, such as the COVID-19 pandemic, there are still issues with underwriting deficits, investments, and efficiency compared to conventional insurers [25,30,34]. These cross-national results therefore indicate a broader operational logic of the Takaful industry; however, they can only be applied with caution to the context of Pakistan, since the vast majority of international research refers to Takaful companies operating fully, not through Takaful windows. Given that Takaful windows in Pakistan operate under a hybrid legal framework and account for the majority of national Takaful contributions, the limitations of the international research further support the need for an empirical study specifically designed to address the needs of Takaful windows in Pakistan.
Regarding Pakistan, Arshad et al. [35] identified the factors affecting the financial performance of the Takaful industry by examining five full-fledged firms from 2007 to 2014. They found that underwriting risk, liquidity position, and firm age significantly influence firms’ financial performance. Tanveer [36] examined the impact of the retention ratio, loss ratio, liquidity ratio, efficiency ratio, capital adequacy, and current ratio on the financial performance of conventional insurers and Takaful firms in Pakistan during 2010–2016. For Takaful, the retention ratio, loss ratio, and liquidity ratio were found to be significantly related to return on equity.
Asadullah et al. [37] examined the determinants of profitability for Takaful and conventional insurance companies across three periods: the pre-financial crisis, the 2008 financial crisis, and the post-financial crisis. They used return on assets as a proxy for profitability. They included both macroeconomic exogenous variables, such as GDP growth and inflationary pressures, as well as industry-specific explanatory variables, such as liquidity ratios, leverage ratios, and firm size. The panel regression analysis indicated that macroeconomic variables had no significant effect on profitability across the three phases. Conversely, industry-specific factors showed a distinct pattern: Takaful companies were more efficient in liquidity management than traditional insurers at the post-crisis stage, leading to higher profitability.
Similarly, Iqbal et al. [38] assessed the performance of the Takaful window for 2010–2019. Their paper is based on information from ten reputable insurance companies regulated by the Securities and Exchange Commission of Pakistan (SECP), including those companies involved in both general and life insurance. Using descriptive statistical techniques, the study investigated financial performance before and after the commencement of Takaful operations, employing the event-window approach. The results showed mixed outcomes. Although introducing Takaful windows did not significantly enhance return on equity and return on assets for general and life insurers, Earnings Per Share (EPS) increased substantially after adopting Takaful operations, suggesting the potential to improve specific financial metrics.
Although previous studies have examined all types of Islamic insurance in Malaysia, Saudi Arabia, Indonesia, and Pakistan (i.e., Takaful operators), they are generally limited to an analysis of factors related to the insurance industry as a whole, including those associated with the overall performance of the institution (e.g., premium income levels, firm size), liquidity (the amount of money available at any time), and underwriting performance (the ability to generate revenue through the sale of insurance contracts). While the body of literature contributes to our general understanding of the financial behavior of Islamic insurance institutions, it does not address the structure and operation of Takaful windows. Since Takaful windows account for the largest share of contributions in the Pakistani Takaful market and many operate under a hybrid regulatory framework, they are critical to the financial and operational sustainability of the Pakistani Takaful sector. Therefore, there appears to be a gap in the literature between what researchers examine empirically and what Takaful window operators consider essential for the financial and operational success of their operations. As such, this research contributes to the literature by empirically examining the factors that affect both the short-term financial performance and the long-term sustainability of Takaful window operators in Pakistan.

2.3. Takaful Market in Pakistan

2.3.1. Background

Historically, the insurance sector in Pakistan was dominated by foreign companies. In response to this, the government of Pakistan established the Pakistan Insurance Corporation in 1953 to promote local participation in the industry. The nationalization policies adopted during the 1970s included the 1972 nationalization of life insurance and the 1976 nationalization of general insurance. However, the industry began to liberalize in the 1990s [39].
In 2003, the University of Darul Uloom Karachi hosted a convention of Shariah scholars that determined the permissibility of Takaful under Islamic law. Subsequently, the regulatory body drafted a working plan to bring into place laws for the Takaful operation in Pakistan. Backed by this working plan, in 2005, the Securities and Exchange Commission of Pakistan (SECP) promulgated the Takaful Rules, paving the way for the country’s first Takaful firm, Pak Kuwait Takaful Co. Limited. To align with international developments and provide further direction, SECP revised the Takaful Rules in 2012 [15]. One of the key developments in the 2012 rules was the allowance for conventional insurance companies to operate Takaful windows to increase market competitiveness and the Takaful sector’s market share [3].

2.3.2. A Regulatory Overview of the Takaful Window in Pakistan

The Takaful industry in Pakistan began in 2005 when the Securities and Exchange Commission introduced the Takaful Rules. Initially, conventional insurers were barred from offering Takaful products, but the 2012 Takaful Rules permitted them to operate Takaful windows, enhancing market competitiveness and sector growth by leveraging established distribution networks [14,40]. The 2012 rules marked a turning point, setting key guidelines for organizing window operations, as follows:
First, the operator, popularly known as the host, is mandated to create a Waqf fund, an irrevocable trust fund known in the industry as the Participants’ Takaful Fund (PTF). This fund must be a separate and independent entity with the capacity to own and manage different types of assets, whether in cash or movable or immovable property, provided that these assets are Shariah-compliant.
Second, the obligation of the host is to manage the Participants’ Takaful Fund, PTF, for a stipulated compensation, usually referred to as the Takaful Operator’s Fee. The host shall effect this management in accordance with the provisions of the Waqf Rules, which stipulate the duties and liabilities of the operator, the Waqf, and the participants for the proper regulation of the Takaful operation. These guidelines similarly regulate the investment activity of the Waqf and the Operator’s Fund, thereby ensuring adherence to the principles sanctioned by the Shariah Adviser appointed by the operator.
Third, the operator ensures the separation of Waqf accounts, enabling the clear identification of the Waqf’s assets and liabilities. The financial statements, prepared by the operator, are structured to clearly distinguish between the Waqf’s and the Operator’s activities’ financial performance and position as independent entities.

3. Methodology

3.1. Data Descriptions

3.1.1. Data

This research uses secondary data from the annual reports of Pakistani insurance companies, as this study’s scope relates to Takaful windows. Due to limited data availability, this research uses an annual time series from 2013 to 2022. In fact, the choice of the 2013–2022 period was based on both data availability and new regulations (in Pakistan) in the Takaful insurance industry. The available financial data define the scope of the empirical part of this research. Still, it becomes consistent only after the introduction of the Takaful Rules 2012, which set out the authorization, supervision, and reporting requirements for Takaful window operations. Window operators have been required to report using the same disclosure and governance framework since 2013, thereby providing comparable and reliable financial data. Assessing financial performance over the ten years from 2013 (a time during which all Takaful windows operated under clear institutional rules and, hence, behaved in terms of operation and profit maximization in ways that are determined by those rules), creates a coherent and stable context for examining financial performance, as it includes the period during which the Takaful window segment of the insurance market developed structurally in the country. As such, it provides a valuable basis for analyzing the determinants of financial performance across Takaful windows in Pakistan.
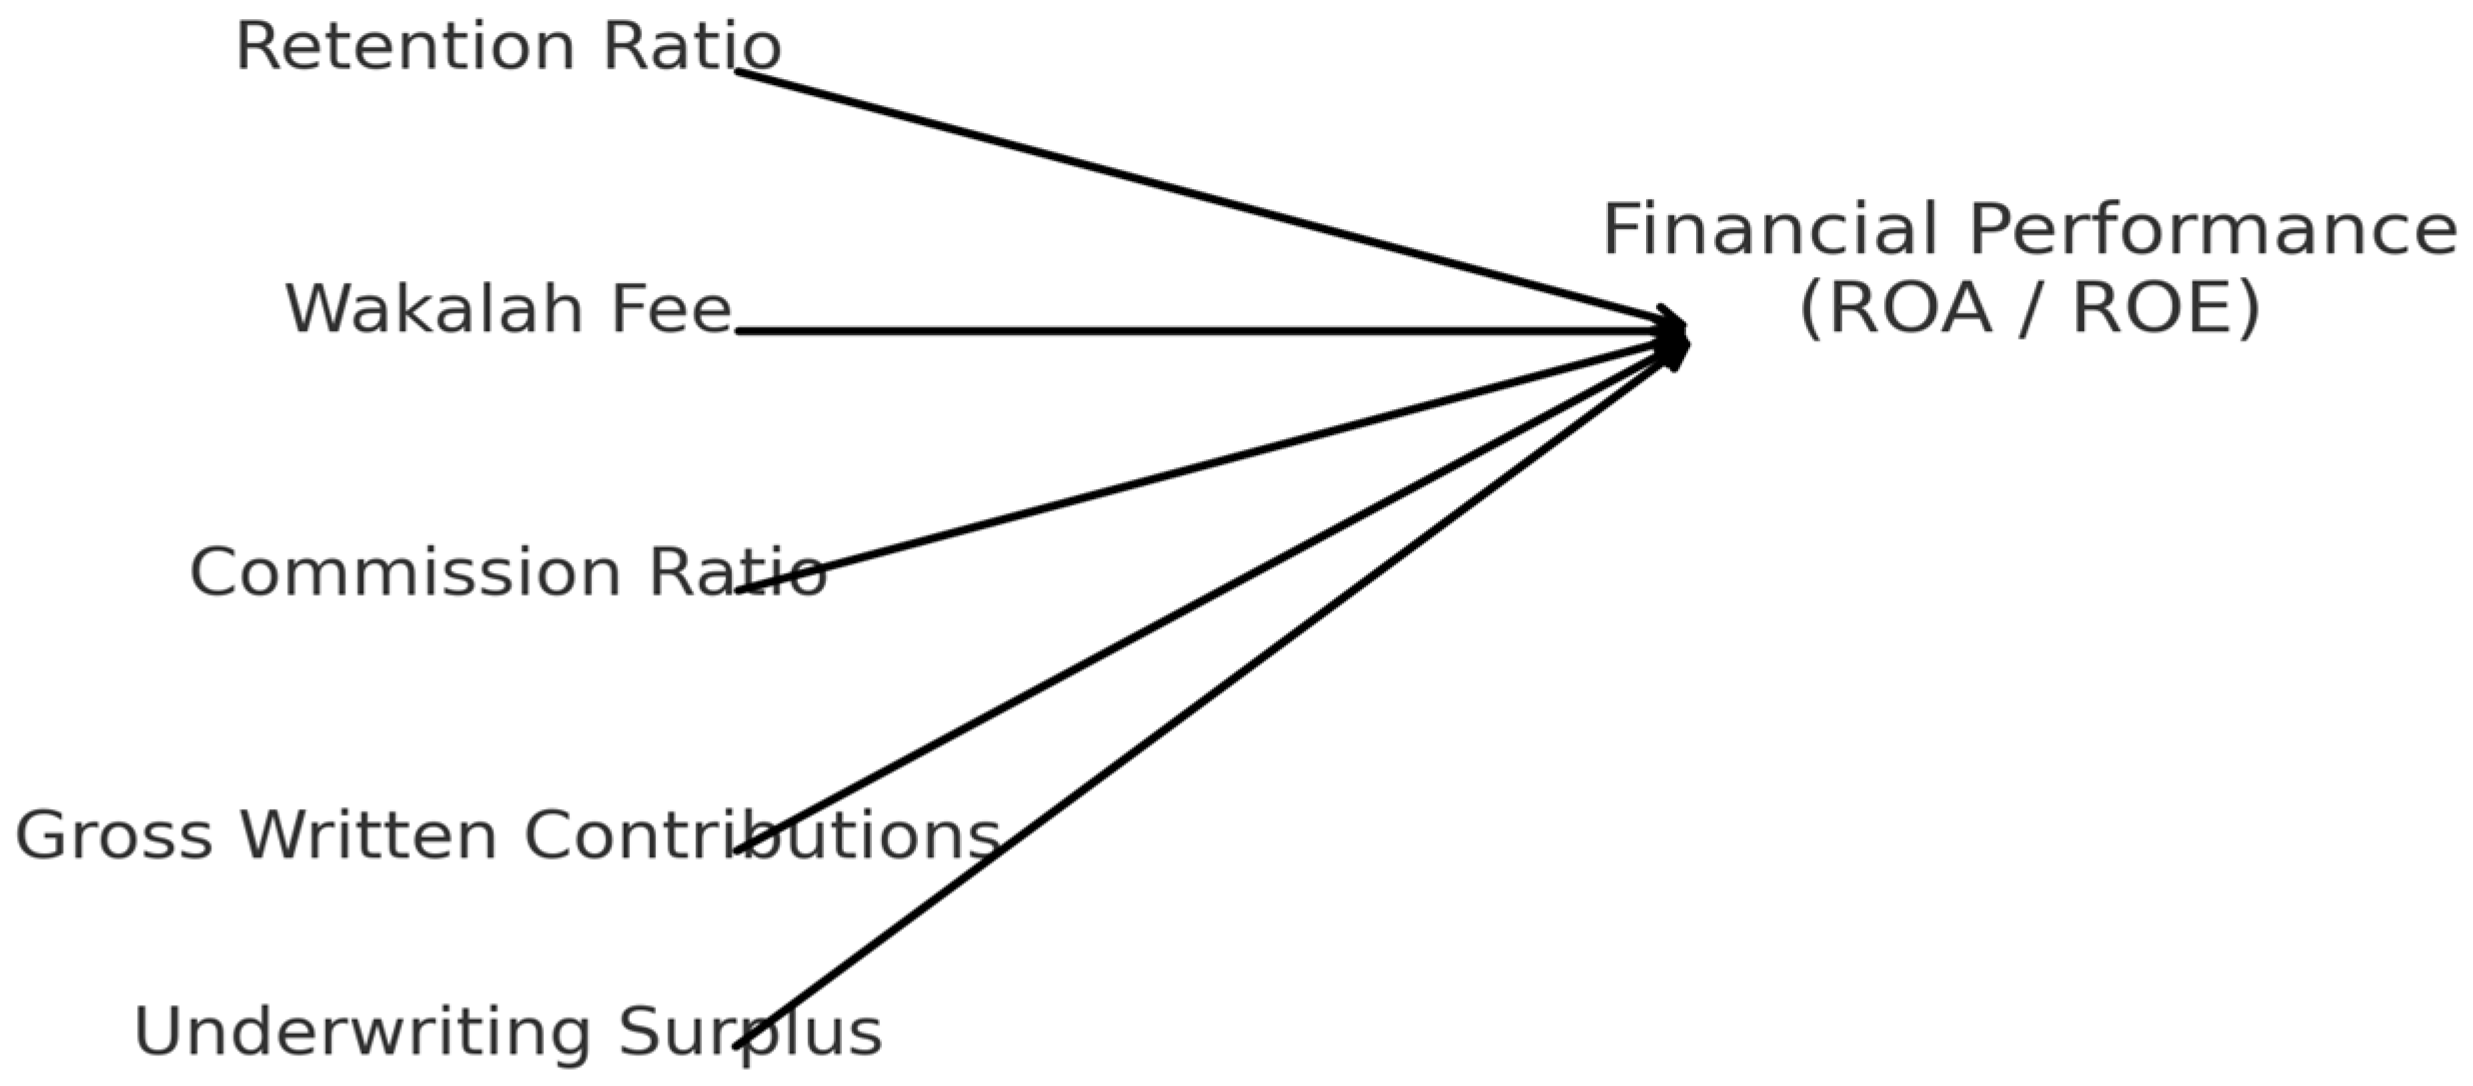
Overall, data were collated for 18 insurance firms that provide Takaful products alongside conventional products. This means further that to select a sample of eighteen companies, we applied two basic conditions: (a) the firm has an authorized Takaful window under Takaful Rules 2012, and (b) complete and accurate financial reporting is available for the entire period. Table 1 provides a comprehensive report on the factors, their measurements, the anticipated signs of the coefficients related to the explanatory factors, and their financial explanations. Table 2 presents descriptive statistics for all variables, including standard deviation, mean, median, maximum, minimum, skewness, kurtosis, the Jarque–Bera statistic, and the coefficient of variation. Further, Figure 2 presents the conceptual framework for the Takaful Window performance.

3.1.2. Dependent Variables

For this study, return on assets (ROA) and return on equity (ROE) are used as the two dependent variables because they represent the most commonly used performance measurement standards in the vast literature on Takaful and the overall insurance industry. ROA measures the efficiency with which an organization uses its assets to generate profit; ROE measures the profit generated per dollar of shareholder equity. The use of both measures provides a complete picture of organizational financial results, based on the level of operational efficiency achieved and the return generated from equity investments. This allows for comparison with other empirical research conducted using a similar methodology, as well as alignment with conventional best practices for measuring the performance of insurance and Takaful companies.
In more detail, as a financial entity, an insurance company aims to build a profitable business model by underwriting and investing. The profitability of an insurance company is widely assessed in the industry using the following ratios: return on assets (ROA) and return on equity (ROE).
ROA is a financial ratio that measures a company’s efficiency and profitability in generating profits from its assets. It is calculated by dividing the company’s net income by its total assets [41]. ROE is another financial ratio that is accepted in profitability measurement. It indicates the amount of profit generated from the invested shareholders’ money. It is calculated by dividing the company’s net income by its shareholders’ equity [42].

3.1.3. Independent Variables

To examine the factors affecting the financial performance of Takaful windows in Pakistan, the researchers used the following independent variables.
  • Retention ratio.
The retention ratio indicates the percentage of gross premiums not reinsured or shared/transferred to reinsurance/reTakaful. An insurance company itself covers it. It is calculated as a ratio of net written premiums to gross written premiums. The significance of the retention ratio on profitability is varied in the literature. The retention ratio’s impact on profitability was positive and significant in the following studies [43,44]. Studies show the impact remains positive but insignificant, as reported by [45,46].
  • Commission ratio.
The commission ratio indicates the percentage of acquisition costs paid to a broker or agent for acquiring or placing the business, relative to the insurer’s net written premiums. The significance of the commission ratio on profitability is varied in the literature. Wasike et al. [47] found that commission expenses significantly affect the profit margin of Kenyan insurance companies. However, Hussanie and Joo [48] presented a different view in their paper and found that the commission ratio is not a significant predictor of the profitability of life insurance companies in India.
  • Gross written contribution.
Gross written contribution/premium (GWC, also known as GWP) is the total direct and assumed premium written by an insurer before deductions for reinsurance/reTakaful and ceding commissions. It is considered the main source of income earned by the insurers. The research by Shawar and Siddiqui [16] found that gross written premium has a significant positive impact on the profitability of the Pakistani insurance industry. Similarly, Kaya [49] found that the profitability of non-life insurance companies in Turkey is statistically significant and positively related to the premium growth rate.
  • Wakalah fee.
The Wakalah fee is a unique variable for Takaful. It refers to an upfront fee deducted from the GWC and transferred to the shareholders’ fund to manage the PRF on behalf of the participant. Karbhari et al. [50] showed that the Wakalah fee has a negative relationship with both technical efficiency and market share, indicating that higher efficiency scores and higher market share are associated with lower Wakalah fees, suggesting there is no abuse of market power. Asafa and Archer [51] stated that excessive fees and high profit-sharing ratios may lead to deficiencies in Takaful performance.
  • Underwriting surplus/deficit.
The financial result of the PRF could record an excess, generally called an underwriting surplus, or a deficiency, known as an underwriting deficit. This variable is unique for Takaful businesses, and there is limited research assessing its impact on the financial performance of Takaful companies. Satata et al. [52] found that underwriting surplus does not significantly affect the earnings of a Takaful insurance company in Indonesia.
As demonstrated in Table 2, the descriptive statistics provide a first impression of the distribution of this study’s variables and are therefore useful for interpreting the subsequent PVAR analysis. The mean and standard deviation values illustrate how Takaful window operators differ in profitability, retention structure, fee structure, commission expenses, and underwriting results. The statistics mentioned above allow for identifying whether the variables exhibit greater volatility than others and whether there are differences in operational processes between companies. In addition, the observed range indicates that the data are sufficiently diverse to support dynamic modeling. In general, the descriptive statistics provide the empirical basis for the data set, confirm that it is suitable for estimating multivariate time series, and offer preliminary insights into the financial and operational conditions of Takaful windows in Pakistan.

3.2. Pvar Model Specification

This study employs a modern PVAR methodology established by Abrigo and Love [53]. The beneficial tool is a combination of econometric methods that connects the standard panel model, which accounts for unobserved heterogeneity across individuals, with the vector autoregressive (VAR) model, which treats all variables in the system as endogenous. The primary advantage of the PVAR methodology is its integration of the conventional VAR method, which addresses endogeneity through a panel-data approach that accounts for unobserved individual heterogeneity. Another advantage is the potential to increase the quantity of relevant data by introducing a fixed effect, thereby improving the consistency of the evaluation [53]. The PVAR model takes the following specifications:
Z i t = B 0 + J = 1 p Z i t j B j + X i t A + θ i + φ t + ξ i t i 1 , 2 , , N , t 1 , 2 , , T
where the vector Zit represents the endogenous variables. Xit represents the exogenous variables. The matrices B0, Bj, and A contain the parameter values to be assessed. The idiosyncratic errors, time-specific fixed effects, and panel-specific fixed effects are represented by ξ i t , φ t , and θ i , respectively.
As previously mentioned, multiple reasons motivated us to utilize the PVAR model for this study: (1) it allows us to examine how our main variables, ROE and ROA, respond to a shock of one standard deviation on all the explanatory variables; (2) the PVAR model uses forecast error variance decomposition (FEVD) to evaluate how each system variable contributes to the variability in the ROE and ROA variables; (3) the direction of causality between all the models within the study framework can be examined using the PVAR model. On the technical side, the PVAR model offers notable advantages over other econometric models commonly used in the literature. The primary benefit lies in its ability to integrate diverse econometric attributes by combining elements of the conventional panel framework with those of the vector autoregressive method. The PVAR technique assumes fixed effects, which is another significant advantage of the methodology [53]. This suggests that it explains unobserved individual differences in a multifactorial model. Further, this study used a PVAR model as it was an appropriate choice to capture the dynamic interactions between various firm-level factors (i.e., the dependent and independent variables in this study), addressed issues of endogeneity, and accounted for feedback effects between the operational variables and the measures of profitability over time, which were consistent with the research objectives.
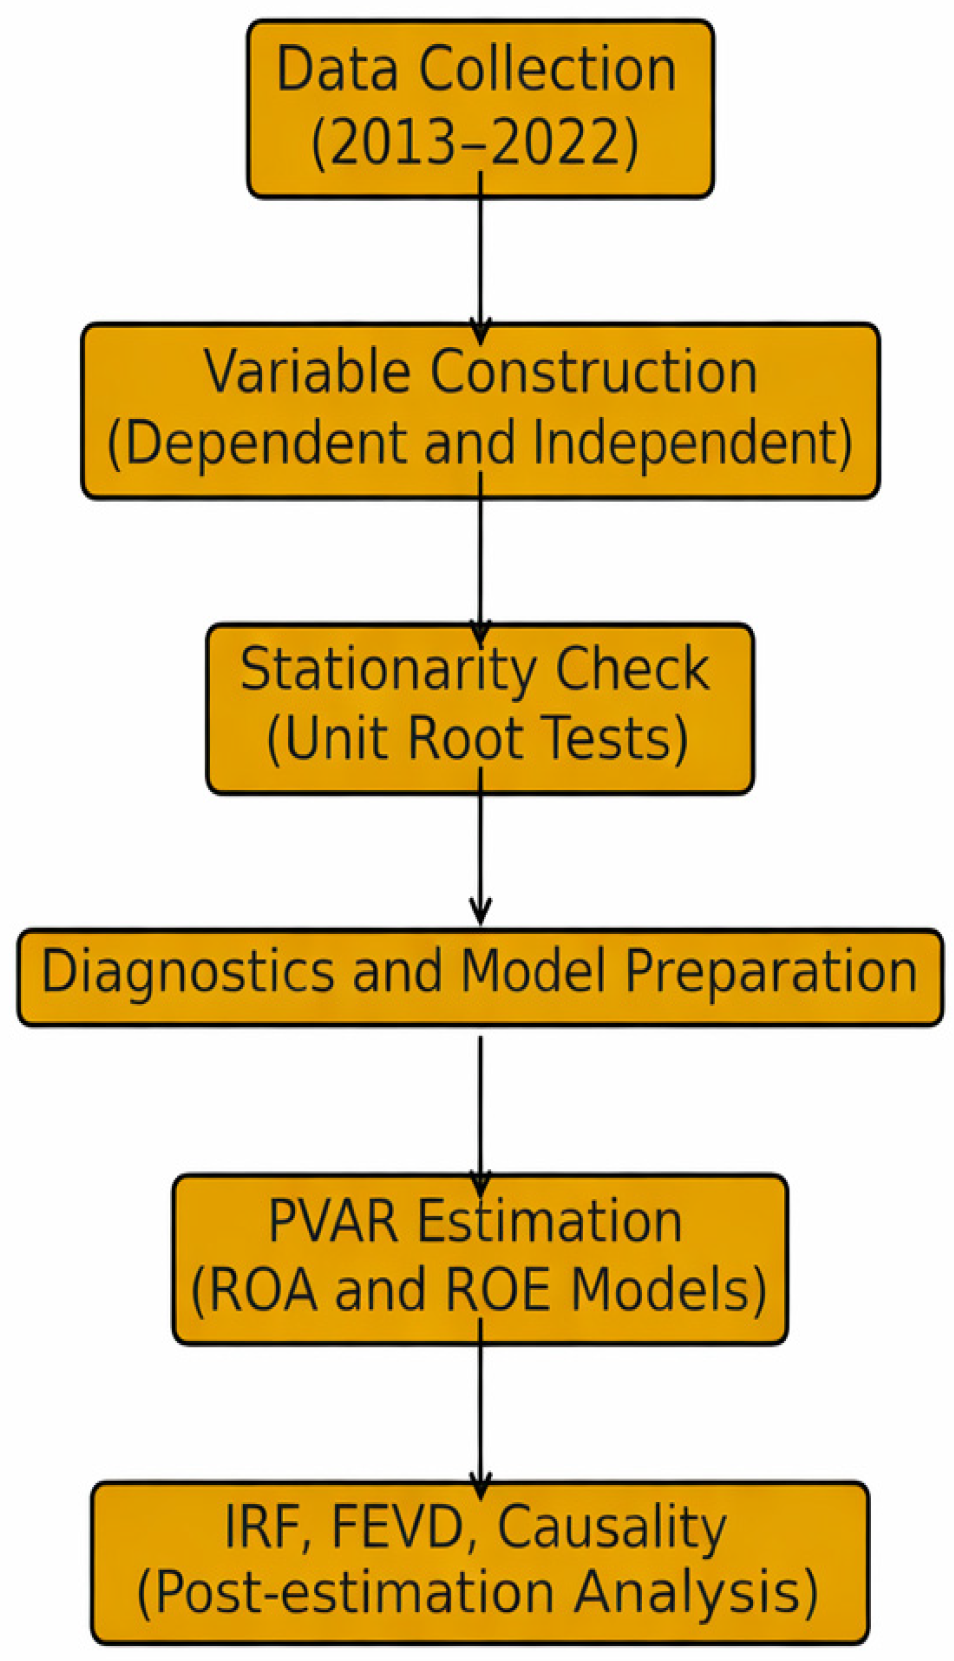
The estimation process of the PVAR model involves three major steps. In the first step, the stationarity of all model variables is checked, and the optimal lag for the PVAR order is identified. Additionally, to determine the most appropriate order for the PVAR model, three modified information criteria are used to determine the best fit for the lag lengths in the PVAR model, namely, the MAIC (Modified Akaike Information Criterion), MBIC (Modified Bayesian Information Criterion) and MQIC (Modified Hannan–Quinn Criterion), which all have finite sample corrections that are suitable for panel data. The modifications to the standard AIC, BIC, and HQ, as suggested by Andrews and Lu [54], improve the performance of model selection based on these criteria in dynamic panel data settings; therefore, they provide an objective measure of selecting the correct number of lags for the estimation of a PVAR model. The next step is to estimate the PVAR model with the optimal lag and check its stability. The final stage involves the post-estimation procedure, which comprises the computation of impulse response functions (IRFs), the decomposition of forecast error variance (FEVD), and the analysis of causal direction (see Figure 3). Additionally, the empirical analysis was conducted in Stata (version 17) at every stage of the estimation process, from stationarity testing and diagnostic tests to a PVAR model and related impulse responses and variance decompositions.

4. Results and Discussion

4.1. Results of Unit Root Tests

A crucial preliminary step is to examine the integration order for each variable of interest before estimating the PVAR model. The PVAR model requires that each series be stationary. To examine the stationarity of the variables, this paper employed a battery of panel unit root tests. Three tests were applied in the present investigation: the Fisher-ADF and Fisher-PP tests, defined by Maddala and Wu [55] and Choi [56], respectively, and the LLC and IPS tests, defined by Levin et al. [57] and Im et al. [58], respectively. For each of the three tests, the alternative hypothesis is stationarity, and the null hypothesis is the unit root assumption. We provide the computed results of the three panel unit root tests that we employed in this investigation in Table 3. As shown in Table 3, the first differences of all variables are statistically significant at the 1% confidence level (Δ-statistic). Therefore, we conclude that each time series is integrated of order one (i.e., I(1)). The confirmation of I(1) supports the use of these time series in the PVAR model since it is assumed that all data should be stationary in their first difference. In general, we found that all variables exhibited first-order integration. As such, all the factors were included in their first differences in the PVAR estimate.

4.2. Selection of Optimal Lag

The results of testing all tests and information criteria for alternative lag lengths up to k = 2 are given in Table 4. The analysis shows that the optimal lag is k = 1, which matches the minimum values across all analyses and criteria. Subsequently, the following analysis is based on k* = 1 as the optimum lag length for further investigation.

4.3. Results of PVAR Estimates

Table 5 and Table 6 present the estimated results of the PVAR model with the optimal lag, k* = 1. However, it is crucial to verify and evaluate the stability hypothesis in the selected models before analyzing and interpreting the PVAR findings.
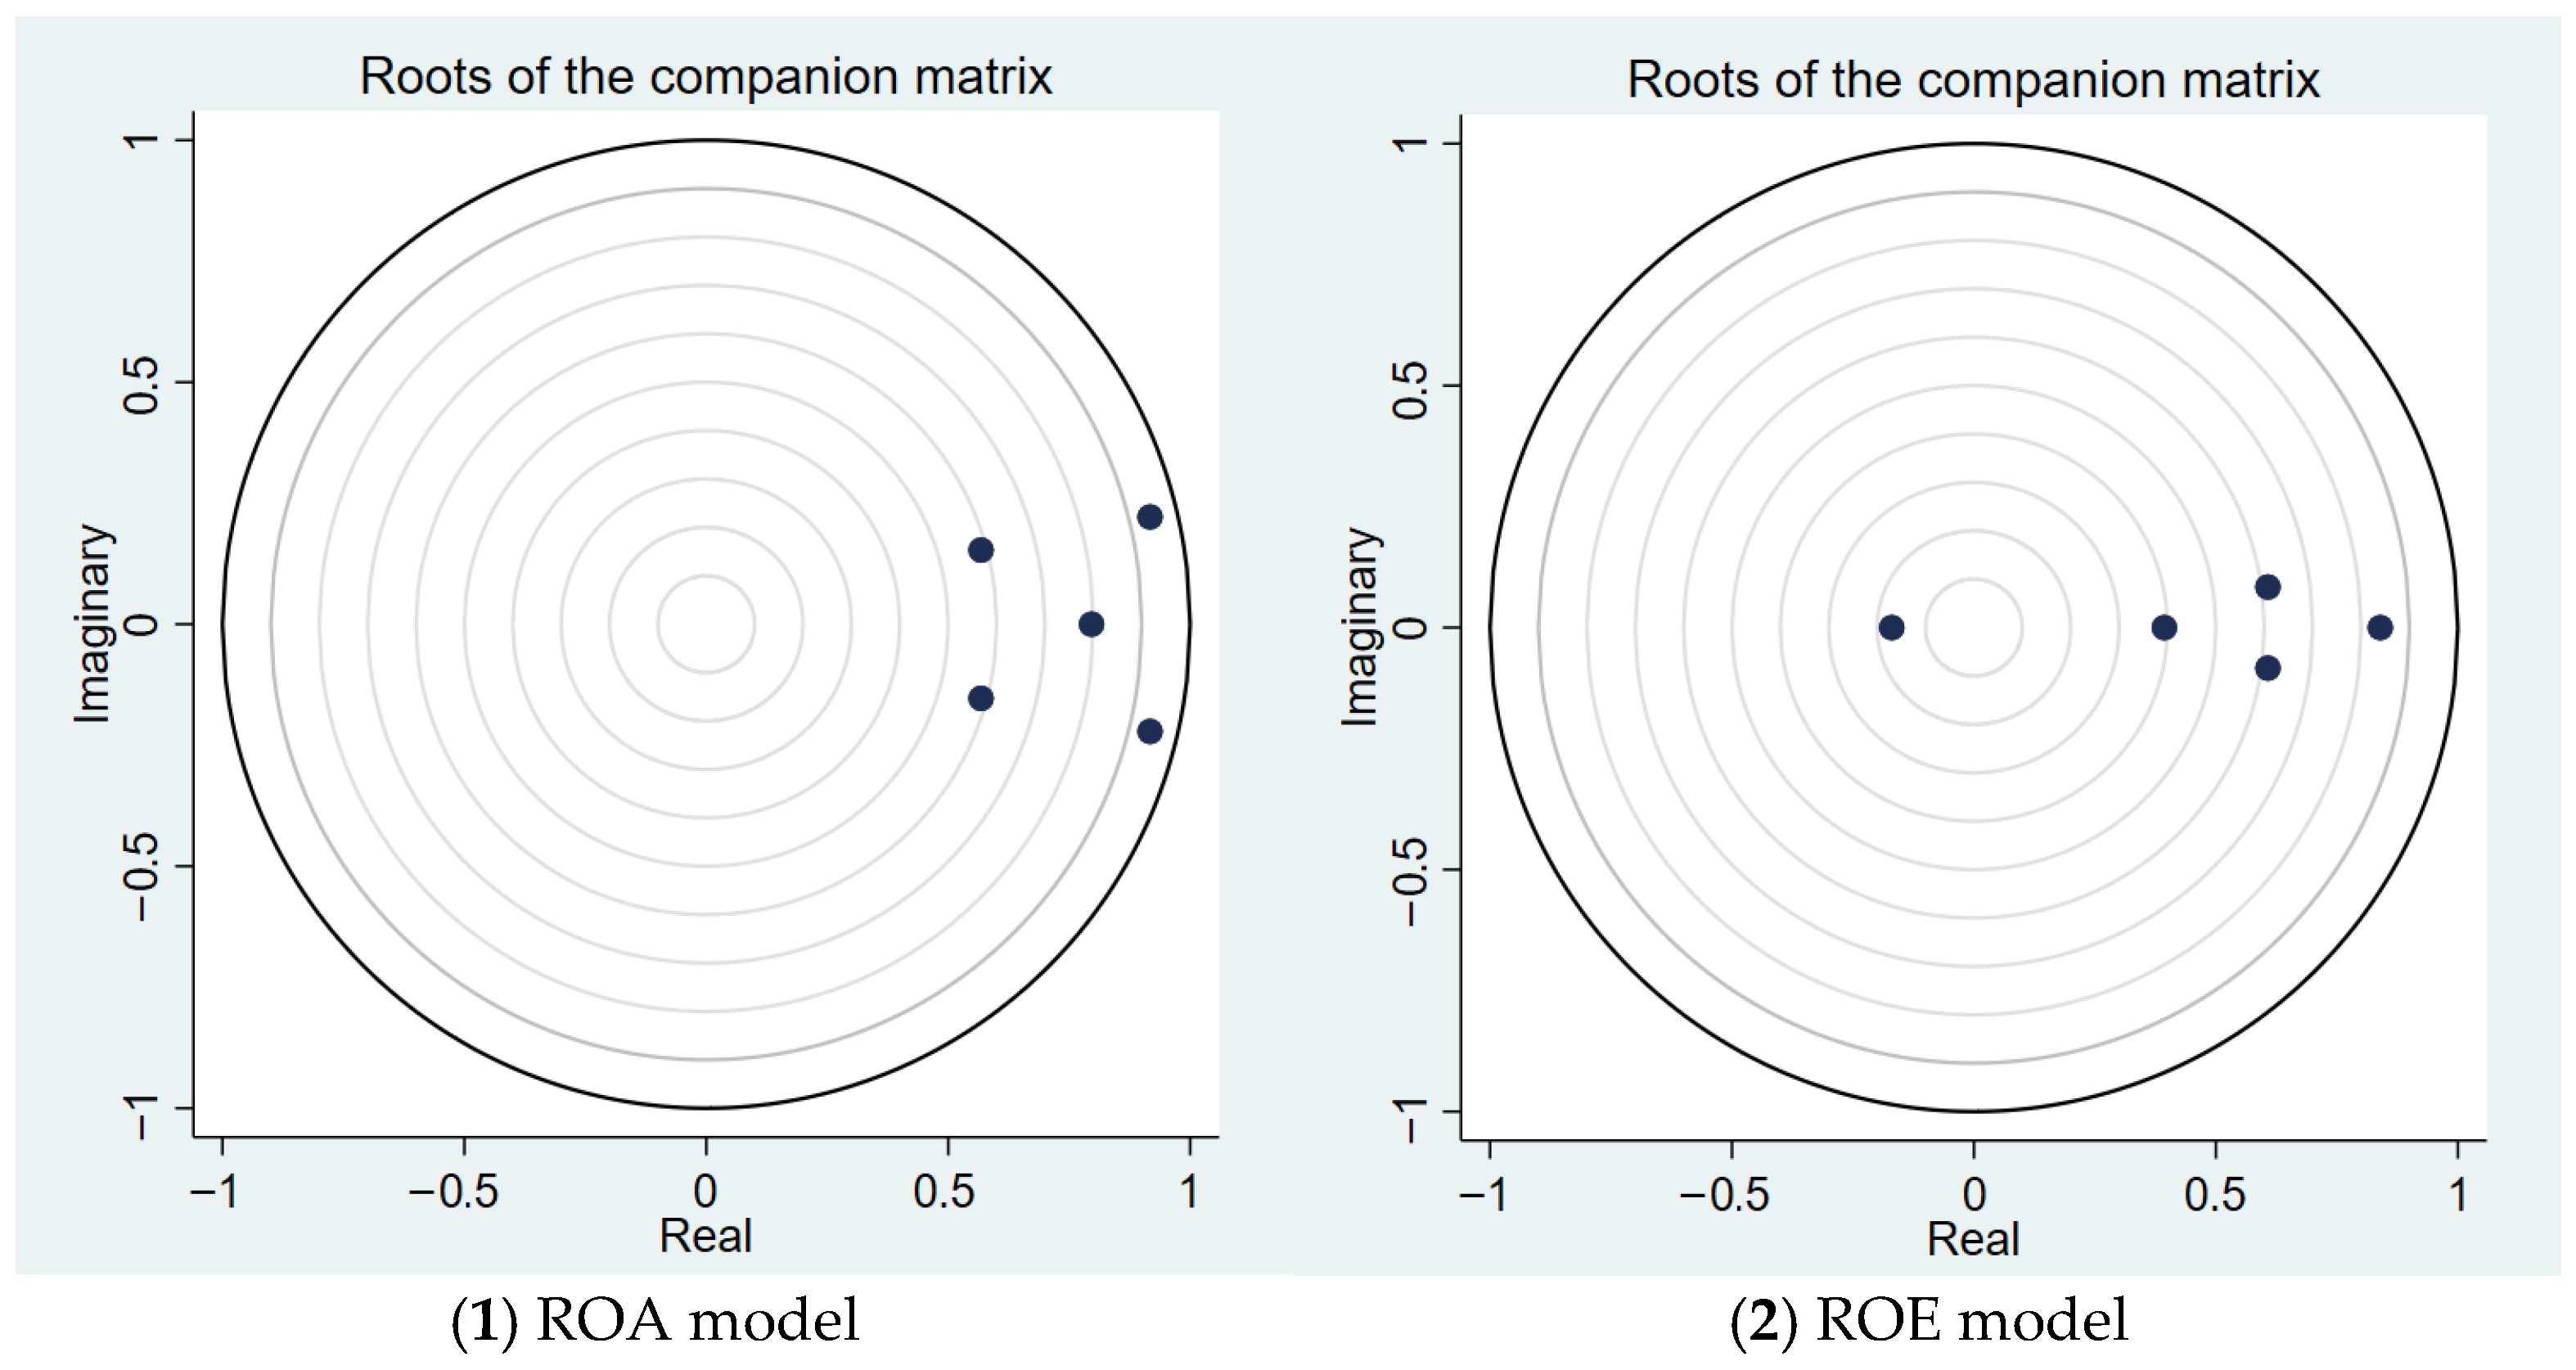
In the context of the standard vector autoregressive model, panel vector autoregressive model stability is checked by computing the modulus of each eigenvalue. The results are presented in Figure 4, which shows that the PVAR models satisfy the stability condition, as all roots lie inside the unit root circle [59]. The following study precisely estimates the ROE and ROA equations to assess the determinants affecting the financial performance of Takaful windows in Pakistan.
The outcomes of the ROA model estimate are shown in Table 5. The results indicate that the coefficients for the first lag of the retention ratio, Wakalah fee, commission ratio, and underwriting surplus/deficit variables are all statistically significant at the 1% significance level (p-value < 0.01).
From an economic perspective, the Wakalah fee coefficient is negative, whereas the coefficients for our other determinant variables are positive and highly significant. In Takaful, the Wakalah fee represents the remuneration paid to the Takaful windows (specifically, it is channeled to the shareholders’ fund). The Wakalah fee is deducted upfront from the GWC, which means a higher Wakalah fee results in a lower net written contribution injected into the participants’ fund (sometimes known as the Takaful fund) and, subsequently, impacts profitability. This variable is essential to Takaful operations, and, to the authors’ knowledge, no research goes into depth to select this variable for analysis.
For the gross written contribution variable, the impact is positive and statistically significant at the 1% level (p-value < 0.01). The outcomes indicate a positive, significant impact of GWC on ROA, since GWC is the main source of income for the Takaful windows. This result is in line with various related studies, such as [6,60,61].
For the retention ratio variable, the impact is positive: Takaful windows should retain more business rather than ceding it to reTakaful or reinsurance. This potentially led to an increase in net premium income, which may be reflected in underwriting activities and, subsequently, positively affect profitability. Another factor that could lead to the same outcome is that a higher retention ratio can reduce reinsurance commission and save expenses that would otherwise be deducted from premiums.
The underwriting surplus positively affects return on assets, further confirming the importance of underwriting as a key determinant of Takaful windows’ financial stability. Strong underwriting performance yields sufficient premiums, efficient risk selection, and fund solvency; in turn, it reduces the need for shareholder support and improves overall profitability [62,63].
The last variable shown in Table 5 is the commission ratio; the results indicate a positive impact on profitability. As stated earlier, the commission ratio relates to the amount paid to intermediaries. This could have occurred when the high commission could incentivize intermediaries to sell more policies and attract more customers to the Takaful windows. This situation can increase the number of policies acquired and the amount of GWC, and it can be reflected in profitability if Takaful is well managed.
Further, the empirical results for the ROE equation in Table 6 indicate that the first lag of the commission ratio and underwriting surplus have positive, highly significant coefficients at the 1% level.
In terms of underwriting surplus, the results show that this variable positively affects return on equity, indicating effective management of the Takaful fund and prudent underwriting risk control, thereby enhancing overall profitability. This reduces reliance on shareholders’ funds to provide qard support, which becomes necessary only when the Takaful fund incurs a deficit [64,65].
The first lag of the retention ratio and Wakalah fee variables have negative and highly significant coefficients. The common perception of the retention ratio is positive. If the firm has a high retention ratio, it may lead to increased underwriting income and reduced reTakaful/reinsurance costs. However, it may also increase risk exposure, requiring more capital, thereby impacting profitability and return on equity. This means the firm should target the optimal retention ratio by carefully balancing risk management, capital utilization, market conditions, and regulatory considerations [66,67,68].
Further, a higher retention ratio could improve ROA, as greater retained risk allows the company to retain a larger share of its underwriting income, thereby enhancing its asset-based profitability. However, this increased retained risk must be supported by additional capital that meets both solvency and regulatory requirements. Therefore, the requirement for the company to dedicate a larger percentage of its capital relative to equity can negatively affect equity-based ROE, explaining why an increase in retained risk reduces ROE. This distinction captures the two differing aspects of ROA and ROE—operational profitability and capital efficiency.
The Wakalah fee variable shows negative results, as shown in Table 5. A high Wakalah fee may be seen as a positive indicator for shareholders’ funds, but it also means fewer funds are injected into the Takaful fund, and the probability of a deficit could be higher. Subsequently, the shareholders’ fund will provide a qard to the Takaful fund.
In line with international evidence, we find support in studies from Malaysia and the GCC (i.e., [69,70]) for the positive effect of our retention and underwriting surplus and for the negative effect of a high Wakalah fee on equity-based returns. In contrast, findings from Indonesia and some GCC countries, e.g., [71], show limited, and sometimes even negative, effects of commission ratios and GWC, including higher acquisition costs, different reinsurance arrangements, or heterogeneity in governance.
The GWC variable shows a negative, statistically significant effect at the 10% level, reducing ROE while increasing ROA. Such mixed outcomes may reflect the distinct nature of Takaful windows, where inadequate segregation from conventional operations and the shareholders’ obligation to sustain the Takaful fund can distort financial boundaries and influence performance. The above-described mixed effects can be understood through a Takaful window framework. The higher Wakalah fees will increase the funds transferred to the shareholders’ fund (a component that improves short-term profitability and ROA), but diverting too many funds from the PRF could reduce its ability to absorb claims over the long term. This would help explain the negative relationship between the two variables for ROE. Similarly, while growth in GWC could improve both the scale of operations and, therefore, operating income, it can also negatively affect ROE when growth in contributions is associated with higher acquisition costs and lower-quality underwriting, thereby reducing the return on equity.
For the commission ratio variable, the positive results shown in both Table 5 and Table 6 suggest that high commissions paid to intermediaries may lead to increased sales and profitability, resulting in higher earnings and, consequently, a higher ROE.

4.4. Analysis of IRFs

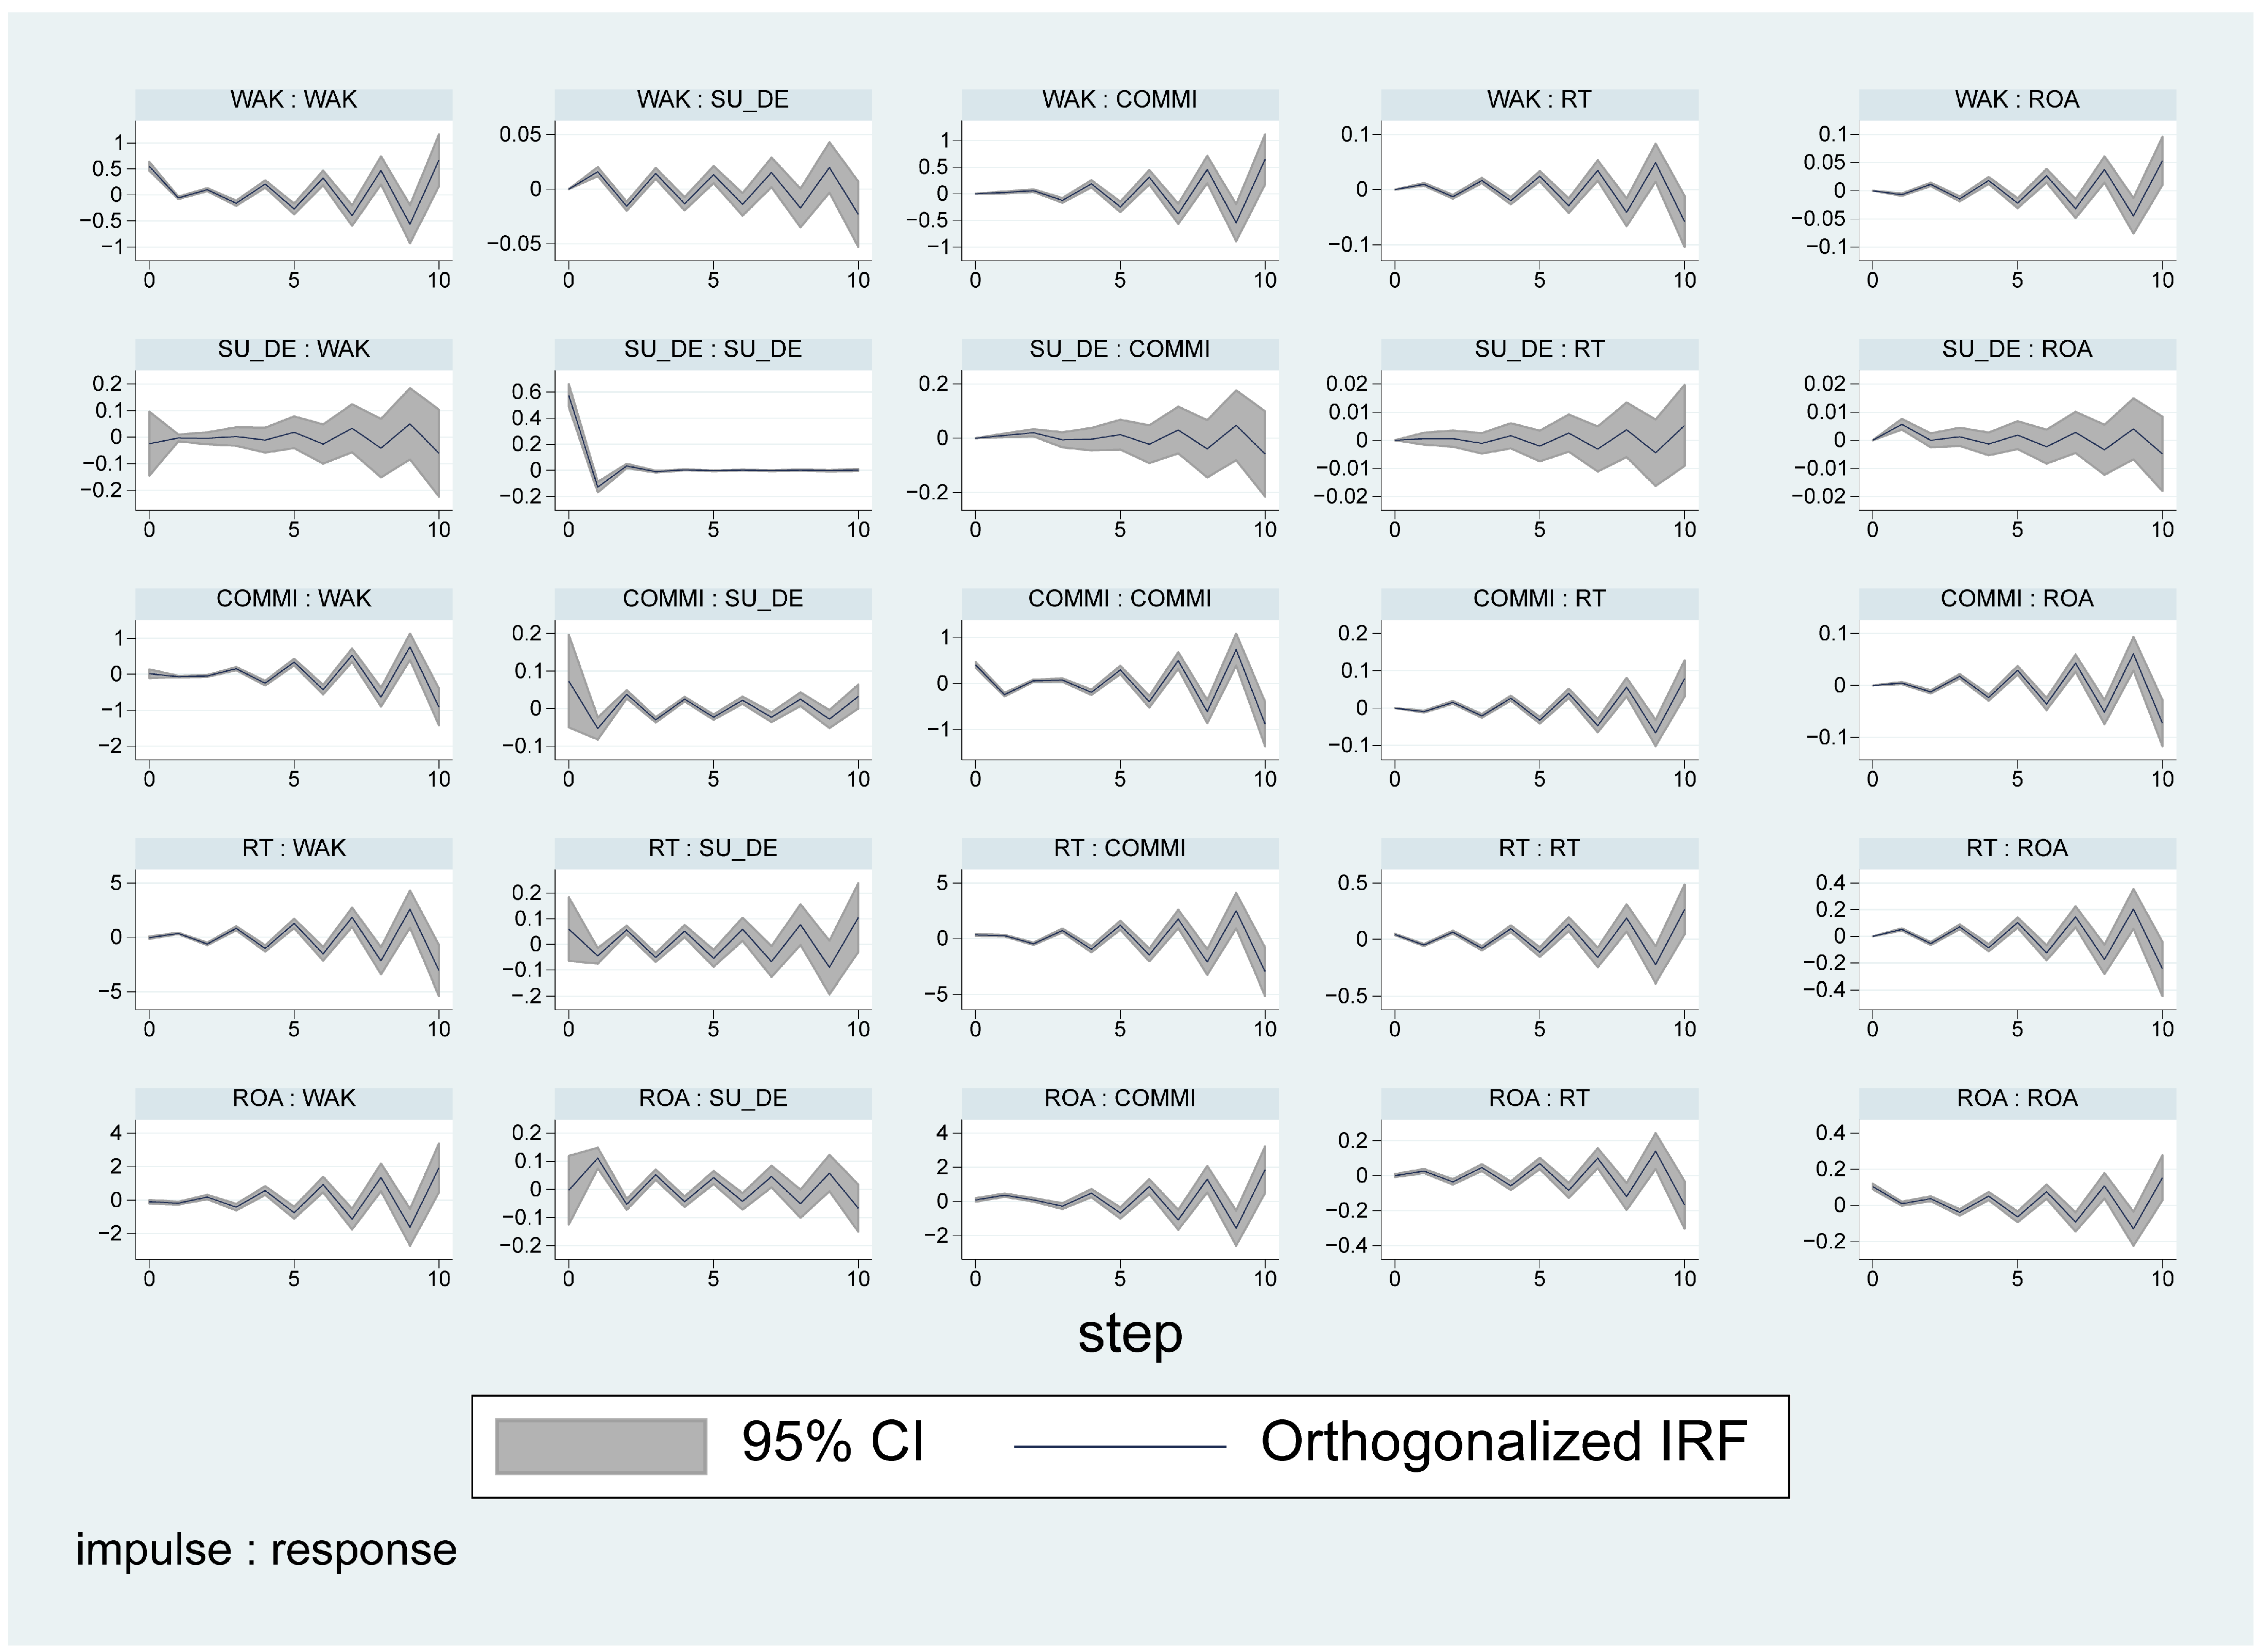
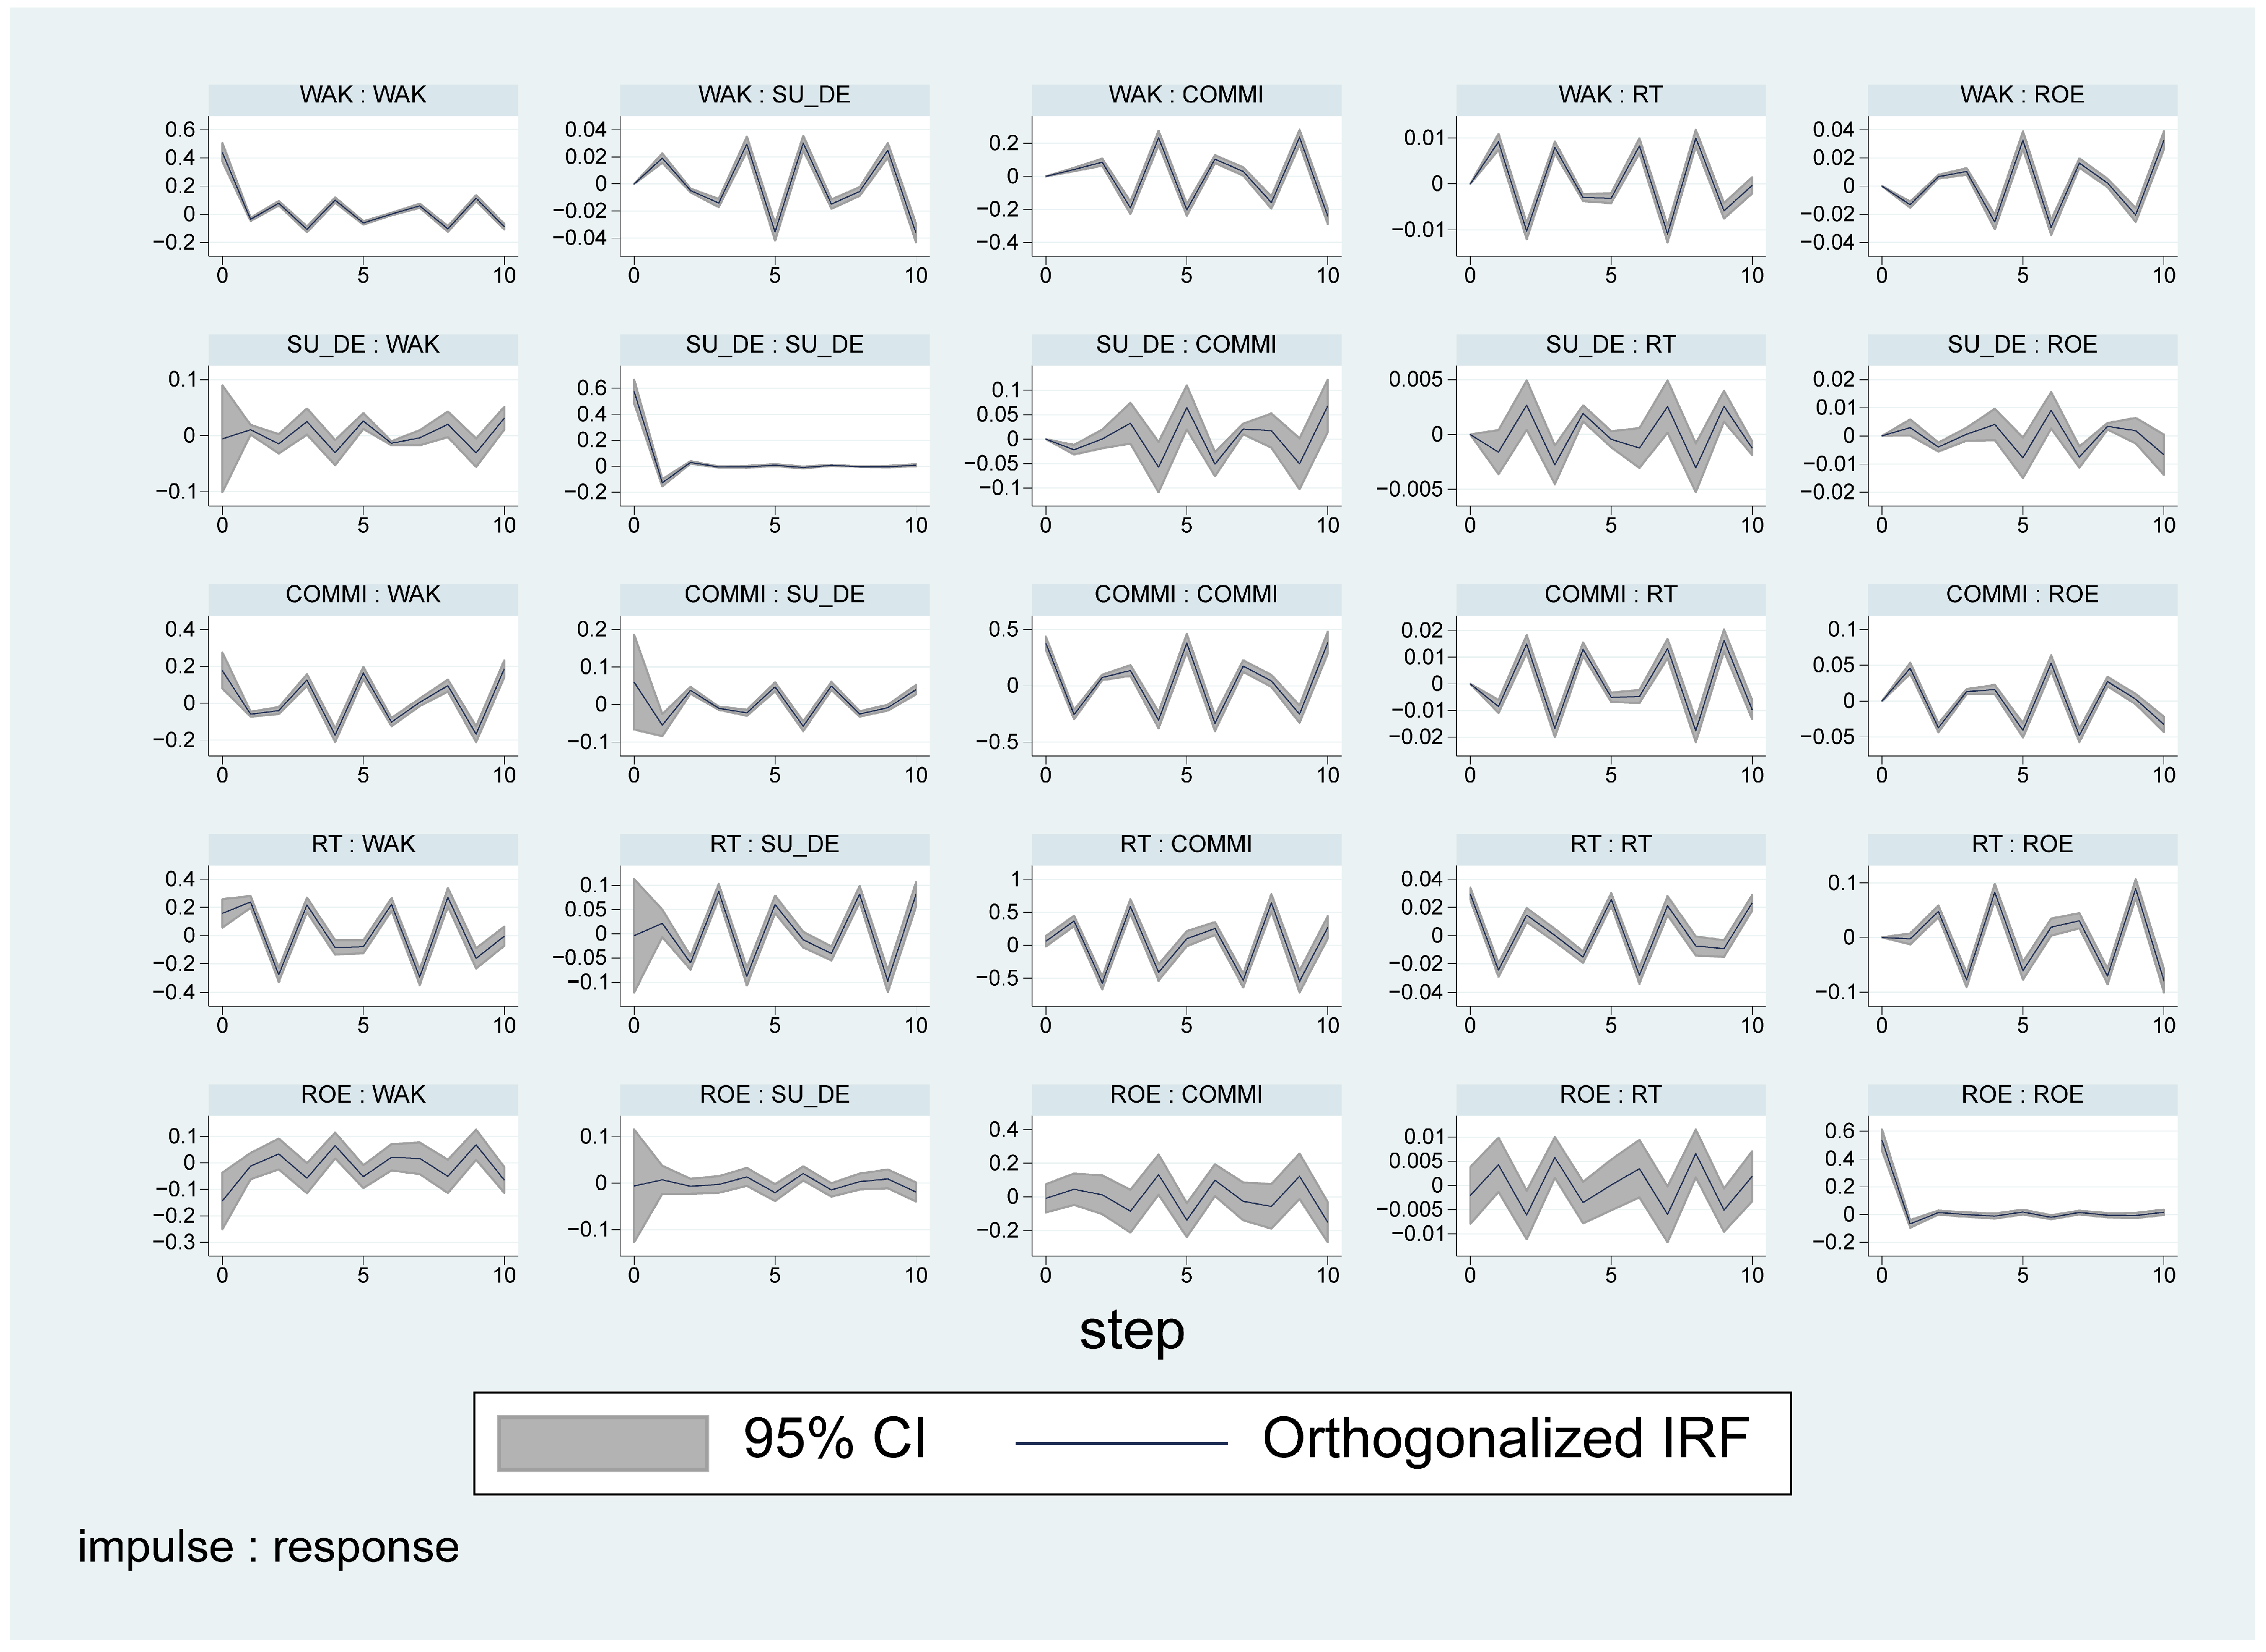
The purpose of this section is to conduct an analysis of the impulse response functions (IRFs) of the ROA and ROE that occurred after a single standard innovation shock that had an effect on the variables of our investigation independently. In accordance with Sims [72], we decomposed the residual variance–covariance matrix using Cholesky decomposition to ensure that shocks are orthogonal. In addition, we performed Monte Carlo simulations to generate the IRFs for this investigation. We provide the reaction outcomes of ROA and ROE with 5% margins of error in Figure 5 and Figure 6, respectively. Remember that if the zero horizontal line is outside the 5% error range, then the ROA and ROE responses are significant.
Regarding Figure 5, the impulse response functions (IRFs) of the ROA model provide valuable insights into how return on assets responds to shocks in the key variables studied. The IRFs show that a positive shock to the retention ratio leads to a significant positive response in ROA, indicating that higher retention improves the profitability of Takaful windows. On the contrary, a shock to Wakalah fees produces a negative response in ROA, mirroring the adverse effect of higher fees on profitability by reducing the amounts available for underwriting and investment activities. The constructive shaping of IRFs into the underwriting surplus subsequently supports improved profitability. Furthermore, the commission ratio is expected to negatively impact profitability due to higher acquisition costs, but its positive impact on ROA suggests that incentivizing intermediaries may increase business volume and, therefore, profitability if properly managed. In conclusion, the ROA model’s IRFs highlight the importance of risk management, fee optimization, and an effective retention strategy for improving the bottom line of Takaful windows.
Concerning Figure 6, the impulse response functions (IRFs) related to the ROE model give some extra insight into the dynamics of ROE after perturbations on key explanatory variables. Importantly, an increasing commission ratio and a higher level of underwriting surplus have a significant, positive effect on ROE, suggesting that underwriting policies and intermediaries’ incentives are key determinants of equity returns. On the other hand, if there is a perturbation in the retention rate and also in the Wakalah fees, there is a negative reaction in ROE, as it implies that while high retention can contribute to high revenue, it will simultaneously also increase risk exposure and capital requirements. Thus, it can reduce the profitability of equity. Analogously, when Wakalah fees become too high, the funds available for the PRF are reduced, which has a detrimental effect on the fiscal health of the Takaful fund and, by extension, depresses these ROEs. Of note, a shock to the Government Wage Cost (GWC) parameter leads to a mixed response in ROE; the negative effect implies that subpar segregation between conventional and Islamic operations can erode equity returns. These IRF findings substantively underscore the imperative for Takaful windows to exercise utmost prudence in balancing risk management, fee structures, and capital allocation to optimize ROE.

4.5. Analysis of Variance Decomposition

The variance decomposition analysis in Table 7 provides an overview of the contributions of each principal variable to the observed variability in return on assets and return on equity for Takaful windows in Pakistan. In the ROA model, the retention ratio (RT) is the most pervasive explanatory factor, accounting for nearly 63 percent of the total variance; hence, the crucial role of customer retention approaches in maintaining and improving asset performance. In contrast, the contributions of the commission ratio (COMMI), underwriting surplus (SU_DE), and Wakalah fees (WAK) are relatively minor, with COMMI accounting for 5.1%, SU_DE for 0.2%, and WAK for 2.9% of the variance in ROA. This empirical behavior indicates that while the popularity of commission structures, intermediary incentives, underwriting practices, and fee management are substantively important, their direct impact on asset returns is comparatively less than that of the business retention.
Within the ROE framework, the retention ratio has emerged as the main determinant, accounting for 9.7% of the variation in ROE. This finding underscores the importance of maintaining a proper retention ratio in shaping equity returns as a stable business retention strategy to balance risks between the window and the reTakaful. This contributes significantly to the financial stability and profitability of Takaful windows. The commission ratio (COMMI) also explains a portion of the variation in ROE, but to a lesser degree: it accounts for 3.3% of the total variation. Hence, although commissions are essential, the extent to which they affect equity returns is secondary to the impact of retention strategies. On the other hand, underwriting surplus (SU_DE) and Wakalah fees (WAK) are small, accounting for 0.3% and 1%, respectively, indicating a marginal impact on equity returns.
In summary, the variance decomposition shows that commission and retention ratios are the predominant drivers of Takaful windows’ financial performance. Consequently, hosts should improve commission frameworks to enhance asset profitability and employ effective retention strategies to improve equity returns. Although this is aided by underwriting surplus and Wakalah fees, their comparatively minor roles underscore the importance of managing commissions and retention for sustainable growth.

4.6. Analysis of Causality

The results of Granger causality in Table 8 provide essential information on the direction of relationships among the key variables and their impacts on ROA and ROE within the Takaful windows framework. The analysis also shows strong bidirectional causality between ROA and the retention ratio, suggesting that an increase in the retention ratio not only boosts profitability (ROA) but that improved profitability, in turn, has a positive effect on the firm’s ability to retain its business. Also, the commission ratio and underwriting surplus have a strong causal effect on ROA, implying that greater commissions paid to intermediaries and effective underwriting strategies enhance profitability.
For ROE, the causality results show a strong correlation with the commission ratio and underwriting surplus, indicating that these two variables have a direct impact on ROE returns and are also influenced by changes in ROE itself. This perpetuates the joint causality between efficient commission models, underwriting performance, and equity profitability. Conversely, Wakalah fees imply a unidirectional negative causality from the payment of high fees to low profitability and no reverse causality. This result demonstrates the need to design fee structures that do not negatively affect the budget performance of Takaful windows.

5. Conclusions and Policy Implications

This study provides evidence on the financial sustainability of Takaful windows and identifies firm-level factors contributing to stable profitability in Pakistan’s hybrid Islamic insurance environment. The results indicate that retaining the business, commission structures, and underwriting profit margins are key to achieving profitable performance and that excessive Wakalah fees will negatively affect long-term viability. This study shows the operating mechanism by which Takaful windows have maintained financial resilience, operating within the constraints of reliance on host insurers and competitive pressure from other competitors. This study demonstrates how institutional sustainability can be achieved at the institutional level through balanced risk-sharing arrangements, efficient underwriting, and governance structures that align fee policies with performance outcomes.
The present research has several significant implications for policymakers, regulators, and stakeholders in the Takaful industry. First, given that underwriting surplus positively affects financial performance, policymakers should promote interdependence mechanisms to enhance underwriting quality, especially by adopting better risk management practices and greater adherence to Shariah principles. Moreover, the detected negative impact of Wakala commissions on financial performance suggests that regulatory agencies should implement policies to limit such commissions to their optimal levels, enabling different Takaful windows to balance profitability and risk funds and maintain sufficient resources. Furthermore, this study confirms the importance of retention ratios as proxies for balancing between retaining the business and resharing it with reTakaful. Given the asymmetric effects of gross written contributions on overall profitability, interdependence windows must ensure adequate segregation between Islamic and conventional operations to prevent the misallocation of funds that could eventually threaten the integrity of interdependence models. These recommendations can inform the design of policy reforms to enhance the financial sustainability of interdependence windows and ensure their integration into the Islamic finance framework.
These broader implications of the regulatory proposals can be further enhanced by identifying specific practical mechanisms for regulators and Takaful window operators to strengthen the financial resiliency of Takaful windows. To achieve this, regulators could establish a linkage between permissible Wakalah fees and the ability to measure the Takaful window’s performance with respect to PRF and solvency measures, thereby, in effect, establishing an incentive for Wakalah fee extraction to support long-term risk-sharing objectives. Furthermore, enhanced regulation of how funds are utilized, costs are allocated, and operating expenses are treated will provide additional assurance of the segregation between Islamic and conventional operations, thereby ensuring both Shariah compliance and financial viability within the Takaful window structure.
While this study provides substantive information on the determinants of profitability through Takaful windows in Pakistan, it is not without limitations. The main limitation is the analysis’s limited geographical coverage, restricted to Pakistan. As a result, the external validity of the findings is limited, and they cannot be generalized to markets with different regulatory, economic, and governance structures. Moreover, this research is based solely on secondary data for the period 2013–2022, which may not adequately reflect recent developments or emerging trends in the Takaful industry. In addition, the availability of financial statements, especially for key variables under study, such as underwriting surplus and Wakalah fees, shows variability in quality and consistency across firms, limiting the breadth of analysis.
Future work could further the present project by using a larger, multi-country dataset, enabling cross-country comparisons of Takaful windows. Such an expansion would also make it easier to study macroeconomic effects and policy changes during Takaful windows. Complementary qualitative inquiries, such as structured interviews with industry experts, could yield deeper insights into operational challenges and opportunities, providing additional avenues for inquiry. Future research could also include micro-level corporate governance variables (e.g., the size, level of expertise, and independence of the Shariah board) in addition to broader macroeconomic variables. The inclusion of these variables will provide a better understanding of how both the institutions that govern Takaful windows and the broader economic environment affect their performance. These extensions are expected to make a significant contribution to understanding Takaful windows and to the formulation of specialized policies to promote their growth and long-term sustainability.

Author Contributions

Conceptualization, O.A. and A.A.A.; methodology, M.K.; software, M.K.; validation, O.A., A.A.A. and M.K.; formal analysis, O.A.; investigation, A.A.A.; resources, M.K.; data curation, M.K.; writing—original draft preparation, A.A.A.; writing—review and editing, O.A.; visualization, O.A.; supervision, M.K.; project administration, O.A.; funding acquisition, A.A.A. All authors have read and agreed to the published version of the manuscript.

Funding

This research received no external funding.

Institutional Review Board Statement

Not applicable.

Informed Consent Statement

Not applicable.

Data Availability Statement

The data presented in this study are available on request from the authors.

Acknowledgments

The researchers would like to thank the Deanship of Graduate Studies and Scientific Research at Qassim University for financial support (QU-APC-2025).

Conflicts of Interest

The authors declare no conflict of interest.

References

  1. IFSB. Islamic Financial Services Industry Stability Report; Islamic Financial Services Board: Kuala Lumpur, Malaysia, 2024. [Google Scholar]
  2. IFSB. IFSB-25: Disclosures to Promote Transparency and Market Discipline for Takāful/Retakāful Undertakings; Islamic Financial Services Board: Kuala Lumpur, Malaysia, 2020. [Google Scholar]
  3. Alrazni Alshammari, A.; Motawe Altarturi, B.H.; Alokla, J. Systematic review on Takaful and reTakaful windows: A regulatory development perspective. Turk Tur. Arastirmalari Derg. 2021, 4, 1–13. [Google Scholar] [CrossRef] [Scilit]
  4. Hodori, A.; Masih, M. Determinants of Profitability of Takaful Operators: New Evidence from Malaysia Based on Dynamic GMM Approach. Munich Pers. RePEc Arch. 2017, 79441, 24. [Google Scholar]
  5. Ismail, M. Determinants of financial performance: The case of general Takaful and insurance companies in Malaysia. Int. Rev. Bus. Res. Pap. 2013, 9, 111–130. [Google Scholar]
  6. Guendouz, A.A.; Ouassaf, S. Determinants of Saudi Takaful Insurance Companies Profitability. Acad. Account. Financ. Stud. J. 2018, 5, 1. [Google Scholar]
  7. Suherman, M.; Firmansyah, I.; Almunawwaroh, M. Determinants of sharia insurance company profitability. AFEBI Account. Rev. 2019, 4, 41–49. [Google Scholar] [CrossRef] [Scilit]
  8. Alias, A.; Sulaiman, M.; Ariffin, N.; Bakar, A. MALAYSIAN TAKAFUL REPORTING FROM A MAQASID SHARIAH PERSPECTIVE. J. Islam. Philanthr. Soc. Financ. 2023, 5, 1–9. [Google Scholar] [CrossRef] [Scilit]
  9. Al-Amri, K.; Hossain, M. A survey of the Islamic insurance literature – takaful. J. Econ. Res. 2017, 6, 53–61. [Google Scholar]
  10. Asafa, D.A. WP-16: Regulatory and Supervisory Issues in Takaful Windows; Islamic Financial Services Board: Kuala Lumpur, Malaysia, 2020. [Google Scholar]
  11. Middle East Insurance Review. Guinea: SAAR Assurances Starts Takaful Window. Middle East Insurance Review. 2020a. Available online: https://www.meinsurancereview.com/News/View-NewsLetter-Article/id/72714/Type/Africa/Guinea-SAAR-Assurances-starts-Takaful-window (accessed on 6 September 2024).
  12. Middle East Insurance Review. Kenya: State Owned Reinsurer Eyes Setting Up ReTakaful Subsidiary in Egypt. Middle East Insurance Review. 2020b. Available online: https://www.meinsurancereview.com/News/View-NewsLetter-Article/id/60677/Type/Africa/Kenya-State-owned-reinsurer-eyes-setting-up-reTakaful-subsidiary-in-Egypt (accessed on 23 November 2024).
  13. Vizcaino, B. Pakistan Takaful Rules to Attract New Players. Reuters India. 2012. Available online: https://in.reuters.com/article/islamic-finance-pakistan-idINL6E8J51BP20120807 (accessed on 23 November 2024).
  14. Abuljebain, R.D.; Wakerley, S.; Garrett, L. Insurance and Reinsurance in Kuwait: Overview; Thomson Reuters, Practical Law: London, UK, 2020. [Google Scholar]
  15. Alali, M.S.; Alsalem, A.S.; Alawadhi, K.M.; Alforaih, E.O.; Alsabah, A.M. Examining the nexus between internal factors and profitability of insurance companies listed at Kuwait stock exchange. Kuwait Chapter Arab. J. Bus. Manag. Rev. 2019, 8, 30–37. [Google Scholar] [CrossRef] [Scilit]
  16. Shawar, K.; Siddiqui, D.A. Factors Affecting Financial Performance of Insurance Industry in Pakistan. Res. J. Financ. Account. 2019, 10, 29–41. [Google Scholar]
  17. Batool, A.; Sahi, A. Determinants of financial performance of insurance companies of USA and UK during global financial crisis (2007–2016). Int. J. Account. Res. 2007, 7, 1–9. [Google Scholar] [CrossRef] [Scilit]
  18. Sasidharan, S.; Ranjith, V.; Prabhuram, S. Micro-and Macro-Level Factors Determining Financial Performance of UAE Insurance Companies. J. Asian Financ. Econ. Bus. 2020, 7, 909–917. [Google Scholar] [CrossRef] [Scilit]
  19. Abdeljawad, I.; Dwaikat, L.M.; Oweidat, G. The determinants of profitability of insurance companies in Palestine. An-Najah Univ. J. Res.-B (Humanit.) 2020, 2, 439–468. [Google Scholar] [CrossRef] [Scilit]
  20. Killins, R.N. Firm-specific, industry-specific and macroeconomic factors of life insurers’ profitability: Evidence from Canada. N. Am. J. Econ. Financ. 2020, 51, 101068. [Google Scholar] [CrossRef] [Scilit]
  21. Sharma, A.; Jadi, D.M.; Ward, D. Analyzing the determinants of financial performance for UK insurance companies using financial strength ratings information. Econ. Change Restruct. 2021, 54, 683–697. [Google Scholar] [CrossRef] [Scilit]
  22. Ahmeti, Y.; Iseni, E. Factors affecting profitability of insurance companies. Evidence from Kosovo. Acad. Int. Sci. J. 2022, 25, 122–142. [Google Scholar] [CrossRef] [Scilit]
  23. Rofika, H.; Meylianingrum, K. Factors that Influence the Profits of Takaful Companies in Indonesia and Malaysia. J. Islam. Econ. Financ. Stud. 2024, 5, 99–116. [Google Scholar] [CrossRef] [Scilit]
  24. Qubbaja, A. Determinants of Palestine Takaful Insurance Companies Profitability. Millah J. Relig. Stud. 2025, 24, 459–490. [Google Scholar] [CrossRef] [Scilit]
  25. Amrullah, A. Profitability and Resilience. J. Econ. Law Soc. 2025, 2, 51–72. [Google Scholar] [CrossRef] [Scilit]
  26. Nabihah, R.; Nasution, Z.; Setiawan, S. The Effect of Good Corporate Governance and Company Size on The Profitability of Islamic Insurance Companies in Malaysia. J. Ekon. Syariah 2023, 8, 35–42. [Google Scholar] [CrossRef] [Scilit]
  27. Ulya, A. Analysis of the Effect of Equity and Liabilities on Profitability at PT Takaful Keluarga. J. Ilm. Ekon. Islam 2024, 10, 222–228. [Google Scholar] [CrossRef] [Scilit]
  28. Sallemi, N.; Zouari, G. Shariah board and Takaful performance: Mediating role of corporate social responsibility. Int. Rev. Econ. 2023, 71, 175–204. [Google Scholar] [CrossRef] [Scilit]
  29. Sallemi, N.; Zouari, G. Effect of external corporate factors on Takaful performance. Asian J. Account. Res. 2024, 9, 217–228. [Google Scholar] [CrossRef] [Scilit]
  30. Elomari, R. The Role of Fintech in Promoting the Takaful Model of Islamic Insurance. Am. J. Financ. Technol. Innov. 2023, 1, 15–23. [Google Scholar] [CrossRef] [Scilit]
  31. Bensaid, Y. Shariah governance and Takaful financial performance: The case of listed Takaful insurances. J. Islam. Account. Bus. Res. 2023, 16, 170–187. [Google Scholar] [CrossRef] [Scilit]
  32. Sallemi, N.; Zouari, G. Board characteristics and Takaful performance: The moderating role of ownership concentration. J. Islam. Account. Bus. Res. 2024, 16, 1318–1345. [Google Scholar] [CrossRef] [Scilit]
  33. Bensaid, Y.; Quttainah, M. The determinants of Takaful insurance financial stability: The moderating role of Shari’ah Supervisory Board. J. Islam. Account. Bus. Res. 2024, 15, 1–20. [Google Scholar] [CrossRef] [Scilit]
  34. Rosli, F.; Noor, N.; Ramli, M.; Jalil, M.; Arifin, J. The Financial Performance of Life Insurance and Takaful Operators in Malaysia: A Lesson from the Health Crisis for Future Development. Int. J. Acad. Res. Account. Financ. Manag. Sci. 2023, 13, 176–192. [Google Scholar] [CrossRef] [Scilit] [PubMed]
  35. Arshad, Z.; Gondal, M.Y.; Hussain, T. Factor affecting the Financial Performance of Takaful Companies in Pakistan. Asian J. Res. Bank. Financ. 2016, 4, 14–21. [Google Scholar] [CrossRef] [Scilit]
  36. Tanveer, Z. Determinants of Financial Performance of Takaful and Insurance Companies. Doctoral Dissertation, University of Management and Technology, Arlington County, VA, USA, 2017. [Google Scholar]
  37. Asadullah, M.; Hassan, M.; Siddiqui, Z.A. Comparison of Takaful and non-Takaful insurance companies of Pakistan: Under Pre, during, and post-economic Crisis 2008. Etikonomi 2008, 20, 201–212. [Google Scholar] [CrossRef] [Scilit]
  38. Iqbal, H.; Rauf, M.A.; Syed Kashif Saeed, A. Determinants of the Performance of Window Takaful Companies: A Study of Pakistan. SSRN, 3866385. 2021. Available online: https://papers.ssrn.com/sol3/papers.cfm?abstract_id=5011335 (accessed on 18 March 2024).
  39. Noreen, U.; Ahmad, S. Cost Efficiency and Total Factor Productivity: An Empirical Analysis of Pakistan’s Insurance Sector. Lahore J. Econ. 2016, 21, 123–150. [Google Scholar] [CrossRef] [Scilit]
  40. Middle East Insurance Review. Pakistan: Financial Regulator’s Board Approves Takaful Regulations. Middle East Insurance Review. 2019. Available online: https://www.meinsurancereview.com/News/View-NewsLetter-Article/id/49198/Type/MiddleEast/Pakistan-Financial-regulator-s-board-approves-Takaful-regulations (accessed on 27 April 2024).
  41. Timothy, A. A Study of Financial Performance Using DuPont Analysis in a Supply Chain. Int. J. Bus. Manag. 2022, 10, 17. [Google Scholar] [CrossRef] [Scilit]
  42. OECD. Global Insurance Market Trends 2023; OECD: Paris, France, 2023. [Google Scholar]
  43. Akotey, O.; Sackey, J.; Amoah, F.G.; Manso, L. The financial performance of life insurance companies in Ghana. J. Risk Financ. 2013, 14, 286–302. [Google Scholar] [CrossRef] [Scilit]
  44. Tesfaye, T.T. Analysis of factors affecting financial performance evidence from selected Ethiopian insurance companies. Int. J. Sci. Res. 2018, 7, 834–852. [Google Scholar]
  45. Sumartono, S.; Harianto, K.A. Kinerja Keuangan Perusahaan Asuransi Di Indonesia dan Faktor-faktor yang Mempengaruhinya. Future J. Manaj. Dan Akunt. 2018, 6, 1–14. [Google Scholar]
  46. Hasibuan, A.F.P.; Sadalia, I.; Muda, I. The effect of claim ratio, operational ratio and retention ratio on profitability performance of insurance companies in Indonesia Stock Exchange. Int. J. Res. Rev. 2020, 7, 223–231. [Google Scholar]
  47. Wasike, A.N.; Ngoya, A. Determinants of profitability in the insurance sector in Kenya: A case of composite insurance Companies. IOSR J. Humanit. Soc. Sci. 2016, 21, 10–24. [Google Scholar] [CrossRef] [Scilit]
  48. Hussanie, I.; Joo, B.A. Determinants of profitability of life insurers in India-panel evidence. Int. J. Manag. Stud. 2019, 6, 58–65. [Google Scholar] [CrossRef] [Scilit]
  49. Kaya, Ö. The effects of firm-specific factors on the profitability of non-life insurance companies in Turkey. Int. J. Financ. Stud. 2015, 3, 510–529. [Google Scholar] [CrossRef] [Scilit]
  50. Karbhari, Y.; Muye, I.M.; Sheikh Hassan, A.; Elnahass, M. Governance mechanisms and efficiency: Evidence from an alternative insurance market. J. Int. Financ. Mark. Inst. Money 2018, 54, 119–133. [Google Scholar] [CrossRef] [Scilit]
  51. Asafa, D.; Archer, S. Issues Arising from Changes in Takāful Capital Requirements; IFSB Working Paper Series; Islamic Financial Services Board: Kuala Lumpur, Malaysia, 2018. [Google Scholar]
  52. Satata, E.D.A.; Septiarini, D.F. The Relationships of Insurance Premium, Investment Revenue and Underwriting Surplus on Profits of Pt. Jasindo Takaful Insurance. J. Ekon. Syariah Teor. Dan Terap. 2020, 7, 1989–2003. [Google Scholar] [CrossRef] [Scilit]
  53. Abrigo, M.R.M.; Love, I. Estimation of panel vector autoregression in Stata: A package of programs. Stata J. 2016, 16, 778–804. [Google Scholar] [CrossRef] [Scilit]
  54. Andrews, D.W.K.; Lu, B. Consistent model and moment selection procedures for GMM estimation with application to dynamic panel data models. J. Econom. 2001, 101, 123–164. [Google Scholar] [CrossRef] [Scilit]
  55. Maddala, G.S.; Wu, S. A Comparative Study of Unit Root Tests with Panel Data and a New Simple Test. Oxf. Bull. Econ. Stat. 1999, 61, 631–652. [Google Scholar] [CrossRef] [Scilit]
  56. Choi, I. Unit Root Tests for Panel Data. J. Int. Money Financ. 2001, 20, 249–272. [Google Scholar] [CrossRef] [Scilit]
  57. Levin, A.; Lin, C.-F.; Chu, C.-S.J. Unit root tests in panel data: Asymptotic and finite-sample properties. J. Econom. 2002, 108, 1–24. [Google Scholar] [CrossRef] [Scilit]
  58. Im, K.S.; Pesaran, M.H.; Shin, Y. Testing for unit roots in heterogeneous panels. J. Econom. 2003, 115, 53–74. [Google Scholar] [CrossRef] [Scilit]
  59. Lütkepohl, H. New Introduction to Multiple Time Series Analysis; Springer: Berlin/Heidelberg, Germany, 2005. [Google Scholar]
  60. Johny, M.; Purwoko, B.; Merawaty, E.E. Effect of Gross Premiums, Claims Reserves, Premium Reserves, and Payment of Claims to ROA: A Survey of General Insurance Companies is Recorded in IDX. Manag. Bus. Soc. Sci. (IJEMBIS) 2021, 1, 31–43. [Google Scholar]
  61. Prasaja, M.; Setiawan, A.; Rahmawati, U. What Drives The Financial Performance of Islamic Insurance Companies in Indonesia? J. Akunt. Dan Keuang. Islam 2023, 11, 5–23. [Google Scholar] [CrossRef] [Scilit]
  62. Scordis, N.A. Underwriting, Investing and Value. J. Insur. Issues 2019, 42, 1–36. [Google Scholar]
  63. Oluwaleye, T.O.; Ajemunigbohun, S.S.; Abiodun, K.E. Underwriting Operations and Financial Performance: Evidence from Non-Life Insurance Firms in Nigeria. Bus. Econ. Commun. Soc. Sci. J. (BECOSS) 2023, 5, 167–176. [Google Scholar] [CrossRef] [Scilit]
  64. Ismail Onagun, A. Solvency of Takāful Fund: A Case of Subordinated Qard. Islam. Econ. Stud. 2011, 18, 1–16. [Google Scholar]
  65. Isa, M.Y.; Naim, M.; Wahab, A. Qard Hasan Issue in Mudarabah Takaful Model. J. Islam. Econ. Bank. Financ. 2017, 13, 152–164. [Google Scholar]
  66. Mwangi, M.; Iraya, C. Determinants of Financial Performance of General Insurance Underwriters in Kenya. 2014. Available online: https://api.semanticscholar.org/CorpusID:167828342 (accessed on 27 April 2024).
  67. Zekarias, H. Factors Affecting Profitability of Insurance Companies in Ethiopia. Doctoral Dissertation, St. Mary’s University, Addis Ababa, Ethiopia, 2017. [Google Scholar]
  68. Charumathi, B. On the Determinants of Profitability of Indian Life Insurers—An Empirical Study. Proc. World Congr. Eng. 2012, 1, 978–988. [Google Scholar]
  69. Abduh, M.; Zein Isma, S.N. Economic and market predictors of solvency of family takaful in Malaysia. J. Islam. Account. Bus. Res. 2017, 8, 334–344. [Google Scholar] [CrossRef] [Scilit]
  70. Al-Amri, K. Takaful insurance efficiency in the GCC countries. Humanomics 2015, 31, 344–353. [Google Scholar] [CrossRef] [Scilit]
  71. Alokla, J.; Daynes, A.; Pagas, P.; Tzouvanas, P. Solvency determinants: Evidence from the Takaful insurance industry. The Geneva Papers on Risk and Insurance – Issues and Practice 2023, 48, 847–871. [Google Scholar] [CrossRef] [Scilit]
  72. Sims, C.A. Macroeconomics and Reality. Econom. Soc. 1980, 48, 1–48. [Google Scholar] [CrossRef] [Scilit]
Figure 1. Composition of Takaful contributions in Pakistan (2021).
Sustainability 18 00557 g001
Figure 2. The conceptual framework for the Takaful Window performance.
Sustainability 18 00557 g002
Figure 3. Flowchart of the study methodological steps.
Sustainability 18 00557 g003
Figure 4. Stability results for the ROA model and the ROE model.
Sustainability 18 00557 g004
Figure 5. IRFs of the ROA model.
Sustainability 18 00557 g005
Figure 6. IRFs of the ROE model.
Sustainability 18 00557 g006
Table 1. Variable description, expected sign, and economic explanation.
VariablesSymbolDefinition and MeasurementData SourceSignExplanation
Return on assetsROAIt is a financial ratio that measures a business’s profitability relative to its total assets. It is calculated by taking a company’s annual net income divided by its total assets.Annual ReportsNANA
Return on equityROEIt is a financial ratio that measures a firm’s profitability. It is calculated by taking a company’s annual net income divided by its shareholders’ equity.Annual ReportsNANA
Retention ratioRTIt refers to the portion of contributions that is kept on a company’s books rather than being ceded or passed on to reTakaful/reinsurance companies.Annual Reports+Expected to have a positive impact on performance since it will be kept in the company’s books [35]
Wakalah feeWAKIt is a fee payable to the shareholders’ fund against managing the PRF. This fee is upfront deducted from the gross written contributions.Annual ReportsExpected to have a negative impact on performance since it is transferred to the shareholders’ fund [38].
Commission ratioCOMMIIt refers to the percentage of acquisition costs paid to a broker/agent to acquire a business relative to the net written contributions.Annual Reports+/−Expected to have a negative impact on performance since it is an outflow of the company’s books.
Also, it may positively impact performance if it incentivizes the sales force to bring in more businesses to the company [36].
Underwriting surplus/deficitSU_DEThe Participants’ Risk Fund’s financial result from the risk elements of its business is the balance after deducting expenses and claims (including any movement in technical provisions) from contributions income.Annual Reports+/−Expected to have a positive impact on performance in the surplus situation, and it is expected to have a negative effect on performance when the financial result of the underwriting is recorded as a deficit [7].
Gross written contributionGWCIt is the total direct and assumed contribution/premium written by Takaful windows, before deductions for reTakaful/reinsurance and ceding commissions.Annual Reports+/−Expected to have a positive or negative impact on performance, depending on how the firm manages segregation between the conventional host and the Takaful windows [4].
Source: Authors’ tabulation.
Table 2. Descriptive statistics 2013–2022.
ROAROERTWAKCOMMISU_DEGWC
Mean0.0884930.8564730.19716115,183,2940.5935661,413,34914.09615
Median0.0261280.06140.665865182,0820.19684227,78813.71808
Maximum0.98413447.577741.3106254.04 × 10833.5646961,386,86820.77637
Minimum−0.14481−6.777272−43.96619730−0.28347−57,687,3728.419139
Std. Dev.0.221794.7952743.50034457,844,8972.7545918,683,9002.670678
Skewness2.8141497.3145−11.52225.24277610.569130.5639920.489853
Kurtosis9.57837763.27168143.717831.41577120.932530.02372.652607
Jarque–Bera559.022828,689.84151,646.96842.298107,063.75456.1628.058773
Probability0.5230.6450.2350.3410.4120.7310.263
Observations179179179179179179179
Source: Authors’ tabulation.
Table 3. Panel unit root test results.
LLCIPSADF-FisherPP-Fisher
LevelΔLevelΔLevelΔLevelΔ
ROA−0.210−5.129 ***1.207−5.800 ***8.35664.963 ***8.91880.366 ***
ROE−0.612−5.030 ***1.200−5.321 ***7.62368.374 ***7.33767.936 ***
RT−0.316−4.353 ***0.710−4.887 ***8.20057.288 ***8.69968.941 ***
WAK−0.456−4.879 ***0.820−4.222 ***7.63066.264 ***8.01685.178 ***
COMMI−0.891−4.580 ***0.470−4.100 ***8.12050.660 ***7.16275.907 ***
SU_DE−0.658−5.352 ***0.950−4.623 ***8.98150.369 ***8.81289.886 ***
GWC−0.280−4.3000.724−4.683 ***8.95361.522 ***7.95682.369 ***
Notes: *** denotes the significance at 1% level. Δ refers to the first difference.
Table 4. Results of selection order criteria.
Model ROAModel ROE
k = 1k = 2k = 1k = 2
MAIC−436.31 ***−402.20−459.70 ***−325.27
MBIC−288.65 ***−149.90−243.09 ***−110.22
MQIC−198.03 ***−131.33−177.36 ***−162.40
Notes: k denotes the length of lags. MAIC, MBIC, and MQIC refer to the Akaike Information Criterion, the Bayesian Information Criterion, and the Hannan–Quinn Information Criterion, respectively. *** denotes significance at the 1% level.
Table 5. Results of the PVAR model for ROA.
ROARTCOMMISU_DEWAK
ROA (−1)0.068 ***0.293 ***0.061 ***0.164 ***−0.681 ***
(0.000)(0.000)(0.000)(0.000)(0.000)
RT (−1)0.110 ***−0.983 ***0.699 ***−0.0160.167 ***
(0.000)(0.000)(0.000)(0.682)(0.000)
COMMI (−1)0.010 ***−0.024 ***−0.604 ***−0.092 ***−0.162 ***
(0.000)(0.000)(0.000)(0.000)(0.000)
SUDE (−1)0.009 ***0.001 ***0.019 ***−0.221 ***−0.009 **
(0.000)(0.000)(0.000)(0.000)(0.015)
WAK (−1)−0.012 ***0.017 ***0.042 ***0.029 ***−0.100 ***
(0.000)(0.000)(0.000)(0.000)(0.000)
GWC0.035 ***0.027 ***0.297 ***−0.019 ***0.924 ***
(0.000)(0.000)(0.000)(0.000)(0.000)
Note: (.) p-values are in parentheses. ***, **, and * denote significance at the 1%, 5%, and 10% levels, respectively.
Table 6. Results of the PVAR model for ROE.
ROERTCOMMISU_DEWAK
ROE (−1)−0.131 ***0.009 ***0.150 ***0.023 ***−0.012 ***
(0.000)(0.000)(0.000)(0.000)(0.003)
RT (−1)−0.202 ***−0.873 ***0.357 ***0.730 ***0.743 ***
(0.000)(0.000)(0.000)(0.000)(0.000)
COMMI (−1)0.134 ***−0.031 ***−0.717 ***−0.130 ***−0.120 ***
(0.000)(0.000)(0.000)(0.000)(0.000)
SUDE (−1)0.004 ***−0.002 ***−0.036 ***−0.219 ***0.017 ***
(0.000)(0.000)(0.000)(0.000)(0.000)
WAK (−1)−0.030 ***0.020 ***0.095 ***0.043 ***−0.081 ***
(0.000)(0.000)(0.000)(0.000)(0.000)
GWC−0.002 *0.024 ***0.259 ***−0.029 ***0.983 ***
(0.062)(0.000)(0.000)(0.000)(0.000)
Note: (.) p-values are in parentheses. ***, **, and * denotes the significance at 1%, 5%, and 10% level, respectively.
Table 7. Forecast error variance decomposition (FEVD).
Response.
Variable
Impulse VariableResponse. VariableImpulse Variable
ROARTCOMMISU_DEWAK ROERTCOMMISU_DEWAK
ROA0.2880.6300.0510.0020.029ROE0.8570.0970.0330.0030.010
RT0.2510.6620.0550.0020.030RT0.0340.6220.2420.0100.092
COMMI0.2420.6700.0570.0020.029COMMI0.0240.6710.2210.0080.076
SU_DE0.0720.0890.0320.8000.007SU_DE0.0030.0990.0410.8440.013
WAK0.2440.6630.0520.0020.039WAK0.0440.5000.1720.0060.278
Note: FEVD standard errors and confidence intervals based on 1000 Monte Carlo simulations.
Table 8. Results of the PVAR Granger causality test.
Equation\ExcludedModel ROAModel ROEModel ROA
chi2Probchi2Prob
ROA
ROE----
RT1065.88 ***0.000--
COMMI150.410 ***0.000--
SU_DE323.189 ***0.000--
WAK58.177 ***0.000--ROASustainability 18 00557 i001RT
ALL1677.60 ***0.000--ROASustainability 18 00557 i001COMMI
ROE ROASustainability 18 00557 i001SU_DE
ROA----ROASustainability 18 00557 i001WAK
COMMI--7661.9 ***0.000
SU_DE--1109.2 ***0.000
WAK--1163.5 ***0.000
ALL--13,845.3 ***0.000
RT
ROE--349.64 ***0.000
ROA507.74 ***0.000--
COMMI942.52 ***0.0001983.901 ***0.000
SU_DE61.672 ***0.000231.093 ***0.000
WAK81.020 ***0.000271.456 ***0.000
ALL1770.58 ***0.0002120.498 ***0.000
COMMI Model ROE
ROE--140.833 ***0.000
ROA710.28 ***0.000--
RT463.39 ***0.0002695.7 ***0.000ROESustainability 18 00557 i001RT
SU_DE25.92 ***0.000674.945 ***0.000ROESustainability 18 00557 i001COMMI
WAK5.191 **0.02397.819 ***0.000ROESustainability 18 00557 i001SU_DE
ALL2727.9 ***0.00014,639.8 ***0.000ROESustainability 18 00557 i001WAK
SU_DE
ROE--252.189 ***0.000
ROA437.34 ***0.000--
RT0.1680.682117.184 ***0.000
COMMI926.01 ***0.0005029.2 ***0.000
WAK86.958 ***0.000410.404 ***0.000
ALL2631.465 ***0.0006347.62 ***0.000
WAK
ROE--8.920 ***0.000
ROA425.67 ***0.000--
RT361.08 ***0.0001734.8 ***0.000
COMMI118.65 ***0.00094.924 ***0.000
SU_DE5.89 **0.01534.668 ***0.000
ALL3429.332 ***0.0004790.46 ***0.000
Notes: H0: Excluded variable does not Granger-cause Equation variable versus H1: Excluded variable Granger-causes Equation variable. ***, **, and * denotes significance at 1%, 5%, and 10% levels, respectively. Sustainability 18 00557 i001 Bidirectional causality.
Disclaimer/Publisher’s Note: The statements, opinions and data contained in all publications are solely those of the individual author(s) and contributor(s) and not of MDPI and/or the editor(s). MDPI and/or the editor(s) disclaim responsibility for any injury to people or property resulting from any ideas, methods, instructions or products referred to in the content.