1. Introduction
1.1. Importance of Light Environment for Psychological and Cognitive Responses in Office Workspaces
As modern human work activities have largely shifted to indoor settings [
1], the indoor lighting environment has become a critical factor significantly influencing occupants’ wellness, social sustainability [
2,
3], and cognitive performance [
4]. The lighting environment serves as a crucial design element that simultaneously influences both the experiential aspects of comfort and performance and the environmental outcome of operational efficiency, making it a key factor in creating a sustainable office environment. Additionally, optimizing illuminance and the light spectrum can replace simplistic approaches, such as excessive brightness increases, evolving into a design strategy that provides an appropriate environment tailored to user needs and work characteristics while minimizing unnecessary energy waste. Offices, where people spend most of their working hours, are spaces in which the quality of lighting affects not only task performance but also various psychological and cognitive responses, such as emotional stability, fatigue, and concentration. Therefore, the lighting environment is recognized as a key environmental variable that influences human wellness [
5,
6,
7] and work performance [
8,
9,
10] beyond mere visual considerations.
The lighting environment exerts non-visual effects that extend beyond its primary function as a light source, profoundly influencing human circadian rhythms. These non-visual effects of indoor lighting are mainly mediated by intrinsically photosensitive retinal ganglion cells (ipRGCs) in the retina [
11]. The ipRGCs respond to light stimuli by transmitting signals to the suprachiasmatic nucleus (SCN) of the hypothalamus, establishing a physiological pathway that suppresses melatonin secretion [
12] and regulates sleep–wake cycles [
13,
14]. This mechanism impacts physiological arousal, energy maintenance, and subjective sleepiness, with the intensity and direction of responses varying according to the spectral characteristics and wavelength distribution of the light [
15,
16].
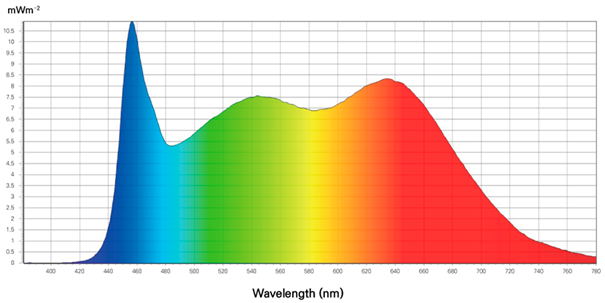
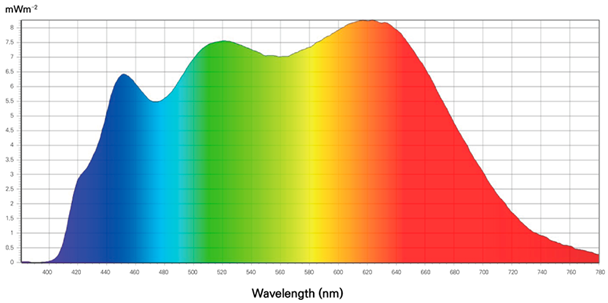
Against this background, recent research on lighting environments has expanded beyond simple measures of illuminance and color temperature to comprehensively consider spectral distribution and melanopic stimulation. Conventional LEDs typically exhibit a spectral distribution with relatively high intensity in the blue wavelength range (450–480 nm), whereas full-spectrum LEDs, which have a continuous distribution similar to sunlight, provide a more balanced spectral output across the entire visible range and offer more stable non-visual stimulation, as measured by melanopic equivalent daylight illuminance (m-EDI). Differences in spectral quality have been identified as major factors influencing circadian rhythms, arousal states, and melatonin secretion via the ipRGC pathway. Based on these findings, various guidelines for light exposure [
17,
18,
19] and integrated lighting design strategies have been proposed for indoor and nighttime environments [
20,
21].
However, although substantial scientific evidence exists regarding the effects of spectral characteristics and melanopic stimulation on physiological responses, empirical studies investigating how these factors influence psychological satisfaction, perceived fatigue, visual comfort, and cognitive work performance in office-like environments remain relatively limited.
Recent advances in solid-state lighting, including spectrally engineered LEDs and laser-driven white light sources, have further underscored the importance of understanding how spectral composition influences human responses in applied environments such as offices [
22,
23].
In real work environments, lighting interacts complexly with physiological arousal, subjective perception, emotional state, and spatial experience, collectively influencing work behavior and performance. However, quantitative research connecting these multidimensional responses to variations in spectral quality remains insufficient. Therefore, human-centric lighting must extend beyond simply enhancing physiological arousal or sleep hygiene to explore how spectral composition and melanopic stimulation levels jointly affect occupants’ psychological fatigue, visual comfort, preferences, and cognitive performance.
This study aims to experimentally analyze the interrelationships among psychological fatigue, visual comfort, preference, and cognitive performance within office lighting environments featuring full-spectrum LEDs and conventional LEDs.
1.2. Advances and Limitations in Light Environment Research
Previous studies on indoor lighting environments have developed along four main directions. First, field studies and post-occupancy evaluations (POE) utilizing on-site measurements and simulations. Second, laboratory-based experiments controlling illuminance, correlated color temperature (CCT), and spatial configuration. Third, studies quantifying non-visual responses. Fourth, research advancing analytical methods and methodologies to interpret the accumulated data from these studies. Additionally, there have been reports comparing full-spectrum LEDs and conventional LEDs under similar illuminance and CCT conditions, as well as studies evaluating human responses based on spectral characteristics (
Table 1).
Table 1.
Summary of previous studies on the light environment.
Table 1.
Summary of previous studies on the light environment.
| Category | Typical Variables | Main Indicators | Key Limitations |
|---|
Field Studies
and POE
[24,25,26,27,28] | - -
Daylight availability and quantity - -
Window view and façade/room design - -
Indoor illuminance, daylight factor, uniformity - -
Daytime and nighttime indoor light-exposure patterns
| - -
Sleep duration and quality - -
Circadian stability and overall well-being - -
Self-reported stress and perceived stress - -
Visual comfort and space/overall satisfaction
| - -
Strong focus on daylight metrics (DF, horizontal illuminance, uniformity) and global satisfaction - -
Spectral composition (SPD, melanopic metrics) rarely analyzed in detail - -
Task-level cognitive performance and detailed office-like task metrics are seldom assessed
|
Laboratory
Experiments
[29,30,31,32,33,34,35,36,37,38,39,40,41,42,43,44,45,46] | - -
2–6 levels of illuminance and CCT - -
Sometimes basic spectral differences - -
Controlled laboratory rooms (office, classroom, vehicle, road, etc.) - -
Ambient/task lighting configurations
| - -
Physiological responses (HRV, skin conductance, EEG) - -
Psychological responses (mood, alertness, fatigue) - -
Task performance (attention, working memory, creativity, basic visual tasks)
| - -
Mostly short-term exposure with few lighting conditions per study - -
Predominant use of average-comparison statistics (t-tests, ANOVA, repeated-measures ANOVA) - -
Limited treatment of illuminance–CCT–spectrum interactions and cross-indicator correlations - -
Restricted ecological validity for everyday office work
|
Non-visual
Metrics
[47,48,49,50,51,52] | - -
Spectral power distribution (SPD) - -
Melanopic illuminance/m-EDI and ipRGC-based metrics - -
Daytime and nighttime light-exposure protocols
| - -
Melatonin suppression and phase shift - -
Circadian rhythm alignment/Stability - -
Subjective sleepiness and alertness
| - -
Evidence concentrated on sleep and circadian outcomes - -
Few studies jointly address psychological comfort, preference, visual comfort and task performance under matched illuminance/CCT with different spectra - -
Office-like, cognitively demanding tasks are rarely integrated with non-visual metrics
|
Full-spectrum LED vs.
Conventional LED
[53,54,55,56,57,58,59] | - -
Full-spectrum LEDs vs. conventional LEDs under similar illuminance/CCT - -
Melanopic-enriched (short-wavelength–enhanced) white light - -
Phosphor-free white LEDs (e.g., yellow–green–enriched spectra) - -
Spectral-compensation systems with tailored SPD
| - -
Subjective responses (visual comfort, naturalness, fatigue, mood, sleep-related ratings) - -
Non-visual responses (melatonin profiles, circadian stability, HRV and other physiological markers) - -
Cognitive performance (PVT, 2-back, procedural learning and simple visual discrimination tasks)
| - -
Effects on subjective and non-visual responses are often partial and condition-dependent - -
Effects on cognitive performance are small or inconsistent, and frequently appear only under specific protocols (e.g., sleep restriction, shift work, closed environments) - -
Mostly small samples (≈12–30) and few lighting conditions - -
Office-like, text-based tasks and joint analysis of fatigue, preference, visual comfort and task performance under matched illuminance/CCT remain rare
|
Analytical
Approaches and
Methodological
Developments
[25,27,29,30,31,32,33,34,35,36,37,38,39,40,41,42,43,45,46,47,50,51,52,53,54,55,56,57,58,59] | - -
t-tests, ANOVA - -
Correlation and regression analyses - -
PCA, network analysis - -
Clustering analysis - -
Machine-learning–based predictive modeling - -
Time-series–informed approaches for emotional/circadian responses - -
Reporting checklists and guidelines for non-visual and spectrum-related studies
| - -
Latent response patterns and response types across multiple indicators - -
Time-varying emotional/physiological responses in short-and long-term light exposure studies - -
Basic effect estimation for lighting conditions and time trends - -
Reporting quality and methodological consistency in non-visual and spectrum-related studies
| - -
Many experimental studies still rely mainly on simple, average-comparison models (t-tests, ANOVA) at the group level - -
Participant-level exposure imbalance, missing data and inter-individual differences are rarely modeled explicitly - -
In full-spectrum/spectrally modified LED studies, mixed-effects or regression models are often applied to single outcomes only (e.g., alertness, melatonin) - -
Integrated treatment of spectral quality together with multiple response dimensions, while accounting for repeated-measures structure and inter-individual variability, remains scarce
|
First, field studies and POE have consistently reported, through measurements and simulations in various environments such as hospitals [
24], residential settings [
25], and offices [
26,
27,
28], that indoor lighting conditions influence human physical, psychological, and cognitive responses. Research integrating natural daylight, views, and day-night light exposure patterns has shown that occupants’ sleep duration, alertness, well-being, and cognitive performance are closely linked to daylight exposure. POE studies conducted in various building types—such as hospitals, residences, and offices—indicate that lighting conditions play a crucial role in visual comfort, spatial satisfaction, and stress perception. However, most field studies primarily analyze physical indicators such as Daylight Factor (DF), horizontal illuminance, uniformity, and daylight autonomy, alongside satisfaction and preference ratings, with relatively limited multidimensional analyses that include spectral composition or detailed cognitive performance metrics.
Next, laboratory experiments have primarily used illuminance and CCT as independent variables to measure physiological responses [
29,
30,
31,
32,
33,
34] such as heart rate variability (HRV), skin conductance, and electroencephalography (EEG), along with emotional states, concentration, and task-related outcomes [
35,
36,
37,
38,
39,
40,
41], to better clarify how different lighting conditions influence human responses. Several studies analyzing the short-term impacts of particular illuminance–CCT combinations on arousal, mood, and task speed have found that moderate to high illuminance levels combined with neutral white or daylight white color temperatures tend to reduce fatigue and enhance attention. Research investigating various cognitive tasks has also examined how lighting influences attention, memory, and creativity. These laboratory studies have since expanded to real-world environments such as classrooms [
42,
43,
44], vehicles [
45], and roadways [
46], leading to lighting environment experiments involving humans in diverse settings.
Furthermore, studies incorporating non-visual metrics have introduced lighting indicators that reflect ipRGC-based non-visual pathways, with active efforts to quantify the non-visual effects of light using m-EDI [
47,
48]. These studies demonstrate that wavelength composition and melanopic stimulus levels significantly influence melatonin suppression, circadian rhythm synchronization, and subjective sleepiness. They also propose recommended indoor lighting exposure levels for occupants during both day and night [
49,
50], along with guidelines for measurement and reporting [
51,
52]. However, the analytical focus has primarily been on physiological and sleep-related indicators, and comprehensive interpretations of how illuminance, CCT, and spectral combinations jointly affect psychological stability, preference, visual comfort, and cognition-based work performance remain limited.
Within this context, research comparing full-spectrum LEDs and conventional LEDs—differing only in spectral composition under identical or similar illuminance and CCT conditions, as well as studies using various LED lights with adjusted spectral characteristics to evaluate human responses have also been conducted. Prior investigations employing full-spectrum LEDs, melanopic-enhanced white light, and phosphor-free white LEDs have assessed subjective indicators such as visual comfort, fatigue, mood, and sleep quality [
53,
54,
55], alongside non-visual indicators like circadian rhythm stability and HRV [
56,
57,
58]. Many of these studies report that spectral characteristics can partially improve these subjective and non-visual responses. Conversely, cognitive performance indicators show minimal differences between spectra, with significant improvements observed only under specific experimental conditions such as sleep restriction, shift work, or confined environments [
56,
59]. However, effect sizes and reproducibility remain limited [
53,
59]. Moreover, most studies involve relatively small samples of 12–30 participants, few lighting conditions, and specific cognitive tasks (e.g., psychomotor vigilance task [PVT], 2-back, procedural learning), making comparisons of full-spectrum and conventional LEDs under similar illuminance and CCT in real office environments—simultaneously analyzing psychological fatigue, preference, visual comfort, and cognition-based work performance—still rare.
Finally, regarding analytical approaches and methodological developments, numerous experimental studies have primarily employed descriptive statistics,
t-tests, and analysis of variance (ANOVA), focusing on lighting conditions. This trend is commonly observed in general lighting research [
29,
30,
31,
32,
33,
34,
35,
36,
37,
38,
39,
40,
42,
43,
45,
46] as well as in spectral comparison studies [
53,
54,
55,
56,
57,
59]. These mean-comparison-focused methods have limitations in fully elucidating the interactions among illuminance, CCT, and spectrum or the correlation structures among multiple indicators. To address these limitations, some studies have utilized correlation and regression analyses to quantify relationships between lighting variables and satisfaction or performance metrics [
25,
27,
35,
36,
39,
40,
41,
45,
58]. Others have modeled the relationships between visual and non-visual indicators using principal component analysis (PCA) and network analysis [
47] or introduced machine learning-based predictive models [
35]. Additionally, efforts have been made to analyze temporal changes in emotional responses and to track short- and long-term exposure effects [
53,
56], while checklists and guidelines for reporting non-visual effect studies have been proposed [
50,
51,
52]. Nevertheless, analytical frameworks that rigorously account for imbalanced condition exposures per participant, missing data handling, and individual difference structures remain underdeveloped. In particular, although some studies comparing full-spectrum and conventional LEDs have employed regression models to estimate lighting effects [
58], most rely on
t-tests and ANOVA, limiting comprehensive analyses that simultaneously consider repeated-measures designs and individual differences across psychological fatigue, preference, visual comfort, and cognitive performance indicators.
In summary, previous studies consistently show—from measurement, laboratory, and non-visual perspectives—that lighting environments influence human biological, affective, and cognitive outcomes. Research on full-spectrum LEDs suggests that spectral characteristics may affect both visual perception and non-visual pathways, together with selected dimensions of cognitive functioning. However, these studies typically involve relatively small sample sizes (12–30 participants), limited lighting conditions, specialized experimental settings, and few cognitive tasks, with analyses primarily focused on mean differences using t-tests and ANOVA. Consequently, there are limitations in integratively interpreting how illuminance and spectral quality impact psychological fatigue, lighting preference, visual comfort, cognition-based work performance, and the correlation structures and individual differences among these indicators. Therefore, this study aims to compare full-spectrum and conventional LEDs under similar illuminance and CCT conditions in an office-like environment with a moderate-to-large sample size. It simultaneously analyzes psychological fatigue, lighting preference, visual comfort, and text-based cognitive task performance, applying sophisticated statistical models that account for repeated-measures designs and individual differences. This research framework can provide foundational data for establishing lighting strategies that consider both illuminance and spectrum in human-centered office lighting design.
1.3. Significance and Aims of the Study
Considering the trends and limitations of previous studies, this research aims to complement existing work, which has often been restricted to physiological indicators or single average comparisons. It does so by incorporating experimental variables such as full-spectrum LED, conventional LED, and illuminance levels that occupants can readily recognize and modify within indoor settings. The study seeks to comprehensively analyze the effects of these variables on human affective and cognitive outcomes—particularly task performance—within office contexts, thereby enhancing the practical relevance and real-world applicability of spatial and environmental design strategies. Additionally, lighting environment design that helps reduce occupant fatigue and maintain cognitive performance is closely linked to health and well-being-based social sustainability. Designing illuminance and spectral characteristics according to the type and conditions of work provides essential evidence for establishing guidelines for integrated sustainable design, which optimizes energy use by minimizing over-lighting. In other words, this study aims to present the quantitative relationships between combinations of illuminance and spectrum in relation to fatigue, preference, visual comfort, and work performance. The goal is to provide a foundation for a need-based control strategy that adjusts the lighting environment according to work demands and occupant conditions, thereby offering evidence for a sustainable office lighting environment that avoids unnecessary energy consumption without compromising human well-being and performance.
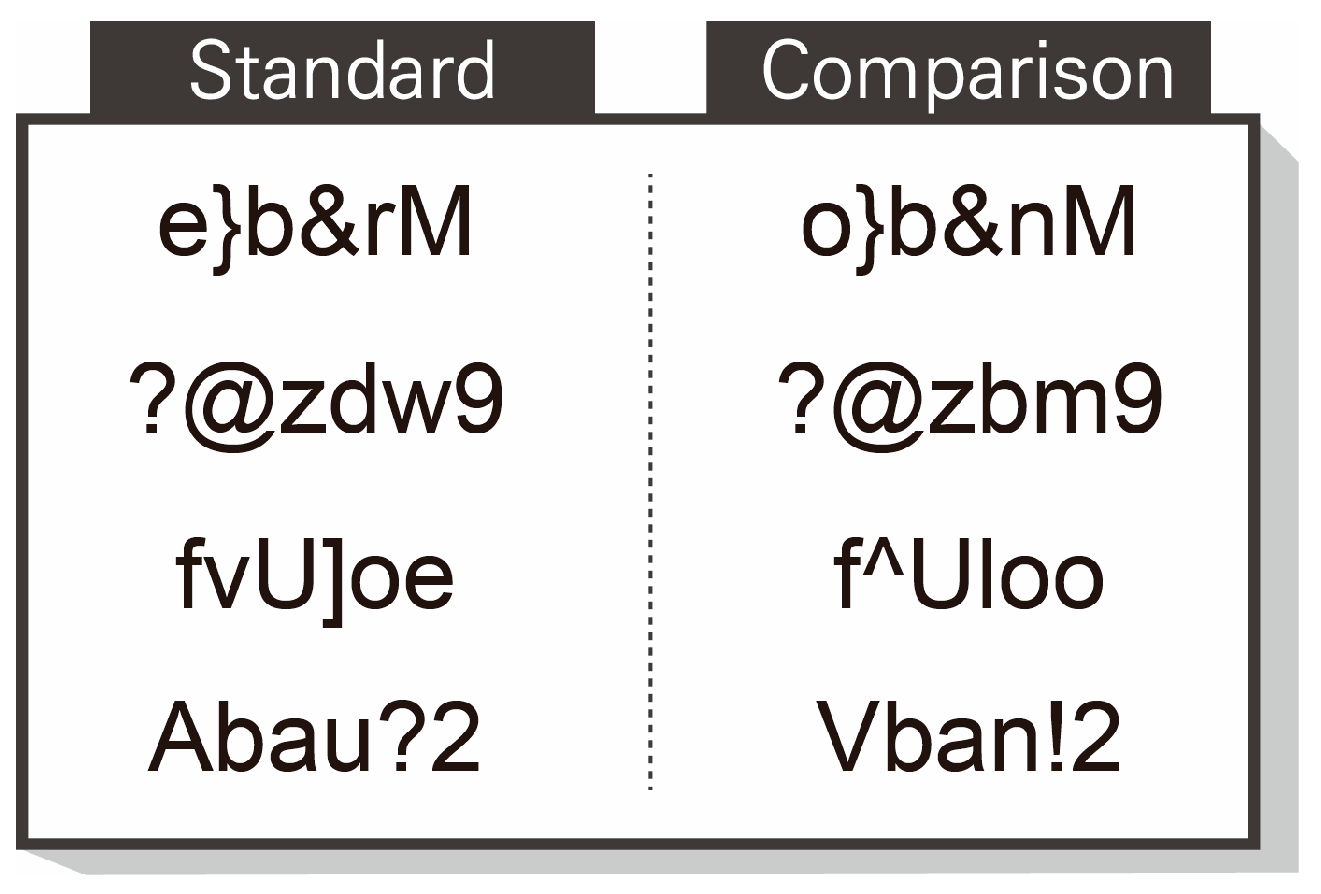
To achieve this, a 2 × 2 experimental design was employed, with illuminance and spectrum as factors. The sample size exceeds that of prior lighting environment studies, and the experiments involved tasks analogous to document reading and review in real work settings.
Furthermore, building on existing methodologies while addressing the aforementioned limitations, this study introduces the following distinctions:
First, from a multivariate analytical perspective, it simultaneously considered the effects of lighting spectrum characteristics and illuminance levels on psychological fatigue, preference, visual comfort, and cognitive performance.
Second, moving beyond the traditional ANOVA-centered approach, linear mixed models (LMMs) were employed to precisely examine the main effects and interaction effects between conditions while controlling for individual differences through random effects.
Third, correlation analysis was conducted to examine the relationships among indicators for each lighting environment variable, exploring associations between psychological responses (fatigue, preference, visual comfort) and cognition-based performance.
Fourth, to address the limitations of correlation analysis, multiple regression analyses were conducted with illuminance and spectral type treated as predictors and individual psychological and cognitive measures treated as outcomes, thereby quantitatively assessing the relative influence of lighting environment factors.
This integrated approach aims to elucidate the multidimensional structure of how lighting environments influence human psychological and cognitive responses and to contribute to the interpretation of the response network. Building on this, the study ultimately seeks to experimentally verify the differential effects of full-spectrum LED characteristics compared to conventional LEDs on human psychological and cognitive responses, providing foundational data for human-centric lighting design in office spaces.
To this end, the following three hypotheses were formulated:
H1. Full-spectrum lighting reduces psychological fatigue and enhances preference and visual comfort at the same illuminance level.
H2. High illuminance (1000 lx) improves cognitive performance compared to low illuminance (500 lx).
H3. Statistically significant improvements in cognition-based performance indicators will be observed as comfort increases and fatigue decreases in response to changes in the lighting environment.
This study aims to move beyond existing physical and physiological approaches by elucidating the mediating processes through which lighting environments affect the interaction between human psychological experiences and cognitive performance. In doing so, it offers guidance for the design of human-centric lighting environments.
3. Analysis and Results
This chapter quantitatively analyzes the differences in occupants’ psychological and cognitive responses to full-spectrum LEDs versus conventional LEDs, as well as the effects of two illuminance levels (500 lx and 1000 lx). Forty participants experienced all four lighting conditions (Full-spectrum/Conventional × 500/1000 lx). Under each condition, repeated measurements were taken for psychological fatigue (ΔKSS), preference and visual comfort (OLS), and work efficiency (number of AVT responses and accuracy). Using these repeated measures data, the effects of lighting spectrum and illuminance level on occupants’ psychological and cognitive responses were examined systematically.
All statistical analyses were performed using IBM SPSS Statistics (v.22). Statistical significance was set at a 95% confidence level (p < 0.05).
The analytical process was organized into the following four stages:
First, descriptive statistics and visualizations were employed to present the means, standard deviations, and distribution characteristics of psychological and cognitive indicators (ΔKSS, preference, visual comfort, AVT response count, and accuracy) under each lighting condition. This approach facilitated a comprehensive understanding of trends in these indicators based on spectrum and illuminance, offering an intuitive view of the patterns and directional effects of the lighting variables.
Second, a Linear Mixed Model (LMM) was employed to examine the effects of lighting spectrum and illuminance level on each indicator. In the LMM, participants were treated as random effects to account for individual differences inherent in the repeated measures design, while spectrum, illuminance, and their interaction were included as fixed effects. This approach provides greater flexibility than traditional repeated measures ANOVA, allowing for the evaluation of condition differences for each factor and the testing of the hypotheses proposed in H1 and H2.
Third, correlation analysis was conducted to examine the relationships among factors under different lighting conditions. Spearman’s rank correlation coefficient was used to calculate correlation coefficients between lighting variables, ΔKSS, preference, visual comfort, AVT response count, and accuracy. This method was selected because the primary variables were measured on Likert scales or had limited score ranges, making it difficult to satisfy assumptions of normality and linearity. Spearman’s correlation is robust for non-normal distributions and relatively small sample sizes. By identifying the directional relationships between fatigue, emotional evaluations, and cognitive performance, this analysis explored and tested the associations among comfort, fatigue, and cognitive performance as proposed in H3.
Fourth, because correlation analysis only reveals associations without establishing directionality or comparative contribution, multiple regression analysis was performed to quantitatively evaluate how lighting-related predictors explain variation across outcome measures. Illuminance and spectrum were treated as predictors, with each outcome measure specified as the response variable, allowing systematic identification of the lighting factor with the stronger contribution to observed changes. This approach complemented the condition effects identified in the LMM and enabled a more integrated interpretation of the relationships between the lighting environment and psychological and cognitive measures.
Through this comprehensive analytical procedure, the present study aims to systematically elucidate the multidimensional relational structure among spectrum, illuminance, psychological responses, and work efficiency, moving beyond simple condition comparisons.
3.1. Overview of Measures and Descriptive Patterns
To examine how different lighting conditions are associated with psychological and cognitive outcome measures, descriptive statistics were calculated for four lighting variables (Conventional/Full-spectrum LED × 500/1000 lx) in relation to psychological fatigue (ΔKSS), preference, visual comfort, number of responses, and accuracy rate (
Table 3).
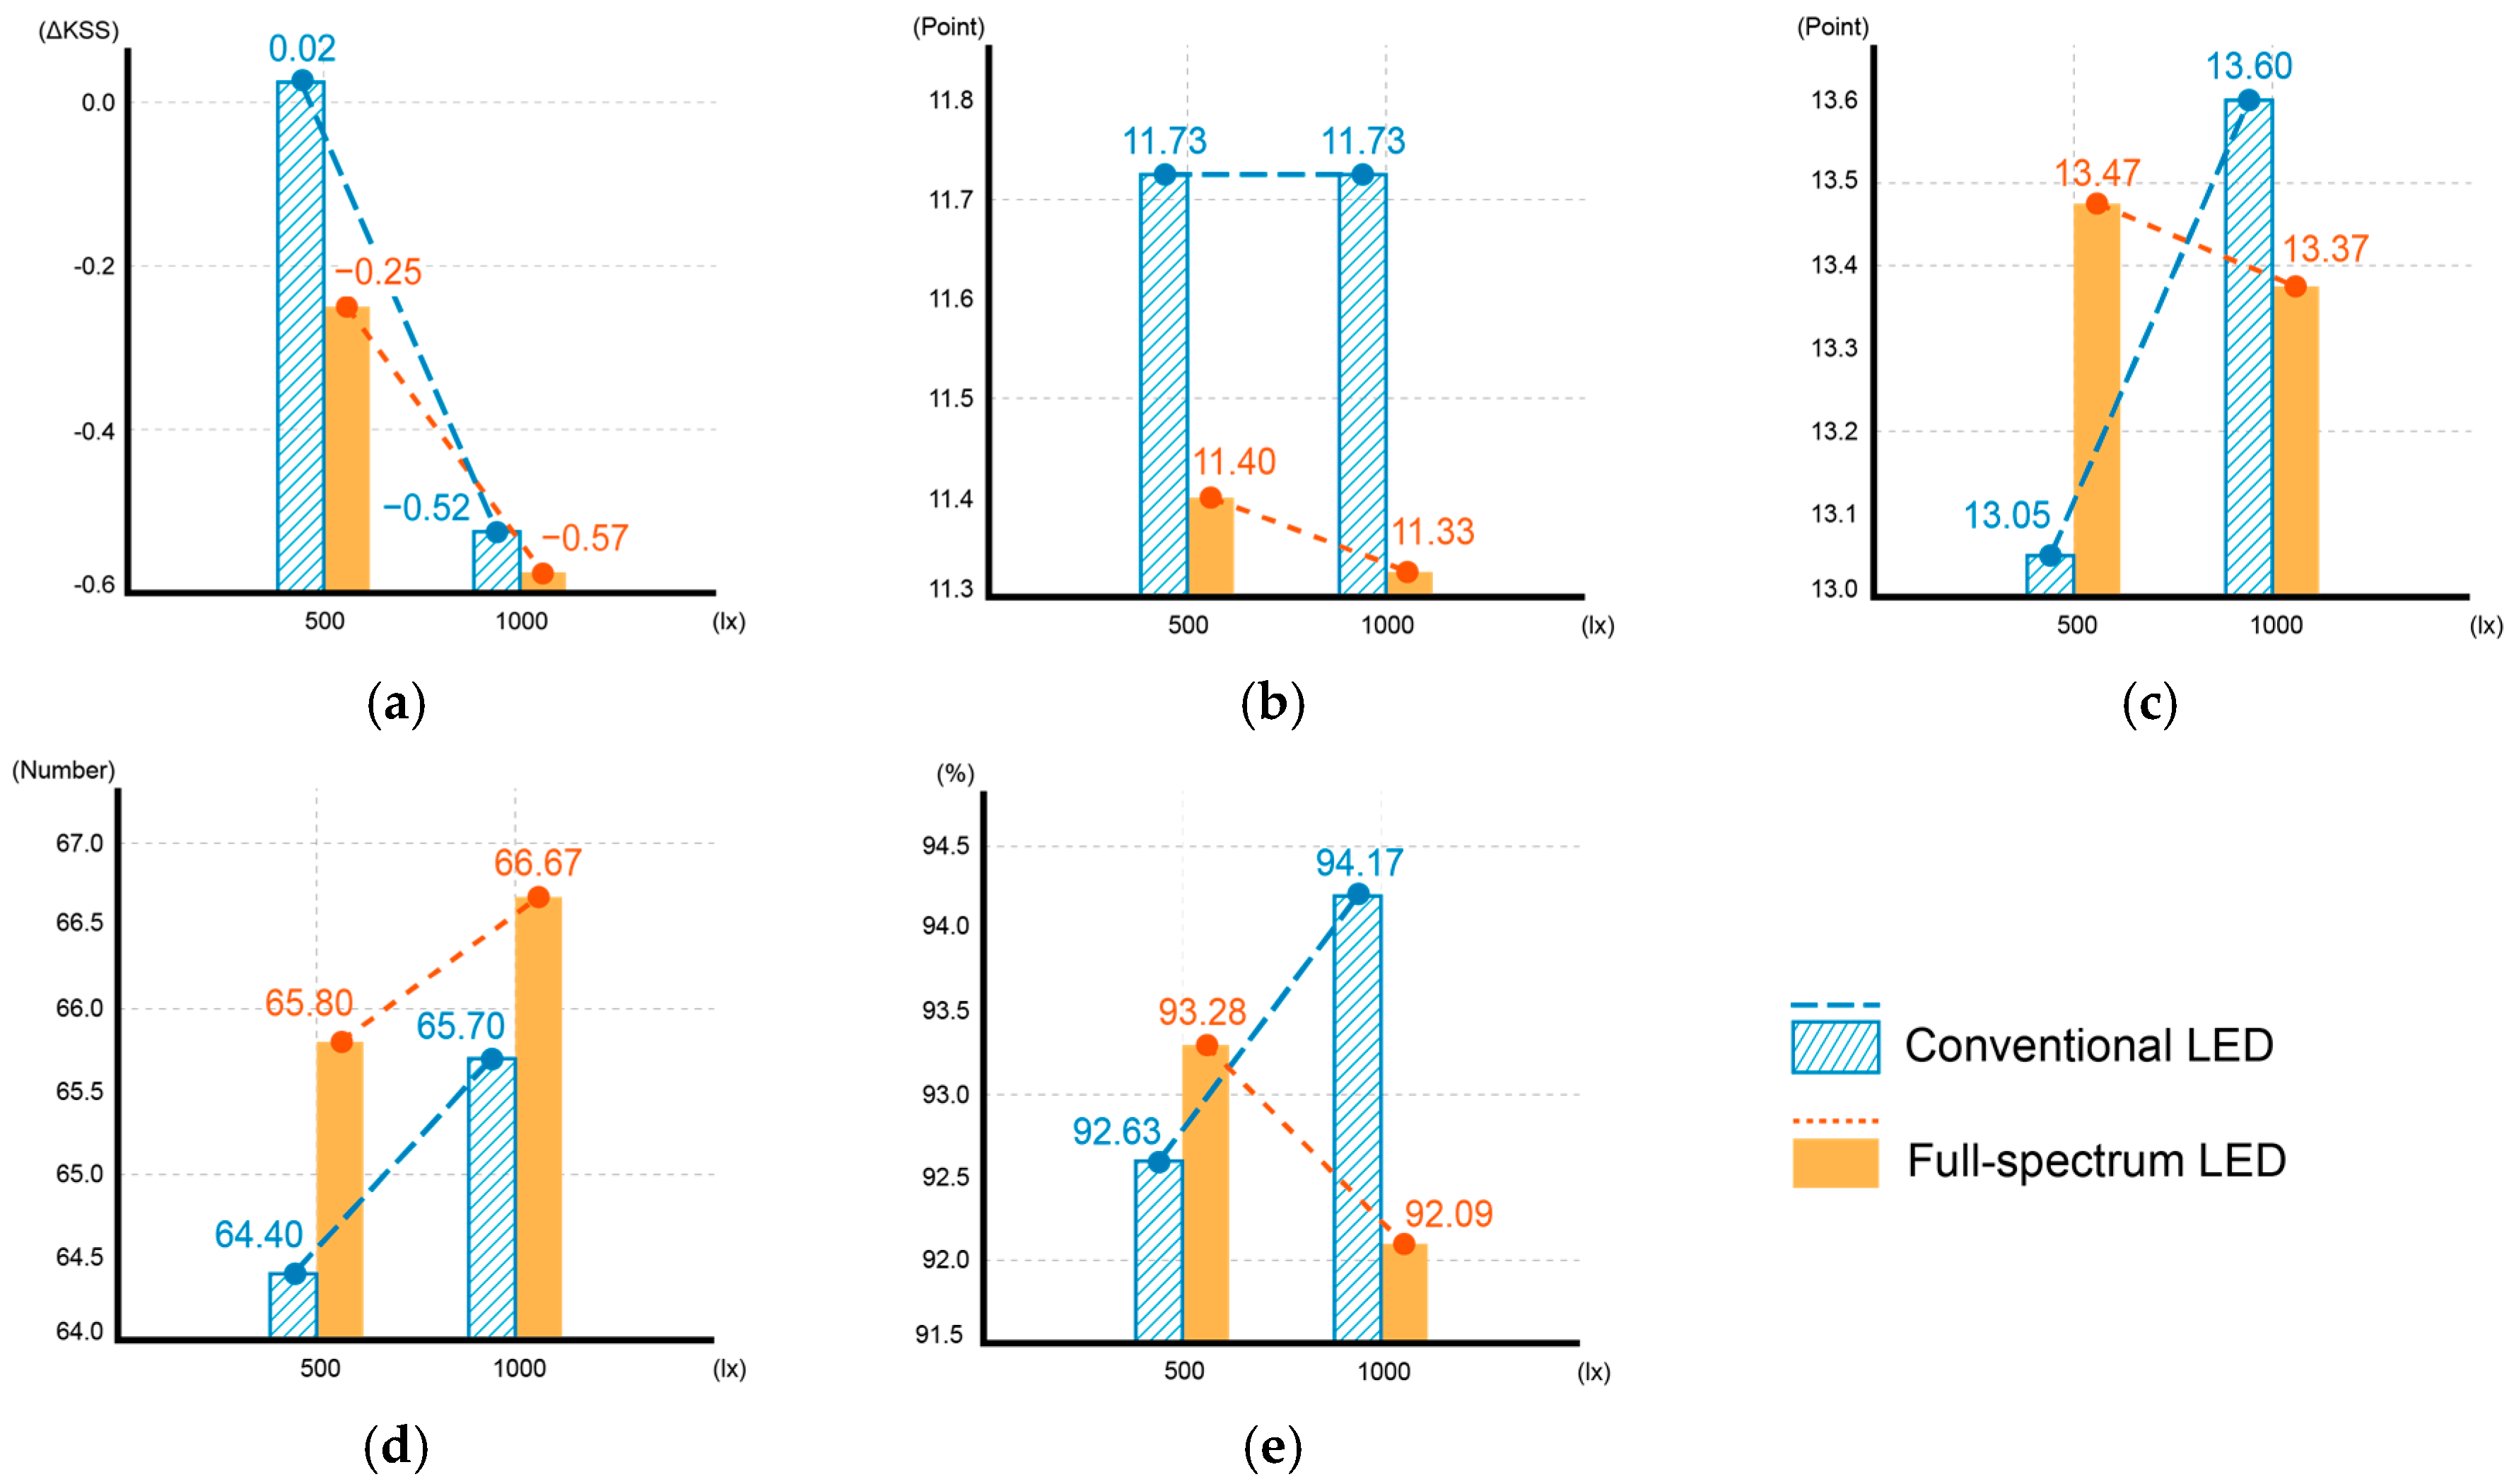
Based on these data, the means and standard deviations for each variable were compared to visually examine trends in response to lighting spectrum and illuminance level (
Figure 4).
First, regarding psychological fatigue, under the 500 lx/Conventional LED condition, there was almost no change observed. In contrast, under the same illuminance with full-spectrum LED, the average ΔKSS shifted in the negative direction, indicating a slight decrease in fatigue. At the 1000 lx condition, the reduction in ΔKSS was more pronounced in both spectra, and overall, a decrease in fatigue was observed under high-luminance conditions.
Notably, the 1000 lx/Full-spectrum LED condition exhibited the greatest reduction in fatigue, suggesting that the combination of high illuminance and spectral characteristics helps maintain subjective arousal levels more effectively.
However, since the standard deviations in all four conditions exceeded a certain threshold, indicating individual differences, these trends should be interpreted as descriptive patterns. The statistical significance of these findings must be verified through subsequent LMM analysis.
Relatively mild changes were observed in preference and visual comfort indicators. Preference means were very similar across the four conditions, showing no clear differences due to variations in illuminance or spectrum. Visual comfort exhibited slightly higher average values for the Full-spectrum LED compared to the Conventional LED at 500 lx, whereas at 1000 lx, the Conventional LED tended to have marginally higher values. This resulted in a subtle crossover pattern in comfort ratings depending on the combination of illuminance and spectrum. However, because the mean differences were small relative to the standard deviations, it is more appropriate to interpret preference and comfort not as distinctly differentiated by lighting conditions alone but in conjunction with other factors—such as individual differences and fatigue—in future model-based analyses.
Regarding work performance indicators—namely, the number of responses and correct rates—differences between conditions were relatively limited, although some meaningful trends emerged. The number of responses (speed) tended to be slightly higher under Full-spectrum LED conditions compared to Conventional LED, and responses increased modestly at 1000 lx compared to 500 lx. These findings indicate that pairing higher illuminance with full-spectrum lighting may modestly improve information-processing speed. Correct rates were highest under the 1000 lx/Conventional LED condition and somewhat lower under the 1000 lx/Full-spectrum LED condition, indicating a possible speed–accuracy trade-off under high illuminance and Full-spectrum conditions, where increased speed may be accompanied by a slight decrease in accuracy.
In summary, descriptive statistics indicate that high illuminance and full-spectrum LED lighting are generally associated with reduced fatigue and increased task performance speed. However, differences in preference, visual comfort, and accuracy between conditions are minimal, with relatively large standard deviations suggesting a significant influence of individual variability.
Therefore, instead of concluding that any specific lighting environment condition is consistently superior, it is essential to statistically verify the main effects and interactions of spectrum and illuminance using LMM analysis. Subsequently, correlation and regression analyses should be performed to comprehensively interpret the relationships between psychological indicators and work performance.
3.2. Linear Mixed Model Analysis with Light Environment Variables
To examine the effects of lighting spectrum and illuminance level on psychological and cognitive indicators, linear mixed models (LMMs) were constructed for each indicator. The dependent variables included five indicators: psychological fatigue (ΔKSS), preference, visual comfort, number of responses (speed), and correct rate. Illuminance levels (500 lx, 1000 lx) and spectrum types (Conventional, Full-spectrum) were included as fixed effects, while subjects (ID) were treated as random intercepts. To account for individual differences inherent in the repeated measures design, subject-specific random intercepts were incorporated, assuming a variance components covariance structure. Parameter estimation was performed using restricted maximum likelihood (REML), and Type III sums of squares were employed to test fixed effects. Additionally, the intraclass correlation coefficient (ICC) was calculated from the variance of the subject random intercepts and residual variance in each model, indicating the proportion of total variance attributable to between-subject differences (
Table 4). Random slopes were excluded from the final models because preliminary comparisons showed no significant improvement in fit and caused convergence issues due to the sample size and experimental design.
First, in the model with psychological fatigue as the dependent variable, illuminance showed a significant main effect (F(1, 117) = 9.577,
p = 0.002). In contrast, the main effect of spectrum (F(1, 117) = 1.321,
p = 0.253) and the illuminance × spectrum interaction (F(1, 117) = 0.633,
p = 0.428) were not significant. This finding aligns with the descriptive statistics (
Table 3), which indicated that ΔKSS decreased more under the 1000 lx condition compared to 500 lx, suggesting that relatively higher illuminance (1000 lx) may contribute to reduced fatigue during short-term exposure. The variance of the subject random intercept was 0.382, and the residual variance was 0.799, with approximately 32% of the total variance explained by between-subject differences (ICC ≈ 0.32). This indicates that factors such as individual baseline states play a substantial role in fatigue changes beyond lighting conditions. For preference and visual comfort, the LMM results showed that neither illuminance nor spectrum, nor their combined effect, reached statistical significance.
For preference, Illuminance (F(1, 117) = 0.016,
p = 0.901), Spectrum (F(1, 117) = 1.449,
p = 0.231), and the Illuminance × Spectrum interaction (F(1, 117) = 0.016,
p = 0.901) were all non-significant. Similarly, for visual comfort, Illuminance (F(1, 117) = 0.256,
p = 0.614), Spectrum (F(1, 117) = 0.051,
p = 0.822), and their interaction (F(1, 117) = 0.534,
p = 0.466) did not reach significance. These findings are consistent with the descriptive statistics presented in
Section 3.1, where mean differences among the four conditions were small and standard deviations relatively large. Examining variance components, preference showed a subject random intercept variance of 0.401 and residual variance of 3.627, resulting in an ICC of approximately 0.10; visual comfort had a random intercept variance of 0.549 and residual variance of 7.905, with an ICC around 0.06. In other words, within the 500–1000 lx range and the two types of LED spectra tested, differences in lighting conditions were overshadowed by individual differences and other contextual factors, rather than producing distinct effects on preference and visual comfort ratings.
Regarding work performance indicators, in the model using the number of AVT responses (speed) as the dependent variable, Illuminance (F(1, 117) = 0.796,
p = 0.374), Spectrum (F(1, 117) = 0.949,
p = 0.332), and their interaction (F(1, 117) = 0.030,
p = 0.862) were all non-significant. Although descriptive statistics showed a slight tendency for increased response counts under Full-spectrum LED and higher illuminance (
Table 3), these differences were not statistically significant. However, the variance structure revealed a subject random intercept variance of 88.330 and a residual variance of 59.421, yielding an ICC of approximately 0.60. This indicates that variability in response speed is more strongly explained by individual differences in processing speed than by lighting conditions.
In the model with correct rate as the dependent variable, the main effects of Illuminance (F(1, 117) = 0.113,
p = 0.738) and Spectrum (F(1, 117) = 1.979,
p = 0.162) were not significant; however, the Illuminance × Spectrum interaction was significant (F(1, 117) = 7.269,
p = 0.008). Considering the means of the four conditions presented in
Table 3, under the 500 lx condition, the Full-spectrum LED showed a slightly higher correct rate than the Conventional LED (0.9328 vs. 0.9263), whereas under the 1000 lx condition, the Conventional LED had the highest correct rate (0.9417) and the Full-spectrum LED the lowest (0.9209), demonstrating a crossover pattern. This suggests a possible speed–accuracy trade-off, where the high-illuminance Full-spectrum condition increases response speed but slightly decreases accuracy. The accuracy model showed a subject random intercept variance of 0.000971 and residual variance of 0.001024, with an ICC of approximately 0.49, indicating that accuracy also reflects relatively stable individual performance characteristics.
Integrating these LMM results, when considering illuminance and spectrum simultaneously, high illuminance (1000 lx) was the only condition to show a consistently significant effect on changes in fatigue. For preference, visual comfort, and response speed, neither the main effects nor the interaction between illuminance and spectrum were significant. This suggests that, under short-term exposure and within the limited illuminance range tested, it is difficult to clearly differentiate these indicators based solely on the lighting environment. In contrast, accuracy exhibited a significant illuminance × spectrum interaction. Specifically, certain combinations (e.g., 1000 lx with conventional LED) maintained relatively high accuracy, whereas the 1000 lx full-spectrum LED condition showed a pattern of increased speed accompanied by somewhat reduced accuracy. Although some effects were statistically significant, the regression coefficients and confidence intervals indicate modest practical effect sizes. The interaction effect was detected only in the LMM, likely due to its greater sensitivity to within-subject dependencies in repeated-measures data.
3.3. Associations Between Lighting Conditions and Outcome
To comprehensively understand the relationship between lighting environment variables and psychological and cognitive indicators, a correlation analysis was conducted. The lighting environment variable was represented as a single index by ranking four different conditions.
Examining the correlations between the lighting environment variable and each indicator in (
Table 5), only the correlation coefficient with psychological fatigue demonstrated a statistically significant negative correlation (ρ = −0.157,
p < 0.05). This indicates that as the lighting condition approaches relatively high illuminance and full-spectrum light, ΔKSS tends to decrease slightly—that is, fatigue is reported to be somewhat lower compared to the baseline state.
However, since the absolute value of the correlation coefficient is less than 0.2 and relatively small, it can be inferred that changes in the lighting environment do not have a strong direct effect on fatigue. Instead, lighting acts as one factor among many in a complex interplay. In contrast, the correlations with preference (ρ = −0.083), visual comfort (ρ = −0.012), response speed (ρ = 0.091), and correct rate (ρ = −0.034) were all very weak and statistically insignificant. This indicates that the four lighting conditions are not strongly associated with subjective evaluations or cognitive performance when considered through simple correlational analysis.
Examining correlations among response indicators, psychological fatigue showed significant negative correlations with both preference (ρ = −0.261, p < 0.01) and the response speed (ρ = −0.230, p < 0.01). This indicates that higher reported fatigue is associated with a lower preference for the lighting condition and a tendency to solve fewer problems within the allotted time. Although the correlation coefficients are weak, their direction suggests that fatigue may negatively affect both the subjective evaluation of lighting and cognitive task speed, supporting the possibility that psychological state serves as a mediating factor in performance.
A moderately strong positive correlation was observed between preference and visual comfort (ρ = 0.485, p < 0.01). This indicates a consistent tendency to favor lighting conditions perceived as more visually comfortable overall, demonstrating that although these two indicators represent distinct subcomponents, they share a closely connected emotional evaluation dimension.
On the other hand, correlations between visual comfort and work performance indicators—responses speed (ρ = 0.022) and correct rate (ρ = −0.129)—were not statistically significant, and the absolute values of the correlation coefficients remained very small, around 0.1. Correct rates also showed correlations with other indicators, all within the range of |ρ| < 0.13, suggesting that under the task difficulty and time conditions set in this experiment, accuracy was relatively stable and did not exhibit clear associations with lighting conditions or fatigue/preference indicators at the simple correlation level. This can be interpreted as reflecting the task characteristic whereby changes in lighting and fatigue state are more sensitively reflected in speed initially, while accuracy is maintained above a certain threshold.
In summary, the correlation analysis results indicate that, although only weak correlations are generally observed between lighting environment variables and individual indicators, there is a conceptually interpretable correlation structure with meaningful direction and magnitude among fatigue, preference, visual comfort, and response speed. Notably, the negative correlations among fatigue, preference, and response speed, as well as the positive correlation between preference and visual comfort, provide important insights into how the subjective experience of the lighting environment may be linked to cognitive performance. These findings can serve as foundational data for interpreting the relative influence of lighting environment factors and psychological indicators in subsequent multiple regression analyses.
3.4. Multiple Regression Analysis of Light Environment Variables
To assess the relative influence of lighting environment factors on each indicator, multiple regression analyses were performed using illuminance and spectrum as independent variables, and psychological fatigue (ΔKSS), preference, visual comfort, response speed, and correct rate as dependent variables (
Table 6). In all models, the tolerance and variance inflation factor (VIF) were both 1.0, indicating no multicollinearity issues. Furthermore, the Durbin–Watson statistics were approximately 2.0, suggesting that the assumption of residual independence was generally satisfied.
In the model with psychological fatigue as the dependent variable, the overall regression was statistically significant (R = 0.212, R2 = 0.045, F = 3.702, p = 0.027). Examining individual predictors, illuminance had a significant negative effect (B = −0.001, β = −0.199, t = −2.551, p = 0.012). This indicates that as illuminance increased (from 500 lx to 1000 lx), ΔKSS decreased, suggesting a tendency toward reduced fatigue. In contrast, spectrum did not have a significant effect on changes in fatigue (B = −0.163, β = −0.074, p = 0.345). However, given that the overall model explained only about 4.5% of the variance (R2 = 0.045), it is reasonable to interpret illuminance as a statistically significant but limited predictor of fatigue changes in terms of effect size.
For the model with preference as the dependent variable (R = 0.092, R2 = 0.008, F = 0.664, p = 0.516), neither illuminance (B ≈ 0, β = −0.009, p = 0.906) nor spectrum (B = −0.363, β = −0.091, p = 0.254) were statistically significant. This indicates that variations in illuminance and spectrum among the four lighting conditions did not have a meaningful impact on changes in preference. Similarly, the model with visual comfort as the dependent variable (R = 0.043, R2 = 0.002, F = 0.144, p = 0.866) showed no significant effects for illuminance (B ≈ 0, β = 0.039, p = 0.625) or spectrum (B = 0.100, β = 0.017, p = 0.828), with explanatory power effectively near zero. These results suggest, consistent with descriptive statistics and correlation analyses, that within the illuminance range used in this study (500–1000 lx) and the two spectrum types, the direct linear effects on preference and visual comfort ratings are minimal.
Regression results for work performance indicators revealed similar trends. In the model with response speed as the dependent variable (R = 0.067, R2 = 0.004, F = 0.353, p = 0.703), neither illuminance (B = 0.002, β = 0.045, p = 0.571) nor spectrum (B = 1.188, β = 0.049, p = 0.536) were statistically significant, and the explanatory power was very low at 0.4%. Similarly, the model with correct rate as the dependent variable (R = 0.082, R2 = 0.007, F = 0.528, p = 0.591) showed no significant effects for illuminance (B ≈ 0, β = 0.019, p = 0.812) or spectrum (B = −0.007, β = −0.079, p = 0.319), with minimal explanatory power. These findings suggest that, under the experimental conditions, lighting environment factors such as spectrum and illuminance level have little influence as linear predictors of work speed and accuracy. Task performance was likely more strongly affected by other factors, such as individual differences or cognitive strategies beyond lighting.
In summary, the multiple regression analysis results indicate that the direct linear effects of illuminance and spectrum on psychological and cognitive indicators are generally limited. As illuminance increased, psychological fatigue tended to decrease; however, no statistically significant relationships were observed for preference, visual comfort, response speed, or accuracy. Notably, spectrum did not yield statistically significant regression coefficients for any indicators, suggesting that under the short-term exposure conditions and illuminance range established in this study, the spectral differences between full-spectrum LED and conventional LED do not produce clear effects within simple linear models.
These findings suggest not that the effects of lighting conditions are negligible, but rather that human responses exhibit high variability and that the effects of lighting may have a complex structure involving interactions with psychological states and task characteristics.
4. Discussion
4.1. Interpretation of Results
This study comprehensively analyzed the effects of full-spectrum LED and conventional LED lighting, along with two illuminance levels (500 lx and 1000 lx), on psychological fatigue (ΔKSS), preference, visual comfort, and cognitive performance (speed and accuracy) in an office environment. Overall, illuminance emerged as the most statistically significant factor, while the light spectrum did not show clear significance on individual indicators but appeared to act as a “qualitative variable” that consistently influenced the direction of fatigue and speed.
First, psychological fatigue was the most sensitive indicator of changes in lighting conditions. Descriptive statistics, LMM, and regression analyses all demonstrated a significant decrease in fatigue under the 1000 lx condition compared to 500 lx, suggesting that increased illuminance can help alleviate subjective fatigue and maintain arousal levels during short-term exposure. Although the main effect of spectrum was not statistically significant, it is noteworthy that across all four lighting conditions, the full-spectrum LED consistently yielded lower average fatigue scores than the conventional LED. In other words, at the same illuminance level, the full-spectrum LED tended to subtly shift responses toward “inducing less fatigue,” supporting the hypothesis (H1) that full-spectrum lighting reduces psychological fatigue at equal illuminance, at least in terms of directional trends.
The effects of illuminance and spectrum on preference and visual comfort were relatively limited. Mean differences among the four lighting conditions were small, and standard deviations were large. Neither the main effects nor the interaction effects of illuminance and spectrum were significant in LMM and regression analyses. Nevertheless, a moderate positive correlation was observed between these two indicators, indicating that lighting conditions perceived as more visually comfortable were also consistently more preferred. This suggests that, although preference and visual comfort can be conceptually distinct constructs, in actual user experience they function strongly as a single emotional evaluation dimension. However, the hypothesis that full-spectrum LED lighting significantly enhances preference and visual comfort at the same illuminance level (H1) was not statistically confirmed under the short-term exposure and illuminance range (500–1000 lx) used in this study.
Correct rates remained relatively stable across all conditions, with no significant effects of illuminance or spectrum alone. However, LMM revealed a significant interaction effect between illuminance and spectrum on accuracy: the highest accuracy was observed under 1000 lx with Conventional LED, whereas accuracy was relatively lower under 1000 lx with Full-spectrum LED. This suggests a typical speed–accuracy trade-off, where the combination of high illuminance and full-spectrum lighting slightly increases response speed at the expense of a minor decrease in accuracy. This effect may reflect arousal-related mechanisms, in which heightened alertness promotes faster processing but slightly reduces response monitoring. The implications depend on task demands. Speed-oriented tasks may benefit, whereas precision-oriented tasks may require more balanced conditions. In other words, full-spectrum LED lighting should not be viewed as reducing accuracy but rather as promoting “faster processing behavior” when combined with high illuminance, which may be accompanied by a slight decline in accuracy.
Response speed exhibited clearer patterns in relation to psychological fatigue than to the lighting variables themselves. It was observed that as fatigue levels increased, the number of questions completed within the same amount of time decreased, indicating that fatigue directly impairs the work speed. Considering that response speed was generally slightly higher under full-spectrum LED lighting compared to conventional LED, the spectrum appears to have the potential to subtly enhance speed in a favorable direction. These results partially support H2, which posits that high illuminance improves performance compared to low illuminance. Specifically, high illuminance was associated with reduced fatigue and increased speed under certain conditions; however, the effect size was limited when attempting to explain overall performance (speed and accuracy) based solely on lighting levels.
Finally, the correlation structure among fatigue, preference, visual comfort, and response speed conceptually supports the relationship between psychological evaluation and cognitive performance proposed in H3. Higher fatigue was associated with lower preference and slower response speed, while visual comfort and preference tended to increase together. This suggests that lighting conditions do not independently affect a single indicator but rather function as an environmental factor that modulates an interconnected response network involving fatigue, emotion, and work behavior. From this perspective, illuminance can be understood as the primary factor determining arousal levels within this network, while full-spectrum LED lighting acts as a quality factor that subtly shifts responses toward reduced fatigue and maintained speed under the same illuminance conditions.
4.2. Comparison with Previous Studies
Previous studies on conventional office and similar work environments have consistently reported that changes in illuminance, CCT, and spectral composition can influence psychological satisfaction, fatigue, and arousal levels. Multiple studies have emphasized that lighting environments with illuminance above a certain threshold and moderate to high brightness contribute to reduced subjective sleepiness and sustained arousal. Additionally, natural light or spectra closely resembling natural light tend to promote more positive emotional evaluations and overall well-being. In this context, the trend observed in the present study—where increased illuminance correlates with reduced fatigue and a preference for lighting perceived as more comfortable—conceptually aligns with the findings of prior research. However, previous studies have also noted that physiological, psychological, and cognitive responses vary inconsistently depending on factors such as exposure duration, task type, illuminance range, and participant characteristics (e.g., age, vision, and job type). Notably, it has been observed that under conditions such as short-term exposure, mid-range illuminance, and single cognitive tasks, it is difficult to detect strong effects attributable solely to lighting variables. Similarly, the results of this study demonstrate that under practical illuminance levels of 500–1000 lux, short-term exposure, and a structured text verification task (AVT), psychological and cognitive indicators cannot be reliably explained based solely on the lighting environment.
Nonetheless, this study offers the following unique implications compared to previous research:
First, by directly comparing full-spectrum LEDs and conventional LEDs within the same illuminance range and analyzing spectral differences—including their potential for melanopic stimulation—in relation to psychological fatigue, subjective evaluations, and cognitive performance indicators, this study offers a more nuanced perspective beyond simple comparisons of illuminance and CCT levels.
Second, by integrating analyses of mean differences between conditions with LMM, correlation analyses, and multiple regression analyses to elucidate the structural relationships among fatigue, preference, visual comfort, speed, and accuracy, this study establishes a foundation for interpreting the interactions between lighting environment, psychological evaluation, and cognitive performance as an interconnected, multidimensional response network rather than as isolated, single effects. This approach reinforces the perspective that lighting is not merely a variable influencing a single performance indicator but an environmental factor affecting the entire response system encompassing fatigue, emotion, and work type.
Future research should further investigate the generalizability of the patterns observed in this study and identify the conditions under which full-spectrum LEDs produce clearly distinguishable psychological and cognitive effects compared to conventional LEDs. This can be accomplished through experimental designs that incorporate a broader illuminance range (e.g., 300–1200 lux), diverse spectral configurations (systematically adjusting melanopic stimulation levels), comparisons of long-term versus short-term exposure, and multiple cognitive tasks.
4.3. Practical Implications
The results of this study provide the following practical implications for designing office lighting environments and developing human-centric lighting strategies.
First, within the range of 500 to 1000 lx, an increase in illuminance was consistently associated with a decrease in psychological fatigue. Statistically, fatigue tended to decrease significantly as illuminance increased. This suggests that merely meeting the minimum standard illuminance (e.g., 500 lux) may be insufficient. For tasks requiring prolonged concentration and alertness, it may be necessary to consider illuminance levels that exceed the standard. However, rather than uniformly increasing illuminance, implementing a dynamic lighting control system that finely adjusts illuminance based on task type, time of day, and occupant fatigue state is a more appropriate approach. This need-based lighting control prevents unnecessary high illuminance, thereby reducing occupant fatigue and maintaining work performance. By shifting from constant to task-oriented illumination, this approach offers a robust framework for sustainable office management that simultaneously optimizes energy efficiency and occupant well-being.
Second, preference and visual comfort are closely interconnected emotional evaluation dimensions. However, within short-term exposure and moderate illuminance ranges, illuminance and spectrum alone do not reliably predict these factors. This indicates that simply meeting specified values, such as a certain number of lux or CCT in actual design and standards does not guarantee user satisfaction. Instead, these factors must be considered integratively alongside space usage, interior materials, finishes, brightness distribution within the field of view, display locations, and other relevant elements. Additionally, natural light–like spectrum lighting, such as full-spectrum LEDs, can be incorporated within this integrated design framework to enhance basic spectral quality, particularly helping to reduce emotional burden and alleviate visual fatigue in office environments where occupants spend extended periods.
Third, in the task measuring work performance, accuracy generally remained stable, while work speed tended to decline as fatigue increased. This suggests that lighting design contributes more directly to creating an environment in which occupants can maintain a consistently steady work pace, rather than minimizing decreases in task performance accuracy. For example, in tasks requiring high concentration, such as document review or inspection, it is necessary to slightly increase illuminance to reduce fatigue and drowsiness, while simultaneously addressing balanced requirements to minimize glare and discomfort (e.g., using indirect lighting and ensuring uniform luminance distribution).
Fourth, the low explanatory power and small effect sizes identified in this study indicate that relying on lighting alone as a standalone solution to improve office wellness and work performance is unrealistic. The lighting environment is just one factor that must be considered alongside workload, rest patterns, digital display usage time, and individual sleep and alertness rhythms. In practice, a multilayered strategy is required—one that combines full-spectrum LEDs and variable illuminance with regular breaks, seat-specific lighting adjustments, and personalized desk lighting.
Finally, the correlation structure among fatigue, preference, and response speed observed in this study, along with the LMM and regression analyses, provides foundational data that can be utilized in the development of AI-based lighting control systems or personalized lighting recommendation algorithms. Rather than directly optimizing illuminance and spectrum, these systems can be expanded into human-centric lighting solutions that use fatigue, preference, and visual comfort indicators as state variables to dynamically explore and control lighting environments in real time. This approach enables users to experience reduced fatigue, increased comfort, and maintain a consistent level of work speed. The findings suggest that illuminance levels of approximately 750–1000 lx may support sustained alertness during cognitively demanding tasks. Additionally, full-spectrum lighting may act as a qualitative enhancer, facilitating task-sensitive and flexible lighting strategies rather than fixed settings. The analytical framework presented in this study is significant because it offers a structural foundation to support the development of such systems.
5. Conclusions
This study comprehensively analyzed the combined effects of illuminance and light spectrum on psychological fatigue, preference, visual comfort, and cognition-based work performance using LMM, correlation analysis, and multiple regression analysis. This approach offers quantitative evidence supporting sustainable, human-centered design in indoor environments, thereby contributing to an integrated sustainable design framework that simultaneously enhances well-being, work performance (social sustainability), and energy optimization (environmental and operational sustainability).
The results showed that within the 500–1000 lux range, illuminance consistently had a statistically significant effect on changes in psychological fatigue. As illuminance increased from 500 lx to 1000 lx, fatigue tended to decrease, suggesting that in short-term exposure scenarios, higher illuminance can partially contribute to maintaining alertness and reducing drowsiness. Although the average fatigue level under full-spectrum LED lighting was lower than that under conventional LED lighting, and response speed also showed a slight increase, these findings indicate that spectrum quality may act as a qualitative variable that subtly influences responses in a manner favorable to fatigue reduction and speed maintenance.
Preference and visual comfort showed no significant average differences based on illuminance or spectrum, and no direct effects were identified in LMM or regression analyses. Nevertheless, a moderate positive correlation was observed between these two measures, consistently indicating that lighting conditions perceived as more visually comfortable were also more preferred. This suggests that, although preference and visual comfort are conceptually distinct subcomponents, they function closely together as a unified emotional evaluation dimension in actual user experience.
Accuracy remained generally stable at a high level, with limited effects from illuminance and spectrum. However, LMM revealed a significant interaction between illuminance and spectrum on accuracy: the highest accuracy was observed under the 1000 lx/Conventional LED condition, while the 1000 lx/Full-spectrum LED condition showed relatively lower accuracy. This suggests a typical speed–accuracy trade-off, where the combination of high illuminance and full-spectrum lighting increases work speed but slightly reduces accuracy. From a cognitive perspective, this pattern may reflect arousal-driven modulation of attention, where increased alertness speeds stimulus processing but slightly reduces sustained monitoring or response verification. This trade-off does not imply a negative outcome but indicates a task-dependent shift in cognitive strategy. It may benefit throughput-focused office tasks but is less suitable for precision-critical tasks (e.g., proofreading or error-sensitive work). In other words, full-spectrum LED lighting should not be viewed as degrading accuracy but rather as a strategy that, when combined with high illuminance, promotes faster information processing accompanied by a minor loss in accuracy.
Examining the overall correlation structure among the response indicators, fatigue exhibited a decreasing trend as both preference and work speed increased, while preference and visual comfort showed a significant positive correlation, increasing together. Higher reported fatigue was associated with a lower preference for the lighting condition and fewer items processed within the given time, whereas conditions perceived as more visually comfortable were more preferred. This structure indicates that the lighting environment influences a network of interconnected responses involving fatigue, emotion, and work speed, rather than independently affecting a single indicator.
In summary, the effects of lighting variables did not produce large, clear changes in any single indicator; rather, they manifested as subtle variations across multiple measures.
- (1)
Illuminance indirectly had a positive effect on cognitive performance by reducing fatigue (H2).
- (2)
Full-spectrum LED lighting demonstrated subtle effects in reducing fatigue and increasing speed under the same illuminance conditions (H1, H2).
- (3)
A correlation structure among fatigue, preference, visual comfort, and speed was established, revealing an interconnected response system linking psychological evaluation and cognitive performance (H3).
Therefore, the present findings provide practical support for the theoretical propositions outline in H1–H3, highlighting subtle but consistent tendencies rather than strong deterministic effects. Specifically, the lighting environment should be understood not as a high-intensity stimulus that strongly affects a single indicator, but as a multi-layered environmental factor that modulates an entire response network involving fatigue, emotion, and work strategies.
Nonetheless, this study has several limitations.
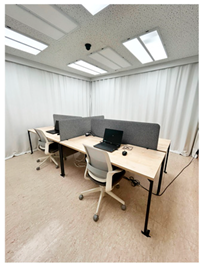
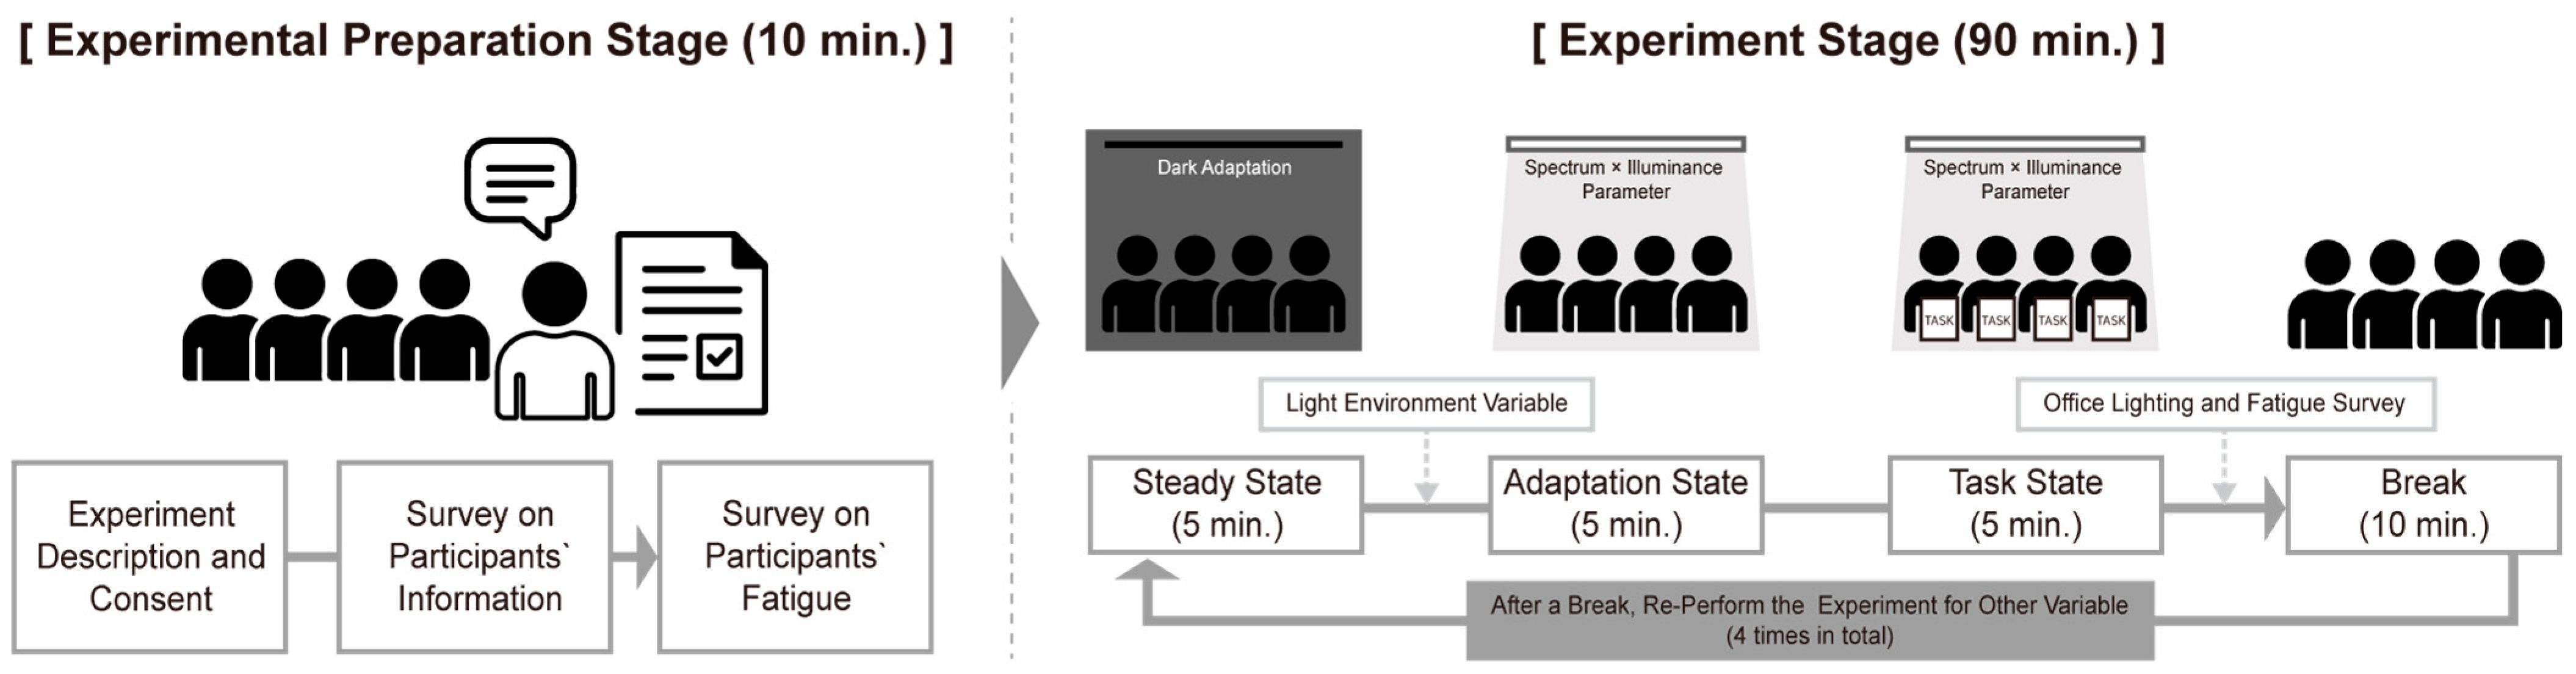
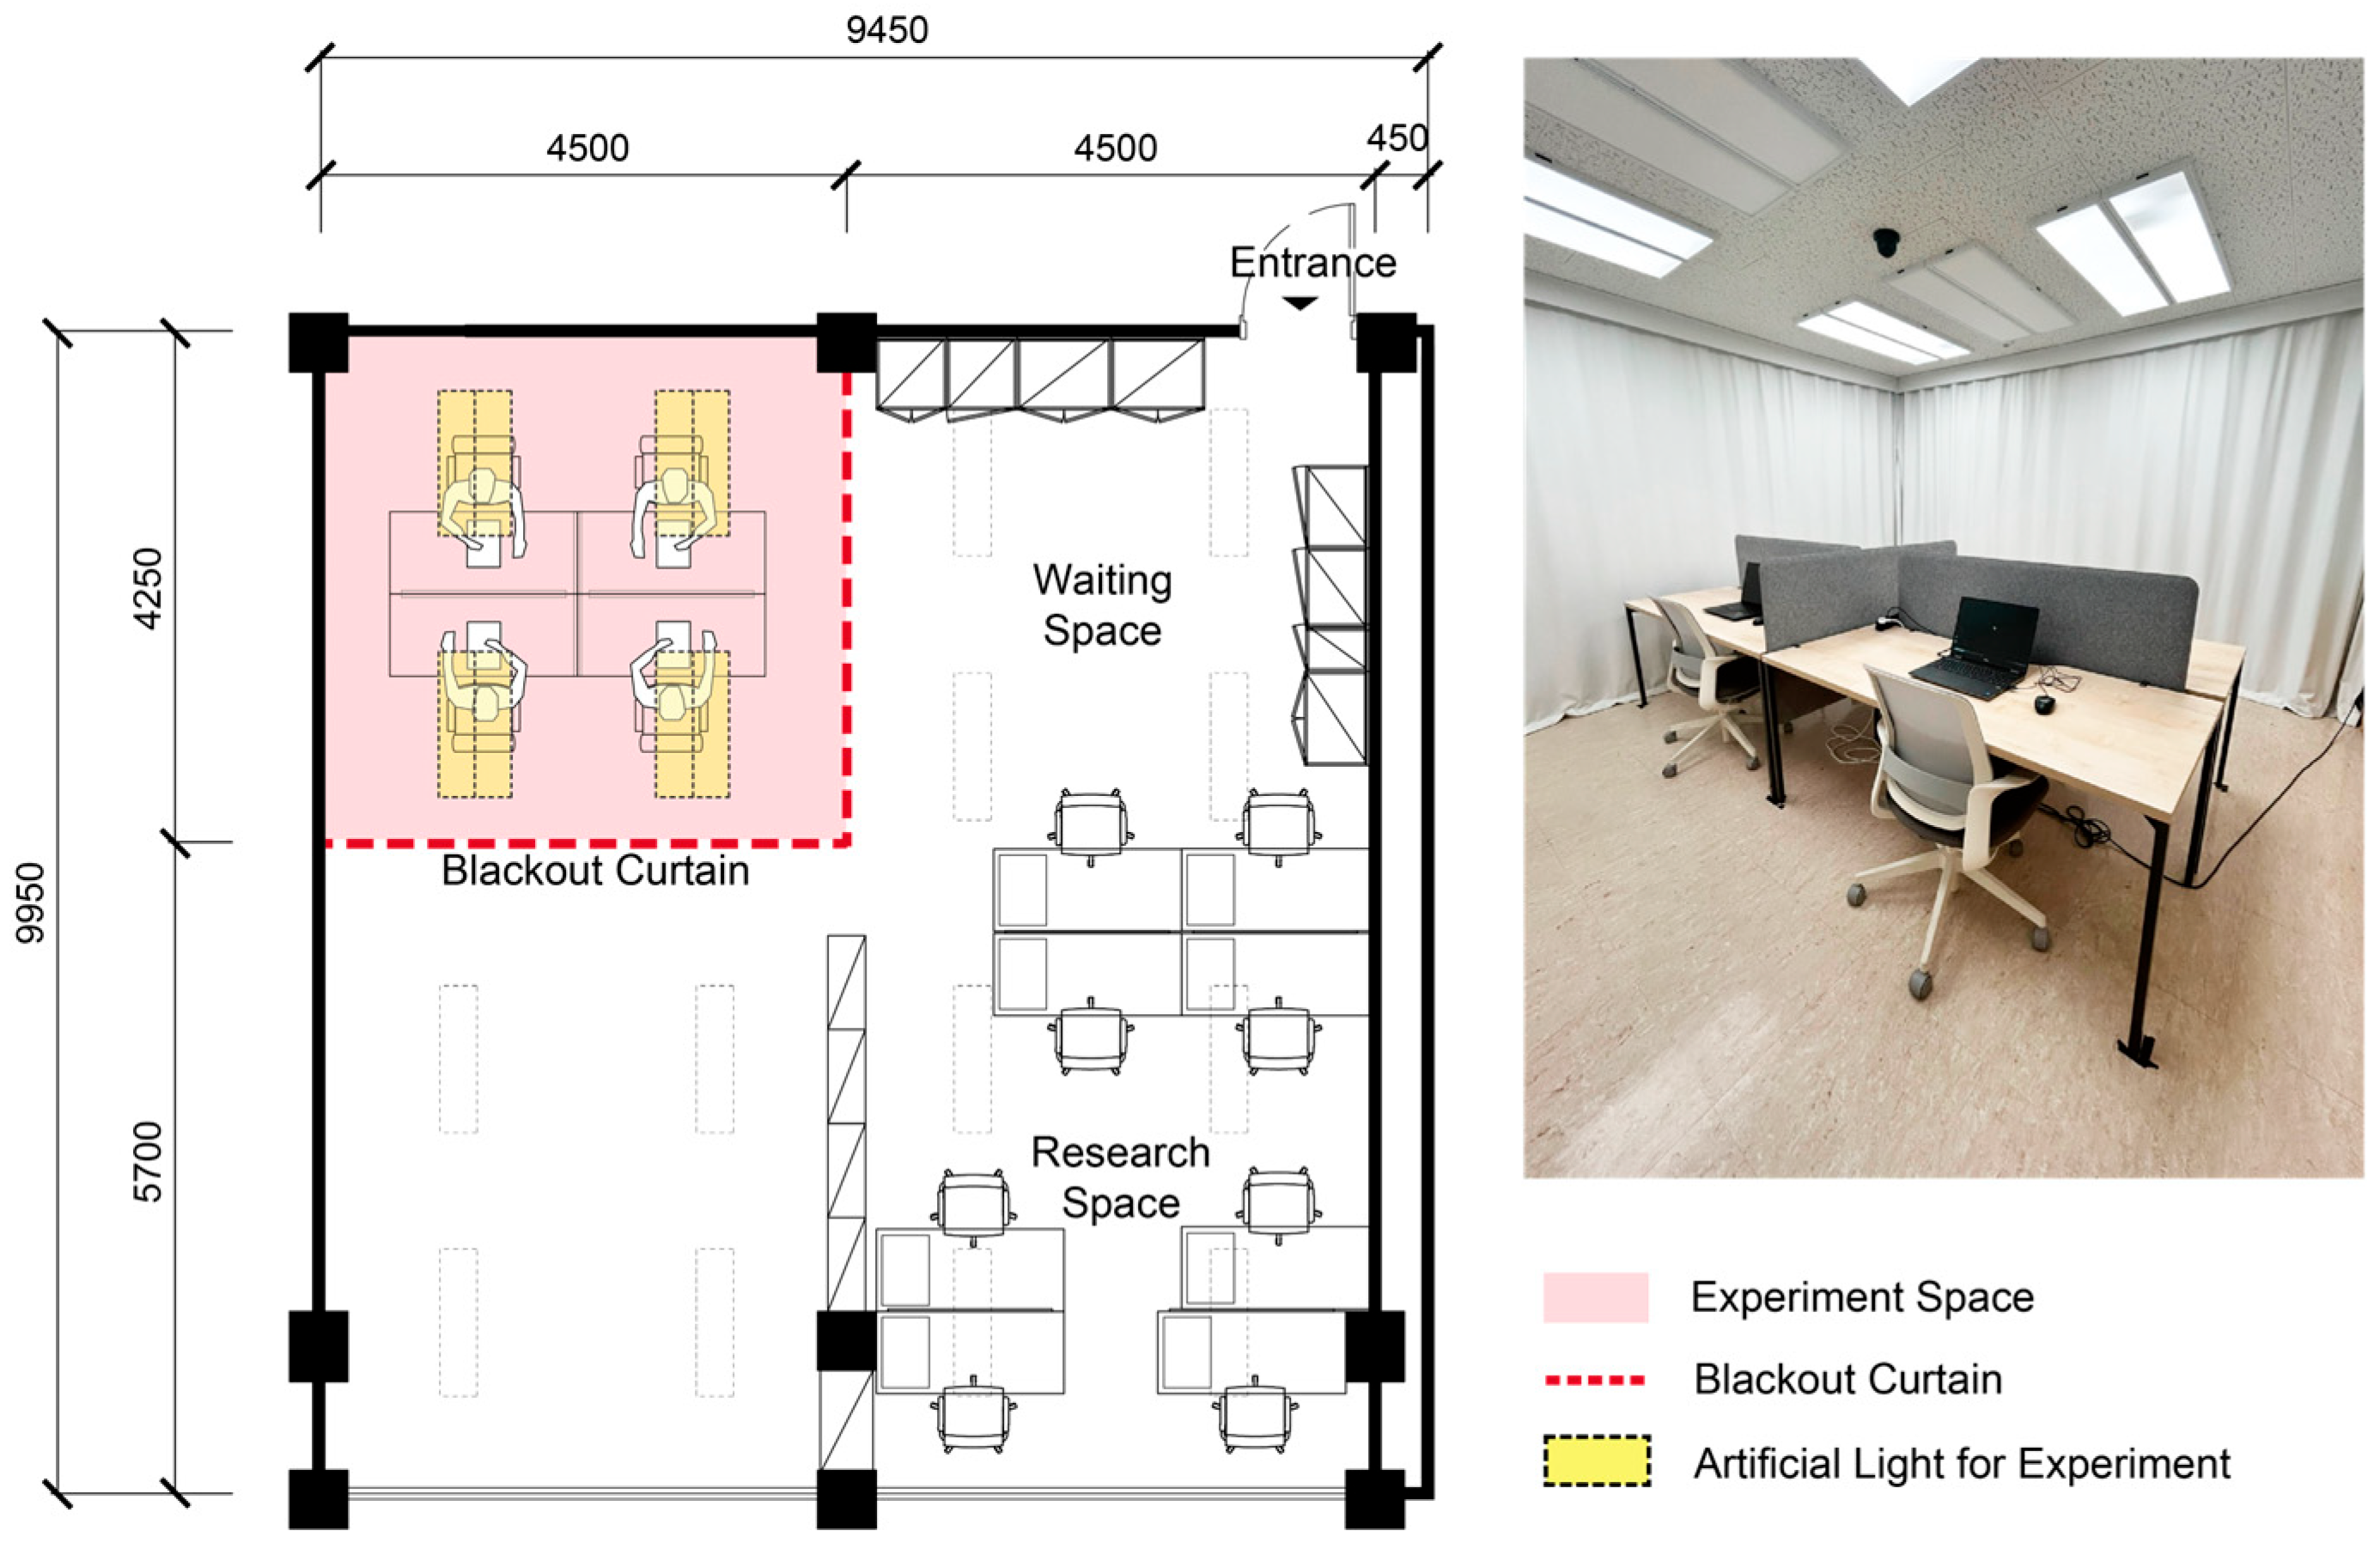
First, the experiment was conducted in a controlled laboratory with blackout curtains and artificial lighting, using short-term exposure (5 min of adaptation and 5 min of task performance per condition). A key limitation is the brief exposure duration (10 min per condition), which captures short-term task-related responses but not long-term physiological or circadian effects. Therefore, it does not fully reflect the complexity of real office environments involving prolonged exposure, daylight, shading, and surrounding visual contexts. Although a 10 min washout period separated lighting conditions, residual effects from prior exposure cannot be entirely ruled out and should be considered when interpreting within-subject comparisons. Second, illuminance levels were limited to two settings (500 and 1000 lx), CCT was fixed at a single neutral white (~4500 K), and the spectrum was restricted to two types of commercial LEDs. This limits the generalizability of the findings to extreme low or high illuminance levels, various CCT and melanopic stimulus levels, or other full-spectrum lighting designs. Third, participants were a relatively homogeneous group of healthy adults in their 20s and 30s. Although the sample size (n = 40) is larger than in many previous lighting studies, high individual variability combined with subtle spectral effects reduces statistical power. Since the participants were limited to adults aged 20 to 39, the findings are primarily applicable to younger office populations. Therefore, age-related spectral sensitivity should be investigated in future studies. Therefore, follow-up studies should include the 40- to 65-year age group, which represents the working-age population, in addition to the age groups examined in this study. This inclusion will better capture differences in age, visual characteristics, and patterns of fatigue accumulation, thereby enhancing the generalizability and applicability of lighting design. Fourth, the cognitive task in this study involved only a single document review task. The relatively high accuracy rates suggest a possible mild ceiling effect; future studies could employ tasks with adaptive difficulty to enhance sensitivity. Further research is needed to determine whether similar patterns occur across various types of work, such as precision tasks requiring high attention or unfamiliar tasks. Fifth, this study focused on psychological and cognitive responses and did not directly incorporate physiological indicators such as HRV, skin conductance, melatonin secretion, or ipRGC-based melanopic stimulus metrics into the analysis. Future research should concurrently measure these physiological indicators to model the relationships among lighting environment, fatigue, emotion, and cognitive performance within a unified psychobehavioral–physiological framework. This framework should also incorporate temporal factors (exposure duration, time of day) and individual characteristics (chronotype, sleep patterns). Such an approach will enable a more precise understanding of how spectrum quality and illuminance levels affect physical, psychological, and cognitive responses.
In summary, this study directly compared full-spectrum and conventional LEDs within the same illuminance range, employing LMM, correlation, and regression analyses to develop a framework for interpreting the relationships among illuminance, spectrum, fatigue, preference, visual comfort, work speed, and accuracy within a unified structure. This approach establishes a foundation for understanding the lighting environment not merely as a stimulus that influences a single indicator but as a human-centered environmental variable that modulates an integrated response network involving fatigue, emotion, and work speed. Consequently, the study holds practical significance as foundational data supporting human-centered lighting design in office spaces, smart lighting control strategies, and the enhancement of quantitative design standards at both practical and institutional levels. From a practical design perspective, illuminance levels near the upper end of typical office ranges (around 1000 lx) may enhance sustained alertness and work speed in cognitively demanding tasks. However, the observed speed–accuracy trade-off under high illuminance and full-spectrum lighting underscores the need for task-sensitive lighting strategies, suggesting that precision-critical tasks require more balanced or adaptive lighting rather than uniformly high stimulation.
This study supports the validity of a need-based operational approach that selectively adjusts lighting levels according to work patterns and occupant conditions, rather than relying on consistently high illuminance. In doing so, it reinforces a high-performance, human-centered, integrated sustainable design framework that unifies environmental performance optimization with spatial experience.