Article

Field Test Investigation into Heat Transfer Performance of Coaxial Casing Heat Exchanger Associated with Deep Geothermal Wells
1
School of Mines, China University of Mining and Technology, Xuzhou 221116, China
2
Xi’an Coal Technology Geothermal Energy Development Co., Ltd., Xi’an 712044, China
3
CCTEG Xi’an Research Institute (Group) Co., Ltd., Xi’an 710077, China
4
General Survey of Natural Resources Center, China Geological Survey, Kunming 650100, China
*
Authors to whom correspondence should be addressed.
Sustainability 2026, 18(2), 1038; https://doi.org/10.3390/su18021038
Submission received: 29 November 2025 / Revised: 26 December 2025 / Accepted: 16 January 2026 / Published: 20 January 2026

Abstract

Rapid economic growth has directly driven up energy demand, and the gradual depletion of traditional fossil fuels has severely hindered sustainable development. Developing green and efficient geothermal exploitation technologies constitutes a crucial measure for tackling this sustainable development issue. This paper presents a field test associated with a clean energy system conducted in the Guanzhong Basin, China, with the core component of a coaxial casing deep geothermal well. A distributed temperature sensing system (DTS system) with over 3000 m-depth optical fiber installed and adopted to monitor near-wellbore formation temperature changes. Combining information on the inlet/outlet water temperature and flow rate monitored by an integrated temperature–pressure monitoring system, the heat transfer patterns during the operation of the deep geothermal well are deeply investigated. The research results demonstrate that a higher operation parameter of flow rates has a significant increasing effect on the heat transfer capacity of heat exchangers for coaxial casing deep geothermal wells. Although the increase in inlet temperature has minimal effect on the outlet temperature, it leads to a continuous decline in heat transfer capacity. In addition, as heat exchange duration extends, the geothermal gradient of the near-wellbore formation progressively declines.

1. Introduction

Currently, the accelerated consumption of fossil fuels has led to substantial CO2 emissions, triggering a series of severe environmental issues. This urgent situation demands a fundamental shift in the energy consumption landscape towards clean and green alternatives. The production and utilization of clean energy, e.g., solar, wind, geothermal, and others, can significantly alleviate the environmental problems caused by CO2 emissions, meeting the pressing needs of green transformation [1,2,3,4,5,6,7]. Compared to other forms of clean energy, geothermal energy possesses vast and renewable resource reserves. It is estimated that the total geothermal energy within the Earth is equivalent to approximately 170 million times the global coal reserves. Crucially, geothermal energy generates heat directly without consuming fossil fuels or other resources for energy conversion, thus holding substantial application potential [8,9,10,11,12,13,14]. In addition, geothermal utilization facilities can provide a reliable, stable, and continuous supply of geothermal energy without being affected by weather, climate, etc. These advantages determine that geothermal energy has enormous potential for mankind’s development in the fields of power generation and daily heating.
Deep geothermal wells have a significant advantage in single-well heat supply for large-scale building complexes due to their high-grade heat sources. In terms of deep geothermal development, a geothermal heat extraction system based on coaxial borehole heat exchangers is one of main means of extracting geothermal energy [10,15]. This type of geothermal development system has obtained widespread attention, primarily attributed to two reasons: (1) high heat transfer efficiency determined by the internal structure design of two concentric tubes; (2) groundwater environmental friendliness achieved through a heat extraction method named ‘no water heat extraction’. In addition, the combination of coaxial casing technology with geothermal power generation systems has achieved a dual effect of improving heat extraction efficiency and increasing power output [16]. This further enhances the application prospects of coaxial casing in deep geothermal energy extraction. However, this heat extraction method is characterized by the long-distance flow of circulating water in concentric tubes. Its heat transfer process is characterized by high complexity, due to long-distance flow and varying geothermal temperatures, which further influences the structural and operational parameter optimization design. Therefore, figuring out heat transfer behavior and its underlying responsible mechanisms under dominant controlling factors are major concerns and crucial for construction and operation of deep geothermal well with coaxial casing heat exchanger.
The huge demand for efficient energy utilization highlights the urgency of studying the heat transfer behavior of deep geothermal well systems. Recent years have witnessed extensive research efforts dedicated to Coaxial Casing Deep Borehole Heat Exchange Technology, yielding a wealth of valuable insights and guiding conclusions [15,16,17,18]. Among them, many researchers have studied the heat transfer behavior of deep geothermal wells through numerical modeling [19,20,21]. Du et al. employs a comprehensive approach including numerical simulation to investigate the impacts of three key factors on the heat extraction performance of deep coaxial borehole heat exchangers: (1) the thermal insulation performance of the inner tube, (2) the heat preservation method of the inner tube, and (3) the diameter ratio between the inner and outer tubes [19]. Liu et al. employed a numerical model to analyze heat transfer in a double-casing borehole heat exchanger (DCBHE), revealing that inner tube heat loss precluded the complete extraction of subsurface thermal energy. Their simulation demonstrated that augmenting the fluid flow rate—achieved by optimizing the inner and outer tube diameters—significantly mitigated this thermal loss [20]. Based on the study by Fang et al., an unsteady-state heat transfer model for a deep CBHE is developed, solved using the finite difference method, and validated with experimental data. Key factors influencing CBHE performance are systematically analyzed. Simulations reveal a significant initial drop in outlet temperature, followed by stabilization [14]. According to the research by Beier et al., an analytical transient heat transfer model for pipe-in-pipe coaxial borehole heat exchangers has been developed and validated against field measurements from distributed thermal response tests. The model simultaneously couples vertical temperature profiles in both circulating fluids with the surrounding grout and ground formations [21]. Cai et al. used deep borehole heat exchanger model implemented in OpenGeoSys-5 software to perform long-term simulations. To investigate the tentative heat extraction rate effect on long-term heat exchange performance, it is necessary to conduct short-term thermal performance tests to obtain the tentative heat extraction capacity [22]. The above findings have enhanced our understanding of the heat transfer process in coaxial casing heat exchangers for geothermal wells. However, for deep geothermal wells with complex geothermal conditions, numerical simulation remains highly constrained due to the challenges in developing a refined geological model. Instead, in situ test analysis demonstrates clear advantages for this issue. Some researchers investigated the influence of some important factors of the inner tube on the heat transfer performance of the middle-deep coaxial borehole heat exchanger through field test [14,19]. Due to high costs, systematic research of in situ tests associated with operation parameters and near-well geothermal temperature variation are seldom conducted in deep geothermal wells.
In this research, the geothermal-rich Guanzhong Basin in Northwest China is chosen as the geological framework. A 3141 m-deep in situ geothermal well test system was independently constructed, based on large-diameter coaxial borehole heat exchanger technology. Monitoring data involving temperature and flow were recorded by a dedicated monitoring network which used distributed fiber optic sensing (DFOS) monitoring technology. Through analysis of monitoring results, the study revealed the evolution regulations governing the effects of inlet flow rate and inlet flow temperature on outlet temperature and heat extraction rate in deep coaxial borehole heat exchangers. Furthermore, during the operation of geothermal well test system, the vertical temperature distribution in adjacent rock mass surrounding the heat exchanger was investigated, considering thermal-hydraulic effects from injection fluid temperature and flow rate.

2. Investigation of Study Site

2.1. Regional Geological Structures

The south-central part of Xi’an sag belongs to Guanzhong Basin, which is situated in central Shanxi province, China. It extends from Baoji in the west to Tongguan in the east. It spans approximately 300 km along east–west direction and covers an area of 20,000 km2. Bounded by Qinling Mountains to the south and Beishan Mountains to the north, this intracontinental rift basin has experienced multiple tectonic evolutions dominated by extensional faulting since the Quaternary period. These tectonic movements have sculpted the fundamental architectural framework of the current geological structure shown in Figure 1a. The basin consists of multiple subordinate fault blocks with varying dimensions. Specifically, boundaries of secondary geological structures extend along direction of NEE-trending or E-W striking. This structural attitude demonstrates striking congruence with the densely developed faults within Guanzhong Basin. From Figure 1b, the pre-Cenozoic base rock layer of the Guanzhong Basin exhibits a south-deepening and north-shallowing profile, forming a slightly southward-tilted V-shaped depression. The axis of this depression reaching depths of nearly 7000 m, roughly aligns with the surface course of the Weihe River, and extends in a NEE orientation. The above analysis demonstrates that the strata thickness within the Guanzhong Basin is highly variable, with distinct stratigraphic architectures occurring across different orientations.
Due to thin crust developed in the Guanzhong Basin, the partially molten asthenosphere within the upper mantle has experienced significant uplift relative to its common depth level. This suggests that a high-temperature melt zone is directly beneath the crust and even causing it to ascend intrusively into the crust. This process establishes a deep geological setting characterized by elevated geothermal temperatures and high heat flow in the Basin. In addition, in the upper part of this basin, the Weihe Graben formed during the Tertiary period and progressively subsided, accumulating extremely thick Cenozoic sediments. These loosely consolidated or semi-cemented sediments exhibit poor thermal conductivity, functioning as a massive thermal insulation layer that traps deep-sourced heat and restricts its dissipation. The reservoir rock layers across the basin predominantly consist of interbedded sandstones and mudstones. Sandstone layers, with their high porosity and permeability, serve as primary geothermal water reservoirs, while fine-grained mudstones act as natural impermeable barriers, effectively retaining heat through thermal insulation. Consequently, these combined mechanisms establish the Guanzhong Basin as a prominent high-temperature, high-heat-flow anomaly zone.

2.2. Geothermogeological Conditions

The geothermal reservoir associated with the south-central part of Xi’an sag is characterized by favorable and abundant geothermal resources. According to existing investigation results, at a depth of 200 m ground temperatures are generally below 21 °C. At 1000 m depth, temperatures are mostly around 45 °C, with a maximum of 70 °C. The distribution of relatively higher and lower temperature zones is largely consistent with that at 200 m depth, though there is poor reservoir continuity. At 2000 m depth, temperatures are mostly below 75 °C, while higher-temperature zones reach around 80 °C, with isolated areas peaking at 90 °C. At 3000 m depth, both measured and inferred temperatures are approximately 100 °C.
The geothermal gradient in the Xi’an area generally ranges from 2.8 °C/hm to 3.5 °C/hm, averaging 3.2 °C/hm. However, significant variations exist at different depths. In shallow reservoir, the gradient is relatively large and exhibits a wider range, from 2.5 °C/hm to 6 °C/hm, with isolated points exceeding 10 °C/hm. Between 1000 m and 2000 m depth, the gradient ranges from 2.5 °C/hm to 5 °C/hm. From 2000 m to 3000 m depth, the gradient narrows to 2.5 °C/hm to 3.5 °C/hm, averaging 3.2 °C/100 m, aligning with the regional geothermal gradient. The main lithological features from top to bottom (above 3500 m depth) obtained by geological data are as follows:
1. Quaternary Qinchuan Group. This stratigraphic group is distributed between 0 and 600 m depth with a total thickness of 600 m. It comprises interbedded layers of gray-yellow silty clay, sandy clay, clay, and medium-fine sand, coarse sand, and sandy gravel with variable thickness.
2. Quaternary Sanmen Formation: This stratigraphic formation extends from 600 m to 750.8 m depth with a total thickness of 150.8 m. It consists of grey-yellow to yellowish-brown clay interbedded with variably thick medium-coarse sand and gravelly medium-coarse sand.
3. Neogene Zhangjiapo Formation. This stratigraphic formation extends from 750.8 m to 1662.3 m depth with a total thickness of 911.5 m. It comprises interbedded pale yellowish-gray, greenish-gray, and dark purple mudstone or sandy mudstone alternating with yellowish-gray and gray fine sandstone, where sandstone accounts for approximately 16% of the total thickness.
4. Neogene Lanlian-Bahe Formation: This stratigraphic formation extends from 1662.3 m to 2342 m depth with a thickness of 679.7 m. It comprises brownish-purple mudstone and sandy mudstone interbedded with grayish-white fine sandstone and sandy conglomerate of variable thicknesses, where sandstone lithologies constitute approximately 30% of the total thickness.
5. Neogene Gaoling Group: This stratigraphic group extends from 2342 m to 3500 m depth with a thickness of 1158 m. It consists of brown, purplish-red, and grayish-green mudstone/sandy mudstone interbedded with gray fine sandstone and gravelly sandstone of variable thicknesses, where sandstone lithologies account for approximately 10% of the total thickness.

3. Field Test

3.1. Experimental Work

To conduct a field experimental study on the heat transfer characteristics of deep geothermal wells, a 3141 m-deep geothermal well was drilled in the south-central part of the Xi’an sag. Based on this, the heat exchange test for the deep geothermal well was comprehensively carried out, which is an open-cycle type. Based on this well, a coaxial casing deep geothermal resource extraction system has been established, which extracts geothermal energy through the injected circulating water. Specifically, a low-temperature heat transfer water is injected into the annular space of the outer tube of the coaxial heat exchanger. As it flows downward, it continuously absorbs heat from the surrounding rock formation. Upon reaching the bottom as a high-temperature fluid, it returns directly to the ground surface through the central inner tube. During this test process, multiple factors significantly influence the final water temperature at the surface outlet. These include the thermal conductivity of the inner and outer tubes, the inlet water flow rate and temperature, the operational duration of the heat extraction system, etc. This study specifically focuses on the impacts of variations in inlet water temperature and flow rate. Consequently, heat exchange tests under variable inlet temperatures and flow rates were devised for the deep geothermal well.
Considering the temperature interference effect of seasonal and diurnal temperature variations on the circulating water source in geothermal wells, it is necessary to investigate variation patterns of heat extraction efficiency with circulating water inlet temperature. For this purpose, three inlet temperature levels were designed: 9 °C, 14 °C, and 18 °C. Additionally, to optimize heat extraction efficiency during normal operation of the geothermal well, the impact of inlet flow rate variations must be examined. Based on common pump capacities adopted by geothermal wells, three inlet flow rate levels were established: 24 m3/h, 30 m3/h, and 33.5 m3/h. In addition, to ensure the comparability of test monitoring data under different inlet temperatures, the geothermal well is designed to recover for the same period (i.e., 9 h) of time before conducting the next round of tests. This can largely ensure that the ground temperature reaches a nearly identical recovery level.
In this study, the quantitative indicator of heat extraction capacity Q is adopted to evaluate the heat extraction effect for the geothermal well, which is calculated based on inlet flow rate and inlet temperature. And the formula is as shown in Equation (1):
Q = ρ V C ( T o u t T i n ) 3600 .
where ρ is the density for circulating water (kg/m3), V represents the volumetric flow rate for one single geothermal well (m3/h), C denotes the specific heat capacity of water at constant pressure (kJ/(kg·K)), and Tin is the average inlet water temperature per well (°C). Tout is the average outlet water temperature per well (°C).

3.2. Experimental System

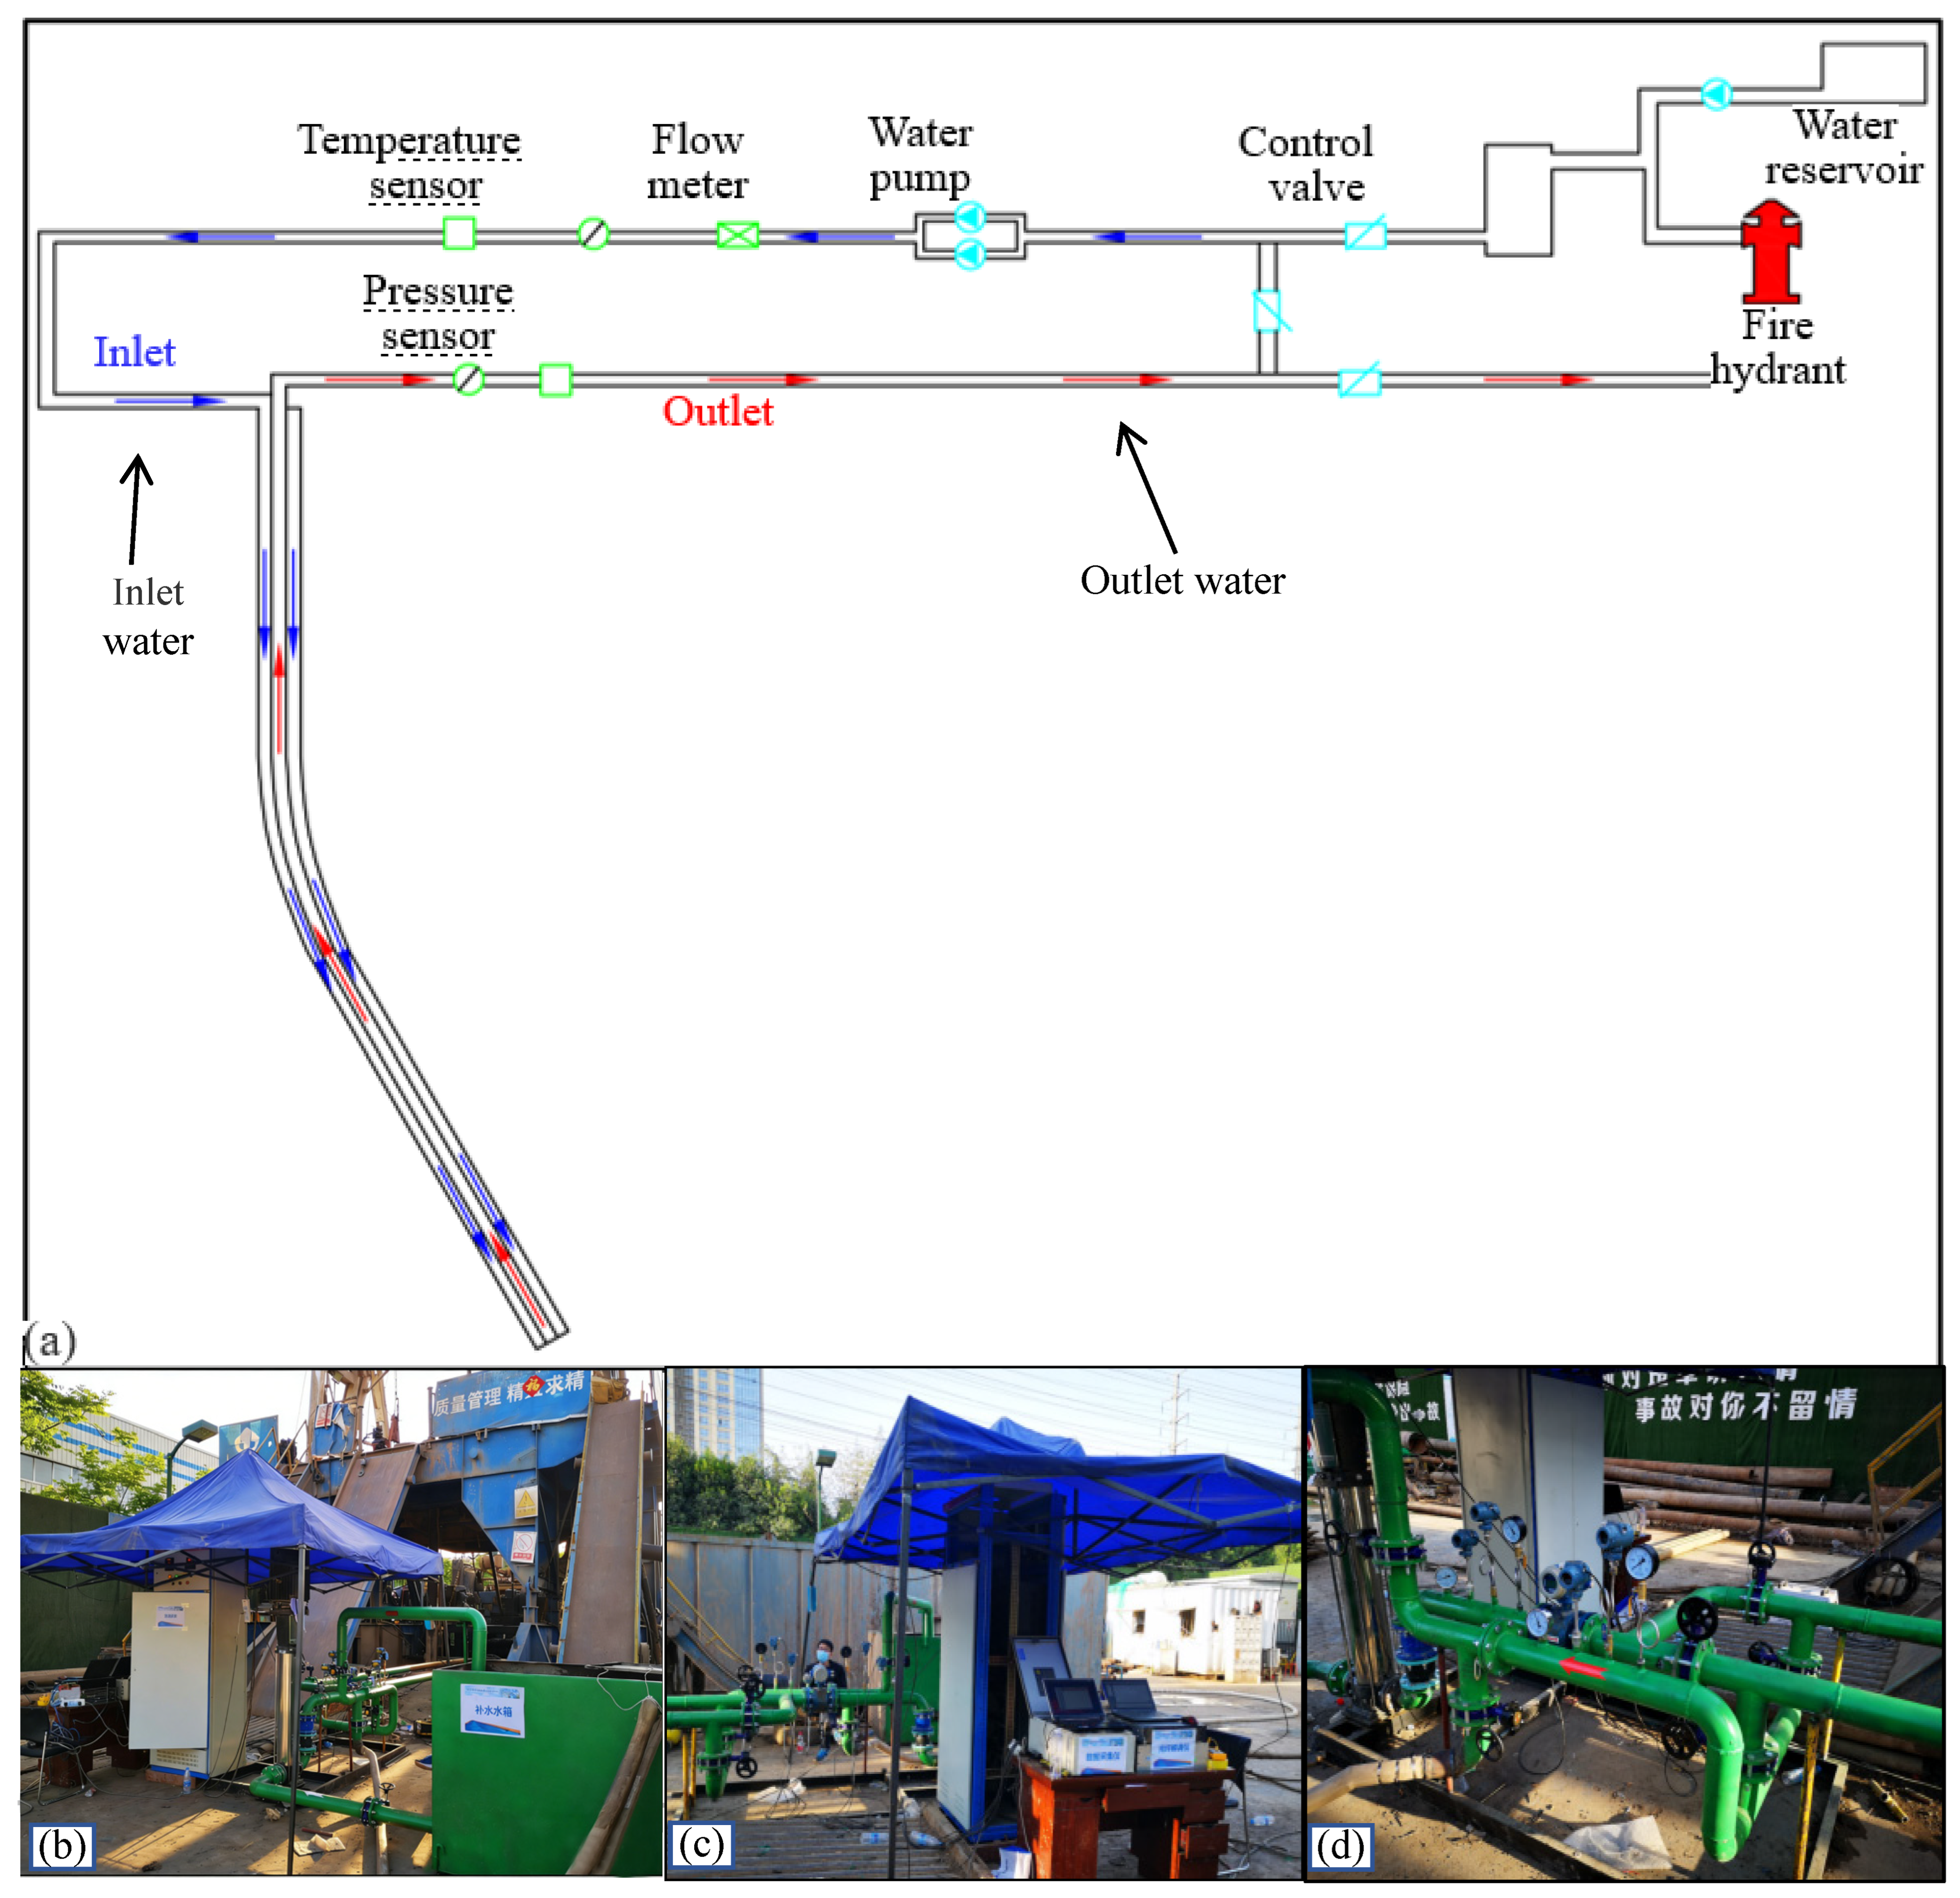
In this project, the geothermal well structure for the field test mainly comprises two main components: the pumping device on the ground surface and the heat extraction device underground (Figure 2). The core equipment of the pumping device is two frequency-modulatable centrifugal pumps, with a power rating of 30 kW. The pumping device is positioned at the surface-mounted geothermal wellhead. In terms of mechanical function, water pressurized by the pump is injected into the geothermal well through the discharge outlet to extract heat [23]. And the water for extracting heat comes from the water supply tank, which connects to the inlets of these pumps. In order to adjust the initial temperature of water for extracting heat, two water sources have been set up for the supply tank: (1) tap water and (2) blended water (a mixture of geothermal well effluent and tap water). Due to the incorporation of geothermal effluent, the temperature of the blended water is significantly higher than that of the tap water. Therefore, the initial water temperature injected into the geothermal well can be determined by adjusting the volume ratio of these two liquid media, which is achieved by a blending control valve. Additionally, the inflow rate into the geothermal well can be controlled via the built-in frequency modulation function of these centrifugal pumps.
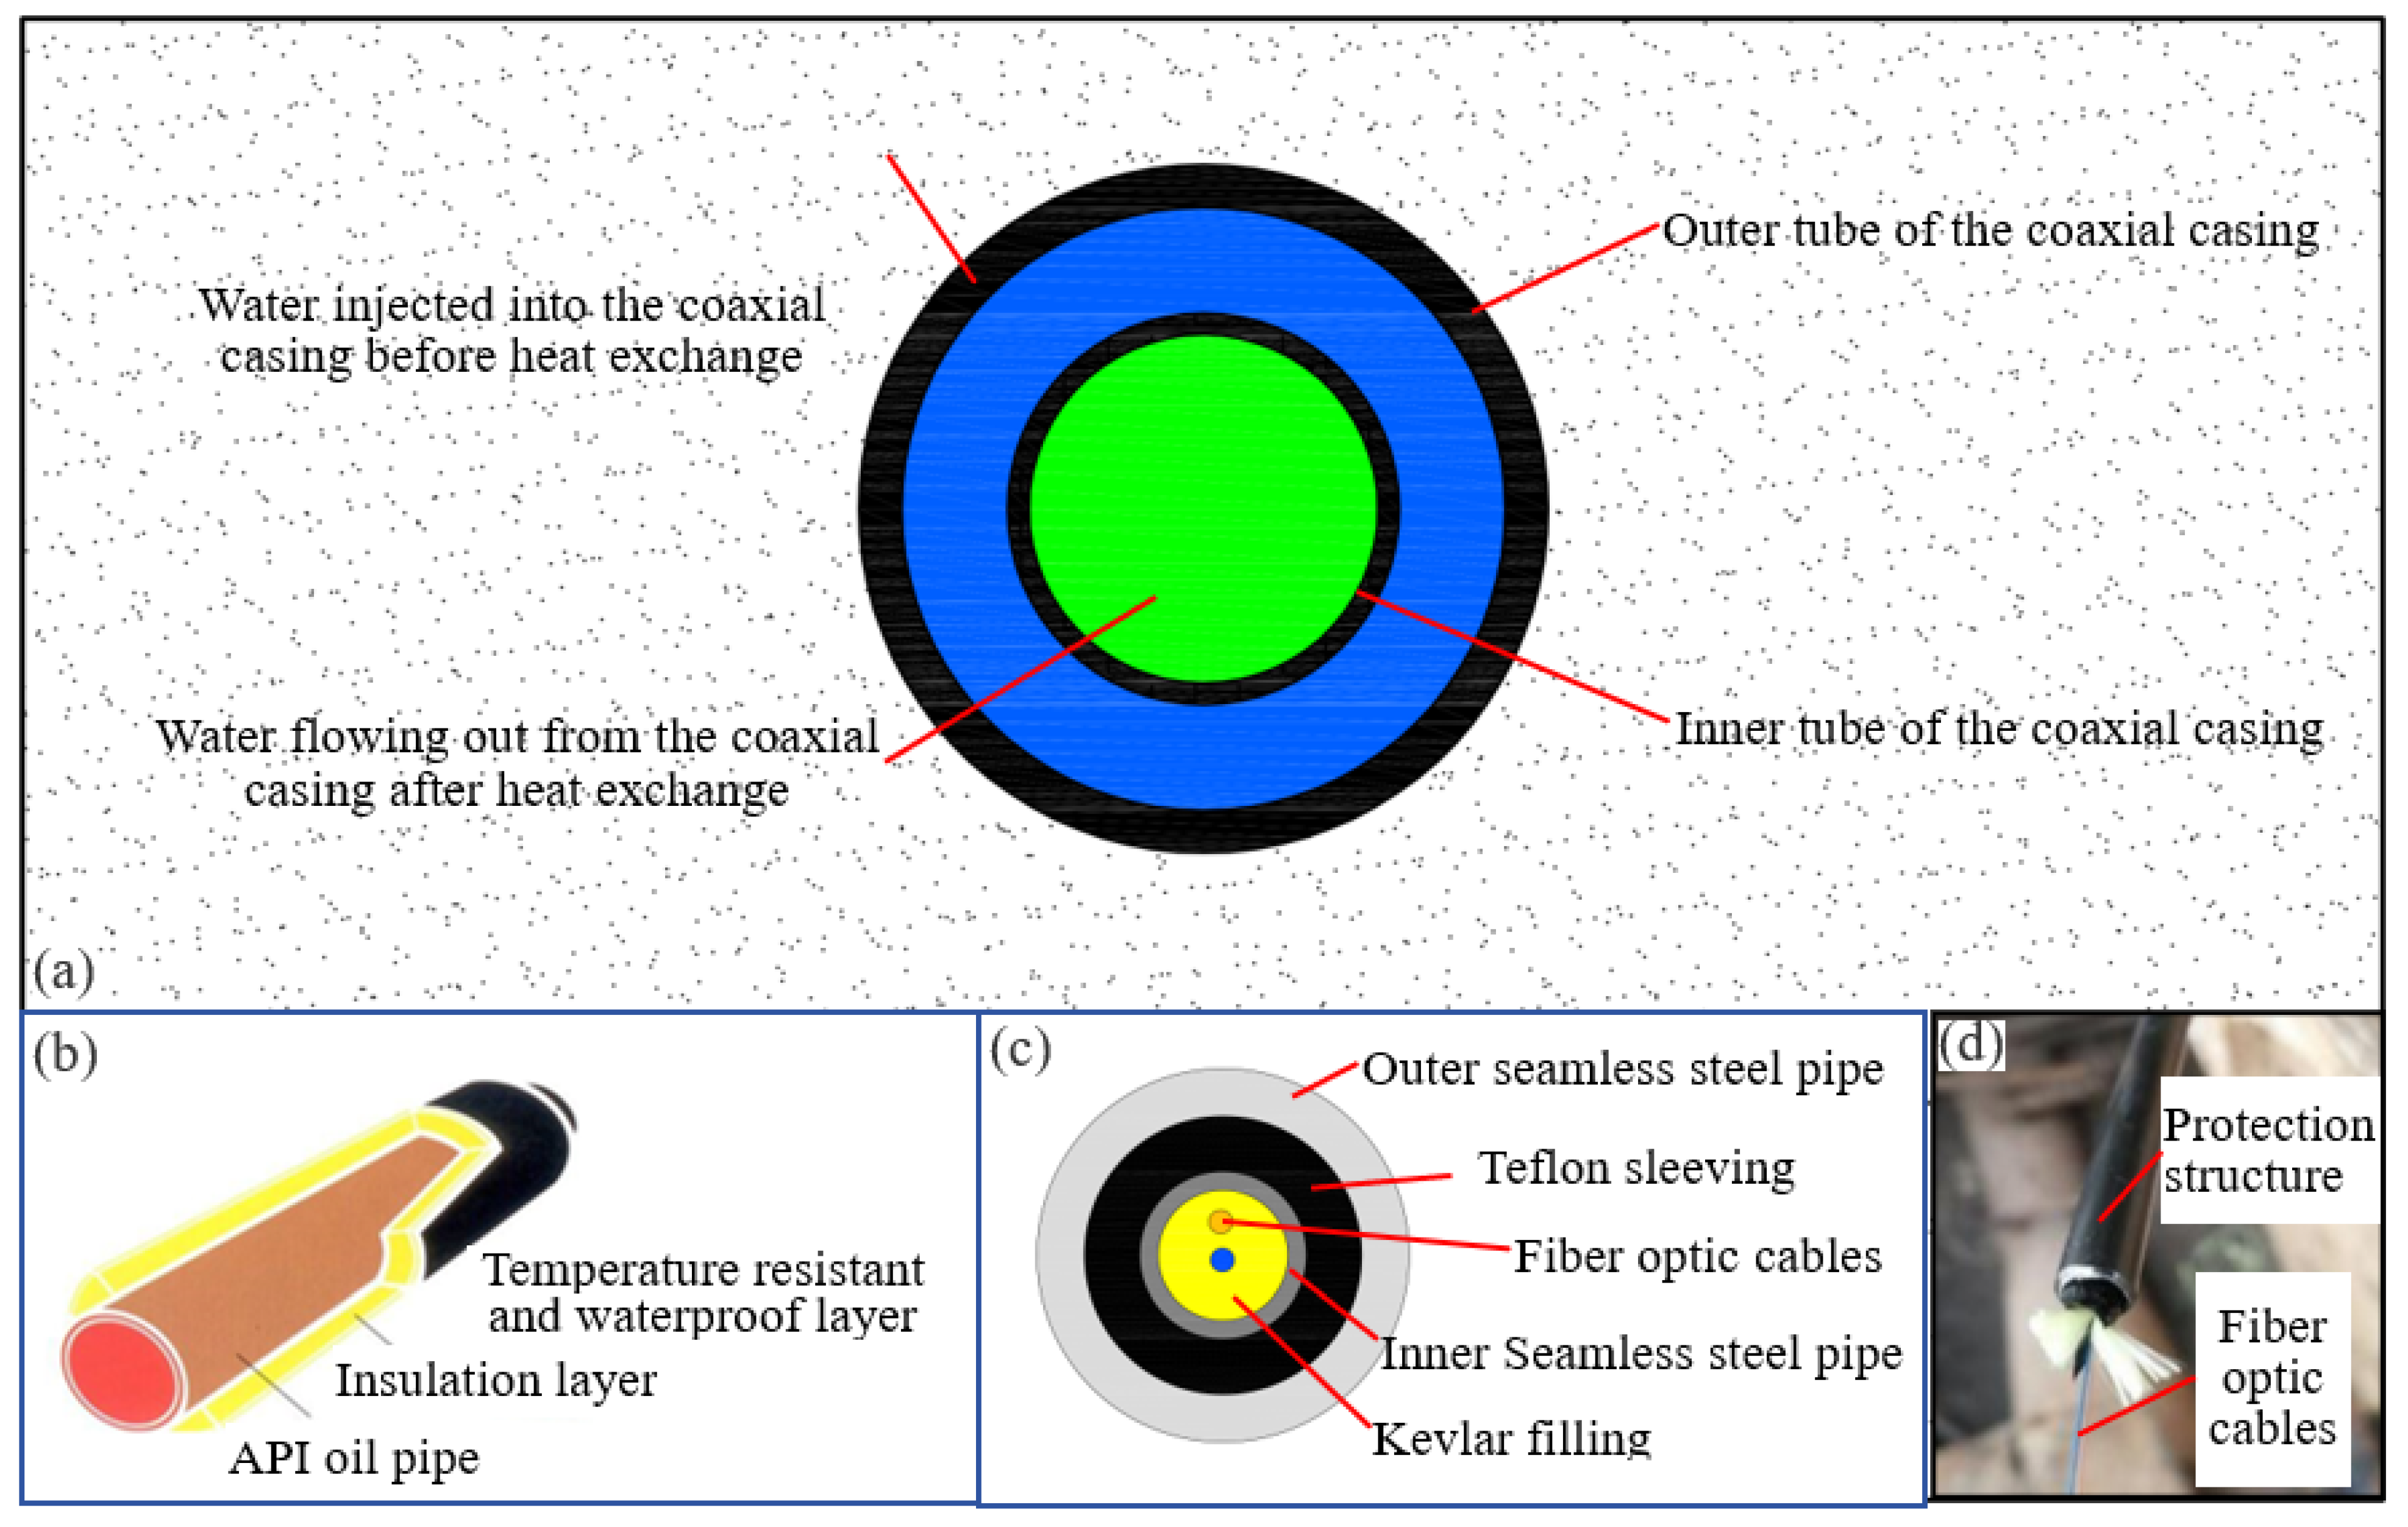
The underground heat extraction device mainly consists of coaxial casing heat exchangers and high thermal conductivity cementing materials. Among them, the coaxial casing heat exchanger, as the core component of the deep-drilling geothermal well, includes two water transmission tubes, the inner and outer tube (Figure 3a). This dual tube structure of “outer tube inflow and inner tube outflow” ensures the stable operation of the continuous heating mode of the circulating water. At present, the commonly used materials for inner tube are PE and its derivatives, with a maximum temperature resistance of up to 90 °C. For this type of material, the tube connection effect of hot melt is unstable, and in the application of geothermal wells, the tube disconnection phenomenon is common and the tube installation process is difficult. Meanwhile, although another alternative of insulated oil pipes exhibits good insulation features, they are limited by conventional specifications and high cost constraints, making it difficult to promote and apply on a large scale. In order to economically and effectively ensure the stable operation of long-distance coaxial tubes in deep geothermal wells, the inner tube needs to meet both insulation and waterproofing functions. Hence, in this study, a waterproof and anti-corrosion insulation tube suitable for deep-drilling geothermal wells was designed and developed. Its structure consists of three layers, with the innermost layer being an API oil pipe made of N80 material, the middle layer being an insulation layer, and the outermost layer being a temperature-resistant and waterproof layer. The structural composition is shown in Figure 3b. By applying insulation treatment to the inner tube wall, the heat loss caused by the return water of the inner tube is reduced, and the heat extraction efficiency of the geothermal well is improved. This thermal conductivity structure of inner pipe is independently developed. Through preliminary thermal conductivity tests, its apparent thermal conductivity is measured to be ≤0.15 W/(m·K), a 62.5% reduction compared to the conventional PE pipe (0.4 W/(m·K)). A set of preparation methods and installation techniques for the insulation inner pipe has also been established. At the same time, the outermost waterproof and anti-corrosion layer protects the insulation layer from damage, ensuring an insulation effect while improving the service duration of the inner tube.
The outer tube of the coaxial casing is adjacent to the surrounding rock layers around the geothermal well, and the water inflow crossing through its internal channel directly extracts heat from the underground heat source. In order to improve the heat extraction efficiency of circulating water, it is necessary to use cementing materials with high thermal conductivity for adding cementing layer attached to the inner surface of geothermal wells. The cementing layer mainly serves to protect and support the coaxial casing, while also providing a sealing effect on groundwater. However, the thermal conductivity of conventional cement for conventional oil wells is in the range of 0.4–0.7 W/(m·K), which is much lower than that of rock layers (e.g., 1.7–3.4 W/(m·K) for sandstone. Geothermal extraction efficiency is highly reduced due to this poor thermal conductivity and the thermal resistance effect of the cementing layer. In addition, the cementing layer is subjected to stress from casing, initial ground stress, underground humid and hot environments, etc., requiring it to have excellent mechanical properties. In view of this, the development of multifunctional composite cementing materials for deep geothermal wells is an important way to improve its reinforcement quality and geothermal exploitation efficiency.
In this study, common materials with high thermal conductivity such as graphite, iron powder, quartz sand, etc., were mixed into cement to increase its thermal conductivity. Based on numerous heat transfer and mechanical tests, the optimal material ratio was ultimately selected for the refined cementing material with high thermal conductivity that meets the requirements of deep geothermal well. Specifically, according to the comprehensive evaluation of multiple indicators, the weight proportions of mixed materials, i.e., graphite, iron powder, and quartz sand, are determined as 7.5%, 3%, and 2%, respectively, when compared to the cement weight. And the thermal conductivity of this refined cementing material can reach 1.87 W/(m·K). Compared to conventional cement for conventional oil wells, the refined cementing material meets the requirements of deep geothermal well cementing in terms of density, flowability, and mechanical strength. Its thermal conductivity has increased by about 69.5% compared to the original conventional cementing material.

3.3. Monitoring Technology

(1) Distributed temperature sensing system (DTS system)
In order to investigate the temperature response during the operation of geothermal wells, a high-resolution distributed temperature sensing system, abbreviated as DTS system, is adopted for continuously monitoring the surrounding rock layers around the deep geothermal well in real-time. The distributed temperature sensing system consists of a Temperature Sensing Cable (Sensing Units), temperature measurement host machine (Processing Unit), and Display and Interaction Module. The full-length Temperature Sensing Cable integrates signals detection and signal transmission functions. Its distributed front-end temperature sensors collect temperature data through continuous distributed measurement. And then through fiber optic cables the data are transmitted to the temperature measurement host machine.
The ultra-deep well drilling for geothermal energy extraction suggests that fiber optic cables with length exceeding 3000 m should be installed downward within the surrounding rock layers near the well, prior to the installation of the coaxial casing. Considering the high risk of cable fracture occurring during the installation process in an ultra-deep well, adequate protective structures must be adopted tightly surrounding the fiber optic cable, as shown in Figure 3c,d. This cylindrical protection structure mainly includes four parts. These parts are, respectively, a Kevlar filling part, an inner seamless steel pipe, teflon sleeving, and an outer seamless steel pipe with a thick wall, in sequence from inside to outside. Specifically, the inner seamless steel pipe employed in this project has a diameter of 2.8 mm, inside which complete and dense filling operations were carried out using the Kevlar filling material to protect the optical fiber through buffering. Subsequently, teflon sleeving with the diameter of 4.5 mm is added tightly surrounding the inner seamless steel pipe, providing secondary buffering protection for cables. Thick-walled seamless steel pipe is positioned at the outermost layer and has a diameter of 6.35 mm. It is noted that the specific size of this protective structure can be adjusted, based on geological conditions and changes in well depth, when it is further applied in other projects.
In this project, for further enhancing the reliability of temperature monitoring, two fiber optic cables were established simultaneously. Among them, one of these two cables suffered partial damage during installation. Affected by this, the DTS system operation test shows that this fiber optic cable merely remains in normal working condition within a distance range of 1549 m below the ground surface. Meanwhile, the other cable possessed a fully functional length of 3125 m in terms of temperature monitoring, due to its successful installation operation. In this project, A temperature measurement host machine with eight parallel channels was adopted, which is sufficient to simultaneously process signals collected through two channels. This DTS system has a temperature measurement accuracy of ±1 °C and a measurement positioning accuracy of ±0.5 m. And this DTS system achieves a single-channel temperature measurement range exceeding 4000 m. It also features an all-fiber passive design, providing immunity to electromagnetic interference (EMI) along with explosion-proof and flame-retardant capabilities.
(2) Temperature and flow monitoring for circulating water
In order to investigate heat transfer behavior in deep geothermal wells under varying inlet water temperature and flow rate conditions, an integrated electronic monitoring system was implemented in the application project, enabling simultaneous measurement of inlet/outlet water temperature, flow rate, pressure, and other parameters. The core component of this monitoring system is a PLC-integrated acquisition and control cabinet with a data sampling interval under 3 s. It handles raw electrical signals captured from electronic sensors (temperature, water pressure, flow rate, etc.) and converts them into target engineering unit measurements. Detailed specifications of the various electronic sensors appear in Table 1. A high-precision temperature sensor with an accuracy of ±0.2 °C was used to monitor the outlet temperature.

4. Experimental Results

4.1. Flow Rate Effect

To probe the flow rate effect on deep geothermal well operation, other influencing factors need to be strictly controlled in the field test. For this, the inlet water temperature remained constant at 9 °C for all rounds of tests. And for a single test the operating cycle of geothermal well heat extraction was set at 13 h, followed by an 11 h intermittent recovery period to allow the surrounding rock mass temperature to return to its pre-test state. It is noted that real-time monitoring via DTS system is used to confirm this before the commencement of next subsequent test. Subsequently, the flow rates in the coaxial casing heat exchanger were designed at a series level of 24 m3/h, 30 m3/h, and 33.5 m3/h, through the variable frequency drive system of the frequency-modulatable centrifugal pumps.
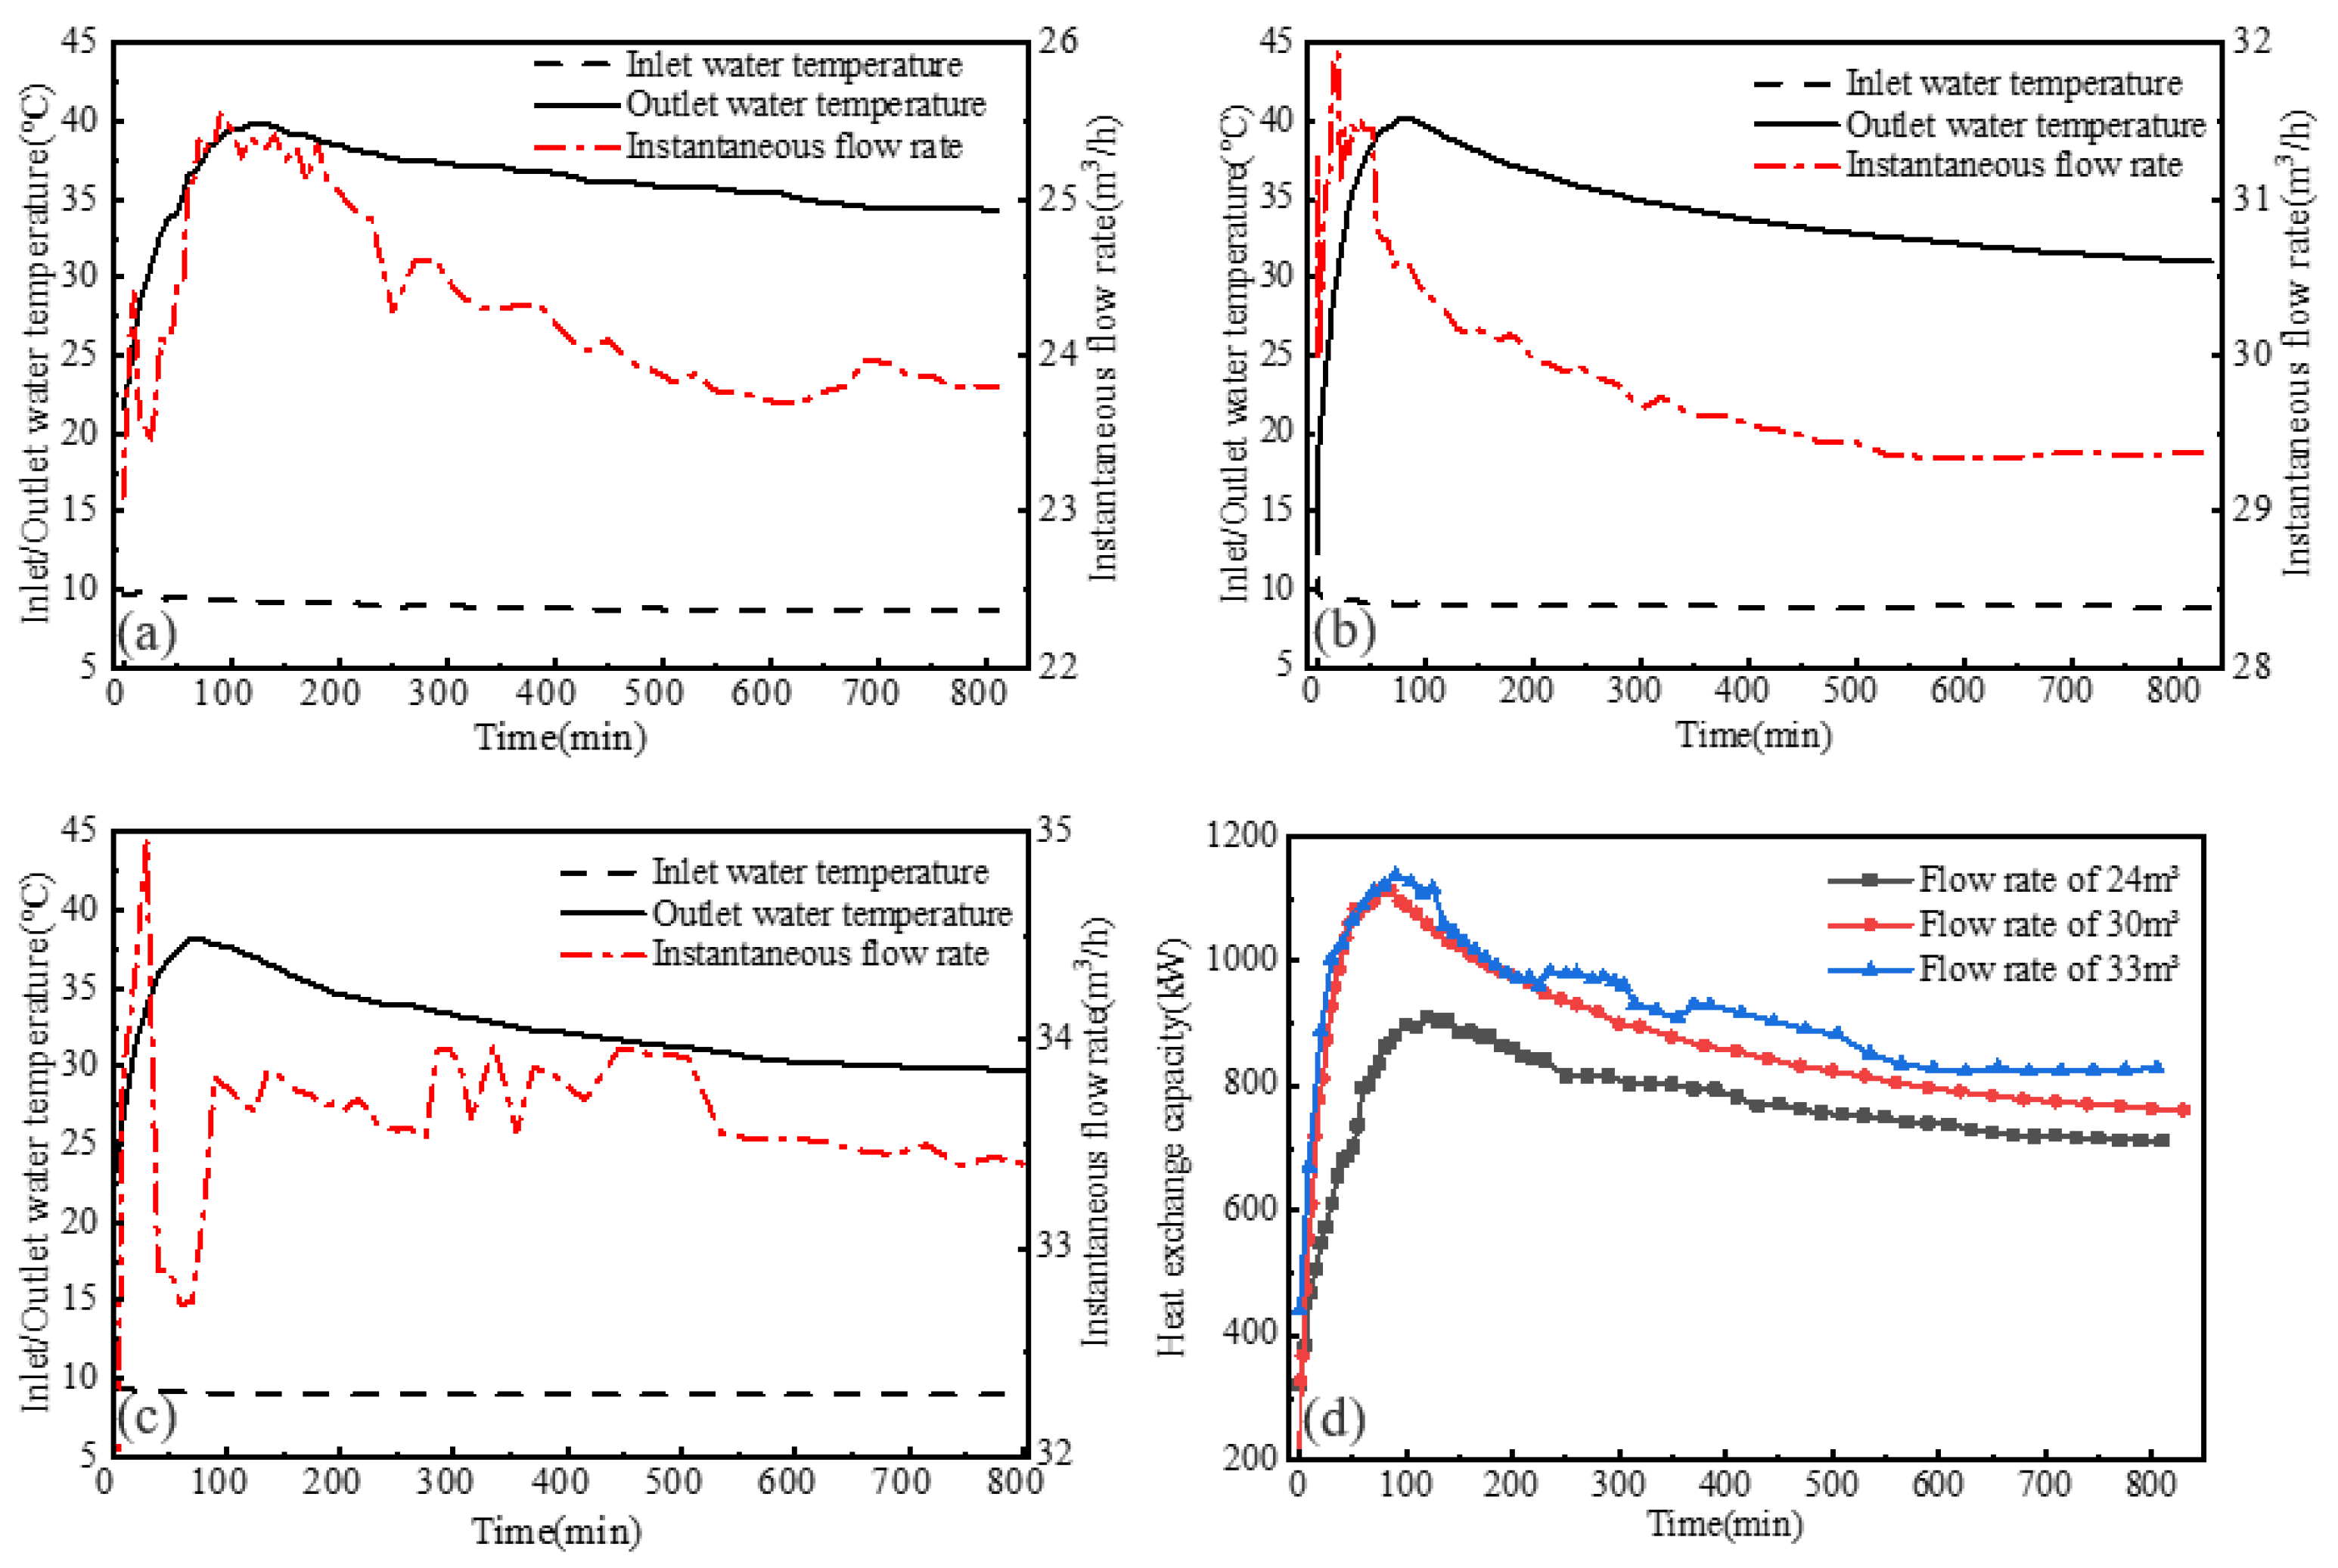
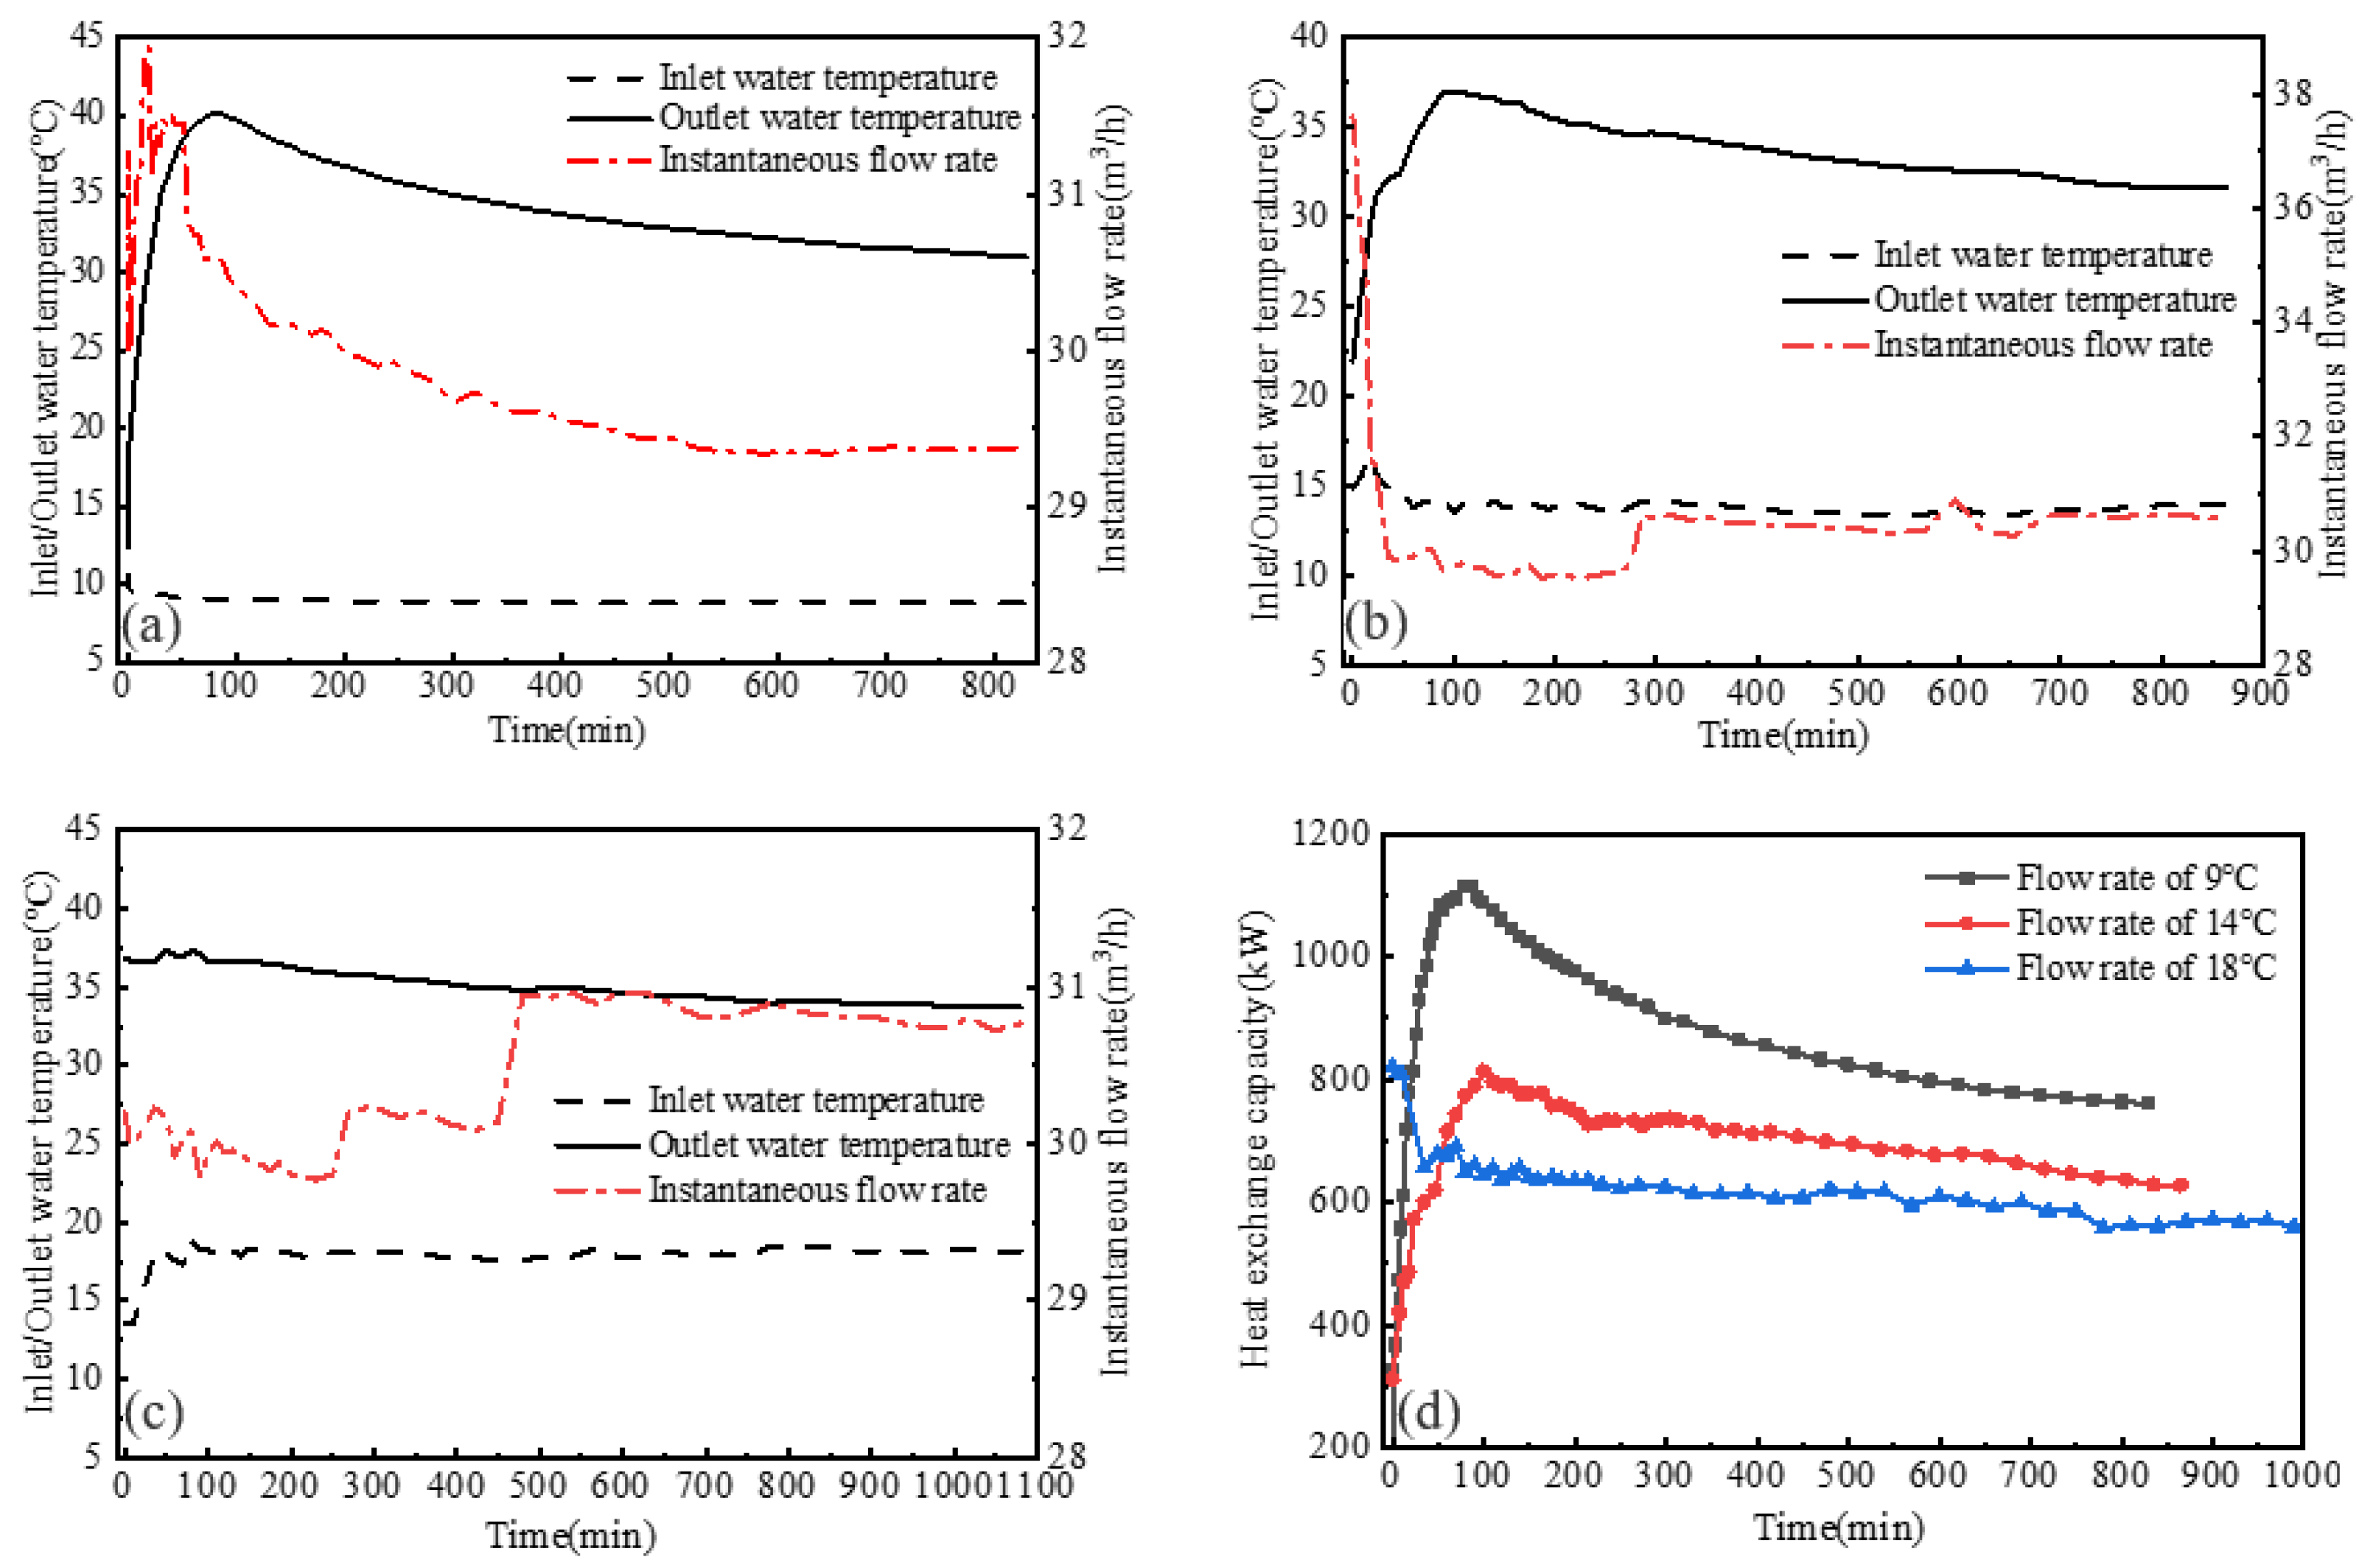
Under conditions of continuous operation for 13 h, the outlet temperature variation curve over time is as shown in Figure 4. It is clear that, although the flow rate varies, the trend of the outlet temperature–time curve remains largely consistent. The specific manifestation of this change characteristic is an initial rapid increase, succeeded by a slow decrease, before gradually approaching a stable state, as the circulation time progresses. Furthermore, higher flow rates lead to a shorter time to reach the maximum outlet temperature. This can be attributed to the fact that during the initial operation cycle, the hottest water originates from the bottom of the well. As circulation commences, this bottom-hole water reaches the ground surface, resulting in the peak outlet temperature. In addition, as the flow rate increases, the maximum outlet temperature does not increase proportionally (not linearly proportional). Specifically, when the flow rate is 24 m3/h, the peak temperature of the surface outlet water reaches 39.9 °C at the 120 min mark. when the flow rate is 30 m3/h and 33.5 m3/h, that reaches 40.2 °C at the 90 min mark and 38.2 °C at 70 min, respectively. The maximum wellhead temperature does not exhibit a proportional relationship with the inlet flow rate. This suggests that while increasing the flow rate reduces the heat exchange time between the circulating water in the outer tube and the surrounding rock layers, it also concurrently reduces the thermal interference time for the fluid inside the inner tube.
Based on the calculation from Formula (1) for single-well heat exchange capacity, this index corresponding to each sampling time during the experimental process was calculated using field monitoring data including inlet/outlet water temperatures and flow rates. Then, relevant change curves were plotted in Figure 4d, from which it is evident that the heat exchange capacity under different flow rates exhibits consistent variation patterns with increasing heat exchange time. Specifically, it increases rapidly within a short initial period before gradually decreasing as heat exchange continues. Furthermore, when the inlet water temperature remains constant, the influence of flow rate on heat exchange capacity is clear, with higher flow rates resulting in greater heat exchange capacity. During the early stages of tests under different flow rates, significant fluctuations in heat exchange capacity occur; however, the values gradually stabilize after approximately 10 h. This phenomenon can be effectively explained by Formula (1), which demonstrates that heat exchange capacity is directly proportional to flow rate. Consequently, heat exchange capacity increases with higher flow rates. It is noteworthy, however, that increasing flow rates lead to a corresponding rise in operational power consumption of the equipment. Therefore, when planning and designing deep-well geothermal systems, flow rate parameters must be comprehensively determined by considering factors such as energy consumption and efficiency.

4.2. Inlet Water Temperature Effect

To investigate the effect of inlet water temperature on the heat transfer behavior of deep-buried coaxial casing heat exchangers, a series of variable-temperature tests were conducted based on the deep geothermal well. Specifically, three heat exchange tests with different inlet water temperature levels (9 °C, 14 °C, and 18 °C) were successively carried out. The flow rate for all tests was uniformly set at 30 m3/h. Under the 9 °C and 14 °C inlet temperature conditions, the geothermal system operated for a cycle time of 13 h with an intermittent recovery time of 11 h, while under the temperature condition of 18 °C, the cycle time was extended to 18 h. Notably, the variation in inlet water temperature was controlled by adjustment of the input quantity of blended water.
Under conditions of continuous operation for 13 h, the outlet temperature variation curve over time is as shown in Figure 5. It is clear that the curve of water outlet temperature over time primarily shows a rapid initial rise to a peak, followed by a slow decline until stabilization. This is because the pipe system is pre-filled with water before each round of test. The water medium in the pipes, after undergoing heat exchange with the formation over a sufficiently long period (nearly 12 h), reaches a stable state and exhibits a temperature increase with depth. Therefore, before pumping begins (at the 0 h on the horizontal axis of the curve), the outlet temperature is slightly higher than the ambient temperature (due to the insulation cotton wrapping). Once the system starts operating, the water in the inner pipe below the ground is sequentially pumped outward, causing a rapid rise in the outlet temperature. The outlet temperature reaches its peak when the high-temperature water from the bottom position is pumped to the surface ground. Subsequently, the outlet temperature begins to decline slowly. This is because, in the initial stage, the formation temperature field remains undisturbed, and the rock temperature is relatively high, allowing the circulating water to absorb more heat from the rock. Over time, the formation near the borehole wall gradually cools. Due to the low thermal conductivity of the formation, heat from distant regions cannot reach the borehole wall in time, resulting in a “cold accumulation” near the borehole wall. As a result, the water absorbs less heat from the formation, leading to a gradual decrease in the outlet temperature.
Due to the difficulty of accurately obtaining the quantitative influence on the outlet temperature from inlet temperature based on analysis of Figure 5a–c, several data at some typical moments were selected from the experimental process, and the outlet temperature gap between different inlet conditions at these moments were calculated, as shown in Table 2.
Through comparative analysis of the data, it can be observed that under constant flow conditions, the outlet water temperature increases slightly with the rise in inlet water temperature. Furthermore, it is noted that the increase in outlet water temperature becomes progressively smaller as the inlet water temperature rises. The increment in outlet water temperature is relatively minor compared to the increase in inlet water temperature. For example, when the inlet temperature rises from 9 °C to 14 °C, the average increase in outlet temperature is 0.21; when the inlet temperature increases from 14 °C to 18 °C, the average increase in outlet temperature is 0.14. Therefore, the elevation of inlet water temperature has a limited effect on the outlet water temperature, and the rate of increase in outlet temperature diminishes with higher inlet temperatures. In addition, Figure 5d illustrates that the single-well heat exchange capacity decreases with increasing inlet water temperature. Under stable water flow condition of 30 m3/h, a higher inlet water temperature results in a lower single-well heat exchange capacity, with the capacity tending to stabilize after 10 h. This phenomenon occurring can be primarily attributed to the fact that higher inlet water temperatures reduce the thermal gap between the inlet water and rock layers surrounding the wellbore bottom, thereby diminishing heat transfer efficiency. When the inlet temperature rises from 9 °C to 14 °C, the heat exchange capacity exhibits an average reduction rate of 31.8 kW/°C. Similarly, as the temperature increases from 14 °C to 18 °C, the average reduction rate is 30.9 kW/°C.

4.3. Temperature Evolution of Near-Wellbore Formation Induced by Heat Exchange

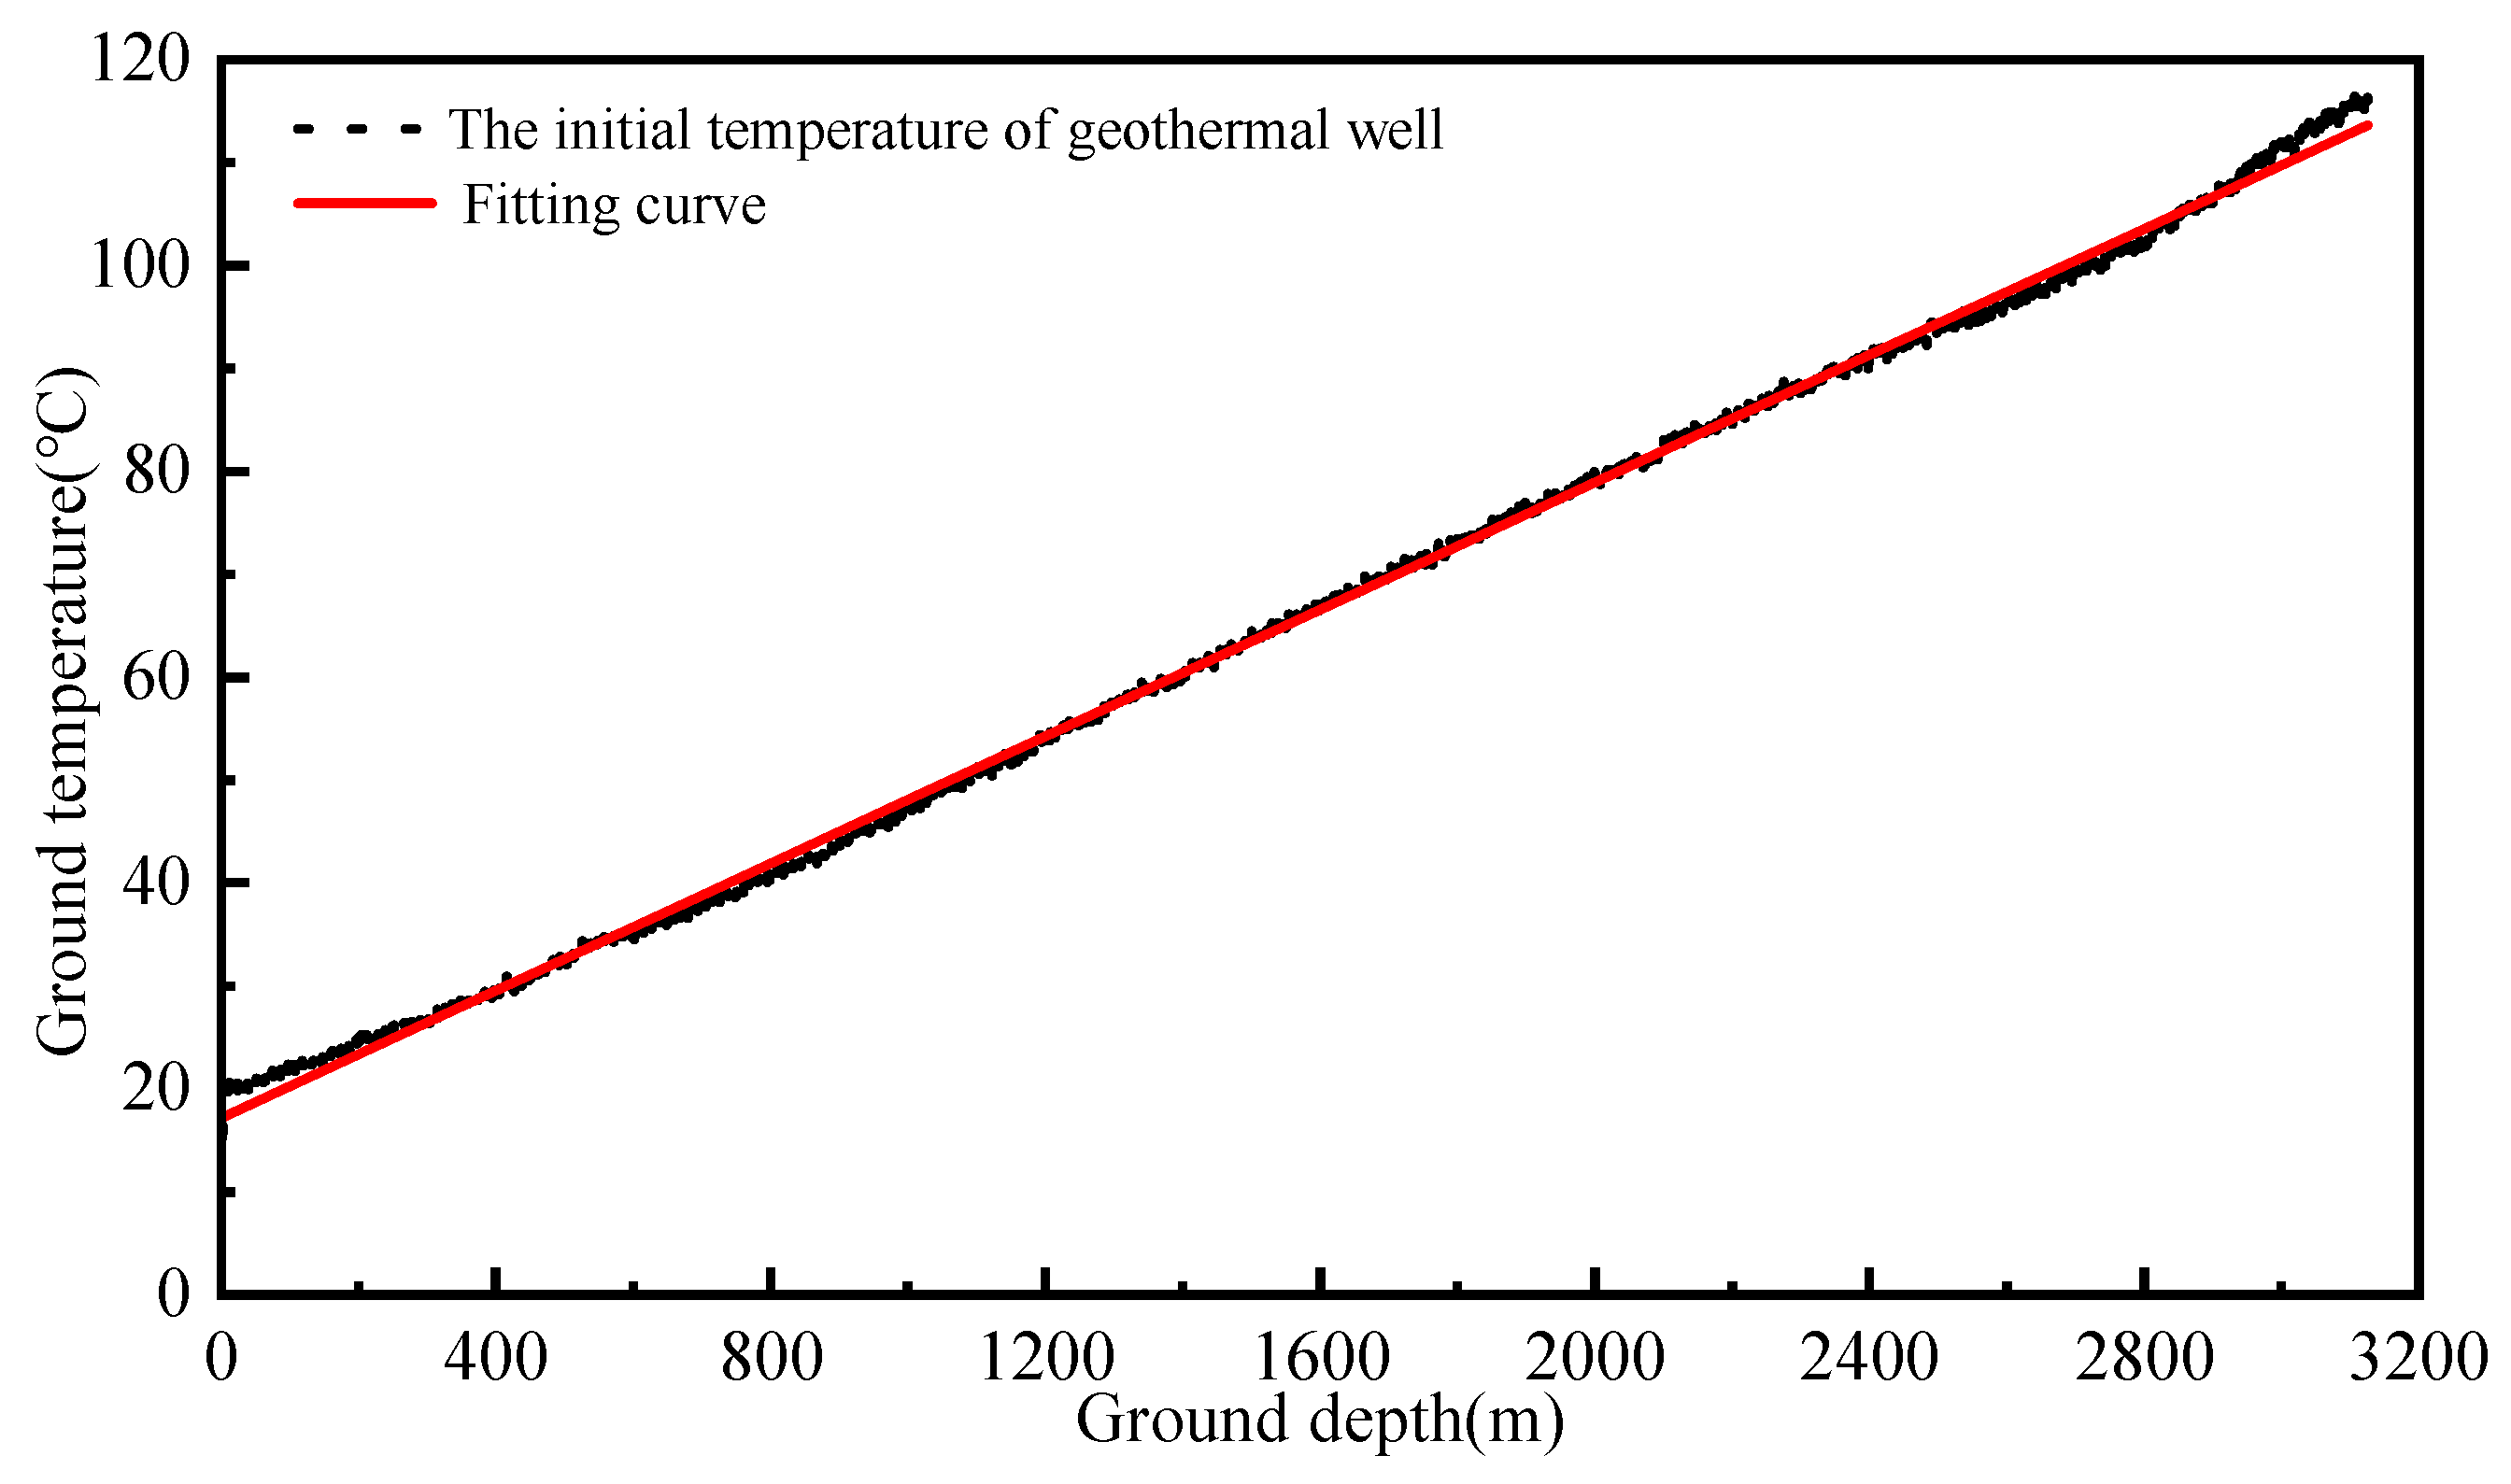
In the geothermal wells, a large area of direct contact surface exists between the surrounding rock strata and the outer wall of the heat exchanger. Hence, surrounding rock mass nearby constitutes the irreplaceable heat source for heating the circulating water. In order to investigate the reverse temperature weakening effect of circulating water heating on the nearby rock strata, it is first necessary to calibrate the initial temperature distribution within nearby rock strata along the vertical direction. Consequently, in situ temperature measurements of the country rock adjacent to the wellbore of the experimental geothermal well were conducted in March 2021. The related experimental results are shown in Figure 6, which specifically exhibits that within the 0–500 m depth interval, the average geothermal gradient is 2.8 °C/hm. From 500 to 1000 m depth, the average geothermal gradient is 2.6 °C/hm. Between 1000 and 2000 m depth, the average geothermal gradient measures 3.3 °C/hm. In the 2000–3000 m interval, the average gradient is 3.1 °C/hm; at 3000–3500 m depth, the average gradient reaches 4.0 °C/hm. Significant variations in geothermal gradients are observed across different depth intervals of the experimental geothermal well. The average geothermal gradient over the entire well depth is 3.1 °C/hm. In summary, although the surrounding rock temperature exhibits zonal characteristics with depth, the geothermal well demonstrates a highly linear temperature increase with depth. This validates the rationale and feasibility of employing ultra-long fiber optics for deep geothermal monitoring.
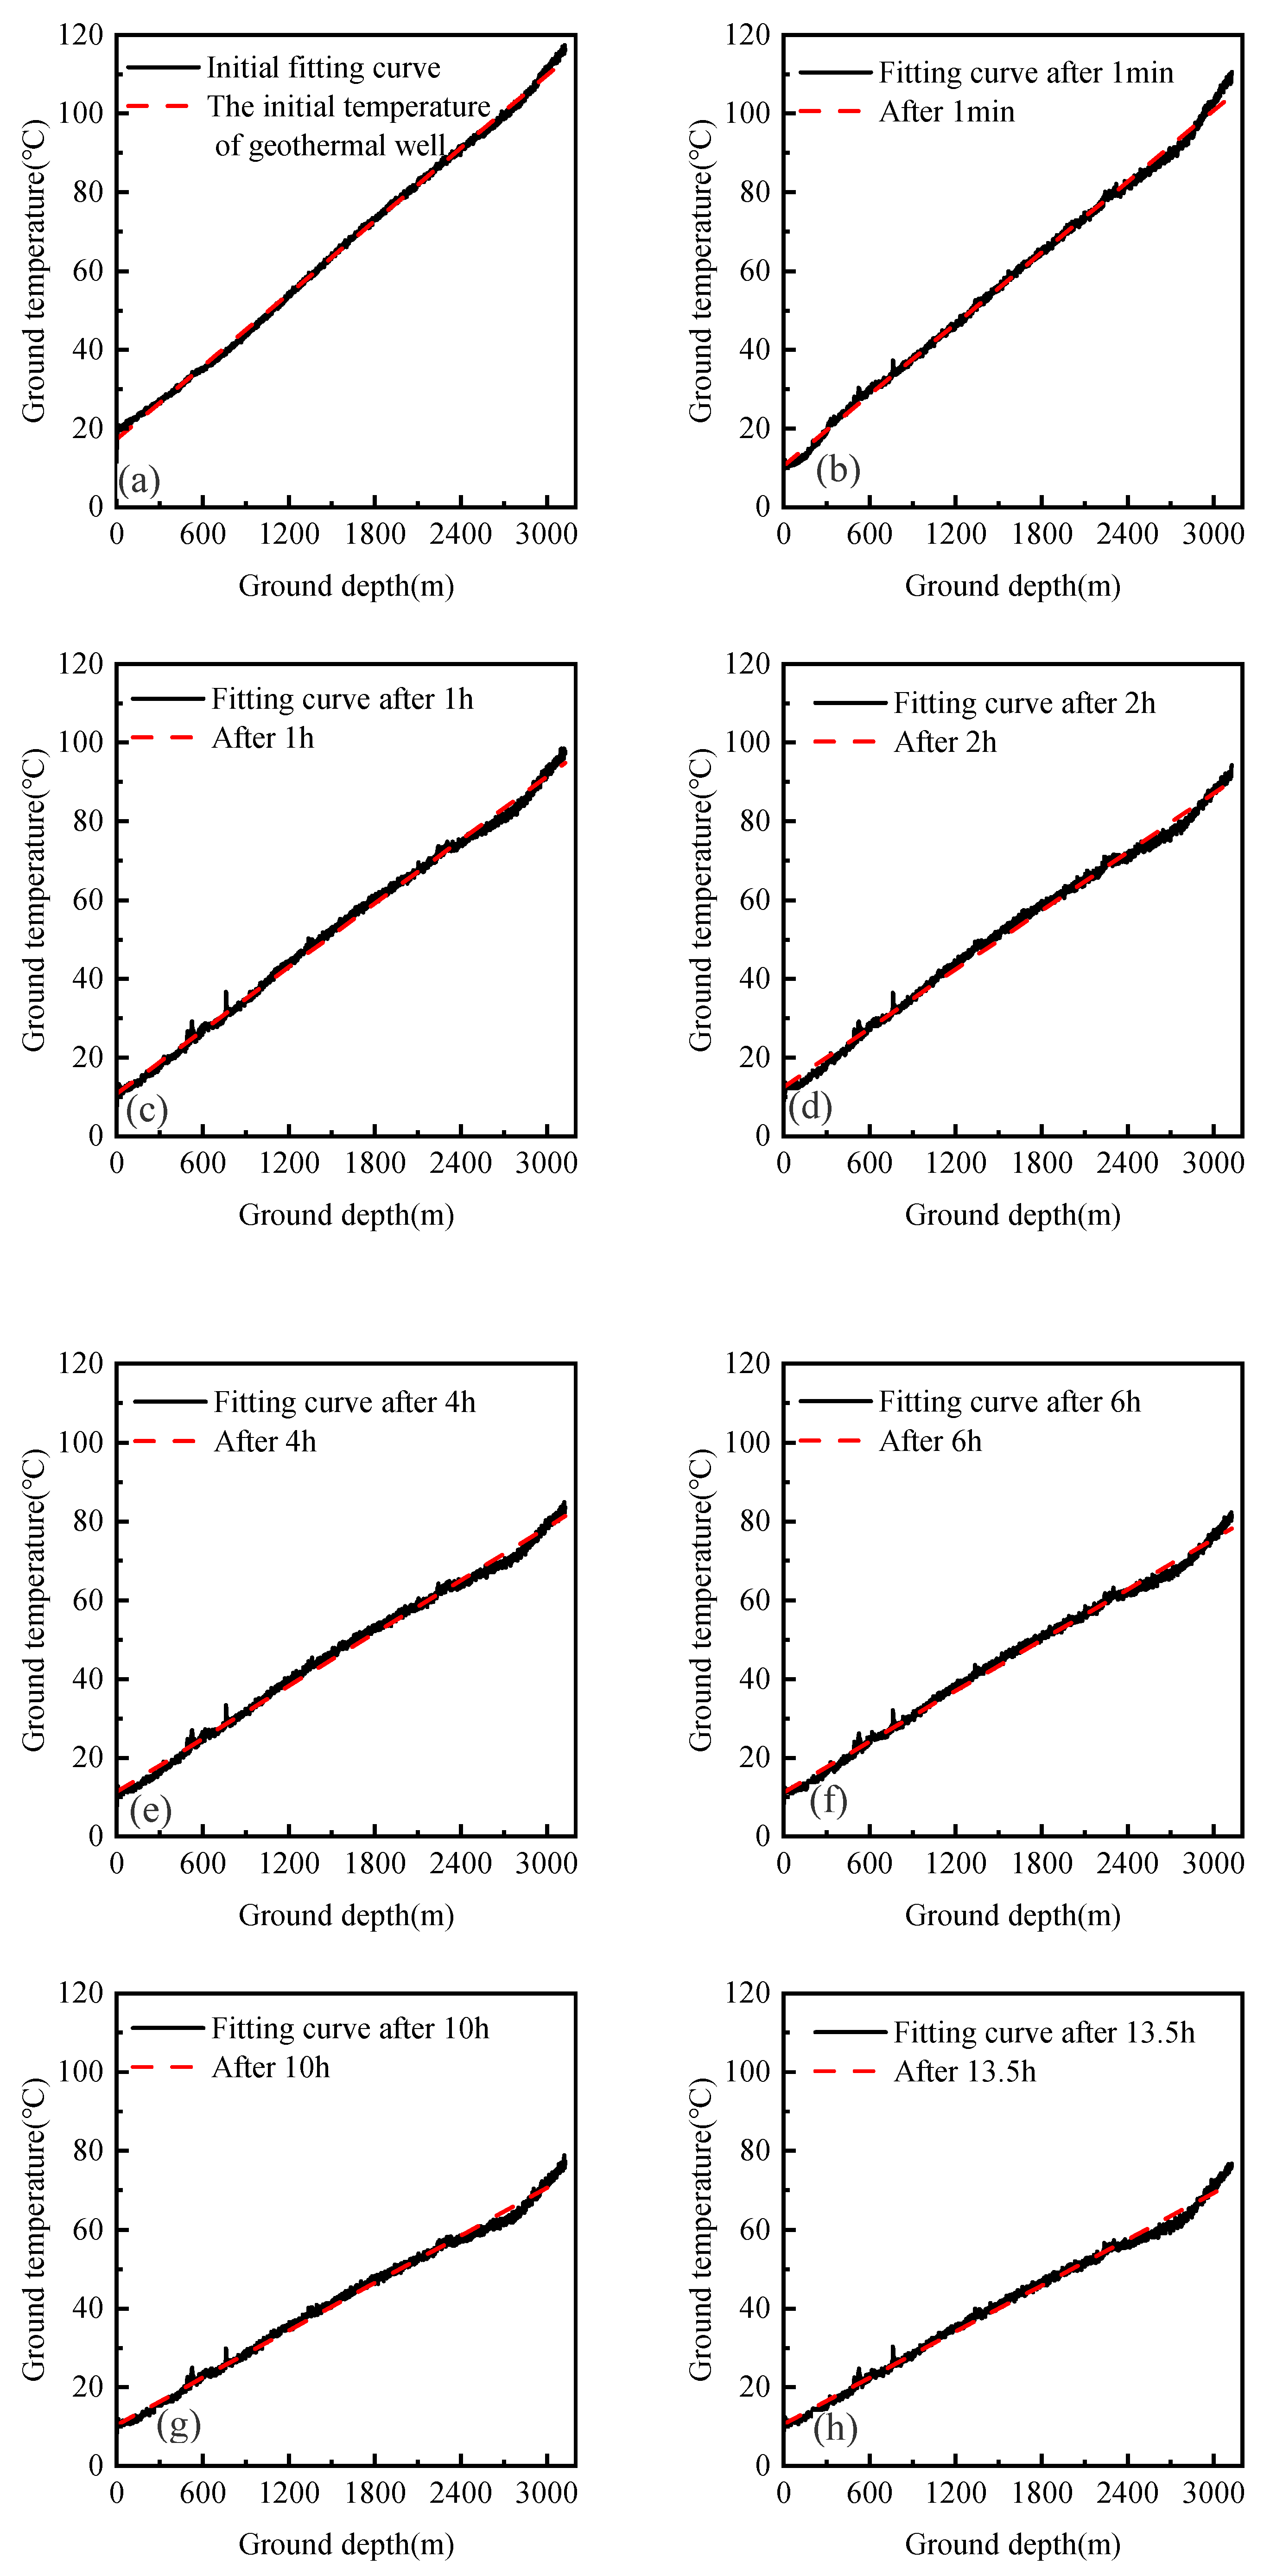
With an inlet water temperature of 9 °C and a flow rate of 30 m3/h, the field test was conducted for investigating the temperature evolution of surrounding rock layers induced by geothermal well heat exchange. According to DTS monitoring results, the temperature–depth profiles at different time intervals during the test are displayed in Figure 7 Overall, the formation temperature consistently exhibited a highly linear increase with depth under heat extraction conditions. Consequently, linear fitting was applied to derive regression lines for each temperature–depth curve at respective time points (Figure 7). It was found that the geothermal gradient progressively decreased with extended heat extraction time, declining from an initial 3.1 °C/hm to the final 1.9 °C/hm (a reduction factor of 1.63). This reduction is primarily attributed to thermal depletion effects from heat extraction. Elevated temperatures at greater depths accelerate thermal dissipation rates, resulting in faster temperature decline in deep formations compared to shallow strata. Beyond 10 h of operation, the geothermal gradient stabilized at approximately 1.9 °C/hm. It is noted that the average country rock temperature decreased, respectively, by 7.9 °C/h at test initiation, 4.7 °C/h after 1 h, 1.4 °C/h after 2 h, 2.4 °C/h after 4 h, 0.8 °C/h after 6 h, 0.7 °C/h after 10 h, and 0.25 °C/h after 13.5 h. Significant temperature variations occurred during initial operation, but the country rock temperature adjacent to the wellbore stabilized after 10–13.5 h. This suggests that the thermal exchange process between the wellbore and country rock essentially reached steady state after experiencing 10 h operation.
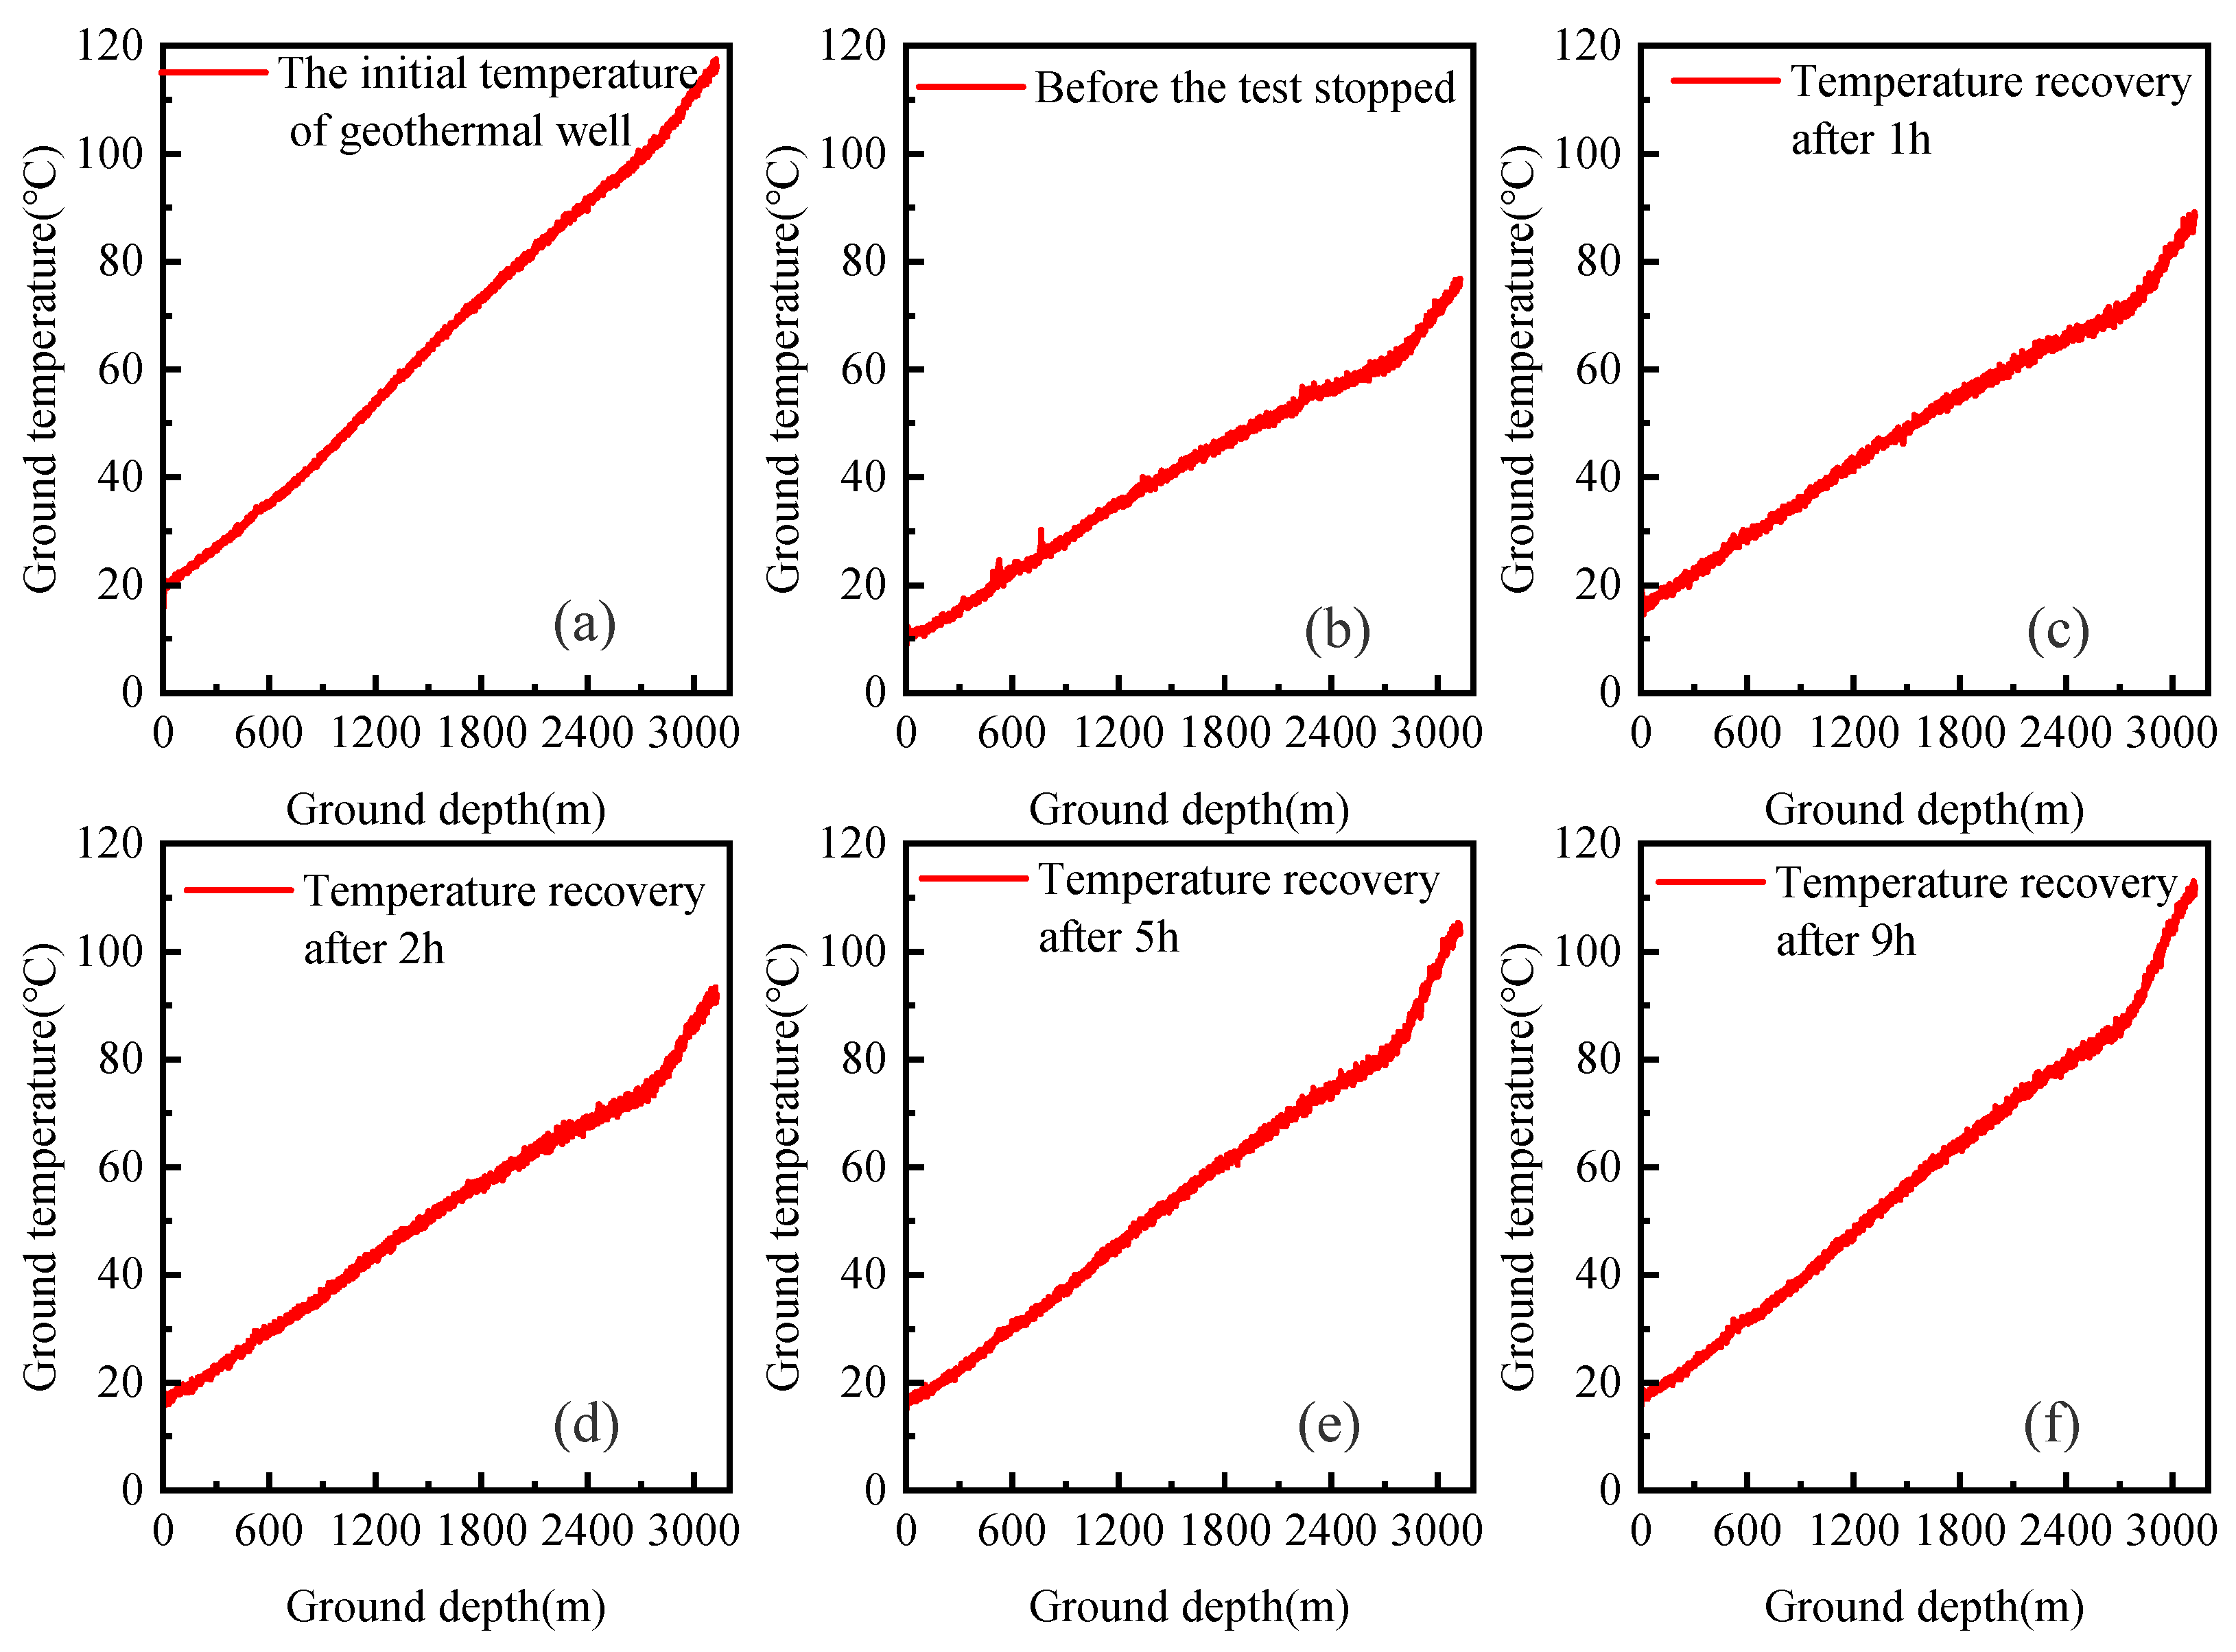
To test temperature recovery capacity of the surrounding ground, the DTS monitoring system continued to be used to monitor the ground temperature at different time intervals after the heat exchange test. The monitoring results are shown in Figure 8. After the test was stopped, the average temperature recovery rate was 8.25 °C/h after 1 h, 1.73 °C/h after 3 h, 1.28 °C/h after 5 h, and 0.85 °C/h after 9 h, with the recovery rate gradually decreasing over time. However, throughout the entire monitoring period, the recovered ground temperature still showed a significant gap compared to the initial ground temperature, which means that temperature recovery of surrounding rock after geothermal well heat exchange belongs to a slow process.
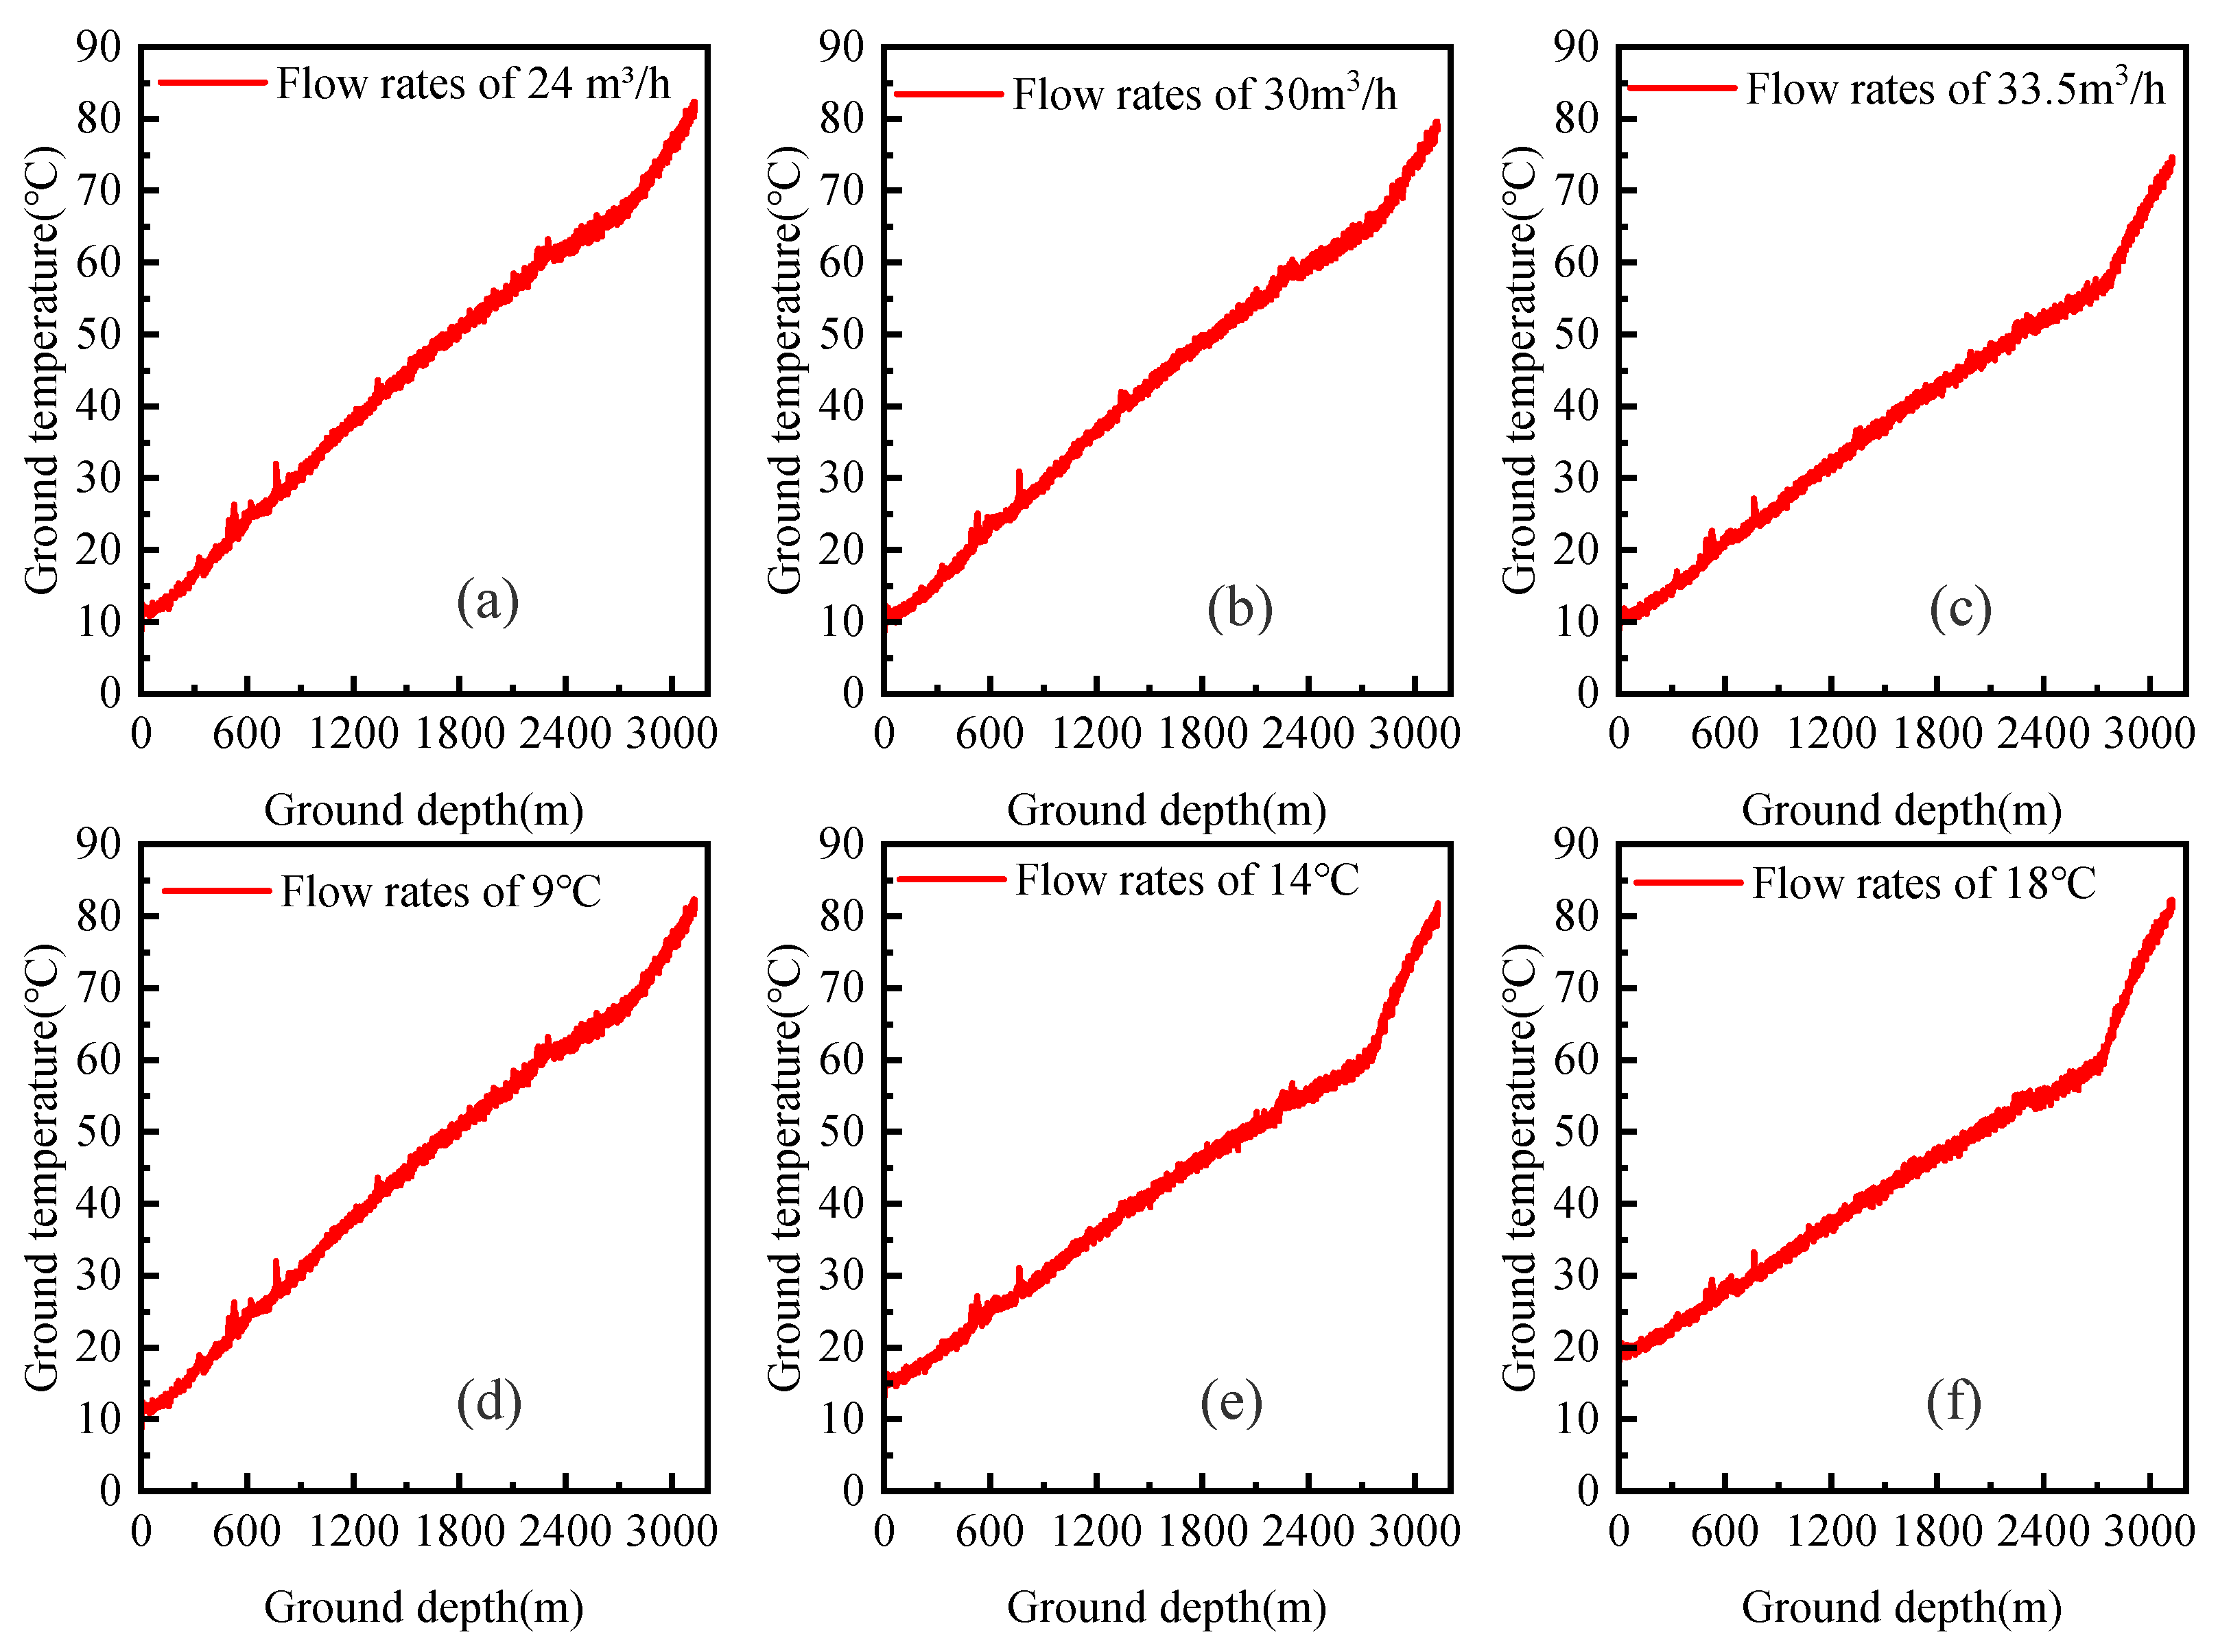
Additionally, based on DTS monitoring results of near-wellbore ground temperature during the 8 h heat exchange test conducted, the ground temperature–burial depth curves under variable inlet water temperature and flow rate conditions were obtained for flow rates of 24 m3/h, 30 m3/h, and 33.5 m3/h (Figure 9a–c), as well as for inlet water temperatures of 9 °C, 14 °C, and 18 °C (Figure 9d–f). When the inlet water temperature was maintained at 9 °C, a lower flow rate resulted in higher near-wellbore ground temperatures. When the flow rate increased from 24 m3/h to 30 m3/h, the average wellbore temperature decreased by 1.7 °C. Further increasing the flow rate from 30 m3/h to 33.5 m3/h led to a more significant temperature reduction of 4.7 °C, which was a more pronounced effect compared to the previous change.
The ground temperature–burial depth curves from the heat exchange tests with different inlet temperatures indicate that for the first 8 h of heat exchange, the ground temperature at depths above 1000 m follows the same variation trend as the inlet temperature. However, at depths between 1000 m and 3150 m, the ground temperature with an inlet temperature of 9 °C is higher than that with 14 °C and 18 °C inlets. As shown in the ground temperature recovery curves in Figure 8, the ground temperature had not fully recovered even 9 h after the test was completed, which suggests that the ground temperature recovery after deep-well heat exchange exhibits a significant time-lag effect. It is noted that the heat exchange tests at 14 °C and 18 °C inlet water temperatures were conducted on the 4th and 5th days during the system operation, respectively, following the 9 °C inlet water temperature test. During these two sets of experiments (14 °C and 18 °C), the ground temperature environment exhibited a certain degree of attenuation characteristics due to this time-lag effect in ground temperature recovery. Further, the ground temperature recovery efficiency within the depth range of 1000 m to 3150 m was significantly poor compared to that of the depth below 1000 m. Therefore, as operational days increase, the inefficient effect of ground temperature recovery in the deep zone of the geothermal well deserves attention regarding its impact on the heat extraction efficiency of the overall well.
It is noted that the test site is located within the corporate facility, and the test start time is very close to the winter heating period for the building complex. The whole test period was significantly compressed. As a result, each test group could be conducted only one time, making it impossible to calculate the standard deviation and to evaluate data dispersion through repeated tests. However, through longitudinal comparisons of multiple tests at different temperatures and flow rates, the experimental results exhibit strong regularity, which indirectly validates the reliability of the data.

5. Conclusions

(1)
Full-scale field heat exchange tests, incorporating an integrated electronic monitoring system and a high-resolution DTS system, are proven to effectively monitor the heat exchange process of deep geothermal wells in real time and its temperature impact on the near-wellbore formation. The integrated electronic monitoring system was implemented in the application project, enabling simultaneous measurement of inlet/outlet water temperature, flow rate, pressure, and other parameters. In addition, a high-resolution DTS system, is adopted for continuously monitoring the temperature response for near-wellbore formation in real-time. The integrated monitoring system for deep geothermal wells constructed in this study adopts multi-parameter and multi-dimensional features and can effectively reveal the coupled heat transfer behavior among the inner tube, outer tube, and near-wellbore formation.
(2)
During the entire operation of deep geothermal wells, the outlet temperature of circulating water after heat exchange with the underground formation exhibits a fluctuating phase before stabilization. It is specifically manifested as increasing significantly within a short period during the initial operation phase, followed by gradually declining and stabilizing. In addition, higher flow rates increase the heat exchanger’s heat transfer capacity. And the outlet water temperature is not inversely proportional to the flow rate. This is due to the fact that it simultaneously reduces the duration of thermal interference from the fluid inside the inner tube.
(3)
For coaxial casing deep geothermal wells, the inlet water temperature has a minimal impact on the outlet temperature. However, the heat transfer capacity continuously decreases as the inlet water temperature rises. And the geothermal gradient causes the temperature gap between the outer pipe and the near-wellbore formation to gradually increase with depth. The heat transfer rate at the deeper part of the well is higher than that at the shallower part. Furthermore, as heat exchange duration extends, the geothermal gradient of the near-wellbore formation progressively declines.

Author Contributions

Conceptualization, Y.S. and C.T.; Methodology, Y.S., Q.W. and Y.W.; Validation, Q.W., H.A., Y.L. and X.L.; Formal analysis, Y.S., Q.W., H.A. and C.T.; Investigation, Y.S. and Y.W.; Writing—original draft, Y.S.; Writing—review and editing, Y.S. All authors have read and agreed to the published version of the manuscript.

Funding

This project was supported by the Key Research and Development Program of Shaanxi (Program No. 2024PT-ZCK-70), Science and Technology Innovation Fund Project of China Coal Science and Technology Xi’an Research Institute (Group) Co., Ltd. (2023XAYJS21), and Science and Technology Innovation and Entrepreneurship Fund Special Project of Tiandi Science and Technology Co., Ltd. (2023-2-TD-ZD021).

Institutional Review Board Statement

Not applicable.

Informed Consent Statement

Not applicable.

Data Availability Statement

The original contributions presented in this study are included in the article. Further inquiries can be directed to the corresponding authors.

Acknowledgments

We would like to thank the anonymous reviewers for their time and effort devoted to improving the quality of this research.

Conflicts of Interest

Authors Yuliang Sun, Qilong Wang, Yijie Wang, Hongtao An, and Yanzi Lei are employed by the company Xi’an Coal Technology Geothermal Energy Development Co., Ltd. and CCTEG Xi’an Re-search Institute (Group) Co., Ltd. The remaining authors declare that the research was conducted in the absence of any commercial or financial relationships that could be construed as a potential conflict of interest. The authors also declare that this study received funding from China Coal Science and Technology Xi’an Research Institute (Group) Co., Ltd. and Tiandi Science and Technology Co., Ltd. The funder was not involved in the study design, collection, analysis, interpretation of data, the writing of this article, or the decision to submit it for publication.

References

  1. Anderson, A.; Rezaie, B. Geothermal Technology: Trends and Potential Role in a Sustainable Future. Appl. Energy 2019, 248, 18–34. [Google Scholar] [CrossRef]
  2. Cheng, W.L.; Li, T.T.; Nian, Y.L. Studies on geothermal power generation using abandoned oil wells. Energy 2013, 59, 248–254. [Google Scholar] [CrossRef]
  3. Nejat, P.; Jomehzadeh, F.; Taheri, M.M.; Gohari, M.; Majid, M.Z.A. A global review of energy consumption, CO2 emissions and policy in the residential sector (with an overview of the top ten CO2 emitting countries). Renew. Sustain. Energy Rev. 2015, 43, 843–862. [Google Scholar] [CrossRef]
  4. Khapre, A. Utilizing the greenhouse effect as a source to produce renewable energy. Encycl. Renew. Sustain. Mater. 2020, 3, 835–843. [Google Scholar]
  5. Yau, Y.H.; Hasbi, S. A review of climate change impacts on commercial buildings and their technical services in the tropics. Renew. Sustain. Energy Rev. 2013, 18, 430–441. [Google Scholar] [CrossRef]
  6. Mostafaeipour, A.; Jadidi, M.; Mohammadi, K.; Sedaghat, A. An analysis of wind energy potential and economic evaluation in Zahedan, Iran. Renew. Sustain. Energy Rev. 2014, 30, 641–650. [Google Scholar] [CrossRef]
  7. Roetzel, A.; Tsangrassoulis, A. Impact of climate change on comfort and energy performance in offices. Build. Environ. 2012, 57, 349–361. [Google Scholar] [CrossRef]
  8. Lund, J.W.; Toth, A.N. Direct utilization of geothermal energy 2020 worldwide review. Geothermics 2021, 97, 3382–3393. [Google Scholar] [CrossRef]
  9. Falcone, G. Assessment of deep geothermal energy exploitation methods: The need for novel single-well solutions. Energy 2018, 160, 54–63. [Google Scholar] [CrossRef]
  10. Dijkshoorn, L.; Speer, S.; Pechnig, R. Measurements and Design Calculations for a Deep Coaxial Borehole Heat Exchanger in Aachen, Germany. Int. J. Geophys. 2013, 2013, 916541. [Google Scholar] [CrossRef]
  11. Faizal, M.; Bouazza, A.; Singh, R.M. Heat transfer enhancement of geothermal energy piles. Renew. Sustain. Energy Rev. 2016, 57, 16–33. [Google Scholar] [CrossRef]
  12. Al-Khoury, R.; Bonnier, P.G.; Brinkgreve, R.B.J. Efficient finite element formulation for geothermal heating systems. Part I: Steady state. Int. J. Numer. Methods Eng. 2005, 63, 988–1013. [Google Scholar] [CrossRef]
  13. Beier, R.A. Thermal Response Tests on Deep Borehole Heat Exchangers with Geothermal Gradient. Appl. Therm. Eng. 2020, 178, 115447. [Google Scholar] [CrossRef]
  14. Fang, L.; Diao, N.; Shao, Z.; Zhu, K.; Fang, Z. A Computationally Efficient Numerical Model for Heat Transfer Simulation of Deep Borehole Heat Exchangers. Energy Build. 2018, 167, 79–88. [Google Scholar] [CrossRef]
  15. Huang, Y.; Zhang, Y.; Xie, Y.; Zhang, Y.; Gao, X.; Ma, J. Field Test and Numerical Investigation on Deep Coaxial Borehole Heat Exchanger Based on Distributed Optical Fiber Temperature Sensor. Energy 2020, 210, 118643. [Google Scholar] [CrossRef]
  16. Lou, Y.C.; Liu, G.K.; Romagnoli, A.; Ji, D.X. TEG-ORC combined cycle for geothermal source with coaxial casing well. Appl. Therm. Eng. 2023, 226, 120223. [Google Scholar] [CrossRef]
  17. Kong, X.; Deng, Y.; Li, L.; Gong, W.; Cao, S. Experimental and numerical study on thermal performance of ground source heat pump with a set of designed buried pipes. Appl. Therm. Eng. 2017, 114, 110–117. [Google Scholar] [CrossRef]
  18. Zanchini, E.; Lazzari, S.; Priarone, A. Improving the thermal performance of coaxial borehole heat exchangers. Energy 2010, 35, 657–666. [Google Scholar] [CrossRef]
  19. Du, D.S.; Li, Y.Q.; Wang, K.P.; Zhao, Y.Z.; Hu, Z.Y.; Zhang, W.D.; Wang, Q.L. Experimental and numerical simulation research on heat transfer performance of coaxial casing heat exchanger in 3500m-deep geothermal well in Weihe Basin. Geothermics 2023, 109, 102658. [Google Scholar] [CrossRef]
  20. Liu, J.; Wang, F.; Cai, W. Numerical study on the effects of design parameters on the heat transfer performance of coaxial deep borehole heat exchanger. Int. J. Energy Res. 2019, 43, 6337–6352. [Google Scholar] [CrossRef]
  21. Beier, R.A.; Acuña, J.; Mogensen, P.; Palm, B. Transient heat transfer in a coaxial borehole heat exchanger. Geothermics 2014, 51, 470–482. [Google Scholar] [CrossRef]
  22. Cai, W.; Wang, F.; Jiang, J. Long-term performance evaluation and economic analysis for deep borehole heat exchanger heating system in Weihe Basin. Front. Earth Sci. 2022, 10, 806416. [Google Scholar] [CrossRef]
  23. Zhou, W.J.; Su, H.H.; Liu, H.; Zhang, Y.; Qiu, N.; Gao, B. Leakage and rotordynamic performance of a semi-y labyrinth seal structure for centrifugal pump based on multifrequency whirl method. J. Eng. Gas Turbines Power 2025, 147, 101022. [Google Scholar] [CrossRef]
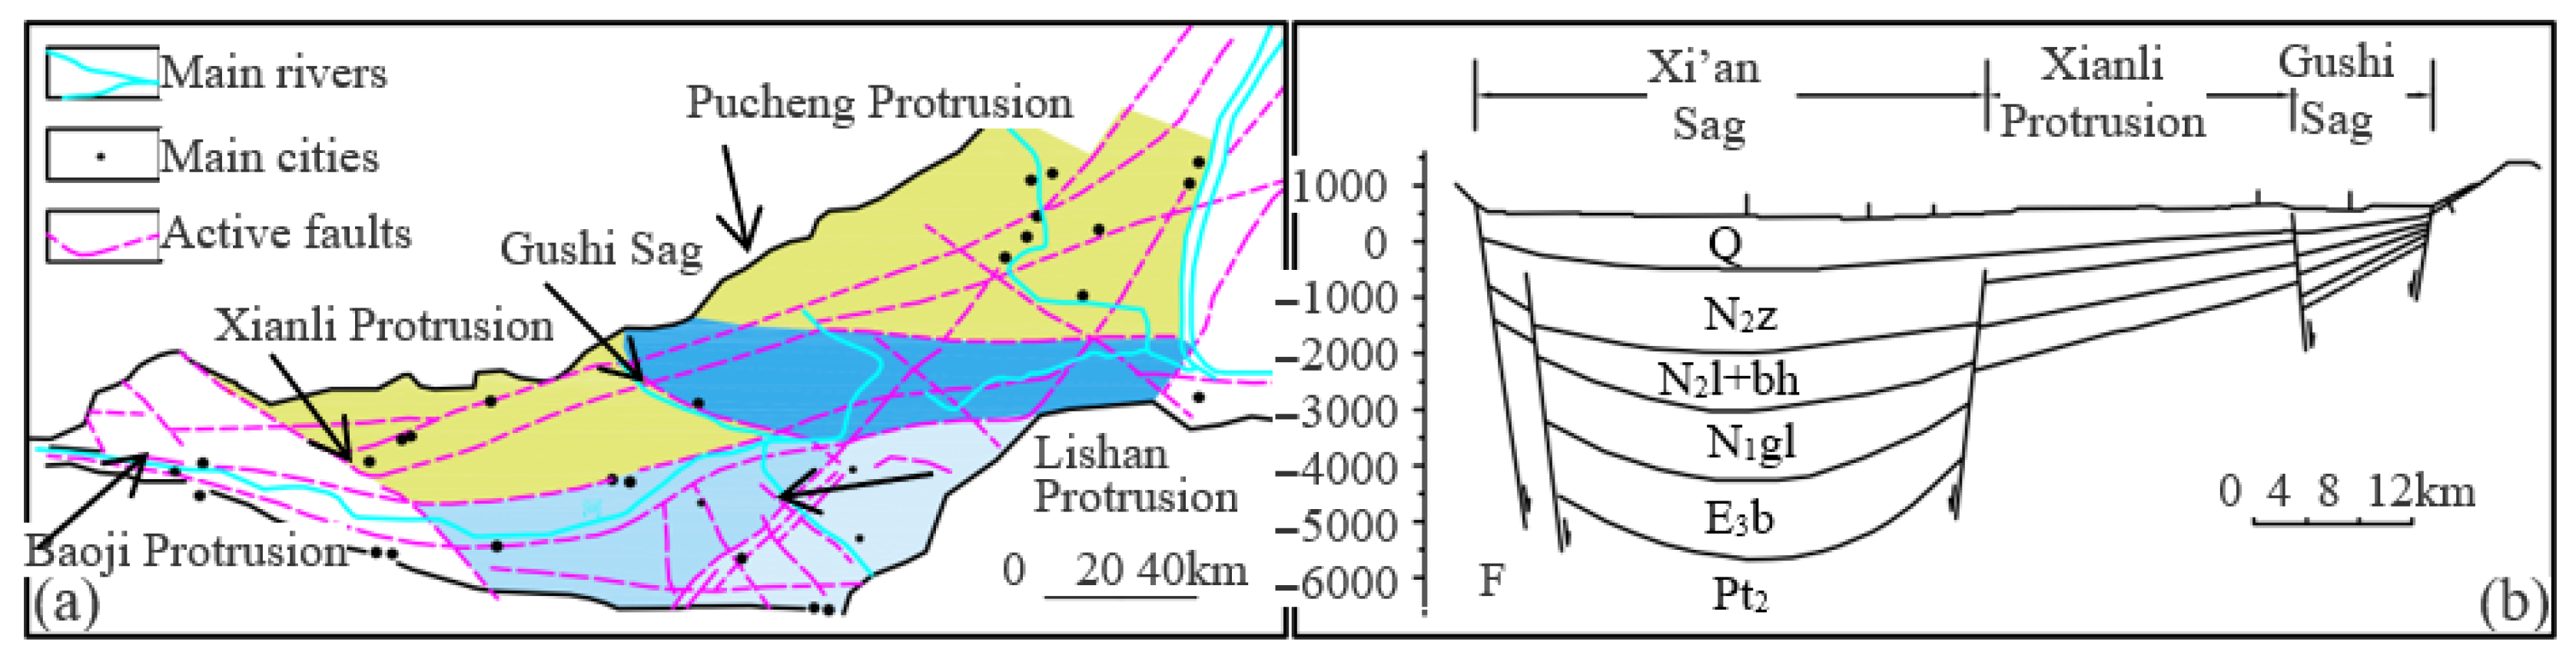
Figure 1. Tectonic architecture of the Guanzhong Basin: (a) geographical position of geothermal well; (b) north–south structural cross-section of the Guanzhong Basin.
Sustainability 18 01038 g001
Figure 2. (a) Experimental system for coaxial casing deep geothermal resource extraction; (b) main Equipment; (c) data acquisition system and fiber optic modem; (d) monitoring equipment and instruments.
Sustainability 18 01038 g002
Figure 3. (a) Cross-sectional view of coaxial casing heat exchanger (b) inner tube structure. (c) Cross-sectional view of protection structure for fiber optic cables. (d) Cross-sectional view of protection structure for temperature sensing fiber.
Sustainability 18 01038 g003
Figure 4. Outlet temperature variation curve with flow rate of (a) 24 m3/h; (b) 30 m3/h; (c) 33.5 m3/h. (d) Single-well heat exchange capacity with different flow rate.
Sustainability 18 01038 g004
Figure 5. Outlet temperature variation curve with (a) inlet temperature of 9 °C; (b) inlet temperature of 14 °C; (c) inlet temperature of 18 °C. (d) Single-well heat exchange capacity with different inlet temperature.
Sustainability 18 01038 g005
Figure 6. Ground temperature profile measured by DTS monitoring system.
Sustainability 18 01038 g006
Figure 7. Temperature profiles of near-wellbore formation rock versus depth under heat exchange duration. (a) at beginning time; (b) after 1 min; (c) after 1 h; (d) after 2 h; (e) after 4 h; (f) after 6 h; (g) after 10 h; (h) after 13.5 h.
Sustainability 18 01038 g007
Figure 8. (a) The initial temperature of geothermal well; (b) The temperature curve before the test stopped; Temperature recovery curve after the completion of the geothermal well heat exchange test for (c) 1 h; (d) 2 h; (e) 5 h; (f) 9 h.
Sustainability 18 01038 g008
Figure 9. Temperature variation curve for near-wellbore formation. (a) With flow rate of 24 m3/h; (b) with flow rate of 30 m3/h; (c) with flow rate of 33.5 m3/h; (d) with inlet temperature of 9 °C; (e) with inlet temperature of 14 °C; (f) with inlet temperature of 18 °C.
Sustainability 18 01038 g009
Table 1. Detailed specifications of the various electronic sensors.
No.Sensor TypeNumber of DevicesTechnical Parameters
Operating PressureNominal DiameterOutput SignalMeasuring RangeOperating Temperature
1Flow sensor24.0 MPa125 mm
2Temperature sensor44.0 MPa 4–20 mA0–200 °C
3Pressure sensor4 4–20 mA0–4.0 MPa0–100 °C
Table 2. Measured outlet temperatures at typical moments under different inlet water temperature conditions.
Inlet Water
Temperature/°C
Operating Time/MinAverage Value
300500600715805825
9 °C34.732.83231.531.13132.18
14 °C35.433.733.332.732.531.933.25
18 °C35.734.43433.333.132.533.83
OTG between 14 °C and 9 °C0.70.91.31.21.40.91.06
OTG between 18 °C and 14 °C0.30.70.70.60.60.60.58
Note: OTG means the outlet temperature gap.
Disclaimer/Publisher’s Note: The statements, opinions and data contained in all publications are solely those of the individual author(s) and contributor(s) and not of MDPI and/or the editor(s). MDPI and/or the editor(s) disclaim responsibility for any injury to people or property resulting from any ideas, methods, instructions or products referred to in the content.