1. Introduction
Fresh fishery products move from capture sites to markets through multiple types of activities, ranging from aggregation, sorting and pre-delivery handling, product preservation, transportation, and product transformation to linkage with end buyers. The continuity of this flow depends not only on the number of actors within a channel, but also on where the necessary activities occur and which actor groups perform them. Analysis of fishery-product supply chains should therefore jointly consider both the structure of product flows and where the activities that enable those flows occur, particularly in seafood systems, where products are highly perishable and require multiple stages of handling before reaching the market [
1,
2,
3].
The concept of supply chain management views a supply chain as a system of processes, flows, and interorganizational coordination rather than merely a sequence of transactions or product movements. Lambert et al. (1998) [
4] emphasize the processes that connect actors from upstream to downstream, whereas Mentzer et al. (2001) [
5] focus on the coordination of business functions both within and across organizations. At the network level, analysis of supply-chain networks further indicates that the structural and functional characteristics of their components should be considered jointly [
6]. From this perspective, descriptions of supply-chain structure should encompass actor sequences, collection and transfer points, product-transformation points, product forms, and destination markets, rather than considering only the number of intermediaries or channel length.
The limitations of describing supply chains solely in terms of actor sequences are particularly evident in the case of midstream actors, such as collectors, wholesalers, logistics providers, and processors. The literature on the “hidden middle” indicates that these actors connect small-scale producers with markets through multiple activities, including volume aggregation, wholesaling, logistics, processing, and coordination of market requirements [
7,
8]. At the network level, actor positions and the roles they perform can be regarded as related dimensions that do not necessarily correspond on a one-to-one basis [
9]. Accordingly, labels such as “collector” or “wholesaler” reflect only part of an actor’s position and do not necessarily capture the functional scope actually performed. This distinction provides a basis for examining whether actor labels and route positions adequately reflect functional scope within seafood supply chains.
Evidence from fisheries supply-chain studies supports the importance of jointly considering the roles of actors at multiple levels. Studies drawing on data from fishers, wholesalers, retailers, restaurants, and downstream actors have helped reveal flow sequences, transfer points, and differences in roles among the actors involved that may not be fully captured by data from a single actor group [
10]. Fisheries value-chain mapping that links actor types with activities has also been proposed as a basis for understanding the system before undertaking more detailed assessments [
11], while trade-network analyses of fishery products have shown that actor positions and relationships can reveal distribution structures that may not be apparent from a linear view of channels [
12]. Similarly, studies of the distribution of returns in small-scale fisheries have shown that actor positions, product forms, and activities associated with transfer or processing are interrelated in complex ways; consequently, price margins, the number of intermediaries, or channel length should not be interpreted as direct proxies for returns or efficiency [
13]. Evidence from the blue swimming crab chain in Indonesia likewise demonstrates linkages among fishers, collectors, and processing operations, suggesting that the functional scope of midstream actors may extend beyond simply purchasing and transferring products [
14].
Based on this evidence, the key issue is not only which actors products pass through, but also which actors perform the activities that enable such flows. A route with fewer actors may still require basic activities similar to those required in a route with more actors if those activities are performed by different actor types. Conversely, actors occupying similar positions may have different functional scopes across routes characterized by different transfer points, product forms, or destination markets. The structural characteristics of routes and patterns of functional distribution are therefore related dimensions that need to be examined jointly.
Although the previous literature has generated substantial knowledge on supply-chain structures, post-harvest activities, and the roles of midstream actors, these dimensions have often been examined separately according to the objectives of individual studies. Research on supply-chain structure typically focuses on tracing actors, product flows, transfer routes, and market linkages [
4,
5,
6,
10,
11,
12], whereas studies of post-harvest handling emphasize product-related activities such as sorting, preservation, handling, transportation, and processing [
1,
2,
3,
11]. Research on midstream actors, meanwhile, highlights the roles of collectors, wholesalers, logistics providers, processors, and other actors positioned between producers and downstream markets in aggregation, coordination, logistics, and market connection [
7,
8,
14]. This separation creates an analytical gap: it remains difficult to determine whether differences in route structure correspond to differences in where activities are performed and whether actor labels adequately reflect functional scope. The gap is therefore not the absence of value-chain mapping, but the lack of systematic linkage between route structure and activity location across multiple route configurations.
This study addresses this gap by linking supply-chain route structures with functional activity allocation in a multi-route seafood case. The contribution is not to propose functional activity allocation as a new general theory, standardized metric, or performance-assessment model. Rather, the study operationalizes it as a middle-range analytical construct that connects route-level mapping with activity-level mapping. This allows the analysis to distinguish the structural question of which actors, transfer points, product forms, and destination markets are involved from the functional question of which actor groups perform the activities that enable product flow.
Bandon Bay, Surat Thani Province, Thailand, provides an appropriate context in which to examine these issues because it is a coastal fisheries area where the blue swimming crab (
Portunus pelagicus) is an important target resource for small-scale fisheries, and where previous studies have documented ecosystem changes and blue swimming crab resource management under long-term restoration measures [
15,
16]. In supply-chain terms, the local blue swimming crab system connects fishers, collectors or buying stations, intermediaries, processing plants, and downstream actors through multiple market channels. The field data in this study cover transfer routes from fishers and collectors across several districts surrounding the bay, including connections to local markets, markets outside the study area, processing plants, restaurants, online channels, and consumers. This diversity provides an opportunity to compare route structures alongside the distribution of activities across actor groups without presupposing that actor labels determine their functional scope.
To operationalize this route–activity linkage, the study classifies functional activities into five groups: (1) aggregation and product flow, (2) sorting and pre-delivery handling, (3) transportation and delivery coordination, (4) product transformation, and (5) market linkage. These groups are used to connect information on which actors and points products pass through with information on which actor groups perform the activities that enable those flows.
This study makes two main contributions. First, it provides an analytical integration of route structures and functional activity allocation by treating actor sequence, transfer points, product forms, destination markets, and activity locations as related but distinct dimensions of analysis. This framing provides a basis for examining whether actor labels and route positions adequately reflect functional scope within documented supply-chain routes. Second, empirically, the study draws on data from actors at multiple levels to describe documented product-flow routes, the functional scope of collectors, and operational constraints at collection points, product-transformation points, and actor interfaces.
These outputs support the identification of sustainability-relevant assessment points, traceability-readiness needs, and intervention-readiness issues in the chain. The study does not assess whether any route exhibits greater efficiency, quality, equity, or sustainability because these outcomes were not directly measured.
Within this scope, the study has the following objectives:
To classify Bandon Bay blue swimming crab supply-chain routes based on actor sequences, transfer points, product forms, and destination markets.
To analyze the distribution of functional activities across the actor groups represented in the identified supply-chain routes.
To describe the activities performed by collectors and the reported operational constraints at collection points, product-transformation points, and actor interfaces.
The research questions are as follows:
Research Question 1: How do Bandon Bay blue swimming crab supply-chain routes differ in terms of actor sequences, transfer points, product forms, and destination markets?
Research Question 2: Across the identified supply-chain routes, which actor groups are supported by evidence as performing aggregation and product flow, sorting and pre-delivery handling, transportation and delivery coordination, product transformation, and market linkage activities?
Research Question 3: What activities do collectors perform, and what operational constraints are reported at collection points, product-transformation points, and actor interfaces?
2. Conceptual Background and Analytical Framework
2.1. Supply-Chain Route Structures
The concept of supply chain management views a supply chain as a system of flows, processes, and relationships among actors at multiple levels, rather than merely as a sequence of transactions. Mentzer et al. (2001) [
5] emphasize the coordination of business functions both within and across firms, whereas Lambert et al. (1998) [
4] propose examining supply chains through the processes that connect actors from upstream to downstream. At the network level, Surana et al. (2005) [
6] argue that the complexity of supply-chain networks arises from the interrelated structural and functional characteristics of their components, while Hanaka et al. (2022) [
17] demonstrate that understanding supply-chain networks requires consideration of the structural positions of components that may perform multiple roles. These perspectives support distinguishing the “structure of the route” from the “functions performed along the route” as two dimensions that should be interpreted jointly.
In fisheries and seafood contexts, value-chain analysis commonly traces actors, product flows, and linkages among production, aggregation, processing, and market points to describe the structures connecting small-scale producers with different markets [
10,
18]. Acosta-Alba et al. (2022) [
11] explicitly demonstrate that fisheries value-chain mapping undertaken to support sustainability assessment requires a typology of both actors and activities, while Seung and Kim (2020) [
3] use structural path analysis in the seafood industry to show that understanding a supply chain requires tracing both upstream and downstream linkage pathways. Such analysis is particularly important when products may undergo transformation, be transferred through multiple actor types, or enter different destination markets, because focusing only on the number of intermediaries may be insufficient to explain differences in supply-chain structure.
For this study, a supply-chain route refers to a specific pathway through which products move from fishers to a destination market, whereas a supply-chain route structure refers to the configuration of elements used to identify and compare routes. Four key elements are considered jointly: (1) the actor sequence from upstream to the destination; (2) key route points, including collection points, transfer points, and product-transformation points; (3) the product form at each segment of the route; and (4) the destination market or buyer type. Considering these four elements together makes it possible to distinguish routes that may share some actors along certain segments but differ in terms of product transformation, transfer points, or product destinations. Accordingly, route structures in this study are not defined solely by the number of intermediaries or channel length.
2.2. Functional Activity Allocation
Describing actor sequences alone cannot fully reveal who performs the activities that enable products to move through the supply chain. Product handling, sorting, holding, transportation, delivery coordination, product transformation, and market linkage may be distributed across multiple actor groups. Process-oriented approaches to supply chain management therefore support analyzing activities alongside actor positions [
4,
5]. At the same time, the network literature on supply-chain systems shows that actor positions and the roles they perform are related dimensions, but do not necessarily correspond completely [
9]. The literature on midstream actors further indicates that aggregation, wholesaling, logistics, transaction coordination, and processing may be performed in combination or distributed across different actor groups depending on the system context [
7,
8,
19,
20]. These perspectives therefore support distinguishing between an actor’s position within a route and the activities that the actor actually performs.
On this basis, this study defines functional activity allocation as the empirically observed distribution of operational activities across actor groups within the identified supply-chain routes. The term is used descriptively to indicate who performs which activities and where these activities occur along the route. It does not imply formal managerial assignment, organizational design, optimization of functions, resource allocation, or a standardized performance measure.
Functional activity allocation also differs from several related terms. It differs from general activity mapping because it does not only list activities; it links activities to actor groups and route contexts. It differs from functional mapping because it does not attempt to construct a complete system-function model, but focuses on empirically supported activity locations within documented product-flow routes. It also differs from role allocation or division of labor because it does not assume formal assignment of responsibilities, labor specialization, or organizational design. In this study, functional activity allocation is therefore used as a middle-range analytical construct for linking route structures with activity locations, rather than as a theory of supply-chain organization or a measure of actor performance.
The analytical value of this construct lies in making visible the distinction between actor position and functional scope. In multi-actor seafood supply chains, actor labels and route positions may not fully reveal the operational activities performed along product-flow routes. Functional activity allocation therefore serves as a route–activity linking construct: it connects information on product-flow structures with information on the operational activities that support those flows.
This positioning is important for clarifying the contribution of the study. Functional activity allocation is not proposed as an independent theory that replaces supply-chain mapping, fisheries value-chain analysis, post-harvest handling studies, or the midstream-actor literature. Rather, it operationalizes a distinction that is often implicit in these approaches: actor labels and route positions do not necessarily reveal the functional scope of actors. The contribution of the concept in this study is therefore analytical and integrative, not theoretical in the sense of proposing a new general model.
For analytical purposes, this study classifies functional activities into five groups: (1) aggregation and product flow, (2) sorting and pre-delivery handling, (3) transportation and delivery coordination, (4) product transformation, and (5) market linkage, as shown in
Table 1. These five groups were established to cover the main operational functions required to move blue swimming crab products from capture to destination markets. Fewer categories would have merged analytically distinct functions, such as transportation and delivery coordination with market linkage, or sorting and pre-delivery handling with product transformation. Conversely, a larger number of categories would have created subdivisions that were not consistently distinguishable across all data sources. The five-group structure therefore provided a practical balance between analytical detail and cross-source comparability and served as the common basis for classifying the field data and constructing the actor–activity matrix during the analytical process.
2.3. Collectors as Midstream Functional Actors
Between upstream producers and downstream buyers or consumers are numerous midstream actors whose functions extend beyond simply buying and selling products. The literature on the “hidden middle” highlights the roles of wholesalers, collectors, logistics operators, and processors in connecting small-scale producers with markets through aggregation, product movement, product handling, transaction coordination, and processing [
7,
8]. The concept of organizational roles in supply networks further suggests that a single organization may simultaneously coordinate information, facilitate relationships, and help structure the network [
21]. More recent studies of aquatic value chains further indicate that the functional scope of midstream actors may vary according to market structure, supply systems, and trading practices [
19,
20].
In fisheries supply chains, collectors and intermediary traders may serve as links between small-scale producers and more distant markets while also supporting product aggregation, transfer, and coordination of market requirements. Analysis of fisheries supply chains is therefore more informative when it considers the roles actors actually perform rather than classifying them solely by actor labels [
10,
18,
22]. Fisheries value-chain mapping that classifies actors alongside activities [
11], together with trade-network analysis examining the positions and relationships of actors in fishery markets [
12], support an analytical approach that considers structure and function jointly without assuming that a commercial position determines a fixed set of activities.
Accordingly, this study employs the concept of midstream functional actors to characterize actors positioned between upstream and downstream based on the activities supported by available evidence, rather than defining their roles solely by commercial labels. Within this framework, a “collector” is therefore not assumed to perform a single function or a fixed set of functions; instead, the analysis examines which types of activities collectors perform across different routes.
However, the performance of multiple functions by an actor should not automatically be interpreted as evidence of greater efficiency, importance, or power. The functional scope of collectors is therefore used to describe the diversity of their operational roles, rather than to rank actor importance, value, or performance.
2.4. Integrated Analytical Framework and Interpretive Boundaries
Analyzing multi-level supply chains requires linking structural-level data with activity-level data. Value-chain analysis in fisheries supports tracing actors and relationships across different segments of the chain to understand how products and activities are interconnected [
10,
18]. Similarly, fisheries value-chain mapping that classifies both actor types and activities helps identify the components of the system before more detailed assessment is undertaken [
11]. In this study, however, the emphasis is not on assessing the economic value or sustainability performance of individual segments, but on jointly analyzing supply-chain route structures and functional activity allocation.
To clarify the analytical positioning of the framework,
Table 2 compares the present route–activity framework with related approaches in supply-chain mapping, fisheries value-chain analysis, post-harvest handling studies, the midstream-actor literature, and network-oriented supply-chain perspectives. The comparison shows that the present framework does not replace these approaches, but combines selected elements from them to address a specific analytical problem: how to describe both route structures and the distribution of operational activities across actor groups without assuming that actor labels, route length, or channel position adequately indicate functional scope.
As shown in
Table 2, the contribution of the present framework lies in the integration and operationalization of existing analytical perspectives rather than in the introduction of a separate general theory. This framing improves analytical precision in describing the Bandon Bay blue swimming crab chain by linking route-level mapping with activity-level interpretation.
The core logic of the framework is that route structures address the questions of which actors products pass through, at which points, and toward which markets, whereas functional activity allocation addresses which actor groups are supported by evidence as performing the activities that enable those flows. Joint analysis of these two dimensions is used to examine the extent to which actor positions within routes correspond to functional scope and how activity locations are distributed across actor groups. This interpretation enables comparison of routes that differ in actor sequences, transfer points, product forms, and destination markets.
Within this framework, route structures and functional activity allocation are treated as distinct dimensions of analysis. Reported operational constraints are incorporated as contextual information to support interpretation of the conditions that actors must manage at collection points, product-transformation points, and actor interfaces.
To prevent interpretation beyond the intended scope, the boundaries of each analytical dimension are defined in
Table 3.
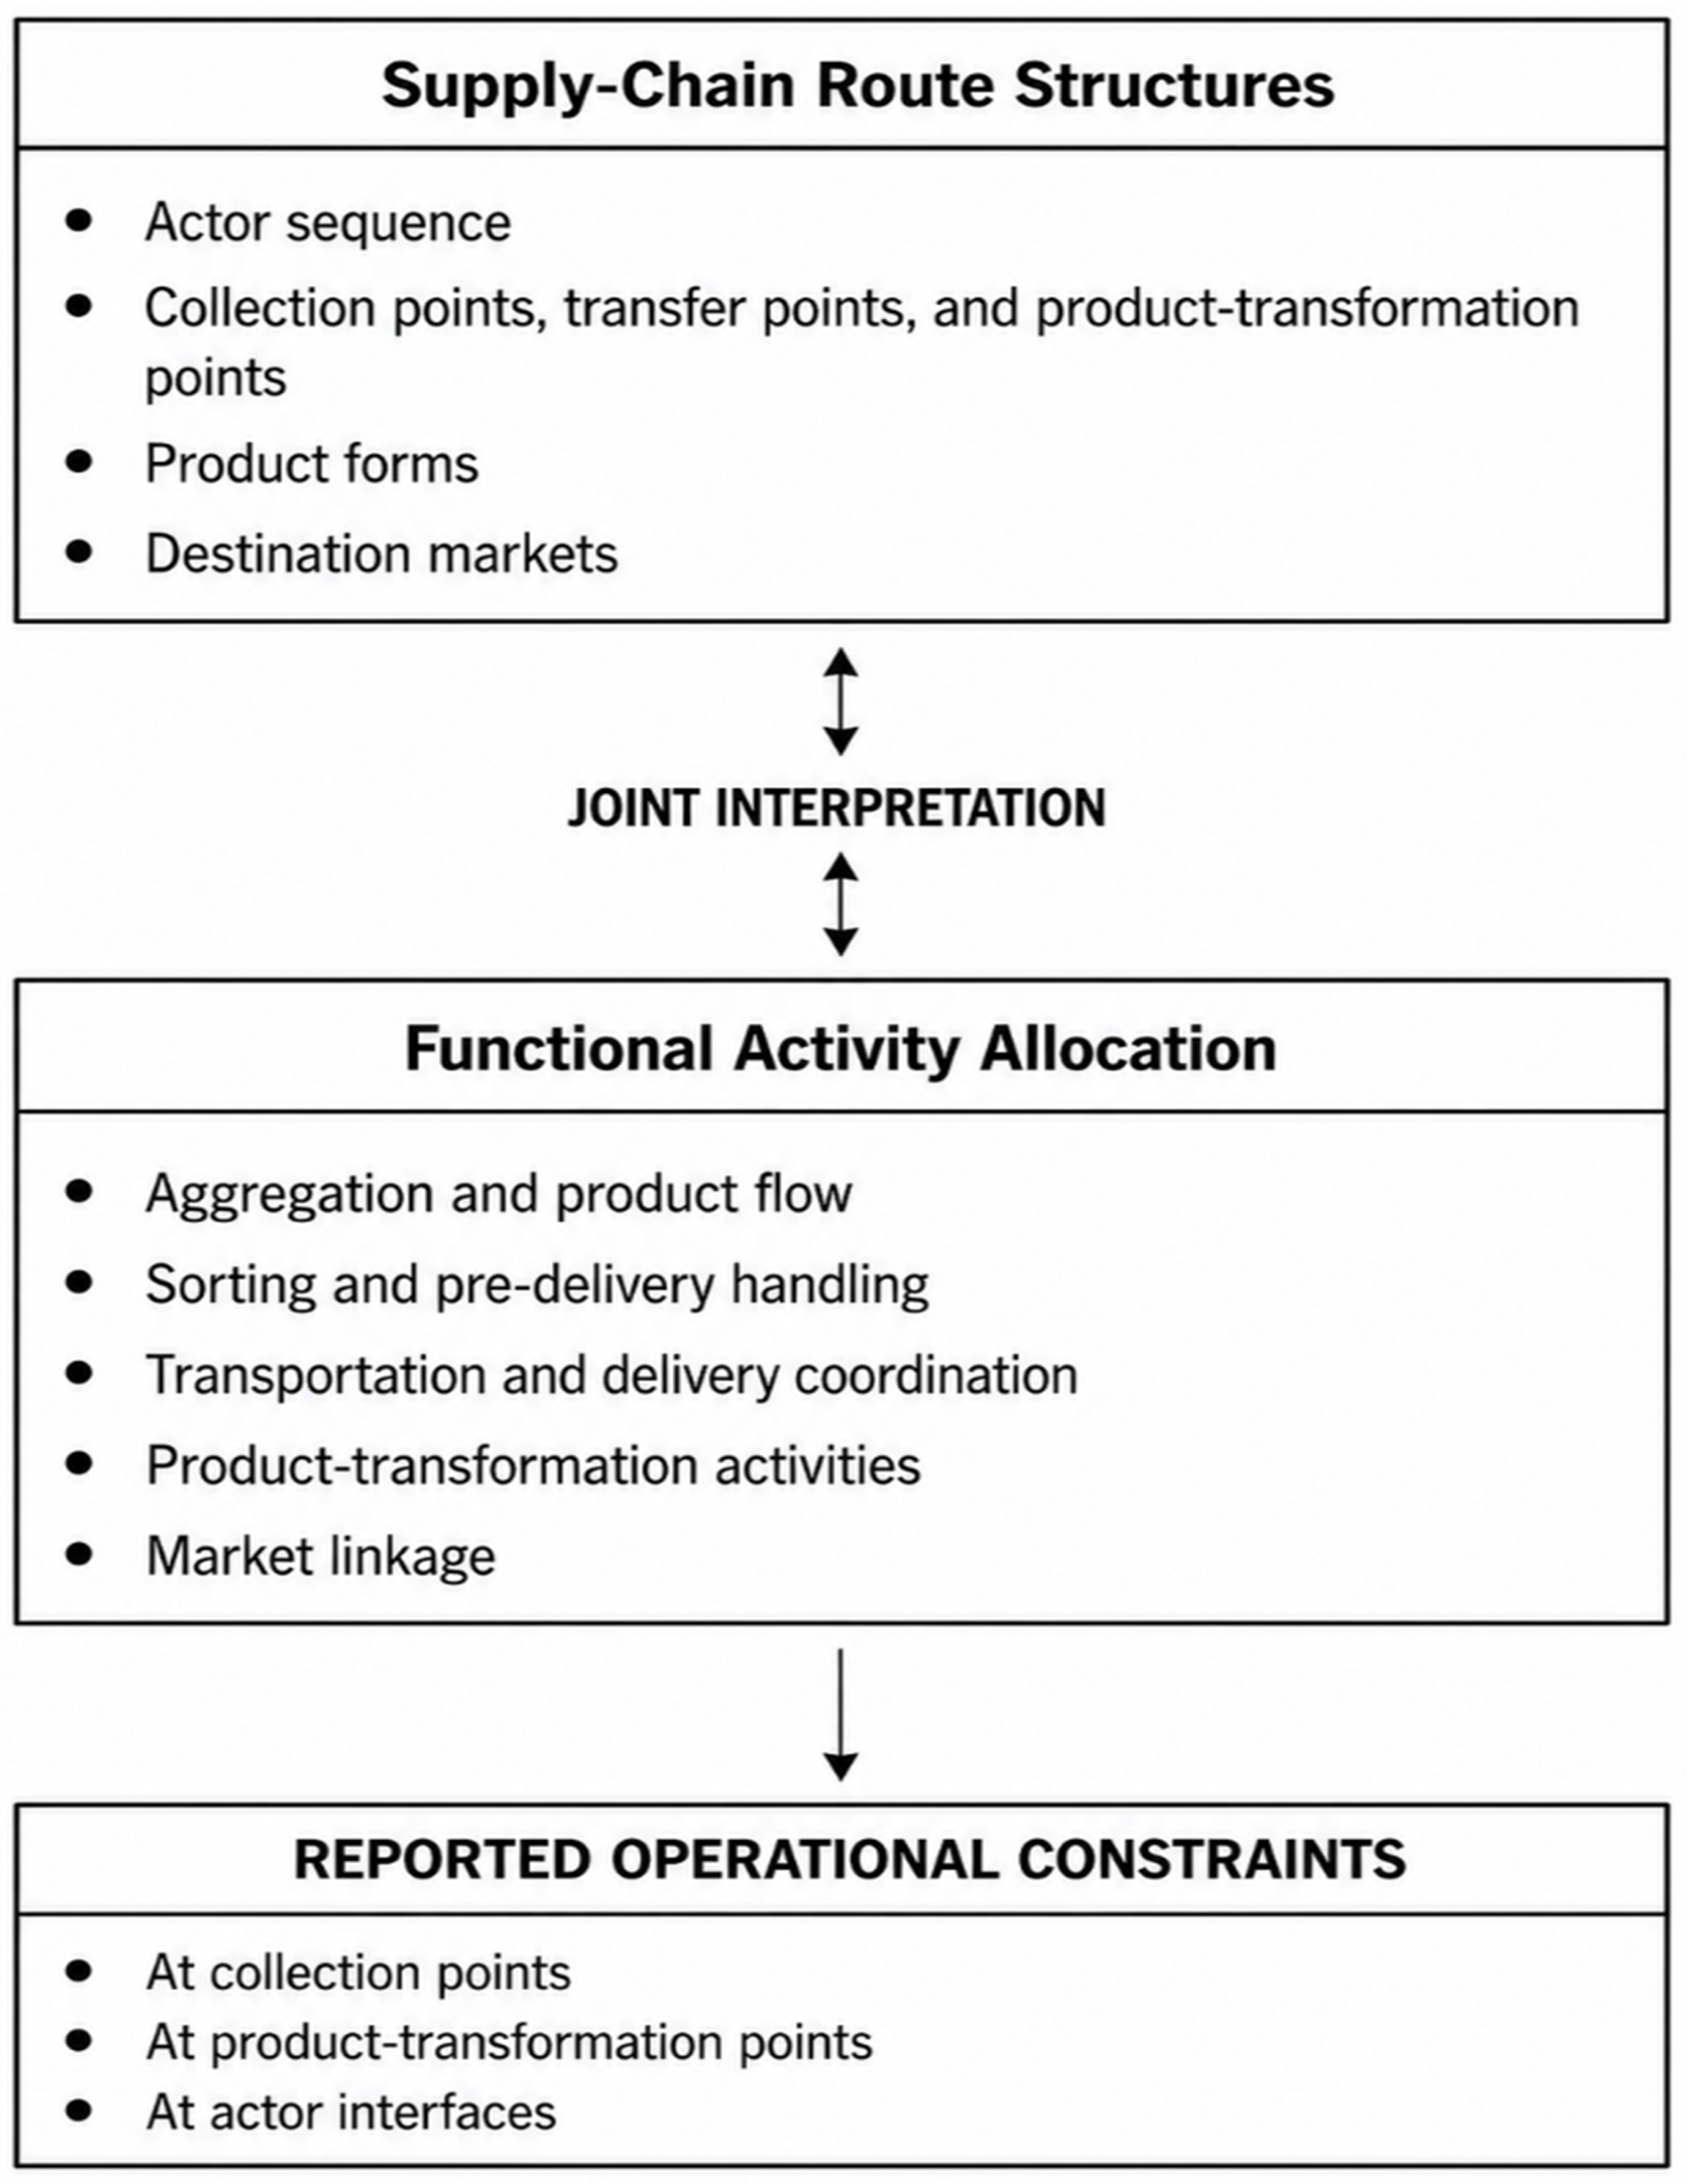
Figure 1 summarizes the relationship among the three analytical components. Supply-chain route structures and functional activity allocation are considered jointly, while reported operational constraints provide contextual information for interpreting operational points and actor interfaces.
3. Materials and Methods
3.1. Research Design
This study employed a multi-source descriptive supply-chain case study design to analyze supply-chain route structures, functional activity allocation, the roles of collectors or buying stations, and reported operational constraints in the Bandon Bay blue swimming crab chain in Surat Thani Province, Thailand. The primary unit of analysis was the supply-chain route, defined as the pathway through which products move from fishers, through different actors and operational points, to destination markets.
The study drew on household surveys, interviews, product-route tracing, field observations, small-group meetings, secondary data, and information from actors at multiple levels of the supply chain. These sources were used to construct the documented routes, classify functional activities, and interpret reported operational constraints in accordance with the analytical framework presented in
Section 2.
The analysis was descriptive and followed the analytical framework presented in
Section 2. As indicated in the framework boundaries, the study was not designed for causal testing or route ranking.
3.2. Study Area and Period
The study area encompassed coastal fishing communities and operational points associated with the blue swimming crab chain in Bandon Bay, Surat Thani Province, across seven districts: Tha Chana, Chaiya, Tha Chang, Phunphin, Mueang Surat Thani, Kanchanadit, and Don Sak. The area included fishing communities, collection points and buying stations, transfer points, product-transformation points, and routes connecting to processing plants and destination markets.
Data were collected from 1 November 2018 to 31 October 2019 and included two processing plants linked to product routes in the Phum Riang and Don Sak areas. The use of 2018–2019 field data is justified by the descriptive and historical purpose of the study. The analysis does not aim to represent the current configuration of the Bandon Bay blue swimming crab chain or to estimate present-day market shares, prices, route frequencies, or sustainability performance. Instead, the dataset is used to examine how route structures and functional activity allocation can be jointly analyzed in a documented multi-actor seafood supply chain.
Because market channels, digital platforms, logistics practices, processing arrangements, and relationships among actors may change over time, the findings are interpreted as a historical case analysis of the Bandon Bay blue swimming crab chain during the 2018–2019 fieldwork period. The study does not claim to describe the current configuration of the chain in 2026. Its value lies in demonstrating how route structures and functional activity allocation can be jointly analyzed using a multi-actor case-study dataset.
3.3. Participants and Sample Selection
The study included multiple actor groups associated with the Bandon Bay blue swimming crab chain, including fisher households, collectors or buying stations, processing plants, and downstream actors. These actor groups were included to support route tracing from upstream production through collection, product transformation, and destination markets. The participant groups and sample-selection procedures are described in the following subsections.
3.3.1. Fisher Households
The upstream participant group consisted of blue swimming crab fisher households in the Bandon Bay area. Because the total number of blue swimming crab fisher households was not known with certainty, the target sample size was initially estimated using a proportion-based formula for a large or unknown population, with a 95% confidence level, a 5% margin of error, and an assumed proportion of 0.50. This calculation, used solely as an operational benchmark, yielded an estimated sample size of approximately 385 households. The field target was therefore set at 400 households to provide a sufficiently broad upstream database for identifying first buyers and route starting points across multiple areas. Because the actual respondents were selected through area-based quota allocation rather than probability sampling, the specified confidence level and margin of error were not interpreted as inferential properties of the final sample, and the survey results were not used to claim statistical representativeness of the overall population.
To ensure coverage of the study area surrounding Bandon Bay, the 400-household sample was allocated using area-based quota allocation, with data collection distributed across fishing communities in the seven designated districts. The quota allocation was intended to increase geographic coverage and the diversity of route starting points.
Respondents were household members involved in the capture, handling, or sale of blue swimming crabs and were able to provide information on fishing activities, pre-sale product handling, first buyers, sales channels, and product-transfer routes, which were used to characterize upstream actors and initiate route tracing.
3.3.2. Collectors or Buying Stations
Seventeen collectors or buying stations were subsequently traced from information provided by fishers using snowball sampling to identify buyers, pre-transfer activities, transfer points, product-transformation points, destinations, and subsequent actors in the sequence. The tracing process was intended to establish continuity in product routes from one actor to the next and to document the routes supported by field data. The 17 collectors or buying stations are therefore interpreted as traced midstream actors linked to the case-study routes, rather than as a statistically representative sample or exhaustive census of all collectors in Bandon Bay. No formal saturation threshold was established before data collection. Instead, tracing continued until additional field information no longer generated route patterns that changed the route-defining elements used in this study: actor sequence, collection or transfer point, product-transformation point, product form, or destination market.
3.3.3. Processing Plants and Downstream Actors
Two processing plants and downstream actors associated with product routes were traced from information provided by fishers and collectors to identify product-transformation points, post-processing product forms, onward transfers, and destination markets. The downstream actors identified through route tracing included intermediaries, markets, restaurants, retailers or agents, online channels, and markets linked to distribution outside the study area or through processing plants. These actors were included to establish and verify route continuity, onward transfers, product forms, and destination-market linkages within the documented supply-chain routes.
3.4. Data Collection Instruments and Procedures
Primary data were collected using household questionnaires, interview guides, product-route tracing, field observations, and small-group meetings. The household questionnaire covered household and fishing characteristics, product handling, sales channels, first buyers, and product transfers. Interviews with subsequent actors in the sequence were used to collect information on product receiving, pre-transfer activities, product transformation, delivery, onward transfers, and destination markets.
Data collection began with fisher households to identify first buyers, product forms, sales channels, and pre-delivery activities. Collectors or buying stations and subsequent actors, including intermediaries, processing plants, markets, restaurants, and other downstream actors, were then traced to construct route sequences and verify product-flow continuity. Throughout the tracing process, information on actor sequences, operational points, product forms, destination markets, and route-related activities was recorded.
Field observations were used to support verification of activities occurring at operational points, including receiving and aggregation, sorting and pre-delivery handling, transportation, and product-transformation activities observed within the study area.
The data collection team consisted of three undergraduate- and graduate-level research assistants and three local assistants. Team members were trained before data collection on the study instruments, data-collection procedures, ethical guidance, and data management. Interviews lasted approximately 10–30 min per participant, and data were documented through note-taking and, where permitted, audio recording.
Following data collection, four small-group meetings were conducted, each involving 10–15 participants, to obtain additional information, verify product-flow routes, and assess the consistency of findings across participants at multiple levels of the supply chain. These meetings served as a small-group verification step. Participants were asked to comment on preliminary route descriptions, actor sequences, collection and transfer points, product-transformation points, product forms, destination markets, activities attributed to actor groups, and reported operational constraints. The feedback from these meetings was used to cross-check route continuity, activity descriptions, and constraint interpretation before finalizing the route classification and actor–activity matrix.
The interview guides, field questionnaire instruments, small-group verification guide, and blank classification reliability template are provided in
Supplementary Material S1.
3.5. Alignment of Research Questions, Data Sources, and Analysis
The data sources and analytical procedures were aligned with the three research questions to ensure traceability from each research question to the corresponding data and analytical outputs, as shown in
Table 4.
3.6. Construction and Classification of Supply-Chain Routes
Route construction began with information from fishers on first buyers, product forms, and sales channels. Collectors or buying stations and subsequent actors were then traced through to destination markets, and data from successive actors were linked to construct product-flow sequences.
Each route was classified using the four route-structure elements outlined in
Section 2: actor sequence, key route points, product form, and destination market or buyer type. Routes were retained as distinct when the field data indicated differences in transfer points, product-transformation points, product forms, or destination markets. R1–R17 were therefore retained as the basic units of analysis.
For higher-level summary purposes, the 17 routes were grouped into four dominant structural configurations according to the main mechanism linking products from upstream sources to markets: direct-market configuration, collector-led configuration, processor-linked configuration, and extended market-linkage configuration through intermediaries and/or digital channels. These four groupings served as a descriptive summary device for organizing the route-level findings.
Route coverage was checked by comparing information across fisher households, collectors or buying stations, processing plants, downstream actors, field observations, small-group meetings, and secondary information where available. Additional route information was retained as a distinct route only when it changed at least one route-defining element; otherwise, it was treated as supporting evidence for an existing route.
Accordingly, the 17 routes are interpreted as empirically documented case-study routes rather than as an exhaustive inventory of all possible blue swimming crab supply-chain routes in Bandon Bay. They provide adequate empirical coverage for the descriptive purpose of this study, which is to compare route structures and functional activity allocation patterns supported by the field evidence collected during the 2018–2019 fieldwork period.
3.7. Activity Classification and Construction of the Actor–Activity Matrix
Activities identified through the primary data were categorized according to the five functional activity groups defined in
Section 2 and
Table 1.
The initial classification was conducted by the principal researcher using the operational definitions of the five activity groups as the coding framework. Activities were classified into predefined categories, and open coding was not used. The decision rule was to classify each activity according to its primary operational function at the point where it occurred. When the same activity could serve different functions depending on the context, such as packaging, its immediate operational purpose and supporting evidence were considered.
To assess classification reproducibility and strengthen the transparency of the classification procedure, an inter-rater reliability check was conducted. A second researcher with expertise in logistics and supply-chain management, who was not involved in the initial route and activity classification, reviewed the classification materials using the same route-definition criteria and the same five functional activity-group definitions applied in the principal analysis. The second researcher received the codebook but did not have access to the principal researcher’s original classifications before completing the assessment.
The reliability check covered all 17 route records because the routes were the basic units of analysis in this study. For functional activity classification, the check covered a subset of 15 activity records selected to represent the five functional activity groups and the main actor groups included in the actor–activity matrix. The activity-record subset was used to assess whether the functional activity definitions could be applied consistently across different actor groups and activity types. The route-classification categories were direct-market configuration, collector-led configuration, processor-linked configuration, and extended market-linkage configuration. The functional activity categories were aggregation and product flow, sorting and pre-delivery handling, transportation and delivery coordination, product transformation, and market linkage.
Percent agreement and Cohen’s kappa were calculated separately for route classification and functional activity classification. Disagreements were reviewed through consensus discussion with reference to the original field notes, interview records, route-tracing records, field-observation records, and small-group verification feedback. The blank inter-rater reliability assessment form and coding sheet are provided in
Supplementary Material S1. The completed reliability records and agreement calculations are retained by the authors and are available from the corresponding author upon reasonable request, subject to confidentiality and ethical considerations.
Following classification, activities were linked to the relevant actor groups and routes and summarized in a case-study-level actor–activity matrix. An activity recorded in the matrix indicates that field evidence supported its occurrence within that actor group in at least one segment of the traced routes. The matrix does not report the frequency, intensity, volume, duration, or proportion of routes in which the activity occurred and is not used to compare route-specific performance. Accordingly, a blank cell indicates that the available data did not support confirmation of the activity for that actor group; it should not be interpreted as evidence that the activity did not occur.
3.8. Analysis of Collector Roles
Data from the 17 collectors or buying stations were analyzed further to characterize the functional scope of these midstream actors based on activities supported by available evidence. Collector activities were linked to the five functional activity groups defined in
Table 1 and considered alongside collector positions within the routes to describe how functional scope varied across different route structures.
3.9. Analysis of Reported Operational Constraints
Operational constraints reported by participants were grouped according to the relevant supply-chain point or domain, including collection points, product-transformation points, and actor interfaces. The grouped constraints were used as contextual information to support interpretation of route structures, functional activity allocation, and operational conditions within the documented supply-chain routes.
3.10. Data Consistency, Small-Group Verification, and Classification Checks
Data consistency was assessed through cross-source comparison and small-group verification. Route descriptions, actor sequences, product forms, transfer points, product-transformation points, destination markets, and reported activities were compared across fisher household questionnaires, collector and buying station interviews, processing plant interviews, downstream actor information, field observations, product-flow tracing, small-group discussions, and secondary data. When inconsistencies were found, the information was reviewed against field notes, interview records, route diagrams, and verification meeting results. Routes were retained in the final classification only when the actor sequence, product form, transfer point, transformation point, and destination-market pattern could be supported by more than one source of evidence or confirmed through verification with relevant actors.
Small-group verification was used to review the plausibility of route descriptions and activity allocation. Participants were asked to confirm whether the identified routes, product movements, actor roles, and operational activities reflected actual practices during the 2018–2019 fieldwork period. The verification process did not aim to produce new statistical estimates. Rather, it was used to check whether the route structures and activity classifications were consistent with the experiences of actors involved in the Bandon Bay blue swimming crab chain. Feedback from the verification process was used to refine route descriptions, clarify ambiguous actor roles, and confirm the final classification of supply-chain routes and functional activity groups.
Classification reproducibility was assessed through the inter-rater reliability check described in
Section 3.7. A second researcher who was not involved in the initial route and activity classification reviewed all 17 route records and a subset of 15 activity records using the same route-definition criteria and functional activity-group definitions. Agreement between the principal researcher and the second researcher was calculated using percent agreement and Cohen’s kappa.
The classification-check process identified one route-boundary case requiring consensus review. This case concerned the distinction between a collector-led configuration and an extended market-linkage configuration where downstream intermediary or online-market linkage could affect the interpretation of the dominant route mechanism. No disagreement was recorded in the checked functional-activity records. Items for which field evidence was insufficient were not coded as confirmed activities in the actor–activity matrix. These decisions were reviewed against field notes, interview records, route-tracing records, field-observation records, and small-group verification feedback before final classification.
3.11. Informed Consent and Protection of Participant Data
Before interviews, surveys, and small-group meetings were conducted, participants were informed of the purpose of the study, the nature of their participation, the voluntary nature of participation, how the data would be used, and the measures used to protect confidentiality. Verbal informed consent was obtained from participants before taking part in the study.
To maintain participant anonymity, data used in the analysis and presentation of results were reported in aggregate form. Names, addresses, contact numbers, and other information that could directly identify participants were excluded from disclosure.
4. Results
4.1. Supply-Chain Route Structures
Tracing product flows from fishers to end buyers during the 2018–2019 fieldwork period identified 17 blue swimming crab supply-chain routes (R1–R17), which differed in actor sequences, transfer points, linkages to product-transformation points, and destination markets. These routes ranged from direct sales by fishers to consumers to routes involving collectors or buying stations, intermediaries, processing plants, markets, restaurants, online channels, retailers or agents, and international markets.
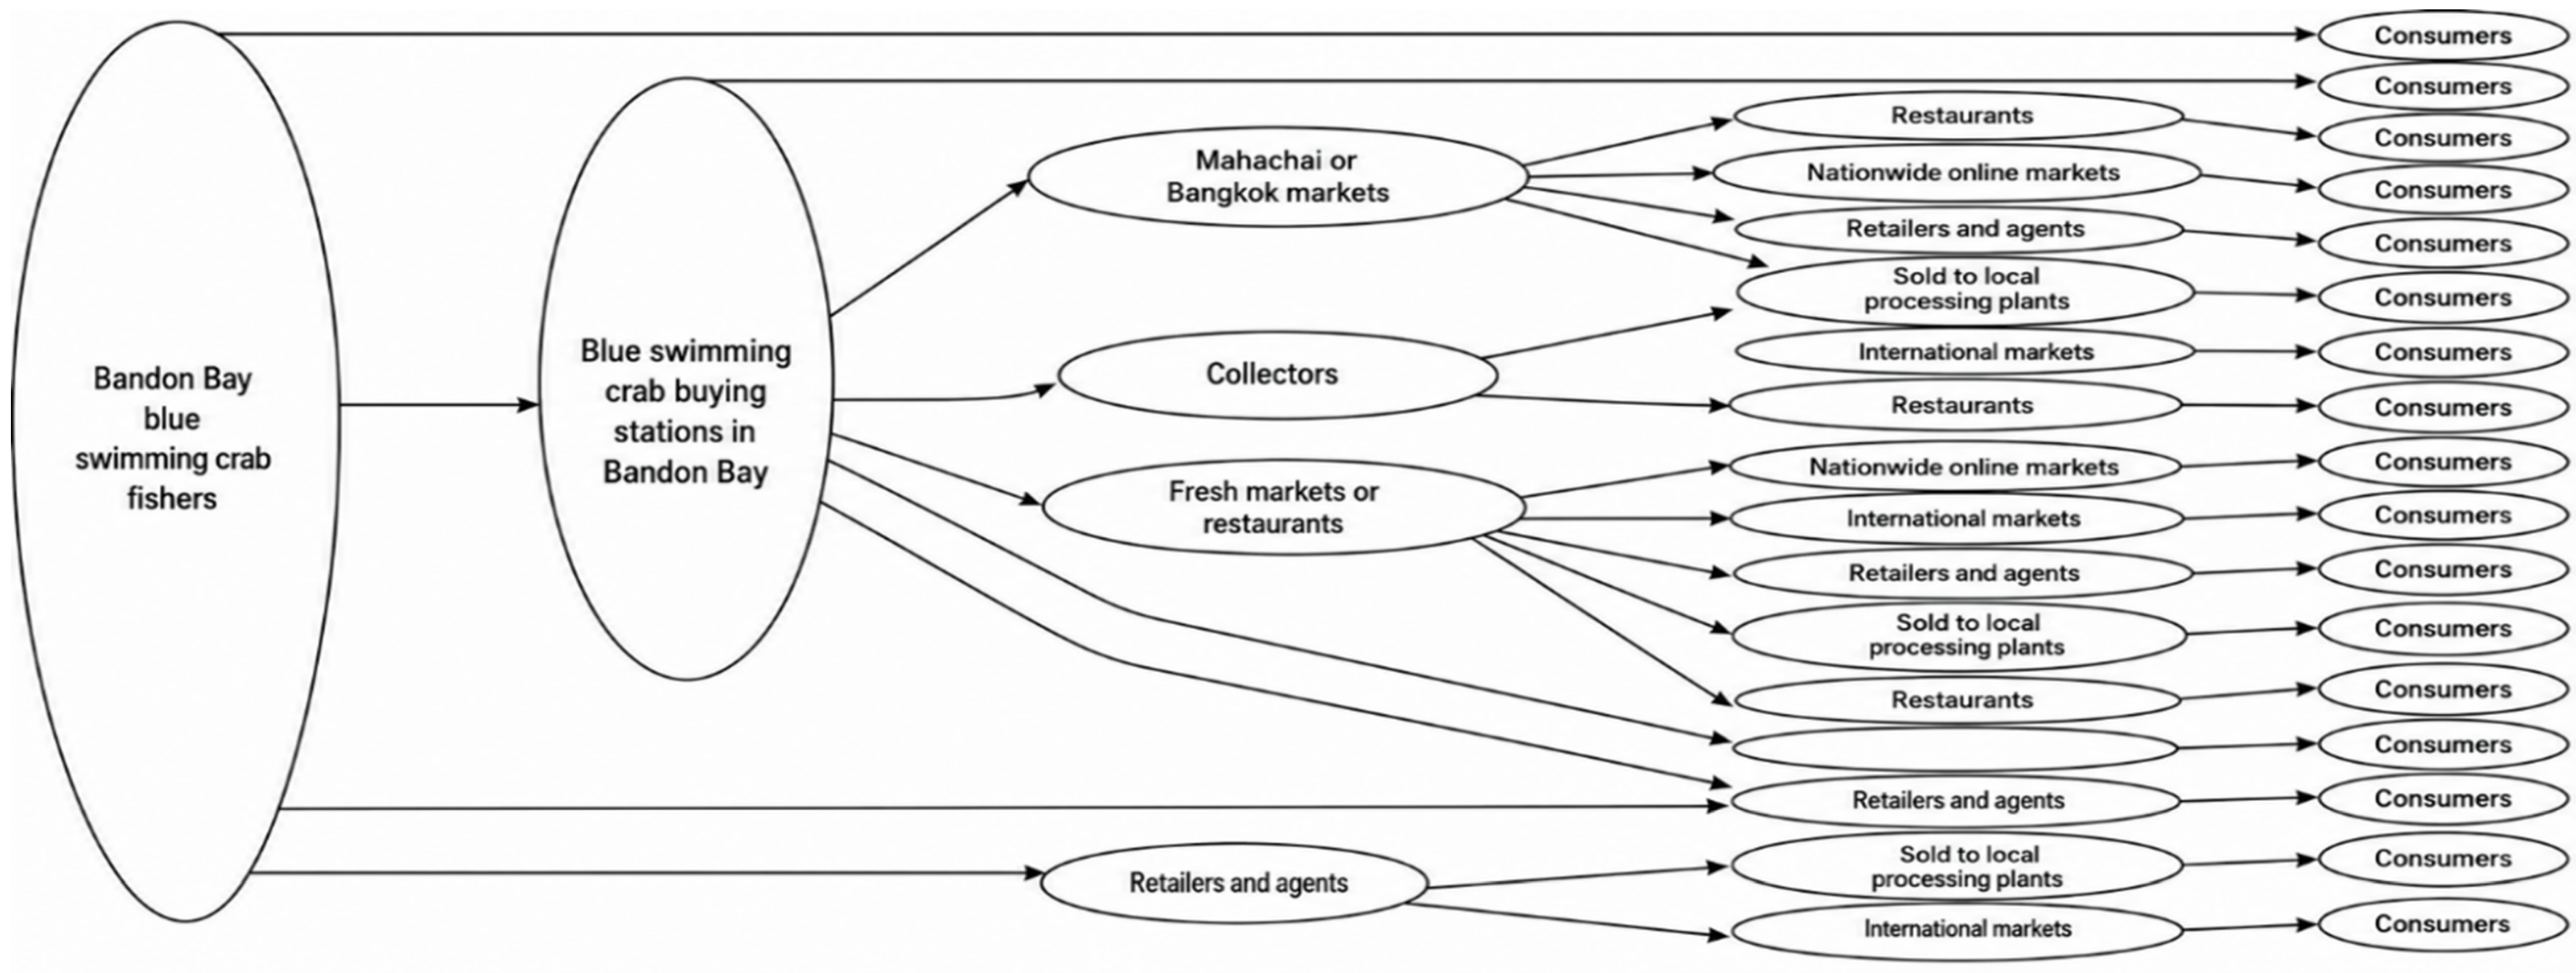
To summarize their shared structural characteristics, the 17 routes were grouped into four dominant structural configurations: direct-market configuration, collector-led configuration, processor-linked configuration, and extended market-linkage configuration through intermediaries and/or digital channels. R1–R17 remained the basic units of analysis, while the four configurations were used to organize and compare route-level patterns. The overall structure of the documented Bandon Bay blue swimming crab supply-chain routes is summarized in
Figure 2.
These routes represent empirically documented case-study routes from the 2018–2019 fieldwork period. They preserve observed differences in actor sequence, transfer points, product-transformation points, product forms, and destination markets, thereby providing the route-level basis for analyzing functional activity allocation. Details of the individual routes are presented in
Table 5.
The direct-market routes included R1 and R15, while the collector-led routes included R2, R3, R5, and R13. The processor-linked routes included R9–R12, and the extended market-linkage routes through intermediaries and/or digital channels included R4, R6–R8, R14, R16, and R17.
Product transfers differed across configurations in terms of destination markets and linkage mechanisms. Collector-led routes connected products to consumers, Mahachai or Bangkok markets, and markets or restaurants, while processor-linked routes involved onward distribution to online channels, restaurants, international markets, and retailers or agents. These differences provide the basis for examining activity distribution across actor groups in
Section 4.2.
To provide additional descriptive detail on route and market-channel patterns, the field data were further summarized at the route-structure level, as shown in
Table 6.
Table 6 provides additional descriptive support for the route-structure interpretation by summarizing how the documented routes differed in market-channel linkage and destination patterns. This evidence strengthens the analysis of route heterogeneity and provides context for examining activity distribution across actor groups in
Section 4.2.
To compare the four structural configurations more systematically,
Table 7 summarizes their route examples, dominant linkage mechanisms, activity-related patterns, and interpretive uses. This comparison clarifies how route structure relates to functional activity allocation across the documented routes.
Table 7 shows that the four configurations differ not only in actor sequence but also in the mechanisms through which products are aggregated, transformed, transferred, and linked to markets. This comparison provides a bridge to the actor–activity analysis in
Section 4.2 by showing why functional activity allocation should be interpreted alongside route structure.
4.2. Functional Activity Allocation Across Actor Groups
When the identified supply-chain routes are examined collectively using the five-group activity framework, the results reveal distinct patterns of activity distribution across fishers, collectors or buying stations, intermediaries, processing plants, and downstream market actors, as shown in
Table 8. The matrix summarizes which actor groups are supported by field evidence as performing each functional activity group.
The inter-rater reliability check supported the reproducibility of the classification procedure. The route-classification check covered all 17 route records, while the functional-activity classification check covered 15 activity records. For route classification, agreement between the principal researcher and the second researcher was 94.12%, with Cohen’s kappa of κ = 0.918. For functional activity classification, agreement was 100.00%, with Cohen’s kappa of κ = 1.000. One route-boundary case required consensus review before final classification.
Aggregation and product flow were supported by evidence for fishers, collectors or buying stations, and processing plants. Sorting and pre-delivery handling were also supported for these three actor groups. Transportation and delivery coordination were clearly supported for collectors or buying stations and intermediaries. Market linkage was the most widely distributed activity, with evidence supporting its occurrence among collectors or buying stations, intermediaries, processing plants, and downstream market actors, and in some cases among fishers.
Product transformation was more narrowly distributed. It was clearly supported by evidence for processing plants and was observed among collectors or buying stations only in some cases. Field evidence indicated that boiling by collectors occurred only in certain cases, whereas transformation activities at processing plants formed part of the product-processing process.
Taken together,
Table 8 shows that actor position within a route and functional scope do not correspond on a one-to-one basis. Actors with different labels may perform overlapping types of activities, while actors of the same type do not necessarily perform all activity groups in every case.
The activity distribution shown in
Table 8 provides the basis for the more detailed examination of collectors in
Section 4.3. Collectors or buying stations were the actor group for which field evidence supported the broadest range of activity types, ranging from aggregation and pre-delivery handling to transportation, market linkage, and, in some cases, product transformation.
To provide a configuration-level view of these activity patterns,
Table 9 summarizes how the five functional activity groups were distributed across the four structural configurations identified from the documented routes.
Table 9 shows that the four structural configurations differed not only in actor sequence and destination-market linkage, but also in the location and distribution of functional activities. In direct-market routes, activities were concentrated closer to fishers and direct buyer interfaces. In collector-led routes, collectors or buying stations formed the main functional hub. In processor-linked routes, product transformation was centered on processing plants, while collectors continued to support aggregation, handling, delivery coordination, and market linkage. In extended market-linkage routes, activities were more dispersed across intermediaries, online channels, and downstream market-linkage actors. These patterns provide a configuration-level complement to the chain-level actor–activity matrix in
Table 8.
4.3. Functional Scope of Collectors
Focusing specifically on collectors or buying stations, the activity-level data revealed a set of functions spanning multiple stages, from product receiving through linkage with subsequent actors in the sequence. Reported activities included product receiving and aggregation, weighing, size grading, icing or product holding, transportation, delivery coordination, packaging, and market linkage. Boiling was observed only in some cases.
Table 10 provides the activity-level evidence underlying the classification of collectors or buying stations in
Table 8, particularly the designations for aggregation and product flow, sorting and pre-delivery handling, transportation and delivery coordination, and market linkage. The ◐ designation for product transformation reflects that boiling was observed only in some cases and not across all collectors or routes. Packaging was treated as context-dependent: in some cases, it served as pre-delivery preparation, whereas in others it was associated with processes following product transformation. The available evidence therefore does not support assigning all packaging activities to a single category.
The functional scope of collectors or buying stations therefore extended beyond purchasing and transfer activities. Their role included aggregation, pre-delivery handling, transportation and delivery coordination, market linkage, and, in some cases, product transformation. This finding provides further evidence that midstream actor labels alone do not fully describe operational functions within the documented routes.
4.4. Reported Operational Constraints
Field data identified operational constraints at several points in the supply chain, including raw-material aggregation and handling, product holding and pre-delivery handling, information interfaces, product-transformation points, and crabmeat-picking activities, as shown in
Table 11.
As shown in
Table 11, reported constraints were located at different operational points in the chain. Collection and handling points were associated with raw-material continuity, time constraints, and limited product holding or storage time. Actor interfaces were associated with paper-based recordkeeping and limited information systems. Product-transformation points were associated with equipment and technology constraints, while crabmeat-picking activities were associated with specialized labor constraints. These results provide the constraint-level evidence used later in
Section 5.5 to identify sustainability-relevant assessment points and intervention-readiness issues.
4.5. Summary of Findings
In summary, the Bandon Bay blue swimming crab chain documented during the 2018–2019 fieldwork period consisted of 17 supply-chain routes that differed in actor sequences, transfer points, product-transformation points, product forms, and destination markets. These routes were summarized into four dominant structural configurations: direct-market configuration, collector-led configuration, processor-linked configuration, and extended market-linkage configuration through intermediaries and/or digital channels.
The findings also show that functional activity allocation does not correspond directly to actor labels or route positions. Aggregation and product flow, sorting and pre-delivery handling, transportation and delivery coordination, product transformation, and market linkage were distributed across actor groups in different ways. Collectors or buying stations were particularly important midstream actors because evidence supported their involvement in aggregation, pre-delivery handling, transportation and delivery coordination, market linkage, and, in some cases, product transformation.
Reported operational constraints occurred at collection points, product-holding and pre-delivery handling points, actor interfaces, product-transformation points, and crabmeat-picking activities. These findings provide the empirical basis for interpreting how route structures, activity locations, and operational constraints can inform sustainability-relevant assessment and intervention-readiness analysis in the documented seafood supply chain.
5. Discussion
5.1. Heterogeneity of Supply-Chain Route Structures
The findings from this study show that the Bandon Bay blue swimming crab chain does not consist of a single product-flow route, but rather encompasses routes that differ in actor sequences, transfer points, product-transformation points, product forms, and destination markets. Although the 17 routes can be synthesized into four descriptive structural configurations, route-level differences remain important for explaining which actors and operational points products pass through before reaching destination markets.
These findings are consistent with approaches to value-chain analysis in small-scale fisheries that emphasize mapping actors, product flows, and linkages among production, aggregation, processing, and markets rather than focusing solely on the number of actors within a channel [
10,
18]. Coronado et al. (2020) [
23] similarly demonstrate that identifying “who is where” in the production chain can reveal actor relationships and roles that may not be apparent from a purely linear view of the channel.
In the Bandon Bay case, routes with similar numbers of actors differed in their product-transformation points and destination markets, while routes with different actor sequences still involved some similar basic activities. These patterns show why the supply-chain route is a useful unit of analysis for preserving route-level heterogeneity and for linking route structures with activity distribution.
This issue is particularly important in small-scale fisheries, where value chains may exhibit multiple market configurations and forms of linkage depending on local and product-specific contexts. Ayilu and Nyiawung (2022) [
22] show that trade in fishery products can connect actors and markets through both formal and informal channels, while Tezzo et al. (2024) [
19] demonstrate that fish-trading practices and actor roles can evolve alongside changes in food systems and markets.
Accordingly, using the supply-chain route as the basic unit of analysis helps preserve distinctions that might otherwise be obscured if actors were aggregated into only a few broad categories. It also provides a basis for examining which actors perform each type of activity across different routes.
5.2. Functional Activity Allocation and the ActoFunction Distinction
A second key finding is that functional activities are not tied exclusively to a single actor type.
Table 8 shows that several activity groups are supported by evidence across multiple actor types, whereas others are more narrowly distributed. Product transformation, in particular, is most clearly evident at processing plants and occurs among collectors only in some cases. This pattern indicates that classifying actors solely by their labels or positions within a route is insufficient to describe the functional scope observed within the supply chain.
This finding demonstrates that actor position within a route and functional scope cannot be used interchangeably. Actor mapping provides structural information on which actors are present along a route, while analysis of functional activity allocation adds information on who performs the activities that enable product flow. Considering these two levels jointly distinguishes the structural question of “which actors do products pass through?” from the functional question of “who performs the activities that enable product flow?”
This interpretation is consistent with the literature that distinguishes actor positions from the roles performed within networks, as well as research on midstream actors showing that actors of the same type may have different functional scopes depending on the chain context. Activities involving aggregation, wholesaling, logistics, transaction coordination, and processing may likewise be distributed across multiple actor groups [
7,
8,
9]. In fisheries contexts, value-chain analysis similarly supports considering actor types, product flows, and activities occurring at different points along the chain to reveal roles that may not be fully captured by actor labels alone [
10,
11,
18].
The Bandon Bay analysis further shows that several types of activities are supported by evidence across more than one actor group, including aggregation and product flow, sorting and pre-delivery handling, and market linkage, whereas product transformation is more narrowly distributed. This pattern indicates that descriptions of supply-chain structure should be considered alongside the locations where activities occur and the functional scope supported by available evidence.
From an analytical perspective, the value of functional activity allocation lies in adding detail to route mapping rather than replacing route-structure analysis. Route analysis identifies actor sequences, transfer points, product-transformation points, and destination markets, while activity analysis identifies which actor groups perform the functions that sustain product flow. Using these two dimensions together provides a more nuanced account of differences among routes than considering only the number of actors or channel length.
5.3. Collectors as Multi-Functional Midstream Actors
With respect to the functionality of the fisheries supply chain, the findings indicate that collectors or buying stations do more than simply purchase and transfer products. Evidence supports their involvement in multiple activities throughout the midstream segment of the supply chain, including product receiving and aggregation, weighing, size grading, icing and product holding, transportation, delivery coordination, market linkage, and, in some cases, boiling and other activities associated with product transformation. This functional scope is consistent with the actor–activity matrix in
Table 8 and the detailed collector activities presented in
Table 10, which show that midstream actors may perform multiple functions extending beyond buying and selling.
This finding is consistent with the literature on the “hidden middle,” which highlights the role of midstream actors in connecting small-scale producers with markets through aggregation, wholesaling, logistics, processing, and transaction coordination [
7,
8]. Evidence from food and aquatic value chains in other contexts further shows that midstream actors occupying similar commercial positions may have different functional scopes depending on supply systems, market configurations, technology, and interfaces with processing [
19,
20]. In the context of blue swimming crab, evidence from Indonesia also reflects the role of collectors in linking purchases from fishers with product handling and onward transfer into processing operations [
14].
From this perspective, the significance of collectors in this case study lies in their position as points at which multiple types of activities converge. Analyzing collectors on the basis of the activities supported by available evidence provides a more detailed understanding of midstream actors than classification by actor labels alone and reinforces the study’s central finding that actor position and functional scope are related dimensions but cannot be used interchangeably.
5.4. Operational Constraints and Supply-Chain Interfaces
The findings identified operational constraints at several points in the supply chain, including raw-material aggregation and handling, product holding and pre-delivery handling, information interfaces, product-transformation points, and crabmeat-picking activities. These constraints highlight the operational points at which product flow, handling, transformation, and information exchange require coordination among actors.
Post-harvest handling is critical in fisheries value chains because aquatic products are highly perishable and require appropriate handling, timing, preservation, and movement through the chain. The literature from low- and middle-income countries reports that fish losses may occur at multiple points along the value chain and are associated with differences in post-harvest handling, infrastructure, storage, transportation, and market conditions [
2]. Research in Cambodia has likewise identified challenges related to post-harvest handling and value addition as key constraints within fisheries value chains [
24]. In the Bandon Bay case, reported constraints related to raw-material continuity, limited holding time, equipment and technology, and specialized labor point to operational areas where handling and transformation capacity are important.
Limitations in recordkeeping and data systems at actor interfaces represent another operational issue. Similar small-scale fisheries research emphasizes that supply-chain improvement should be aligned with local capacities, actor readiness, and institutional conditions rather than treated as a purely technical intervention [
25]. The seafood traceability literature emphasizes information flows alongside product flows because the ability to trace product origin and movement depends on data connectivity among actors [
26,
27]. Evidence from a small-scale fishery in the Philippines shows that implementing traceability in practice may face technological, economic, social, and data-connectivity constraints among actors near the upstream end of the chain [
28]. Research on sustainable cold food chains further indicates that the selection of traceability technologies should be aligned with the specific conditions and requirements of each supply-chain context [
29].
Overall, the operational constraints identified in this study help locate points in the chain where coordination, handling capacity, information systems, processing readiness, and labor availability are relevant to sustainability-relevant supply-chain improvement. Assessing route readiness should therefore extend beyond the presence of actors in a sequence to include the operational points and interfaces through which products, information, and activities are coordinated.
5.5. Sustainability-Relevant Use of Route–Activity Findings and Operational Constraints
In this study, “sustainability-relevant assessment points” refer to operational points, actor interfaces, and information needs that are relevant to future sustainability-oriented monitoring, traceability improvement, or intervention design, rather than to the direct measurement of environmental, social, or economic sustainability performance.
The contribution of this study to sustainability lies in clarifying where sustainability-relevant assessment and intervention design can be attached to a seafood supply chain. The route–activity framework provides a structural and functional information base by identifying documented route configurations, activity locations, actor interfaces, operational constraints, and points where coordination is required. This information is particularly relevant for traceability improvement, handling-time management, digital recordkeeping, processing-capacity assessment, labor-capacity planning, and coordination among supply-chain actors.
Conceptually, the findings indicate that route structures and the distribution of functions are related dimensions but cannot be used interchangeably. Identifying “which actors products pass through” provides information on actor sequences, transfer points, product-transformation points, product forms, and destination markets, whereas identifying “who performs the activities that enable those flows” reveals the locations of aggregation, pre-delivery handling, transportation and delivery coordination, product transformation, and market linkage. Joint interpretation of these two dimensions therefore provides a more detailed account of seafood supply chains than consideration of actor sequences or actor labels alone.
From a practical perspective, the findings provide a basis for identifying where responsibilities, coordination needs, and operational constraints are located within the chain. For example, constraints related to limited holding time and product handling can be translated into monitoring items such as landing-to-collection time, icing availability, holding duration, and delivery timing. Paper-based recordkeeping and weak information systems can be translated into traceability data points such as lot identification, landing-area code, buyer code, transfer date and time, product form, and destination-market information. Constraints related to processing equipment and skilled labor can be translated into intervention-readiness items such as boiling capacity, cold-storage availability, processing downtime, daily crabmeat-picking capacity, worker availability, and backlog volume. These examples illustrate how descriptive route–activity findings can support the design of future monitoring systems without claiming that the present study has measured sustainability outcomes directly.
The literature on fisheries value-chain mapping and traceability similarly indicates that understanding actors, activities, and information flows is an important prerequisite for chain-level assessment and intervention design [
11,
26,
27]. In this sense, the study supports sustainability-oriented improvement by clarifying where data, coordination, handling, transformation, and market-linkage information can be attached to the supply-chain structure. This contribution is descriptive and diagnostic: it helps locate operational points and interfaces that may require attention in future sustainability assessment or supply-chain improvement efforts.
The practical value of the route–activity framework lies in translating descriptive supply-chain findings into locations where future assessment, traceability design, or intervention-readiness review can be attached. The framework does not convert route structures or operational constraints into sustainability indicators by itself. Rather, it identifies where such indicators, data fields, or intervention questions could be developed in future studies or improvement programs. For this reason, the route–activity findings and reported constraints were interpreted in terms of three practical uses: identifying sustainability-relevant assessment points, specifying possible monitoring or traceability data items, and clarifying the interpretive boundaries of what the present study can and cannot claim.
Table 12 summarizes these uses across the main route–activity findings and operational issues documented in the study.
As shown in
Table 12, the route–activity findings are most useful as a diagnostic basis for locating where future sustainability-oriented assessment could be operationalized. Route configurations help identify where route-specific monitoring may be attached; functional activity allocation helps identify actor–activity interfaces where responsibility and data capture may need clarification; and operational constraints help identify points where traceability readiness, handling-time management, processing capacity, or labor availability could be assessed. These uses remain preparatory rather than evaluative. The present study does not determine whether any route or actor group performs better in environmental, social, or economic terms. Instead, it clarifies where future data collection, monitoring indicators, or intervention-readiness tools could be directed within a multi-actor seafood supply chain.
5.6. Temporal Validity and Applicability of the Historical Case
The findings should be interpreted as a historical case analysis of the Bandon Bay blue swimming crab supply chain during the 2018–2019 fieldwork period. Systematic updated post-2019 field data on the Bandon Bay blue swimming crab chain were not available for this study. The manuscript therefore does not reconstruct the current post-2019 configuration of the chain and does not claim that the route structures, actor roles, market channels, or operational constraints documented in 2018–2019 remain unchanged.
Nevertheless, the applicability of the 2018–2019 route–activity findings may be affected by changes in market channels, digital communication, logistics practices, traceability expectations, and labor conditions after the fieldwork period. Online sales channels and digital communication tools may alter how market-linkage activities are performed and documented. Changes in delivery coordination, cold-chain practices, or logistics arrangements may affect the location and timing of handling, storage, and transfer activities. Increased traceability expectations may change recordkeeping requirements at landing points, collection points, processing plants, and downstream interfaces. Disruptions to seafood trade and labor availability during and after the COVID-19 period may also have affected the relative importance of particular routes or constraints.
These possible changes do not invalidate the analytical distinction developed in this study between route structure and functional activity allocation. However, they limit the use of the empirical findings as a current inventory of the Bandon Bay blue swimming crab chain. Future studies should therefore update the route–activity dataset through follow-up fieldwork, repeated route tracing, and actor-level verification before using the findings for current policy design, route ranking, sustainability performance assessment, or supply-chain optimization.
5.7. Study Limitations and Future Research
This study has several limitations that define the interpretation and use of its findings. First, the study is based on a historical, multi-source descriptive case study of the Bandon Bay blue swimming crab supply chain during the 2018–2019 fieldwork period. The findings therefore describe the route structures, activity locations, actor interfaces, and reported operational constraints documented during that period. They should not be interpreted as a current inventory of the Bandon Bay blue swimming crab chain or as evidence that actor roles, market channels, logistics practices, or operational constraints have remained unchanged after the fieldwork period.
Second, the study was designed to identify and compare documented route structures and functional activity allocation, not to estimate route prevalence, product volume, transaction intensity, activity frequency, profitability, product quality, or sustainability performance. The actor–activity matrix provides a chain-level evidence-confirmation summary. A positive entry indicates that field evidence supported the occurrence of an activity within an actor group in at least one segment of the traced routes, while a blank cell indicates that the available data did not support confirmation. The matrix should therefore not be interpreted as a measure of the frequency, intensity, volume, or proportion of activities across routes or actors.
Third, the configuration-level summary in
Table 9 provides an additional descriptive layer for comparing how functional activity patterns were distributed across the four structural configurations. However,
Table 9 remains a qualitative configuration-level summary. It does not estimate the proportion of routes associated with each activity, compare route performance, or rank configurations in terms of efficiency, equity, resilience, or sustainability. Its purpose is to complement the chain-level actor–activity matrix by showing how activity locations and actor interfaces differ across the documented structural configurations.
Fourth, although the inter-rater reliability check supported the reproducibility of the route and functional activity classifications, the original fieldwork was not designed as a prospective multi-coder qualitative study. The reliability check strengthens the transparency and reproducibility of the classification procedure, but it does not convert the study into a fully prospective inter-coder qualitative design. The results should therefore be interpreted as a classification-supported descriptive case analysis rather than as a statistically generalizable coding study.
Fifth, the reported operational constraints were used as contextual information to identify sustainability-relevant assessment points and intervention-readiness issues. They were not measured as causal determinants of supply-chain performance and were not used to compare routes or actor groups. Accordingly, constraints related to holding time, recordkeeping, information systems, processing equipment, technology, or labor availability should be interpreted as locations where future monitoring, traceability design, or intervention-readiness assessment could be developed, rather than as measured indicators of sustainability outcomes in the present study.
Future research should update the Bandon Bay route–activity dataset through follow-up fieldwork, repeated route tracing, and actor-level verification. Updated data would be needed to assess whether post-2019 changes in market channels, digital communication, logistics practices, cold-chain arrangements, traceability expectations, and labor conditions have altered the route structures and activity locations documented in this study. Future studies should also collect quantitative information on product volume, transaction frequency, handling time, storage duration, delivery timing, price formation, labor requirements, processing capacity, product quality, traceability records, and environmental, social, and economic indicators. Such data would make it possible to examine route-level prevalence, compare configuration-level patterns more systematically, and assess whether particular activity locations are associated with measurable sustainability outcomes.
Future research could also connect route–actor–activity datasets with advanced network-based and multi-criteria modeling approaches. For example, Guo et al. [
30] developed a dual-attention graph neural network framework for sustainable supply-chain optimization under energy performance contracting, illustrating how complex supply-chain decisions can be modeled when appropriate quantitative, relational, and temporal data are available. In seafood supply chains, such approaches would require updated route-level data on product volumes, activity frequency, handling time, costs, product quality, traceability records, and sustainability indicators before network optimization, multi-criteria configuration analysis, or traceability-data integration could be meaningfully applied. The present study does not implement such a model, but it provides a diagnostic route–activity structure that future quantitative and modeling studies could build upon.
Within these limitations, the study contributes a diagnostic framework for linking supply-chain route structures with functional activity allocation. Its value lies in identifying where activities occur, which actor groups perform them, where operational constraints are located, and where future sustainability-oriented assessment or intervention design may be attached within a multi-actor seafood supply chain.
6. Conclusions
This study analyzed supply-chain route structures and functional activity allocation in the Bandon Bay blue swimming crab chain in Surat Thani Province, Thailand, using a historical, multi-source descriptive case study based on data collected during 2018–2019. The analysis identified 17 documented supply-chain routes and grouped them into four structural configurations: direct-market, collector-led, processor-linked, and extended market-linkage configurations. The findings show that route structures differed in terms of actor sequences, transfer points, product-transformation points, product forms, and destination markets.
By linking these route structures with five functional activity groups, the study shows that actor position and functional scope do not correspond on a one-to-one basis. Aggregation and product flow, pre-delivery handling, transportation and delivery coordination, product transformation, and market linkage were distributed across actor groups in different ways. Collectors or buying stations were especially important as midstream functional actors because field evidence supported their involvement in aggregation, handling, delivery coordination, market linkage, and, in some cases, product transformation. The configuration-level summary further shows that functional activity patterns differed across the four structural configurations, complementing the chain-level actor–activity matrix.
The study contributes a diagnostic route–activity framework for identifying sustainability-relevant assessment points in a multi-actor seafood supply chain. Its contribution is not to measure environmental, social, or economic sustainability performance directly, nor to rank routes or actors. Rather, it clarifies where activities occur, which actor groups perform them, where operational constraints are located, and where future monitoring, traceability design, or intervention-readiness assessment could be attached. In this sense, the framework provides a structural and functional basis for translating descriptive supply-chain findings into possible monitoring items, traceability data needs, and intervention-readiness questions.
The findings should be interpreted within the boundaries of the study design. The empirical data represent the documented Bandon Bay blue swimming crab chain during the 2018–2019 fieldwork period and should not be treated as a current inventory of the chain. The actor–activity matrix and configuration-level summary do not measure activity frequency, product volume, transaction intensity, route prevalence, profitability, or sustainability outcomes. Future research should update the route–activity dataset through follow-up fieldwork and actor-level verification and should collect quantitative data on product volumes, activity frequency, handling time, costs, product quality, traceability records, labor capacity, and sustainability indicators. Such data would allow future studies to move from diagnostic route–activity mapping toward route-level prevalence analysis, sustainability performance assessment, traceability-data integration, and advanced network-based or multi-criteria modeling.



 ,
,