4.2. Symmetric Information Simulation
Under symmetrical information conditions, the decision-making behaviors of the contractor and the supervisor directly affect the quality control decision-making behaviors of the owner. The following presents an analysis of the owner’s quality control decision-making behaviors. The effects of contractor quality compliance probability
, contractor time effort level
, and supervisor defect detection probability
on the optimal owner supervision probability
are investigated, as shown in
Figure 2,
Figure 3 and
Figure 4.
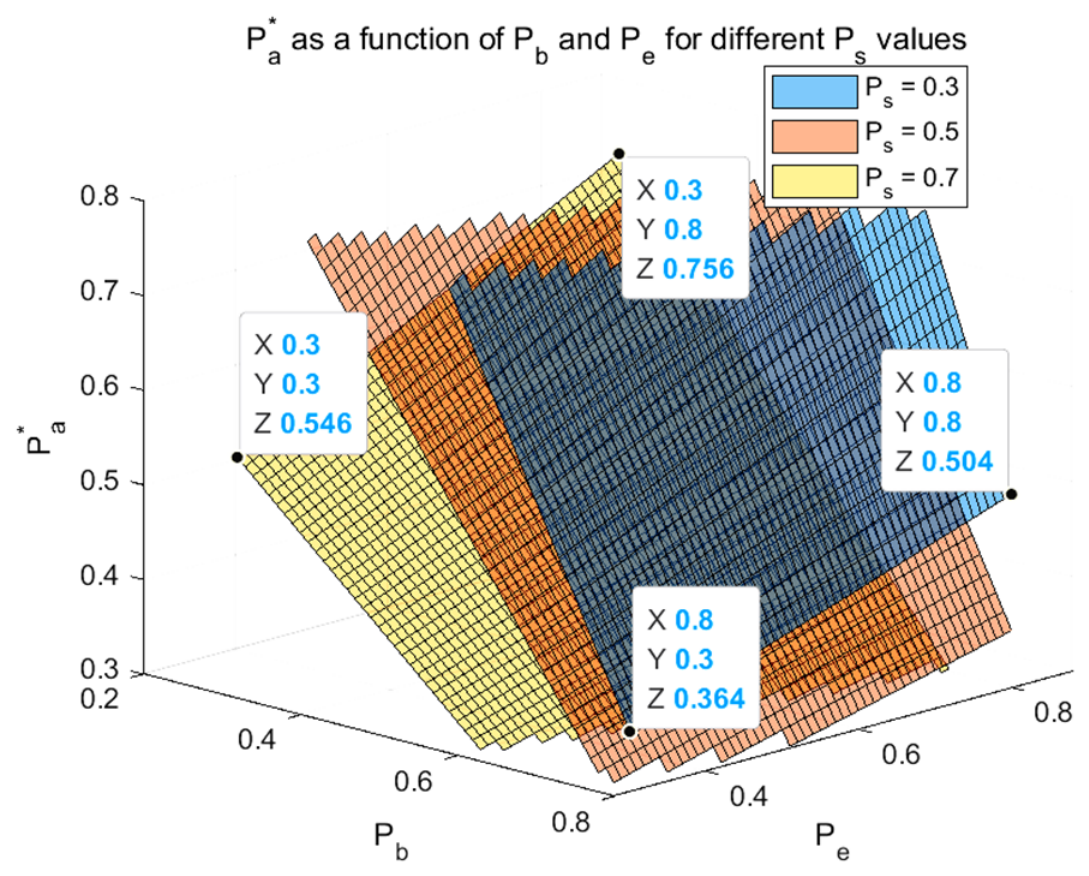
Figure 2 illustrates the interaction mechanism between the owner’s supervision level (
Pa) and the supervisor’s supervision level (
Ps) under high-risk conditions, specifically when the contractor’s quality control is low (
Pb = 0.3) and schedule compression is high (
Pe = 0.8. Sensitivity analysis reveals a clear substitution effect: the surface declines as
Ps increases. Analytically, this inverse relationship stems from the principal-agent structure where the supervisor acts as the owner’s delegate. A higher
Ps implies a stronger probability-based behavior to detect quality defects, thereby reducing the marginal benefit of the owner’s direct supervision. Consequently, to minimize total supervision costs while maintaining quality standards, the optimal
Pa decreases. Managerially, this suggests that the owner should adopt a dynamic resource allocation strategy. When the supervisor demonstrates high professional probability-based behavior (high
Ps), the owner can appropriately reduce direct intervention efforts to save supervision costs. Conversely, if the supervisor’s effort is low, the owner must significantly intensify direct supervision to mitigate moral hazard risks. This finding underscores the importance of evaluating supervisor performance as a prerequisite for optimizing the owner’s own management input.
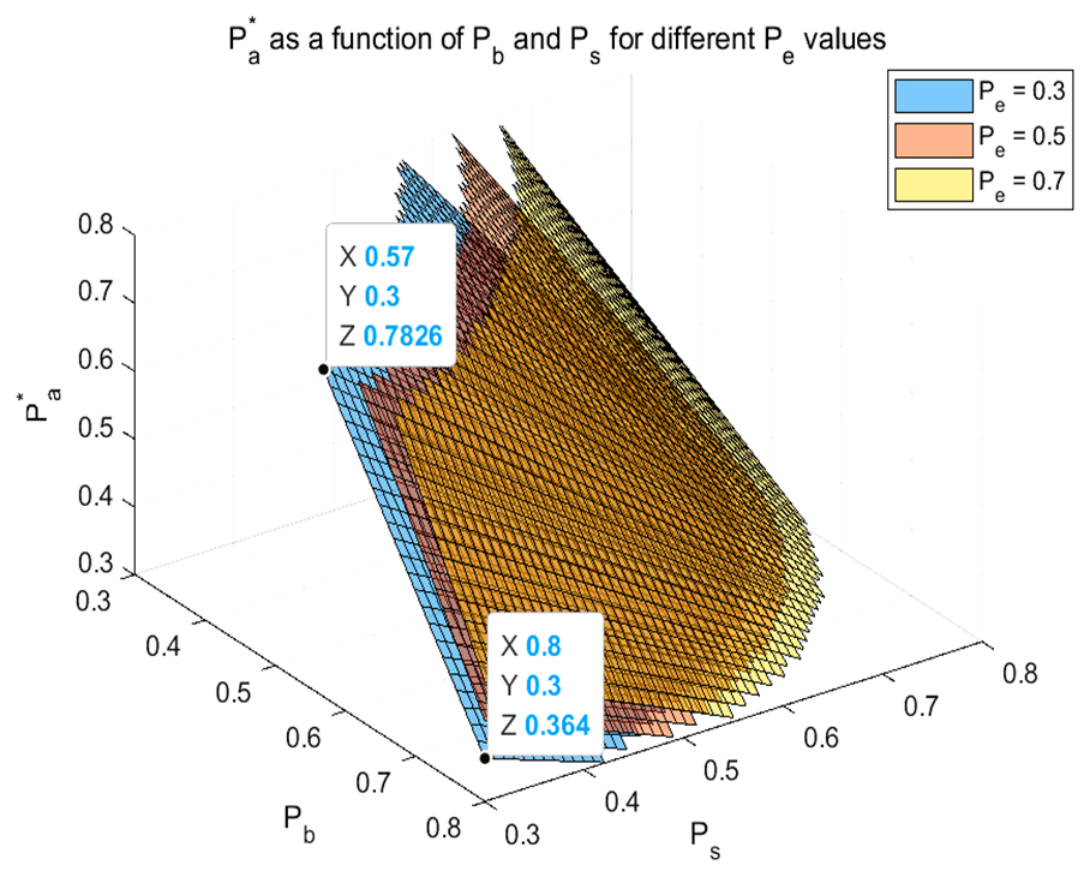
Figure 3 illustrates the sensitivity of the owner’s supervision level (
Pa) to the contractor’s early completion effort level (
Pe), revealing a conditional relationship dependent on the contractor’s quality compliance probability (
Pb) and the supervisor’s supervision level (
Ps). When Pe is directed at schedule compression (e.g.,
Pb = 0.3,
Ps = 0.5), higher
Pe increases quality risk (due to resource strain and procedural shortcuts), necessitating a non-linear increase in Pa to mitigate moral hazard (positive relationship). Conversely, when Pe is allocated to process optimization (e.g.,
Pb = 0.8,
Ps = 0.7), higher
Pe reduces quality risk (by improving workflow efficiency), allowing the owner to lower Pa (negative relationship). Managerially, owners should differentiate supervision strategies—intensifying
Pa for schedule compression and relaxing it for process optimization. Notably, even with high supervisor effort (
Ps), low contractor quality control (
Pb) and high
Pe require high
Pa, indicating third-party supervision cannot fully substitute for direct owner oversight under severe schedule risks. Thus, implementing schedule incentives (e.g., early completion bonuses) requires parallel investment in quality supervision, especially for contractors with weak quality capabilities.
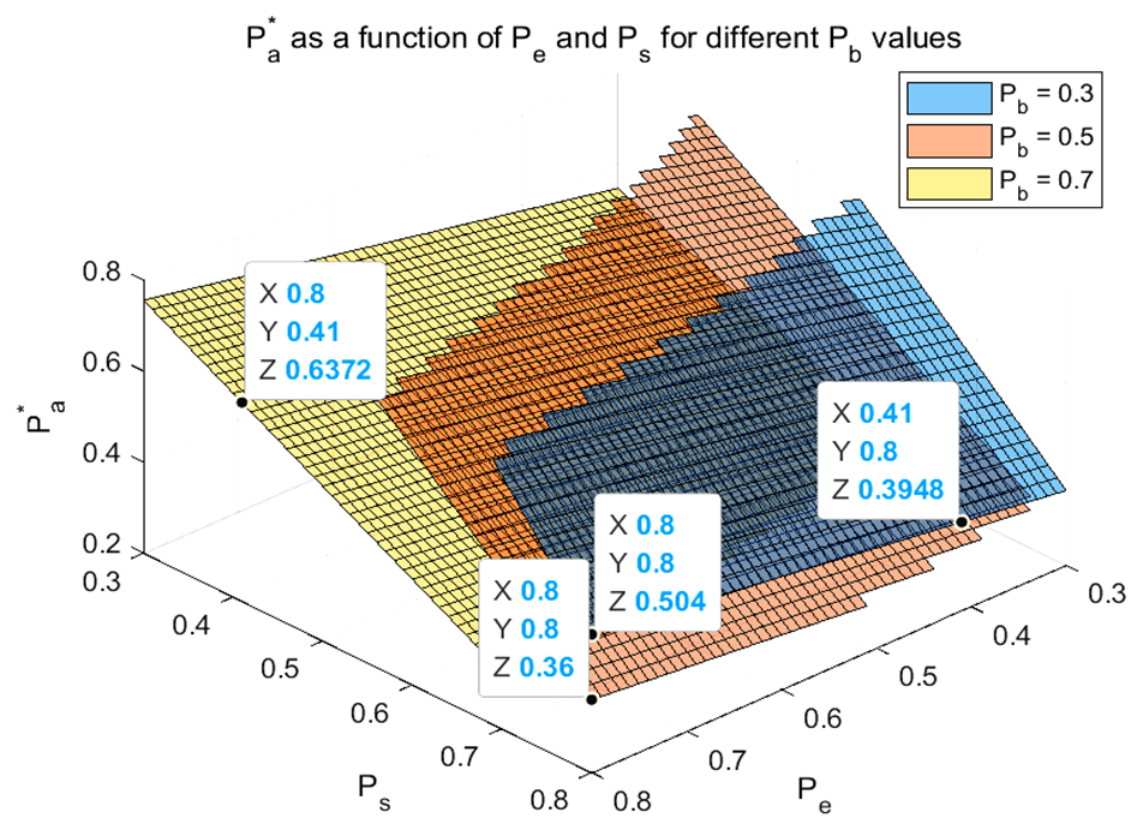
Figure 4 illustrates the sensitivity of the owner’s supervision level (
Pa) to the contractor’s quality compliance probability (
Pb). Sensitivity analysis reveals a significant substitution effect: the surfaces shift downward as
Pb increases, indicating an inverse relationship between the contractor’s internal quality probability-based behavior and the owner’s external supervision requirement. Analytically, this demonstrates a “risk buffering” mechanism. A high
Pb signifies that the contractor possesses a robust internal quality assurance system, which serves as the primary barrier against defects. This effectively mitigates the information asymmetry regarding the contractor’s actual behavior, thereby reducing the marginal benefit of the owner’s direct supervision. Consequently, even under conditions of high schedule compression (
Pe = 0.8) and moderate supervisor effort (
Ps), a high
Pb allows the owner to maintain
Pa at a medium-low level. Managerially, this implies that owners should adopt a differentiated supervision strategy based on contractor probability-based behavior. Selecting contractors with strong quality reputations (high
Pb) is a cost-effective risk management approach, as it significantly lowers the necessary investment in direct supervision resources. Conversely, for contractors with weak quality controls (low
Pb), intensive owner oversight is indispensable to prevent quality failures.
The effects of contractor quality compliance probability
, contractor time effort level
, and supervisor defect detection probability
on the optimal quality guarantee deposit
are further analyzed under different parameter settings, as shown in
Figure 5,
Figure 6 and
Figure 7.
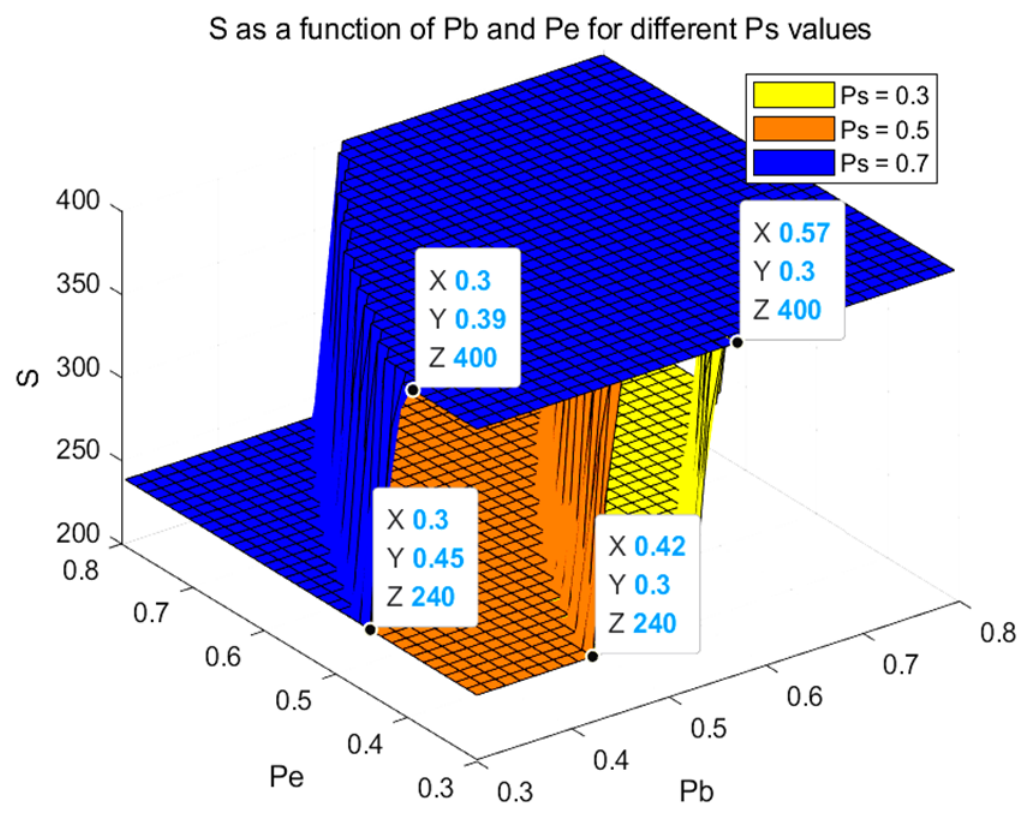
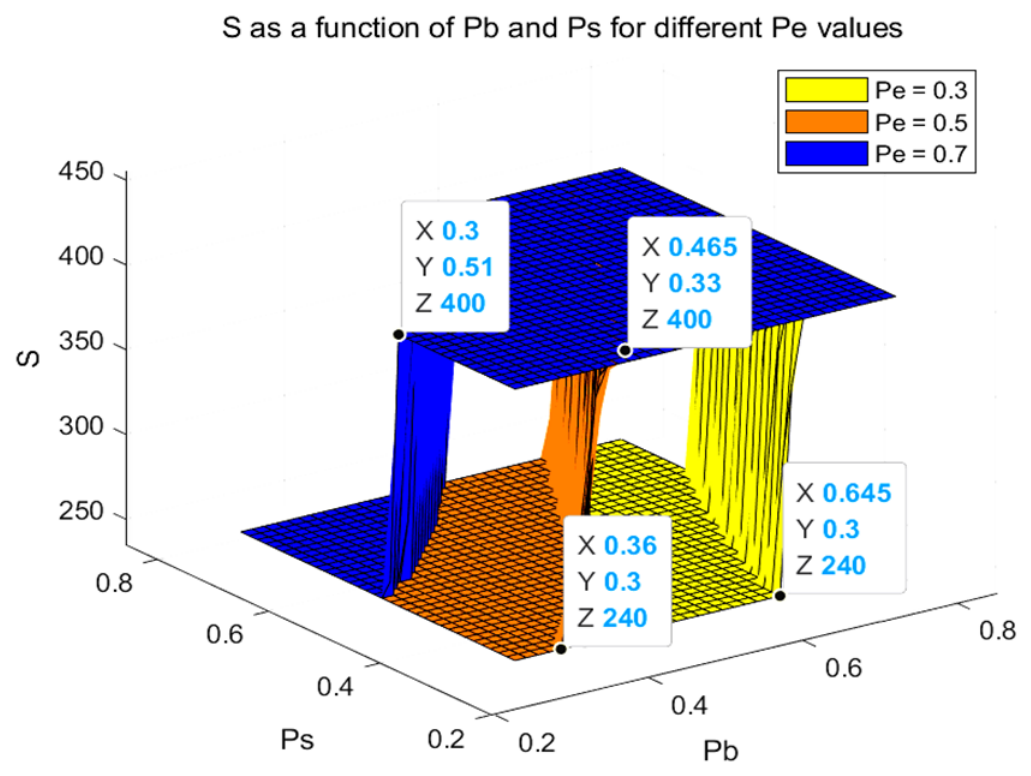
Figure 5 illustrates the determinants of the quality guarantee deposit (
S) and the regulatory role of the contractor’s early completion effort level (
Pe). Sensitivity analysis reveals a significant synergistic effect between the contractor’s quality control (
Pb) and the supervisor’s effort (
Ps). When
Pe is low, high levels of both
Pb and
Ps lead to a substantial reduction in
S, indicating that effective internal control and external supervision can act as substitutes for financial collateral, thereby lowering the contractor’s capital burden. However, as
Pe increases to 0.7, the sensitivity of
S to
Pb intensifies sharply; a low
Pb triggers a surge in
S even if
Ps is high. Analytically, this suggests that schedule compression exacerbates the marginal risk of weak quality control, rendering external supervision insufficient as a standalone safeguard. Consequently, the owner must increase the financial constraint (
S) to mitigate the heightened risk of default. Managerially, this implies that the deposit retention strategy should be dynamic rather than fixed. Owners should implement a “risk-pricing” mechanism: reducing the deposit burden for contractors with strong quality capabilities to incentivize performance, while imposing stricter financial constraints when strict deadlines coincide with weak quality control to ensure project integrity.
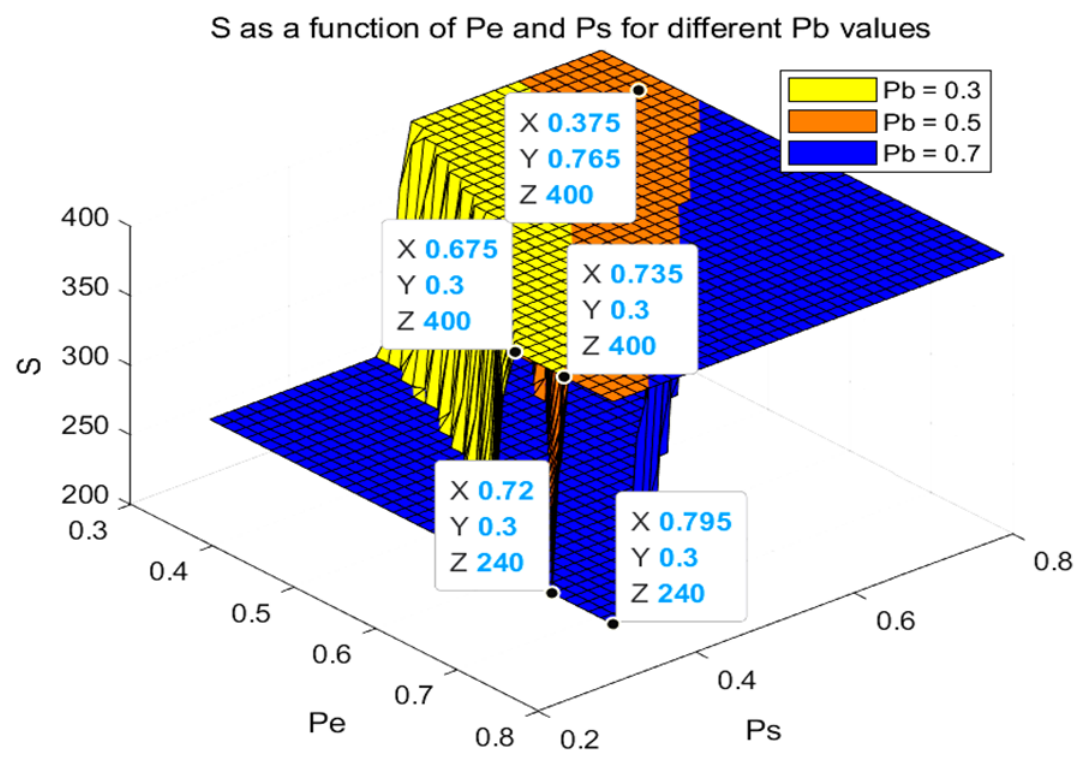
Figure 6 illustrates the sensitivity of the quality guarantee deposit (
S) to schedule compression (
Pe) and supervision intensity (
Ps) under varying contractor capabilities. Sensitivity analysis reveals a critical asymmetry: when contractor quality control is weak (
Pb = 0.3),
S exhibits high sensitivity to
Pe but rigidity (inelasticity) to
Ps. Analytically, this indicates that under high schedule pressure, the marginal risk mitigation provided by external supervision diminishes significantly. The combination of aggressive scheduling (high
Pe) and inherent probability-based behavior deficits (low
Pb) creates a structural risk that monitoring alone cannot resolve; consequently, the owner is compelled to demand a high financial guarantee (
S) to cover potential default risks. Conversely, when
Pb is high,
S remains stable at a low level even if
Pe rises and
Ps is low. This highlights that the contractor’s self-management (inherent prevention) plays a dominant role in risk control, whereas supervision acts merely as an auxiliary constraint. Managerially, this underscores the importance of contractor selection for fast-track projects. Owners must recognize the limitations of supervision; when facing strict deadlines, prioritizing contractors with proven quality capabilities is the most effective risk management strategy, as it fundamentally prevents the escalation of guarantee costs.
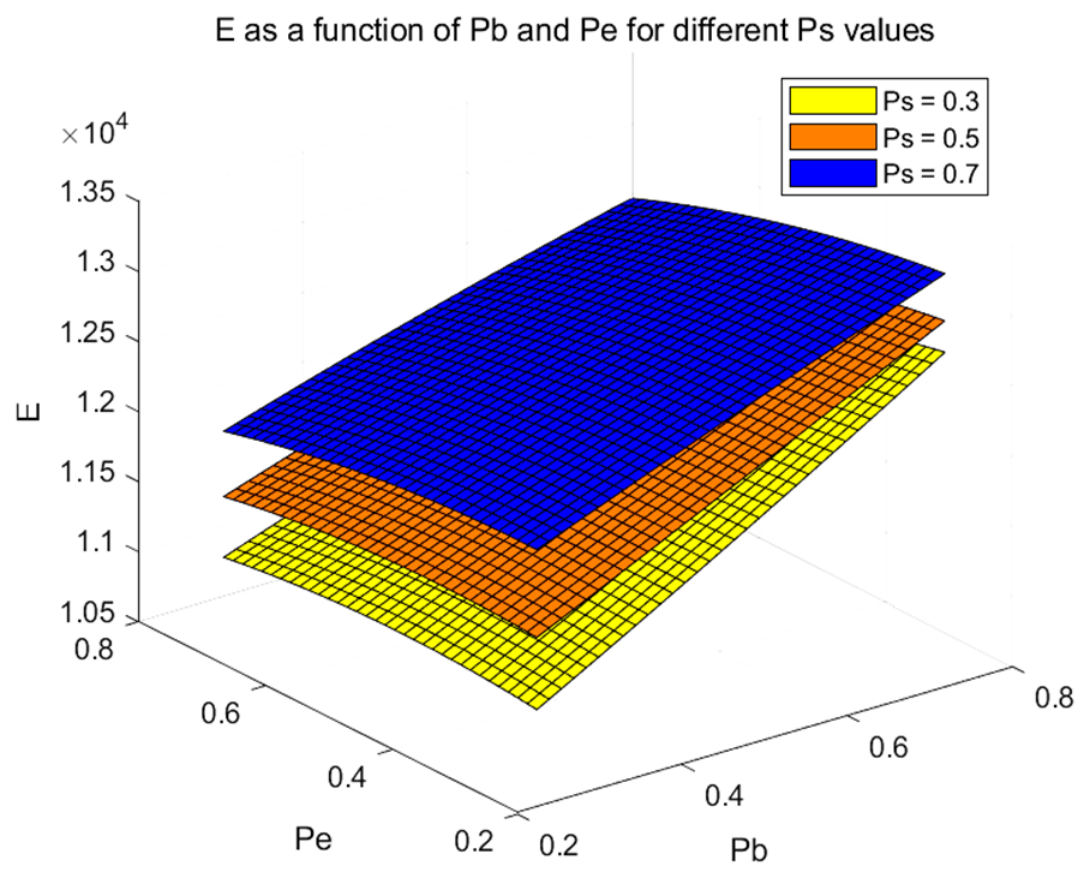
Figure 7 elucidates the asymmetric regulatory effect of the supervisor’s defect detection probability (
Ps) on the quality guarantee deposit (
S). Sensitivity analysis demonstrates a “stabilizing effect”: a higher
Ps significantly reduces the volatility of
S in response to variations in contractor probability-based behavior (
Pb) and schedule pressure (
Pe). Analytically, when
Ps is low, the owner faces high uncertainty regarding project quality, forcing a defensive strategy where
S acts as a highly sensitive financial buffer against external risks. Conversely, a high
Ps provides a reliable external monitoring signal, allowing the owner to moderate the deposit requirement. However, a critical observation arises: even under high
Ps, the combination of low
Pb and high
Pe forces
S to remain near its upper limit. This confirms the principle of “non-substitutability of subject responsibility.” External monitoring, no matter how rigorous, cannot fully internalize the contractor’s quality behavior or eliminate the structural risks posed by probability-based behavior deficits and aggressive scheduling. Managerially, this implies that while enhancing supervision can stabilize risk expectations, it cannot replace financial guarantees when the contractor’s internal risk factors are excessive. Owners should establish a multi-layered risk defense system where supervision and deposits serve distinct functions—supervision for detection and control, and deposits for financial assurance—rather than treating them as fully interchangeable risk mitigation tools.
The change in the retention amount S of the quality guarantee deposit results from the joint influence of the contractor’s quality control Pb, early completion effort level Pe, and supervision Ps. When the contractor significantly increases the level of time effort Pe in pursuit of schedule rewards, if the quality control Pb is not strengthened synchronously or there is a lack of effective supervision Ps by the Supervisor, the potential risk of quality defects during the construction process will significantly accumulate, forcing the owner to increase the retention ratio of the security deposit. On the contrary, if the contractor actively optimizes the quality control system while compressing the construction period, or if the supervisor intervenes through high-frequency and high-precision supervision, it can effectively suppress the irrational growth of S.
The effects of
,
, and
on the owner expected utility
under different parameter settings are shown in
Figure 8,
Figure 9 and
Figure 10.
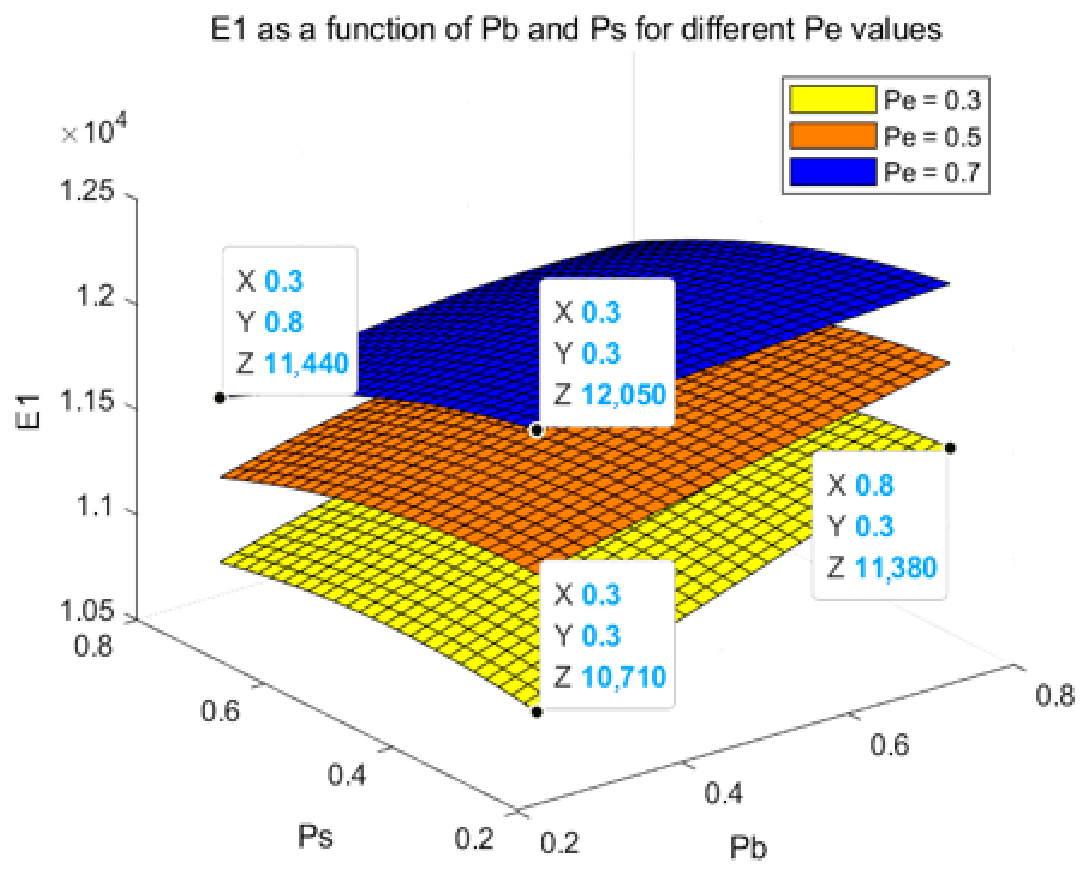
Figure 8 illustrates the sensitivity of the owner’s expected utility (
E1) to the interplay between contractor probability-based behavior (
Pb) and schedule pressure (
Pe). Sensitivity analysis reveals a significant “synergistic value premium”: under low schedule pressure (
Pe = 0.3), the combination of high
Pb and high
Ps maximizes
E1, demonstrating that internal quality assurance and external monitoring jointly minimize defect-related losses. However, this synergy is fragile; as
Pe rises, the utility surface collapses if
Pb remains low. Analytically, this “value erosion” under high
Pe suggests that schedule compression imposes an “efficiency tax” on quality. When the contractor operates at the margin of their capacity (low
Pb), aggressive acceleration exponentially increases the probability of failure, a risk that external supervision (
Ps) cannot fully mitigate. Managerially, this implies a “Probability-based behavior-First” scheduling strategy: high-intensity schedules (fast-tracking) should only be applied to contractors with proven high-quality capabilities (high
Pb). Attempting to compensate for a low-probability-based behavior contractor via supervision during a compressed schedule results in diminishing returns and significant utility loss for the owner.
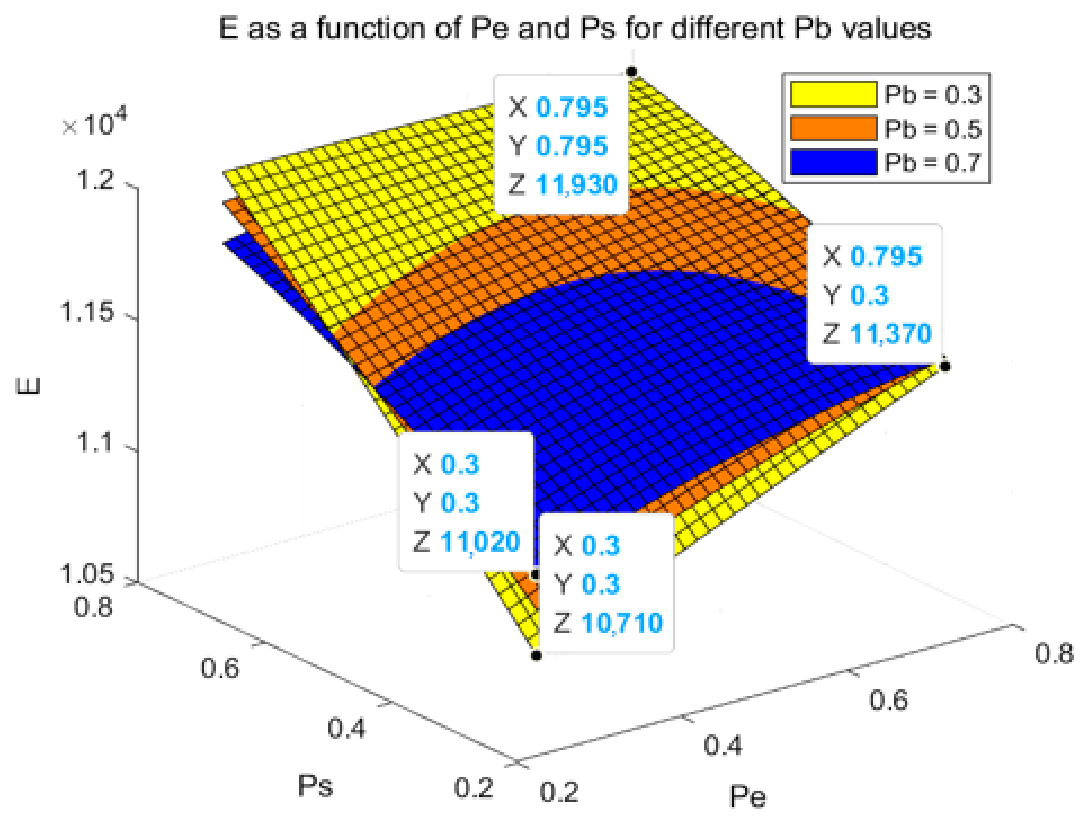
Figure 9 demonstrates the dominance of the contractor’s quality compliance probability (
Pb) in determining the owner’s expected utility (
E1) under schedule pressure. Sensitivity analysis reveals that when
Pb is low (0.3),
E1 exhibits a sharp non-linear decline as
Pe increases, showing significant rigidity to improvements in supervision (
Ps). Analytically, this indicates that quality is primarily an “endogenous attribute” determined by production probability-based behavior, rather than an “exogenous outcome” of inspection. Under low probability-based behavior, the “production constraint” becomes the bottleneck; increasing supervision intensity (
Ps) merely identifies defects but cannot prevent the utility loss caused by the contractor’s inability to execute under tight deadlines. Conversely, a high
Pb serves as a robust safeguard, maintaining high utility even when
Pe is high and
Ps is low. Managerially, this underscores a shift from “outcome inspection” to “source control.” For projects with aggressive schedules, the owner’s priority should be selecting high-probability-based behavior contractors rather than relying on intensive supervision. Investing in the screening of contractor capabilities yields higher marginal returns than increasing supervision efforts when facing inherent probability-based behavior deficits.
Figure 10 elucidates the stabilizing role of the supervisor’s quality supervision level (
Ps) on the owner’s expected utility (
E1). Sensitivity analysis reveals a distinct “variance reduction” effect: when
Ps is high (0.7),
E1 exhibits strong stability against fluctuations in
Pb and
Pe, indicating that effective supervision acts as a buffer against operational risks. Analytically, this suggests that under high
Ps, the supervisor absorbs a significant portion of the information asymmetry risk, shielding the owner from the direct volatility of the contractor’s performance. However, the analysis also identifies a “structural ceiling”: even with high
Ps, the combination of low
Pb and high
Pe results in a persistently low
E1. This confirms that supervision is an ex post detection mechanism with diminishing returns, unable to fully compensate for the ex ante lack of production probability-based behavior. Managerially, this implies that while strong supervision can stabilize returns under normal variance, it cannot rectify systemic failures caused by the combination of weak contractors and aggressive scheduling. Owners must view supervision as a tool for risk mitigation, not as a cure for fundamental probability-based behavior deficits.
Overall, reasonable investment in Pe can promote the progress of the project and improve E1, but excessive rush may cause quality problems and damage E1. Pe will change the degree of influence of Pb and Ps on E1; for example, at higher Pe, the gain effect of Pb enhancement on E1 is more significant; Pb also affects the relationship between Ps, Pe, and E1. When the quality control level of the contractor is high, the marginal effect of supervision and time effort on E1 may change; And Pa not only affects E1 on its own, but also interacts with Pb and Pe. Only by matching appropriate owner supervision with contractor quality control and time investment can E1 be maximized.
4.3. Asymmetric Information Simulation
The effects of
,
,
, and
on the optimal supervision probability
under different parameter settings are shown in
Figure 11 and
Figure 12.
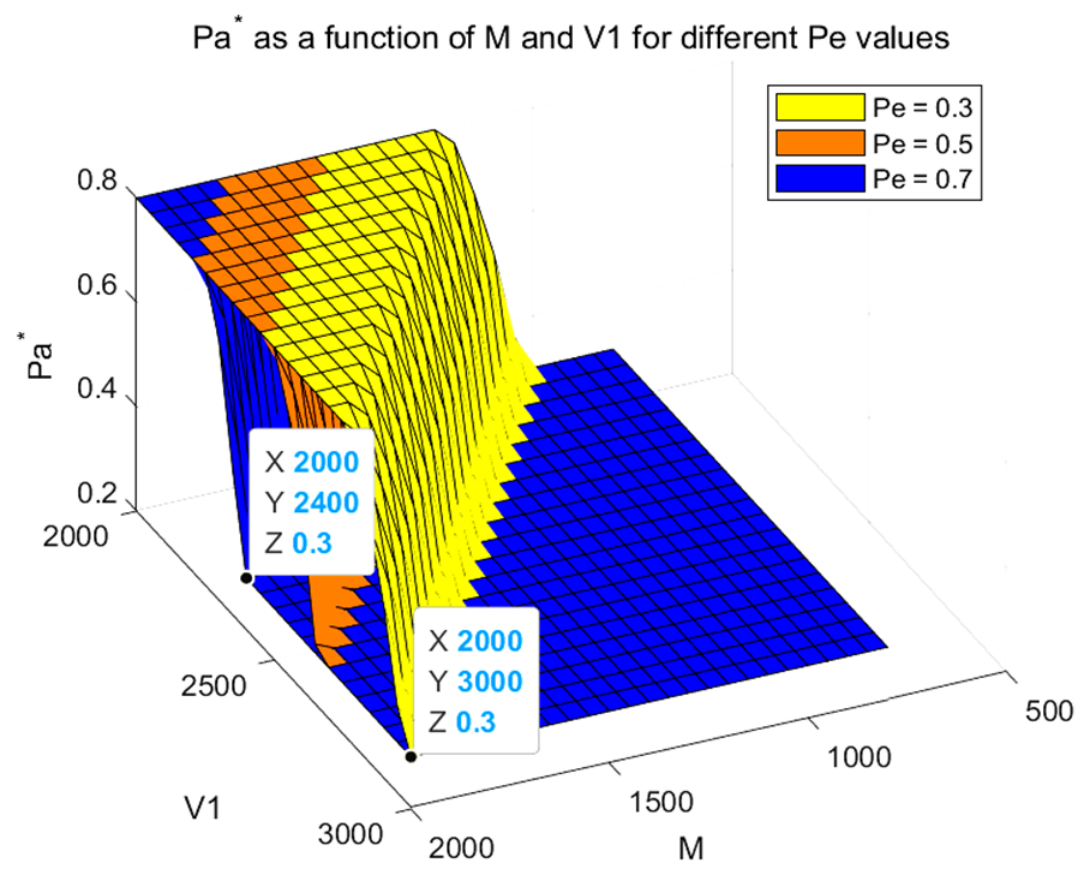
Figure 11 reveals the complex sensitivity of the owner’s supervision level (
Pa) to the contractor’s expected return (
M) and the owner’s potential loss (
V1). Sensitivity analysis indicates that
Pa exhibits a non-linear, fluctuating response to
M, while showing a consistent positive correlation with
V1. Analytically, the fluctuation of
Pa with respect to
M reflects a trade-off between the “commitment effect” and the “moral hazard effect.” While high returns may incentivize the contractor to invest in quality (commitment), they also increase the opportunity cost of compliance, potentially motivating profit-seeking shortcuts that necessitate higher
Pa (moral hazard). This ambiguity forces the owner to adjust supervision dynamically. In contrast, the positive relationship between
V1 and
Pa is driven by risk aversion; as potential losses escalate, the marginal cost of supervision becomes acceptable compared to the risk of project failure. Managerially, this implies that revenue incentives (
M) alone are insufficient to ensure quality; owners must design comprehensive contracts that align incentives with oversight. Furthermore, for projects with high potential loss (
V1), a proactive “high-supervision” strategy is imperative regardless of the contractor’s revenue expectation.
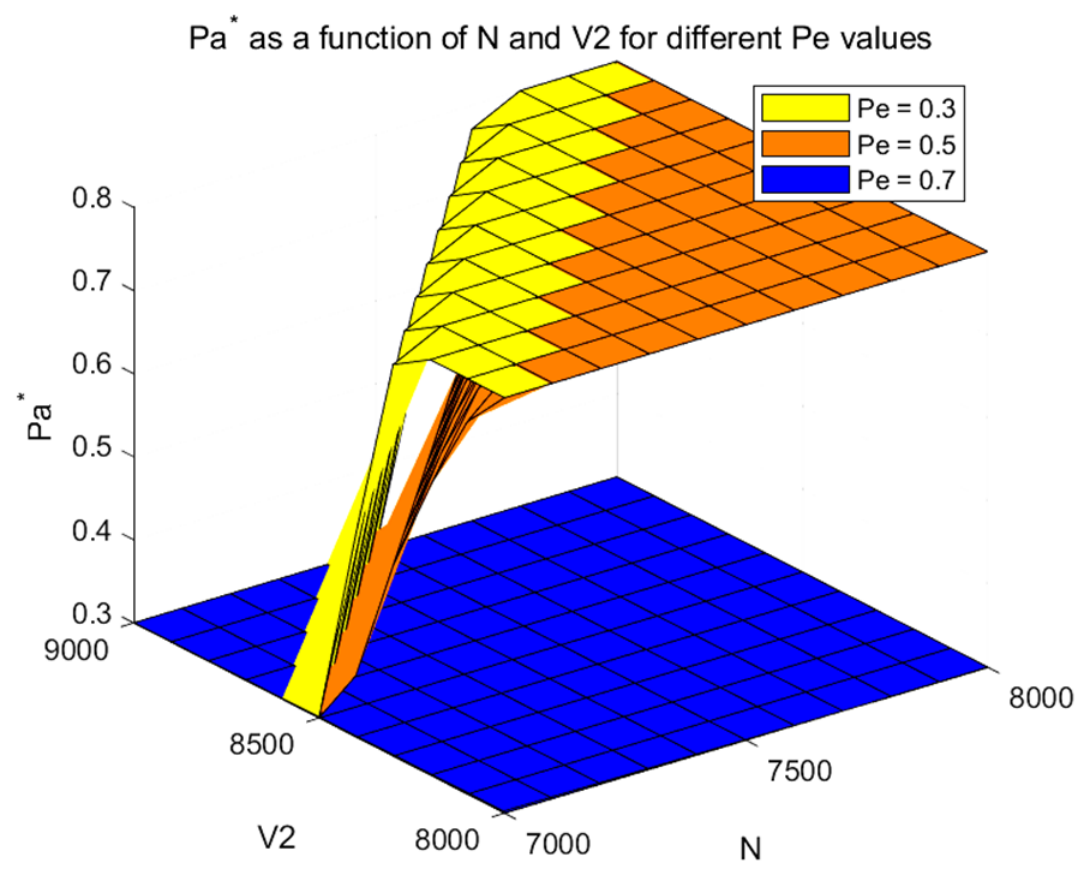
Figure 12 elucidates the sensitivity of the owner’s supervision level (
Pa) to the supervisor’s expected return (
N) and contract value (
V2). Sensitivity analysis indicates that
Pa exhibits a non-monotonic, fluctuating response to
N, while maintaining a consistent positive correlation with
V2. Analytically, the fluctuation of
Pa regarding
N reflects a trade-off between the “incentive effect” and the “collusion risk.” While high returns may motivate the supervisor to perform diligently (reducing the need for owner oversight), they simultaneously increase the potential surplus for collusion with the contractor, necessitating heightened vigilance from the owner. This ambiguity leads to the non-linear trend. In contrast, the positive correlation with
V2 is driven by asset specificity and risk aversion; as the owner’s financial commitment increases, the marginal cost of supervision decreases relative to the potential loss of project failure, prompting higher
Pa. Managerially, this implies that simply increasing supervisor remuneration is insufficient to guarantee quality assurance. Owners must design contracts that separate performance incentives from potential corruption rents. Furthermore, for high-value contracts (
V2), establishing a robust “supervision of the supervisor” mechanism is essential to ensure the return on investment in supervisory services.
The effects of
,
,
, and
on the optimal quality guarantee deposit
and penalty
under different parameter settings are shown in
Figure 13 and
Figure 14.
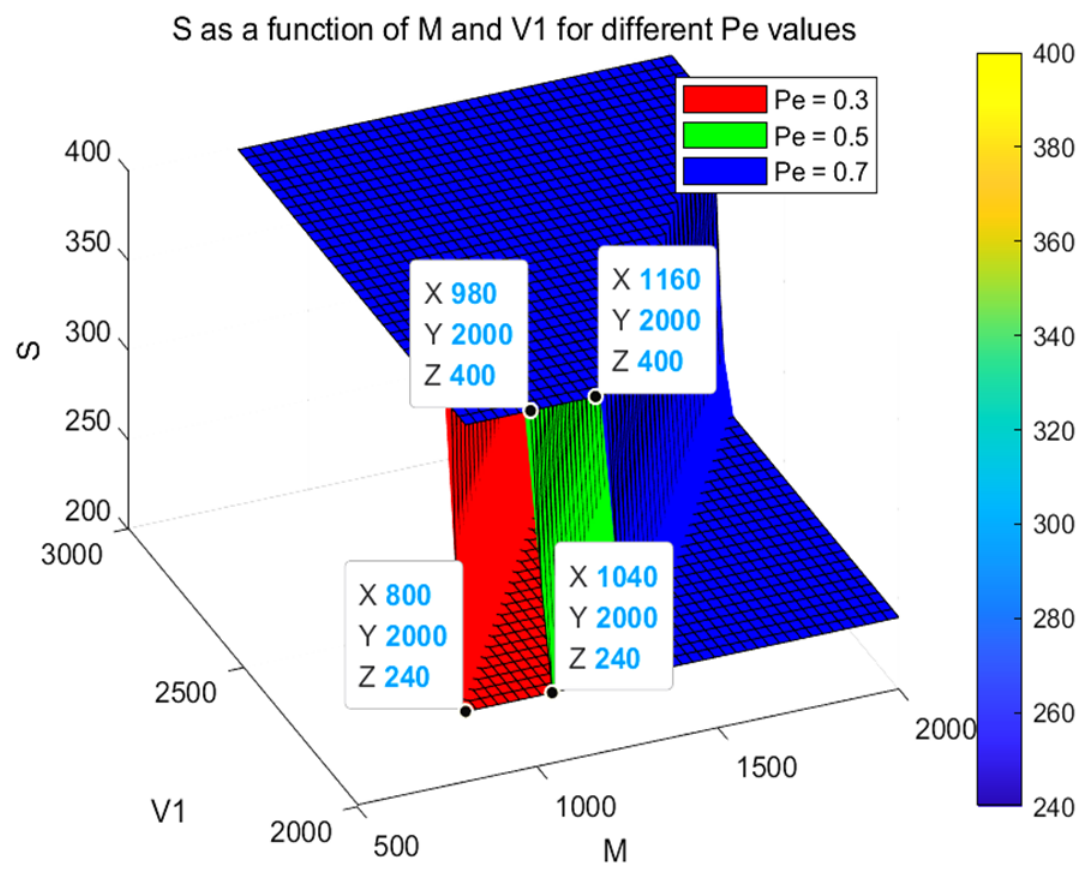
Figure 13 illustrates the sensitivity of the quality guarantee deposit (
S) to financial incentives (
M), potential loss (
V1), and time effort (
Pe). Sensitivity analysis reveals a consistent positive correlation between
S and both
M and
V1, while showing a negative correlation with
Pe. Analytically, the increase in
S alongside
M reflects the principle of “incentive compatibility.” As the contractor’s expected return (
M) rises, the temptation to prioritize speed over quality increases; therefore, the owner must proportionally increase the financial constraint (
S) to maintain an effective deterrence mechanism, ensuring the cost of default outweighs the benefits of opportunism. Similarly, the positive response to
V1 represents a “risk hedging strategy,” where higher deposits are required to cover potential losses in high-stakes projects. Conversely, the lower
S at high
Pe levels indicates a “signaling effect.” A high early completion effort level (
Pe) signals the contractor’s commitment and resource input, reducing information asymmetry and allowing the owner to relax financial constraints. Managerially, this suggests a “Dynamic Deposit Mechanism”: owners should scale the deposit in proportion to project value and profit margins, but offer “performance relaxations”—reducing deposit requirements for contractors who demonstrate high effort levels (
Pe)—to optimize capital efficiency while maintaining risk control.
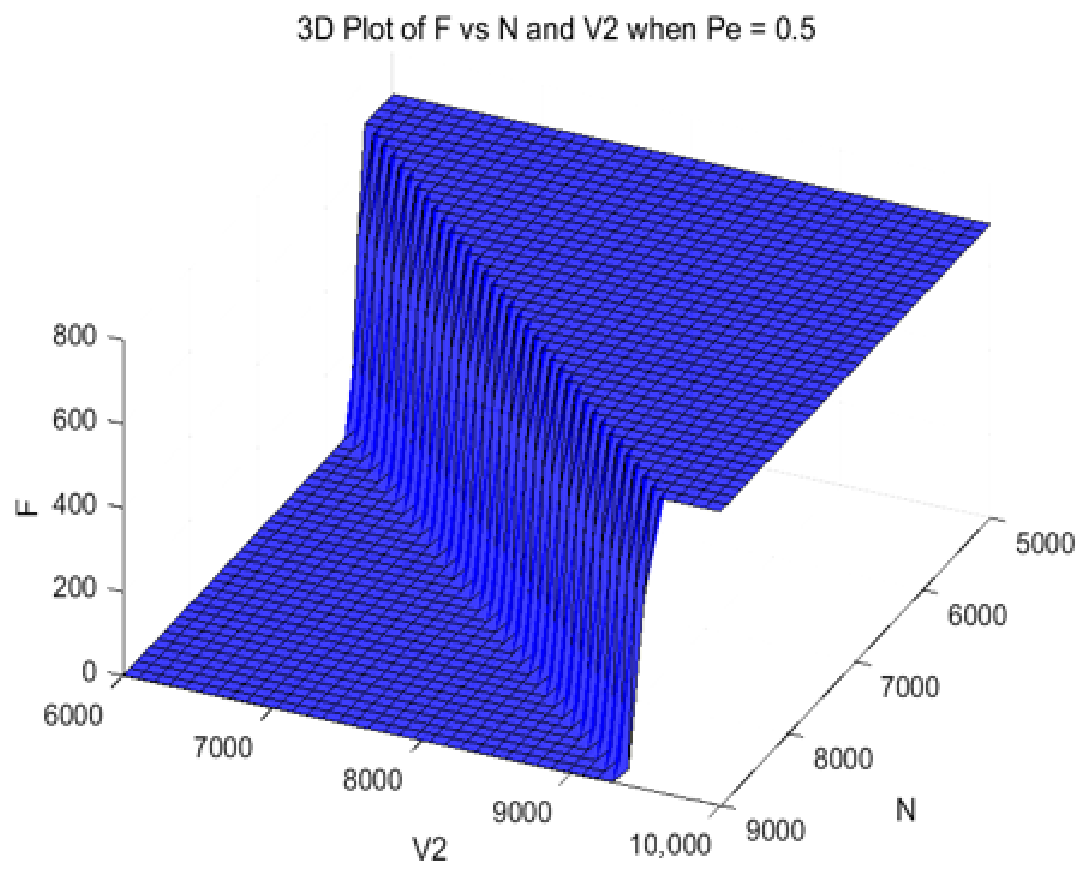
Figure 14 elucidates the determinants of the penalty for supervision dereliction (
F), demonstrating its positive sensitivity to both the supervisor’s expected return (
N) and the contract value (
V2). Sensitivity analysis reveals that
F scales proportionally with the economic significance of the supervision contract. Analytically, the positive relationship between
N and
F reflects the “responsibility-alignment” principle. Higher expected returns (
N) indicate a greater scope of authority and potential benefits; to prevent moral hazard, the penalty (
F) must be sufficiently high to outweigh the benefits of shirking or opportunistic behavior, ensuring effective deterrence. Similarly, the increase in
F with
V2 represents a “proportional accountability” mechanism. As the contract value (
V2) rises, the negative externality of supervision failure magnifies, necessitating a higher financial commitment to cover potential losses. Managerially, this implies that penalty clauses should not be static but rather “indexed” to contract value and expected returns. Owners should design dynamic penalty agreements where the severity of punishment escalates with the supervisor’s income and contract scale, thereby maintaining a credible threat of punishment that aligns the supervisor’s incentives with the owner’s quality objectives.
The effects of
and
on the owner expected utility
under different parameter settings are shown in
Figure 15.
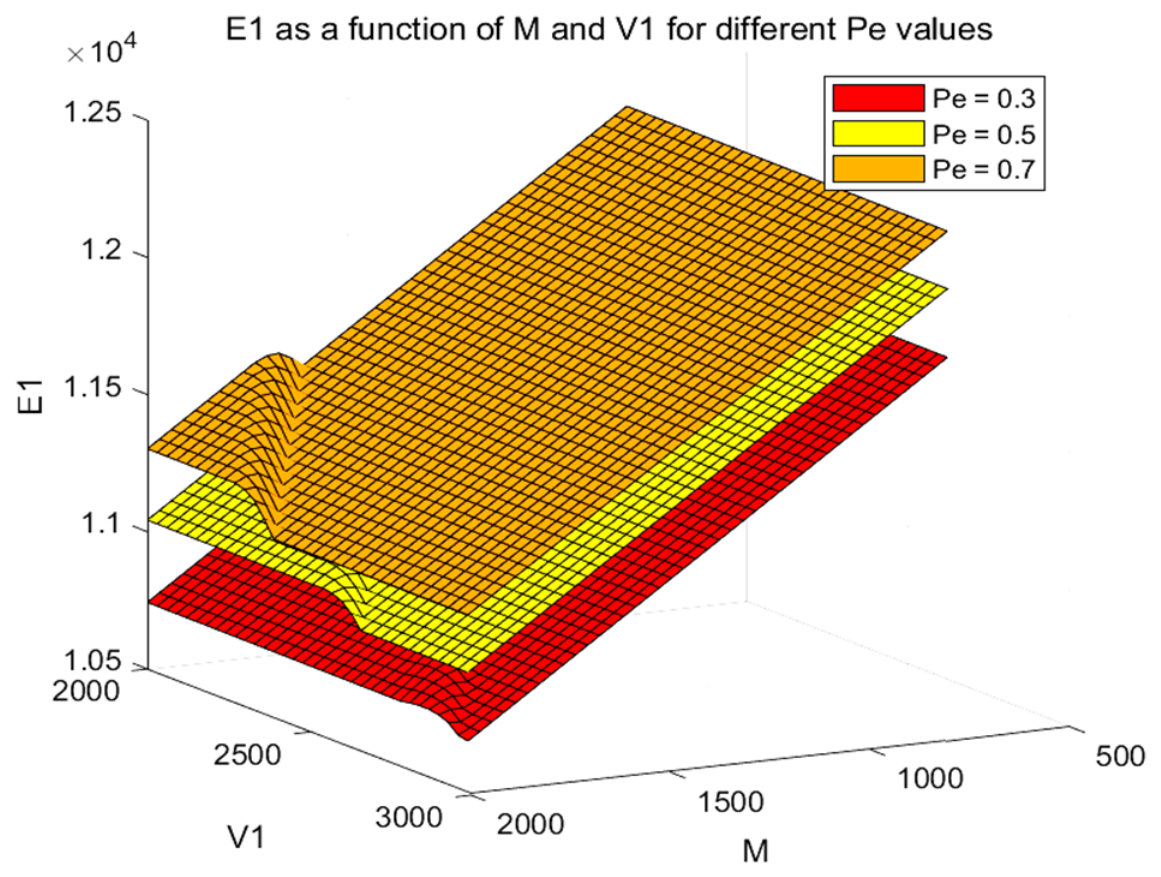
Figure 15 illustrates the sensitivity of the owner’s expected utility (
E1) to the contractor’s expected return (
M), project scale (
V1), and time effort (
Pe). Sensitivity analysis reveals a distinct “Inverted U-shaped” relationship between
M and
E1, while
E1 exhibits a consistent positive correlation with
V1 and
Pe. Analytically, the non-linear trend of
M reflects a trade-off between the “incentive effect” and the “opportunism effect.” Initially, increasing
M aligns the contractor’s interests with the owner’s, motivating resource investment and quality improvement. However, beyond an optimal threshold, excessive returns induce moral hazard, where the contractor prioritizes short-term profit maximization over quality, leading to diminishing marginal utility for the owner. The positive impact of
Pe confirms that time effort acts as a reliable signal of commitment, significantly elevating the utility surface. Managerially, this implies that owner utility is maximized within a “moderate profit interval.” Owners should design contracts that avoid both under-incentivizing (leading to low effort) and over-incentivizing (inducing profiteering). Furthermore, promoting high early completion effort levels (
Pe) is a robust strategy to sustain high utility regardless of profit fluctuations.
4.4. Incomplete Information Simulation
Under the condition of incomplete information, the quality control decision-making behavior of the owner is closely related to the behaviors of the contractor and the supervisor. The following analysis focuses on the owner’s quality control decision-making behavior under asymmetric information. The effects of
,
, and
on the optimal supervision probability
under different fixed parameter combinations are analyzed, as shown in
Figure 16,
Figure 17 and
Figure 18.
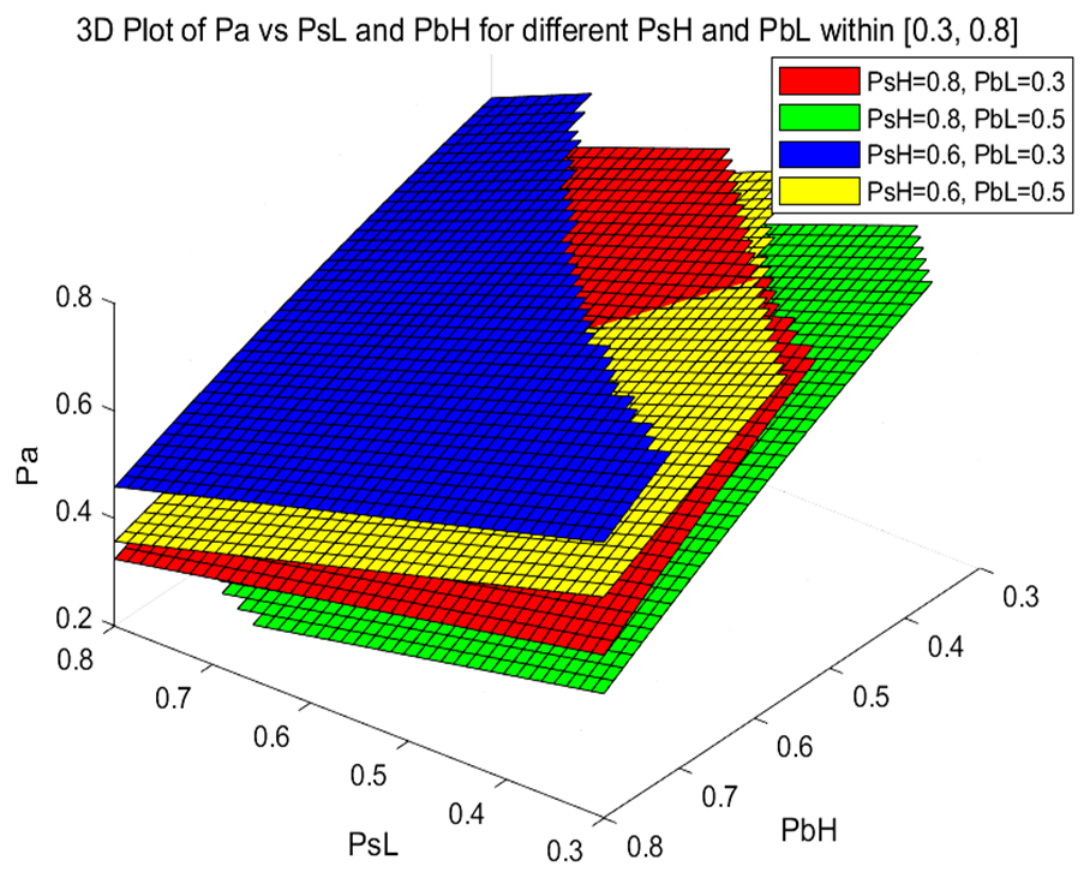
Figure 16 elucidates the sensitivity of the owner’s quality supervision level (
Pa) to the lower limit of supervisor probability-based behavior (
PsL) and the upper limit of contractor probability-based behavior (
PbH). Sensitivity analysis reveals a distinct “substitution effect,” where
Pa exhibits a negative correlation with both
PsL and
PbH. Analytically, the increase in
PsL establishes a reliable “baseline defense” against quality risks. As the supervisor’s minimum competence rises, the uncertainty in the agency relationship diminishes, allowing the owner to substitute costly direct monitoring (
Pa) with the supervisor’s delegated oversight. Similarly, a high
PbH signifies strong “endogenous reliability” of the contractor, reducing the probability of moral hazard and thereby lowering the necessity for external intervention. Managerially, this suggests a “threshold-based resource optimization” strategy. Owners should prioritize ex ante screening mechanisms—setting high entry thresholds for both contractor and supervisor capabilities—over ex post intensive monitoring. Investing in probability-based behavior screening yields long-term cost savings by significantly reducing the marginal need for owner supervision.
Figure 17 illustrates the sensitivity of the owner’s supervision level (
Pa) to the supervisor’s lower probability-based behavior bound (
PsL) and the contractor’s upper probability-based behavior bound (
PbH), with the contractor’s upper time effort bound (
PeH) as a key moderating factor. Sensitivity analysis reveals that
Pa is highly elastic to the improvement of ex ante probability-based behavior thresholds, but the direction of
PbH’s impact on Pa depends on
PbH. When
PbH is high (e.g., aggressive schedule compression) and
PbH is low (e.g., weak quality control),
Pa increases to counter heightened quality risk (positive
PbH −
Pa relationship). Conversely, when PeH is high but
PbH is high (e.g., strong quality control),
Pa decreases as internal quality assurance buffers the risk (negative
PbH − Pa relationship). This confirms that
Pe’s impact on
Pa is not universal—it is mediated by the contractor’s quality probability-based behavior and the nature of time effort. Analytically, raising
PsL establishes a robust “risk control baseline.” When the minimum supervision level is guaranteed, the probability of undetected defects decreases, allowing the owner to reduce costly direct monitoring (
Pa) without compromising quality assurance. Similarly, a higher
PbH signifies the contractor’s technical potential and reliability, effectively reducing information asymmetry and the necessity for intensive oversight. Managerially, this suggests a strategic shift from “ex post monitoring” to “ex ante screening.” Owners should prioritize setting stringent qualification thresholds (high
PsL and
PbH) during the bidding phase, as investment in probability-based behavior screening yields higher marginal returns than subsequent intensive supervision. Furthermore, dynamic incentive mechanisms should be designed to encourage contractors to operate near their upper probability-based behavior bound (
PbH), thereby optimizing the overall governance cost structure.
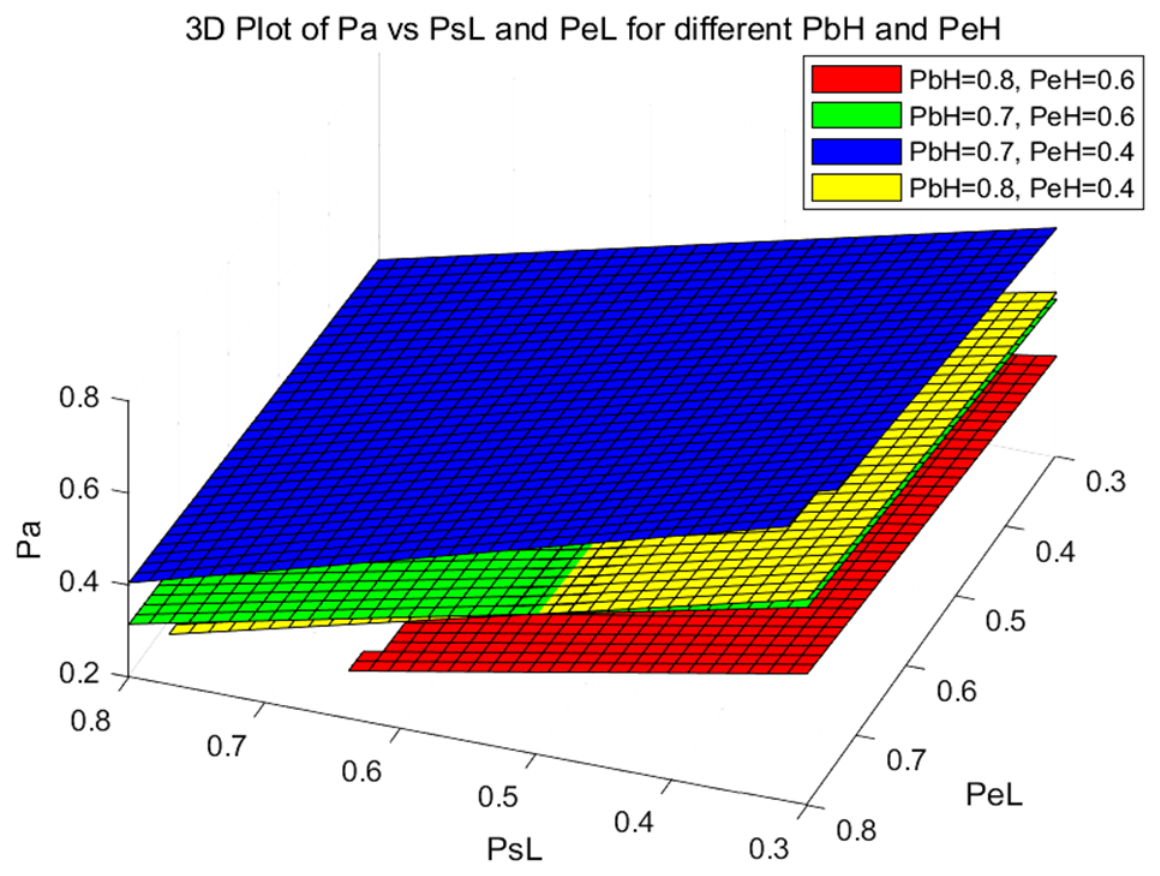
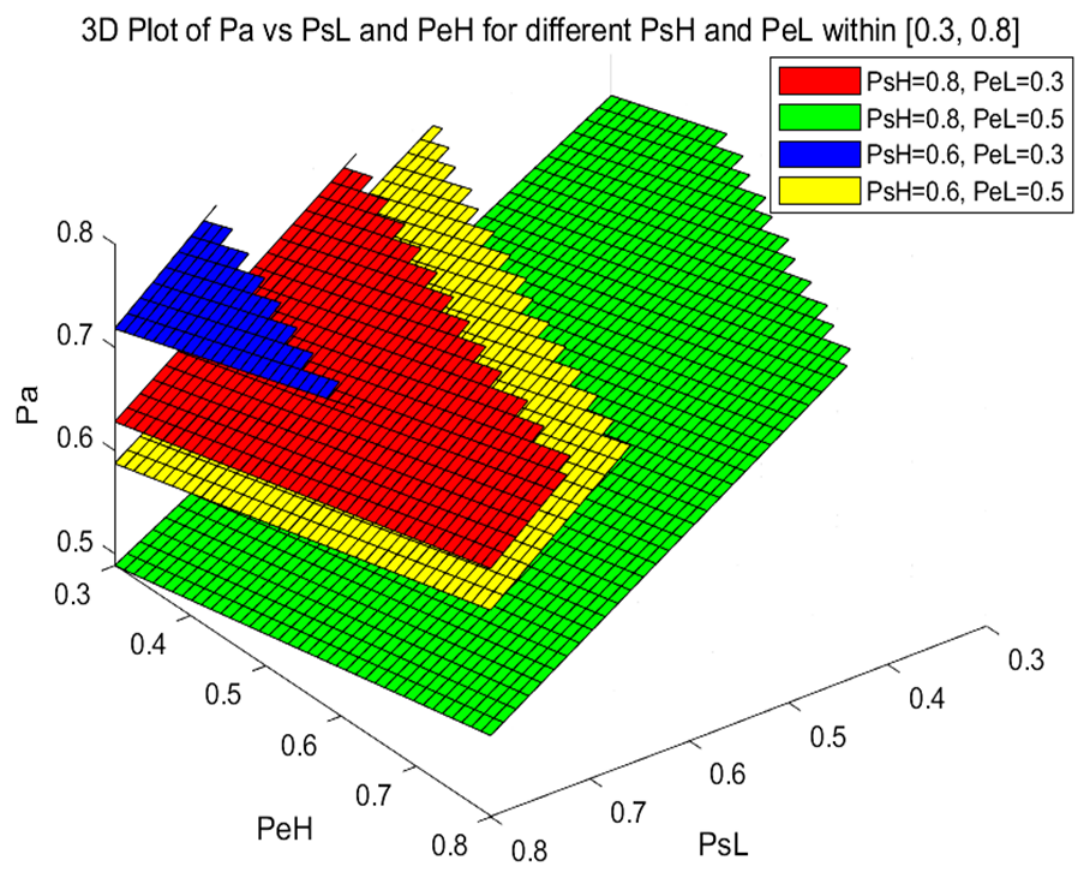
Figure 18 elucidates the sensitivity of the owner’s supervision level (
Pa) to the supervisor’s lower probability-based behavior bound (
PsL) and the contractor’s lower effort bound (
PeL). Sensitivity analysis reveals a consistent negative correlation, indicating that
Pa is highly elastic to improvements in the minimum performance thresholds. Analytically, raising
PsL enhances the “risk absorption capacity” of the supervision system. A higher minimum supervision level ensures a baseline quality of defect detection, allowing the owner to reduce direct monitoring intensity without increasing exposure to residual risk. Similarly, a higher
PeL establishes a “floor” for project execution, reducing the volatility of the contractor’s performance. This constraint on the worst-case scenario minimizes the probability of severe quality failures, thereby decreasing the necessity for intensive owner oversight. Managerially, this suggests a “threshold-based governance” strategy. Owners should prioritize enforcing strict minimum entry and performance criteria (setting high
PsL and
PeL) over continuous high-intensity monitoring. Establishing rigorous “bottom lines” in contracts acts as an effective substitute for ex post supervision, optimizing the allocation of management resources.
Overall, the Supervisor’s lower limit of supervision level PsL has a significant impact on the owner’s decision-making. When PsL is improved, the Supervisor can more effectively identify and handle problems during construction, reducing the owner’s concerns about project quality and thus lowering the quality supervision level Pa. At the same time, although the upper limit PsH of the supervision level of the Supervisor is not intuitively reflected on the coordinate axis, different colored surfaces represent different combinations of values related to the contractor’s variables, which will adjust the relationship between PsL and Pa, reminding the owner to consider multiple factors comprehensively when evaluating the supervisory role. From the perspective of the contractor’s factors, whether it is the increase in the upper limit PbH or lower limit PeL of the contractor’s quality control level, it signals to the owner that the engineering quality is more guaranteed. As the contractor’s quality compliance behavior is enhanced, the possibility of quality problems occurring is reduced, and the owner can correspondingly reduce the investment in quality supervision.
The effects of
,
, and
on the optimal quality guarantee deposit
under different fixed parameter combinations are analyzed, as shown in
Figure 19 and
Figure 20.
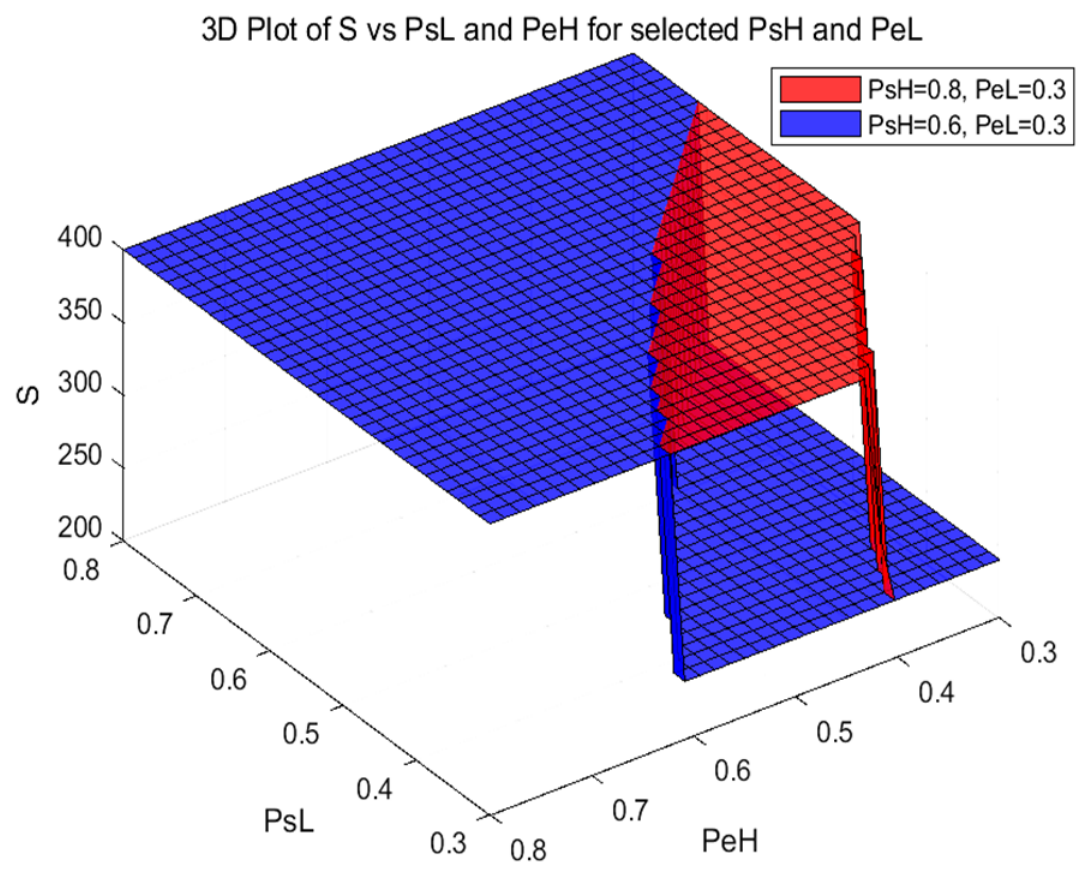
Figure 19 elucidates the sensitivity of the quality guarantee deposit (
S) to the supervisor’s lower probability-based behavior bound (
PsL), the contractor’s upper probability-based behavior bound (
PbH), and the upper time effort bound (
PeH). Sensitivity analysis reveals divergent trends:
S exhibits a negative correlation with
PsL and
PbH, but a positive correlation with
PeH. Analytically, the negative response to
PsL and
PbH reflects a “probability-based behavior substitution effect.” Higher technical probability-based behavior (
PbH) and guaranteed supervision baselines (
PsL) serve as internal risk buffers, reducing the owner’s reliance on external financial constraints like
S. Conversely, the positive correlation with
PeH indicates a “speed–quality trade-off.” A high upper bound of time effort (
PeH) signals an aggressive pursuit of schedule compression, which statistically correlates with increased quality risks. Consequently, the owner must increase
S as a “risk premium” to hedge against the potential quality failures induced by rushing. Managerially, this suggests implementing a “differentiated deposit strategy.” Owners should reduce deposits for high-probability-based behavior contractors to optimize their capital flow, while imposing “acceleration premiums” on deposits for projects with tight schedules to enforce quality accountability.
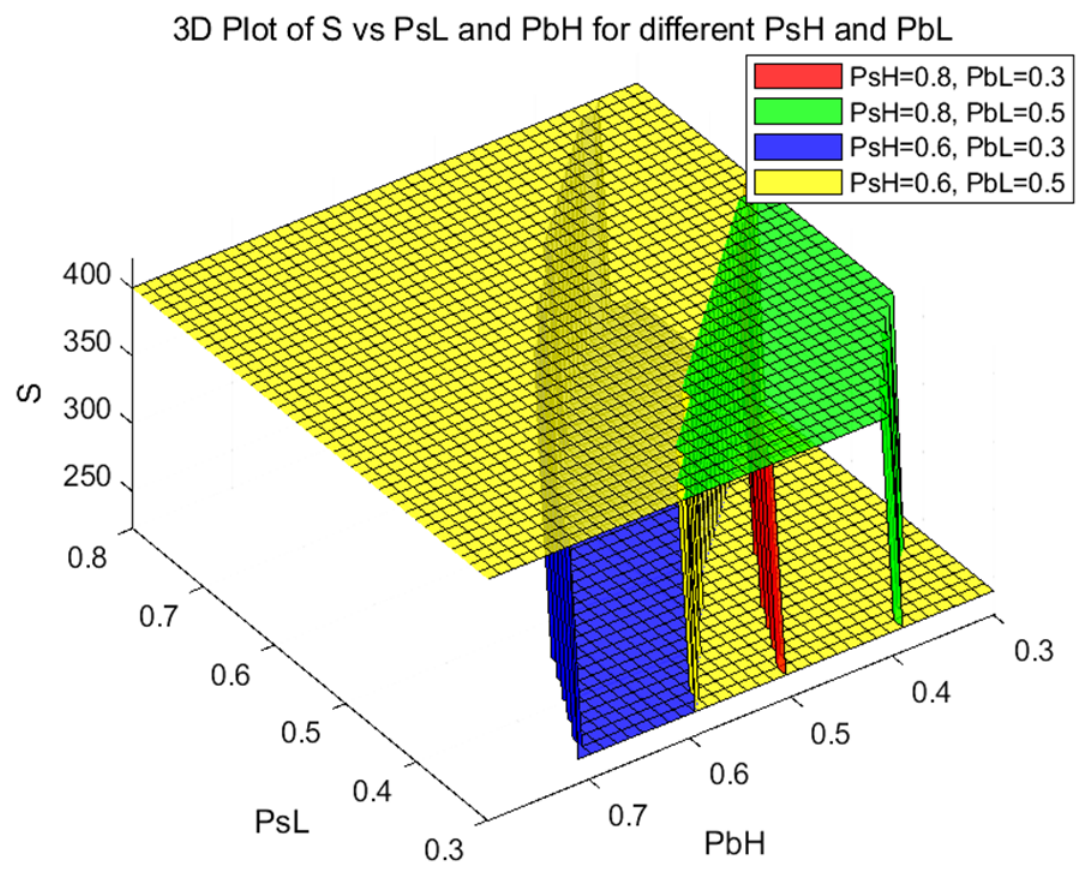
Figure 20 illustrates the multidimensional sensitivity of the quality guarantee deposit (
S) to the supervisor’s lower probability-based behavior bound (
PsL) and the contractor’s upper probability-based behavior bound (
PbH), moderated by the supervisor’s upper bound (
PsH) and the contractor’s lower bound (
PbL). Sensitivity analysis confirms a consistent negative correlation between probability-based behavior bounds (
PsL,
PbH) and
S, reflecting a “probability-based behavior-collateral substitution effect.” As the technical reliability of both parties improves, the owner can substitute costly financial retention with trust in technical competence, thereby optimizing the contractor’s capital liquidity. Furthermore, the divergent surfaces representing different (
PsH,
PbL) combinations demonstrate significant interaction effects. A higher floor for contractor quality (
PbL) or a higher ceiling for supervision (
PsH) further reduces the required deposit level, indicating that system-wide reliability is determined by the interplay of all four parameters. Managerially, this suggests a “Parametric Deposit Strategy”: rather than applying a fixed rate, owners should adopt a dynamic deduction mechanism where the deposit ratio is calculated based on a comprehensive probability-based behavior matrix. Contractors with higher proven performance bounds should be rewarded with reduced financial burdens to incentivize continued excellence.
The effects of
and
on the optimal penalty
under different fixed parameter combinations are analyzed, as shown in
Figure 21.
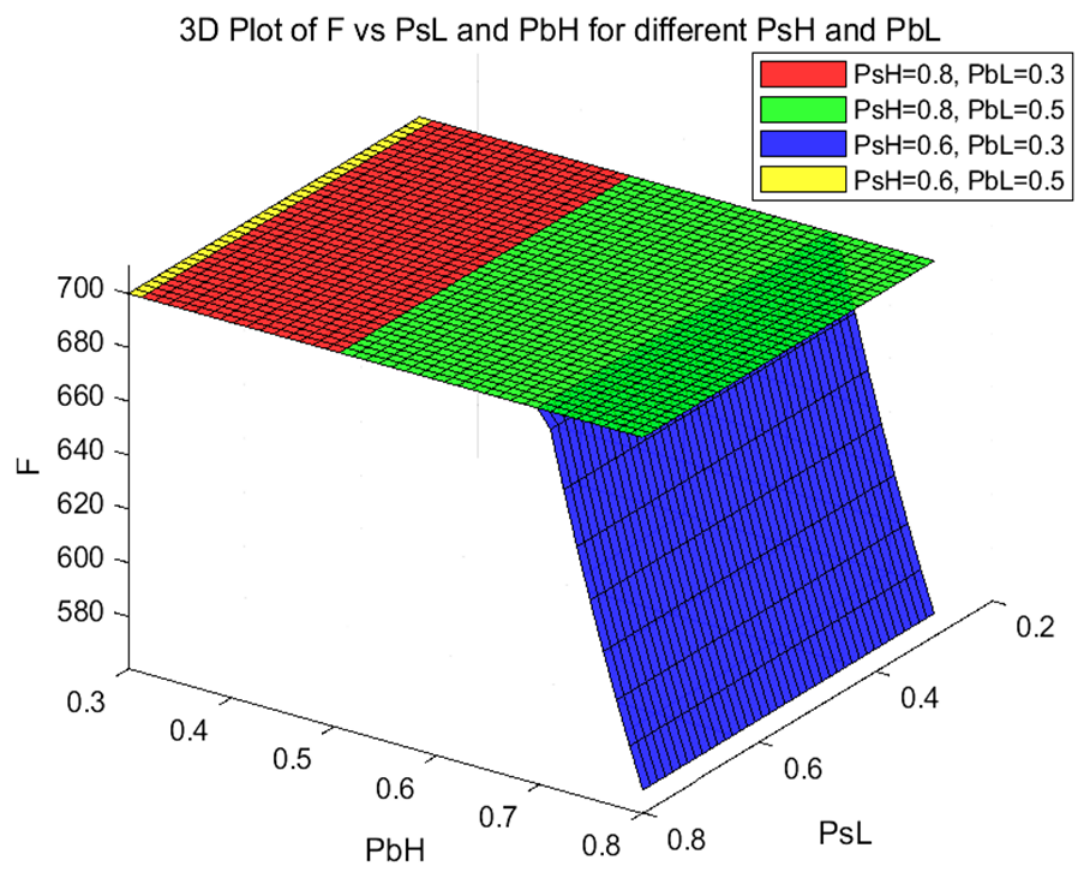
Figure 21 elucidates the sensitivity of the penalty for supervision dereliction (
F) to the supervisor’s lower probability-based behavior bound (
PsL) and the contractor’s upper probability-based behavior bound (
PbH), while highlighting the moderating effects of
PsH and
PbL. Sensitivity analysis confirms a negative correlation between probability-based behavior parameters (
PsL,
PbH) and
F. Analytically, this trend reflects a “necessity attenuation mechanism” for penalties. A higher
PsL guarantees a baseline of supervision quality, reducing the probability of severe negligence and thereby diminishing the need for high punitive deterrence. Similarly, a higher
PbH creates a “performance buffer,” where the contractor’s superior probability-based behavior mitigates the quality risks associated with potential supervision lapses, effectively lowering the penalty burden on the supervisor. Furthermore, the interaction of the moderating variables (
PsH,
PbL) demonstrates that system reliability is multiplicative; a robust supervisory ceiling (
PsH) and a high contractor floor (
PbL) further compress the required penalty level. Managerially, this suggests implementing a “probability-based behavior-based penalty exemption” strategy. Owners should calibrate penalty clauses dynamically, reducing penalty thresholds for high-probability-based behavior supervisors or when engaging high-performance contractors, thereby aligning punitive risks with actual exposure to quality failures.
The effects of
,
, and
on the owner expected utility
under different fixed parameter combinations are analyzed, as shown in
Figure 22 and
Figure 23.
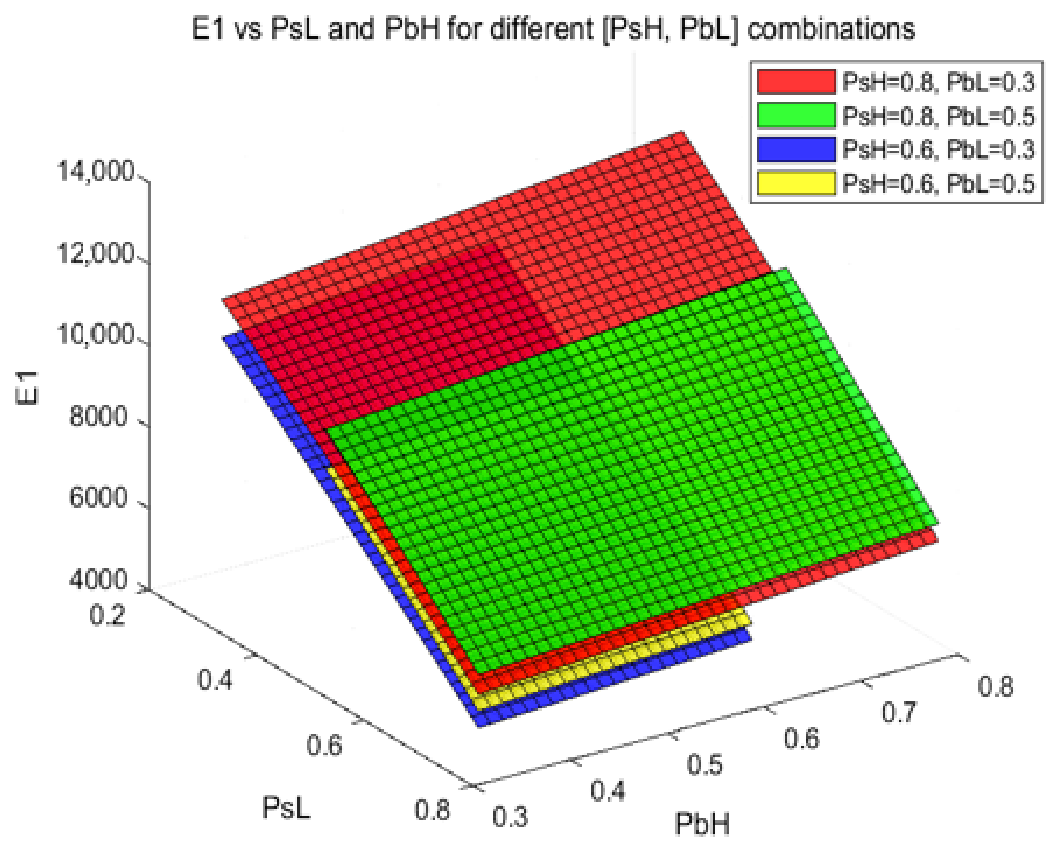
Figure 22 elucidates the sensitivity of the owner’s expected utility (
E1) to the supervisor’s lower probability-based behavior bound (
PsL) and the contractor’s upper probability-based behavior bound (
PbH), with significant moderating effects from
PsH and
PbL. Sensitivity analysis confirms that
E1 is positively correlated with both
PsL and
PbH. Analytically,
PsL acts as a “risk control baseline,” where raising the supervision floor minimizes the probability of quality failures and stabilizes returns. Conversely,
PbH represents the “value creation ceiling,” where a higher technical limit enables the contractor to deliver superior quality and efficiency, directly expanding the owner’s profit margin. Furthermore, the steeper utility surface observed at high
PsH and
PbL values indicates a “synergistic enhancement effect.” This suggests that in a high-probability-based behavior ecosystem, improvements in boundary parameters yield disproportionately higher marginal returns. Managerially, this implies a “dual-threshold-driven strategy.” Owners should simultaneously mandate strict entry thresholds for supervision (
PsL) to secure the baseline, while incentivizing contractors to unlock their maximum technical potential (
PbH) to maximize upside gains.
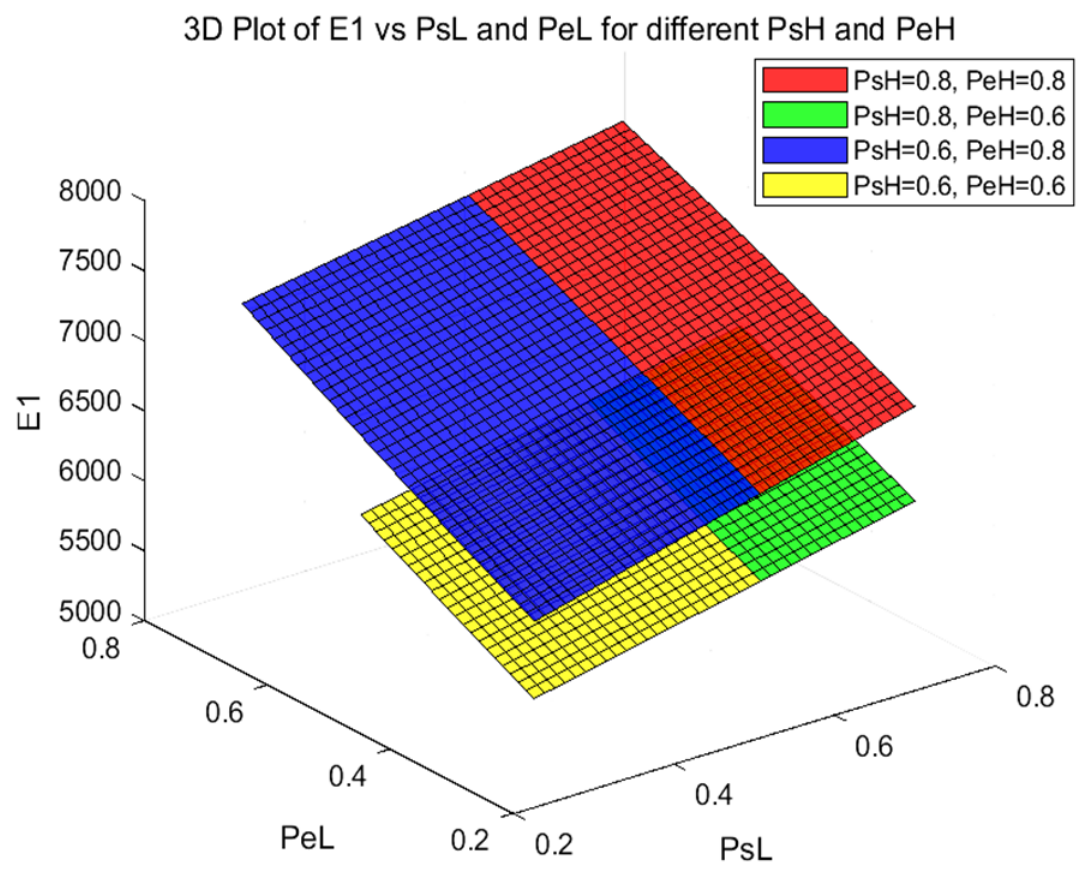
Figure 23 illustrates the sensitivity of the owner’s expected utility (
E1) to the supervisor’s lower probability-based behavior bound (
PsL) and the contractor’s lower effort bound (
PeL), moderated by their respective upper bounds (
PsH,
PeH). Sensitivity analysis confirms a positive correlation between the lower bounds (
PsL,
PeL) and
E1. Analytically, raising these lower bounds establishes a robust “risk floor,” minimizing the probability of worst-case performance scenarios and ensuring project stability. Crucially, the interaction effects reveal a “complementary synergy.” The marginal utility gain from increasing lower bounds is significantly amplified when the upper bounds (
PsH,
PeH) are also high. This indicates that a high-potential environment (high upper bounds) facilitates the translation of baseline improvements into superior outcomes, whereas a low-ceiling environment would constrain such benefits. Managerially, this suggests a “dual-track driving strategy.” Owners should not only enforce strict minimum performance standards (
PsL,
PeL) to secure a baseline but also invest in enhancing the system’s maximum potential (
PsH,
PeH). The simultaneous elevation of both “floor” and “ceiling” generates a multiplicative effect on expected returns, outperforming isolated improvements.
Overall, the expected return E1 of the owner reaches its highest value when the supervisor and contractor’s supervision and quality control levels are high, and drops to its lowest value when both are low. This change trend reflects the synergistic effect between the Supervisor and the contractor in the supply chain. It also indicates that the owner needs to guide the Supervisor and the contractor to maintain a high level of performance during the construction process through reasonable contract design and incentive mechanisms. The owner can improve their expected returns by allocating resources reasonably, increasing the lower limit of supervision level PsL of the supervisor and the lower limit of quality control level PeL of the contractor, such as providing more professional training for the supervisor and requiring the contractor to improve their quality management system.
The research results indicate that under incomplete information conditions, the owner needs to guide the supervisor and contractor to maintain a high level of performance during the construction process through reasonable contract design and incentive mechanisms to maximize their expected benefits. This discovery provides a theoretical basis and practical guidance for water conservancy engineering supply chain management. In practical engineering, the owner can dynamically adjust the incentive mechanism to ensure that all parties in the supply chain maintain high-quality standards and time management efficiency during the construction process, thereby achieving overall project optimization.




 ,
,