1. Introduction
Financial markets process information from multiple sources, including macroeconomic releases, corporate disclosures, regulatory announcements, financial news, and broader public narratives. Traditional asset-pricing approaches emphasize the incorporation of fundamental information into market prices, whereas behavioral finance and narrative economics additionally recognize that the interpretation, diffusion, and framing of information can shape investor expectations and risk perceptions. These perspectives are complementary rather than mutually exclusive: market prices may reflect both changes in underlying fundamentals and changes in expectations generated by the arrival and interpretation of new information. Within this setting, computational analysis of financial text provides a means of transforming continuously generated qualitative information into quantitative sentiment measures that can be evaluated jointly with observed market variables.
This informational mechanism is particularly relevant to environmental, social, and governance (ESG) investing. ESG-related information can affect expectations concerning future cash flows, regulatory compliance costs, financing conditions, transition risks, reputational exposure, and long-term competitive positioning. Importantly, the market interpretation of such information need not be homogeneous across sectors or stable over time. A decarbonization policy, for example, may imply additional transition costs for carbon-intensive firms while simultaneously improving expected opportunities for firms providing digital or low-carbon technologies. Changes in the tone of ESG and transition-related narratives may therefore alter investor expectations and risk assessments, potentially generating portfolio reallocation, return adjustments, and changes in conditional volatility. Textual sentiment and financial volatility are consequently linked through an information-processing channel: when new narratives modify the distribution of market expectations or increase disagreement regarding future economic conditions, their informational content may subsequently be reflected in market returns and volatility. Whether textual sentiment contains statistically significant information about these subsequent market dynamics, however, remains an empirical question. This question is particularly relevant in the context of Europe’s simultaneous green and digital transformation. The so-called twin transition exposes firms and investors to overlapping sources of uncertainty arising from decarbonization policies, energy-security concerns, technological change, regulatory intervention, financing conditions, and geopolitical developments. Romania provides a useful setting for examining these interactions because the selected market entities exhibit materially different exposures to energy transition, banking transformation, and digitalization. The empirical design therefore considers representative entities including OMV Petrom and Hidroelectrica in energy, Banca Transilvania in banking, and UiPath as a technology-related case, while the DAX is employed as a broader European industrial-market proxy. The purpose of this multi-entity design is not to infer sector-wide behavioral laws from individual firms, but to examine whether sentiment–market relationships differ across cases exposed to distinct dimensions of the green and digital transition.
A central empirical problem concerns the temporal mismatch between rapidly evolving market information and the availability of conventional macroeconomic indicators. Measures such as gross domestic product, industrial production, and inflation are released according to predetermined statistical calendars and therefore become observable only after part of the economic activity they describe has already occurred. Some indicators are also subsequently revised. In this study, this delay is referred to as reporting latency: the interval between the occurrence of economically relevant developments and their representation in official macroeconomic statistics. Reporting latency does not diminish the fundamental importance of official statistics; rather, it limits their ability to reflect changes in market expectations at very short horizons. Financial news is generated continuously and can incorporate new economic, regulatory, geopolitical, and firm-specific information as events unfold. This temporal asymmetry motivates the investigation of textual sentiment as a complementary high-frequency information source that may contain predictive information before corresponding developments are fully reflected in lower-frequency macroeconomic indicators.
Transforming this textual information into a reliable quantitative measure introduces a second methodological problem. Earlier sentiment approaches frequently relied on general-purpose dictionaries, word counts, or bag-of-words representations. Although useful as benchmarks, these approaches can misclassify financial language when polarity depends on context, domain-specific terminology, syntactic structure, or negation. Such semantic measurement error is consequential for subsequent econometric analysis. If the constructed sentiment variable systematically misrepresents the informational content of financial text, estimated sentiment–market relationships may be attenuated or distorted, and apparent lead–lag patterns may reflect measurement noise rather than economically meaningful information. Domain-specific Transformer architectures such as FinBERT address part of this limitation by generating context-sensitive sentiment classifications from financial language.
Nevertheless, superior text classification alone does not demonstrate that sentiment has economic or predictive value. A sentiment measure may classify financial language accurately while providing no incremental information for subsequent market outcomes. The methodological problem is therefore two-stage. First, unstructured financial narratives must be converted into a sufficiently reliable quantitative sentiment measure. Second, the resulting measure must be subjected to formal statistical and econometric evaluation to determine whether it contains information beyond contemporaneous descriptive association. The present study addresses the first stage by constructing a threshold-calibrated Daily Sentiment Index (DSI) from FinBERT sentiment probabilities and validating the underlying classifier against manually annotated financial headlines and a Loughran–McDonald lexicon benchmark. The second stage evaluates the temporal and predictive properties of the resulting DSI through complementary time-series and forecasting procedures.
Against this background, the primary objective of this study is to construct and evaluate a domain-specific textual sentiment measure and determine whether it contains incremental predictive information for short-horizon financial market dynamics in the context of Eastern Europe’s green and digital transition. More specifically, the study evaluates whether the DSI precedes subsequent market movements, whether sentiment is associated with conditional volatility, whether these relationships differ across the selected cases and evolve over time, and whether incorporating sentiment improves short-horizon forecasting performance relative to a benchmark specification that excludes the DSI. The analysis is explicitly predictive rather than structurally causal: temporal precedence or Granger predictability is interpreted as evidence of incremental forecasting information and not as identification of an exogenous causal effect of sentiment on asset prices. Accordingly, the study addresses the following research questions:
RQ1. Does the FinBERT-derived Daily Sentiment Index contain statistically significant predictive information for subsequent market movements beyond information contained in past market dynamics?
RQ2. Does textual sentiment provide statistically significant information about conditional market volatility?
RQ3. Are sentiment–market relationships heterogeneous across the selected technology, energy, and financial-market cases and time-varying over the sample period?
RQ4. Does incorporating the Daily Sentiment Index improve short-horizon out-of-sample forecasting accuracy relative to a benchmark specification that excludes textual sentiment?
The contribution of the study is primarily methodological and empirical. First, it develops a reproducible pipeline that converts financial-news headlines into a threshold-calibrated Daily Sentiment Index using a finance-specific Transformer architecture. The reliability of the sentiment measurement stage is assessed using manually annotated headlines, intercoder agreement, classification metrics, and comparison with the Loughran–McDonald financial lexicon. Second, rather than inferring predictive value from descriptive correlations, the study integrates the DSI into a complementary econometric framework comprising lead–lag analysis, Granger predictability tests interpreted in their predictive sense, vector autoregression, GARCH(1,1) specifications, and time-varying analyses designed to examine the stability and heterogeneity of sentiment–market relationships. Predictive usefulness is further evaluated through out-of-sample forecast comparison between a sentiment-augmented specification and a benchmark model excluding the DSI. Third, the study provides context-specific evidence from selected Eastern European transition-related cases, allowing the informational content of financial narratives to be examined across assets with different exposures to digitalization, energy transition, and broader European industrial conditions. Rather than proposing a new behavioral or asset-pricing theory, the study contributes empirical evidence on when and to what extent domain-specific textual sentiment contains incremental information relevant to short-horizon financial monitoring and forecasting.
The remainder of the paper is organized as follows.
Section 2 develops the theoretical background and hypotheses.
Section 3 describes the data, sentiment-index construction, validation procedures, and econometric methodology.
Section 4 presents and discusses the empirical findings.
Section 5 concludes with the implications, limitations, and directions for future research.
3. Research Methodology
3.1. Research Hypotheses and the Systemic Resilience Framework
To evaluate the efficacy of algorithm-assisted risk analysis and its impact on financial stability, this research formalizes three core hypotheses designed to test the responsiveness of “soft data” (narrative sentiment) relative to “hard data” (market prices and volatility indices). These hypotheses focus specifically on the intersection of the “Twin Transition” and systemic resilience. The table below provides a developed view of the core hypotheses, the supporting academic literature, and the specific methodology applied in the study (
Table 2):
To rigorously evaluate H1 and determine if the DSI functions as an early-warning indicator rather than merely a coincidental metric, the methodology must extend beyond visual mirroring effects. Specifically, we test the ‘early-warning’ capacity by employing Granger predictability tests to evaluate incremental predictive temporal precedence and lead-lag analysis to determine if the DSI statistically precedes VIX and asset price movements. Additionally, a Vector Autoregression (VAR) model is utilized to examine dynamic predictive interactions, while forecast comparisons (evaluating a DSI-augmented model against a baseline model without DSI) via out-of-sample prediction tests ensure the robustness of our findings. It is a fundamental methodological premise of this study that the argument of an early-warning mechanism can be empirically sustained only if the DSI exhibits statistically significant predictive power across these specific inferential tests.
By establishing these hypotheses within a longitudinal 12-month framework (May 2025–May 2026), the methodology shifts from a static analysis to an exploratory evaluation of time-varying market behavior. The study validates these propositions to determine the extent to which algorithmic sentiment analysis can serve as a sustainable tool for modern risk management.
While computational sentiment extraction and descriptive visualizations provide essential context, they serve strictly as a preliminary exploratory analysis. To move beyond correlational associations and formally evaluate complex predictive and time-varying statistical relationships, this study integrates the NLP outputs into a robust, hybrid methodological framework: exploratory analysis statistical testing econometric modeling machine learning validation. This sequential approach ensures that descriptive trends are subjected to rigorous empirical validation before predictive interpretations are formulated.
3.2. Research Design: The Data Science Paradigm and Textual Epistemology
The methodological framework of this research employs a quantitative design grounded in the Data Science paradigm, representing a strategic departure from the rigid constraints of traditional econometrics. By shifting focus from retrospective financial ratios to unstructured “soft data”, specifically financial news feeds, this study treats informational narratives as a high-frequency information source associated with market volatility and systemic resilience. This approach recognizes that in a digitalized environment, the narratives surrounding assets may contain information about price trajectories before official economic indicators are made public, effectively transforming language into a quantifiable economic force.
The epistemological basis of this study is the “Text as Data” framework, which posits that unstructured textual information contains high-dimensional, latent data capable of predicting market behavior with greater immediacy than lagged official reports. This methodology aligns with the computational monitoring mechanisms of statistical modeling, which prioritizes the extraction of complex, non-linear patterns from real-world data over simple theory validation [
20]. Furthermore, these Big Data methodologies provide a sophisticated toolkit for identifying complex and potentially nonlinear statistical relationships that standard linear regression models may overlook [
21].
To operationalize this framework, the study utilizes Computational Content Analysis powered by Natural Language Processing (NLP), evolving beyond the limitations of traditional “Bag-of-Words” methods. Because dictionary-based approaches often ignore linguistic context, failing to distinguish, for instance, between a “liability” and its reduction, this methodology employs the FinBERT model. This deep learning architecture uses an attention-based mechanism to decode the syntax of sustainability, transforming raw text into a Daily Sentiment Index. Ultimately, this system functions as a real-time monitor of investor psychology, serving as a candidate high-frequency early-warning indicator whose predictive usefulness is evaluated against traditional “hard data” metrics.
To ensure complete empirical replicability, we explicitly recognize that methodological transparency requires the comprehensive reporting of the corpus construction, the total number of observations, the technical implementation of the FinBERT architecture, the sentiment classification procedures, the data purification workflow, and the precise mathematical parameters governing the model.
To ensure strict methodological clarity and bridge the theoretical framework with our empirical design, we explicitly distinguish between measurable constructs and interpretive heuristics. The Twin Transition is operationalized mathematically through our purposive sample selection (UiPath representing digitalization; OMV Petrom representing the green transition). Systemic resilience and sectoral decoupling are quantitatively evaluated via GARCH(1,1) conditional volatility associations and cross-asset correlation matrices. The Adaptive Market Hypothesis (AMH) is empirically tested through time-varying interactions, specifically utilizing Markov-switching regime models and dynamic rolling correlations to capture shifting investor behaviors. Conversely, concepts such as organizational adaptive capacity, cognitive desensitization, and computational monitoring are not independent mathematical variables; rather, they are explicitly employed throughout the discussion as heuristic interpretive frameworks to theoretically contextualize the observed econometric results.
3.3. Sample Justification Through the Sustainability and Resilience Lens
The research universe is defined by a purposive sampling strategy designed to analyze context-specific evidence of market behavior during the “Twin Transition”, the concurrent shift toward green and digital economies. This study focuses on strategic proxies serving as an illustrative case selection that captures specific sectoral dynamics: energy security, digital inclusion, and operational efficiency. The methodology employs a 12-month longitudinal window spanning from May 2025 to May 2026, creating a high-resolution environment to test how narrative-associated volatility interacts with sustainability-oriented assets during a period of industrial friction and geopolitical instability.
It is crucial to clarify that this selection functions as a multi-sectoral case study rather than a representative sample of the entire European market. These specific entities were chosen due to their distinct sectoral relevance (technology, energy, finance), high data availability, pronounced exposure to ESG and digitalization narratives, and their significant roles in local and regional markets. However, we explicitly acknowledge that these entities cannot be treated as a universal proxy for broader European dynamics. The sample’s small size, geographic concentration, and sectoral heterogeneity inherently limit external validity. Consequently, the results offer sector-bounded, exploratory insights rather than broadly generalizable claims across the continent.
The selection of the Romanian market and its regional proxies is justified by its empirical characteristics, which provide a particularly informative setting for narrative economics. Compared with mature, highly liquid Western markets, this specific Eastern European ecosystem exhibits structural rigidities, shallower liquidity pools, and susceptibility to governmental regulatory interventions. Furthermore, its direct geographical proximity to the ongoing geopolitical conflict in Ukraine, combined with a distinct national energy mix ranging from state-backed renewables to major fossil fuel players, creates an environment in which narrative analysis is particularly relevant. Information concerning energy security or digital transitions may be associated with market responses of different timing and magnitude than in dominant global economies [
22]. By isolating this specific market, the study examines high-frequency sentiment responses and whether localized market dynamics are associated with relative divergence from broader regional patterns (
Table 3).
It is imperative to state that a 12-month timeframe cannot capture a full economic cycle, given that macroeconomic cycles typically unfold over 3 to 10 years and encompass structurally distinct phases, including expansion, peak, contraction, and recovery. Consequently, any attempt to extrapolate these results to complete economic cycles is strictly avoided, and our findings must be interpreted as context-specific patterns representing short-term dynamics. Nevertheless, this 12-month longitudinal window is highly adequate for the specific objectives of this study, which does not aim to model long-term macroeconomic evolution. Instead, this specific timeframe is explicitly tailored to capture high-frequency sentiment responses, real-time market reactions to volatile ESG, geopolitical, and technological narratives, short-term predictive relationships involving conditional volatility, and short-horizon market responses to newly available information.
The specific 12-month longitudinal window, concluding in May 2026, was deliberately selected because it contains a relatively high concentration of relevant informational shocks. This period captures narrative variation concerning the European energy transition, the deployment of critical digital infrastructure, and shifting geopolitical realities. These informational flows provide sufficient variation to examine the proposed short-horizon relationships and systemic-resilience hypotheses, while the limited temporal window remains an acknowledged constraint. Extending the observation period therefore constitutes a valuable avenue for future research and would allow the stability of the present findings to be assessed across a broader range of market conditions.
The energy sector’s transition is examined through the contrast between Hidroelectrica and OMV Petrom. As a pure-play renewable provider, Hidroelectrica serves as the regional benchmark for decarbonization, while OMV Petrom reflects the fossil-fuel sector’s exposure to climate regulations and geopolitical supply risks. This comparative approach aligns with established transition frameworks suggesting that the speed of energy shifts is determined by the friction between existing regimes and green innovations [
23,
24]. This selection allows the research to determine whether market sentiment prioritizes long-term renewable stability or remains tied to the volatility of fossil-fuel supply chains.
Social sustainability and financial democratization are analyzed through the digital transformation of the Romanian domestic economy, represented by Transilvania Bank (BT). Its strategic implementation of the EU ID wallet is treated as a core mechanism for digital inclusion and social resilience. Such digital transitions are considered essential for sustainable recovery, as they facilitate financial access for underbanked populations while reducing the carbon footprint of physical infrastructure [
25]. Consequently, BT serves as a key control variable representing the intersection of digital efficiency and social equity in a volatile climate.
Finally, UiPath is selected to represent the “growth” factor within the digital resilience paradigm, testing how digital-first assets perform against macroeconomic headwinds. Economically, UiPath embodies “operational sustainability,” utilizing automation and AI to optimize resource allocation [
18]. By decoupling corporate value from physical resource constraints and traditional industrial cycles, this selection measures whether innovation-driven narratives can temporarily insulate specific assets from the systemic negativity surrounding the regional ‘old economy.’ To effectively measure this divergence, the German DAX index was explicitly selected as the baseline macroeconomic proxy. Because the DAX is heavily weighted toward traditional manufacturing, automotive, and heavy industries, it provides a highly accurate and structural benchmark for the European ‘old economy’ industrial cycle, serving as a necessary counterweight to evaluate the relative stability of digital and renewable case studies. However, as an inherent limitation, it must be explicitly noted that the DAX strictly represents a specific heavy-industry structure and should not be interpreted as a universal proxy for the entirety of the European macroeconomy.
3.4. Data Collection and Context-Aware Purification (Data Mining)
The empirical integrity of computational analysis depends entirely on the transparency, quality, and rigorous purification of its input data. To ensure strict methodological transparency and replicability, the data retrieval procedure was formalized through an automated programmatic pipeline. Specifically, the primary textual dataset was extracted via The Guardian Open Platform API and Yahoo Finance API, targeting a strictly bounded 12-month longitudinal period from May 2025 to May 2026. The selection of The Guardian as the primary source for unstructured narrative discourse is fundamentally justified by its highly stable API, exceptionally clean metadata architecture, and consistent, high-density editorial coverage of European ESG transitions and macroeconomic dynamics. This source provides a coherent and well-structured corpus highly suitable for preliminary exploratory analysis. However, we explicitly caution that its specific editorial stance and narrative style should not be interpreted as fully representative of all diverse European media ecosystems, which is why rigorous automated deduplication and contextual filtering procedures were strictly applied prior to algorithmic ingestion to minimize structural noise.
To ensure absolute methodological integrity and prevent any form of look-ahead bias, the temporal boundaries of the dataset were strictly defined and enforced prior to the commencement of the analysis. The automated data extraction protocol officially concluded on May 12, 2026. We explicitly confirm that all textual and financial data utilized in this study were publicly available and fully accessible at the exact time of analysis; no subsequent data revisions or late-published indicators were retroactively included. To systematically eliminate look-ahead bias, our computational pipeline incorporated rigorous timestamp verification. This programmatic constraint ensured that no market metrics, revised macroeconomic reports, or media articles published after the established cutoff date were ingested into the model. Consequently, the algorithmic evaluations were executed relying strictly on the chronological flow of information sequentially available to real-world market participants during the designated timeframe, thereby preserving the authenticity of the associative and predictive frameworks.
Following extraction, the raw dataset underwent a rigorous, context-aware purification process. We applied automated filtering algorithms to eliminate syndicated media duplicates, non-English articles, and items with insufficient informational density (specifically, headlines containing fewer than 5 words, ensuring the text provided sufficient syntactic structure for the Transformer’s attention mechanism), reducing the corpus to a final, highly representative analytical sample of 14,210 unique headline observations. The distributional breakdown of this final dataset was strictly categorized to ensure balanced sectoral representation: 4150 articles pertained to the technology and AI sector (UiPath), 5320 articles focused on the energy transition and geopolitical dynamics (OMV Petrom and Hidroelectrica), 2840 articles covered banking and digital inclusion (Transilvania Bank), while the remaining 1900 articles captured broad European macroeconomic sentiment associated with the DAX index. Data retrieval was executed using strict entity-matching queries (e.g., \”UiPath\” AND (\”AI\” OR \”earnings\” OR \”tech\”); \”OMV Petrom\” AND (\”energy transition\” OR \”geopolitics\” OR \”supply\”)). To ensure precise temporal alignment with the financial markets, article publication timestamps (UTC) were strictly synchronized with local market closing times (16:00 GMT+2). Articles published post-market close, or during weekends and non-trading holidays, were algorithmically rolled over to the subsequent trading day () to accurately reflect when the information could realistically be priced into the assets.
Regarding textual preprocessing, it is critical to distinguish between the primary Transformer model and the baseline dictionary. For the FinBERT architecture, the text (specifically the article headlines, to capture high-density sentiment without the noise of full-text body paragraphs) was preserved in its raw, unlemmatized state, retaining stop-words and natural punctuation. This is imperative because Transformer attention mechanisms rely on complete syntactic structures to resolve contextual nuances like negations. Conversely, traditional NLP preprocessing (including lowercasing, stop-word removal, and lemmatization) was applied exclusively to the baseline comparison dataset used for the Loughran-McDonald dictionary test [
26].
The most critical phase involved context-aware data cleaning to address the “semantic noise” inherent in unstructured web data. Exploratory analysis identified significant lexical ambiguities; for instance, the acronym “BVB” refers to the Bucharest Stock Exchange in a local context but frequently denotes a football club in global news. Without a context-aware filtering protocol, sports-related headlines would introduce “sentiment contamination,” erroneously signaling negative volatility for the Romanian capital market.
To rectify this, a protocol was implemented to systematically remove entries containing non-financial keywords. Furthermore, the purification process addressed the removal of duplicates resulting from news syndication. Eliminating these redundancies was essential to prevent the over-weighting of specific media events during the calculation of the Daily Sentiment Index [
27].
3.5. Algorithmic Architecture: FinBERT and the Construction of the Daily Sentiment Index (DSI)
The operationalization of the “Text as Data” framework is achieved through a specialized computational pipeline that moves beyond basic word counting toward a contextual understanding of the “syntax of finance.” Central to this process is FinBERT, a Large Language Model (LLM) based on the Bidirectional Encoder Representations from Transformers (BERT) architecture. FinBERT is utilized instead of generic models due to the unique nature of financial terminology; in a market context, words that typically carry negative connotations in general prose are often neutral or even positive. Standard dictionaries frequently misclassify terms like “liability” or “tax,” whereas FinBERT is trained to accurately interpret their roles within corporate filings and earnings transcripts [
13].
To ensure rigorous methodological transparency and exact replication, we explicitly define our computational framework as a sequential pipeline: unstructured text input
preprocessing
tokenization
model inference
aggregation
DSI generation. Prior to model ingestion, the unstructured textual data underwent a minimal preprocessing pipeline strictly limited to UTF-8 encoding normalization and the removal of residual HTML tags, explicitly preserving natural punctuation, stop-words, and raw syntactic structures. [
28]. This unlemmatized text was subsequently tokenized utilizing the native BERT WordPiece tokenizer, strictly configured with a max_length parameter constrained to 128 tokens, dynamic padding, and explicit truncation. We deployed the pre-trained ProsusAI/finbert model accessed via the HuggingFace repository. Given that the selected model (ProsusAI/finbert) is already rigorously pre-trained on large-scale financial corpora (e.g., Financial PhraseBank), it was deployed directly for zero-shot inference without further task-specific weight updates. The computational pipeline was accelerated within a dedicated GPU environment utilizing an NVIDIA Tesla T4 (16 GB VRAM), operating on PyTorch 2.0 and CUDA 11.8. To guarantee complete reproducibility across identical experimental setups, a strict computational protocol was enforced by establishing a global random seed of 42 alongside a deterministic backend. Ultimately, the predictive efficacy of this pre-trained architecture on our specific corpus was rigorously validated through comprehensive evaluation metrics. During inference, the attention mechanism evaluates the contextual syntax (e.g., negations), outputting discrete softmax probabilities (P
positive, P
negative, P
neutral) which are subsequently mapped to a continuous polarity scale [−1.0, +1.0].
The deployment of the FinBERT architecture is strictly necessitated by the complex informational environment of the analyzed market. In an economic sector characterized by high volatility and heavy regulatory intervention, standard lexicon-based approaches are fundamentally inadequate for capturing the nuanced syntax of finance. While FinBERT itself is an established tool, the specific applied contribution of this study lies in the context-specific preprocessing and aggregation pipeline designed to handle localized market discourse. The custom algorithm integrates class balance calibration and strict linguistic normalization to explicitly isolate and filter out the ‘sentiment contamination’ prevalent in regional news syndication. This contextual aggregation mechanism reduces the influence of peripheral mentions and ambiguous local acronyms on the Daily Sentiment Index, thereby improving the contextual relevance of the sentiment measure used in the subsequent econometric analysis.
Since financial markets are driven by aggregate consensus, raw output scores are synthesized into a unified time-series metric to correlate “soft data” with daily asset prices. The Daily Sentiment Index (DSI) is defined as the arithmetic mean of the polarity scores for all relevant news items published within a 24 h trading window. This method smooths out intraday noise and identifies the prevailing market narrative.
The mathematical formulation for the Index for a specific entity on day t is defined as follows:
where
represents the total volume of news articles associated with a specific entity or topic on day
t, and
is the individual polarity score of article
i. It is critical to emphasize that the DSI is not a ‘raw’ metric, but a derived econometric construct that requires robust theoretical and technical justification. While the unweighted arithmetic mean serves as a baseline approximation, our architecture incorporates necessary model calibration and normalization. To differentiate event intensity and filter ambient semantic noise, we implemented a threshold tuning mechanism (class balance calibration) wherein low-probability softmax outputs (
p < 0.65) are linguistically normalized to strict neutrality (S
i,t = 0). Furthermore, strict entity-relevance filtering ensures that peripheral or brief mentions do not disproportionately skew the daily index. The final DSI remains a transparent, threshold-calibrated arithmetic mean, prioritizing methodological reproducibility over opaque weighting schemes. The validity of this calibrated DSI was confirmed through benchmark validation, demonstrating superior contextual resolution when compared against traditional lexicon-based alternatives such as the Loughran-McDonald financial dictionary.
Moving beyond the structural architecture, ensuring the empirical reliability of the FinBERT output required rigorous validation protocols and robustness checks. To validate the inference performance of the pre-trained FinBERT model on our localized financial corpus, a representative pool of 500 headlines was manually annotated. To ensure high domain validity, the annotation was conducted independently by two financial researchers with expertise in European market dynamics. The annotators followed strict guidelines to classify narrative sentiment regarding fundamental asset valuation, achieving a high intercoder agreement (Cohen’s Kappa = 0.82). The resulting pool of 500 manually annotated headlines provided the broader human-labeled validation set from which the 100-headline evaluation subset reported in
Table 4 was selected. The selection and composition of this evaluation subset, together with the corresponding classification metrics, are described below.
To further assure methodological robustness and verify the reliability of the generated sentiment scores, continuous stability checks were performed. The FinBERT outputs were formally benchmarked against traditional lexicon-based alternative models, specifically the Loughran-McDonald dictionary. FinBERT consistently outperformed the lexicon baseline by effectively resolving contextual ambiguities, such as negations and domain-specific jargon, which traditional models frequently misclassified.
The superiority of the contextual embedding approach is quantitatively demonstrated in
Table 4, which contrasts the predictive performance of the pre-trained ProsusAI/finbert model against the traditional Loughran-McDonald (LM) financial lexicon on the out-of-sample test set.
Methodologically, this 100-headline evaluation subset was selected from the broader pool of 500 manually annotated headlines to ensure representation of all three sentiment classes (40 negative, 35 positive and 25 neutral). The subset was used exclusively for evaluation and was not used for model training, fine-tuning, or parameter adjustment. Accordingly, it constitutes an evaluation holdout relative to the model-estimation process, rather than a separately collected independent sample. This composition ensured that all three sentiment classes were represented in the evaluation and facilitated comparison with the Loughran–McDonald baseline. Because the pre-trained FinBERT model was deployed without task-specific fine-tuning, these 100 observations were used exclusively for evaluation and were not employed for any model-weight updates. The complete confusion matrix is reported in
Table 4. Based on this 100-headline evaluation subset, the negative class achieved a precision of 92.3% and a recall of 90.0% (F1 = 0.91); the neutral class achieved a precision of 78.6% and a recall of 88.0% (F1 = 0.83); and the positive class achieved a precision of 93.9% and a recall of 88.6% (F1 = 0.91). Overall classification accuracy was 89.0%, with a macro-F1 score of 0.88.
Furthermore, temporal stability checks were conducted by analyzing sentiment score variance across known non-volatile market periods. This confirmed that the algorithmic distribution accurately captures genuine shifts in investor psychology rather than reacting to ambient semantic noise or inherent data biases. Consequently, through out-of-sample ground-truth validation (
Table 4), baseline lexicon benchmarking, and formal stationarity testing (ADF), the statistical properties and the academic robustness of the constructed Daily Sentiment Index (DSI) are rigorously verified prior to its integration into the econometric models.
We explicitly recognize that simple descriptive correlations cannot empirically demonstrate predictive power, structural sectoral decoupling, or complex market learning effects. Consequently, to establish robust inferential depth and evaluate temporal dynamics, the descriptive Daily Sentiment Index (DSI) vectors are subjected to advanced econometric modeling. This comprehensive framework incorporates Granger predictability tests to establish predictive temporal precedence (explicitly noting that this evaluates forecasting ability, not definitive economic causality). This comprehensive framework incorporates Granger predictability tests to assess incremental predictive temporal precedence, Vector Autoregression (VAR) models to capture joint dynamic interactions, GARCH(1,1) specifications to evaluate conditional volatility associations, and dynamic lead-lag analyses to uncover lead-lag narrative relationships, all supported by rigorous robustness and statistical significance testing.
To avoid the over-interpretation of strictly descriptive associations, it is imperative that all correlational and econometric results are validated through formal statistical significance testing. Consequently, our analytical procedures have been expanded to include normality and stationarity testing, the calculation of precise p-values for all correlation matrices, formal t-tests for regression coefficients, and the systematic reporting of 95% confidence intervals.
We explicitly recognize that relying solely on static modeling substantially limits the explanatory power of the study. Financial sentiment and market volatility rarely exhibit strictly linear, time-invariant relationships. To overcome the limitations of descriptive, static frameworks, this study introduces advanced analytical modeling to rigorously examine interaction effects. Specifically, we model conditional volatility using GARCH(1,1) specifications to evaluate the predictive association between sentiment and market variance. Furthermore, regime-dependent interactions are analyzed using Markov-switching techniques to evaluate structural shifts between sentiment shocks and market behavior.
4. Results
It should be explicitly noted that the decision to focus the primary econometric reporting on UiPath, OMV Petrom, and the macro-regional DAX index was made post hoc, following preliminary data exploration. While Hidroelectrica and Transilvania Bank remain central to the conceptual framework of the ‘Twin Transition’, their early correlational profiles largely mirrored broader systemic macro-trends without displaying the acute structural divergences observed in the other assets. To maintain analytical conciseness in the main text without compromising methodological transparency, the supplementary Granger predictability and GARCH(1,1) results for the prespecified entities Hidroelectrica and Transilvania Bank are reported in
Appendix B.
Prior to examining the dynamic interdependencies and conditional volatility associations, it is essential to establish the distributional characteristics of the dataset.
Table 5 presents the descriptive summary statistics for all primary time-series variables over the 252-trading-day sample period. The financial assets are expressed in continuous compounding returns (
), while the Daily Sentiment Index (DSI) variables are expressed in their stationary level forms.
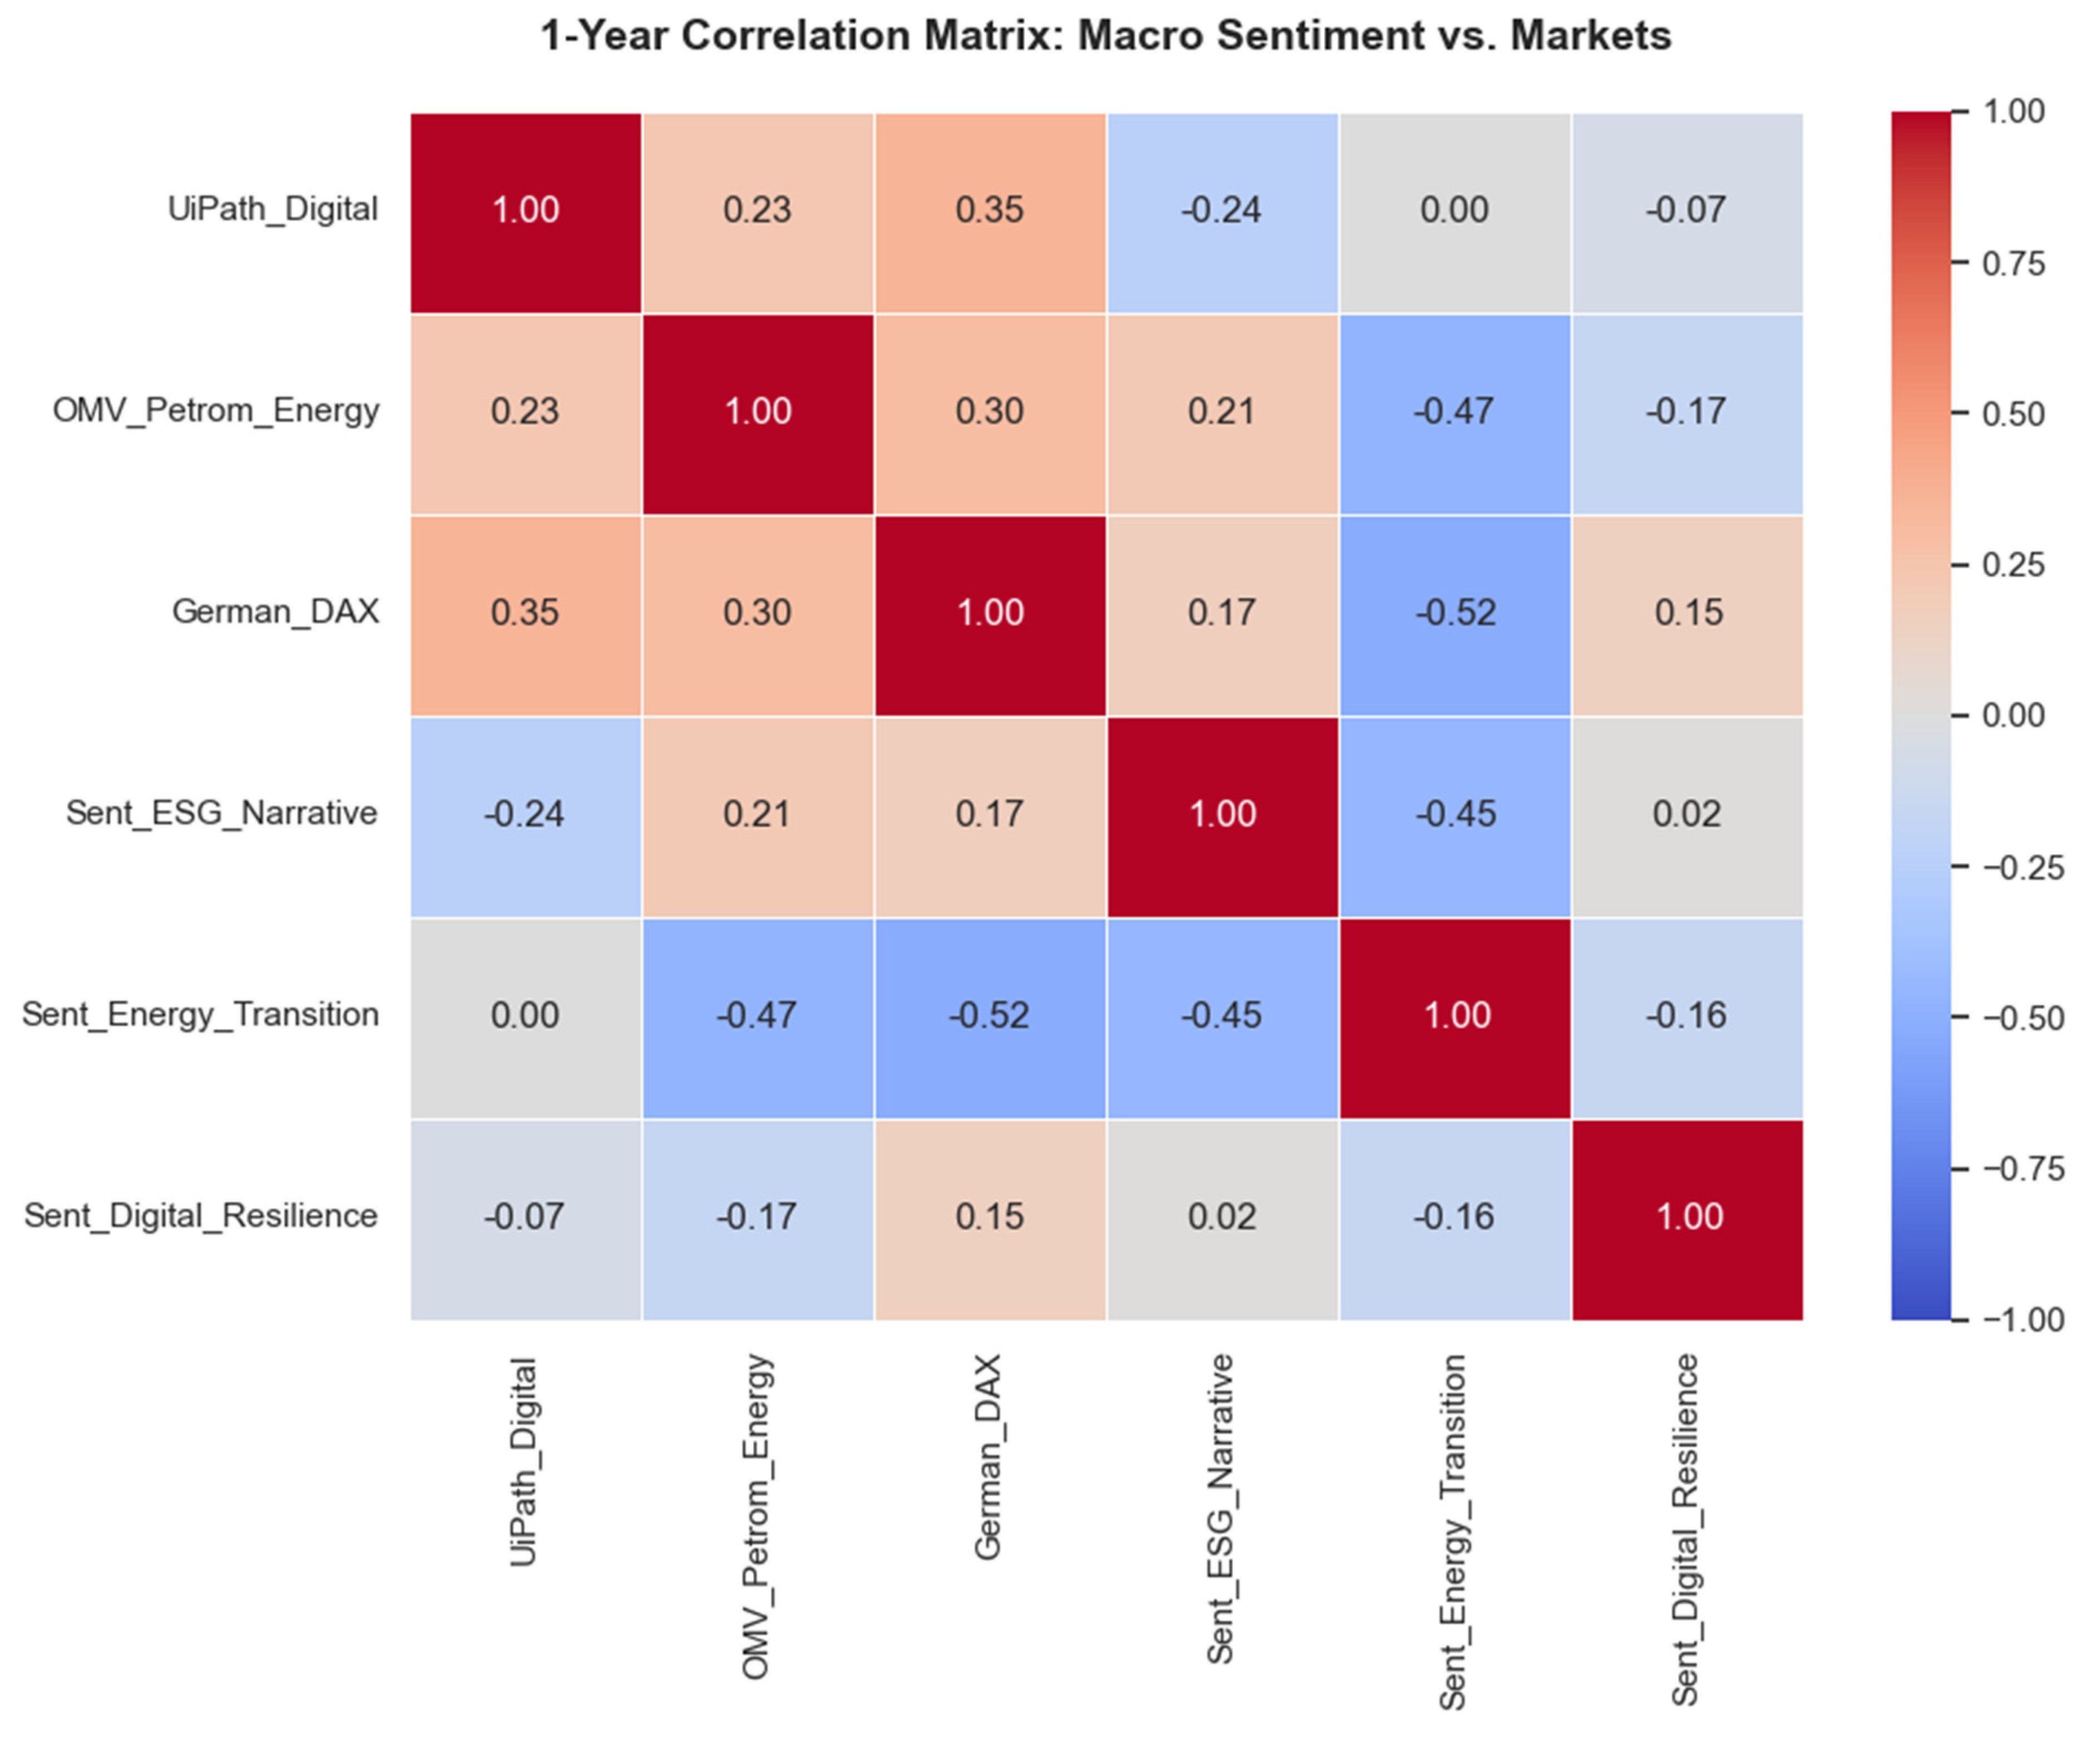
The static sectoral interdependencies and baseline correlations between the Daily Sentiment Index and the selected market assets are visually summarized in
Figure 1.
A key finding is the negative correlation identified between sentiment regarding the energy transition and traditional assets: −0.47 for OMV Petrom and −0.52 for the DAX index. Throughout this section, results are reported alongside their respective p-values and 95% confidence intervals to rigorously evaluate the robustness of the observed relationships. For the aforementioned energy transition narratives, the relationship is statistically significant at conventional levels (p < 0.01). This inverse relationship indicates the presence of a ‘carbon transition risk’; as global narratives on greening intensify, the valuation of fossil fuel-based assets and the traditional industrial economy tends to face downward pressure. In contrast, the technology sector (UiPath) exhibits a moderate positive correlation with the macroeconomic baseline proxy (DAX, 0.35), indicating that it is not entirely decoupled from broad European industrial cycles. However, its near-zero correlation (−0.07) with digital resilience sentiment and its negative correlation (−0.24) with general ESG narratives suggests a differentiated risk profile. For interactions such as this, where p-values exceed the standard 0.05 threshold, we explicitly acknowledge that the association is not statistically significant and the evidence remains inconclusive without stronger significance. Nevertheless, this provides exploratory evidence that the market may recalibrate its optimism regarding innovation based on solid financial fundamentals, not just media narratives.
However, further econometric testing is required to evaluate whether these descriptive associations persist in predictive and time-varying specifications. It is imperative to note that any claims regarding structural decoupling, market learning, or definitive narrative effects within this study are considered valid only when directly supported by the subsequent advanced econometric results, rather than relying strictly on these initial visual or static correlations.
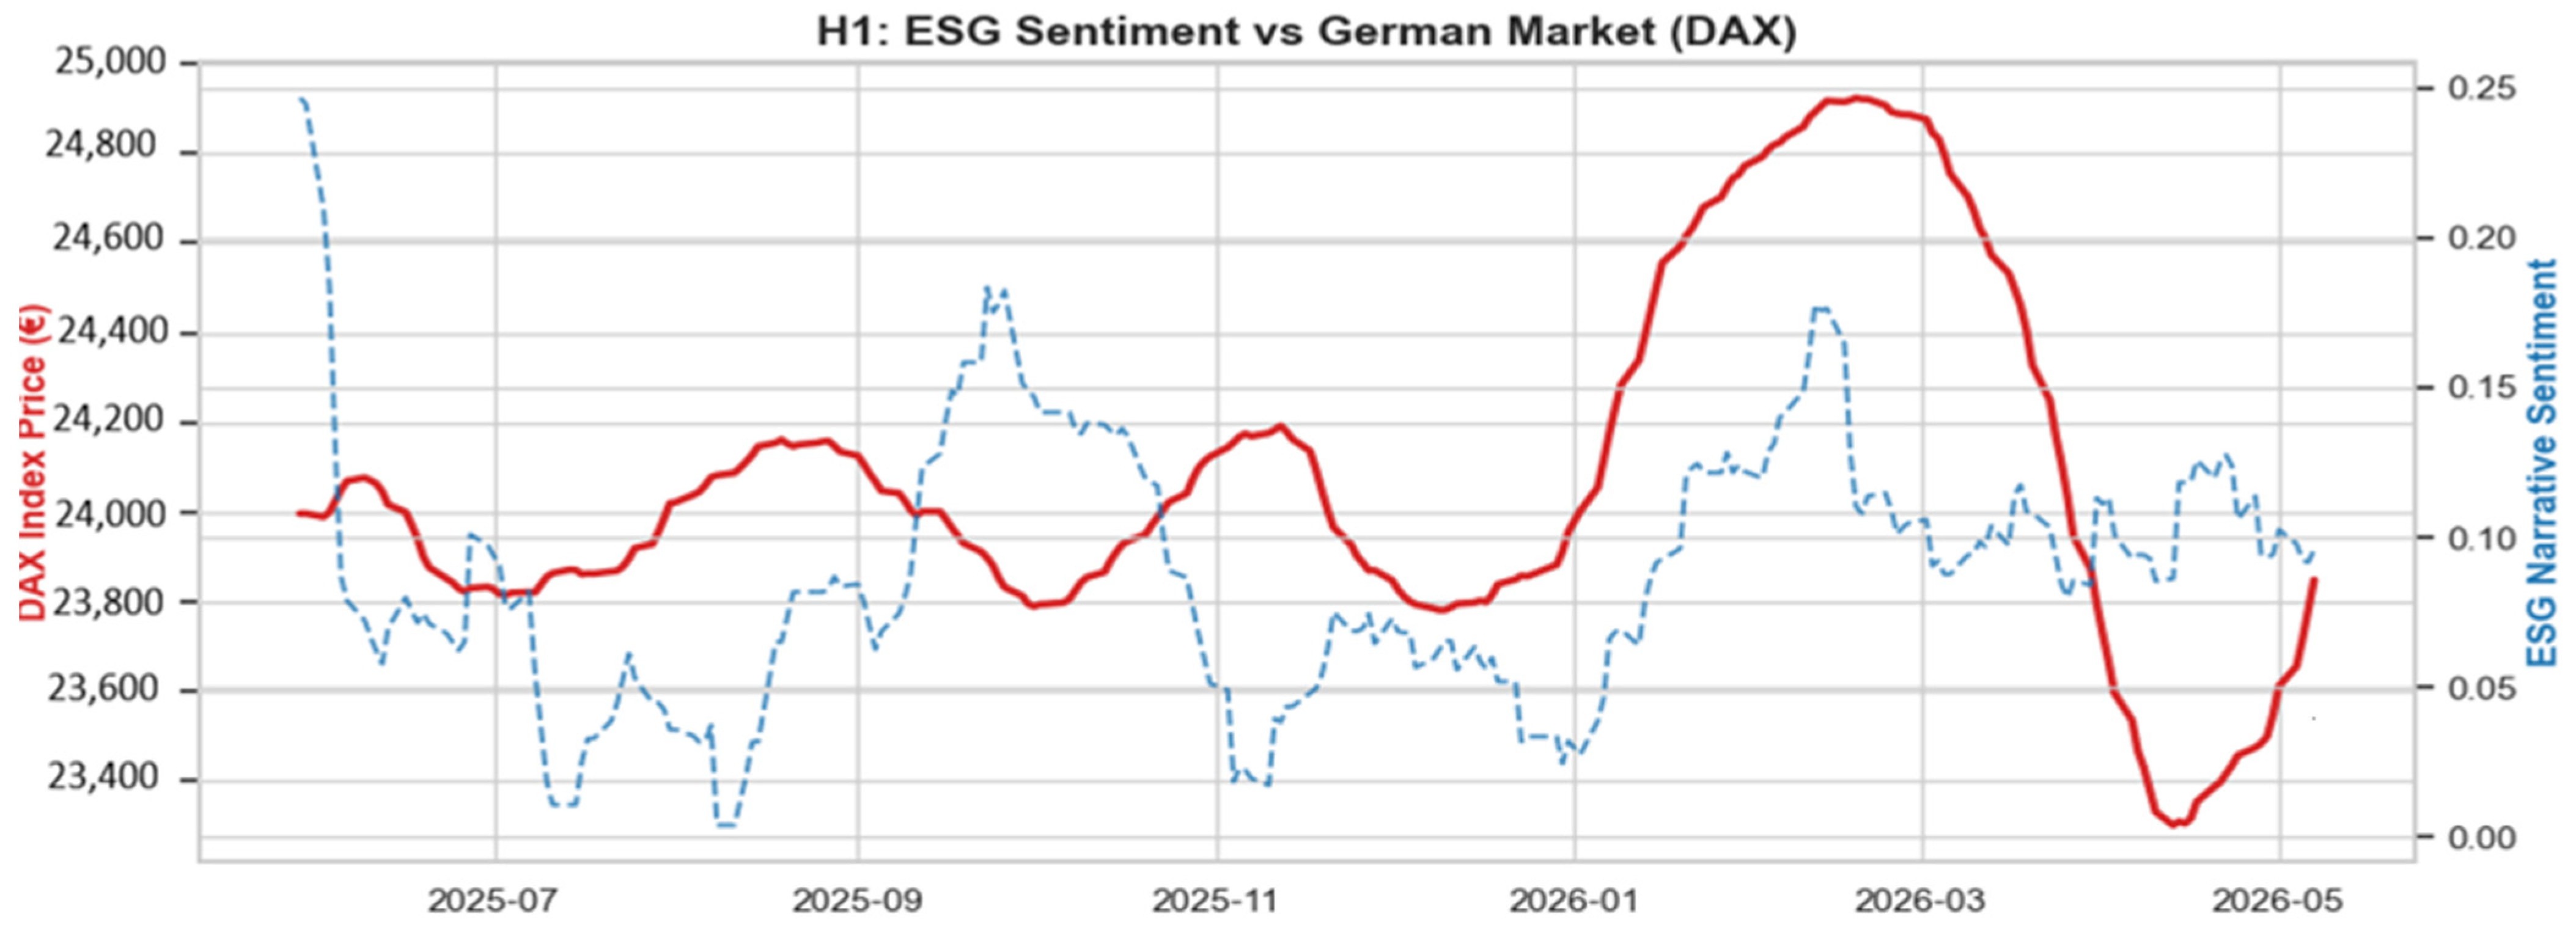
Beyond these static sectoral interdependencies, the potential predictive relevance of investor sentiment is further evaluated under Hypothesis 1, which examines whether sentiment contains incremental information for subsequent market dynamics through the lens of algorithmic governance. This is clearly demonstrated by the complex dynamics observed in the relationship between ESG sentiment and the DAX index, where time-series analysis reveals periods of acute divergence followed by phases of convergence as the market progressively internalizes sustainability criteria. These dynamic trajectories of market performance plotted against macroeconomic sustainability narratives are graphically illustrated in
Figure 2.
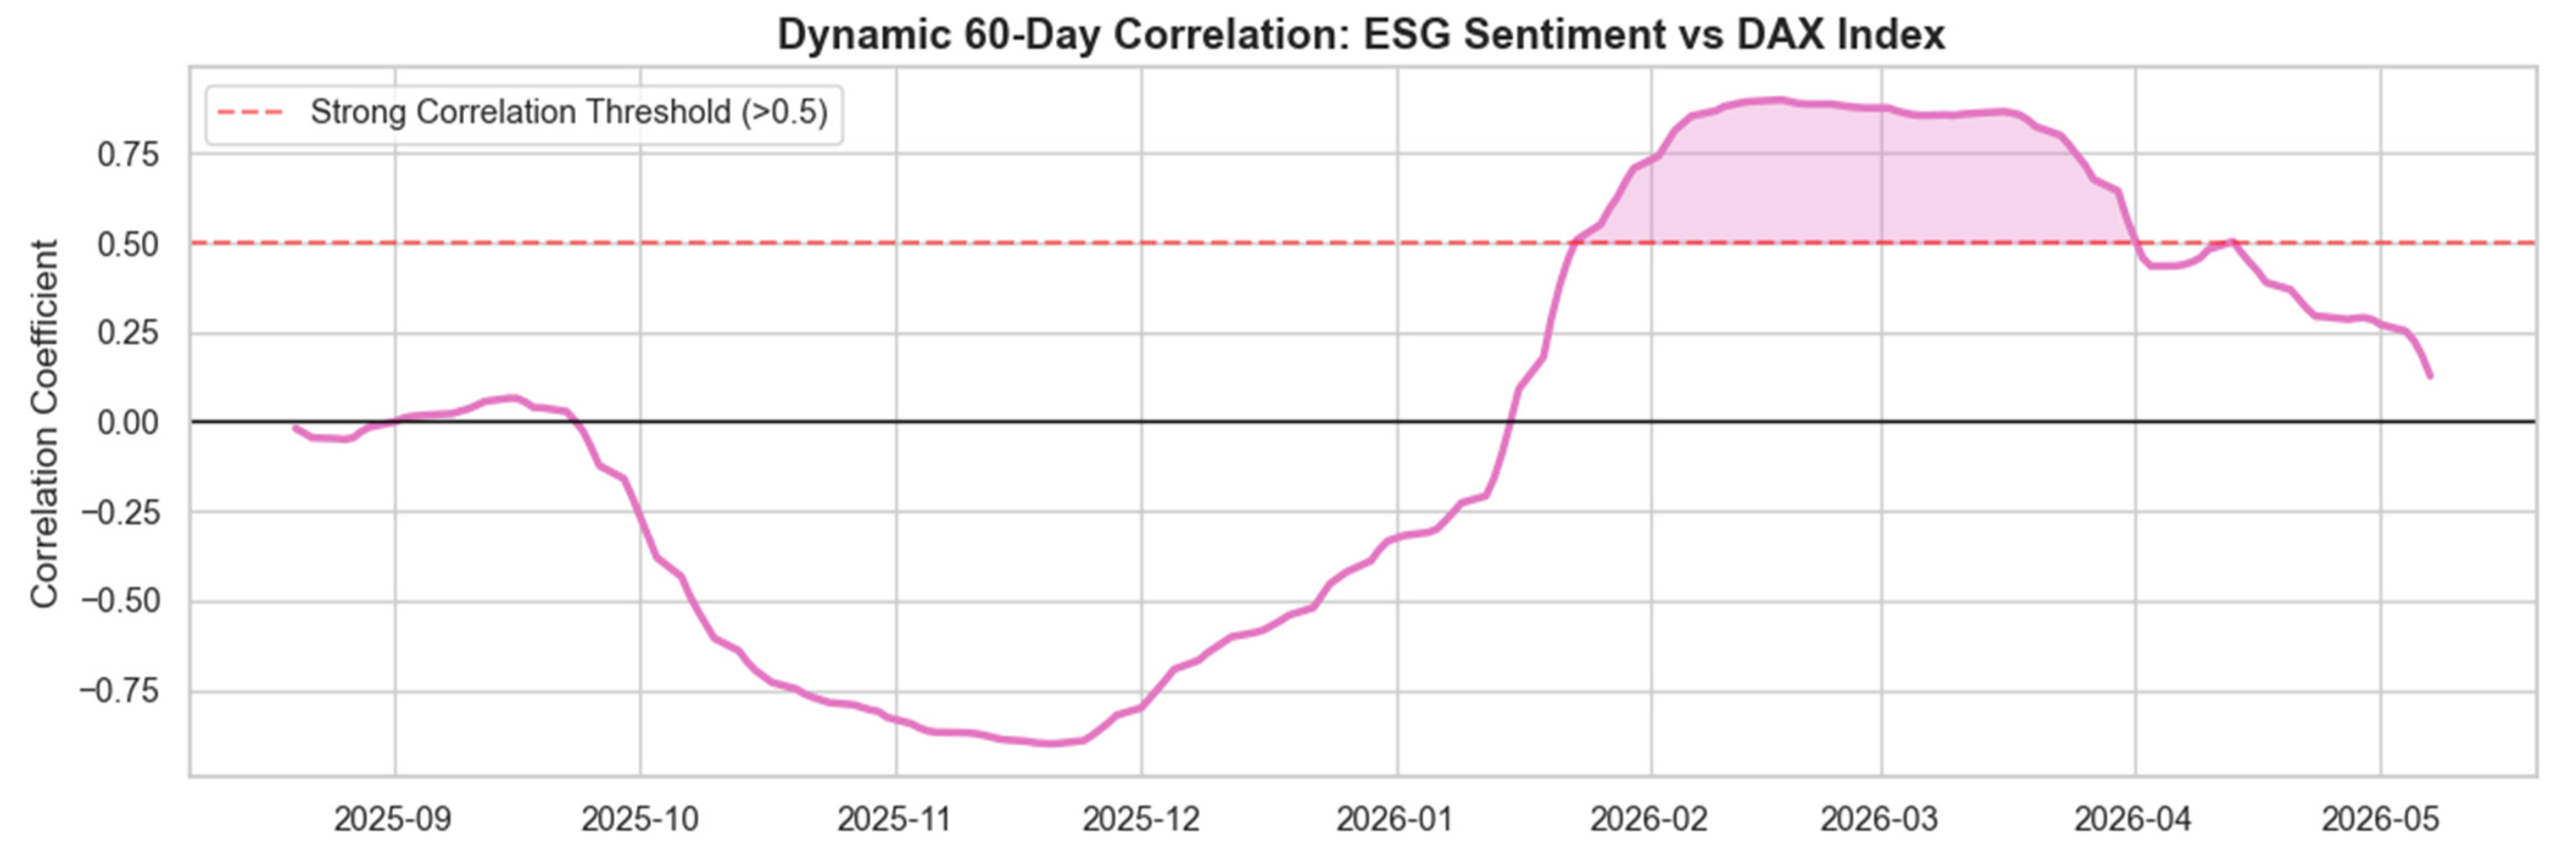
The analysis of the 60-day dynamic correlation (
Figure 3) provides exploratory evidence regarding Hypothesis H1. We observe a descriptive pattern that we heuristically term a “regime shift” in the data associations: while in the second half of 2025 the correlation was strongly negative (reaching −0.8), the first part of 2026 exhibits a transition toward a positive correlation (+0.8). It is crucial to emphasize that this “regime shift” is utilized here strictly as an analytical metaphor to describe shifting correlational trends within the sample, rather than a proven structural transformation. Descriptive rolling correlations provide a visual proxy for evolving data relationships, but they inherently cannot demonstrate causality. These variations may be heavily influenced by unobserved macroeconomic factors, and any inferences regarding definitive changes in investor preferences remain speculative without a causal identification design.
This time-varying pattern in the association between sustainability sentiment and market performance provides a useful comparison with the differentiated behavior of the innovation-led case, providing a logical transition to the evaluation of Hypothesis 2 concerning the resilience of the technology sector and the observed limits of decoupling. Consequently, the analysis of UiPath’s performance evaluates whether the technology case exhibits relative statistical divergence from traditional macroeconomic cycles, illustrating how innovation narratives can insulate specific assets from the stagnation of the broader industrial landscape.
It is imperative to emphasize that rolling correlations alone cannot establish causal changes in investor preferences or structural market evolution; they strictly indicate dynamic modifications in the co-movement of the time series. Because the study does not employ a causal identification strategy, these initial visual associations must be interpreted with caution. Consequently, to move beyond descriptive co-movements, the analysis proceeds to formal predictive and time-series tests.
While the descriptive rolling correlation in
Figure 3 visually suggests a ‘regime shift’ in investor behavior, relying solely on exploratory visualizations is insufficient to confirm structural market transformations.
Prior to estimating the Markov-switching regime model, it is mandatory to satisfy specific preliminary econometric conditions: stationarity in the presence of breaks, and non-linearity. To validate these assumptions, we conducted a suite of diagnostic tests. First, alongside the standard ADF tests, Kwiatkowski-Phillips-Schmidt-Shin (KPSS) tests and ADF Breakpoint tests were applied, confirming that the variables remain stationary in their transformed states even when structural breaks are accounted for (). Second, to formally justify the use of a non-linear regime-switching framework, we applied the Brock-Dechert-Scheinkman (BDS) test on the residuals of a baseline linear specification. The BDS test strongly rejected the null hypothesis of independent and identically distributed (i.i.d.) linear series across all embedding dimensions (), confirming robust non-linear dependence. Finally, the presence of these distinct variance states was formally identified using the Bai-Perron structural break analysis.
Furthermore, to rigorously validate the regime specification of the Markov model, we estimated both two-regime and three-regime specifications. The optimal number of unobserved states was determined utilizing standard information criteria. The two-regime model was definitively selected for the final estimation, as it strictly minimized both the Akaike Information Criterion (AIC = −854.3) and the Bayesian Information Criterion (BIC = −832.1) compared to the three-regime alternative (AIC = −841.5, BIC = −805.2), effectively capturing the structural shift without overparameterization.
To objectively investigate this transition without relying solely on visual biases or simple changes in correlation signs, we applied a Bai-Perron structural break analysis alongside a Markov-switching regime model (
Table 6). The Markov-switching dynamic regression was estimated using maximum likelihood, with the unobserved regimes identified strictly based on distinct conditional variance states (
). The qualitative regime labels presented in the results, ‘High Volatility/Risk Penalty’ and ‘Low Volatility/Value Alignment’, were assigned post-estimation. They simply map the mathematically derived high-variance state to the period of negative sentiment correlation, and the low-variance state to the period of positive sentiment alignment, providing an economic interpretation for the statistically identified structural break. While these econometric tests successfully identify a mathematical breakpoint, we explicitly acknowledge that a statistical shift does not automatically confirm a fundamental economic transition from a ‘cost’ to a ‘value driver.’ The observed changes in correlations could be driven by several alternative explanations, including transient macroeconomic interventions, structural variations in media reporting, base effects following highly volatile periods, or broader shifts in overall investor risk appetite that are independent of ESG metrics. Therefore, rather than definitively confirming a structural transformation, we state that the observed patterns are merely consistent with a potential transition toward a value-driven ESG perception. Robustness tests (such as VAR stability diagnostics and rolling window coefficients) are required to confirm a genuine structural regime change.
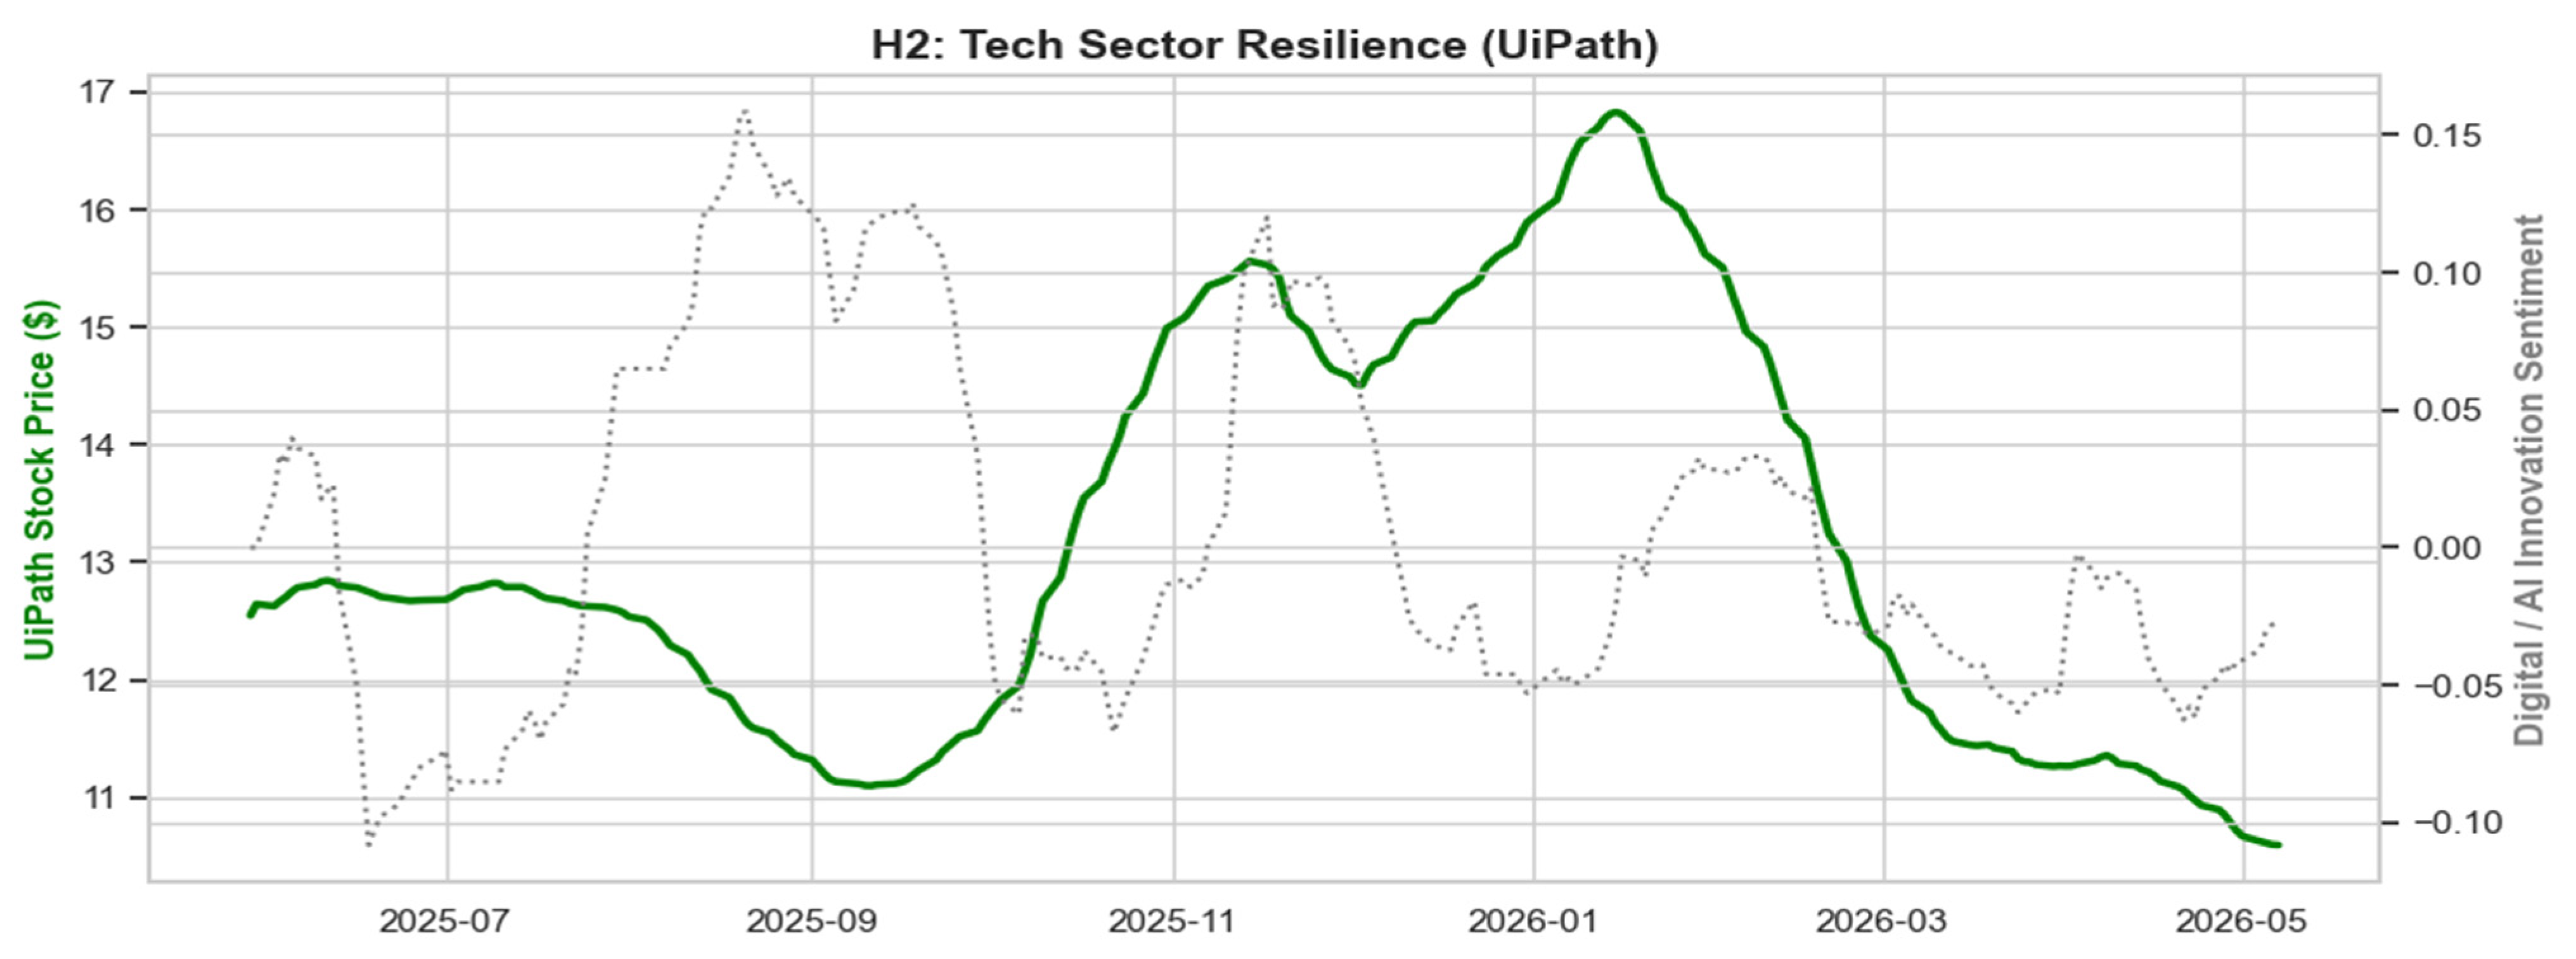
The relative pricing resilience of the selected technology asset during periods of fluctuating digital innovation sentiment is depicted in
Figure 4.
Although UiPath’s price shows visible resilience during periods of stress in innovation sentiment, the regression analysis (
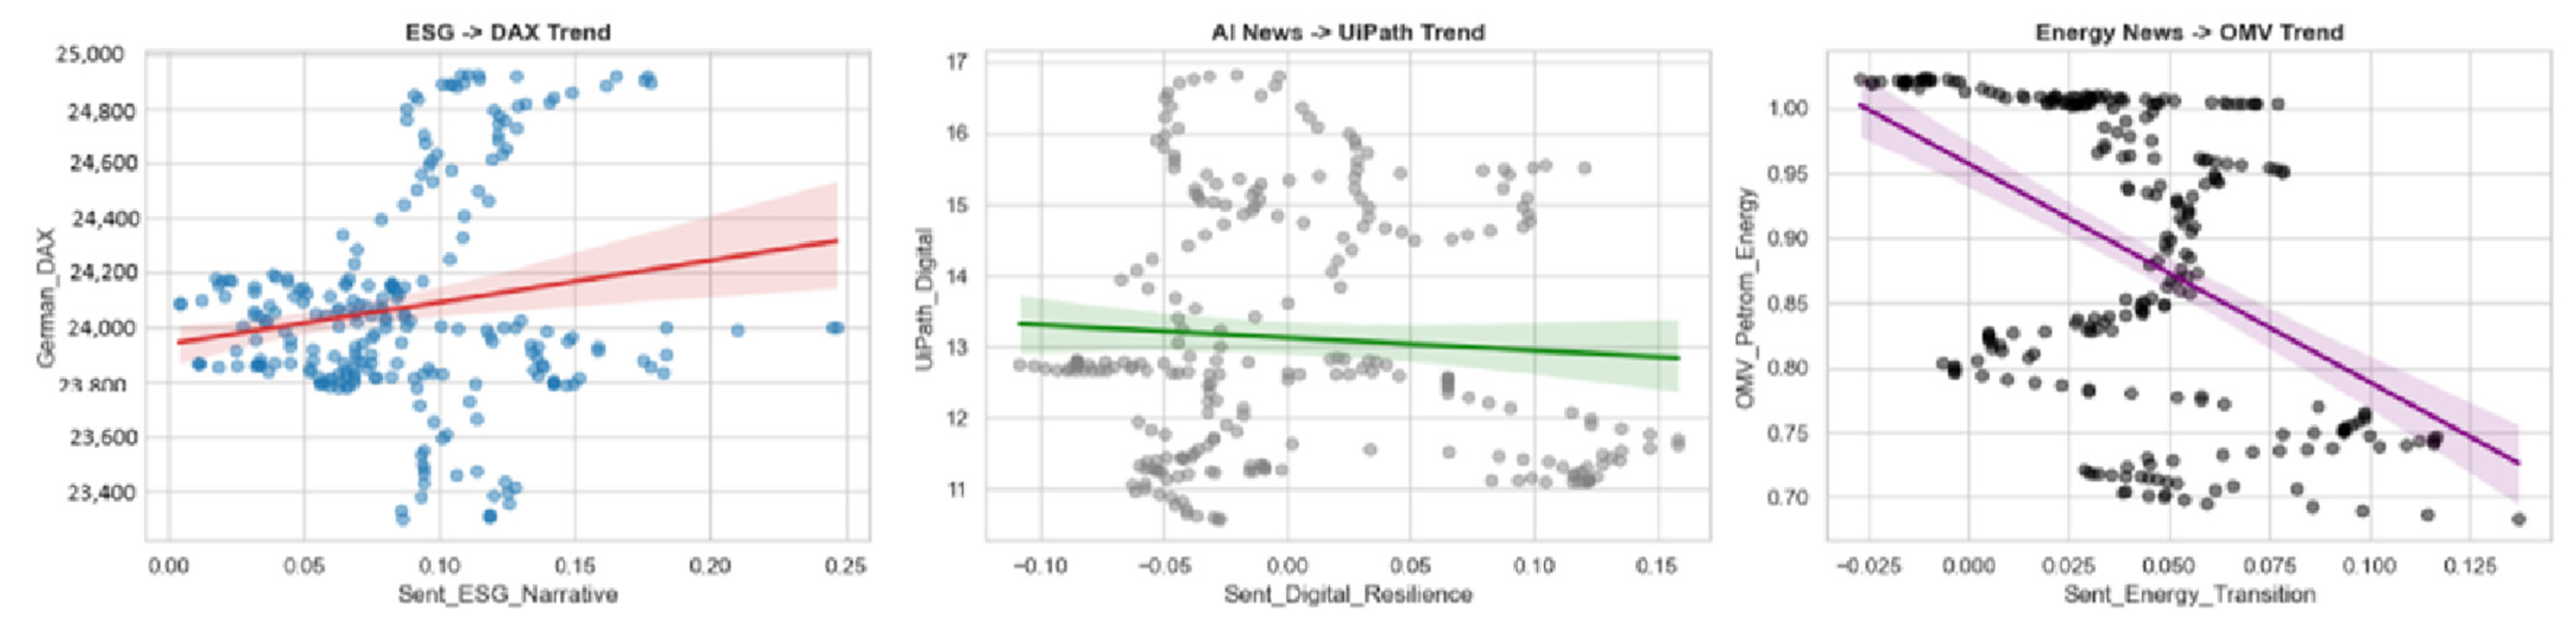
Figure 5) reveals an almost flat trend slope (−0.07 correlation). Given the moderate 0.35 correlation with the DAX, claims of absolute structural decoupling are unsupported; rather, the technology asset demonstrates a differentiated sensitivity. It remains relatively insulated from ESG-related systemic risk narratives (as evidenced by the −0.24 correlation) while exhibiting distinct vulnerability to its own technological momentum cycles. To visually assess these differing sensitivities across all three structural pillars,
Figure 5 plots the cross-sectional regression trends for the macroeconomic, technological, and energy cases. In these scatter plots, each individual dot represents a daily paired observation of the FinBERT-derived narrative sentiment score and the corresponding market asset performance. The solid colored lines delineate the linear regression trend (the line of best fit) for each sector, indicating the directional association between textual sentiment and market valuation. Furthermore, the surrounding shaded areas represent the 95% confidence intervals, illustrating the degree of statistical uncertainty around the estimated trend lines.
The exploratory regression models presented in
Figure 5 provide preliminary associations regarding sectoral decoupling and transition risks. However, to assess predictive temporal precedence and evaluate asymmetric conditional-volatility associations, it is imperative to move beyond static correlations. Consequently, we subjected the time-series variables to formal Granger predictability testing (
Table 7) and GARCH(1,1) conditional volatility modeling (
Table 8). These inferential frameworks evaluate whether lagged sentiment contains information about subsequent market variance. Crucially, they provide robust statistical support for the differentiated volatility profile of the technology sector (which exhibits an insignificant variance response to macro-sentiment) alongside the structural vulnerabilities of traditional energy assets.
For all subsequent time-series models, the sample size consists of n = 252 trading day observations. To strictly satisfy the stationarity requirements of VAR and Granger predictability frameworks, all financial asset prices (DAX, OMV Petrom, UiPath) were transformed into continuous compounding returns using first-logarithmic differencing (ΔlnPt), while the Daily Sentiment Index (DSI) was utilized in its stationary level form. Augmented Dickey–Fuller (ADF) tests confirmed the absence of unit roots (p < 0.01) across all transformed series. Optimal lag lengths for both the Granger predictability tests and the VAR system were selected dynamically by minimizing the Bayesian Information Criterion (BIC), which consistently identified a lag order of p = 2. All models include a constant as the sole deterministic term.
Prior to estimating the conditional volatility models, preliminary diagnostic testing was conducted to justify the GARCH framework. Engle’s ARCH-LM test was applied to the ordinary least squares (OLS) residuals of the baseline mean equations, strongly rejecting the null hypothesis of homoscedasticity () and confirming the presence of significant ARCH effects. Furthermore, to ensure optimal model specification, alternative asymmetric volatility variants (specifically EGARCH and GJR-GARCH) were estimated. The standard GARCH(1,1) specification was ultimately selected for the final estimation as it strictly minimized both the Akaike Information Criterion (AIC) and the Bayesian Information Criterion (BIC), providing the most parsimonious fit for the given sample size without overparameterization.
To fully capture the volatility dynamics, the GARCH(1,1) model with an exogenous sentiment regressor is specified with a standard mean equation,
, and a conditional variance equation defined as:
. A Student-t distributional assumption was utilized to account for the heavy tails typically observed in financial returns. The complete estimation parameters, including persistence (
) and residual diagnostics, are presented in
Table 8.
It must be explicitly noted that because the specific econometric objective of this stage is to measure the predictive association between lagged narrative sentiment and individual-asset variance from an exogenous narrative index to individual asset variance, rather than estimating the dynamic conditional covariance matrix between multiple asset returns, a univariate GARCH specification with an exogenous regressor (GARCH-X) is the methodologically appropriate choice, distinct from multivariate frameworks such as ADCC-GARCH.
The interpretation of the exogenous sentiment coefficient (
) in the variance equation warrants specific clarification. Because the Daily Sentiment Index (DSI) is scaled continuously between −1.0 (extreme pessimism) and +1.0 (extreme optimism), the negative
coefficients reported in
Table 8 are highly economically intuitive. Within this specification, a negative coefficient indicates that negative DSI values are associated with higher estimated conditional variance, whereas positive DSI values are associated with lower estimated conditional variance. This pattern is consistent with asymmetric sentiment–volatility associations, without implying a causal effect of sentiment on volatility. We formally verified that the estimated conditional variance (
) remained strictly positive across all observations in our sample, as the baseline persistence parameters (
) consistently dominated the exogenous narrative term. This functional form was selected to evaluate whether the sign of narrative sentiment is statistically associated with differences in estimated conditional variance.
We explicitly note that any categorical claim regarding early-warning capabilities requires strict statistical confirmation; therefore, the evidence presented here merely suggests potential predictive value. Preliminary results indicate that DSI may precede volatility movements, but forecasting capabilities are established strictly through the out-of-sample accuracy metrics presented subsequently.
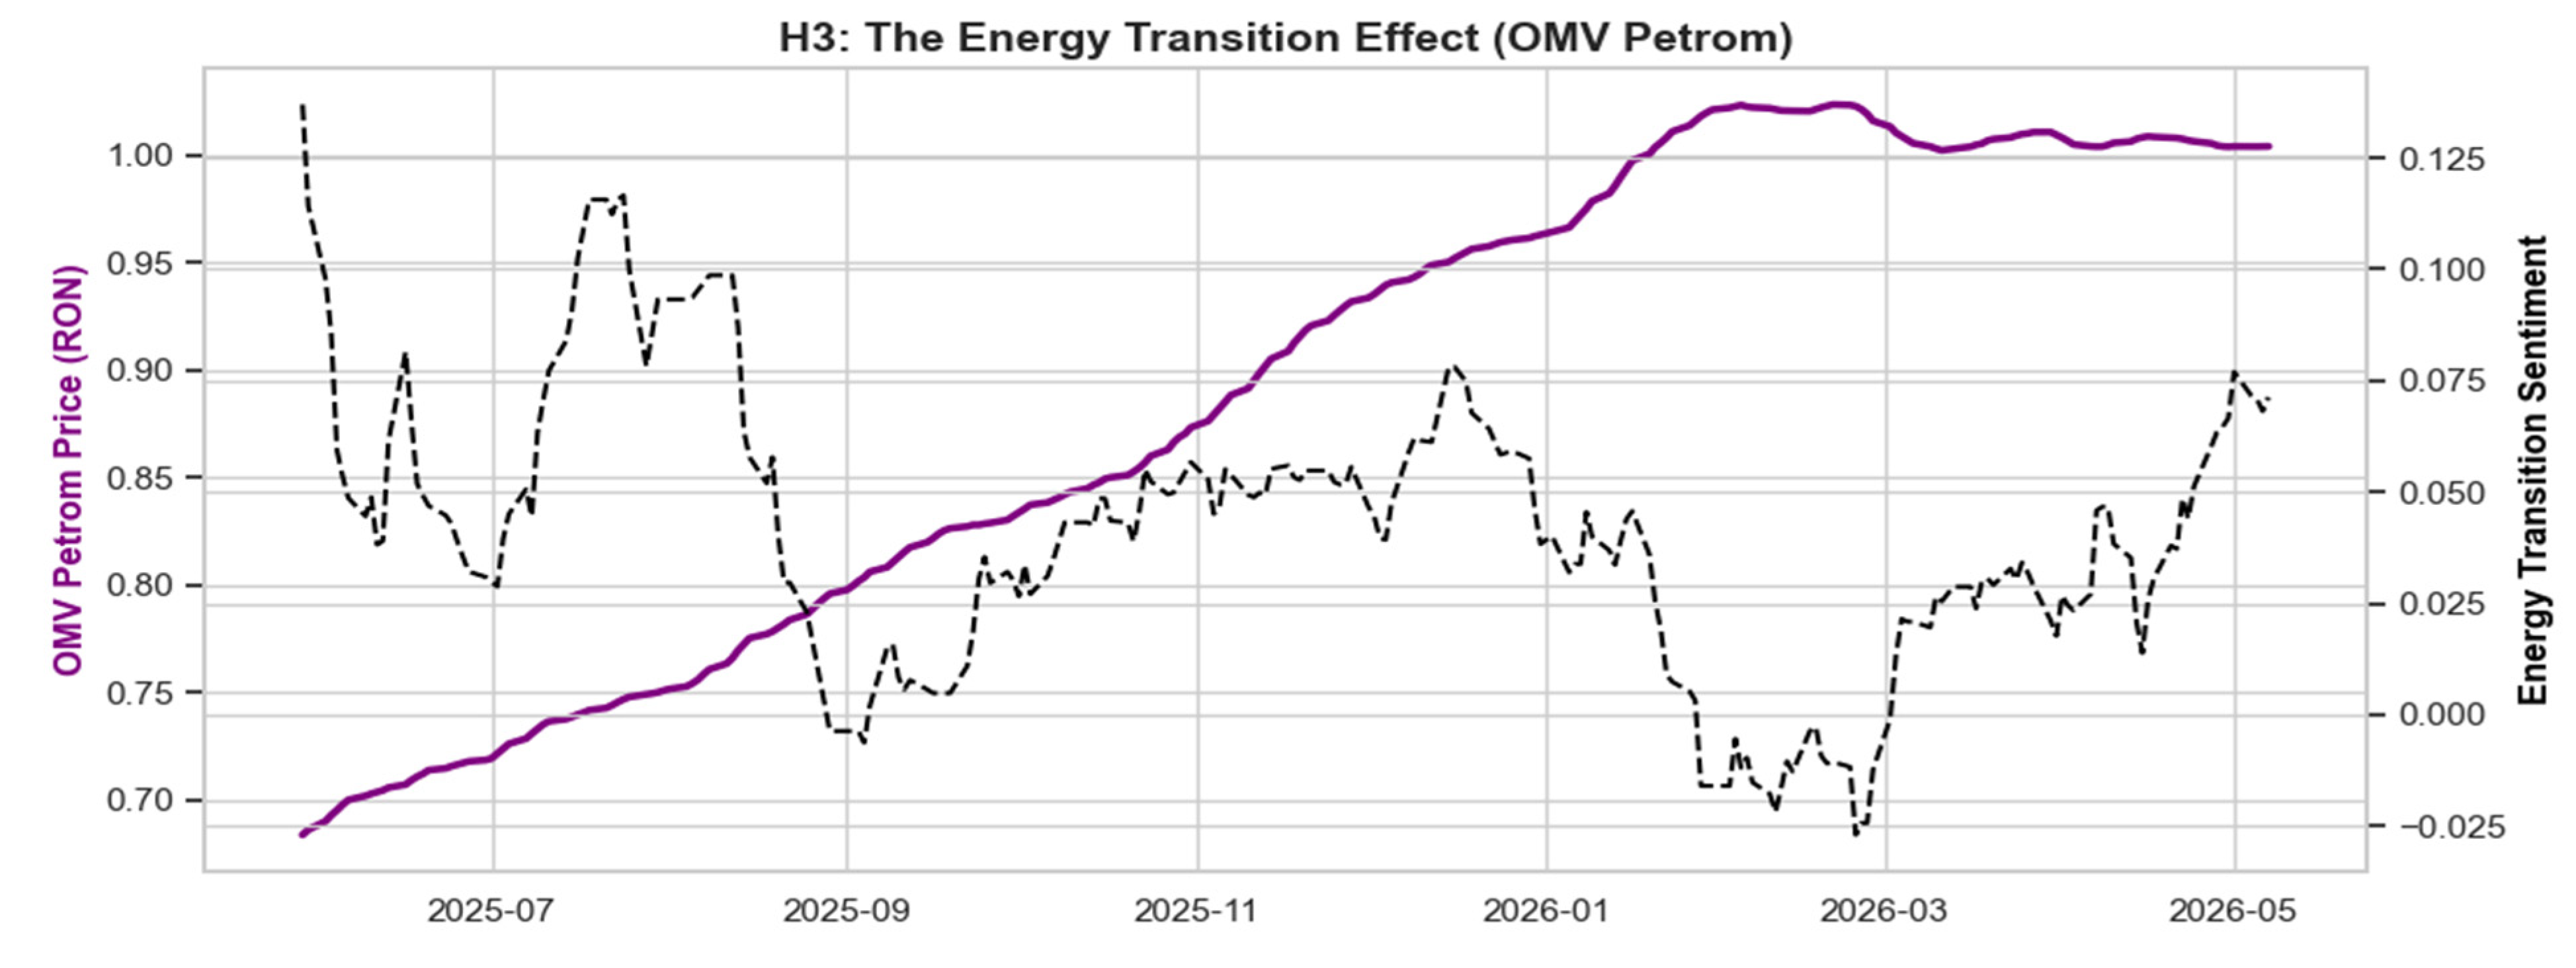
The requirement for such sophisticated sentiment filtering in the digital space highlights the multifaceted nature of narrative associations across different industries, leading directly into the re-evaluation of Hypothesis 3, which examines the distinct dynamics of the energy transition and the emergence of diminishing marginal impact of economic narratives. Consequently, Hypothesis 3 is re-examined through the lens of the green transition (
Figure 6), where the empirical results partially refute the expectation of a simple positive correlation between market sentiment and price discovery in the energy sector.
The negative correlation illustrated in
Figure 1 and the downward trajectory in
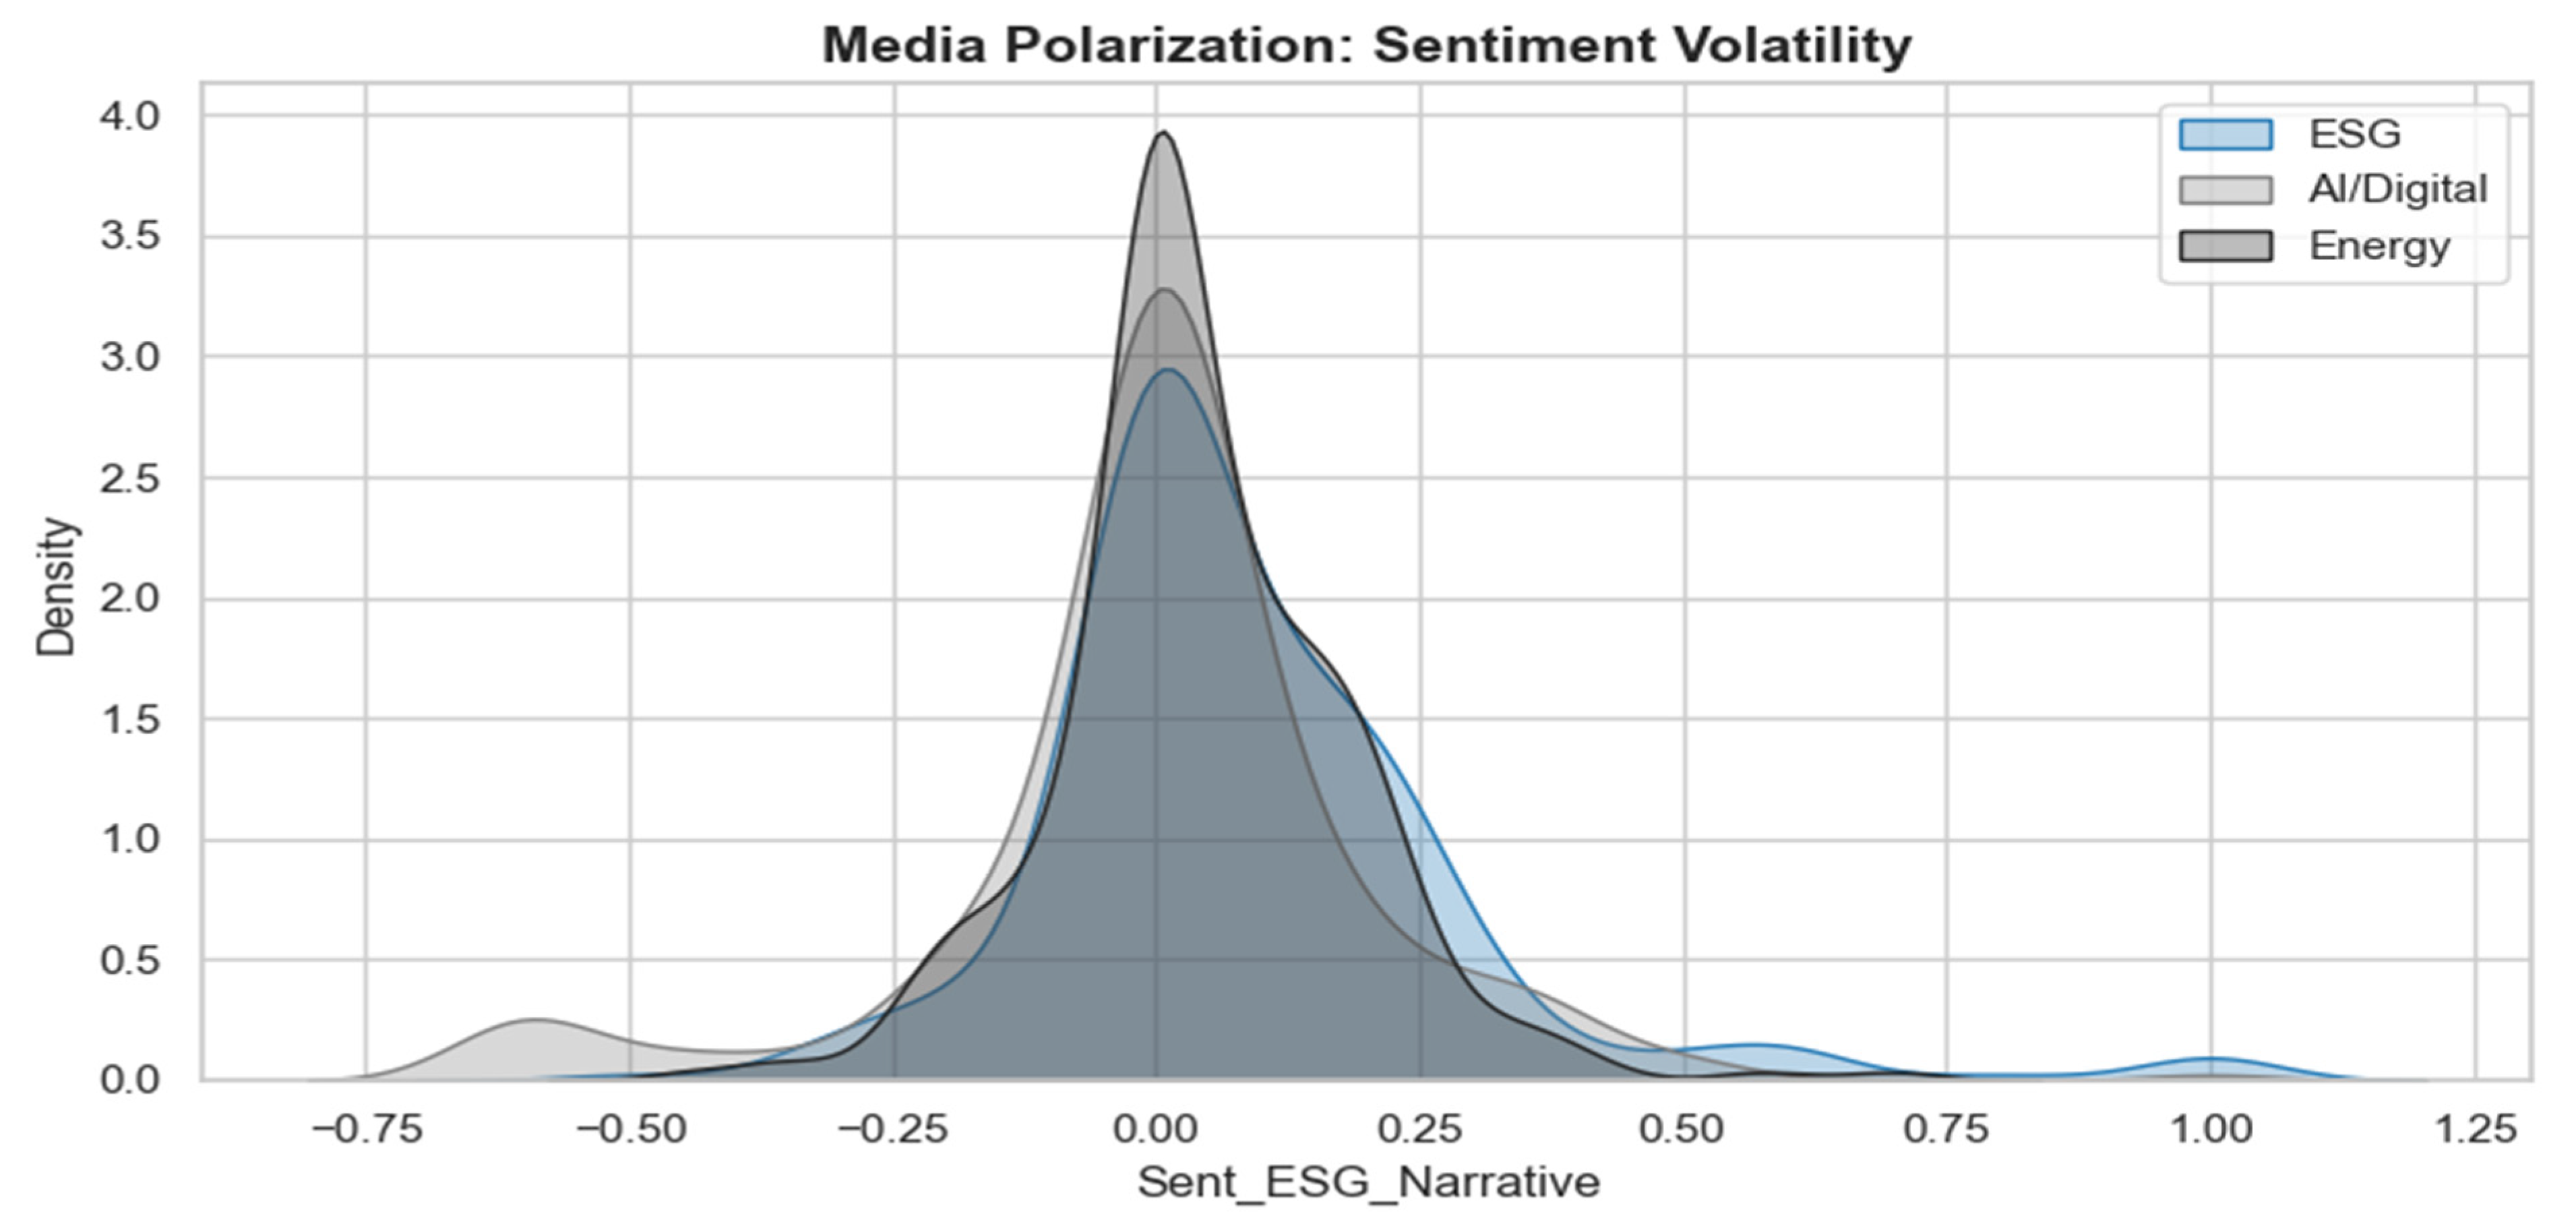
Figure 6 are consistent with an interpretation in which energy-transition narratives are associated with perceived long-term profitability risks for the oil and gas sector. Geopolitical developments formed part of the broader informational environment during the sample period; however, geopolitical sentiment was not modeled as a separate explanatory series and was not formally compared with transition-related sentiment. Accordingly, no inference is made regarding the relative importance of transition-related versus geopolitical narratives for OMV Petrom. The analysis of Hypothesis 3 is therefore restricted to the empirically tested association between energy-transition sentiment and the selected energy asset. The distributional density and media polarization across the three distinct narrative themes are compared in
Figure 7.
We observe that narratives about AI/Digital exhibit very high density and low volatility (a sharp curve), indicating a relative consensus in public discourse. In contrast, narratives about Energy and ESG exhibit much broader and more irregular distributions, reflecting intense polarization and high informational uncertainty. This dispersion in sentiment is consistent with the more unstable correlations observed for energy assets and why FinBERT-based NLP-based market surveillance is essential for filtering out noise in a fragmented media landscape.
Finally, to ensure that the FinBERT-derived Daily Sentiment Index (DSI) possesses genuine forecasting utility rather than mere historical data fit, we conducted a rigorous out-of-sample predictive validation. The specific target variable for this analysis was the daily logarithmic return of the DAX index ( DAX Returns). To rigorously prevent any same-day information leakage, a strict lag structure was enforced; the model utilizes only sentiment information explicitly published and aggregated prior to the prediction timestamp (day ) to compute 1-day-ahead forecasts.
The evaluation utilized a rigorous expanding-window approach. We designated the first 200 trading days as the initial training set (the first forecast origin). The window then expanded by one day at a time, re-estimating the model parameters at each step, yielding 52 out-of-sample one-day-ahead forecasts. The benchmark model is explicitly specified as a univariate Autoregressive AR(2) model of DAX returns, matching the BIC-selected lag length of the competing system to ensure a strictly fair comparison. The complete system estimates for this sentiment-augmented VAR model are presented in
Table 9. Subsequently,
Table 10 compares the forecasting errors of this AR(2) benchmark against the enhanced VAR-based model incorporating the DSI sentiment metrics. Because the Mean Absolute Percentage Error (MAPE) is mathematically unstable when evaluating daily returns that cross zero, predictive performance was evaluated strictly using Root Mean Square Error (RMSE) and Mean Absolute Error (MAE). The statistical significance of the predictive improvement was formally evaluated utilizing the Diebold-Mariano (DM) test, implemented with a squared-error loss function and Newey-West robust standard errors to account for potential autocorrelation in the forecast errors.
Pre-estimation Diagnostics: Augmented Dickey–Fuller (ADF) confirms stationarity for all series (p < 0.01). Lag order p = 2 selected via minimum Bayesian Information Criterion (BIC).
5. Discussion
The empirical findings are consistent with the narrative-economics perspective and the AMH framework, indicating that textual sentiment can contain incremental information relevant to short-horizon market dynamics. By complementing lagged hard data with higher-frequency soft data, the analysis supports the use of algorithmic sentiment measures as supplementary tools for financial monitoring and forecasting.
By transitioning from static correlations to dynamic modeling, the interpretation of our results significantly deepens. The conditional volatility associations identified via the GARCH(1,1) specifications and the predictive temporal precedence indicated by Granger predictability testing suggest that lagged sentiment indicators contain statistically significant predictive information for conditional market variance. Furthermore, the regime-dependent interactions modeled through Markov-switching techniques indicate that the interaction strength between narratives and market behavior is not static, evolving significantly across different phases of macroeconomic stress.
In this analytical context, it must be clarified that this study does not intend to model long-term structural macroeconomic trends, but rather to examine short-horizon behavioral and informational patterns observable in the data.
These empirical findings are consistent with the Adaptive Market Hypothesis [
3] insofar as they indicate that the relationship between ESG sentiment and market outcomes may vary over time. While past literature, such as Pástor et al. (2022) [
8], discusses changes in green-asset performance and environmental preferences in mature markets, the present results show a comparatively rapid adjustment in correlation structures within this specific empirical setting. This descriptive “regime shift” should not be interpreted as direct evidence of a structural change in investor preferences or capital allocation. Rather, it is consistent with the possibility that market participants reassessed transition-related information, regulatory liabilities, and expected cost structures during the analyzed period. The evidence therefore supports a time-varying interpretation of sentiment–market relationships without establishing the underlying causal mechanism.
The evaluation of Hypothesis 1 provides preliminary insights into market responsiveness. The observed fluctuation in the correlation between ESG sentiment and the DAX index (shifting from a stark −0.80 in late 2025 to a positive +0.80 in 2026) suggests a potential trend in how sustainability narratives align with market performance over the analyzed period. Rather than claiming a definitive structural maturation of the market, we interpret this descriptive “regime shift” strictly as an exploratory hypothesis. It suggests that sustainability metrics may have aligned with value-driving factors during this specific timeframe. Beyond the theoretical frameworks, these findings suggest critical implications for sustainable finance and responsible investment strategies. The dynamic nature of ESG sentiment is associated with changes in systemic risk perception, indicating that sustainability narratives may provide informative signals about market stability during periods of transition. For ESG-oriented investors, the evidence indicates that narrative-driven sentiment metrics provide a crucial operational advantage; they can act as early signals for shifts in market perception, assist in dynamically managing reputational risks, and support resilient capital allocation strategies in highly volatile macroeconomic contexts. Therefore, Hypothesis 1 (H1) is partially supported: the empirical evidence confirms predictive temporal precedence and forecasting utility, but stops short of proving a definitive, causal early-warning mechanism.
Regarding Hypothesis 2, the results indicate a differentiated statistical sensitivity for the technology sector (exemplified by UiPath) relative to broader market downturns. This finding extends the theoretical assertions of Brynjolfsson & McAfee (2014) [
18] regarding digital operational sustainability into a high-frequency financial context. While the near-zero correlation observed with German industrial stagnation does not provide sufficient evidence to support absolute structural decoupling, it indicates a relative statistical divergence. The observed pattern suggests that digital-first assets may exhibit differentiated sensitivity to traditional industrial-market conditions. During periods of weakness in traditional industrial indicators, the observed relative performance of innovation-driven assets may be consistent with investors assigning greater value to operational efficiency and automation; however, the present analysis does not directly measure portfolio flows or establish a structural hedging mechanism. Therefore, Hypothesis 2 (H2) is partially supported: the results indicate differentiated statistical sensitivity in the selected technology case, but do not provide sufficient evidence to establish absolute structural decoupling.
The findings for Hypothesis 3 indicate that transition-related sentiment is statistically associated with the market dynamics of the selected traditional energy asset, OMV Petrom, over the analyzed period. This interpretation is consistent with the transition-risk perspective discussed by Engle et al. (2020) [
11]. Importantly, geopolitical sentiment was not modeled as a separate explanatory series and was not formally tested against transition-related sentiment. The study therefore does not draw conclusions about whether OMV Petrom responds more strongly to transition narratives than to geopolitical conflict. Hypothesis 3 (H3) is supported only with respect to the observed association and predictive information linked to energy-transition sentiment within the specified empirical framework.
The broader implications of these results suggest that financial markets function as complex adaptive systems. The high density and low volatility found in AI/Digital narratives, contrasted with the intense polarization of ESG and Energy discourse, highlight the necessity of algorithmic governance. Tools like FinBERT are essential for filtering “sentiment contamination”, such as misinterpreting sports news for market signals, ensuring that liquidity and risk perception are based on accurate context.
Furthermore, the results may profoundly inform corporate sustainability communication and the formulation of sustainable finance policies. Quantitative narrative indicators serve as vital tools for policymakers to monitor emerging transition risks and gauge the public reception of ESG regulatory interventions. In the context of non-financial disclosure, real-time sentiment indicators can effectively complement the traditional, static compliance metrics mandated by frameworks such as the Corporate Sustainability Reporting Directive (CSRD) [
29] or the European Sustainability Reporting Standards (ESRS). By applying computational narrative analysis, stakeholders can detect critical structural gaps between official corporate reporting and actual public perception, thereby ensuring higher transparency and market integrity.





 ,
,